the Creative Commons Attribution 4.0 License.
the Creative Commons Attribution 4.0 License.
 | 17 Jul 2020
Switch of fungal to bacterial degradation in natural, drained and rewetted oligotrophic peatlands reflected in δ15N and fatty acid composition
Miriam Groß-Schmölders
Pascal von Sengbusch
Jan Paul Krüger
Kristy Klein
Axel Birkholz
Jens Leifeld
Christine Alewell
For centuries European peatlands have been degrading along with drainage, land use and climate changes. Increasing pressure on peatland ecosystems calls for a more cost-efficient method to indicate the current state of peatlands and the success of restoration efforts. Metabolic pathways in peatland soils are imprinted in stable isotope compositions due to differences in microorganism communities and their metabolic pathways. Therefore, we hypothesize that depth profiles of nitrogen stable isotope values provide a promising opportunity to detect peatland decomposition or restoration. We studied five peatlands, namely Degerö Stormyr (northern Sweden), Lakkasuo (central Finland) and three mires in the Black Forest (southern Germany). At all locations, cores were taken from adjacent drained (or rewetted) and natural sites to identify δ15N trends that could indicate changes due to drainage and restoration. At all drained (and rewetted) sites we found a distinct peak (“turning point”) of the δ15N values in the center of the drained horizon. We did a fatty acids (FAs) analysis to link our results to microbial community composition. As markers, we distinguished between one fungal-derived FA (C18:2ω9c) and four bacterial-derived FAs. For bacteria, we looked for one general bacterial-derived FA (C14:0), two FAs for gram-positive bacteria (i-C15:0; a-C15:0), and one FA for gram-negative bacteria (C16:1ω9c). In accordance with other studies, our results suggest that fungi dominate the microbial metabolism in the upper aerobic peat horizon. This is reflected by depleted δ15N values. Moving downwards, the drained horizon conditions slowly switch to oxygen limitation. Consequently, fungal-derived FAs decrease whereas bacterial-derived FAs rise. The highest diversity of microbial-derived FAs is indicated by the δ15N turning point. Below the δ15N turning point, oxygen is increasingly limited and concentrations of all microbial-derived FAs are decreasing down to the onset of the permanently waterlogged anaerobic horizon. Peatland cores with restoration successes again show, above the formerly drained horizon, no depth trend of the isotopic values. Hence, we conclude that δ15N stable isotope values reflect microbial community composition, which differs between drained and natural peatlands.
- Article
(3106 KB) - Full-text XML
-
Supplement
(245 KB) - BibTeX
- EndNote


In Europe 70 % of the peatlands are degraded (Joosten and Couwenberg, 2001). Leifeld and Menichetti (2018) reported that degraded peatlands account for 5 % of the anthropogenic CO2 emissions. Despite this dramatic peat decline, we lack reliable and transferable tools that provide time- and cost-efficient information of the peatland hydrology status, as we define it.
We determine natural, drained and rewetted hydrological statuses of peatlands, derived by the average thickness of the aerobic horizons and the resulting degree of decomposition.
From a hydrological perspective, peatland soils can be divided in three different horizons. Most biological metabolism and nutrient cycling takes place in the acrotelm (uppermost aerobic peat horizon with living vegetation; Asada et al., 2005a; Artz, 2009; Morris et al., 2011). In the water-saturated catotelm (deeper, anaerobic horizon) organic substrates are decomposed at much smaller rates owing to anoxic conditions (Asada et al., 2005a; Artz, 2009; Lin et al., 2014). In the mesotelm, the peat horizon situated between acrotelm and catotelm, water table levels and oxygen content fluctuate, resulting in shifting aerobic and anaerobic conditions and shifting metabolism processes (Asada et al., 2005a; Artz, 2009; Lin et al., 2014). Clymo and Bryant (2008) therefore defined the mesotelm as a “transition horizon”. In degraded peatlands the mesotelm is expanded and former preserved organic substrate is decomposed (Zedler and Kercher, 2005). In an expanded mesotelm conditions differ from aerobic, light and warm conditions in the upper mesotelm to semioxic, dark and cold conditions in the lower mesotelm (Artz, 2009; Lin et al., 2014). The conditions in the former mesotelm will be anaerobic, and microbial activity will be inhibited with rewetting (Andersen et al., 2006; Asada et al., 2005b; Thormann et al., 1999).
We determined the hydrological status by a vegetation analysis, the humification index (HI) after von Post (Silc and Stanek, 1977), the measurement of the water table height, and historical data of the installation of drainage channels. Natural and rewetted sites have a high water table near the surface and are mainly formed by Sphagnum mosses with low humification indices. Drained sites are characterized by low water tables, higher grades of humification, less Sphagnum and more of other moss species. However, determination of macroresiduals and their humification degree in more or less degraded peat is time consuming, needs highly specialized expert knowledge and is thus limited to a small number of samples.
Other common methods to measure peatland hydrology currently are gas emission measurements and measurement of growth heights of peatland vegetation. Gas measurements (e.g., CO2, N2O and CH4) provide an indirect measurement of ongoing decomposition processes (Baldocchi et al., 1988). The method is expensive and labor intensive and does not to give information on drainage history and process dynamics beyond the specific measurement time (Bubier et al., 2003). Measuring vegetation growth is connected to the following problems: (i) not only does the sole growth of mosses indicate peat growth but also the balance of growth and degradation (it is important how much vegetation material enters the catotelm and is therefore stored under anaerobic conditions); (ii) peat shrinks and swells with water supply (hence, measuring peat height at different water table heights would lead to different assumptions for peatland growth; Clymo, 1970); and (iii), peat growth, also in a natural hydrology status, is slow and an unambiguous effect on the success of restoration efforts might need decades of measurements (Clymo, 1970; Fenton, 1980).
As such, and in search of practical indicators, we measured bulk density (BD), the carbon ∕ nitrogen ratio (C∕N) and bulk stable isotope values. BD acts as an indicator for decomposition because decomposition processes lead to higher compaction of the peat soil and therefore increasing BD values (Novak et al., 2008). The C∕N ratio indicates the degree of decomposition (Malmer and Holm, 1984; Kuhry and Vitt, 1996). With increasing decomposition, a preferential loss of C over N takes place and the C∕N ratio decreases. Stable isotopes depth patterns of δ13C and δ15N in peat have been found to be specific for peatland hydrology (drained, rewetted or natural) in previous studies (e.g., Krüger et al., 2016; Alewell et al., 2011), but the studies were unable to find an explanation for these depth patterns. As degradation is mostly connected to drainage, we hypothesized that an increase of microbial activity is responsible for the change in isotope patterns.
Stable C and N isotopes are correlated with vegetation composition and microbial decomposition processes. As decomposition induces an enrichment of heavy isotopes (15N and 13C), vegetation is mostly more depleted in 15N and 13C than microbial and recycled substrate. Alewell et al. (2011) and Krüger et al. (2014) reported distinct changes in δ13C values for palsa peat with the onset of the decomposition of hummocks. Various authors observed the same trend with decomposition in peatlands of other climate conditions (Krüger et al., 2016; Novak et al., 1999; Hobbie et al., 2017; Biester et al., 2014). The distinct δ13C depth pattern is a consequence of the use of different sources by fungi and bacteria, as investigated by Kohl et al. (2015) for peat profiles. They conclude that an increasing δ13C signal is caused by differences in biomass synthesis and carbon sources used by fungi and bacteria, which was also reported by Lichtfouse et al. (1995) and Baumann et al. (2013). We also found distinct changes in δ15N with drainage. It is known that plants preferentially incorporate the lighter 14N (Högberg, 1997), an effect that is strongly enhanced by mycorrhizal uptake of nitrogen into plants (Hobbie and Högberg, 2012). Plant rooting and the existence of mycorrhiza leads to enriched δ15N values in the remaining bulk material (Högberg et al., 1996) because plants and mycorrhiza preferentially process lighter 14N (Adams and Grierson, 2001; Asada et al., 2005a; Högberg et al., 1996; Kohzu et al., 2003; Robinson et al., 1998). However, our study sites are open peatlands with a low occurrence of vascular plants and mycorrhiza. Hence, we assume that these mechanisms cannot be the main drivers of our observed δ15N depth patterns. Tfaily et al. (2014) reported that changing microbial abundance and metabolic pathways are correlated with δ15N values. Conversely, this would mean that δ15N values could reflect the hydrology status. Therefore, we assume δ15N values allow us to draw conclusions about whether the observed peatlands have a natural, drained or rewetted hydrology status.
Following previous studies, we use specific terms for the points of change in the stable isotope depth pattern. The points where the stable isotope signals undergo a sudden directional shift with depth are called “turning points”, according to Alewell et al. (2011). Furthermore, the bottom of the mesotelm and the onset of the underlying catotelm are marked by the δ13C turning point.
To test the idea of changing dominant microbial communities as drivers for isotope depth patterns, we did a fatty acid (FA) analysis of four investigated sites, namely two drained and two natural sites in Degerö Stormyr (central Sweden; 70 km from Umea) and Lakkasuo (southern Finland; 14 km north of Orivesi). FAs are valid markers for indicating the abundance of specific microbial communities in the peat because they are specific and persistent compounds of cell membranes of different species (Bajerski, Wagner and Mangelsdorf, 2017; Finotti et al., 1993; Piotrowska-Seget and Mrozik 2003; Reiffarth et al., 2016). Therefore FAs enable us to make qualitative and quantitative statements about the relative abundance of different microbial communities. We will test the existence of four bacterial markers (namely C14:0 as general marker; i-C15:0 and a-C15:0 indicative for gram positive; and C16:1ω9c indicative for gram negative; Vestal and White 1989; Willers et al., 2015; Zelles, 1997) and one fungal marker (C18:2ω9c; Sundh et al., 1997; Elvert et al., 2003; Willers et al., 2015).
We hypothesize that microbial abundance and diversity are the drivers for the distinct observed δ15N depth pattern in natural, drained or rewetted peats. We assume the δ15N depth pattern can therefore be used as an inexpensive and less time-consuming tool to obtain reliable information of peatland hydrology.
2.1 Site description
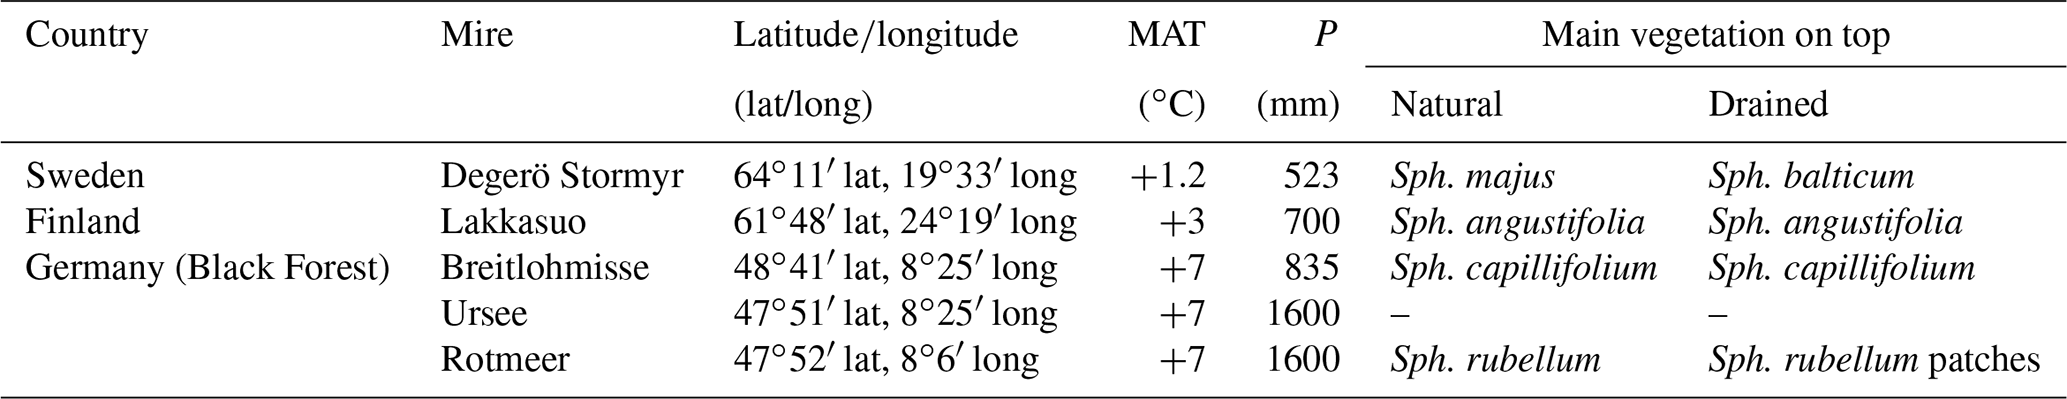
We studied five oligotrophic peatlands (Tables 1–2). All investigated sites are classified as fibric Histosols (HSf; IUSS, 2015; organic soils). Fibric Histosols are classified as soils with a cumulative organic layer and an organic matter amount of 35 % or higher in at least half of the uppermost 80–100 cm and with a high amount (two-thirds) of little decomposed plant residuals (IUSS, 2015). In addition all investigated peatland soils are Sphagnum peats because of their mean annual temperatures (between +1.2 and +7 ∘C) and their annual precipitation between 523 mm and 1600 ppm (Eurola et al., 1984; Vitt, 2006).
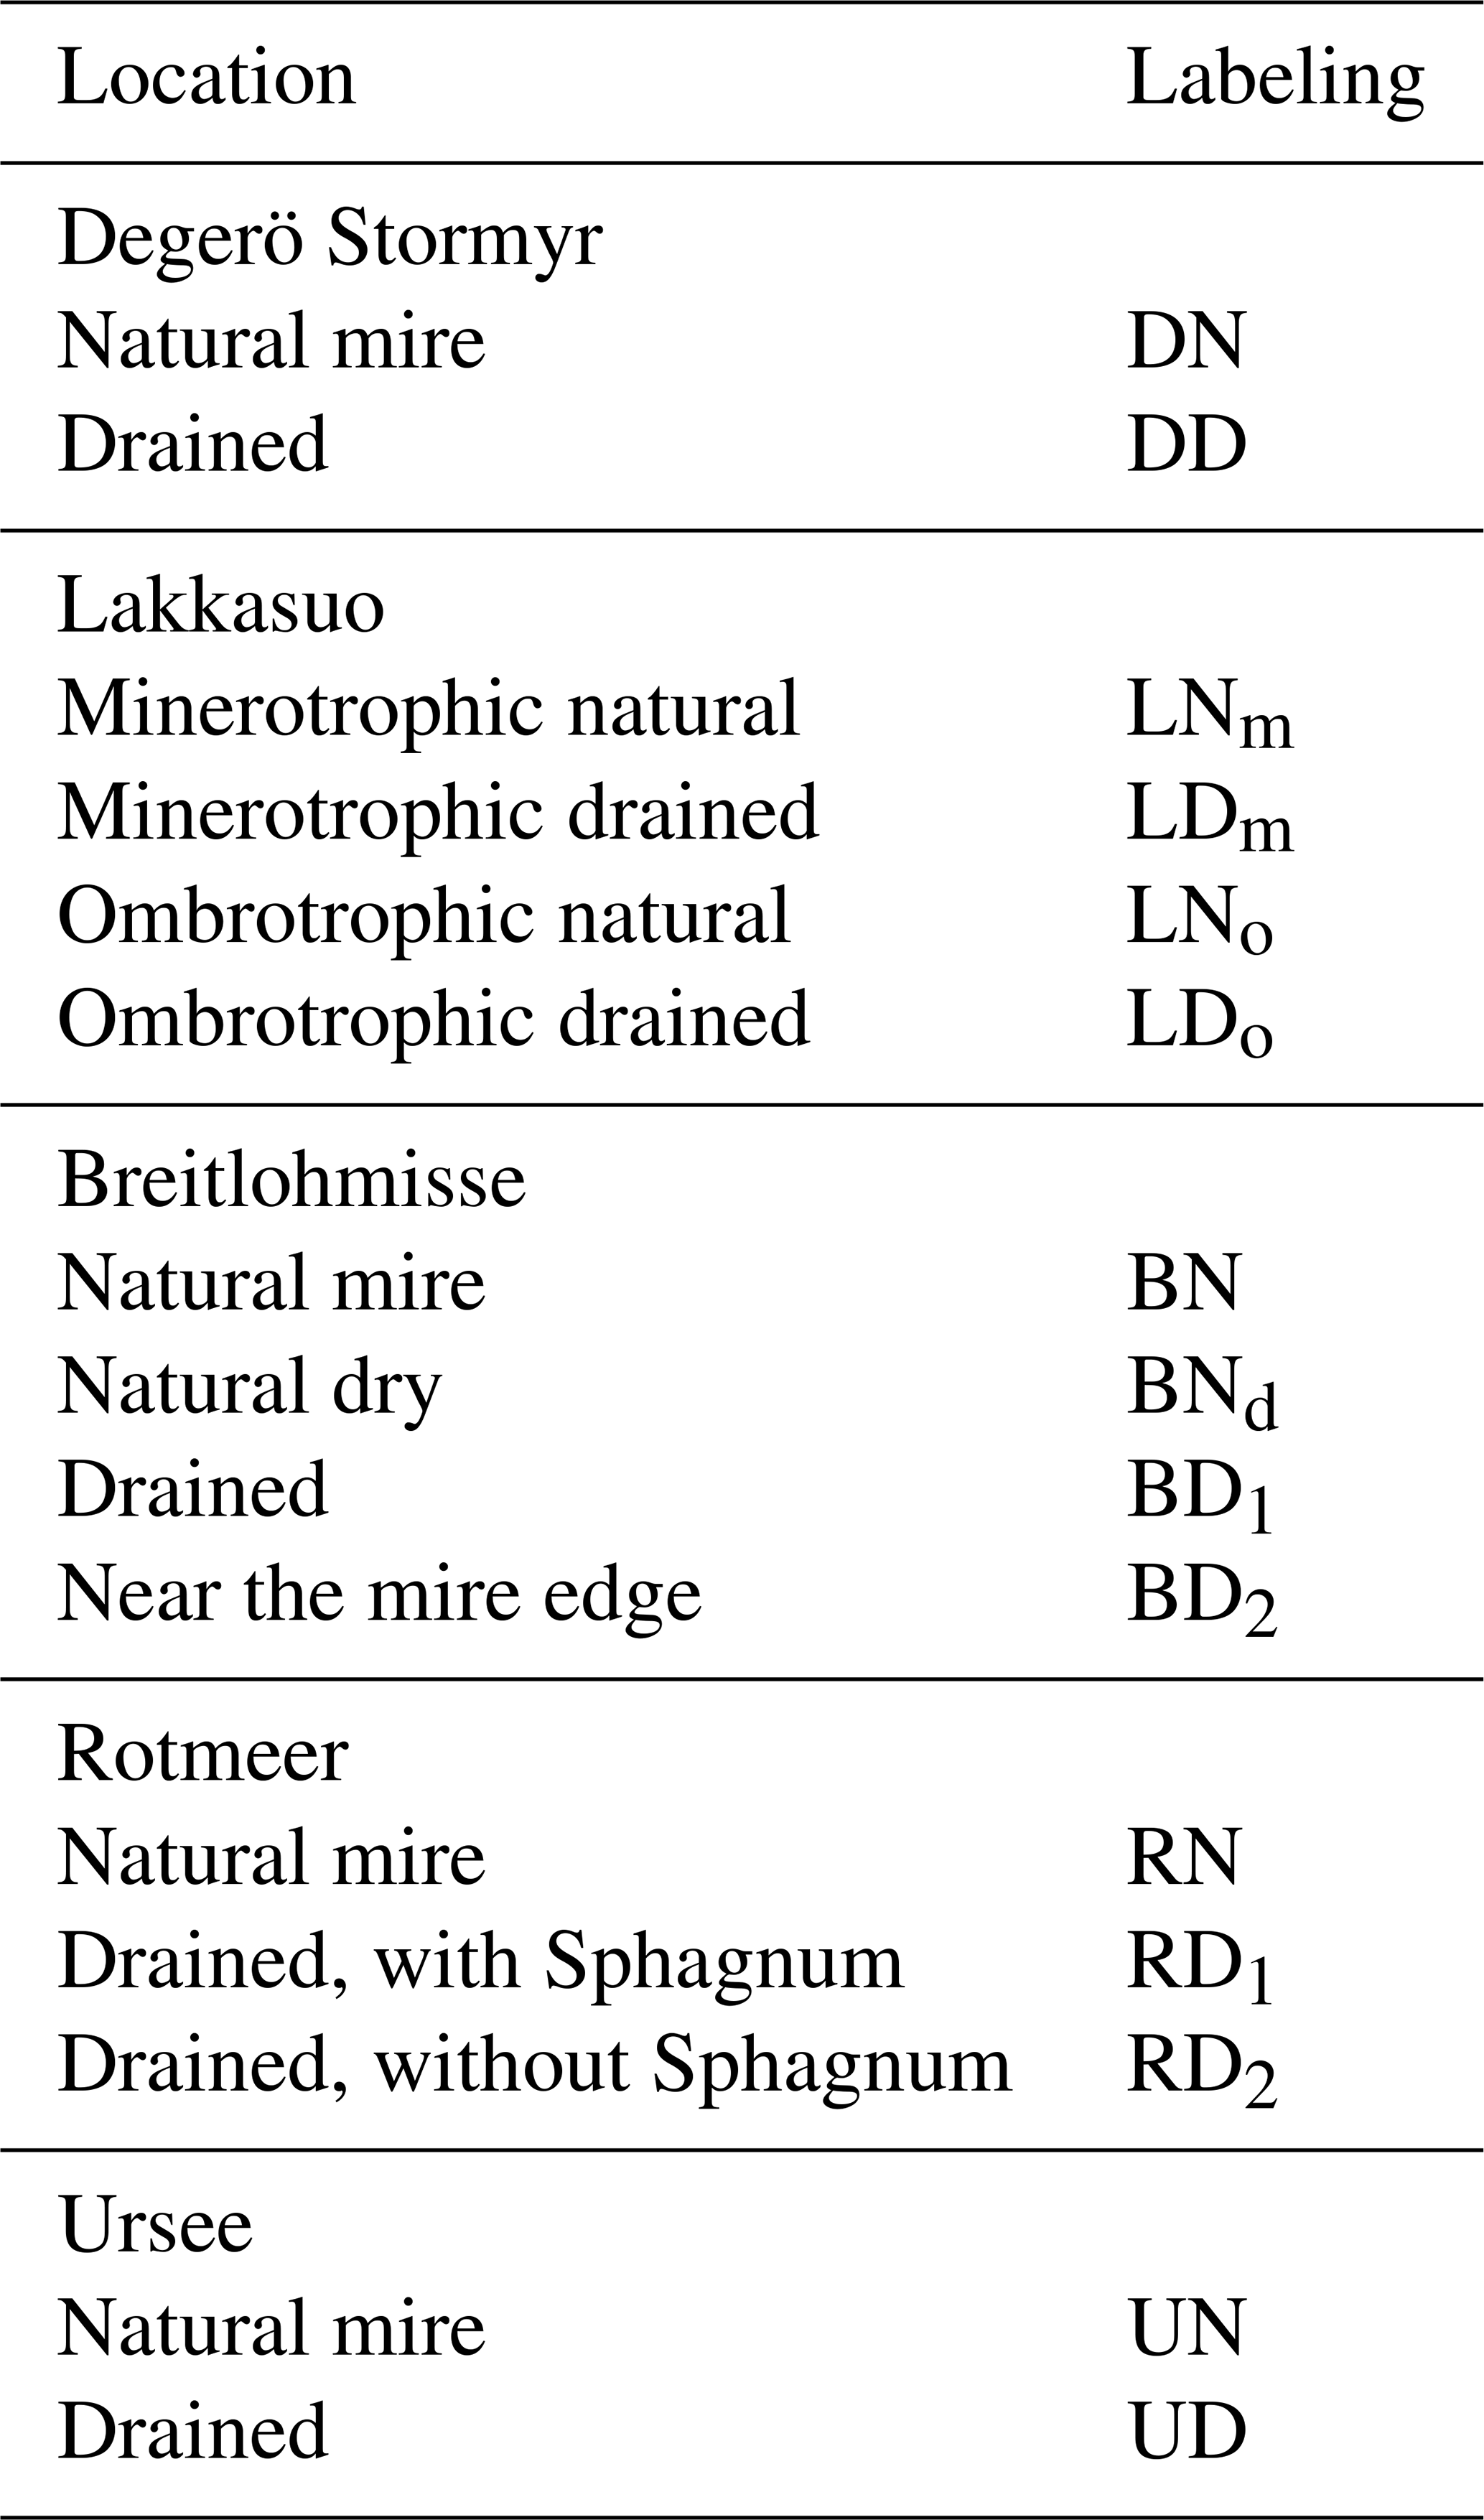
Table 2Overview of studied mires, coordinates (latitude/longitude), mean annual temperature (MAT), annual precipitation (P), and Sphagnum mosses (Sph.; Laine et al., 2004; Nilsson et al., 2008; DWD, 2018; Alexandersson et al., 1991; Armbruster et al., 2003).
Degerö Stormyr (200 m above sea level – a.s.l.) is situated in northern Sweden, at the Kulbäcksliden Experimental Forest near Vindeln, between the rivers Umeälven and Vindelälven (Eurola et al., 1984). It is an acidic mire with minerotrophic conditions and consists of interconnected small mire patches divided by ridges of glacial till. Degerö Stormyr is classified as northern eccentric peatland (Eurola et al., 1984). The climate is characterized as cold, with no dry seasons and cold summers (Dfc zone, based on the Köppen–Geiger climate classification; Peel et al., 2007). In Degerö Stormyr, ditches were installed at the beginning of the 20th century, were closed in 2017 and a natural reestablishment of Sphagnum took place afterwards. The water table is at the surface in the natural part (DN; Nilsson et al., 2008) and in around 10–15 cm depths at the drained location (DD).
Lakkasuo (150 m a.s.l.), central Finland, is a northern eccentric peatland complex (Eurola et al., 1984) with two parts. In the southern part the conditions are ombrotrophic, whereas the northern part is minerotrophic (Minkkinen et al., 1999). Lakkasuo is also located in the cold climate zone, with no dry seasons and cold summers (Dfc zone, based on the Köppen–Geiger climate classification; Peel et al., 2007). The ditches that were installed in 1961 (70 cm depth; spacing of 40–60 m) affect approximately 50 % of the peatland (Minkkinen et al., 1999). In the ombrotrophic natural site (LNo) the water table was around 13 cm below ground surface. The ombrotrophic drained site (LDo) had a water table with a 26 cm depth (average), whereas the water table is near the surface at the minerotrophic natural site (LNm) and at an average depth of 36 cm in the minerotrophic drained site (LDm; Minkkinen et al., 1999; Tables 1–2). In the Black Forest three mires were investigated, namely Breitlohmisse, Ursee and Rotmeer. They are located in the temperate climate zone with no dry seasons and warm summers (Cfb zone, based on the Köppen–Geiger climate classification; Peel et al., 2007). In the mires of the Black Forest, ditches were installed in the middle of the 20th century. Breitlohmisse (810 m a.s.l.; 50 km southeast of Baden-Baden) is minerotrophic and is located in the northern part of the Black Forest. The mire is mostly lanced with ditches for hunting (BNd). The ditches are naturally refilled with Sphagnum. The water table is at an average depth of 15 cm in the natural center (BN; BNd) and is found at lower depths near the degraded edges of the mire (BD1; BD2). Rotmeer (960 m a.s.l.; 40 km southeast of Freiburg im Breisgau) and Ursee (850 m a.s.l., 45 km southeast of Freiburg im Breisgau) are both in the southern Black Forest. Rotmeer consists of an ombrotrophic center (RN; water table at the surface), surrounded by a minerotrophic part with signs of decomposition (RD1; water table around 12 cm depth) and without mosses at the edges (RD2; water table below 12 cm depth). Urmeer is minerotrophic. A quaking bog forms the center with the water table at the surface (UN), whereas the edges had a lower water table (UD; Tables 1–2).
2.2 Soil sampling and bulk analyses
In May 2012 (Breitlohmisse), June 2012 (Rotmeer), July 2012 (Ursee) and September 2013 (Degerö Stormyr and Lakkasuo) three volumetric peat cores were drilled per site with a Russian peat corer (Eijkelkamp, the Netherlands) at a medium stage of small-scale topography. In Degerö Stormyr cores were sampled in the assumed natural center of the mire (DN) and a 1 m distance from a drainage ditch (1 m depth; DD). In Lakkasuo we took cores at the natural sites (ombrotrophic natural – LNo; minerotrophic natural – LNm) and the drained locations (ombrotrophic drained – LDo; minerotrophic drained – LDm). For Ursee two cores were taken, namely one in the natural center (UN) and one at the drained edge of the mire (UD). In Breitlohmisse and Rotmeer we took cores in a transect from natural (BN and RN) to strong drained (BD2 and RD2) sites. Each core has a composite length of 1 m. Here, we focus on the uppermost 60 cm because this part included the drained horizon, and no major changes in isotopic composition were observed at the natural sites below the mesotelm. In all investigated peatlands, the catotelm starts in the natural sites below a 10 cm depth and varied in drained sites but was always visible below a 40 cm depth.
Directly after drilling, HIs were determined for each horizon with the von Post scale. The von Post scale has a range from 1 to 10. HI 1 indicates natural condition with undecomposed, completely visible vegetation residuals. HI 10 represents a strongly decomposed horizon without visible vegetation residuals (Silc and Stanek, 1977).
The cores were encased in plastic shells and covered with plastic wrap, stored in coolers, and transported to the laboratory. The cores were sliced in 2 cm sections and every second layer was analyzed, giving a 4 cm depth resolution. Samples were ovendried at 40 ∘C for 72 h and homogenized with a vibrating ball mill (MM400; Retsch GmbH, Haan, Germany). Stable C and N isotopic compositions were measured with an elemental analyzer combined with an isotope ratio mass spectrometer (EA–IRMS; Inegra2, Sercon Limited, Crewe, UK). Carbon isotopic composition (13C∕12C) was expressed relative to the Vienna Pee Dee Belemnite (VPDB) standard and reported in delta notation (‰); stable nitrogen isotopes were expressed relative to the atmospheric nitrogen standard and reported in delta notation (‰). C∕N was determined with the mass relationship of the measured bulk content of C and N. Bulk density was measured with volumetric samples, which were weighted before and after drying.
In Degerö Stormyr tree rings of seven individual trees were analyzed (Pinus sylvestris) to obtain information of growth conditions and, therefore, to enhance our knowledge of drainage history.
2.3 Fatty acid analysis
Four cores (per site; one drained and one natural core) were selected to do a fatty acid analysis, namely two sites in Lakkasuo (LDo 1 and LNo 3) and two sites for Degerö Stormyr (DD 3 and DN 1). We took subsamples from all cores in the acrotelm (respectively, at the end of the mesotelm in DD) and in the catotelm. At the drained sites of DD 3 and LDo 1, we also took samples in the middle and at the end of the mesotelm.
We processed 0.2–1.1 g of sample for the lipid extraction with a mixture of CH2Cl2:MeOH (9:1 ν∕ν) in an accelerated solvent extractor (Dionex ASE 350; Thermo Fisher Scientific, Waltham, Massachusetts, USA). A total of 50 µL of an internal standard (0.4 mg mL−1; nonadecanoic acid) was added before processing each sample.
The total lipid extracts (TLEs) were saponified by adding 2 mL of KOH dissolved in MeOH (12 %) and putting it in the oven for 3 h at 80 ∘C.
Following the method of Elvert et al. (2003), TLEs were pooled afterwards with 1 mL KCl (0.1 mol), and the neutral fraction was extracted by agitating three times with hexane. Neutral fraction in the supernatant was separated, dried under a stream of N2 and stored in the fridge for later analysis. We acidified the rest of the TLEs with fuming hydrochloric acid to a pH of 1. The acid fraction was extracted by agitating again three times with hexane. The acid fraction in the supernatant was separated and hexane was reduced to near dryness under a stream of N2. Then the acid fraction was methylated by adding 1 mL boron trifluoride (BF3) in MeOH (12 %–14 %) and putting it in the oven for 1 h at 60 ∘C. Afterwards the resulting fatty acid methyl esters (FAMEs) fraction was pooled with KCl (0.1 mol) extracted by agitating again three times with hexane and transferred in 2 mL vials. The FAMEs were quantified with a gas chromatograph (Trace Ultra GC) equipped with a flame ionization detector (FID; Thermo Fisher Scientific, Waltham, Massachusetts, USA). The carrier gas (helium) had a constant flow of 1.2 mL per minute and the GC–FID was set to splitless mode. Detector temperature was 320 ∘C and the samples (dissolved in hexane) were injected by 300 ∘C. The starting temperature of the oven was 50 ∘C. The temperature was increased by 10 ∘C per minute to 140 ∘C. The temperature was held for 1 min before it was increased up to 300 ∘C. This temperature was held for 63 min.
To identify the fungal and bacterial markers, we used the bacterial acid methyl esters (BAMEs) standard (Supelco, Inc, Pennsylvania, USA). The standard includes the following FAs as markers for bacteria: C14:0 (general bacterial marker; Willers et al., 2015, Zelles, 1997); i-C15:0 and a-C-15:0 (for gram-positive bacteria; Zelles, 1997; O'Leary and Wilkinson, 1988; Tunlid and White, 1992); and C16:1ω9c (for gram-negative bacteria; Willers et al., 2015; Zelles, 1997). For fungi, the standard includes C18:2ω9c (Andersen et al., 2010; Sundh et al., 1997; Zelles, 1997; O'Leary and Wilkinson, 1988; Vestal and White, 1989). Quantification of the FAs was done using the internal standard, C19:0 FA, after correcting for the methyl group added during methylation reaction.
2.4 Data evaluation and statistical analysis
As we were interested in comparing the depth trends of all single profiles with each other, we first normalized the depths of the cores. This was done using the depth of the δ15N turning point (see Sect. 3.1) in each drained profile as the anchor point serving as normalized depth (normD). The normalized depth of this anchor point was set to a 20 cm depth (normD = 20 cm; Fig. 1) in each single core. In the corresponding natural cores, we transferred the values from the same depth related to the drained core into the same norm depth. For example the values of the natural site (DN) in a depth of 13 cm (depth of the turning point of δ15N in the corresponding DD core) were set to 20 cm normD.
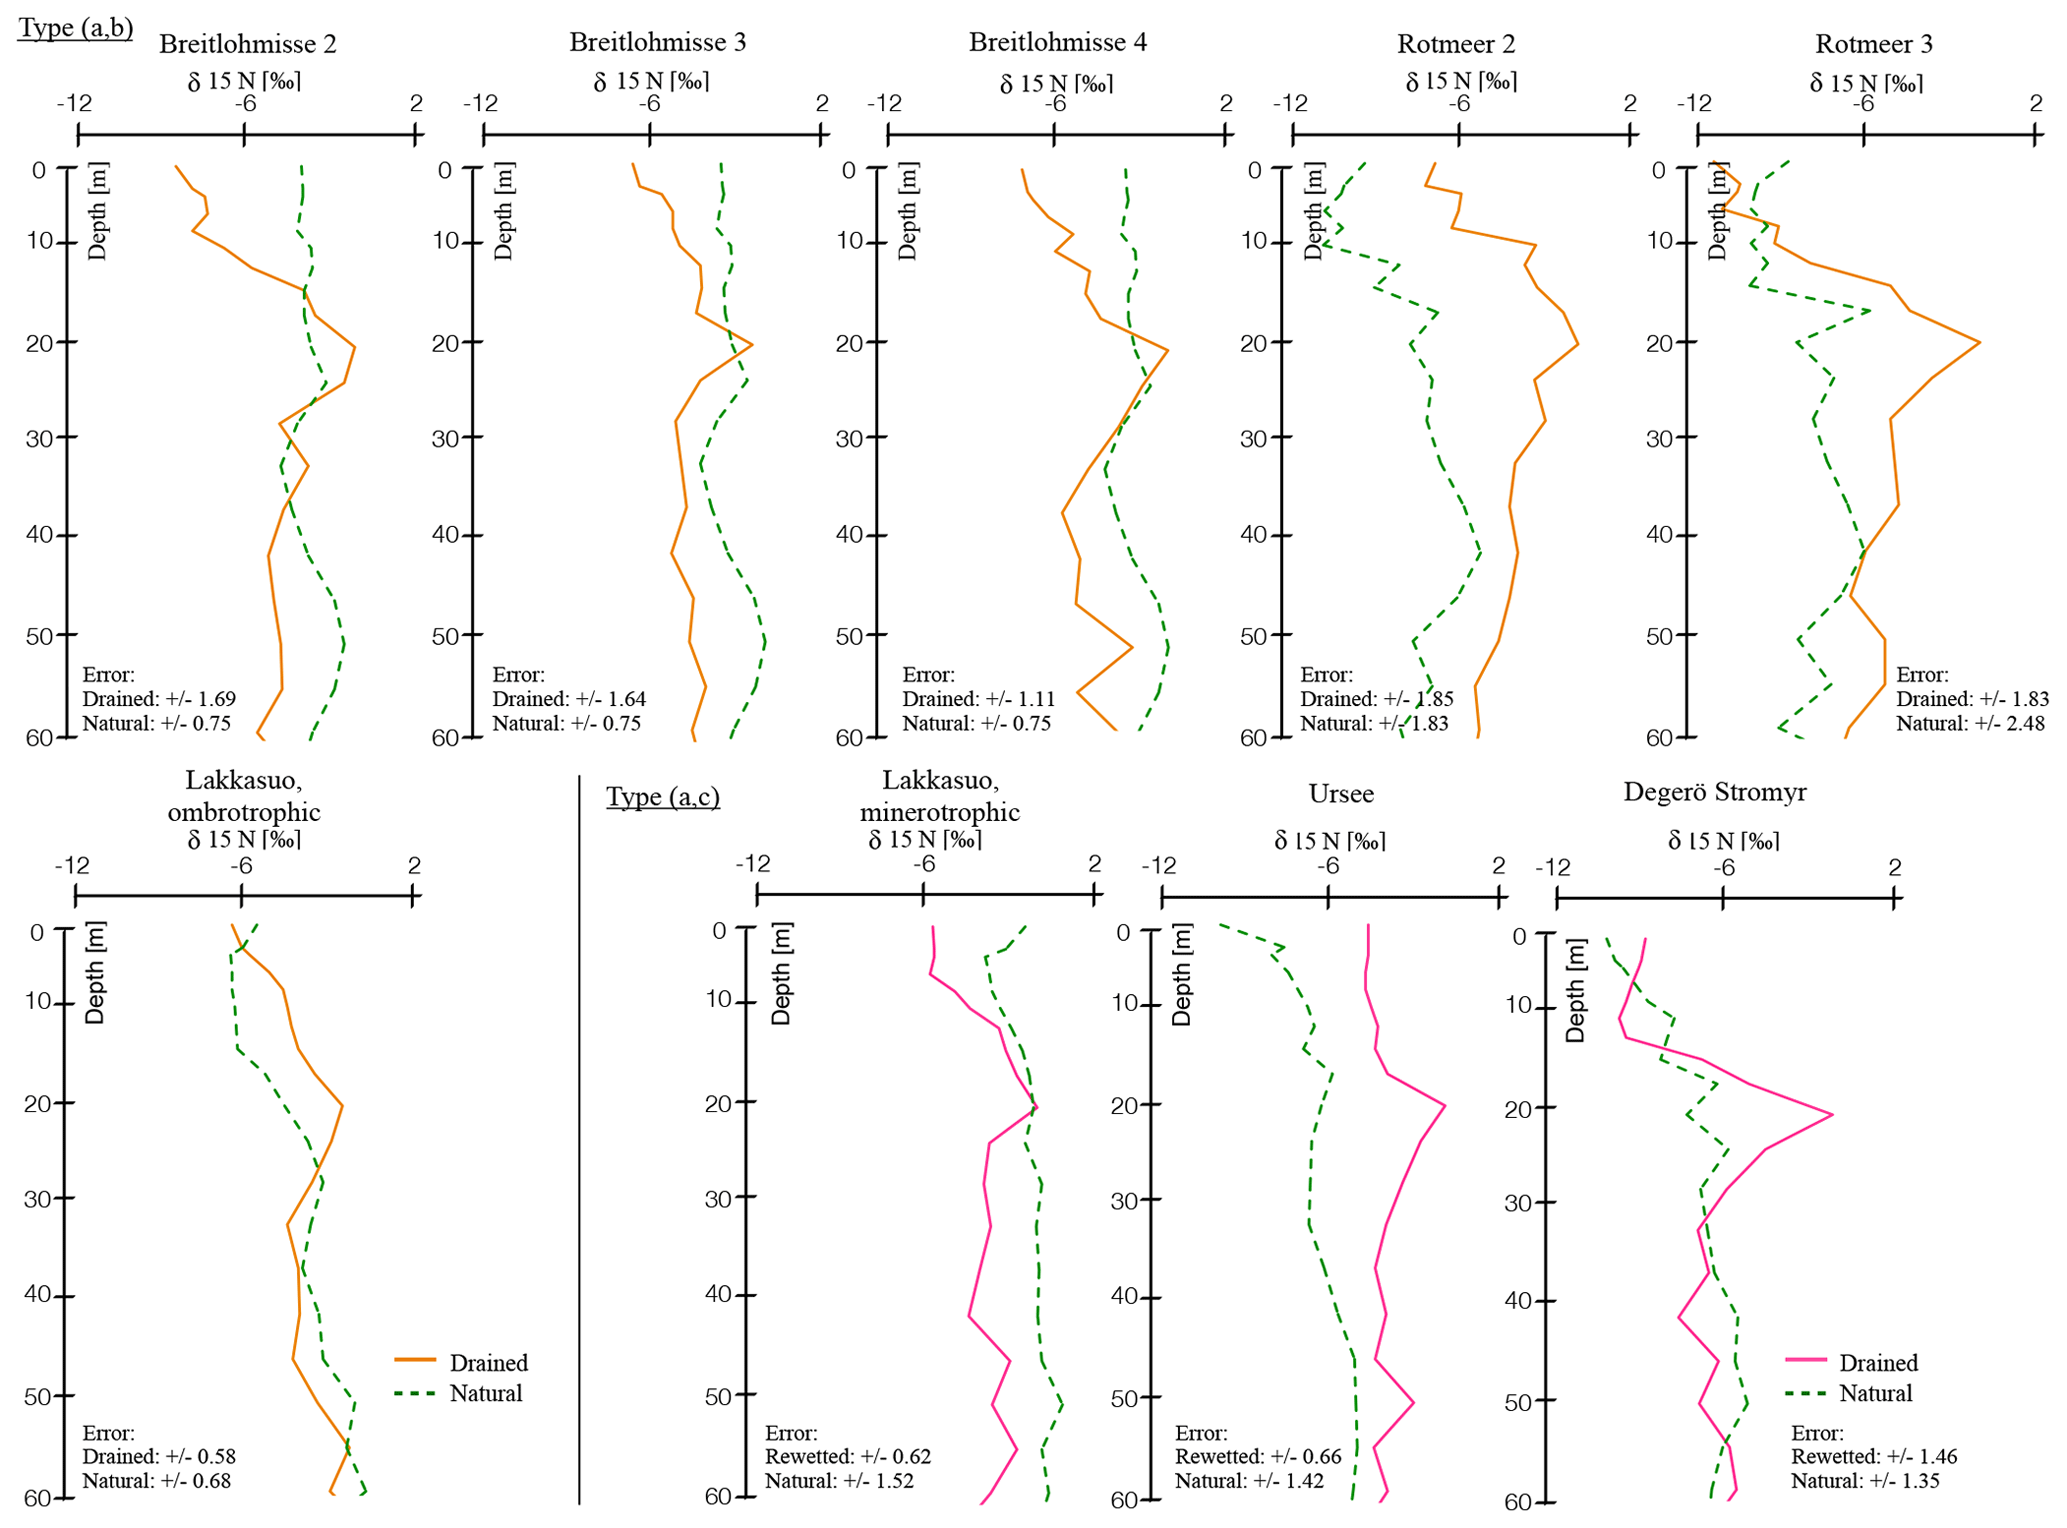
Figure 1δ15N depth profiles in all natural and drained (or rewetted) sites, with normalized depth and normalized δ15N values (see Sect. 2.4); trend types included (a) natural (green), (b) drained up to the surface (orange), and (c) rewetted above drainage (pink; for single, nonnormalized values see the Supplement).
In a second step, because we were mainly interested in trends and not the absolute values, we normalized the isotopic values themselves because the range of δ15N varied considerably between the sites, whereas the trends show consistent patterns (Fig. 1). Therefore, to be able to do a meaningful comparison we set the value of δ15N at the turning point to zero in each profile as follows:
Using the same procedure, all other parameters (δ13C, C∕N and BD) were normalized using the same anchor point (e.g., δ15N turning point) as follows:
We used the above procedures' means to decide on the depth of the δ15N turning points, which we backed up statistically with a t test (p≤0.05) and an integrated change point analysis with the software package “changepoint” in R (version 1.0.153). These analyses were done for each of the drained sites separately and also with an average of all the locations. For the t test, we analyzed if δ15N values in the drained horizon are of the same population as the values of the natural sites for each depth (H0 – drained and natural values are of the same population). For the changepoint analysis, the variance of δ15N was evaluated with a linear gradient over the whole drained peat profile against the variance of three or four separated linear gradients (rewetted part, if present, upper mesotelm, lower mesotelm and catotelm). Here, we define the starting point of the drained horizon with the onset of a shift in the δ15N values upward and the end of this horizon with the stabilization of the δ15N values towards the surface.
We also determined the slopes of each single core to acquire information on the strength of the differences of the isotopic values with depth. First, the whole peat profile of each drained core was analyzed as one trend (called “overall profile”). Second, profiles were separated into the following different horizons: (i) rewetted horizon (if present), (ii) upper mesotelm, (iii) lower mesotelm and (iv) catotelm. If the values were clearly changing with depth, then the slopes were closer to zero. In horizons with stabilized values, the slopes were distinctly higher or lower than zero.
In the following we present only the normalized data. Raw data without normalization are available in the Supplement.
2.5 Tree ring width and microscope analysis of peat
The investigation of the tree ring width of seven surrounding trees (Pinus sylvestris) in Degerö Stormyr was done with a hand-operated wood drill (Djos Increment Borers, Haglöf Sweden, Västernorrland, Sweden; 5 mm diameter). Samples were fixed on wooden carriers. The tracheids (elongated cells of the xylem of vascular plants) were cut with a sharp carbon blade and analyzed with an impinging light binocular (60×–160× amplification).
Peat samples of four study sites were analyzed using an impinging light binocular (60×–160× amplification) to obtain an overview of the vegetation assemblages and to differentiate horizons. For detailed information (and the distinction of the Sphagnum species) the samples were elutriated with water, pigmented with methyl blue and analyzed under a transmitted light microscope (100×–640× amplification).
3.1 Depth profile of vegetation assemblage and water table defining the hydrological statuses
Following our indicators (HI and vegetation assemblages), we defined the following three types of hydrological statuses: (a) natural, (b) drained up to the surface and (c) profiles with a rewetted horizon above the drained horizon (Fig. 1).
All sites, which we attributed as “natural” (type a), had a water table near the surface (<10 cm; Sect. 2.1), macroresiduals were highly visible throughout the profile, HIs were low, and the main living vegetation was Sphagnum spp. (Tables 3 and S4).
Table 3Description of the vegetation of four of the study sites and Sphagnum mosses (Sph.).

All drained sites had higher HIs even if no direct modifications in the vegetation assemblage could be documented. For type (b), there was little or no Sphagnum visible at the surface and the water table was found at lower depths (Sect. 2.1). Macroresiduals were more strongly affected by decomposition and HIs were high up to the surface. Especially the ombrotrophic-drained site (LDM) was influenced by drainage. Here, mosses of drier environments replaced Sphagnum species or mosses were completely absent (Tables 3 and S4).
For type (c), vegetation assemblages were mainly composed of Sphagnum spp. and the water table was near the surface. HIs were low in the rewetted horizon and macroresiduals were preserved well (Sect. 2.1; Tables 3 and S4). With the onset of the upper mesotelm, HIs and decomposition of macroresiduals was high. In the lower mesotelm, the HIs were decreasing and more macroresiduals were visible. In the catotelm, the quality of macroresiduals was higher than in the mesotelm and the HIs were even lower (Tables 3 and S4).
3.2 Tree ring widths are verifying the rewetted hydrological status of Degerö Stormyr
Tree ring width is a marker for the wellbeing and/or growth rate of trees. Young trees have a small circumference, coupled with high growth rates, which leads to thicker tree rings. Tree rings get smaller with the increasing age of the tree. If there are no environmental stressors like heat, increasing wetness or drought, tree rings are bigger and the cell lumen is higher compared to trees at sites with environmental stress. With increasing environmental stress, tree ring width decreases (Stoffel et al., 2010). Before 1992, tree rings at the drained site (DD) site showed only a slightly decreasing trend, which could be due to aging (average of 1.3 mm width in the 1930s to an average width of 0.9 mm in the late 1980s). The draining ditches in Degerö Stormyr were established at the beginning of the 20th century, which supports these results, with dryer and therefore better growth conditions for trees. From 1992 onwards tree ring widths decreased, reaching 0.2 mm in 1998 and thereafter. These results suggest a restoration to a wetter, i.e., more natural hydrological status. Rewetted hydrological conditions are not favorable for tree growth and thus lead to smaller tree ring width.
3.3 Biogeochemical parameters and hydrological status
Biogeochemical composition of peatlands strongly reflects the related hydrological status (Moore and Basiliko, 2006).
As is typical for oligotrophic peatlands, our investigated natural sites have an average C∕N ratio of 57 (Table S7). This is in line with results from Malmer and Holm (1984) and Kuhry and Vitt (1996) who found the C∕N ratio in the acrotelm of oligotrophic peatlands to be higher than 35 (mostly between 50 and 90). The values in the mesotelm were lower compared to both acrotelm and catotelm, most likely due to higher decomposition rates and the release of CO2 (Table S7). As is typical for peatlands, BD in our peatlands is low due to the high amount of plant residuals in the soil and low values of mineralization (Novak et al., 2008), with 0.02 kg m−3 at the surface and increased with increasing decomposition and compaction of plant material downwards to 0.04 kg m−3 in the mesotelm (Table S8). BD was also increasing in the catotelm (average of 0.05 kg m−3; Table S8), following the increased gravimetric pressure.
In contrast, the biogeochemical parameters of drained sites have a very different pattern. The lower C∕N ratio in the acrotelm (average of 41; Table S7) and the mesotelm (average of 35; Table S7) indicates higher mineralization rates with gaseous release of carbon and nitrogen (Krüger et al., 2017). In the catotelm with natural, anaerobic conditions, the C∕N ratio was in the same range as in the natural sites (average of 49; Table S7). BD of the acrotelm and mesotelm (average of 0.07 kg m−3; Table S8) also increased as a consequence of the enhanced decomposition processes.
These results are in line with the hydrology statuses indicated by the vegetation analysis (Sect. 3.1).
3.4 Stable nitrogen isotope depth trends as indicators for the hydrology status
While mineral soils have been shown to have continuous increasing values of δ15N (Nadelhoffer et al., 1996; Högberg et al., 1997), we found increasing δ15N and δ13C values with depth down to particular isotopic-specific turning points in drained peatland soils (Fig. 1).
The trends of the single eight out of nine studied drained peatlands and the average trend confirm the existence of a δ15N turning point. We determined a significant difference with p<0.05 between δ15N in the center of the mesotelm compared to the δ15N values in undrained horizons (Table S1), with a nonsignificant difference for one drained site, namely Breitlohmisse (BD1). The latter was most likely related to generally higher δ15N values of the natural site in Breitlohmisse (BN) compared to a smaller increase in δ15N at the related drained site (BD1). The depth of δ15N turning point (center of the mesotelm) differs from δ13C turning point (end of the mesotelm) for all investigated sites (Fig. 2).
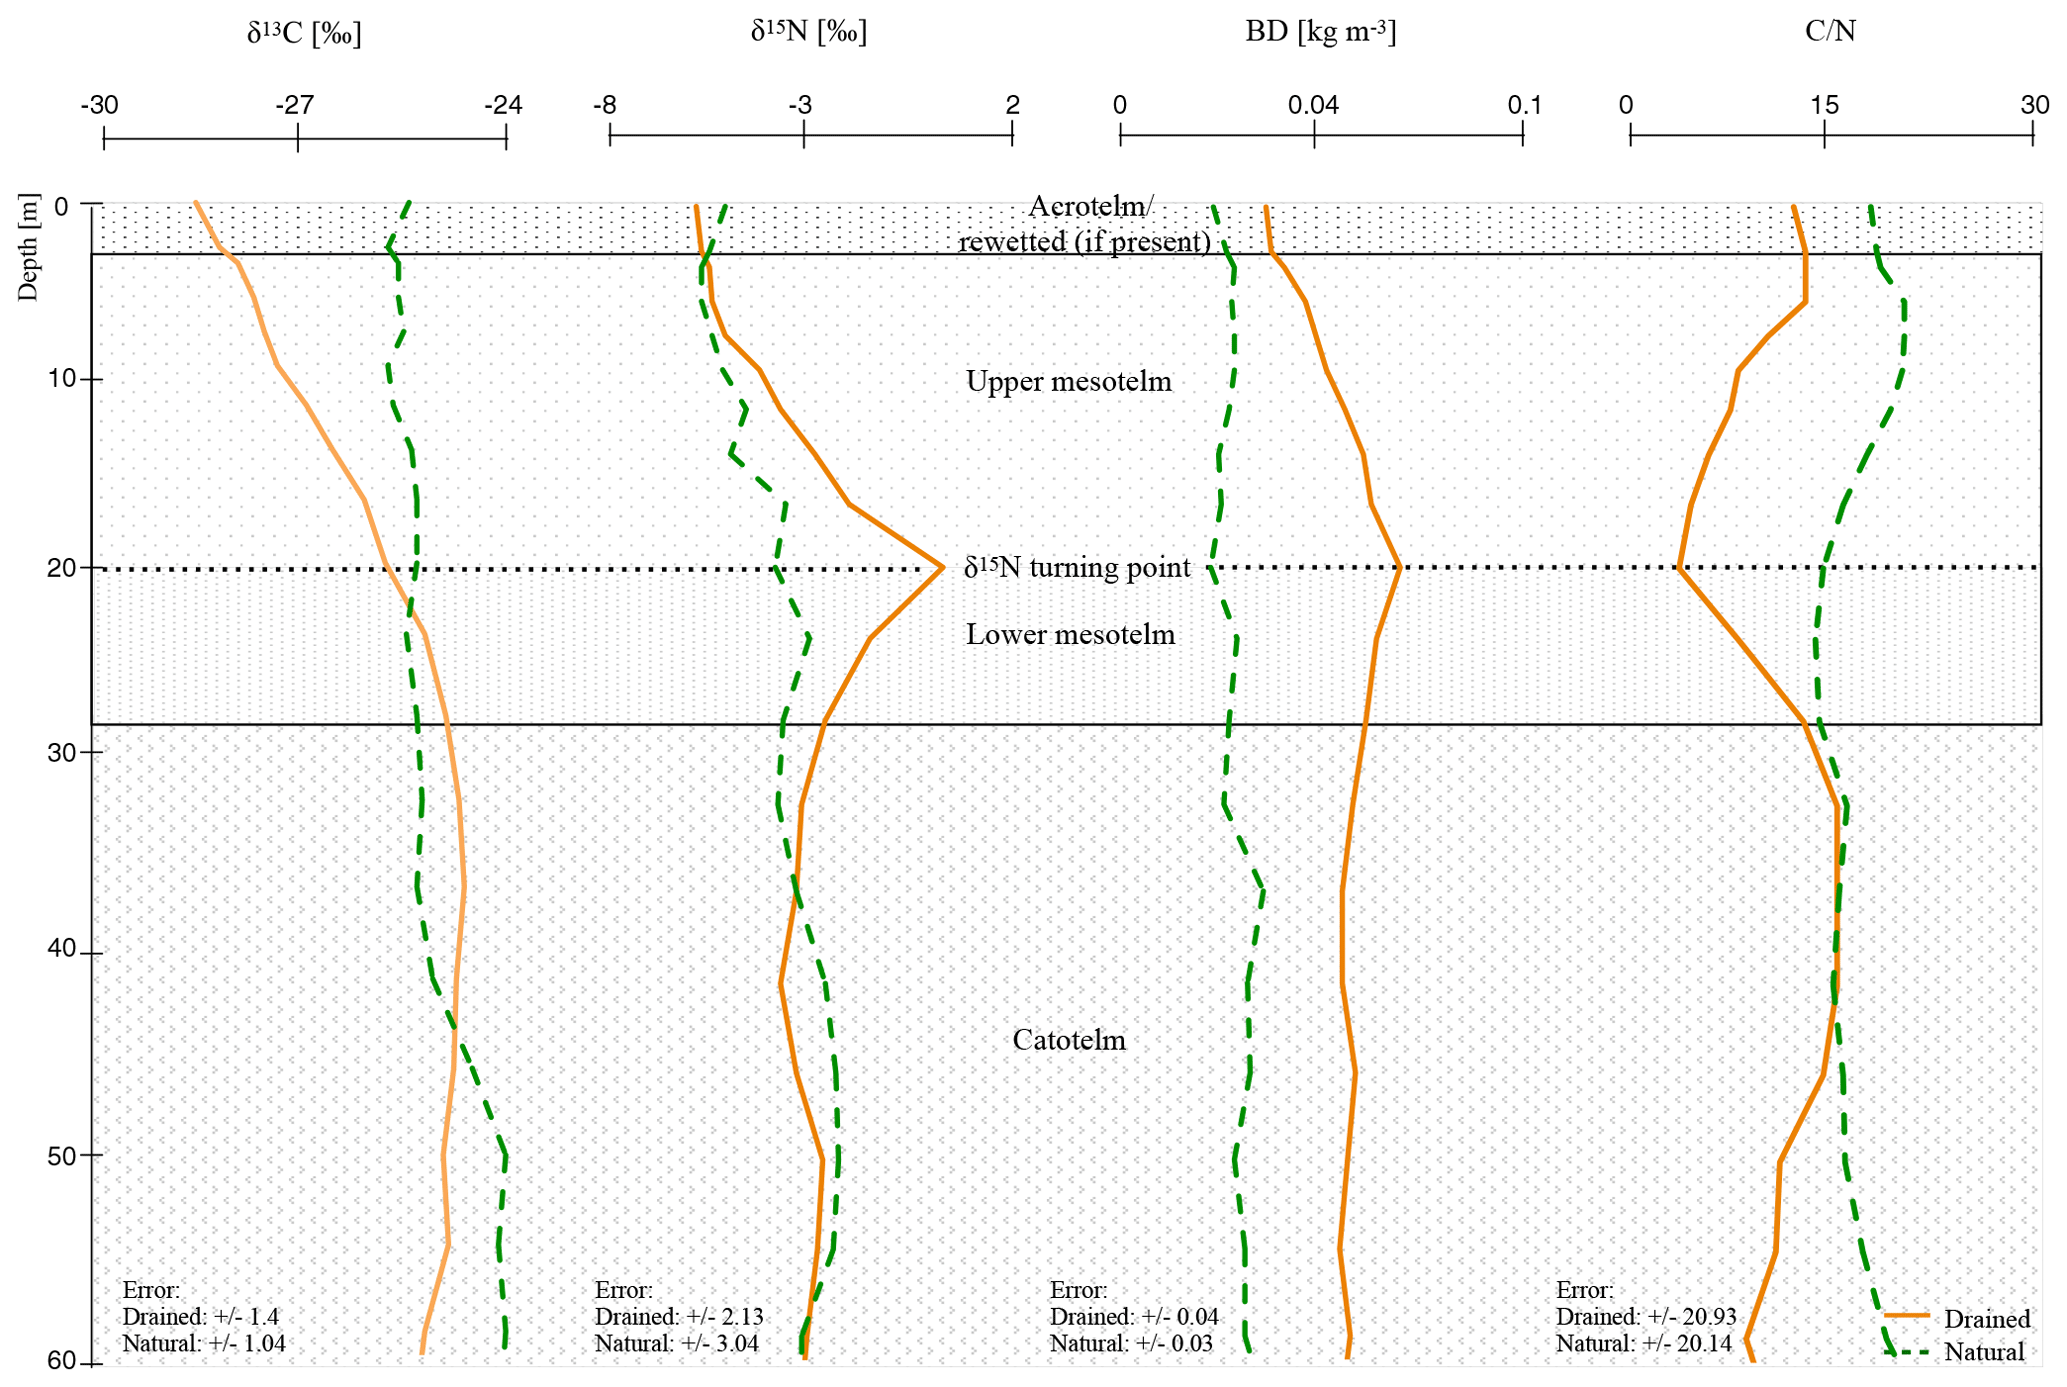
Figure 2Mean depth trends (δ15N, δ13C, C∕N, and BD) of natural and drained sites of all nine investigated peatlands with normalized depth and normalization based on δ15N compositions (see Sect. 2.4; for single δ13C, C∕N, and BD values of all peat cores see the Supplement).
Changed slope values of the separated horizons indicate significant trend changes (Table S3). In anaerobic conditions (natural and catotelm) with stabilized isotopic values with depth, slopes were distinctly different to 0 (cm ‰−1). δ15N values seem to change rapidly within the mesotelm and slope values were closer to zero. Most interesting was a switch to negative trend values at the δ15N turning point in all investigated drained sites, which marks the beginning of the lower mesotelm (Table S3).
In a natural hydrological status – type (a) – all investigated parameters had a low variability and indicated a natural, wet mire hydrology status (Fig. 1). There were two exceptions, namely Breitlohmisse natural (BN; 40–60 cm normD) and Rotmeer natural (RN; 30–50 cm normD), with trend instabilities of δ15N. This might indicate some minor drainage or disturbance in the wetland sites we classified as “natural” (Fig. 1).
In contrast, the values of the drained sites showed significant trends. We found two different trend types in the drained sites, namely type (b) and (c; Fig. 1). For type (b) we distinguished six sites, namely Lakkasuo ombrotrophic drained (LDo); Breitlohmisse natural dry (BNdd); Breitlohmisse drained 1 (BD1); Breitlohmisse 4 (BD2); Rotmeer drained 1 (RD1); and Rotmeer drained 2 (RD2) with clear signs of decomposition up to the surface. Type (c) was visible in three sites, namely drained site Degerö Stormyr (DD), minerotrophic drained site Lakkasuo (LDm), and Ursee 1 (UD). At type (c) sites the isotopic values, C∕N and BD, were stabilized again above the mesotelm. Therefore, they are assumed to be in a “new” natural status (Figs. 1–2).
Below 8 cm (normD; average profile) all drained profiles showed the typical signs of the upper mesotelm with increasing values of δ15N, δ13C and BD down to the δ15N turning point and decreasing C∕N. Below the δ15N turning point, in the lower mesotelm, δ15N values were decreasing. In this horizon, δ13C values, C∕N and BD were increasing. The end of the lower mesotelm was mostly linked to a clear shift in δ13C trend to either stable values or a slow decreasing trend; hence, we called this point δ13C turning point (28 cm normD; average profile; e.g., Krüger et al., 2014). Constant C∕N, BD and δ15N values below the δ13C turning point also served as indicators for reduced compaction and decomposition. Most likely the δ13C turning point marked the onset of permanent waterlogged anaerobic conditions (e.g., Krüger et al., 2016). The similarity of the trends in these deeper parts of the drained sites to those of the catotelm in the natural sites supported the assumption of an intact catotelm below the δ13C turning point (Figs. 1–2; for the single δ13C, C∕N and BD values of all peat cores see the Supplement).
3.5 Changing microbial FAs and nitrogen stable isotope depth pattern
Fungal-derived FAs (80 % of all microbial-derived FAs) were the dominant fraction near the surface. In the catotelm the microbial-derived FA values decreased down to 30 %, compared to the acrotelm and the mesotelm, with a clear dominance of bacterial-derived FAs (98 %), as a consequence of the anaerobic conditions (Fig. 3).

Figure 3Correlation of nitrogen stable isotope values and microbial fatty acid concentrations in natural and drained wetlands in Lakkasuo and Degerö Stormyr.
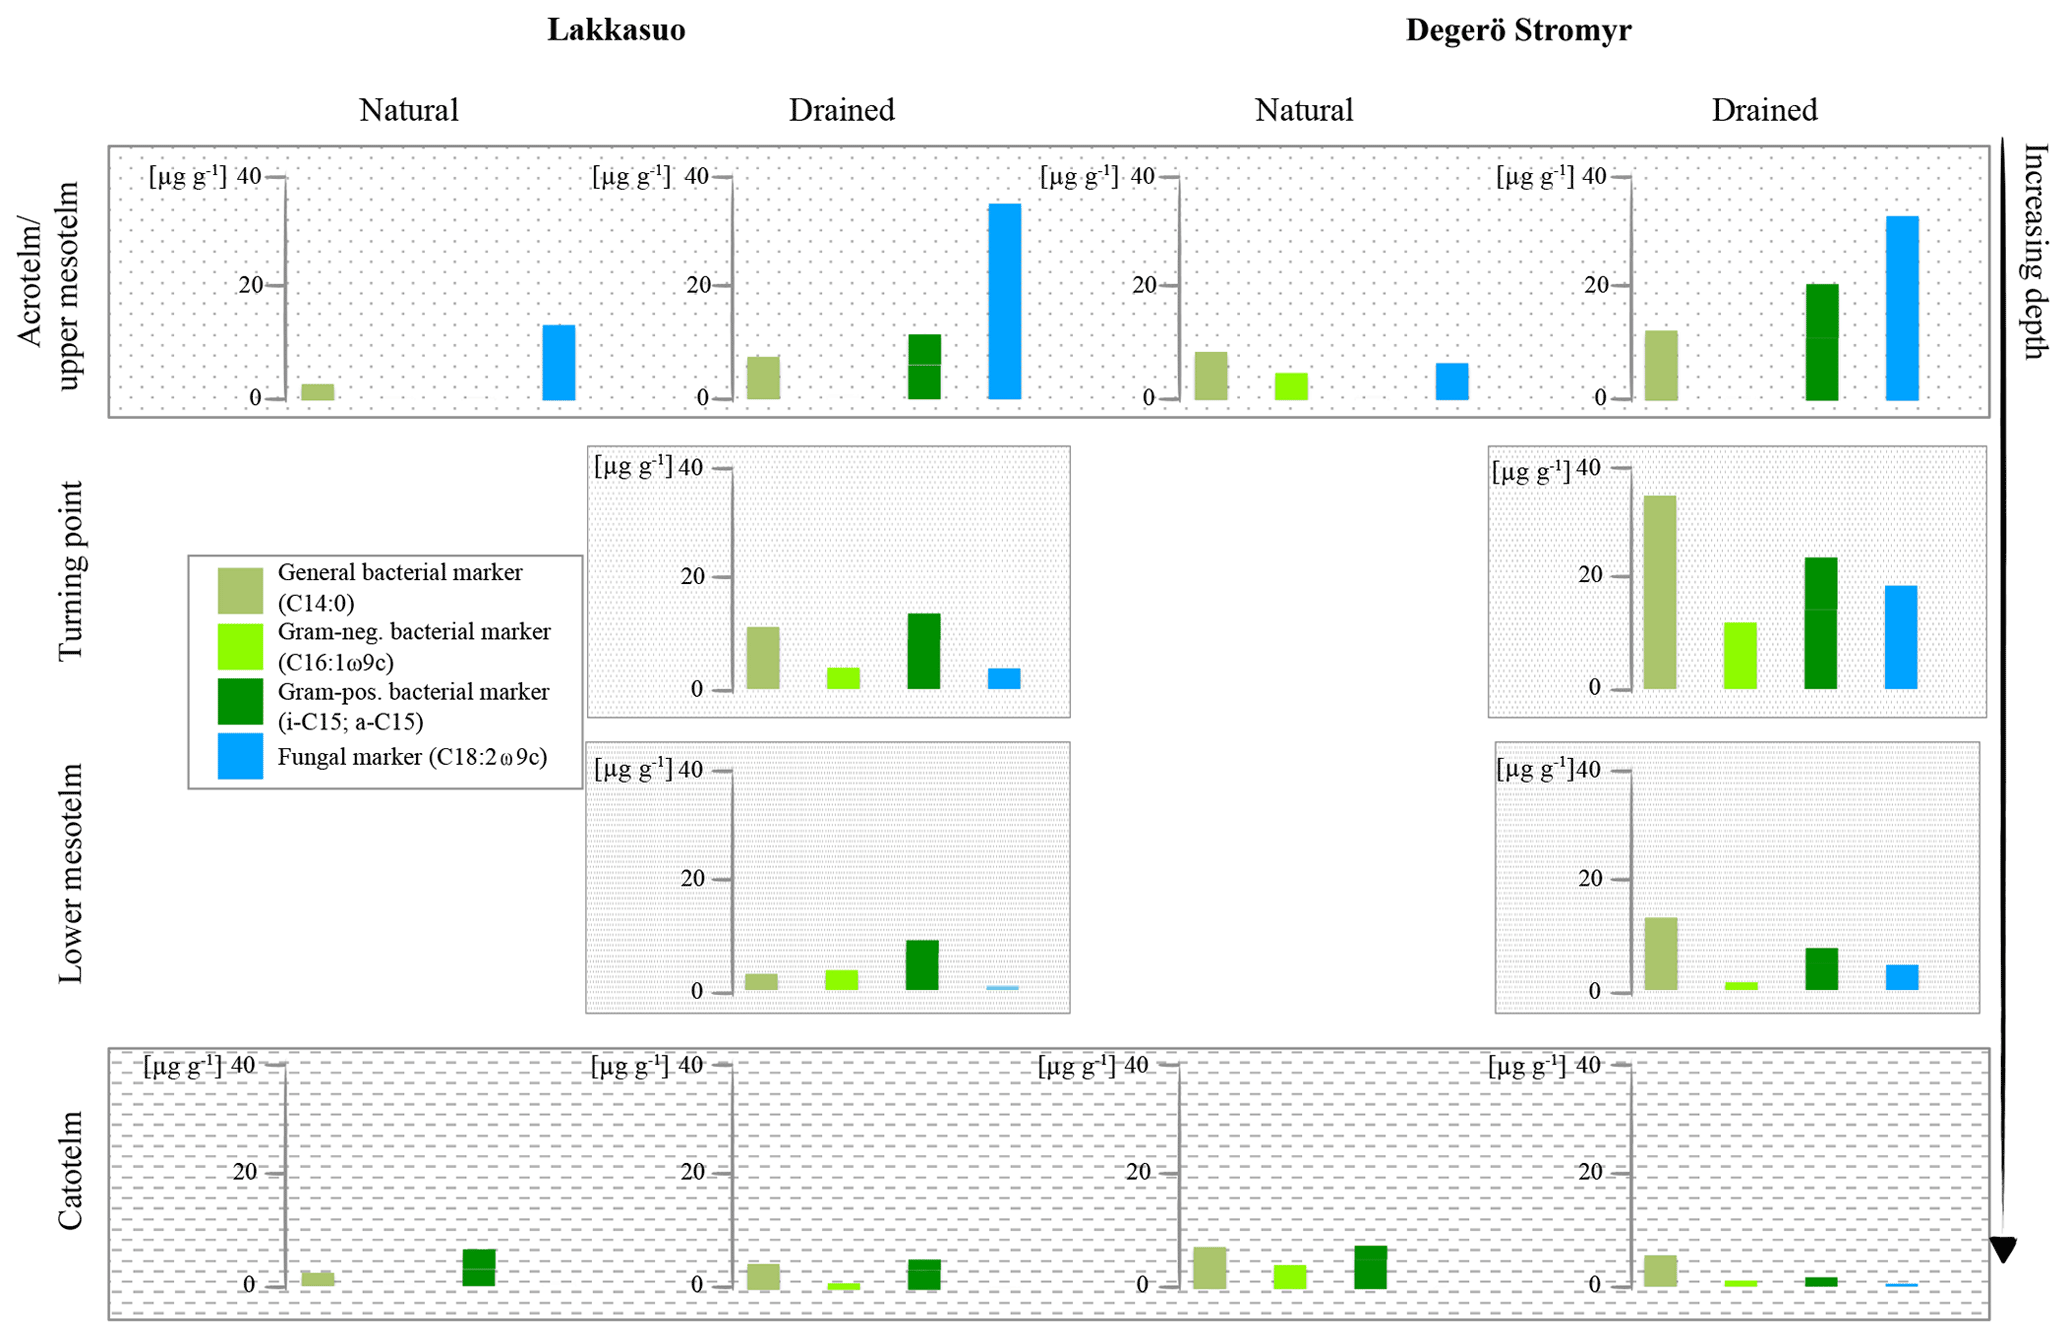
Figure 4Fatty acid concentrations of bacterial and fungal markers in natural and drained wetlands, namely Lakkasuo and Degerö Stormyr, in different horizons.
The latter is congruent with the results of Thormann et al. (1999); fungi will be outcompeted by bacteria with increasing depth and changing hydrological conditions (darker, less oxygen). In the acrotelm of the natural sites, 70 % less microbial-derived FAs, compared to the acrotelm of the drained sites, confirmed the clear link between microbial abundance and the hydrological status. In contrast, we found similar values of microbial FAs in the catotelm for drained and natural sites. This suggests that drainage did not affect the catotelm.
In the drained sites the enhanced microbial-derived FAs, abundance could be caused by the improved conditions for metabolic processes by drainage, i.e., enhanced oxygen abundance and relatively high nutrient availability of the prior conserved plant material (Peltoniemi et al., 2009). In the acrotelm and the upper mesotelm fungal-derived FAs were dominating (77 %). At the δ15N turning point, lower values of fungal markers (23 %) and increased bacterial-derived FAs (67 %) could be found. In the lower mesotelm, the abundance of microbial-derived FAs was generally decreased and 69 % of the detected FAs were bacterial derived (Fig. 3).
3.6 Microbial metabolism mirrored by stable isotope patterns
Our findings suggest that nitrogen stable isotope values are linked to microbial abundance and diversity. We found a clear correlation for stable isotope depth patterns and microbial-derived FAs in all sites (r2=0.4; Fig. 3), with high values of nitrogen stable isotopes being linked to high amounts of microbial-derived FAs.
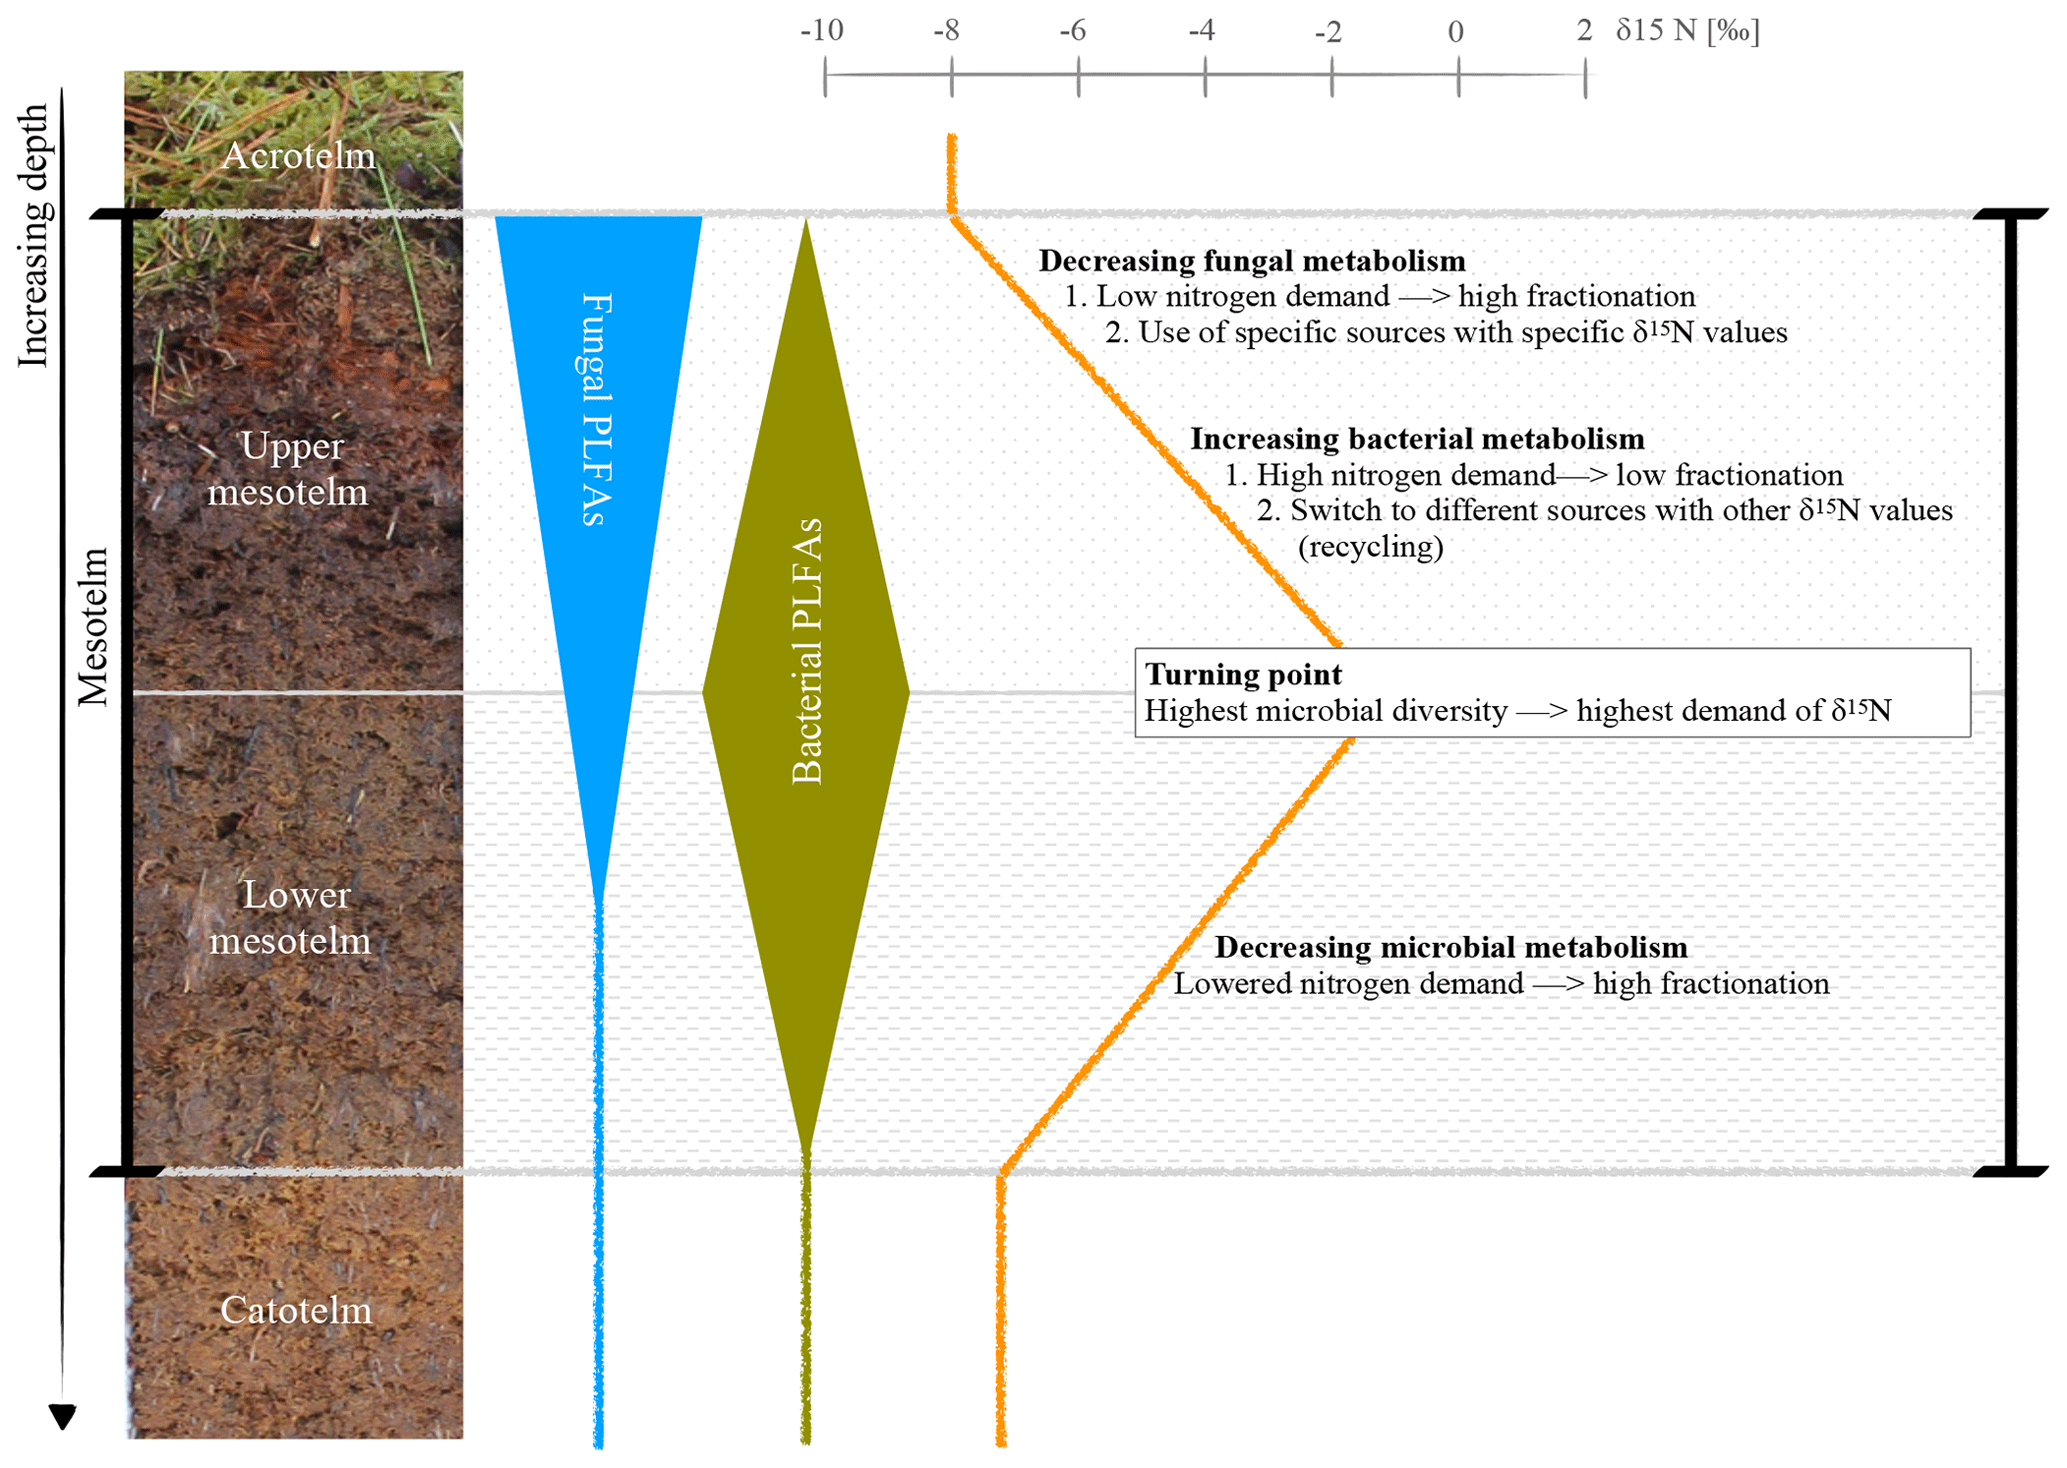
Figure 5Hypothesis of a microbial switch (fungi to bacteria) with depth, reflected by specific FAs, and its influence on the δ15N depth trend; example photo and δ15N values of the ombrotrophic, drained site in Lakkasuo (LDo; note that all isotope values are normalized to zero at the turning point).
Generally, plants are depleted in 15N compared to atmospheric nitrogen (which is, by definition, 0 ‰ because air is used as the nitrogen isotopic standard) due to the general preference of plants for the lighter isotope 14N. As such, the average signal of the relatively undecomposed peat (e.g., the acrotelm of the natural/rewetted sites; the catotelm) is −10 ‰ to −4 ‰. These plant signals are imprinted in the acrotelm (average of −6.09 ‰; Table S5). Furthermore, δ15N values of plants (here mostly Sphagnum mosses) are lower than the values of microbes and bulk material (Aldous, 2002; Lichtfouse et al., 1995). Microbes prefer to mineralize the lighter 14N and plants incorporate (and therefore extract) the microbial mineralized lighter nitrogen (Dijkstra et al., 2006; Novák et al., 1999). Contrary to plants, microbial biomass is enriched in 15N, probably as the result of processing and releasing the lighter 14N during mineralization and hence sequestering the remaining heavier 15N (Roswell, 1976). In addition, as caused by the preferential mineralization of lighter nitrogen, the heavier 15N might be also enriched in the remaining humic substances (Novák et al., 1999). The effect of the latter on δ15N bulk values is probably also enhanced due to the loss of 15N-depleted material during leaching (Damman, 1988; Niemen, 1998), denitrification and the release of gaseous nitrogen (Kohzu et al., 2003; Niemen, 1998). Our values confirm these reported patterns, with highest δ15N values in the mesotelm (average of −3.63 ‰; Table S5) and the correspondence of high microbial activity (reflected by the highest values of microbial-derived FAs) to the δ15N turning point (Figs. 4–5). In acid bogs under aerobic conditions, fungi will dominate the general metabolism in upper peat soils (Thormann et al., 2003). This is pictured by the highest amount of fungal-derived FAs in the acrotelm and the upper mesotelm (Fig. 4). Fungi are the preferred decomposers of primary plant material (Wallander et al., 2009; Thormann et al., 2004); hence, the depleted plant isotopic signal is relatively preserved in the upper most aerobic horizons. Furthermore, fungi have a relatively low nitrogen demand compared to bacteria (Myers et al., 2012). With increasing depth and increasing oxygen limitation, fungal metabolism decreases (Thormann, 2011). In parallel, the amount of bacterial-derived FAs increases (Fig. 4) as Lin et al. (2014), Hu et al. (2011) and Bauersachs et al. (2009) also reported. They found evidence for bacterial-dominated decomposition in hypoxic conditions. This is in line with the findings of Kohl et al. (2015) and Schmidt and Bölter (2002), who also reported a switch from fungal to bacterial dominance in the mesotelm. Andersen et al. (2013), Wallander et al. (2009), Winsborough and Basiliko (2010) and Myers et al. (2012) also stated that fungal biomass is decreasing in peatland soils with depth. In addition, bacterial metabolism is generally faster than fungal metabolism and needs higher amounts of nitrogen (Brunner et al., 2013). We assume that bacteria and fungi compete most over decomposable substrates (not only nitrogen) at the δ15N turning point, resulting in the highest turnover rates with an enrichment of δ15N in the remaining peat, similar to reports from mineral soils with aerobic decomposition (Alewell et al., 2011; Nadelhofer et al., 1996). As such, we assume that besides the highest microbial activity, the diversity of microbial metabolism also peaks at the δ15N turning point (Fig. 5). This would also be related to the highest δ15N values because (1) different microbial communities prefer different sources (Dijkstra et al., 2006; Drollinger et al., 2019) and (2) with increasing bacterial abundance, fungi have to also use recalcitrant (isotopically lighter) sources because bacterial metabolism will outcompete fungi for the easily degradable substances (Rousk and Bååth, 2007; Winsborough and Basiliko, 2010). Hence, with increasing microbial diversity, the diversity of the mineralized organic fractions also increases (Thormann, 2006).
To summarize, with an increased diversity of utilized nitrogen sources, more release of lighter 14N is possible and the δ15N values in the remaining substrate should increase (Dijkstra et al., 2008; Figs. 3–4). However, because of the faster and more complete decomposition with increasing microbial activity (Damman, 1988), metabolism of 15N increases as well and fractionation will be less (Lerch et al., 2011). These contrasting patterns must lead to only small increases in the δ15N values of the bulk material, because if all nitrogen is used, fractionation will be lower at the δ15N turning point.
In the lower mesotelm, oxygen limitation increases, leading to a general decrease in microbial metabolism and related concentrations of microbial-derived FAs (Fig. 4). The decreasing microbial metabolism leads to simultaneously decreasing δ15N values because an increasing amount of intact vegetation (with low δ15N values) will be conserved (Figs. 4–5).
Finally, with the establishment of permanently waterlogged anaerobic conditions in the catotelm (also indicated by the δ13C turning point), FA concentration decreases sharply to near-zero values. Here, decomposition processes are largely inhibited, which leads to stable δ15N and δ13C values, close to the original vegetation signals (Alewell et al., 2011; Krüger et al., 2015; Figs. 1 and 4).
Our results confirmed that the nitrogen isotopic depth trends of peatlands are suitable indicators of the natural, drained or rewetted hydrological status. We validated our isotopic hypothesis with microscope analysis of the vegetation remains in the cores and the investigation of tree rings as indicators for changed hydrological status in the past. An analysis of gram-positive and gram-negative bacterial-derived FAs versus fungal-derived FAs underpinned our hypothesis with the expected changes in microbial abundance with depth. The aerobic acrotelm was characterized by a high fungal abundance with low nitrogen demand and turnover. The upper mesotelm was the transition to a mixture of decreasing fungal and increasing bacterial abundance, competing for organic substrates, and resulting in an enrichment of δ15N values. In the lower mesotelm microbial decomposition generally decreased but was dominated by bacterial abundance, and finally, microbial metabolism was strongly impeded and δ15N values were stabilized in the anaerobic catotelm.
Carbon isotope compositions were also changed with drainage, but they are neither a suitable indicator for a switch in microbial abundance within the drained horizon nor for the trend induced by the rewetting of the peatland. In summary, δ15N depth profiles in peat might give more insights into a switch of microbial metabolism because they reflect more precisely different microbial abundance than carbon isotope compositions. Therefore, we conclude that δ15N depth profiles could act as a reliable and efficient tool to obtain fast and easy information about the hydrological status, restoration success and drainage history.
All used data are available in the Supplement.
The supplement related to this article is available online at: https://doi.org/10.5194/soil-6-299-2020-supplement.
MGS conducted the sampling, measurements, evaluation and analysis of the data and cowrote the paper with CA. JPK did the sampling and measuring, and AB assisted with the measurements and helped with the analytics. KK added to the discussion. PvS provided the peat microscopy and vegetation analysis. JL and CA had the project idea, supervised and added to the discussion.
The authors declare that they have no conflict of interest.
We are very thankful to the editor and the reviewers for their valuable suggestions and comments which improved this paper.
This research has been supported by the Swiss National Science Foundation (SNF; grant no. 169556).
This paper was edited by Jeanette Whitaker and reviewed by Lukas Kohl and one anonymous referee.
Adams, M. A. and Grierson, P. F.: Stable Isotopes at Natural Abundance in Terrestrial Plant Ecology and Ecophysiology: An Update, Plant Biol., 3, 299–310, https://doi.org/10.1055/s-2001-16454, 2001.
Aldous, A. R.: Nitrogen retention by Sphagnum mosses: responses to atmospheric nitrogen deposition and drought, Can. J. Bot., 80, 721–731, https://doi.org/10.1139/b02-054, 2002.
Alewell, C., Giesler, R., Klaminder, J., Leifeld, J., and Rollog, M.: Stable carbon isotopes as indicators for environmental change in palsa peats, Biogeosciences, 8, 1769–1778, https://doi.org/10.5194/bg-8-1769-2011, 2011.
Alexandersson, H., Karlström, C., and Larsson-Mccan, S.: Temperature and precipitation in Sweden 1961–1990, Reference normals, Swedish Meteorological and Hydrological Institute (SMHI), Meterologi, Norrköping, Sweden, 81, 1991.
Andersen, R., Francez, A.-J., and Rochefort, L.: The physicochemical and microbiological status of a restored bog in Québec: Identification of relevant criteria to monitor success, Soil Biol. Biochem., 38, 1375–1387, https://doi.org/10.1016/j.soilbio.2005.10.012, 2006.
Andersen, R., Grasset, L., Thormann, M., Rochefort, L., and Francez, A.-J.: Changes in microbial community structure and function following Sphagnum peatland restoration, Soil Biol. Biochem., 42, 291–301, https://doi.org/10.1016/j.soilbio.2009.11.006, 2010.
Andersen, R., Wells, C., Macrea, M., and Price, J.: Nutrient mineralisation and microbial functional diversity in a restored bog approach natural conditions 10 years post restoration, Soil Biol. Biochem., 64, 37–47, https://doi.org/10.1016/j.soilbio.2013.04.004, 2013.
Armbruster, M., Abiy, M., and Feger, K-H.: The biogeochemistry of two forested catchments in the Black Forest and the eastern Ore Mountains, Biogeochemistry, 65, 341–368, https://doi.org/10.1023/A:1026250209699, 2003.
Artz, R. R. E.: Microbial Community Structure and Carbon Substrate use in Northern Peatlands, in: Carbon Cycling in Northern Peatlands, edited by: Baird, A., Belyea, L., Comas, X., Reeve, A. S., and Slater, L. D., American Geophysical Union, Washington DC, USA, 111–129, https://doi.org/10.1029/2008GM000806, 2009.
Asada, T., Warner, B. G., and Aravena, R.: Nitrogen isotope signature variability in plant species from open peatland, Aquat. Bot., 82, 297–307, https://doi.org/10.1016/j.aquabot.2005.05.005, 2005a.
Asada, T., Warner, B., and Aravena, R.: Effects of the early stage of decomposition on change in carbon and nitrogen isotopes in Sphagnum litter, J. Plant Interact., 1, 229–237. https://doi.org/10.1080/17429140601056766, 2005b.
Bajerski, F., Wagner, D., and Mangelsdorf, K.: Cell Membrane Fatty Acid Composition of Chryseobacterium frigidisoli PB4T. Isolated from Antarctic Glacier Forefield Soils, in Response to Changing Temperature and pH Conditions, Front. Microbiol., 8, 1–11, https://doi.org/10.3389/fmicb.2017.00677, 2017.
Baldocchi, D. D., Hicks, B. B., and Meyers, T. D.: Measuring biosphere atmosphere exchanges of biologically related gases with micrometeorological methods, Ecology, 69, 1331–1340, 1988.
Bauersachs, T., Schouten, S., Compaoré, Wollenzoen, U., Stal, L., and Sinninghe Damsté, J.: Nitrogen isotopic fractionation associated with growth on dinitrogen gas and nitrate by cyanobacteria, Limnol. Oceanogr., 54, 1403–1411, https://doi.org/10.4319/lo.2009.54.4.1403, 2009.
Baumann, K., Dignac, M.-F., Rumpel, C., Bardoux, G., Sarr, A., Steffens, M., and Maron, P.-A.: Soil microbial diversity affects soil organic matter decomposition in a silty grassland soil, Biogeochemistry, 114, 201–212, https://doi.org/10.1007/s10533-012-9800-6, 2013.
Biester, H., Knorr, K.-H., Schellekens, J., Basler, A., and Hermanns, Y.-M.: Comparison of different methods to determine the degree of peat decomposition in peat bogs, Biogeosciences, 11, 2691–2707, https://doi.org/10.5194/bg-11-2691-2014, 2014.
Brunner, B., Contreras, S., Lehman, M., Matantseva, Rollog, M., Kalvelage, T., Klockgether, G., Gaute, L., Jetten, M., Kartal, B., and Kuypers, M.: Nitrogen isotope effects induced by anammox bacteria, P. Natl. Acad. Sci. USA, 110, 18994–18999, https://doi.org/10.1073/pnas.1310488110, 2013.
Bubier, J., Crill, P., Mosedale, A., Frolking, S., and Linder, E.: Peatland responses to varying interannual moisture conditions as measured by automatic CO2 chambers, Global Biogeochem. Cy., 17, 35-1–35-15, https://doi.org/10.1029/2002GB001946, 2003.
Clymo, R. and Bryant, C.: Diffusion and mass of dissolved carbon dioxide, methane and dissolved organic carbon in a 7-m deep raised peat bog, Geochim. Cosmochim. Ac., 72, 2048–2066, https://doi.org/10.1016/j.gca.2008.01.032, 2008.
Clymo, R. S.: The Growth of Sphagnum: Methods of Measurement, J. Ecol., 58, 13–49, 1970.
Damman, A. W. H.: Regulation of nitrogen removal and retention in Sphagnum nogs and other peatlands, OIKOS, 51, 291–305, 1988.
Dijkstra, P., Ishizu, A., Doucett, R., Hart, S., Schwartz, E., Manyailo, O., and Hungate, B.: 13C and 15N natural abundance of the soil microbial biomass, Soil Biol. Biochem., 38, 3257–3266, https://doi.org/10.1016/j.soilbio.2006.04.005, 2006.
Dijkstra, P., LaViolette, C. M., Coyle, J. S., Doucett, R. R., Schwartz, E., Hart, S. C., and Hungate, B. A.: 15N enrichment as an integrator of the effects of C and N on microbial metabolism and ecosystem function, Ecol. Lett., 11, 389–397, https://doi.org/10.1111/j.1461-0248.2008.01154.x, 2008.
Drollinger, S., Kuzyakov, Y., and Glatzel, S.: Effects of peat decomposition on δ13C and δ15N depth profiles of Alpine bogs, Catena, 178, 1–10, https://doi.org/10.1016/j.catena.2019.02.027, 2019.
DWD (Deutscher Wetter Dienst): Wetter und Klima vor Ort, available at: https://www.dwd.de/DE/wetter/wetterundklima_vorort/baden-wuerttemberg/feldberg/_node.html, last access: 18 September 2018.
Elvert, M., Boetius, A., Knittel, K., and Jørgensen, B.: Characterization of Specific Membrane Fatty Acids as Chemotaxonomic Markers for Sulfate-Reducing Bacterial Involved in Anaerobic Oxidation of Methane, Geomicrobiol. J., 20, 403–419, https://doi.org/10.1080/01490450303894, 2003.
Eurola S., Hicks S. T., and Kaakinen E.: Key to Finnish mire types, in: European Mires, edited by: Moore, P. D., Academic Press, London, Great Britain, 1–117, 1984.
Fenton, J. H. C.: The Rate of Peat Accumulation in Antarctic Moss Banks, J. Ecol., 68, 211–228, 1980.
Finotti, E., Moretto, D., Marsella, R., and Mercantini, R.: Temperature effects and fatty acid patterns in Geomyces species isolated from Antarctic soil, Polar Biol., 13, 127–130, https://doi.org/10.1007/BF00238545, 1993.
Hobbie, E. and Högberg, P.: Nitrogen isotopes link mycorrhizal fungi and plants to nitrogen dynamics, New Phytol., 196, 367–382, https://doi.org/10.1111/j.1469-8137.2012.04300.x, 2012.
Hobbie, E. A., Chen, J., Hanson, P. J., Iversen, C. M., McFarlane, K. J., Thorp, N. R., and Hofmockel, K. S.: Long-term carbon and nitrogen dynamics at SPRUCE revealed through stable isotopes in peat profiles, Biogeosciences, 14, 2481–2494, https://doi.org/10.5194/bg-14-2481-2017, 2017.
Högberg, P.: 15N natural abundance in soil-plant systems, New Phytol., 137, 179–203, https://doi.org/10.1046/j.1469-8137.1997.00808.x, 1997.
Högberg, P., Högbom, L., Schinkel, H., Högberg, M., Johannisson, C., and Wallmark, H.: 15N abundance of surface soils, roots and mycorrhizas in profiles of European forest soils, Oecologia, 108, 207–214, https://doi.org/10.1007/BF00334643, 1996.
Hu, B.-I., Rush, D., Van der Biezen, E., Zheng, P., Van Mullekom, M., Schouten, S., J., Sinninghe Damasté, A. Smolders, Jetten, M., and Kartal, B.: New Anaerobe, Ammonium-Oxidizing Community Enriched from Peat Soil, Appl. Environ. Microbiol., 77, 966–971, https://doi.org/10.1128/AEM.02402-10, 2011.
IUSS Working Group WRB: World Reference Base for Soil Resources 2014, Update 2015, World Soil Resources Reports 106, FAO, Rome, Italy, 2015.
Joosten, H. and Couwenberg, J.: Das Beispiel Europa, in: Landschaftsökologische Moorkunde, edited by: Succow, M. and Joosten, H., Schweizerbart, Stuttgart, Germany, 406–408, 2001.
Kohl, L., Laganierè, J., Edwards, K., Billings, S., Morril, P., Van Biesen, G., and Ziegler, S.: Distinct fungal and bacterial δ13C signatures as potential drivers of increasing δ13C od soil organic matter with depth, Biogeochemistry, 124, 13–26, https://doi.org/10.1007/s10533-015-0107-2, 2015.
Kohzu, A., Matsui, K., Yamada, T., Sugimoto, A., and Fujita, N.: Significance of rooting depth in mire plants: Evidence from natural 15N abundance, Ecol. Res., 18, 257–266, https://doi.org/10.1046/j.1440-1703.2003.00552.x, 2003.
Krüger, J. P., Leifeld, J., and Alewell, C.: Degradation changes stable carbon isotope depth profiles in palsa peatlands, Biogeosciences, 11, 3369–3380, https://doi.org/10.5194/bg-11-3369-2014, 2014.
Krüger, J. P., Leifeld, J., Glatzel, S., Szidat, S., and Alewell, C.: Biogeochemical indicators of peatland degradation – a case study of a temperate bog in northern Germany, Biogeosciences, 12, 2861–2871, https://doi.org/10.5194/bg-12-2861-2015, 2015.
Krüger, J. P., Alewell, C., Minkkinen, K., Szidat, S., and Leifeld, J.: Calculating carbon changes in peat soils drained for forestry with four different profile-based methods, Forest Ecol. Manag., 381, 29–36, https://doi.org/10.1016/j.foreco.2016.09.006, 2016.
Krüger, J. P., Conen, F., Leifeld, J., and Alewell, C.: Palsa Uplift Identified by Stable Isotope Depth Profiles and Relation of δ15N to C∕N Ratio, Permafrost Periglac., 28, 485–492, https://doi.org/10.1002/ppp.1936, 2017.
Kuhry, P. and Vitt, D. H.: Fossil carbon ∕ nitrogen ratios as a measure of peat decomposition, Ecology, 77, 271–275, 1996.
Laine, J., Komulainen, V., Laiho, R., Minkkinen, K., Rasinmäki, A., Sallantus, T., Sarkkola, S., Silvan, N., Tolonen, K., and Tuittila, E, Vasander, H., and Pälvänen, J. (Eds.): Lakkasuo: A Guide to a Mire Ecosystem, Department of Forest Ecology, University of Helsinki, Helsinki, 2004.
Leifeld, J. and Menichetti, L.: The underappreciated potential of peatlands in global climate change mitigation strategies, Nat. Commun., 9, 1071, https://doi.org/10.1038/s41467-018-03406-6, 2018.
Lerch, T. Z., Nunan, N, Dignac, M.-F., Chenu, C., and Mariotti, A.: Variations in microbial isotopic fractionation during soil organic matter decomposition, Biogeochemistry, 106, 5–21, https://doi.org/10.1007/s10533-010-9432-7, 2011.
Lichtfouse, E., Berthier, G., and Houot, S.: Stable carbon isotope evidence for the microbial origin of C14–C18 n-alkanoic acids in soils, Org. Geochem., 23, 849–852, https://doi.org/10.1016/0146-6380(95)80006-D, 1995.
Lin X., Tfaily, M., Green, S., Steinweg, J., Chanton, P., Imvittaya, A., Chanton, J., Cooper, W., Schadt, C., and Kostka, J.: Microbial Metabolic Potential for Carbon Degradation and Nutrient (Nitrogen and Phosphorus) Acquisition in an Ombrotrophic Peatland, Appl. Environ. Microbiol., 80, 3531–3540, https://doi.org/10.1128/AEM.00206-14, 2014.
Malmer, N. and Holm, E.: Variation in the C∕N-quotient of peat in relation to decomposition rate and age determination with 210Pb, Oikos, 43, 171–182, 1984.
Minkkinen, K., Vasander, H., Jauhiainen, S., Karsisto, M., and Laine, J.: Post drainage changes in vegetation composition and carbon balance in Lakkasuo mire, Central Finland, Plant Soil, 207, https://doi.org/10.1023/A:1004466330076, 107–120, 1999.
Moore, T. and Basiliko, N.: Decomposition in Boreal Peatlands, in: Boreal Peatland Ecosystems, edited by: Wieder, R. K. and Vitt, D. H., Springer, Berlin, Heidelberg, Germany, 125–143, 2006.
Morris, P. J., Waddington, J. M., Benscoter, B. W., and Turetsky, M. R.: Conceptual frameworks in peatland ecohydrology: looking beyond the two layered (acrotelm–catotelm) model, Ecohydrology, 4, 1–11, https://doi.org/10.1002/eco.191, 2011.
Myers, B., Webster, K., Mclaughlin, J., and Basiliko, N.: Microbial activity across a boreal peatland nutrient gradient: the role of fungi and bacteria, Wetl. Ecol. Manag., 20, 77–88, https://doi.org/10.1007/s11273-011-9242-2, 2012.
Nadelhoffer, K., Shaver, G., Frey, B., Giblin, A., Johnson, L., and MacKane, R.: 15N natural abundance and N use by tundra plants, Oecologica, 107, 386–394, https://doi.org/10.1007/BF00328456, 1996.
Niemen, M.: Changes in nitrogen cycling following the clearcutting of drained peatland forests in southern Finland, Boreal Environ. Res., 31, 9–21, 1998.
Nilsson, M., Sagerfors, J., Buffam, I., Laudon, H., Eriksson, T., Grelle, A., and Lindroth, A.: Contemporary carbon accumulation in a boreal oligotrophic minerogenic mire – A significant sink after accounting for all C-fluxes, Glob. Change Biol., 14, https://doi.org/10.1111/j.1365-2486.2008.01654.x, 2008.
Novák, M., Buzek, F., and Adamová, M.: Vertical trends in δ13C, δ15N and δ34S ratios in bulk Sphagnum peat, Soil Biol. Biochem., 31, 1343–1346, https://doi.org/10.1016/S0038-0717(99)00040-1, 1999.
Novák, M., Brizova, E., Adamova, M., Erbanova, L., and Bottrell, S. H.: Accumulation of organic carbon over the past 150 years in five freshwater peatlands in western and central Europe, Sci. Total Environ., 390, 425–436, https://doi.org/10.1016/j.scitotenv.2007.10.011, 2008.
O'Leary, W. M. and Wilkinson, S.: Gram-positive bacteria, in: Microbial Lipids, edited by: Ratledge, C. and Wilkinson, S. G. Academic Press, London, Great Britain, 117–185, 1988.
Peel, M. C., Finlayson, B. L., and McMahon, T. A.: Updated world map of the Köppen-Geiger climate classification, Hydrol. Earth Syst. Sci., 11, 1633–1644, https://doi.org/10.5194/hess-11-1633-2007, 2007.
Peltoniemi, K., Fritze, H., and Laiho, R.: Response of fungal and actinobacterial communities to water-level drawdown in boreal peatland sites, Soil Biol. Biochem., 41, 1902–1914, https://doi.org/10.1016/j.soilbio.2009.06.018, 2009.
Piotrowska-Seget, Z. and Mrozik, A.: Signature Lipid Biomarker (SLB) Analysis in Determining Changes in Communitiy Structure of Soil Microorganisms, Pol. J. Environ. Stud., 12, 669–675, 2003.
Reiffarth, D., Petticrew, E., Owens, P., and Lobb, D.: Sources of variability in fatty acids (FA) biomarkers in the application and compound-specific stable isotopes (CSSIs) to soil and sediment fingerprinting and tracing: A review, Sci. Total Environ., 565, 8–27, https://doi.org/10.1016/j.scitotenv.2016.04.137, 2016.
Robinson, D., Handley, L., and Scrimgeour, C.: A theory for 15N∕14N fractionation in nitrate-grown vascular plants, Planta, 205, 397–406, https://doi.org/10.1007/s004250050336, 1998.
Roswell, T.: The internal nitrogen cycle between microorganisms, vegetation and soil, in: Nitrogen, Phosphorous and Sulphur – Global Cycles, edited by: Svensson, B. H. and Söderlund, R., Ecology Bulleting, Stockholm, Sweden, 157–167, 1976.
Rousk, J. and Bååth, E.: Fungal biomass production and turnover in soil estimated using the acetate-in-ergosterol technique, Soil Biol. Biochem., 39, 2173–2177, https://doi.org/10.1016/j.soilbio.2007.03.023, 2007
Schmidt, N. and Bölter, M.: Fungal and bacterial biomass in tundra soils along an arctic transect from Taimyr Peninsula, central Siberia, Polar Biol., 25, 871–877, https://doi.org/10.1007/s00300-002-0422-7, 2002.
Silc, T. and Stanek, W.: Bulk density estimation of several peats in northern Ontario using the von Post humification scale, Can. J. Soil Sci., 57, 75, https://doi.org/10.4141/cjss77-010, 1977.
Stoffel, M., Bollschweiler, M., Butler, D. R., and Luckman, B. H. (Eds): Tree Rings and Natural Hazards – A State-of-the-Art, Advances in Global Change Research, Bern, Switzerland, 2010.
Sundh, I., Nilsson, M., and Borgå, P.: Variation in Microbial Community Structure in Two Boreal Peatlands as Determined by Analysis of Phospholipid Fatty Acid Profiles, Appl. Environ. Microbiol., 64, 1476–1482, 1997.
Tfaily, M., Cooper, W., Kostka, J., Chanton, P., Schadt, C., Hanson, P., Iversen, C., and Chanton, J.: Organic matter transformation in the peat column at Marcell Experimental Forest: Humification and vertical stratification, J. Geophys. Res.-Biogeo., 119, 661–675, https://doi.org/10.1002/2013JG002492, 2014.
Thormann, M.: Diversity and function of fungi in peatlands: A carbon cycling perspective, Can. J. Soil Sci., 86, 281–293, https://doi.org/10.4141/S05-082, 2006.
Thormann, M.: In vitro decomposition of Sphagnum-derived acrotelm and mesotelm peat by indigenous and alien basidiomycetous, Mires Peat, 8, 1–12, 2011.
Thormann, M., Currah, R., and Bayley, S.: The mycorrhizal status of the dominant vegetation along a peatland gradient in southern boreal Alberta, Canada, Wetlands, 19, 438–450, https://doi.org/10.1007/BF03161775, 1999.
Thormann, M., Currah, R., and Bayley, S.: Succession of mircofungal assemblages in decomposing peatland plants, Plant Soil, 250, 323–333, https://doi.org/10.1023/A:1022845604385, 2003.
Thormann, M., Currah, R., and Bayley, S.: Patterns of distribution of microfungi in decomposing bog and fen plants, Can. J. Bot., 82, 710–720, https://doi.org/10.1139/b04-025, 2004.
Tunlid, A. and White, D. C.: Biochemical analysis of biomass, community structure, nutritional status, and metabolic activity of microbial communities, in: Soil Biochemistry, edited by: Stotzky, G. and Bollag, J.-M., Marcel Dekker Inc., New York, USA, 229–262, 1992.
Vestal, J. R. and White, D. C.: Lipid analysis in microbial ecology, BioScience, 39, 535–541, https://doi.org/10.2307/1310976, 1989.
Vitt, D. H.: Functional characteristics and indicators of boreal peatlands, in: Boreal Peatland Ecosystems, edited by: Wieder, R. K. and Vitt, D., Springer, Berlin, Heidelberg, 9–24, 2006.
Wallander, H., Mörth, C., and Giesler, R.: Increasing abundance of soil fungi is driver for 15N enrichment in soil profiles along a chronosequence undergoing isostatic rebound in northern Sweden, Oecologica, 160, 87–96, https://doi.org/10.1007/s00442-008-1270-0, 2009.
Willers, C., Jansen van Rensburg, P. J., and Claassens, S.: Phospholipid fatty acid profiling of microbial communities – a review of interpretations and recent applications, Appl. Microbiol., 119, 1207–1218, https://doi.org/10.1111/jam.12902, 2015.
Winsborough, C. and Basiliko, N.: Fungal and Bacterial Activity in Nothern Peatlands, Geochem. J., 27, 315–320, https://doi.org/10.1080/01490450903424432, 2010.
Zedler, J. B. and Kercher, S.: Wetland Resources: Status, Trends, Ecosystem Services, and Restorability, Annu. Rev. Environ. Res., 30, 39–74, https://doi.org/10.1146/annurev.energy.30.050504.144248, 2005.
Zelles, L.: Phospholipid fatty acid profiles in selected members of soil microbial communities, Chemosphere, 35, 275–294, https://doi.org/10.1016/S0045-6535(97)00155-0, 1997.