the Creative Commons Attribution 4.0 License.
the Creative Commons Attribution 4.0 License.
 | 18 May 2026
Mineral-bound organic carbon exposed by hillslope thermokarst terrain: case study in Cape Bounty, Canadian High Arctic
Julien Fouché
Hugues Titeux
Charlotte Morelle
Nathan Bemelmans
Melissa J. Lafrenière
Joanne K. Heslop
Sophie Opfergelt
Arctic landscapes could add 55–230 Pg of carbon (in CO2 equivalent) to the atmosphere, through CO2 and CH4 emissions, by the end of this century. These estimates could be quantified more accurately by constraining the contribution of rapid thawing processes such as thermokarst landscapes to permafrost carbon loss, and by investigating the exposed organic carbon (OC) interacting with mineral surfaces or metallic cations, i.e., the nature of these interactions and what controls their relative abundance. Here, we investigate two contrasted types of hillslope thermokarst landscapes: an Active Layer Detachment (ALD) which is a one-time event, and a Retrogressive Thaw Slump (RTS) which repeats annually during summer months in the Cape Bounty Arctic Watershed Observatory (Melville Island, Canada). We analyzed mineralogy, total and soluble element concentrations, total OC and mineral–OC interactions within the headwalls of both disturbances, and within corresponding undisturbed profiles. Our results show that small fragments of biopolymers stabilized by chemical bonds account for 13 ± 5 % of total OC in the form of organo–metallic complexes and up to 6 ± 2 % associated with poorly crystalline iron oxides. If we add the mechanisms of physical protection of particulate organic matter in aggregates and larger molecules stabilized by chemical bonds, we reach 64 ± 10 % of the total OC being stabilized. Importantly, we observe a decrease in the proportion of mineral-bound OC in the deeper layers exposed by the retrogressive thaw slump: the proportion of organo–metallic complexes drops from ∼ 18 % in surface samples (2–22 cm) to ∼ 1 % in the deepest samples (50–70 cm). These results therefore suggest that the OC exposed by thermokarst disturbances at Cape Bounty is protected by interactions with minerals to a certain extent, but that deep thaw features could expose OC more readily accessible to degradation.
- Article
(9477 KB) - Full-text XML
- BibTeX
- EndNote


In the Arctic, recent studies show that air temperatures are rising 3 to 4 times faster than the global average (AMAP, 2021; Rantanen et al., 2022). This polar amplification exposes permafrost – soil, sediment or rock frozen for at least 2 years – to thawing. The latest IPCC predictions therefore forecast a decrease in near-surface permafrost area of 2 %–66 % for IPCC scenario RCP2.6 and 30 %–99 % for RCP8.5, by 2100 (Fox-Kemper et al., 2021; Meredith et al., 2019). This degradation could induce a permafrost-carbon-climate feedback (e.g., Abbott and Jones, 2015; Koven et al., 2011; McGuire et al., 2018; Schuur et al., 2015), since northern circumpolar permafrost contains ∼ 1000 Pg of carbon in the first three meters, roughly half the soil carbon present in all other terrestrial biomes (Hugelius et al., 2014; Strauss et al., 2021, 2024). It is estimated that CO2 and CH4 emissions from the Arctic could add 55–230 Pg of carbon (in CO2 equivalent) to the atmosphere by the end of this century – a level comparable to emissions of industrialized countries – and must therefore be considered in climate models (Schuur et al., 2022). These assessments are based on simulated volumes of OC that will be exposed by the increase in thickness of the seasonally thawing active layer (i.e., gradual thawing). In order to refine these estimates, rapid thawing processes such as thermokarst, thermo-denudation and thermo-erosion – which could represent an additional release of greenhouse gases – should benefit from further studies (e.g., Natali et al., 2021).
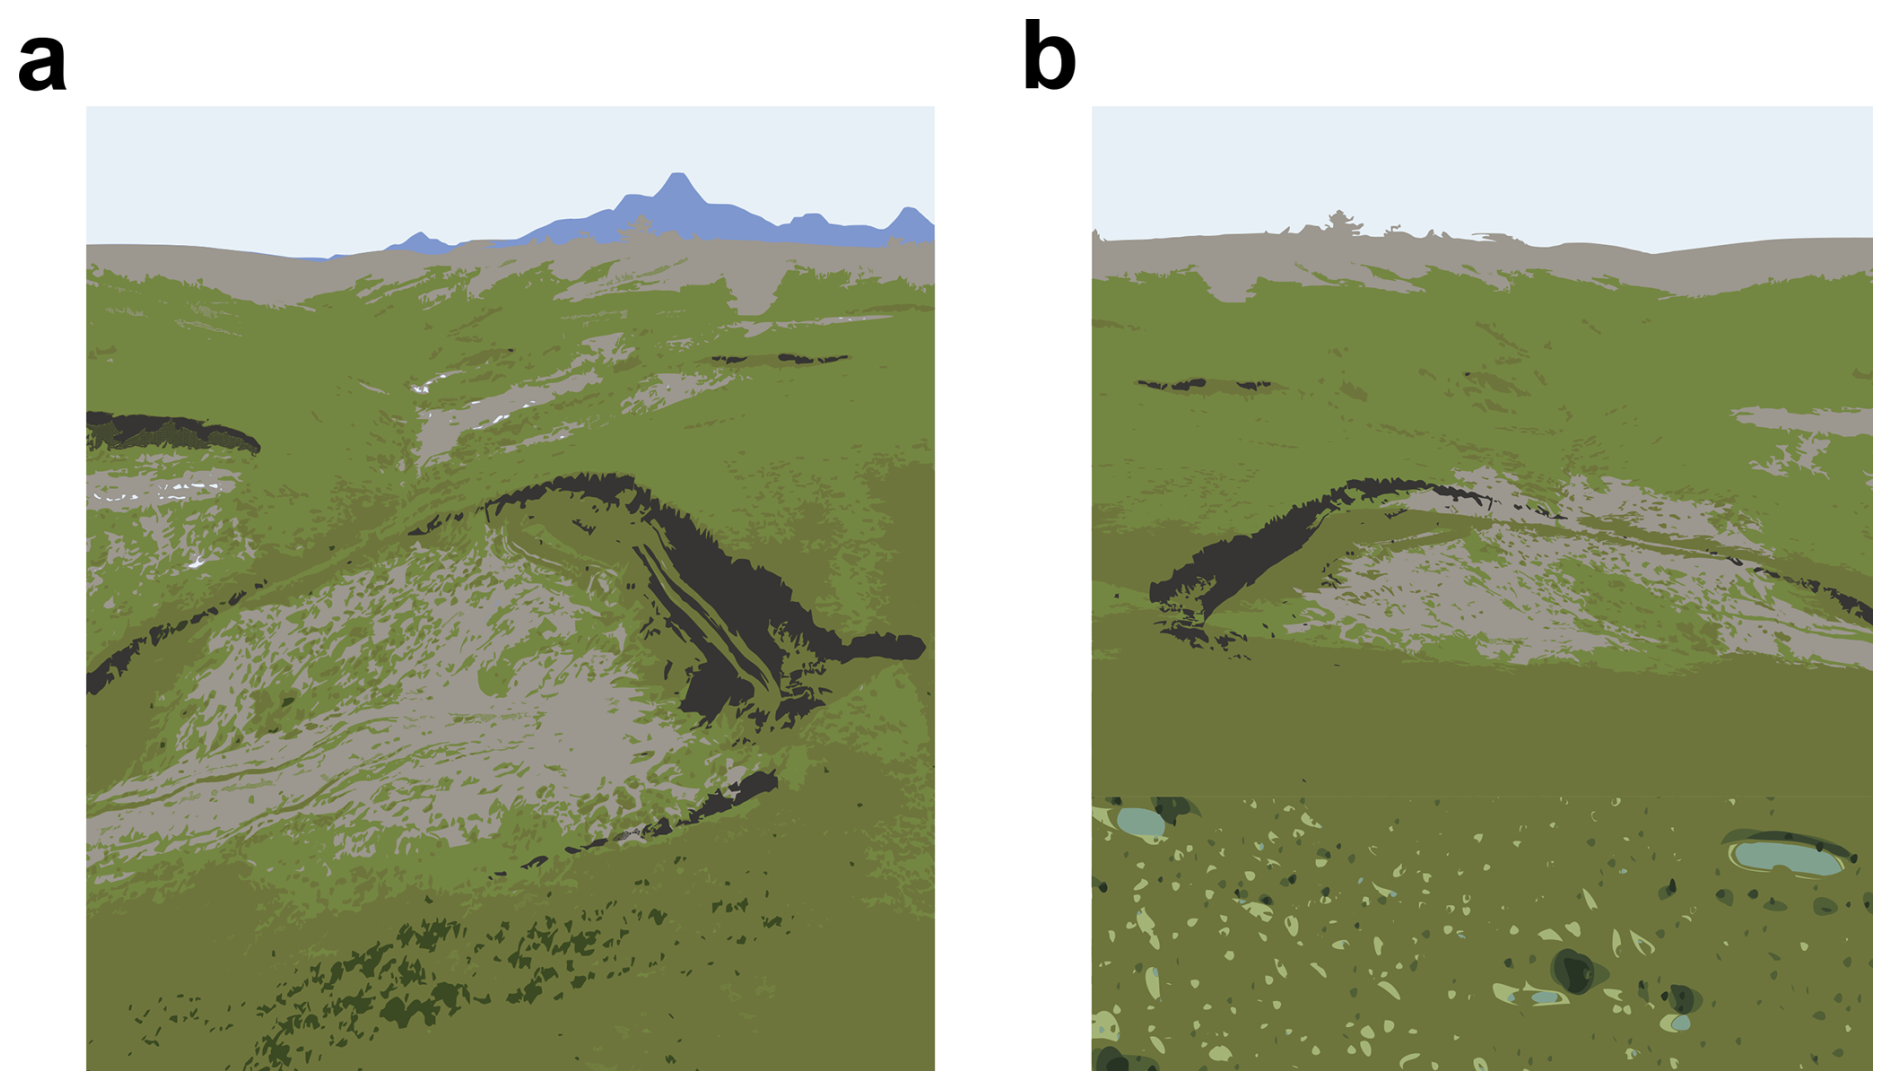
Figure 1Conceptual model of a retrogressive thaw slump (a) and an active layer detachment (b). Panel (a) modified from Thomas et al. (2023).
Thermokarst landforms (e.g., Heginbottom et al., 2012; Kokelj and Jorgenson, 2013) are punctual events, both in space and time, and occur when the ground collapses due to the melting of the excess ice in the soil or sediment. These physical disturbances of permafrost are sometimes referred to as “abrupt thaw”. In particular, hillslope thermokarst landscapes occur where physical degradation leads to slumps (Fig. 1a), active layer detachments (Fig. 1b) and gullies. These events potentially expose deep and ancient materials to thawing, including OC that would never have re-entered the modern carbon cycle if these disturbances had not occurred. The only existing simulations of thermokarst terrain impacts on permafrost carbon balance indicate that these could provide a similar climate feedback as gradual thaw emissions (Turetsky et al., 2020). Active layer detachments (ALD), are landslides in which the active layer slides down onto the permafrost table over tens of meters (e.g., Lamoureux and Lafrenière, 2009). They thus expose a vertical headwall of the height of the active layer at the location where it has detached. This type of event is punctual in time and typically triggered by deep thaw combined with heavy precipitation. Retrogressive thaw slumps (RTS) also consist in the detachment of materials, but generally expose greater depths, where permafrost is part of the exported mass. RTSs expand through the years as frozen deposits thaw and ground ice melts at a headwall. The retreat of the head scarp each summer can reach tens of meters per year (e.g., Brooker et al., 2014; Günther et al., 2015; Kokelj et al., 2021; Kunitsky et al., 2013; Lacelle et al., 2015; Leibman et al., 2021; Séjourné et al., 2015; Vadakkedath et al., 2020; van der Sluijs et al., 2023, 2018). These structures therefore expose and move large volumes of material (Kokelj et al., 2015, 2021; Shakil et al., 2020; van der Sluijs et al., 2018; Tanski et al., 2017), involving previously perennially frozen masses of OC, until they stabilize. The area susceptible to be affected by hillslope thermokarst landforms is indeed projected to increase by 250 000 km2 by the end of the 21st century (Turetsky et al., 2020). The soils and sediments exposed by ALDs and RTSs are generally varied depending on their headwall heights, lithology and historical permafrost thaw dynamics, and contain organic matter of variable composition and interactions with minerals (e.g., Jongejans et al., 2022; Thomas et al., 2024, 2023).
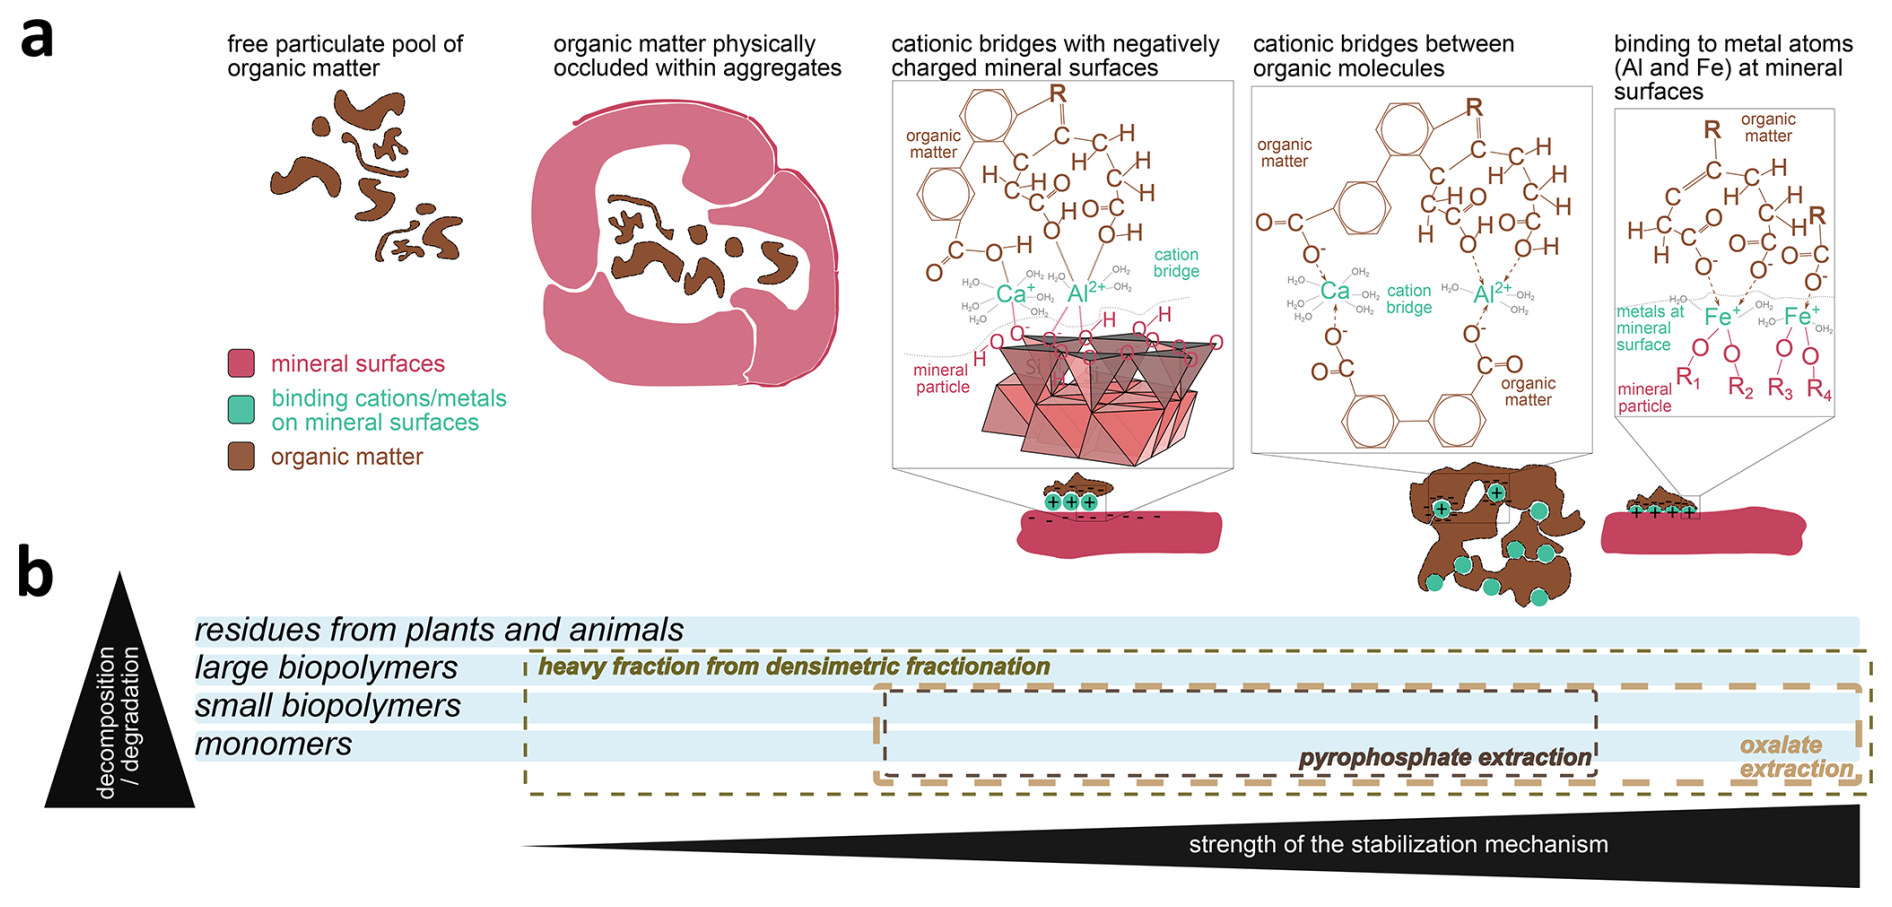
Figure 2Organic carbon (OC) pools with their respective target protocol of extraction and associated stabilization mechanisms; (a) Mechanisms of stabilization of organic matter by mineral surfaces or elements in soils or sediments, i.e. free particulate organic matter; physical protection of organic matter trapped in the aggregates – no chemical link; formation of cation bridges between organic matter and negatively-charged mineral surfaces (such as smectites) – electrostatic interactions; formation of cation bridges between molecules of organic matter of various sizes – electrostatic interactions or coordinate covalent bond; binding of organic matter to metal ions (Al and Fe) contained in mineral surfaces – coordinate covalent bond; (b) Physical and chemical extraction methods and associated target of OC pool.
In soils and sediments, organic matter as a whole can be separated into fractions differing in their interactions with minerals and resistance to decay (i.e., stabilization). The free particulate organic matter, composed of plant fragments non associated with minerals, is considered as prone to microbial degradation (labile) displaying a high turnover (Cotrufo and Lavallee, 2022). The fraction of organic matter interacting with mineral surfaces or metallic cations is considered as stabilized, being protected against microbial processing and therefore more persistent (Lavallee et al., 2020). Although different stabilization mechanisms often act simultaneously, they can be classified into different categories, providing very different levels of stabilization (Fig. 2a): (i) physical protection of OC trapped in the aggregates, with no chemical binding to mineral surfaces. This enables stabilization over a period of 10 to ∼ 100 years and depends on the size of the aggregate (von Lützow et al., 2006); (ii) the formation of cationic bridges between negatively charged clay mineral surfaces (e.g., smectite) and negatively charged organic molecules. These are electrostatic interactions between the organic molecule, the cation and the clay, which allows reversible binding; (iii) the formation of cationic bridges between organic molecules of various sizes. These are organo–metallic complexes, where metals (i.e., , Al3+, or Ca2+) act as polyvalent cations and coordinate to the functional groups of organic acids through electrostatic interactions or coordinate covalent bond (e.g., Boudot et al., 1989; Courchesne and Turmel, 2008; von Lützow et al., 2006). This complexation leads to the coagulation of soluble molecules into insoluble “pseudo-polymers”; (iv) the adsorption of OC onto mineral surfaces such as poorly crystalline iron oxides, via the attachment – by ligand exchange – of organic molecules to metal atoms (Al, Fe) structurally present in the minerals Kleber et al., 2015). Such poorly-crystalline surfaces are among the most effective sorbents for dissolved OC (e.g., Kaiser et al., 1997). Overall, the turnover time of the mineral- interacting pool of OC ranges from decades to millennia (Kleber et al., 2015 and references therein), although a substantial portion of mineral-interacting OC may cycle at relatively fast timescales (minutes to years; Jilling et al., 2025). Quantifying the share of different mechanisms for OC stability requires a combination of physical methods, which enable to isolate mineral-associated OC from the most labile OC pool, and chemical extraction methods which are designed to target specific pools such as complexes or OC associated with poorly-crystalline surfaces (Fig. 2b).
While extensively studied in unfrozen terrestrial ecosystems (e.g., Kleber et al., 2015 and references therein), the nature, quantities and environmental factors controlling the different organo–mineral interactions are still poorly understood in sediments exposed by hillslope thermokarst features (Opfergelt, 2020). Recent studies show that the proportion of stabilized OC in permafrost sediments is sometimes minor (i.e., averaging 15 %; Patzner et al., 2020; Salvadó et al., 2015) or, on the contrary, very significant (i.e., reaching up to 90 %; Dutta et al., 2006; Martens et al., 2023; Monhonval et al., 2022). Besides, approaches to characterizing mineral–OC interactions using physical and chemical methods are often applied separately. A comprehensive understanding of the different mechanisms is, however, necessary for realistic assessments of the fate of OC exposed by these features, particularly from RTSs and ALDs, which expose potentially heterogeneous sediments and mobilize materials from varying depths.
In this study, we investigate the nature and controls of different mechanisms of mineral–OC interactions in soils exposed by two contrasted types of hillslope thermokarst landscapes and within profiles of corresponding undisturbed sites. We hypothesize that organo–mineral interactions may be more prominent in surface layers that are subject to recurrent positive temperatures, but that it may be limited at depth if buried and frozen sediments have not experienced pedological development. We analyzed mineralogy, total and soluble element concentrations, total OC and mineral–OC interactions within the headwalls of two disturbances: an ALD and a RTS at Cape Bounty (south-central coast of the Melville Island, Nunavut, Canada). We investigate whether these contrasted disturbances expose mineral-interacting OC of different natures (i.e., OC extracted by physical or chemical techniques), estimate the level of stabilization of the different pools and discuss their potential fate.
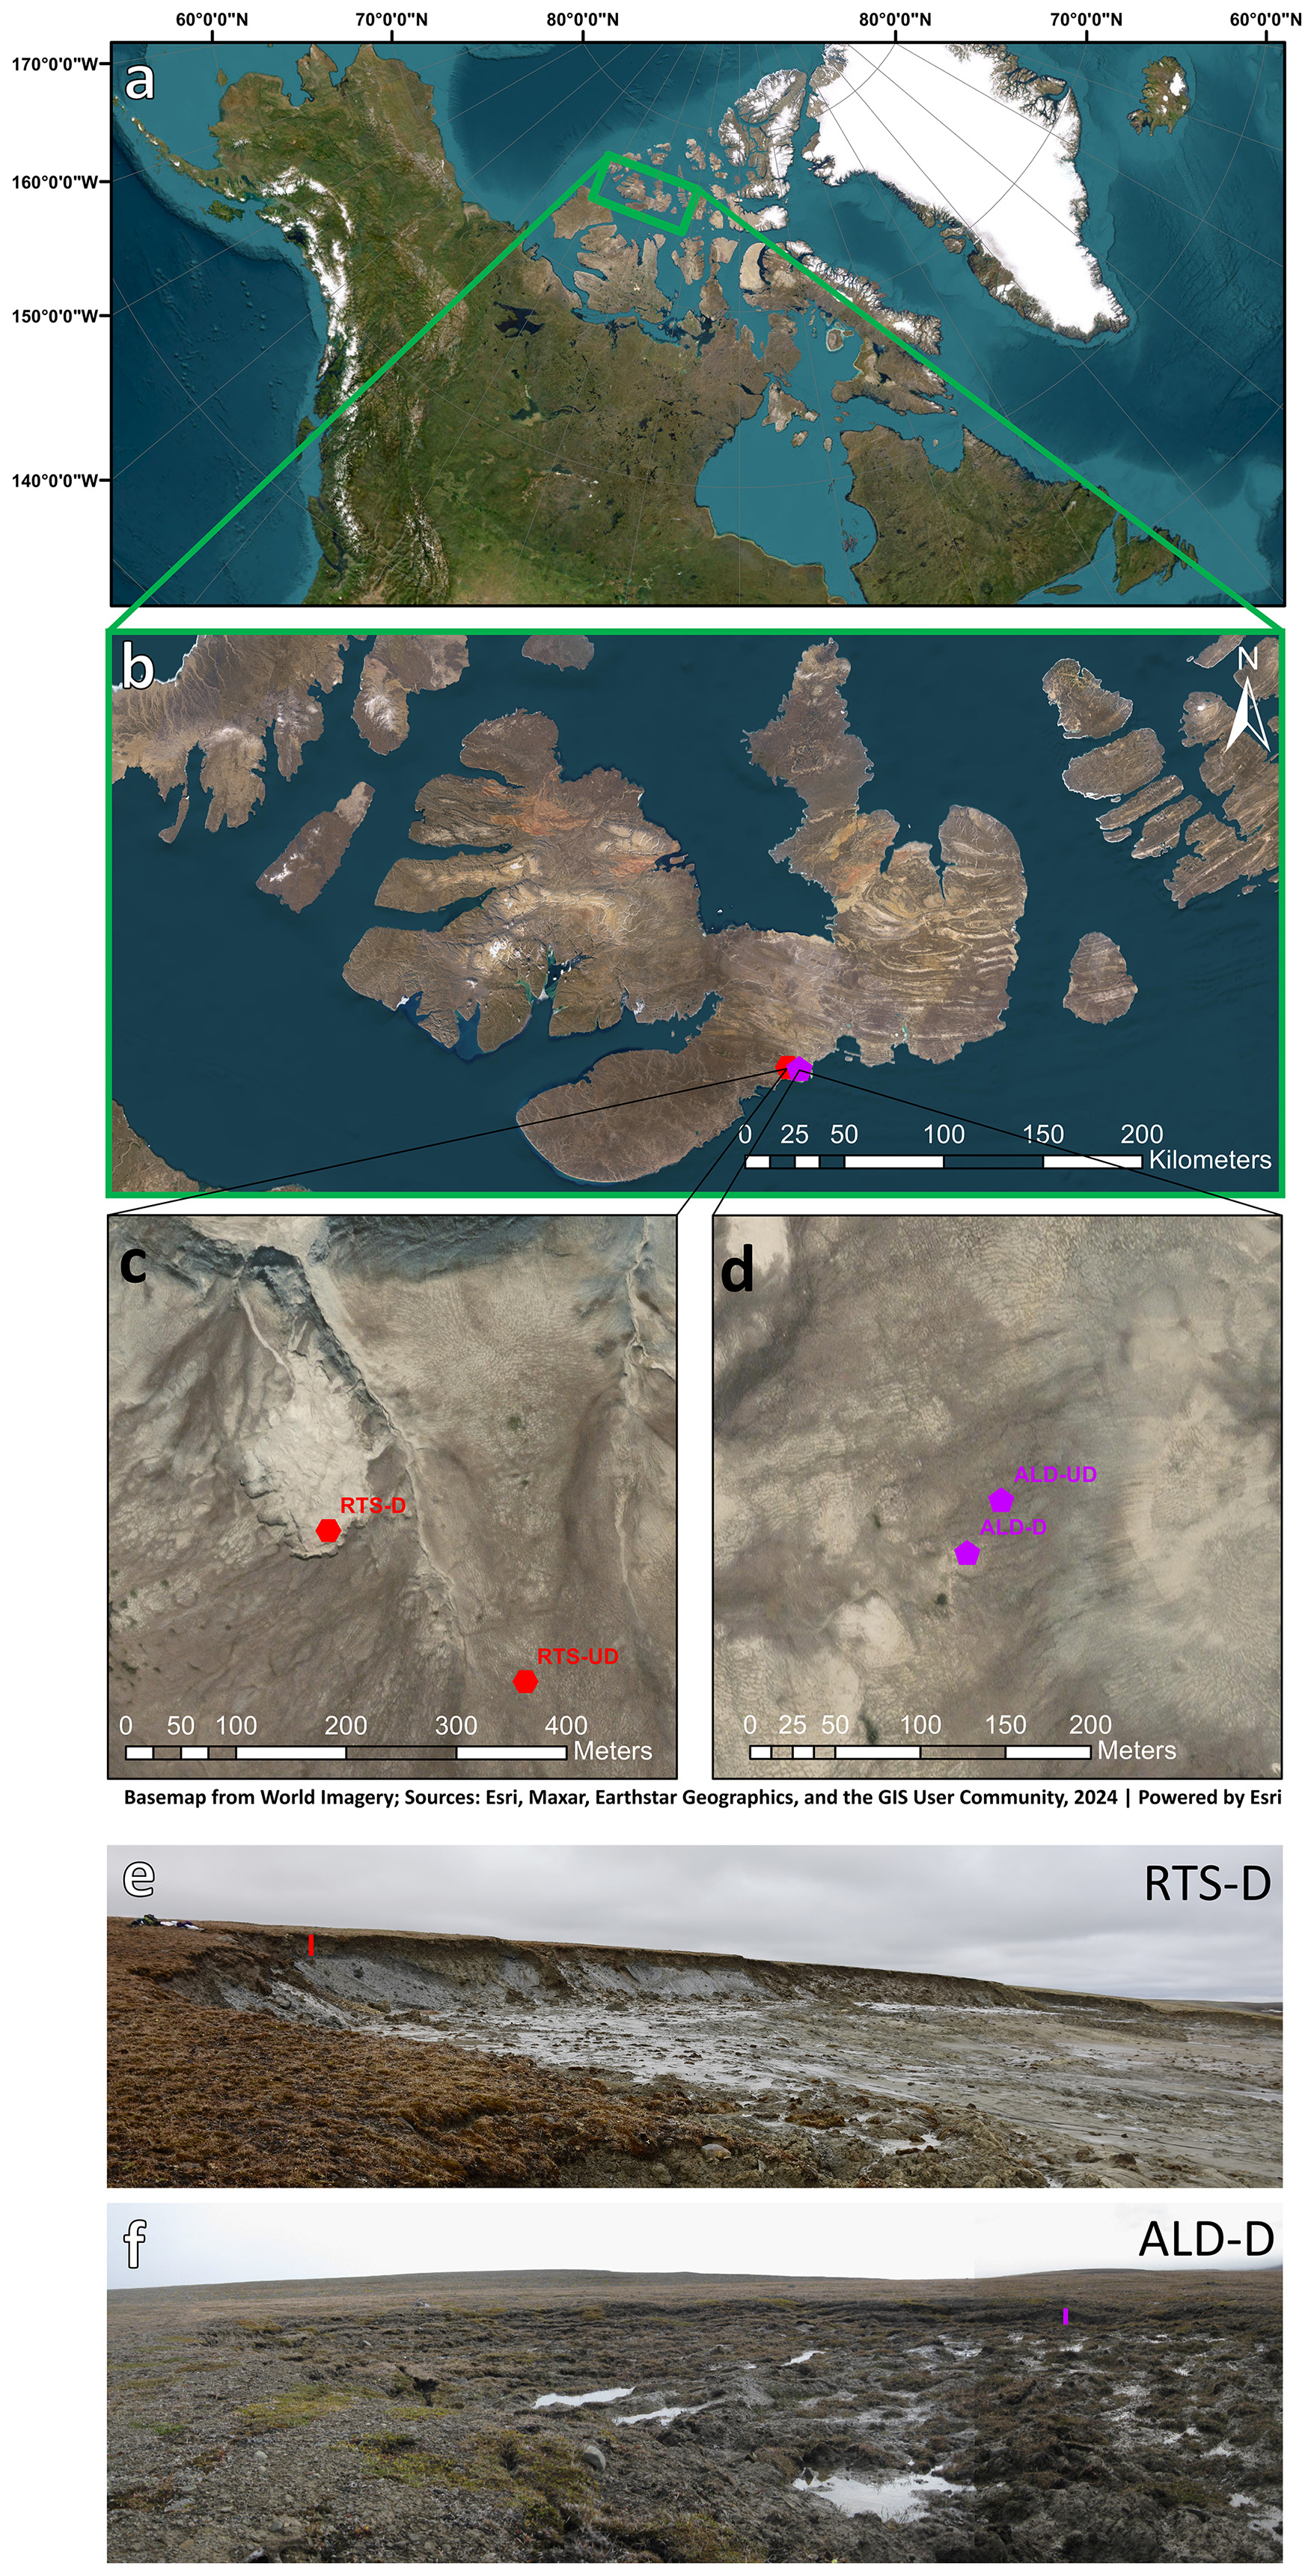
Figure 3Study site and sampling location. (a) Location of the Melville Island; (b) Location of the Cape Bounty Arctic Watershed Observatory (CBAWO), on the south-central coast of the Melville Island; (c, d) Locations of the sampled profiles. RTS = retrogressive thaw slump; ALD = active layer detachment; D = disturbed; UD = undisturbed; (e, f) Photographs and profile locations of the disturbed sites at the time of sampling for the RTS-D (e) and the ALD-D (f). Profile locations on panels (e) and (f) are represented by colored vertical rectangles. Map created in ArcMap® 10.8. Basemap source: World Imagery (Esri et al., 2024). Photos from panels (e, f): Melissa J. Lafrenière and Joanne K. Heslop.
2.1 Study site
The Cape Bounty Arctic Watershed Observatory (CBAWO), located on the south-central coast of the Melville Island (Nunavut, Canada; Fig. 3a and b), was established in 2003 to examine Arctic ecosystem processes that would be impacted by climate warming and permafrost degradation (Lamoureux and Lafrenière, 2018; Treitz et al., 2024). Melville Island is characterized by a polar desert climate (mean annual air temperature: −14.8 ± 1.3 °C) with limited annual precipitation and runoff (< 150 mm yr−1; Beel et al., 2020, 2018; Lamoureux and Lafrenière, 2018) and a short thaw season between June and August (Lamoureux and Lafrenière, 2009). Bedrock in this region is composed of upper Devonian near-shore marine sandstone and siltstone units (Hodgson et al., 1984). Glacial and early Holocene marine sediments later overlaid the region resulting in a landscape characterized by incised low elevation plateaus and gentle hills (Hodgson et al., 1984). Permafrost is continuous and the thickness of the active layer is most often confined to the 0.75–1 m of surface material (Lamoureux and Lafrenière, 2009, 2018; Rudy et al., 2013). Exceptionally warm temperatures and clear skies during July 2007 combined with a major rainfall event (5 year return period), caused extensive thawing of ground ice and degradation of permafrost in Cape Bounty, in the form of hillslope thermokarst structures (Lamoureux and Lafrenière, 2009). This degradation manifested locally as RTSs and ALDs.
2.2 Sampling
The two different types of hillslope thermokarsts were sampled the 7 and 10 August, 2018, i.e., a RTS (Fig. 3c) and an ALD (Fig. 3d), both for so-called “disturbed” and “undisturbed” locations. Samples were taken at 10 cm increments in the active layer until the top of the frozen layer was reached (where only one sample was taken). A location is defined as disturbed (D) when disturbance (ALD or RTS) is present and sampling was conducted within the headwall (Fig. 3e and f). The corresponding undisturbed (UD) site is located at 29 m (ALD) and 234 m (RTS) from the disturbance, in an area where the collapse had not (yet) occurred. The ALD sampled in this study is within the Ptarmigan sub-catchment and formed in 2007 (Lamoureux and Lafrenière, 2009). The catchment hosted other ALDs in 2007, collectively covering 12 % of the total catchment area (21.3 ha; Lafrenière and Lamoureux, 2013). Field observations showed that, while the ALD was not active in summer 2018 at the time of sampling, the RTS was still very active (up to 1 m annual retreat rate) and exposed fresh sediments from that summer.
2.3 Mineralogy
We used X-ray diffraction (XRD) to characterize the crystalline mineral phases in the samples. The mineralogy of the bulk samples was determined on non-oriented powder finely ground in a mortar (Cu Kα, Bruker Advance D8 diffractometer, detection limit 5 % by weight) in the sample closest to the surface and in the deepest sample for the four modalities (n = 8).
2.4 Bulk Mineral Element Concentrations (Fe, Al, Mn, Ca, K)
We measured the total concentrations of Fe, Al, Mn, Ca and K in all samples (n = 33) using a portable X-ray fluorescence (XRF) device (Niton XL3t GOLDD + pXRF; ThermoFisher Scientific, Waltham, the United States). Measurements were carried out in laboratory conditions (ex-situ) on air-dried samples to prevent the introduction of additional variability (e.g. water content, sample heterogeneity). Briefly, the samples were placed on a circular plastic cap (2.5 cm in diameter), its base covered with a thin transparent film (prolene 4 µm). To ensure that detected intensities were not underestimated, the minimum sample thickness in the cap was set at 2 cm (Ravansari et al., 2020), and the total analysis time was set at 90 s to standardize each measurement. Concentrations measured by pXRF were calibrated using a method following Monhonval et al. (2021a). Linear regressions were used to correct pXRF concentrations for trueness on all samples (n = 33). These regressions were obtained from element concentrations measured by pXRF and by inductively coupled plasma optical emission spectrometry (ICP-OES) after alkaline fusion on samples from different permafrost environments (n = 172), including 8 samples from the present study. Those 8 samples were the top and bottom samples for each modality (ALD-D, ALD-UD, RTS-D, RTS-UD). The regressions had good coefficients of determination (robust R2 ≥ 0.9 for Fe, Ca, K; robust R2 ≥ 0.8 for Mn; robust R2 ≥ 0.6 for Al; Fig. A1). In the following, the total element concentration measured by XRF and corrected for trueness will be referred to as Fet, Alt, Mnt, Cat, Kt.
2.5 Water extractions
The water-soluble concentration in Ca and K were determined by water extraction on all samples (n = 33). This measurement is used to assess to what extent a soil or sediment has undergone leaching of water-extractable soluble elements. The water extraction protocol follows that in Thomas et al. (2023), consisting of placing 2 g of soil in 20 mL of ultrapure water (resistivity range = 10–18 MΩ cm) for 2 h at room temperature and targets the elements released in the soluble phase (Ca, K). The element concentrations are measured in solution after filtration at 0.2 µm by ICP-OES. We also measured the pH (pH Electrode Inlab micro) and conductivity (probe Inlab 715-4 mm) on the water extract (Mettler Toledo SevenCompact DuoS213). In the following, elements extracted with ultrapure water will be referred to as the symbol of the corresponding element followed by a subscript letter “w” (Caw, Kw).
2.6 Total organic carbon concentrations
The total organic carbon (TOC) content was determined on finely ground sediments by substracting the total inorganic carbon from the total carbon on all samples (n = 33) and is reported as the mass of OC as a percentage of the total mass of dry soil (weight percent; %wt). The total carbon was measured after dry combustion via a Vario El Cube Elemental Analyser in accordance with the NF ISO 10694 standard (LOD = 0.1 %wt). The measurement of total inorganic carbon was carried out by measuring the release of carbon dioxide (CO2) following acid attack of 1 g of dry soil with hydrochloric acid, following the XP CEN/TS 16375 standard. Briefly, the CO2 released generates a pressure related to the inorganic carbon content and the relationship is established from a series of standards of 10, 20, 50, 100 and 200 mg CaCO3 (see also Baize, 2018). For the samples analyzed (n = 33), inorganic carbon averaged 0.04 ± 0.02 %wt. Inorganic carbon concentration is therefore not significant.
2.7 Selective extractions (Fe, Al, Mn, Ca, organic carbon)
Two approaches of selective extraction from soil were used as indicators of complexed and poorly crystalline oxide phases (Rennert, 2019). Extraction of Fe, Al, Mn and Ca by sodium pyrophosphate targets organometallic complexes (Bascomb, 1968; Parfitt and Childs, 1988). We recognize a possible contribution from oxide nanoparticles in addition to organically bound metals (Courchesne and Turmel, 2008; Jeanroy and Guillet, 1981; Kaiser and Guggenberger, 2007), but limited by centrifugation as well as filtration of the extract. Extraction of Fe, Al and Mn by ammonium oxalate in the dark targets poorly crystalline oxides and organometallic complexes (Blakemore et al., 1981). The pool of mineral elements that form organometallic complexes or associations with OC is sometimes referred to as “reactive”. This reactive pool combines all poorly crystalline, amorphous and complexed forms of Fe, Mn, Al (and Ca), and corresponds here to extraction with ammonium oxalate (Fig. 2b). The selective extractions were carried out on all samples (n = 33). Concentrations in Fe, Al, Mn and Ca were measured in solution by ICP-OES after each extraction. In the following, elements extracted by the pyrophosphate and oxalate methods will be referred to as the symbol of the corresponding element followed by a subscript letter indicating the type of extraction, i.e. “p” for pyrophosphate extraction (Fep, Alp, Mnp, Cap) and “o” for oxalate extraction (Feo, Alo, Mno). The concentration of poorly crystalline oxides is calculated as the difference between the concentration in the oxalate extract and the pyrophosphate extract (Feo−Fep; Alo−Alp; Mno−Mnp).
The pool of OC selectively extracted with sodium pyrophosphate (Bascomb, 1968; Jeanroy and Guillet, 1981; Parfitt and Childs, 1988) was measured on the same solutions as those used for the selective extraction of metals (n = 33). Briefly, we measured dissolved OC released after dispersion by pyrophosphate using a Shimadzu TOC-L analyzer (measuring non-purgeable OC; LOD = 50 µg L−1). In the following, this carbon extracted by pyrophosphate will be referred to as Cp.
For oxalate extracted carbon, direct measurement is impractical as ammonium oxalate ((NH4)2C2O4) and oxalic acid (H2C2O4) are organic reagents. As a proxy, we measured the absorbance at 430 nm in the oxalate extract (via a Genesys 10 S VIS spectrophotometer, with the extractant solution as a blank) to evaluate the organic acid concentration. The optical density of the oxalate extract (ODOE) is mainly influenced by the extracted fulvic acids present in the oxalate extract (Daly, 1982).
The selective extractions presented here target organic carbon in the form of small fragments of biopolymers stabilized by chemical bonds. Some larger fragments of biopolymers – also stabilized by chemical bonds – will not be completely dissolved by selective extractions and will therefore not be included in this pool. These must therefore be quantified using density fractionation (see Sect. 2.8).
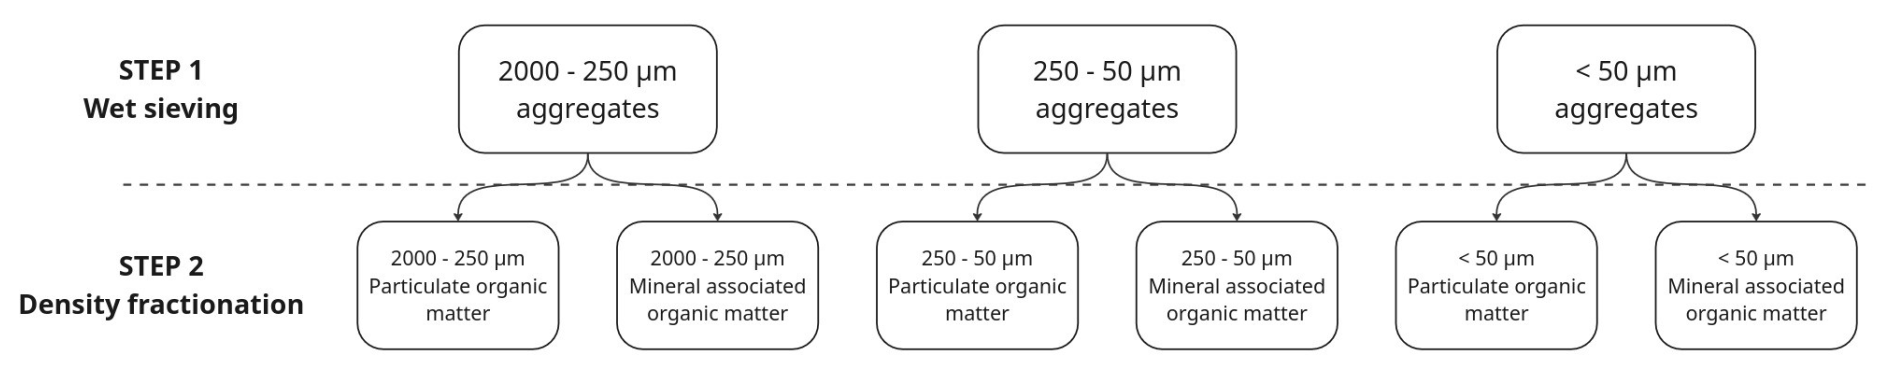
Figure 4Two-stage aggregate and density fractionation protocol (adapted from Burgeon et al., 2021).
2.8 Soil aggregate and density fractionation
The samples followed a two-stage fractionation protocol, based on aggregate size and density (Fig. 4) adapted from and extensively described in Burgeon et al. (2021). This protocol was applied to the sample closest to the surface and to the deepest sample for the four modalities (n = 8) to separate free particulate organic matter from mineral-associated organic matter, representing organic matter occluded in aggregates and sharing chemical bonds with minerals. In the first stage, we performed a series of wet sieving (in a bath of 2 cm of distilled water over the mesh, we rotated and tilted the sieve for 50 rotations during 2 min) to separate the soil into 3 aggregate size classes: the coarse sand size fraction (2000–250 µm), the fine sand size fraction (250–50 µm) and the silt and clay size (S&C) fraction (< 50 µm). Particles larger than 2 mm were eliminated. The second stage used sodium polytungstate (SPT – 1.85 g cm−3) to differentiate light fractions non occluded in aggregates considered as particulate organic matter (< 1.85 g cm−3) from heavy fractions (> 1.85 g cm−3): aggregate of coarse sand size, aggregate of fine sand size and heavy fractions of free silt and clay size, aggregated or not. Briefly, we submerged 5 g of 60 °C oven dried fractions obtained from the first stage in 50 mL of SPT. These were then gently shaken head over head 10 times to soak the sample and remove air bubbles and placed in a vacuum chamber (140 kPa) for 10 min then left to rest under atmospheric pressure for 20 min. All samples were then centrifuged at 4700 g for 10 min and the supernatant, considered as the light fraction, was collected on glass fiber filters (performed thrice). The light fraction was thoroughly rinsed with distilled water and dried at 60 °C. The pellet was shaken into suspension using distilled water, then centrifuged. The distilled water was discarded in order to remove the SPT. This step was performed multiple times to recover heavy fraction dominated by mineral associated organic matter. On each fraction, the total carbon was measured by dry combustion via a Vario El Cube Elemental Analyser (LOD = 0.1 %wt). This carbon content is reported as the mass of OC as a percentage of the total mass of the corresponding fraction (% wt, fraction).
2.9 Statistical analyses
We performed computations for statistical analysis using R software version R.4.5.1 (R Core Team, 2025). Robust mixed-effect models presented in this study were fitted using the rlmer function from the robustlmm package v3.3-3 (Koller, 2016). The variable “profile” (RTS-D, RTS-UD, ALD-D, ALD-UD) has been included as a random factor, with random intercept and slope. We report the marginal R2 (), representing the population-level trend (variance explained by fixed effects) in the main text. The conditional R2 (), which includes both fixed and random effects and reflects total model performance, is additionally shown on the plots for reference. When numerical statistics are presented in the text for dataset descriptions, the mean ± standard deviation of the distribution is presented. For comparing two datasets, we performed nonparametric statistical Wilcoxon test.
3.1 Mineralogy, bulk mineral element concentrations and water extractions
The diffractograms of the samples characterized indicate the presence in all samples of primary silicate minerals (quartz, feldspars and micas) and secondary silicate minerals (kaolinite, illite, vermiculite, chlorite) (Figs. C1–C4) with similar diffractogram patterns in all samples.
Total concentrations in major elements (Ca, K, Fe, Al, Mn) do not vary significantly between the RTS and the ALD for the disturbed and undisturbed modalities (Fig. B1). Total iron concentration is 36 ± 4 g kg−1, total aluminum concentration is 71 ± 11 g kg−1 and total manganese concentration is 0.53 ± 0.09 g kg−1. The concentrations are homogeneous along the depths. However, total calcium (Cat; 2.3 ± 0.4 g kg−1) and potassium (Kt; 15 ± 2 g kg−1) concentrations increase slightly with depth for the sediments exposed by the retrogressive thaw slump (RTS-D) compared to the undisturbed (RTS-UD) location (Fig. B1d and e).
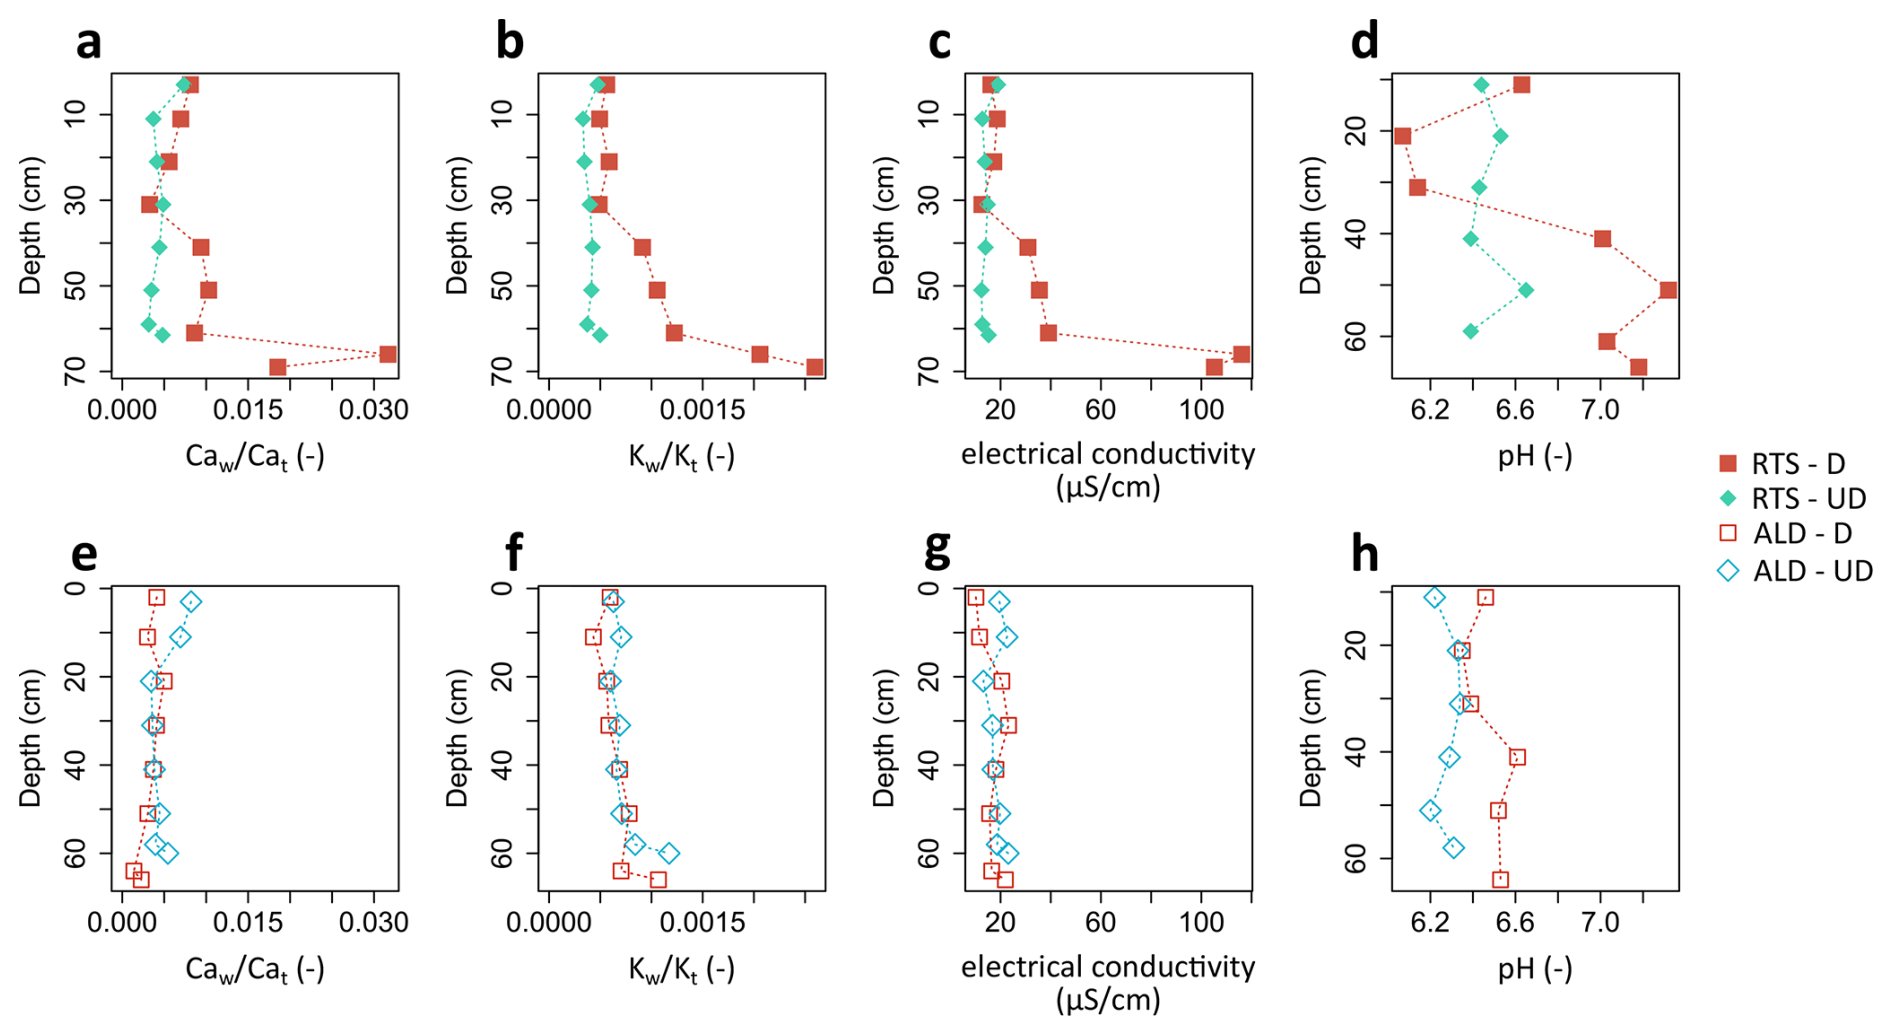
Figure 5Results of water extraction measurements for (a, e) the ratio between water extracted (w) and total (t) concentrations in calcium (), (b, f) the ratio between water extracted (w) and total (t) concentrations in potassium (), (c, g) electrical conductivity and (d, h) pH. RTS = retrogressive thaw slump; ALD = active layer detachment; D = disturbed; UD = undisturbed.
The proportion of highly soluble water extractable Ca and K shows a clear increase with depth for sediments exposed by the retrogressive thaw slump (RTS-D; ; ; Fig. 5a and b), likewise for electrical conductivity of the solution (Fig. 5c) and pH (Fig. 5d). In contrast, there is no trend with depth for active layer detachment samples (Fig. 5e–h).
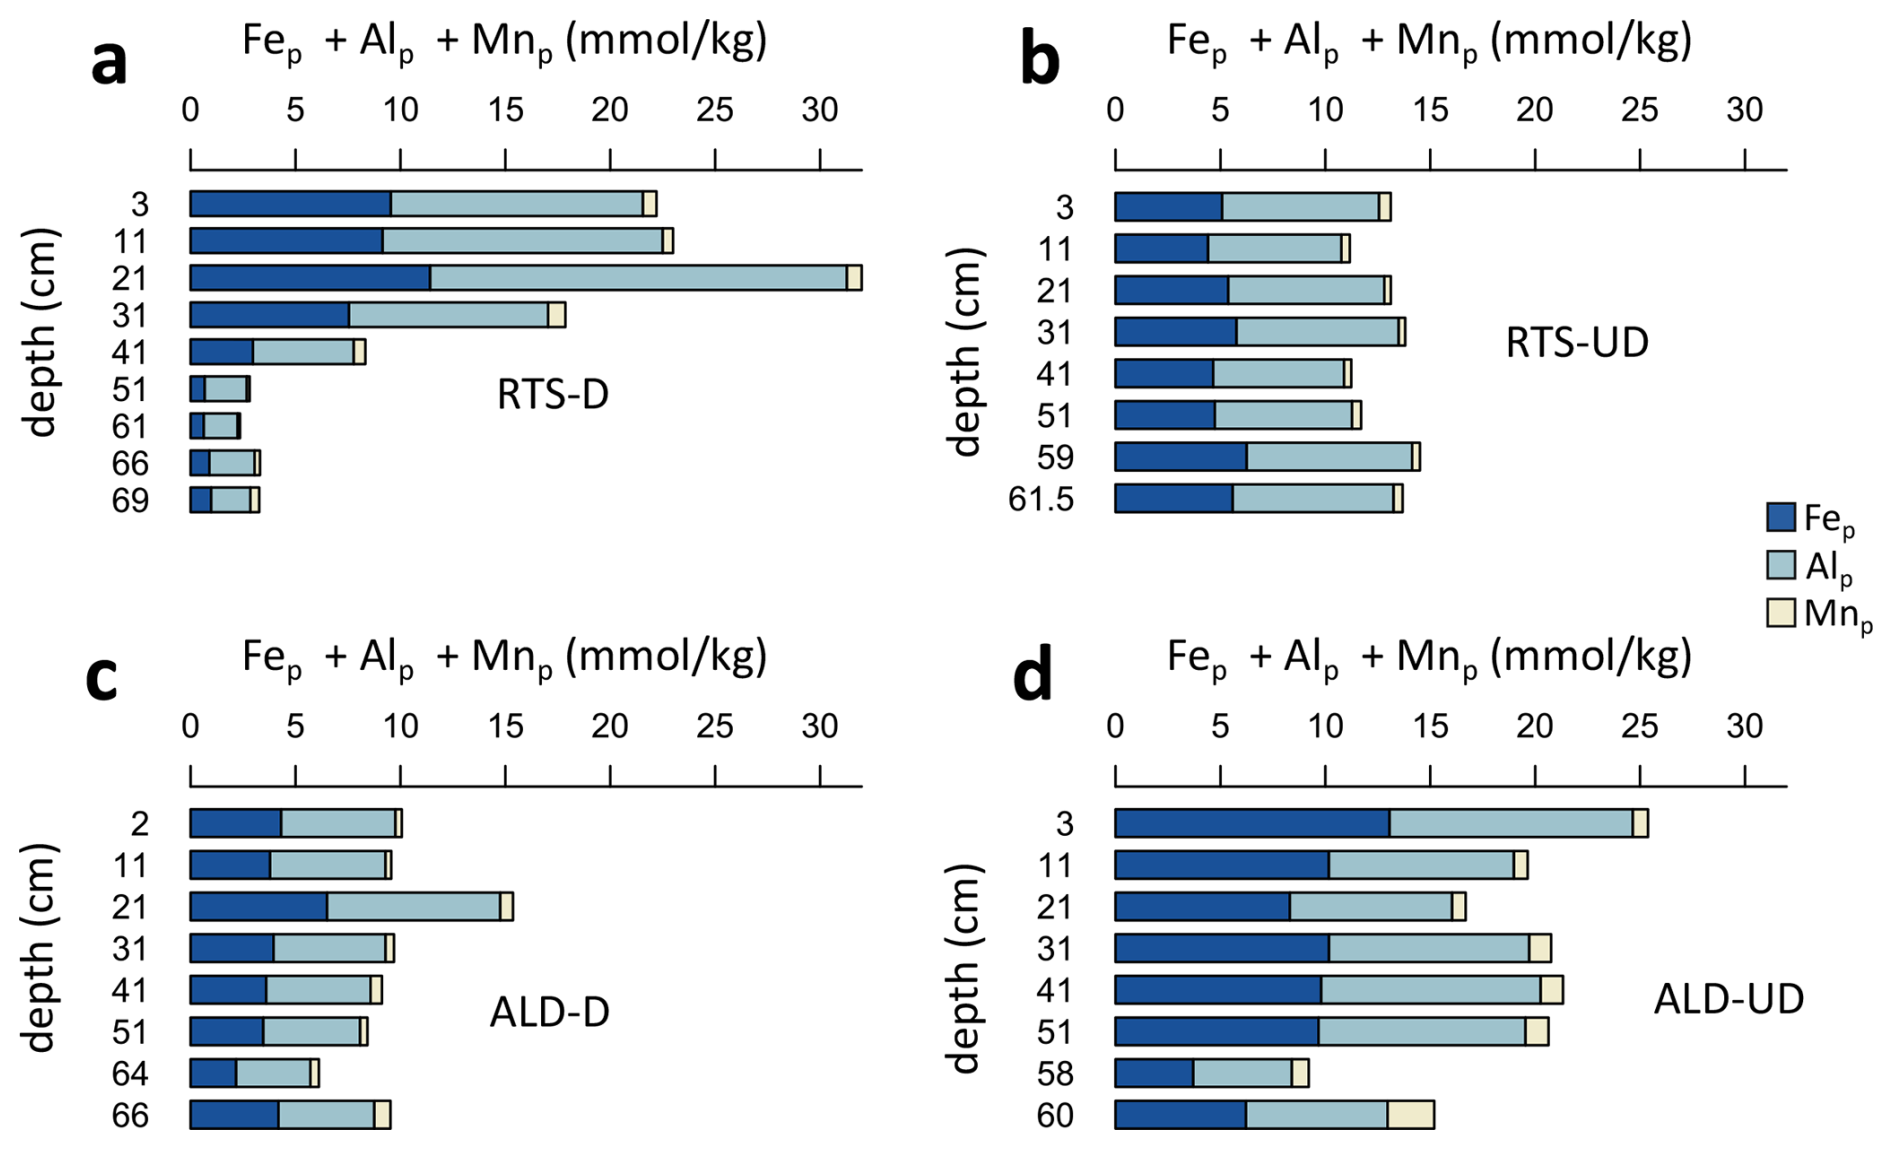
Figure 6Evolution with depth of the metals forming organo–metallic complexes in (a) sediments exposed by the retrogressive thaw slump (RTS-D); (b) the corresponding undisturbed profile (RTS-UD); (c) sediments exposed by the active layer detachment (ALD-D); (d) the corresponding undisturbed profile (ALD-UD).
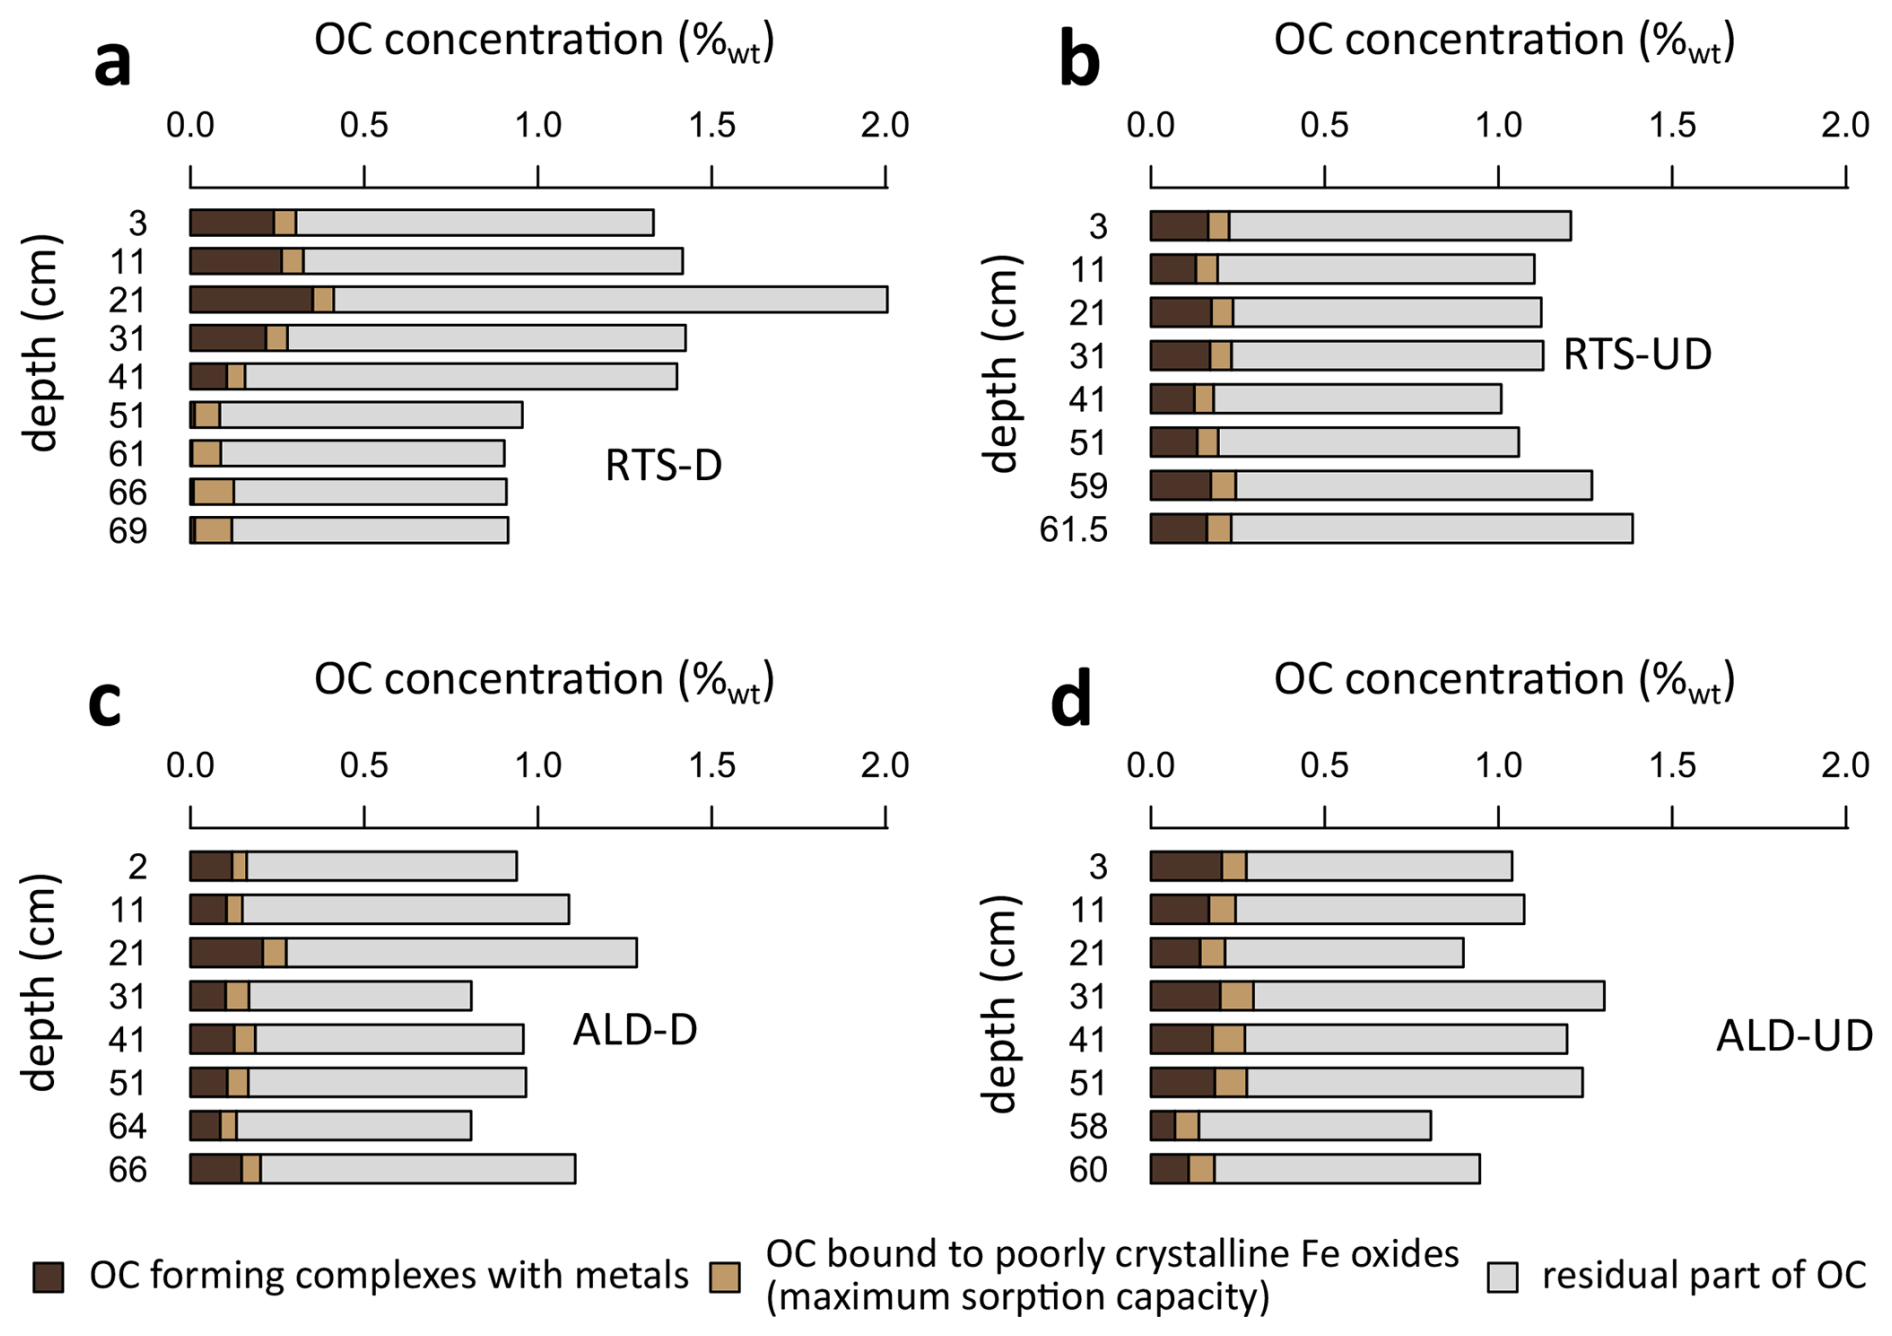
Figure 7Evolution with depth of pyrophosphate-extracted carbon (Cp) and maximum proportion of organic carbon (OC) bound to poorly crystalline Fe oxides (Camorph) in (a) sediments exposed by the retrogressive thaw slump (RTS-D); (b) the corresponding undisturbed profile (RTS-UD); (c) sediments exposed by the active layer detachment (ALD-D); (d) the corresponding undisturbed profile (ALD-UD). The values of OC bound to crystalline Fe oxides correspond to a calculation with a maximum sorption capacity of 0.22 gOC gas ferrihydrite (Feo−Fep). %wt = mass of OC as a percentage of the total mass of dry soil, i.e., weight percent.
3.2 Selective extractions of metals
Four cations were initially examined for the formation of organo–metallic complexes, i.e., extracted by pyrophosphate: iron, aluminum, manganese and calcium. Calcium extracted by pyrophosphate (Cap) was not further investigated, as it showed no correlation with pyrophosphate-extracted carbon (robust = 0.01). We acknowledge that analytically, calcium extracted with pyrophosphate or other extractants reflects both calcium bound to OC and calcium released by dissolution of highly soluble mineral phases, and the pool of organically bound calcium cannot be isolated. Yet, calcium can sometimes play an important role in OC stabilization (e.g., Rowley et al., 2018), by forming cationic cation bridges or beyond, by associating with specific soil OC decomposition products (Rowley et al., 2025 and references therein). Among the three other metals involved in complexation, aluminum is dominant () = 55 ± 6 % when concentrations are expressed on a molar basis: mmol kg−1), followed by iron ( = 40 ± 7 %) and manganese ( = 5 ± 3 %). We observe a distinct decrease in the concentration of metals forming complexes in the deepest samples of the profile exposed by the thaw slump (RTS-D; Fig. 6a), while the concentration of all metal complexes are homogeneous along the depth for the three other profiles (RTS-UD; ALD-D; ALD-UD; Fig. 6b–d). Aluminum, besides being the dominant metal in terms of molar concentration, is also the metal that best explains the distribution of complexed OC (mixed-effect model between Alp and Cp; robust = 0.89; Fig. D1b), followed by iron (Fep; robust = 0.58; Fig. D1a) and manganese (Mnp; robust ∼ 0; Fig. D1c). The proportions of these metals in complex form in relation to total concentrations are low, with 0.3 ± 0.2 % for aluminum (), 0.9 ± 0.6 % for iron () and 6 ± 4 % for manganese ().
For oxalate extraction, the proportion extracted relative to total concentration is 5 to 20 times higher than for pyrophosphate (Figs. D2–D4), with 1.4 ± 0.2 % for aluminum (), 10 ± 2 % for iron () and 63 ± 14 % for manganese (). As for the proportion of poorly crystalline oxides, it stands at 1.1 ± 0.2 % for aluminum (), 9 ± 2 % for iron () and 56 ± 14 % for manganese (). Concentrations and proportion of poorly crystalline oxides are homogeneous along depth, except in the headwall exposed by the retrogressive thaw slump (RTS-D), where there is a clear increase with depth in the proportion of poorly crystalline iron oxides (Fig. D2a) and poorly crystalline aluminum oxides (Fig. D3a), relative to the total.
3.3 Total and selectively extracted organic carbon
Total organic carbon concentrations are low along the profiles, i.e., at 1.1 ± 0.2 %wt. For the profile exposed by the thaw slump (RTS-D), we see an increase to 2 %wt at 20 cm depth, before dropping to 0.9 %wt for the deepest samples (Fig. 7a). The concentration of carbon forming complexes with metals is 0.14 ± 0.07 %wt on average (Cp; Fig. 7). Relative to the TOC concentration, this means that 13 ± 5 % of TOC is in the form of complexes with metals (; Fig. D6), and trends along the depth follow those of metal complexes (see Fig. 6).
Assuming a maximal sorption capacity of 0.22 gOC g as ferrihydrite (Wagai and Mayer, 2007), we can calculate a concentration of up to 0.08 ± 0.02 %wt of OC bound to poorly crystalline iron oxides (Feo−Fep; Fig. 7). We acknowledge that the samples could potentially also contain Al-bearing amorphous silica (e.g., allophanes, imogolite; Rennert, 2019) extracted with oxalate, yet these cannot be quantified and singled out with confidence. Besides, the concentration in Al-bearing amorphous silica or oxides (Alo−Alp) is on average 4 times lower than those containing iron (Feo−Fep; Fig. D5), as are concentrations in poorly crystalline manganese oxides (Mno−Mnp; 12 times lower; Fig. D5). These Al- or Mn-bearing amorphous silica and poorly crystalline oxides have therefore not been considered for associations with OC. In the following, the calculation of OC bound to poorly crystalline iron oxides will be referred to as Camorph and refer to a maximal sorption capacity of OC to poorly crystalline iron oxides only. Relative to TOC, this means that up to 6 ± 2 % of the TOC is bound to poorly crystalline iron oxides in these profiles (Fig. D6). We estimate accordingly that the combination of the mechanisms of complexation and adsorption to poorly crystalline iron oxides results in 20 ± 4 % of the TOC pool being chemically bound with mineral surfaces or metallic cations .
The optical density of the oxalate extract (ODOE) averages 0.039 ± 0.012. This value correlates well with the concentration of OC forming complexes with metals (linear regression between ODOE and Cp; robust = 0.84; Fig. D7a) and TOC (robust = 0.59; Fig. D7e), but shows poor to no correlation with oxalate extracted metals (robust = 0.05 with Feo; Fig. D7b; robust = 0.23 with Alo; Fig. D7c and robust = 0.28 with Mno; Fig. D7d) or with the proportions in poorly crystalline oxides (Fig. D7f–h). On the other hand, ODOE correlates very well with the sum Cp + Camorph (robust = 0.92), supporting our approach to calculate Camorph.
Sediments exposed by the retrogressive thaw slump (RTS-D) exhibit a significant decrease in OC forming complexes with metals (Cp) along depth (Wilcoxon tests comparing the 5 surface samples with the 4 deepest samples; p-value < 0.05; see also Fig. 7a). In contrast, no clear trend is observed for the other three modalities (p-value > 0.3 for RTS-UD, ALD-D and ALD-UD; Fig. 7b–d). The OC associated with poorly crystalline Fe oxides (Camorph) in RTS-D sediments shows an opposite pattern, with concentrations increasing slightly with depth (p-value = 0.2), although Camorph concentrations are, on average, half of those for Cp (Fig. 7). When both mechanisms (Cp and Camorph) are combined, there is still a significant decrease in overall stabilized OC concentration with depth in RTS-D sediments (p-value < 0.05; Fig. 7a).
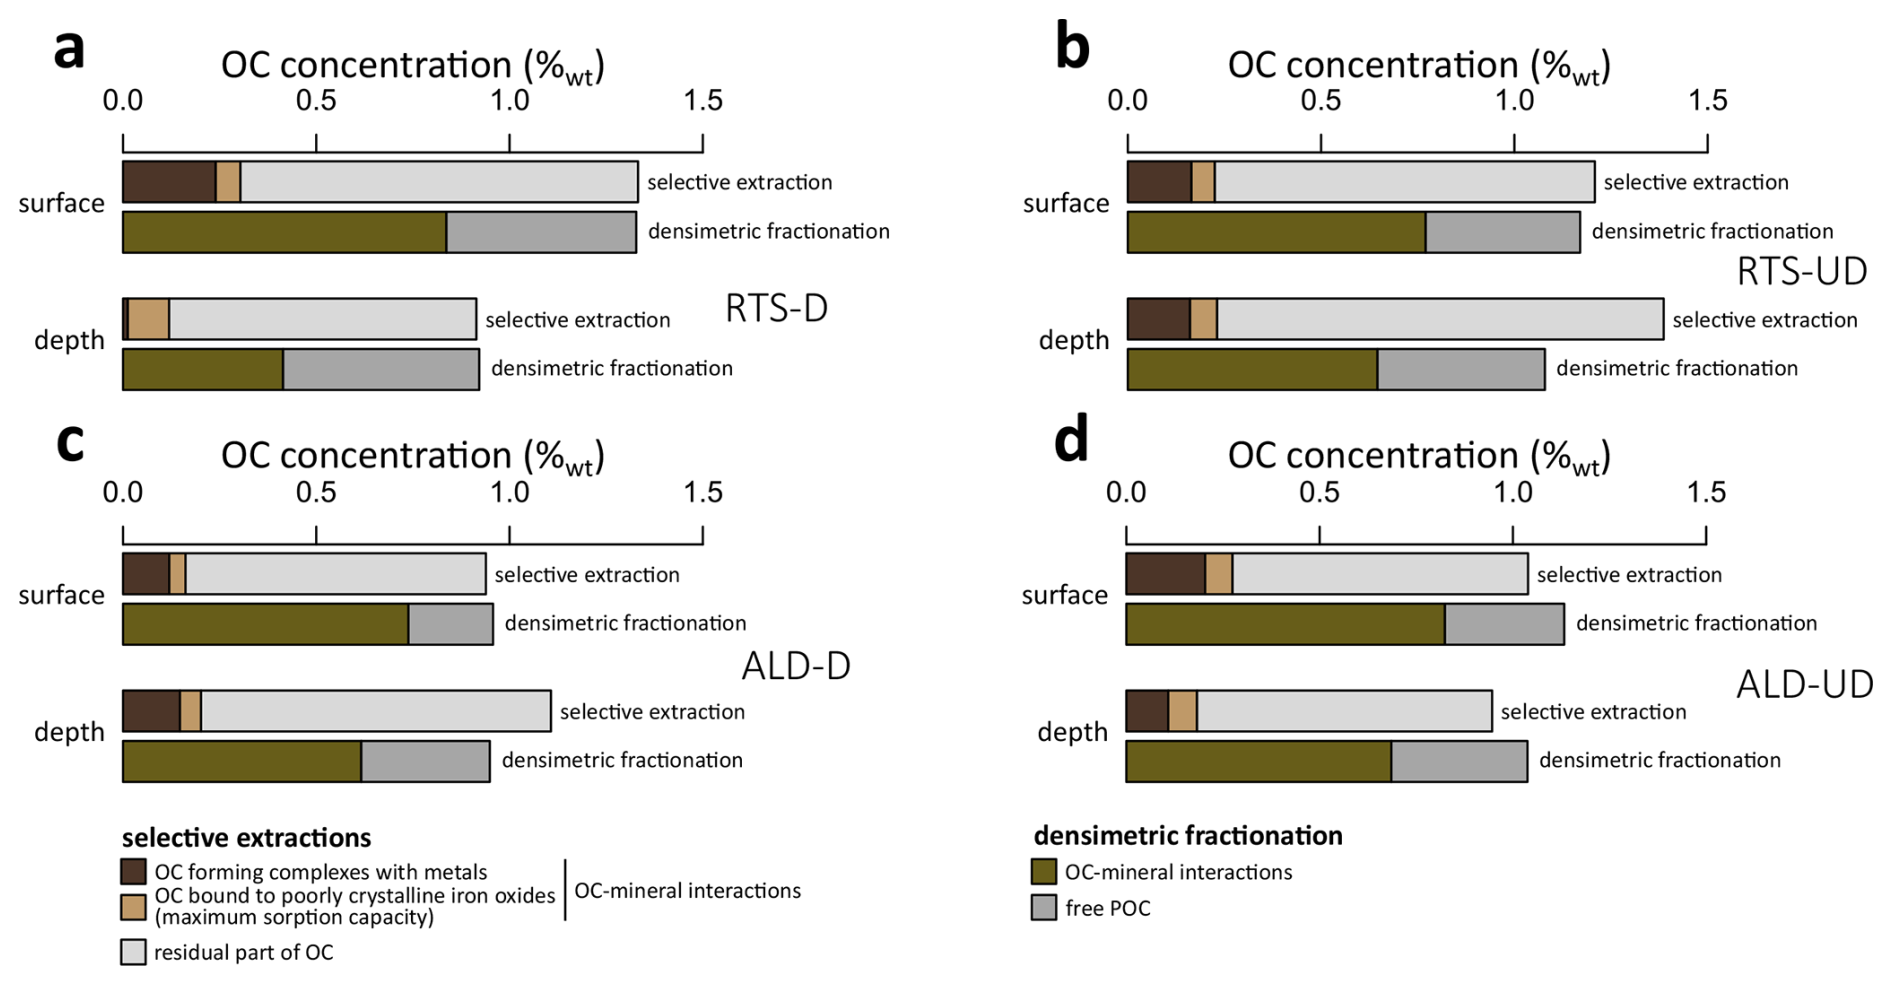
Figure 8Comparative results of organic carbon (OC) stabilized through organo–mineral interactions with the selective chemical extraction protocol and the size and density fractionation protocol for the shallowest and deepest samples in (a) sediments exposed by the retrogressive thaw slump (RTS-D); (b) the corresponding undisturbed profile (RTS-UD); (c) sediments exposed by the active layer detachment (ALD-D); (d) the corresponding undisturbed profile (ALD-UD). POC = particulate organic carbon.
3.4 Particulate and mineral associated organic matter pools
The mass fractions of 2000–250, 250–50 and < 50 µm aggregates are 15 ± 4 %, 37 ± 9 % and 48 ± 10 %, respectively, with no trend with depth or between RTS and ALD. The particulate organic matter resulting from density fractionation represents 1.1 ± 0.2 % on average of the total soil mass. It is divided into 0.24 ± 0.06 % for 2000–250 µm size, 0.4 ± 0.1 % for 250–50 µm size and 0.5 ± 0.1 % for < 50 µm size. The mineral-associated fraction, which represents 98.3 ± 0.2 % of the total mass, is divided into 15 ± 4 % for 2000–250 µm, 36 ± 8 % for 250–50 µm size and 47 ± 10 % for < 50 µm (Table E1). The OC concentration is much higher for the particulate organic matter fractions (33 ± 10 %wt,fraction) than for the mineral associated organic matter fractions (0.7 ± 0.3 %wt,fraction; Table E1). When we recalculate these OC contents taking into account the mass proportion of each fraction in the soil, we obtain that the free particulate organic matter fraction represents a content of 0.4 ± 0.1 %wt on average (Table E1; Fig. 8); divided in 0.06 ± 0.03 %wt, 0.12 ± 0.03 %wt and 0.20 ± 0,07 %wt for 2000–250, 250–50 and < 50 µm sizes, respectively (Fig. E1). The mineral associated organic matter fraction represents a content of 0.7 ± 0.1 %wt (Table E1; Fig. 8), divided in 0.08 ± 0.04 %wt, 0.20 ± 0.09 %wt and 0.4 ± 0.1 %wt for 2000–250, 250–50 and < 50 µm sizes, respectively (Fig. E1). The free particulate organic matter represents on average 36 ± 10 % of the bulk soil TOC content, and the mineral-associated organic matter fraction represents 64 ± 10 % of TOC. For sediment exposed by the RTS, the content of mineral-associated OC decreases with depth, i.e., from 0.84 %wt mineral associated organic C for the shallowest sample to 0.41 %wt at depth (Fig. 8a), as it is the case for the chemical extractions (Figs. 8a and 7a).
4.1 The proportion of organic carbon stabilized by chemical interactions is in the low range at Cape Bounty relative to other Arctic environments
Our estimate is that 20 ± 4 % of the TOC ) in the soil and sediments from Cape Bounty is chemically bound with mineral surfaces or metallic cations, which is in the low range of values reported elsewhere. Indeed, it compares with 43 ± 20 % from other studies on hillslope thermokarst or Yedoma sediments in Siberia and Canada (Monhonval et al., 2021a, 2022; Thomas et al., 2023, 2024), all of which report fairly low TOC content, i.e. on average 1.6 ± 1.5 %wt, which is in the same range as the samples from this study (1.1 ± 0.2 %wt; Sect. 3.3). This confirms that – for sites with comparable TOC contents – the level of stabilization through chemical interactions appears to be about half as high at Cape Bounty in comparison to other studies in the Arctic. This could be partially explained by the particular location of Cape Bounty, which is at the highest latitude (74°55′ N) compared to the study sites referenced here above (66°45′–67°34′ N). In addition, Cape Bounty landscapes consists of Holocene syngenetic permafrost developed in marine sediments (England et al., 2009; Hodgson et al., 1984; Lajeunesse and Hanson, 2008; Paquette et al., 2023) compared to the Pleistocene age of sites referenced above. This means that Cape Bounty is roughly 800–900 km farther north than the comparative sites, with a polar desert climate (mean annual air temperature: −14.8 ± 1.3 °C and low precipitations: < 150mm yr−1; Beel et al., 2018; Lamoureux and Lafrenière, 2018). Such past permafrost history and climatic conditions (i.e., negative temperature and low precipitation) allow only limited pedological development and constitute no favorable conditions for forming mineral–OC bounds. This could partially explain why the level of OC chemical stabilization is generally low at Cape Bounty. Similar low proportions have also been reported in sediments from the Eurasian Arctic shelf, with mineral-interacting proportion of TOC of 0.5 %–22 % (Salvadó et al., 2015; TOC content = 1.4 ± 0.4 %wt) with samples collected between 70 and 80° N. García-Palacios et al. (2024) have shown conversely that higher concentrations of mineral-associated OC are found at lower temperatures, arguing a role of temperature limitation for persistence of the mineral-protected fraction of OC. This suggests that, once the mineral–OC interactions have been formed, cold can help to maintain them over time.
Permafrost peatland environments also show fairly low levels of mineral-interacting proportion of TOC, namely in 20 ± 10 % in lowland thermokarst degradations in Eight Mile Lake, Alaska (Monhonval et al., 2023) and 10 %–15 % in a palsa mire in Sweden (Patzner et al., 2020). In peatland ecosystems, however, the concentration of TOC is much higher, (e.g. 21 ± 19 %wt from Monhonval et al., 2023) and it can be assumed that the surfaces and metallic cations available for mineral–OC interactions are saturated and unable to establish further bonds (Thomas et al., 2024).
The results of aggregate and density fractionation at Cape Bounty, i.e., 64 ± 10 % of the TOC being both physically and chemically stabilized, show on the other hand proportions that are in the same range compared with the literature. By comparison, the same method applied to Siberian permafrost sediments showed a stabilization 73 ± 17 % of the TOC (Dutta et al., 2006; Gentsch et al., 2015; Martens et al., 2023). These proportions are extremely variable across the Arctic and show no latitudinal trend. Future work needs to address a systematic analysis of past and present environmental controls (e.g., soil and air temperature, precipitation, soil moisture) and edaphic controls (e.g., lithology, pH, pyrophosphate- and oxalate-extractable Fe and Al, silt and clay content) of the concentration and proportion of mineral-interacting OC. Total precipitation and effective soil moisture appear promising since they have been shown to be significant positive drivers of soil carbon accumulation in dry tundra (Klaminder et al., 2009) and mineral-interacting OC at the global scale (Kramer and Chadwick, 2018), as are silt and clay content (e.g., Georgiou et al., 2022).
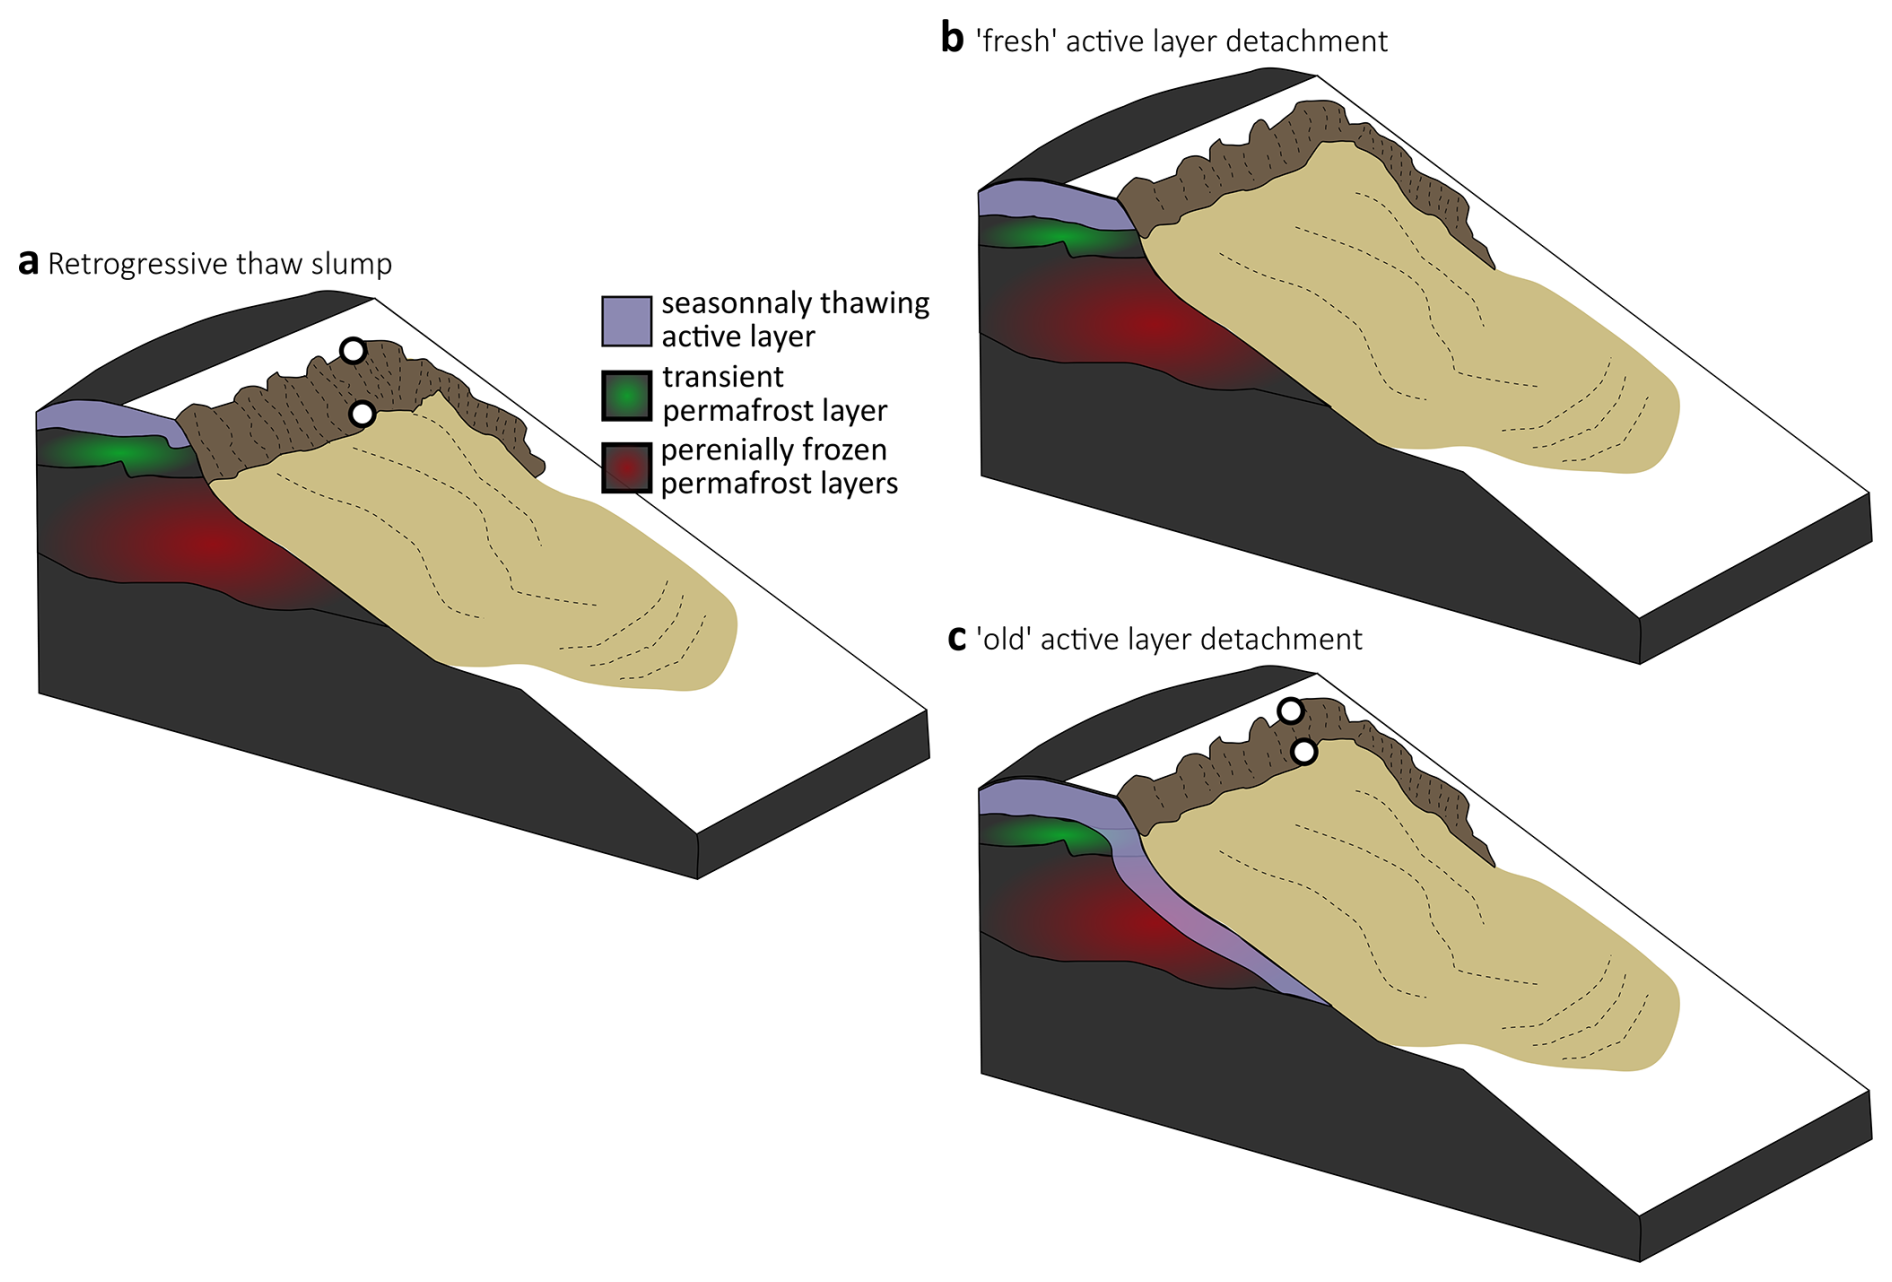
Figure 9Conceptual model of materials exposed by hillslope thermokarst structures and mineral-organic carbon (OC) interactions in surface and deep samples. (a) An active retrogressive thaw slump, whose headwall exposes fresh material every summer; (b) a “fresh” active layer detachment, i.e. in the days/months following its formation; (c) an “old” active layer detachment, i.e. several years after its formation and whose headwall has undergone freeze/thaw cycles for several years. The white dots on the outcrops (a) and (c) represent the sampling depths of the top and bottom samples.
4.2 Organic carbon exposed by the retrogressive thaw slump in deeper horizons is less protected by organo–mineral interactions
The retrogressive thaw slump at Cape Bounty exposes sediments at depth whose OC is less protected by organo–mineral interactions (Figs. 7a and 8a). In particular, organometallic complexation, an efficient mechanism for OC protection (Kleber et al., 2015; Mikutta et al., 2006), are virtually non-existent in deep sediments exposed by the RTS (RTS-D). As it happens, deep sediments in the RTS-D are also those that are rich in soluble mineral elements (Fig. 4a–c; see also Lamhonwah et al., 2017) with higher pH (Fig. 4d). For the other profiles studied (i.e., RTS-UD, ALD-D and ALD-UD), however, there was no change with depth, either for stabilized carbon (Fig. 7b–d) or for soluble elements, conductivity and pH (Fig. 4). Yet all four profiles have a similar mineralogy (Figs. C1–C4) supporting a similar lithology of the parent material. We attribute the observed trends in the RTS-D to the fact that it probably exposes sediments that were previously perennially frozen at lower depths (as they are rich in solutes) and result from a syngenetic permafrost aggradation (French, 2007; Paquette et al., 2023), thereby limiting pedological development and the potential to form organo–mineral interactions. The retrogressive nature of a thaw slump guarantees exposure to this type of fresh sediment every summer until the slump is no longer active (Fig. 9a).
This is in agreement with the conclusion drawn at the Peel Plateau in Canada (Thomas et al., 2023) and in the Batagay thaw slump in Siberia (Thomas et al., 2024), where shallowest soils and sediments show significantly higher Cp concentrations than deep sediments, for which pedological development has been limited. Historical permafrost thaw dynamics therefore appear to be a first-order factor dictating the concentration of stabilized OC in a given sediment type. Data gathered in this study therefore confirm that thaw slumps, which are likely to develop more intensively in the future (Kokelj et al., 2015, 2021), will potentially further expose masses of deep OC that is less well protected by organo–mineral interactions. We can point out that this limited protection in deep horizons is driven by Cp and, at Cape Bounty, is partially offset by a higher concentration of Camorph (Sect. 3.3). As Camorph constitutes only a minor fraction of the TOC pool however, its offsetting effect is negligible (Figs. 7a and 8a).
We would argue that materials exposed by the ALD are sediments that have undergone multiple freeze-thaw cycles since the ALD development in 2007 up to the sampling in 2018. Therefore, the exposed materials in the ALD headwall have thawed for several summers in a row. In addition, in 2018, the active layer thickness at the time of the sampling was lower (i.e., ∼ 0.6 m on average) due to low summer temperatures (Beel et al., 2021) than average active layer thickness (i.e., 0.75–1.0 m) from previous years (Lamoureux and Lafrenière, 2018) (Fig. 9b and c).
Using a mass balance approach, we can derive a first order estimate of the OC stock exposed by the ALD and the RTS per square meter of exposed horizontal surface area and for the entire headwall. Assuming an excess ice content of 50 % for depths ≥ 60 cm (Lamhonwah et al., 2016) and dry bulk densities of 1.53 g cm−3 for depths of 0–7 cm, 1.55 g cm−3 for depths of 7–26 cm, 1.67 g cm−3 for depths of 26–46 cm, and 1.71 g cm−3 for depths greater than 46 cm (Stanton, 2023), it appears that the RTS exposes a greater stock of OC than the ALD (∼ 13.5 kg m−2 for RTS-D versus ∼ 9.8 kg m−2 for the ALD-D; Fig. D8). This besides supports evidence that the proportion of OC stabilized in sediments exposed by the RTS is lower than that of the ALD (∼ 17.2 % for the RTS-D versus ∼ 18.4 % for the ALD-D; Fig. D8). It is worth pointing out that OC stocks exposed at Cape Bounty are quite low compared to OC stocks exported by thaw slumps such as at the Peel Plateau (∼ 150 to ∼ 400 kg m−2; Thomas et al., 2023) or Batagay (∼ 460 kg m−2; Thomas et al., 2024), which is mainly due to the shallow headwall heights in Cape Bounty.
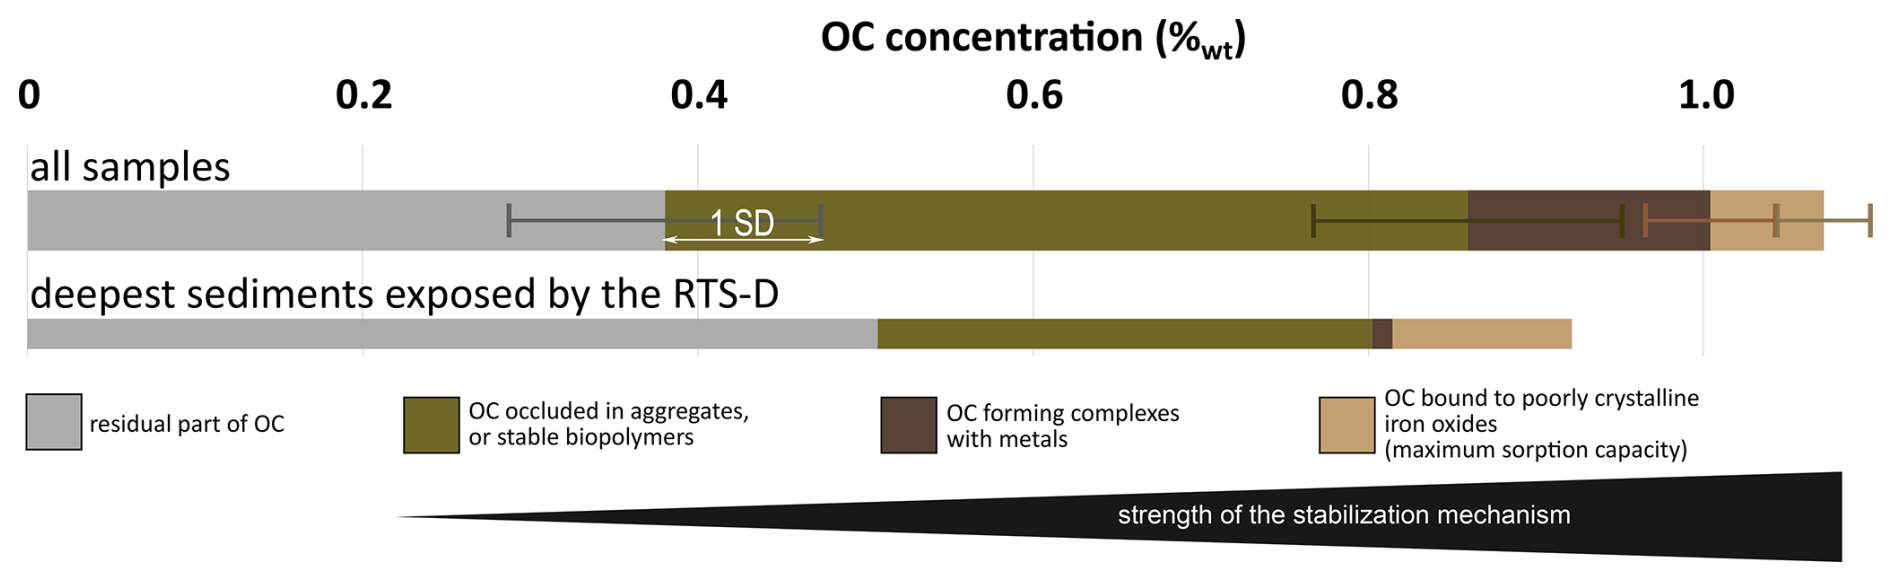
Figure 10Individual organic carbon (OC) pools at Cape Bounty. Average concentrations and standard deviations (SD) of the physically and chemically extracted OC pools on all samples (n = 8) compared to the deepest sediments exposed by the retrogressive thaw slump (RTS-D). The color-coding of the OC targeted pools matches those of the selective extractions shown in Fig. 2.
4.3 Physical and chemical mechanisms of mineral-organic carbon interactions at Cape Bounty: implications for the organic carbon stability
Measurements of the proportion of OC stabilized through mineral–OC interactions greatly differ between the selective extractions protocol (20 ± 4 %; Fig. 7) and the aggregate and density fractionation protocol (64 ± 10 %; Table E1; Fig. 8). One could therefore argue that chemical extractions (pyrophosphate and oxalate) greatly underestimate the proportion of OC that is stabilized in the sediments at the Cape Bounty. Yet, these two protocols do not target the same pools of OC. Chemical extractions target (i) organometallic complexes via pyrophosphate and (ii) organometallic complexes and OC bound through adsorption onto mineral surfaces such as poorly crystalline iron oxides via oxalate (Fig. 2). These two chemical extractions only include small fragments of biopolymers, which are fully dissolved during extraction. Large fragments of biopolymers can also be stabilized by complexation or adsorption, but will not be soluble and therefore not measured in the oxalate or pyrophosphate extract, due to centrifugation. Density fractionation, on the other hand, targets both (i) the same pool as chemical extractions, but also (ii) the OC occluded within the aggregates of various sizes as well as all organic molecules sharing chemical bounds with minerals (even the large fragments of biopolymers that are not completely dissolved by the extractants). The different pools of OC at Cape Bounty and the associated stabilization mechanisms can be summarized as follows:
- i.
up to 6 ± 2 % of the TOC is stabilized through adsorption of organic molecules onto poorly crystalline iron oxides (Camorph; Fig. 10). This is calculated based on a maximum sorption capacity of 0.22 gOC gas ferrihydrite (Wagai and Mayer, 2007; Feo−Fep) and therefore reflects the difference between oxalate and pyrophosphate extractions (Fig. 2b). The mechanism involves the attachment – by ligand exchange – of organic molecules to metal atoms (Al, Fe) structurally present in the minerals (Fig. 2a). The chemical links are coordinate covalent bonds, which provide the longest residence times in soils (Cui et al., 2014; von Lützow et al., 2006; Mikutta et al., 2006), i.e., more than 100 years, or even millennia (Kleber et al., 2015) under stable physico-chemical conditions (pH, redox), as poorly-crystalline surfaces are among the most effective sorbents for dissolved OC (e.g., Kaiser et al., 1997).
- ii.
13 ± 5 % of the TOC is stabilized in the form of complexes (Cp; Fig. 10), and represents the pool extracted with pyrophosphate (Fig. 2b). This mechanism involves the formation of cation bridges between organic matter and negatively-charged mineral surfaces (such as smectites) via electrostatic interactions; or the formation of cation bridges between molecules of organic matter of various sizes via electrostatic interactions or coordinate covalent bond (Fig. 2a). The mechanism of interaction with polymeric metal species is also one of the most important for preservation of OC (Cui et al., 2014; Kleber et al., 2015; von Lützow et al., 2006; Mikutta et al., 2006) and provides residence time in soils up to hundreds of years (Kleber et al., 2015; von Lützow et al., 2006) under stable pH and redox conditions.
- iii.
45 ± 8 % of the TOC is either occluded in aggregates, or in the form of chemically stabilized large fragments of biopolymers that are not completely dissolved by the pyrophosphate and oxalate extractants (Figs. 10 and 2b). The distinction between the two cannot be made here. This is calculated as the difference between the mineral-interacting OC obtained by the protocol of soil aggregate and density fractionation and the mineral-interacting OC obtained via chemical extractions (Cp + Camorph). It should be pointed out that the portion of OC occluded in aggregates is stabilized by being not easily accessible to microorganisms, but there are no chemical links between organic molecules and mineral surfaces or metallic cations (Fig. 2a). This pool is therefore stabilized, but to a lesser extent than in the chemically-extracted pools. Specifically, the physically occluded pool appears to be highly sensitive to physical disturbance in cultivated soils (Bischoff et al., 2017; Cui et al., 2014; von Lützow et al., 2006) and of relatively low importance in Pleistocene permafrost samples (Martens et al., 2023), although the number of relevant studies in permafrost environments is limited and further research is essential.
- iv.
36 ± 10 % of the TOC is a pool of free particulate OC, not being stabilized through interactions with minerals but could be recalcitrant to microbial decomposition, therefore being persistent, depending on intrinsic properties of organic molecules, diversity of microbial communities and functional traits, stoichiometry constrains and abiotic factors (Derrien et al., 2023; Figs. 10 and 2).
Chemical stabilization mechanisms targeting small fragments of biopolymers therefore account for a relatively small proportion of the TOC (20 ± 4 %) but likely support residence times spanning hundreds to thousands of years with no drastic environmental changes (e.g., pH, redox, organic matter inputs, etc.). This proportion may be underestimated, as it does not take into account associations with calcium (Rowley et al., 2025). In contrast, stabilization of larger molecules via chemical bonds or physical protection within aggregates involve a comparatively larger fraction (45 ± 8 %) of TOC, though the residence times of aggregates could be expected to be much shorter, typically on the scale of decades.
The average figures presented above do not reflect the signature of the deep horizon exposed by the thaw slump (RTS-D). For this horizon, the OC bound to poorly crystalline oxides contributes twice as much as the average (12 % of TOC; Fig. 10), but this is offset by the virtual absence of OC forming complexes with metals (1 % of TOC; Fig. 10) and by the low contribution of OC occluded in aggregates or in stable large fragments of biopolymers (32 % of TOC; Fig. 10). Consequently, more than half of the TOC is in the form of free particulate organic carbon in this horizon, meaning that the thaw slump exposes potentially more labile OC (Fig. 10). We attribute this to the limited pedological development in this horizon (Sect. 4.2), yet the actual fate of this OC after material export from the thaw slump headwall remains uncertain. Thomas et al. (2023) showed that the pools of Cp + Camorph were well preserved in materials exported by thaw slumps in the Peel Plateau in Canada. This supports that, although limited, this mineral-interacting OC can be expected to be well protected over the long term if the physico-chemical conditions do not change. It should be noted, however, that pH or redox changes – e.g. caused by water saturation – would be likely to cause a release of mineral-bound OC (Monhonval et al., 2023; Patzner et al., 2020). Yet, hillslope thermokarst landforms are generally located on well-drained terrains leading to redox conditions considered, arguably, as oxic and relatively stable (Abbott and Jones, 2015). Since thaw slumps expose deep poorly weathered material at depth, a substantial decrease in pH, which would induce dissolution of Al-OC bonds, is unlikely at Cape Bounty, where pH levels are close to neutral (Fig. 5d and h). The fate of the sediments carried downstream from the headwall and into the debris tongues remains yet unclear, and further research needs to evaluate mineral–OC interactions along the sediment cascade of materials exported by thaw slumps.
Our study leads to the following conclusions:
-
At the Cape Bounty, chemical stabilization mechanisms targeting small fragments of biopolymers account for 13 ± 5 % of total organic carbon in the form of complexes and up to 6 ± 2 % associated with poorly crystalline iron oxides. These results are in the low range compared to other studies conducted on organo–mineral interactions in the Arctic, possibly attributable to temperature and humidity conditions at the Cape Bounty that are not favorable to the formation of organo–mineral interactions at this latitude.
-
Deep organic carbon exposed by the retrogressive thaw slump is significantly less stabilized by organo–mineral interactions. The retrogressive thaw slumps are therefore expected to expose sediments in which organic carbon is more prone to decomposition.
-
Only about one-fifth of the total organic carbon (20 ± 4 %) is in the form of small fragments of biopolymers stabilized through strong associations with minerals, yet this fraction likely persists the longest in soils. Physical protection, which traps carbon within aggregates or large, chemically stable molecules, accounts for a larger portion (45 ± 8 %) and spans a wider variety of carbon forms.
While the data presented in this study have been put into perspective with the available literature, the conclusions are limited to four distinct profiles. Such studies on headwalls and materials exported by thaw slumps or active layer detachments should receive more attention from the scientific community, and should include structures of various sizes and morphologies, at different latitudes and with contrasting development dynamics.
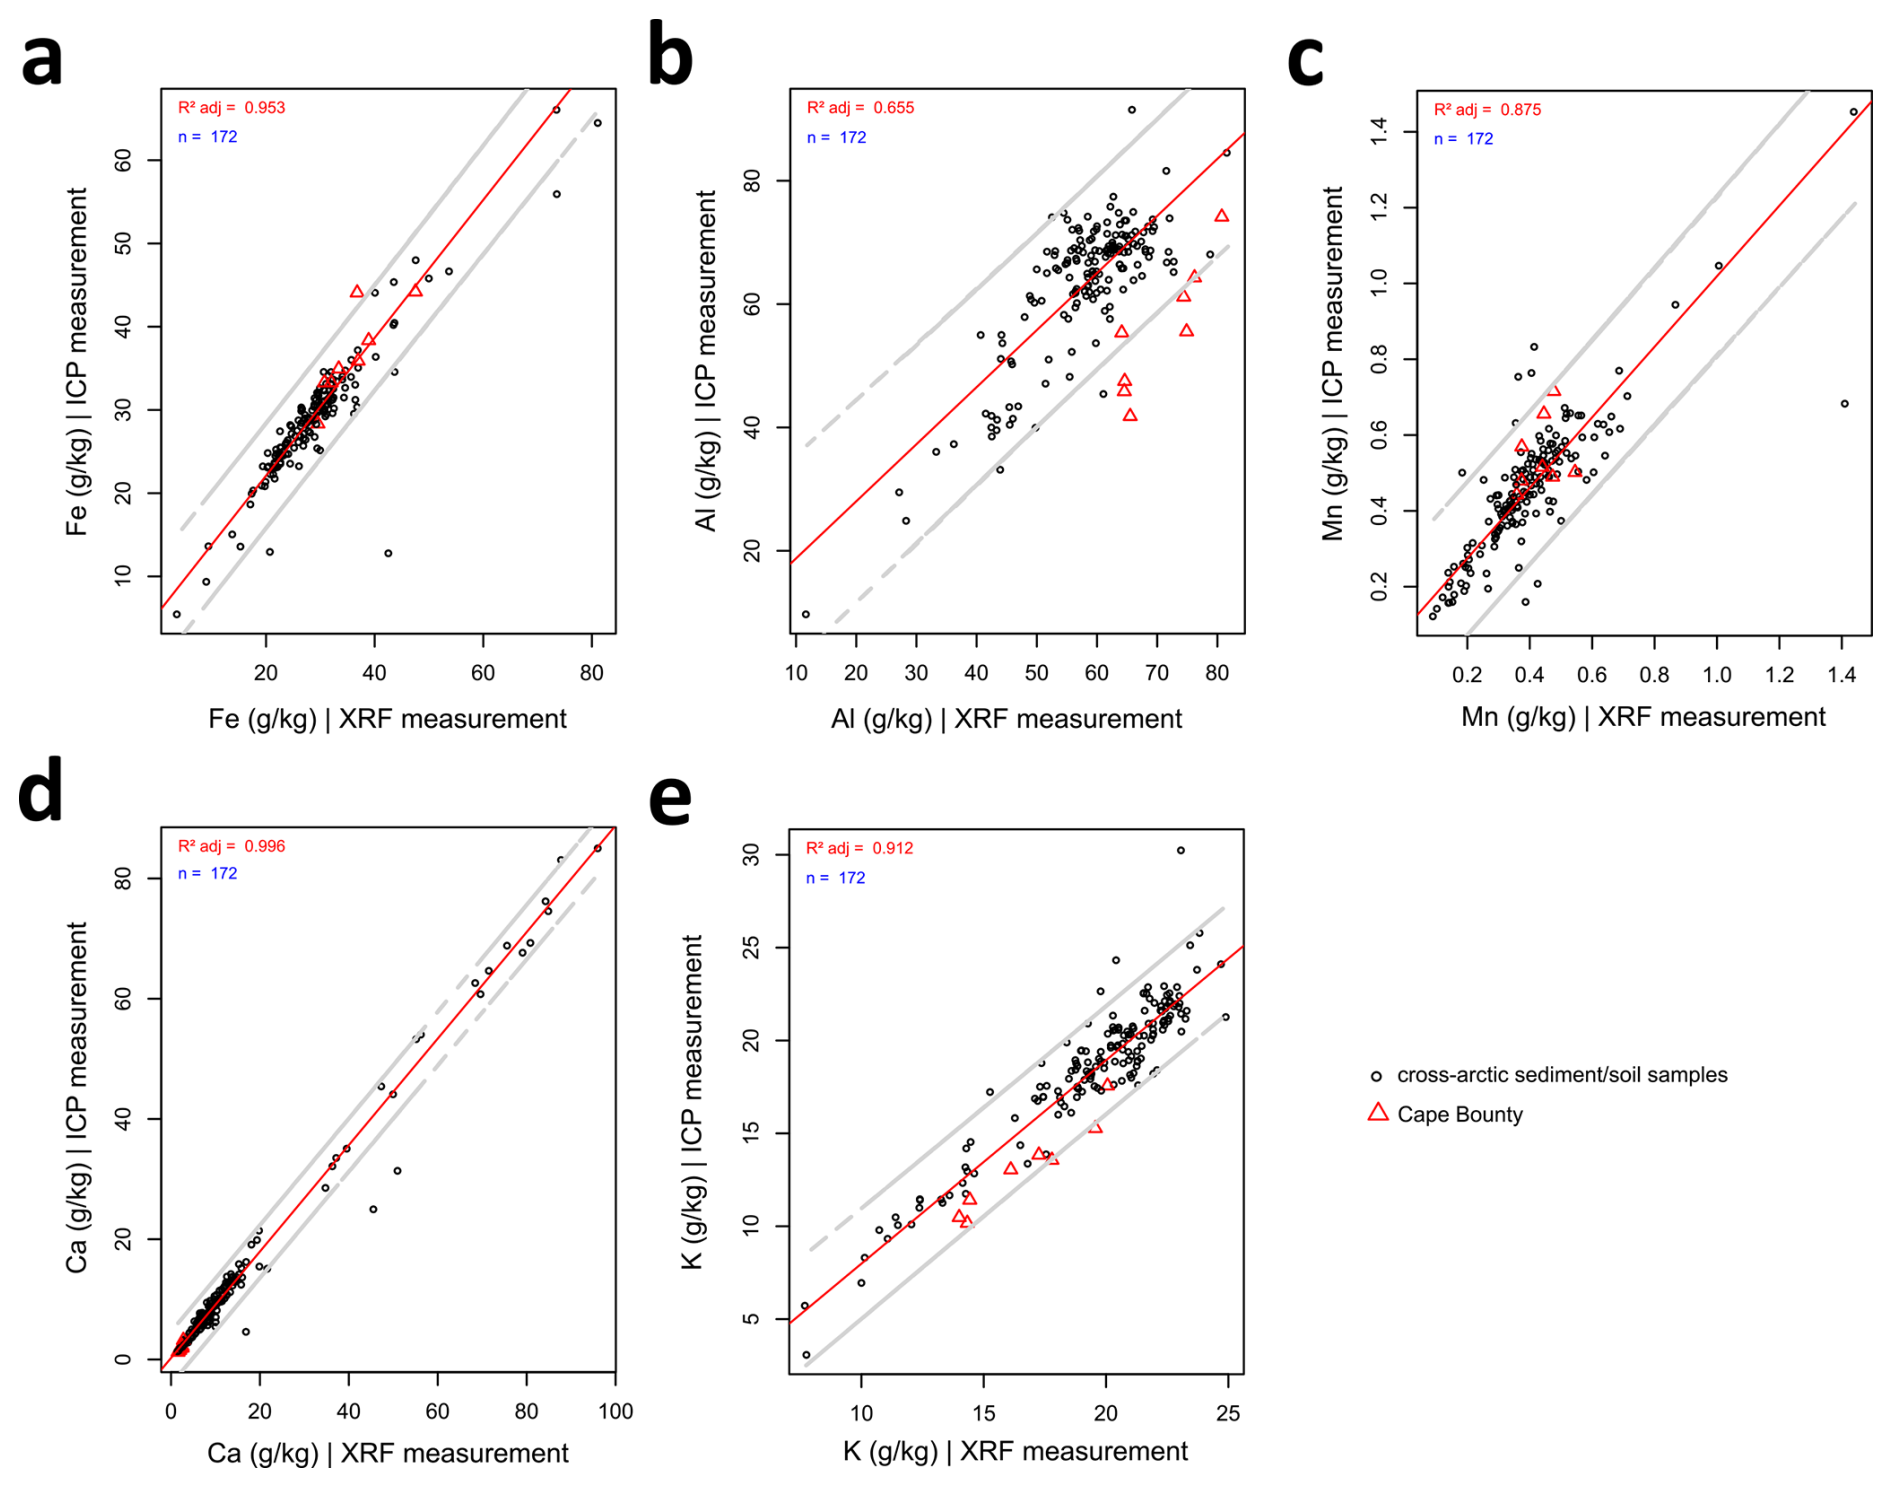
Figure A1Total concentrations in Fe (a), Al (b), Mn (c), Ca (d) and K (e) measured by inductively coupled plasma optical-emission spectrometry (ICP-OES) as a function of those measured by the portable X-ray fluorescence (pXRF). Cross-arctic measurements include data from the yedoma domain (Monhonval et al., 2021b) and include samples from Khardang Island (n = 1), Kurungnakh Island (n = 2), Sobo sise Island (n = 58), Bykovsky peninsula (n = 2), Buor Khaya peninsula (n = 44), Stolbovoy Island (n = 1), Bol'shoy lyakhovsky Island (n = 3), Oyogos Yar coast (n = 1), Kytalyk (n = 4), Duvanny Yar (n = 5), Yukechi (n = 2), Kitluk (n = 2), Baldwin peninsula (n = 1), Colville (n = 8) and Itkillik (n = 10). Other samples originate from Zackenberg (n = 4) (Opfergelt et al., 2018), Peel Plateau (n = 3) (Thomas et al., 2023), Batagay (n = 14) (Thomas et al., 2024) and from Cape Bounty (n = 8; this study). 95 % prediction intervals are presented in grey.
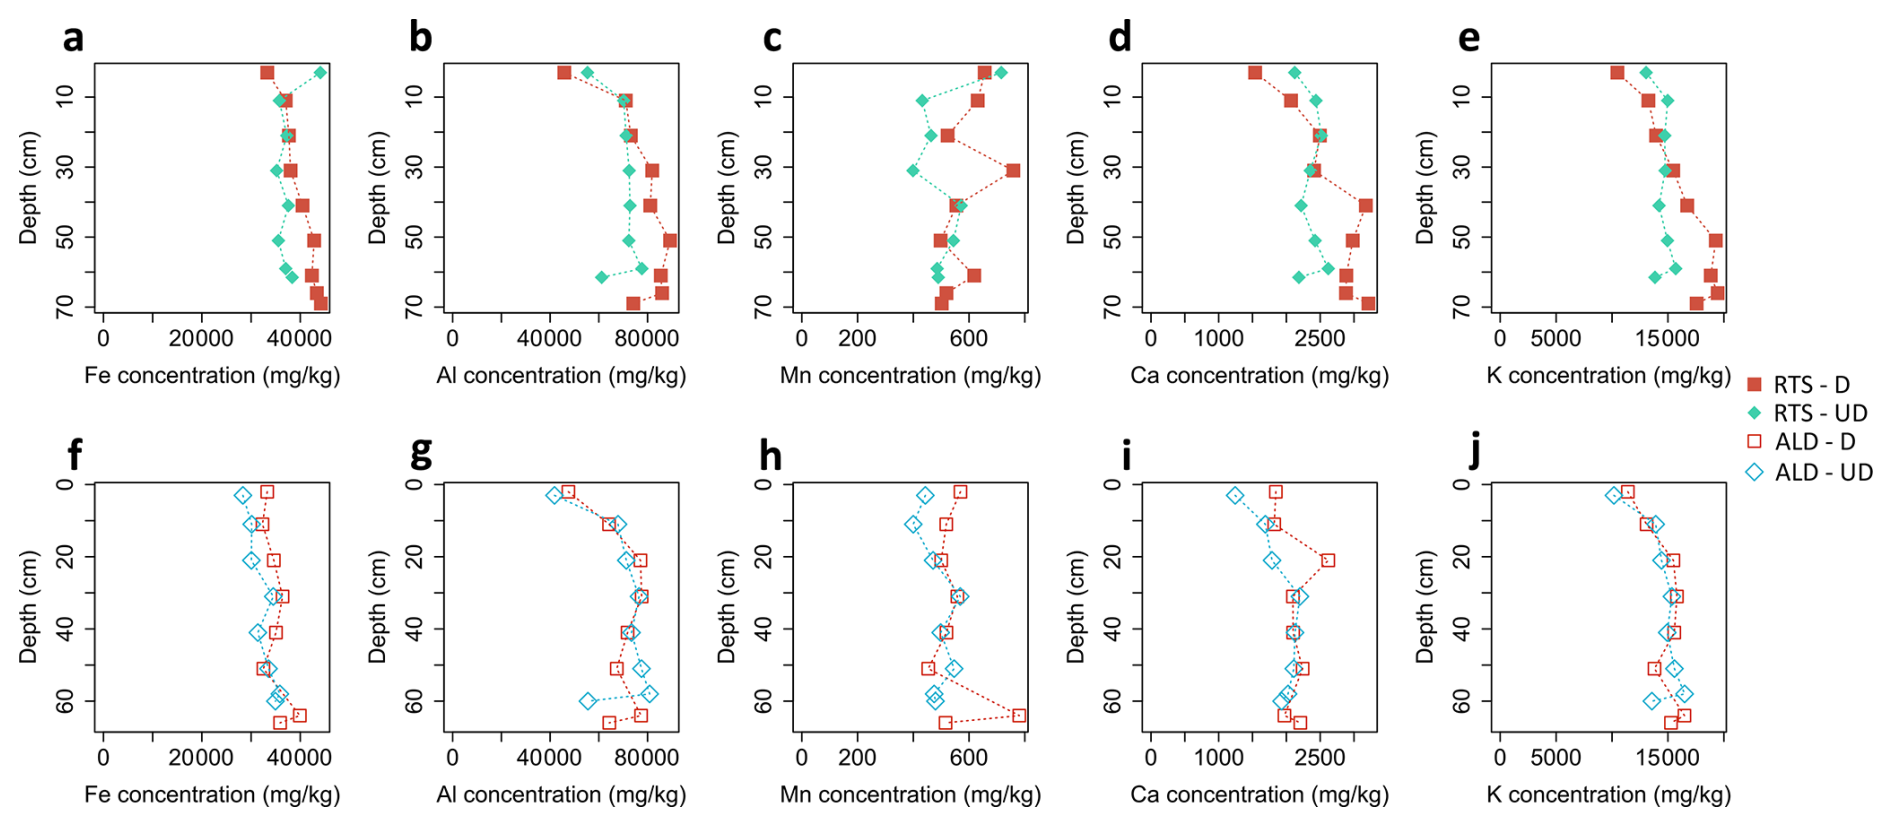
Figure B1Total concentrations in Fe, Al, Mn, Ca, and K as a function of depth for (a–e) the retrogressive thaw slump (RTS; top row, filled symbols) and (f–j) the active layer detachment (ALD; bottom row, outline symbols). The modalities “disturbed” (D) are drawn in red and the modalities “undisturbed” (UD) are drawn in blue.
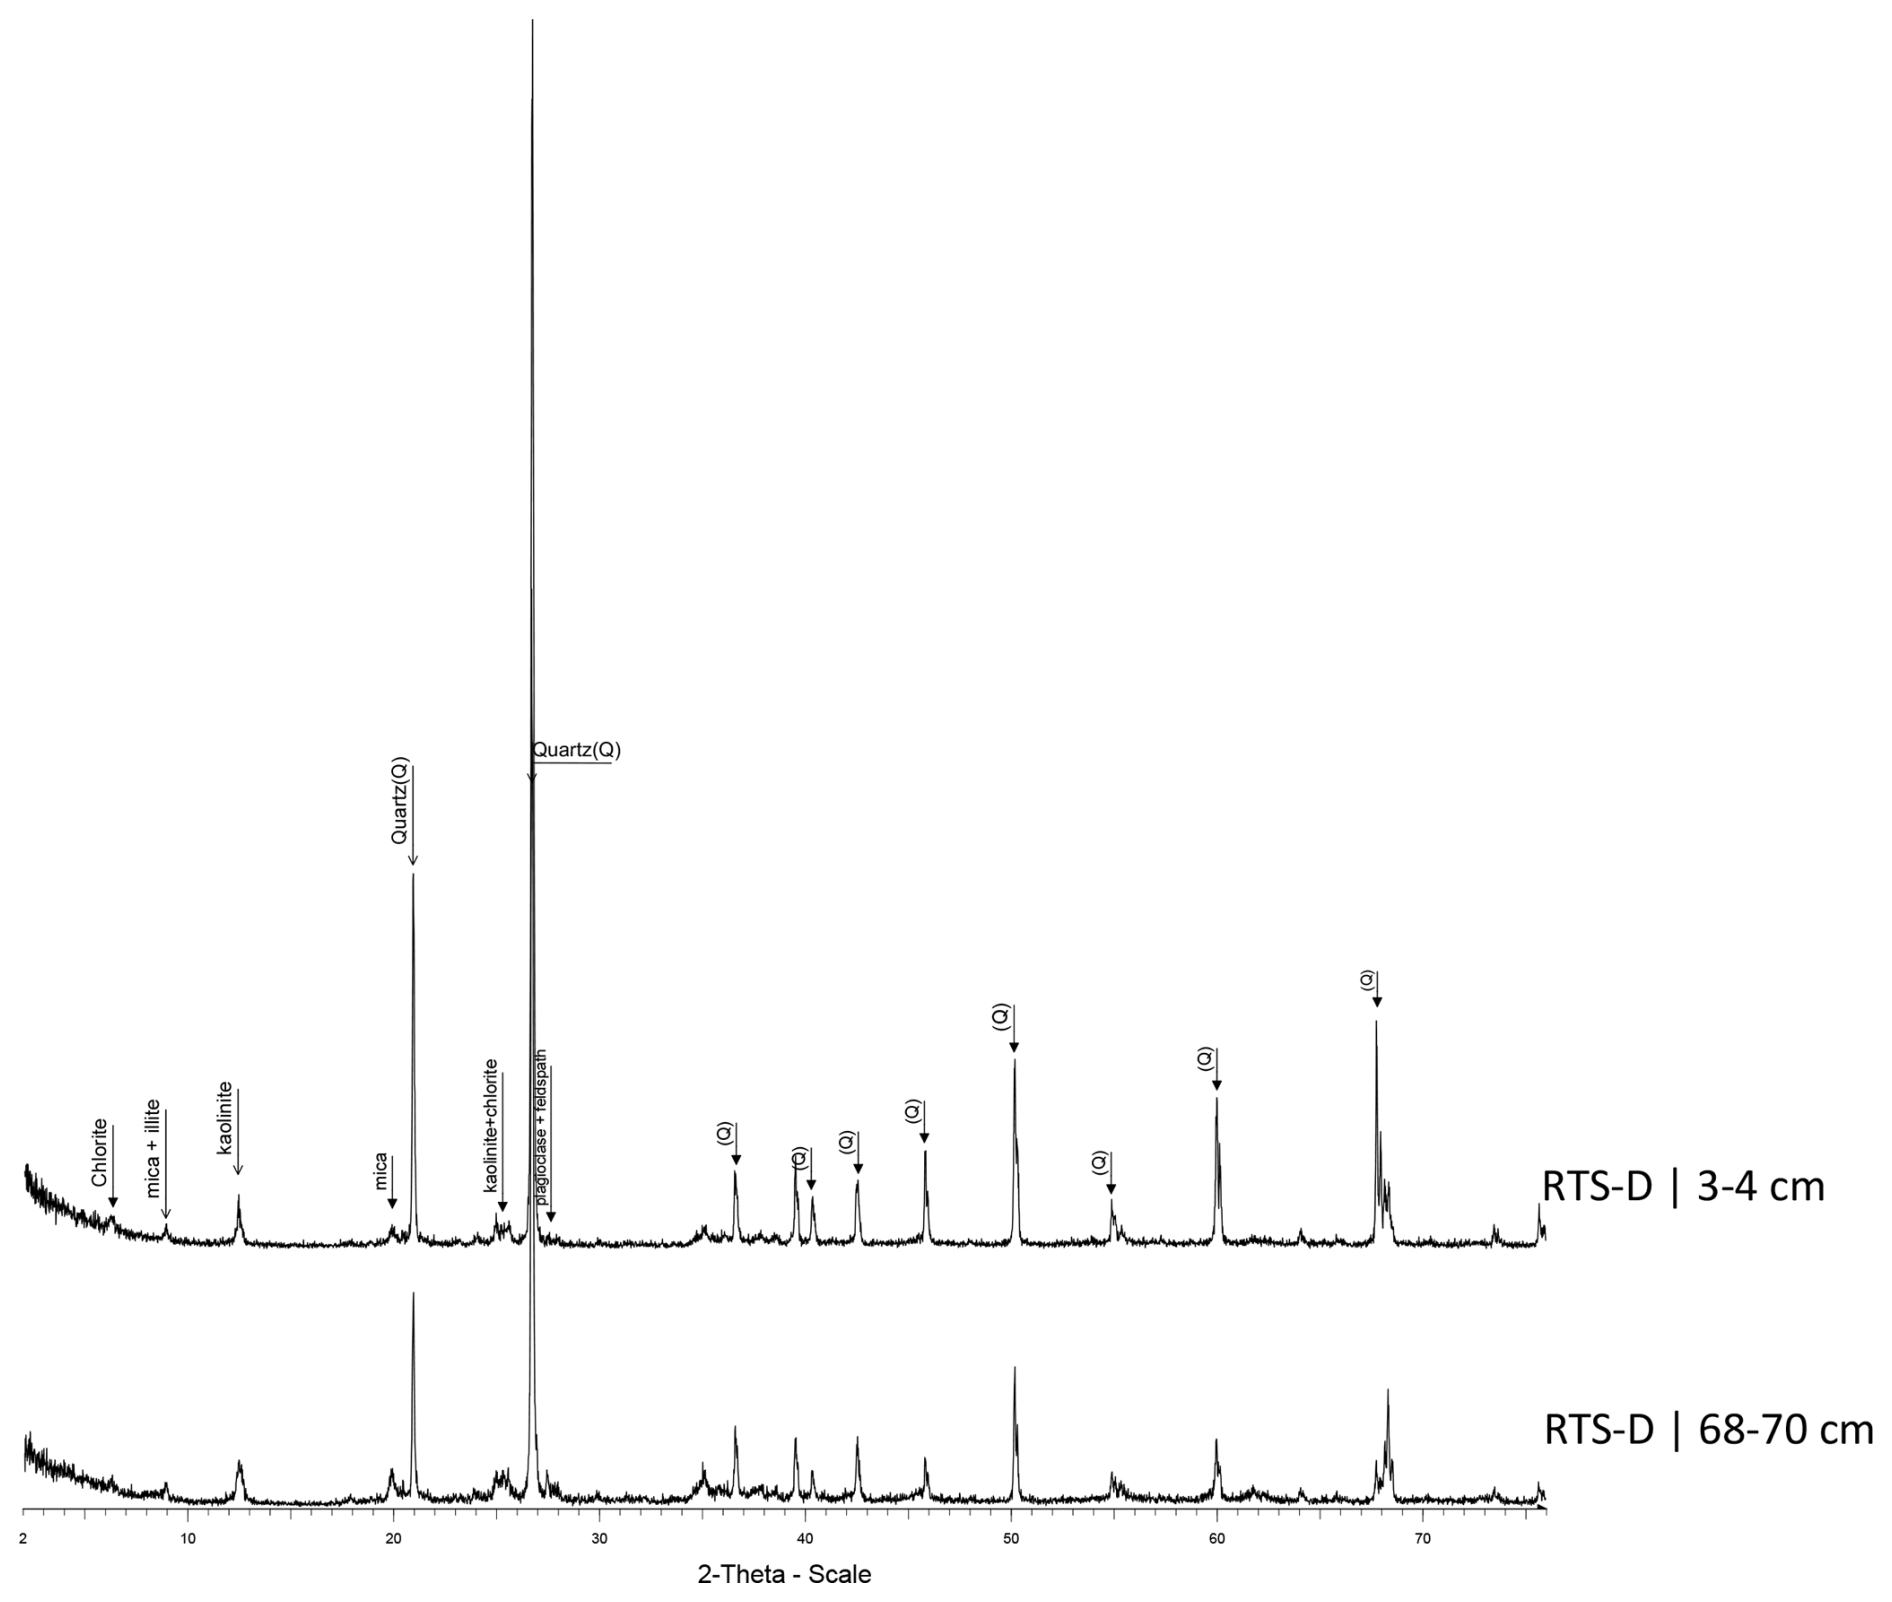
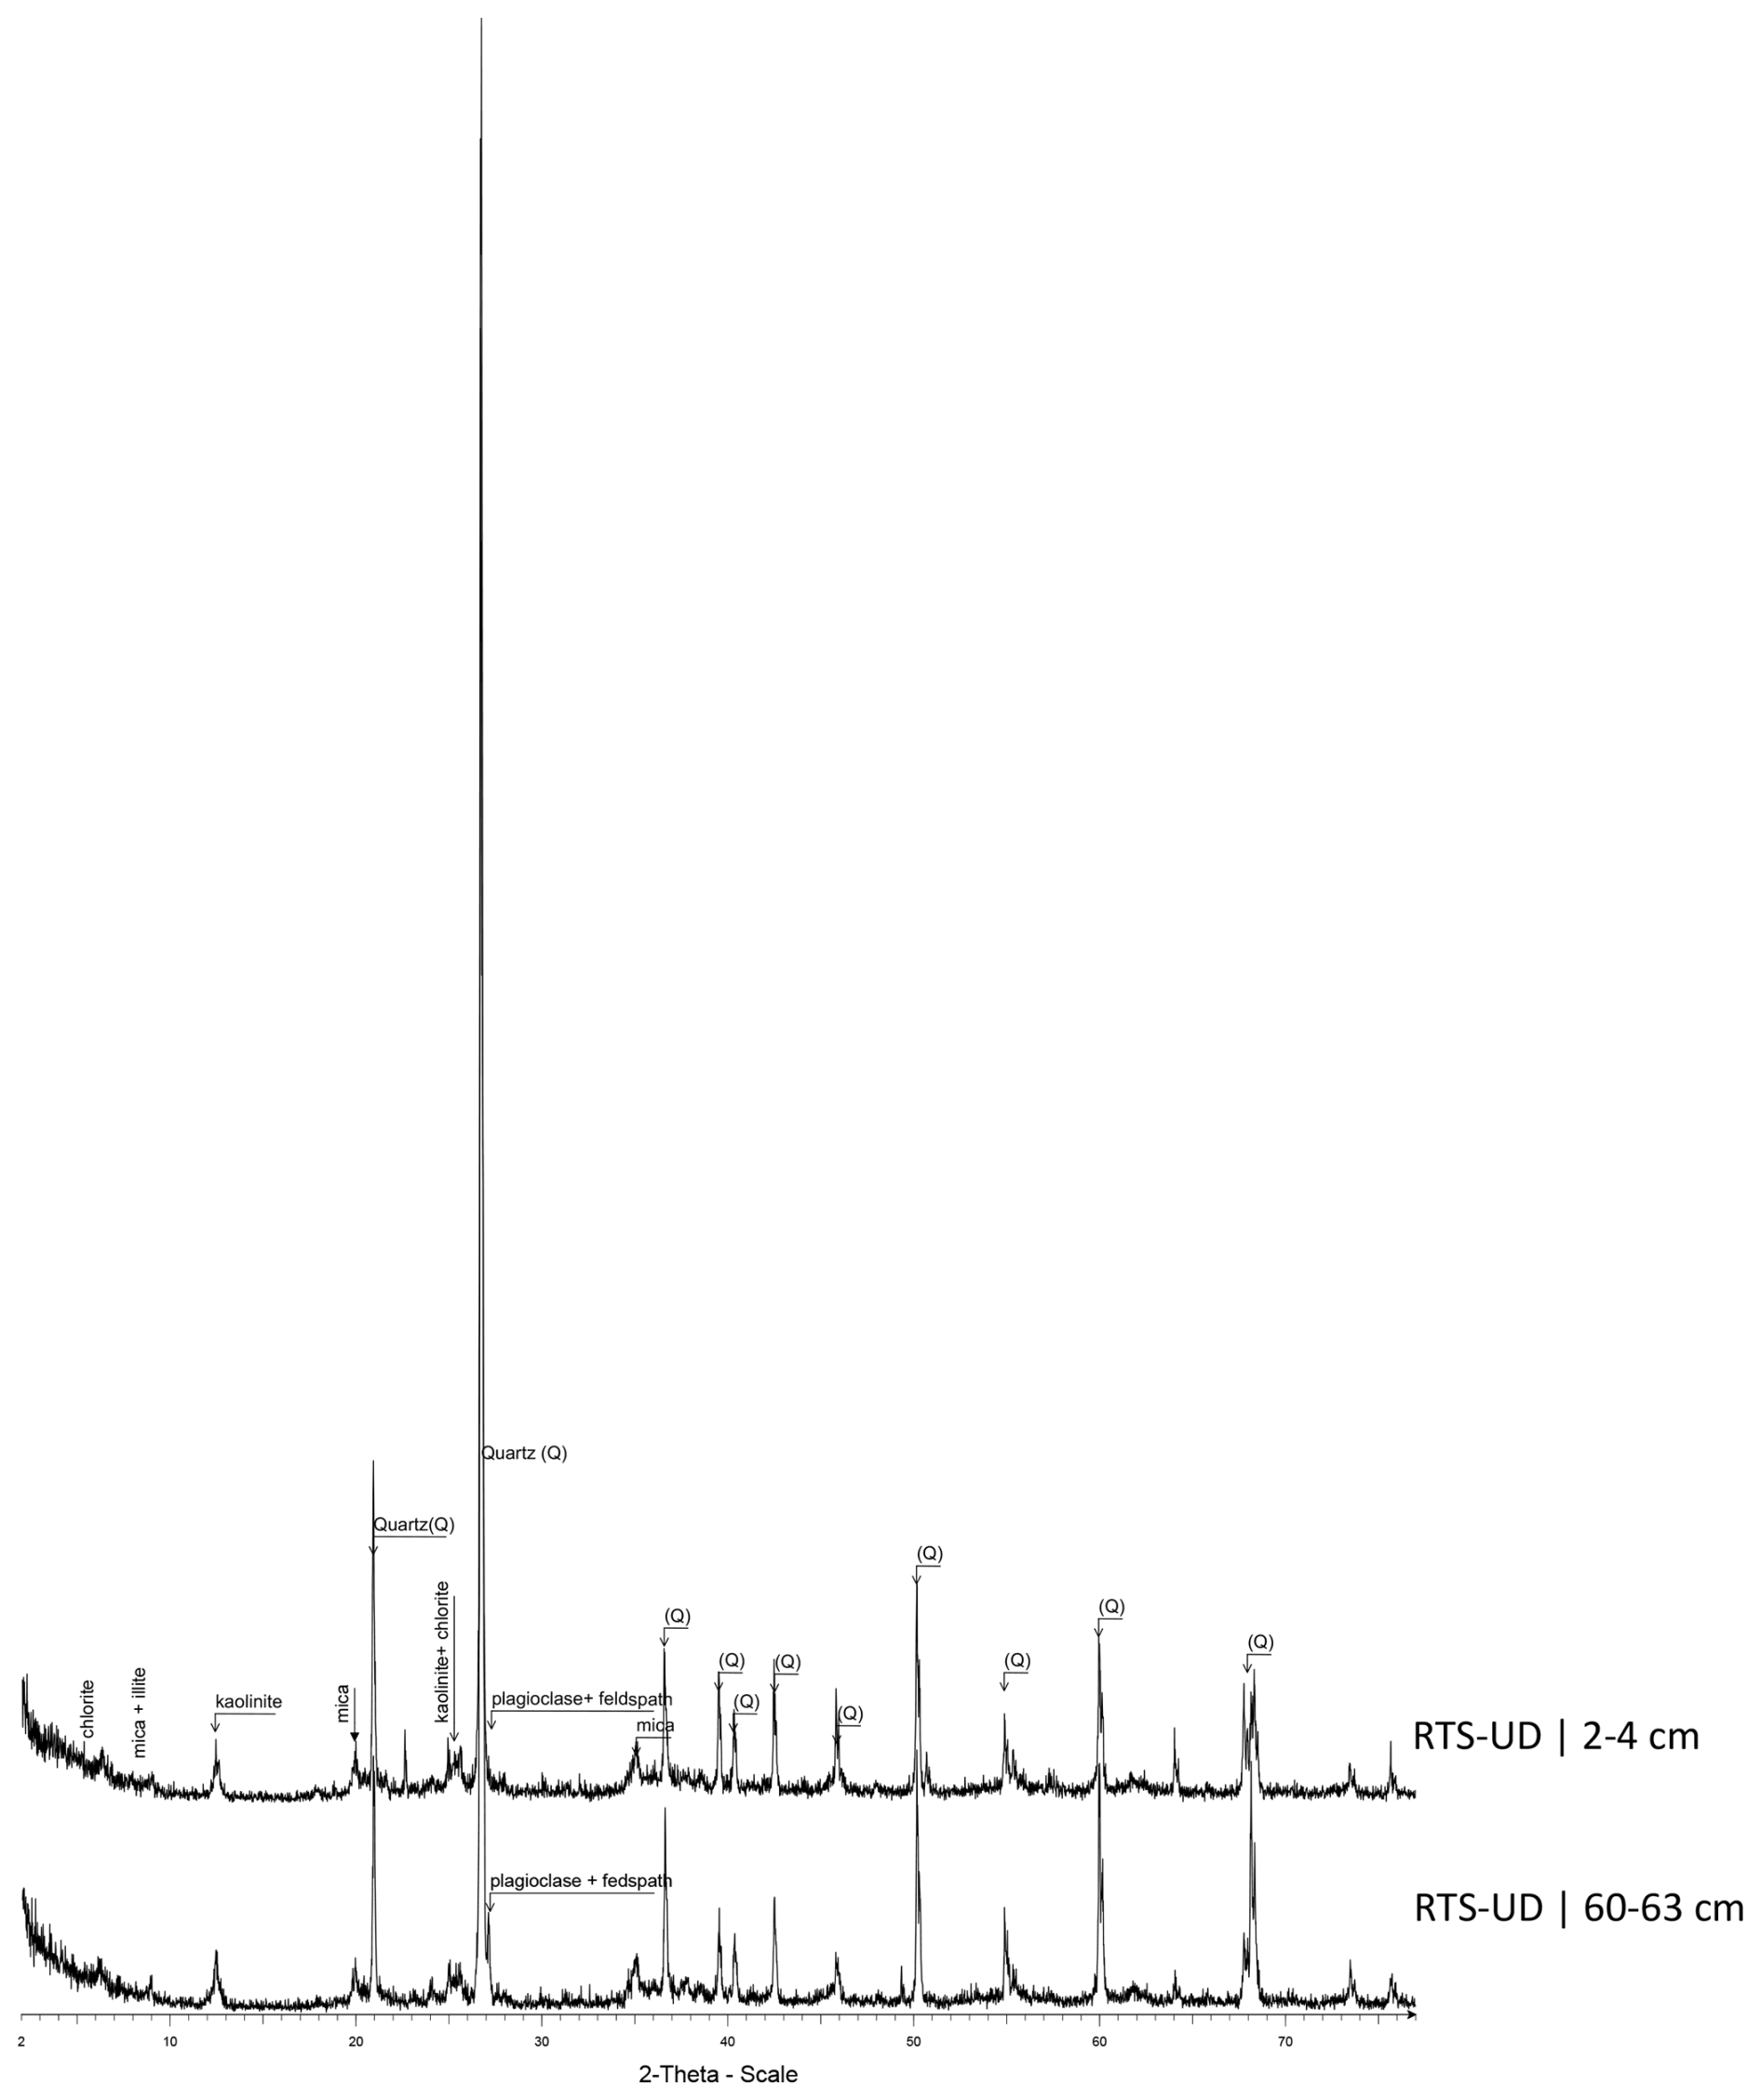
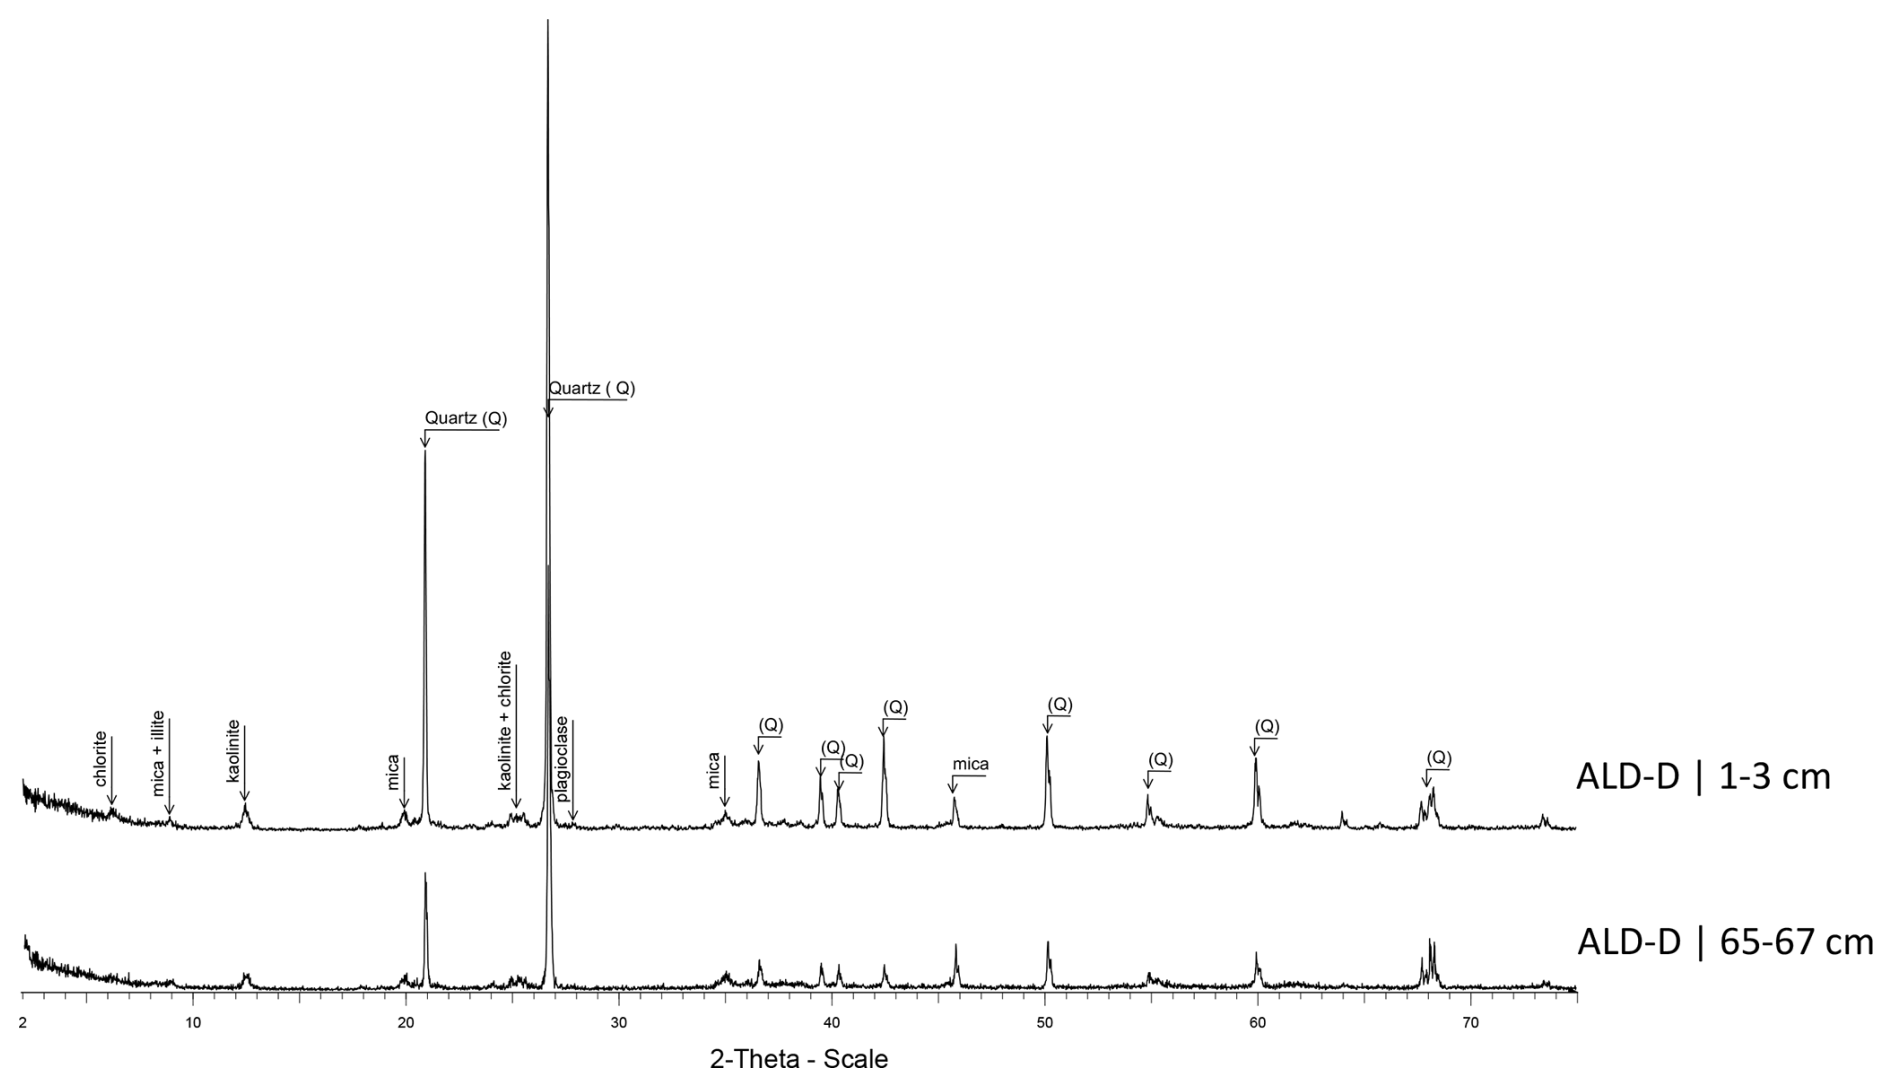
Figure C3Diffractograms for Cape Bounty active layer detachment in the disturbed profile (ALD-D).
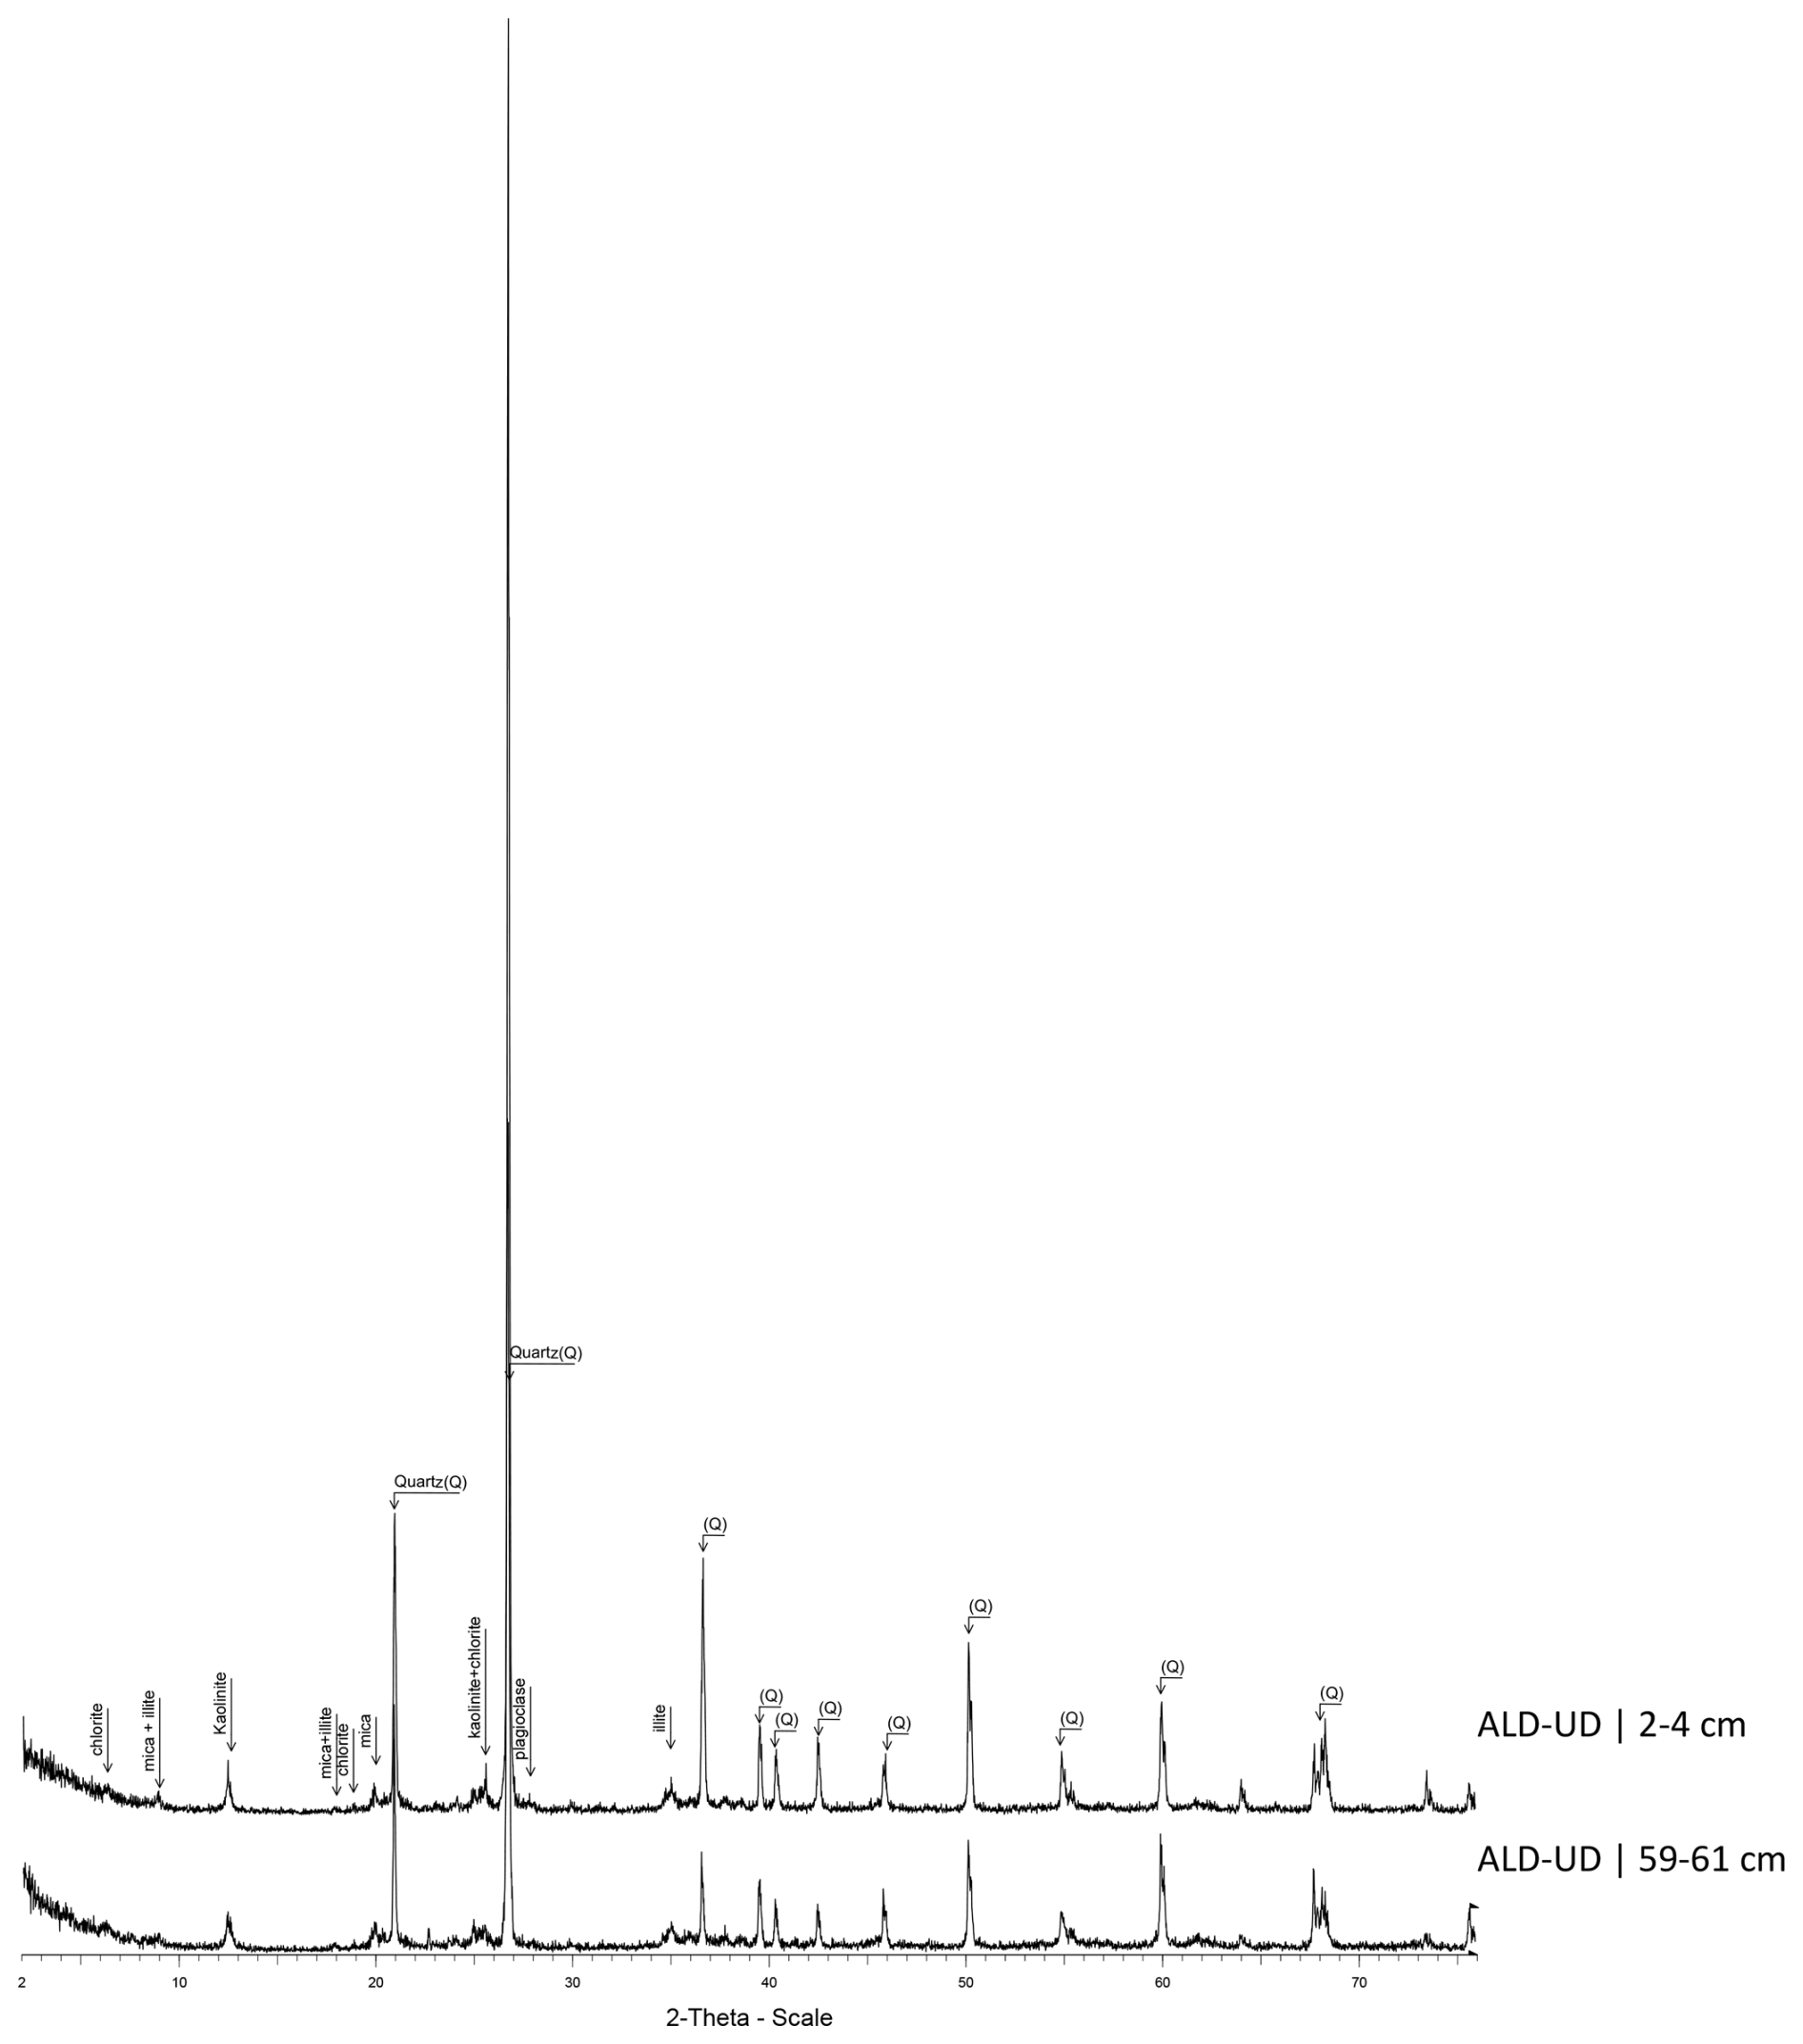
Figure C4Diffractograms for Cape Bounty active layer detachment in the undisturbed profile (ALD-UD).
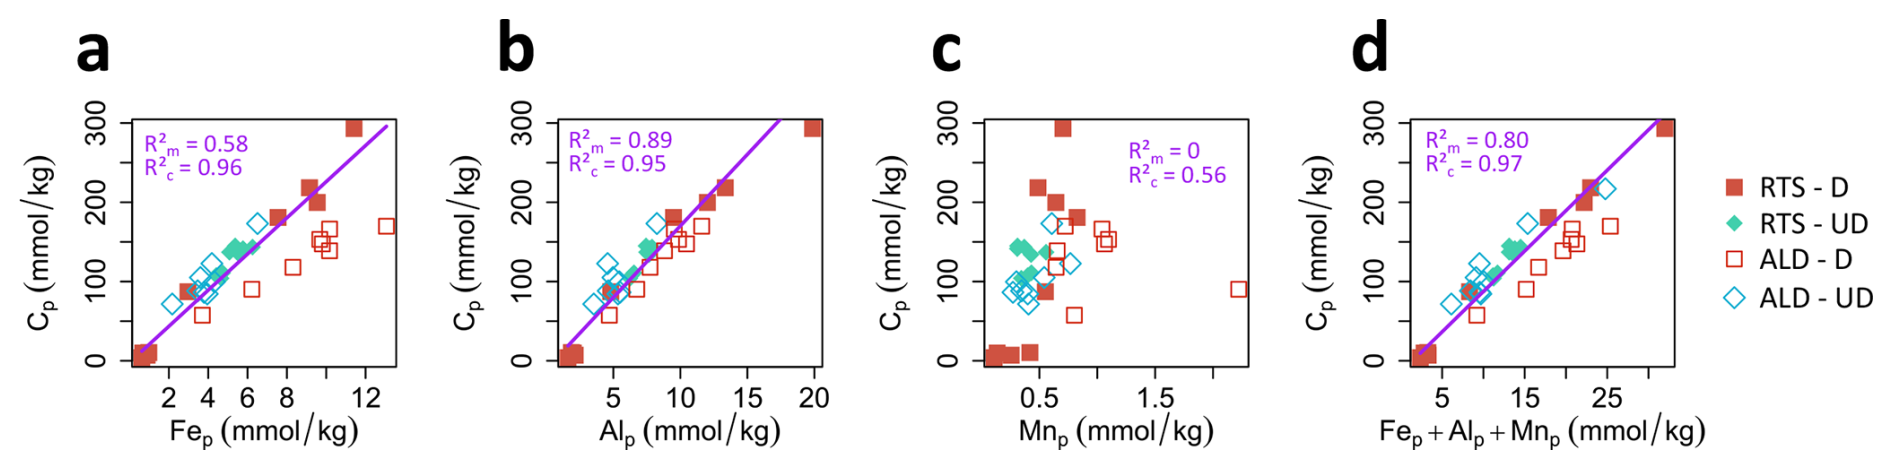
Figure D1Robust linear regression plots between carbon extracted by pyrophosphate (Cp) and (a) Fe extracted by pyrophosphate (Fep); (b) Al extracted by pyrophosphate (Alp); (c) Mn extracted by pyrophosphate (Mnp); (d) sum of metal complexes (Fep + Alp + Mnp). RTS = retrogressive thaw slump; ALD = active layer detachment; D = disturbed; UD = undisturbed. Color code as in Fig. 5. The variable “profile” (RTS-D, RTS-UD, ALD D, ALD UD) have been included as a random factor, with random intercept and slope. The marginal R2 (), represents the population-level trend (variance explained by fixed effects). The conditional R2 () have been included to account for both fixed and random effects and reflects total model performance.
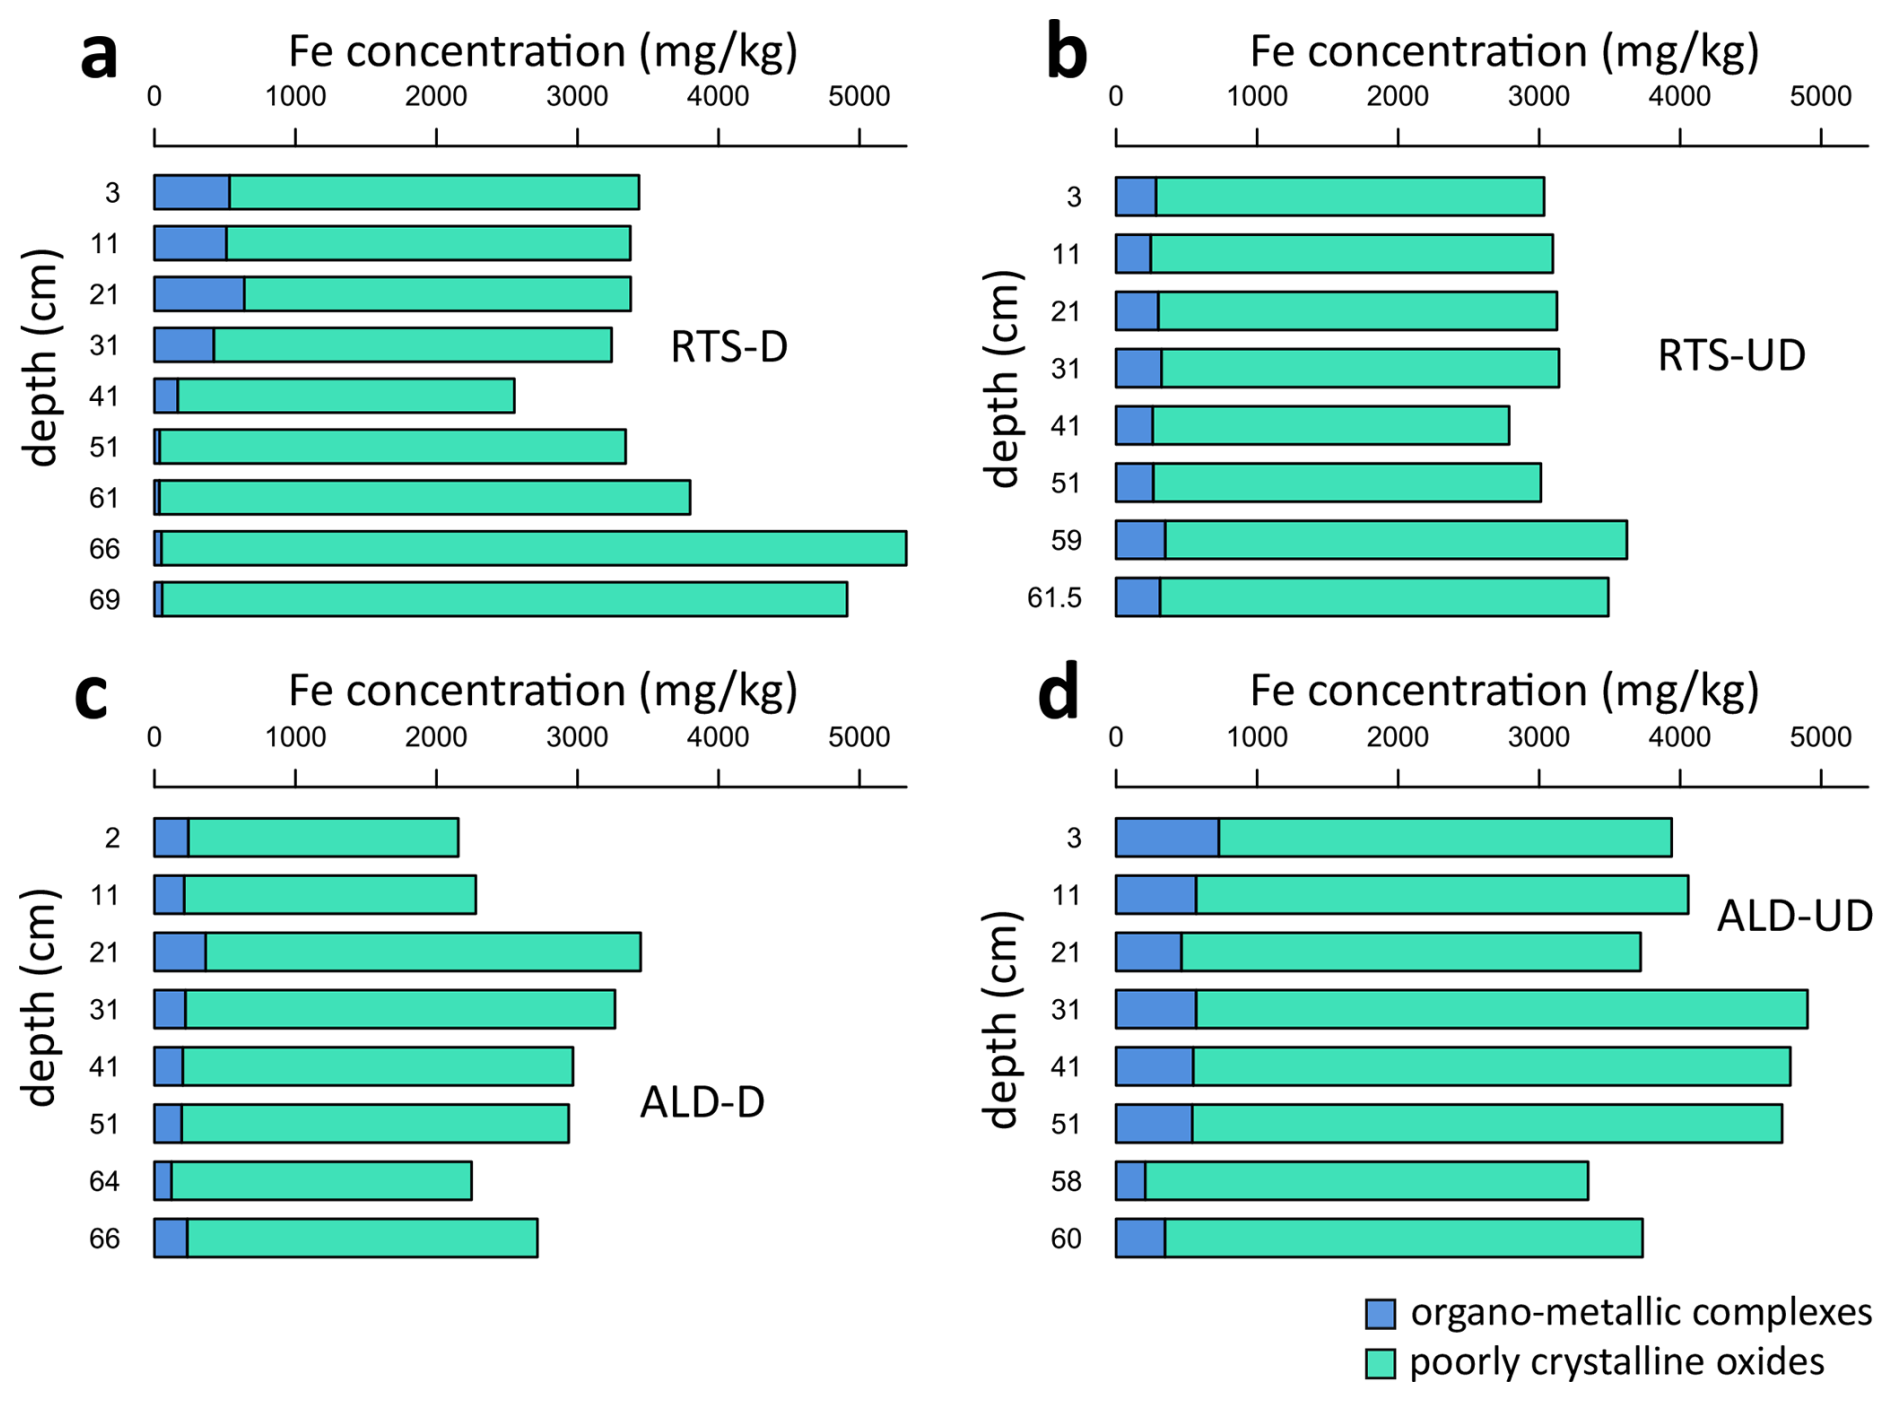
Figure D2Evolution with depth of Fe in the form of organo–metallic complexes (Fep) and poorly crystalline oxides (Feo−Fep) for (a) sediments exposed by the retrogressive thaw slump (RTS-D); (b) the corresponding undisturbed profile (RTS-UD); (c) sediments exposed by the active layer detachment (ALD-D); (d) the corresponding undisturbed profile (ALD-UD).
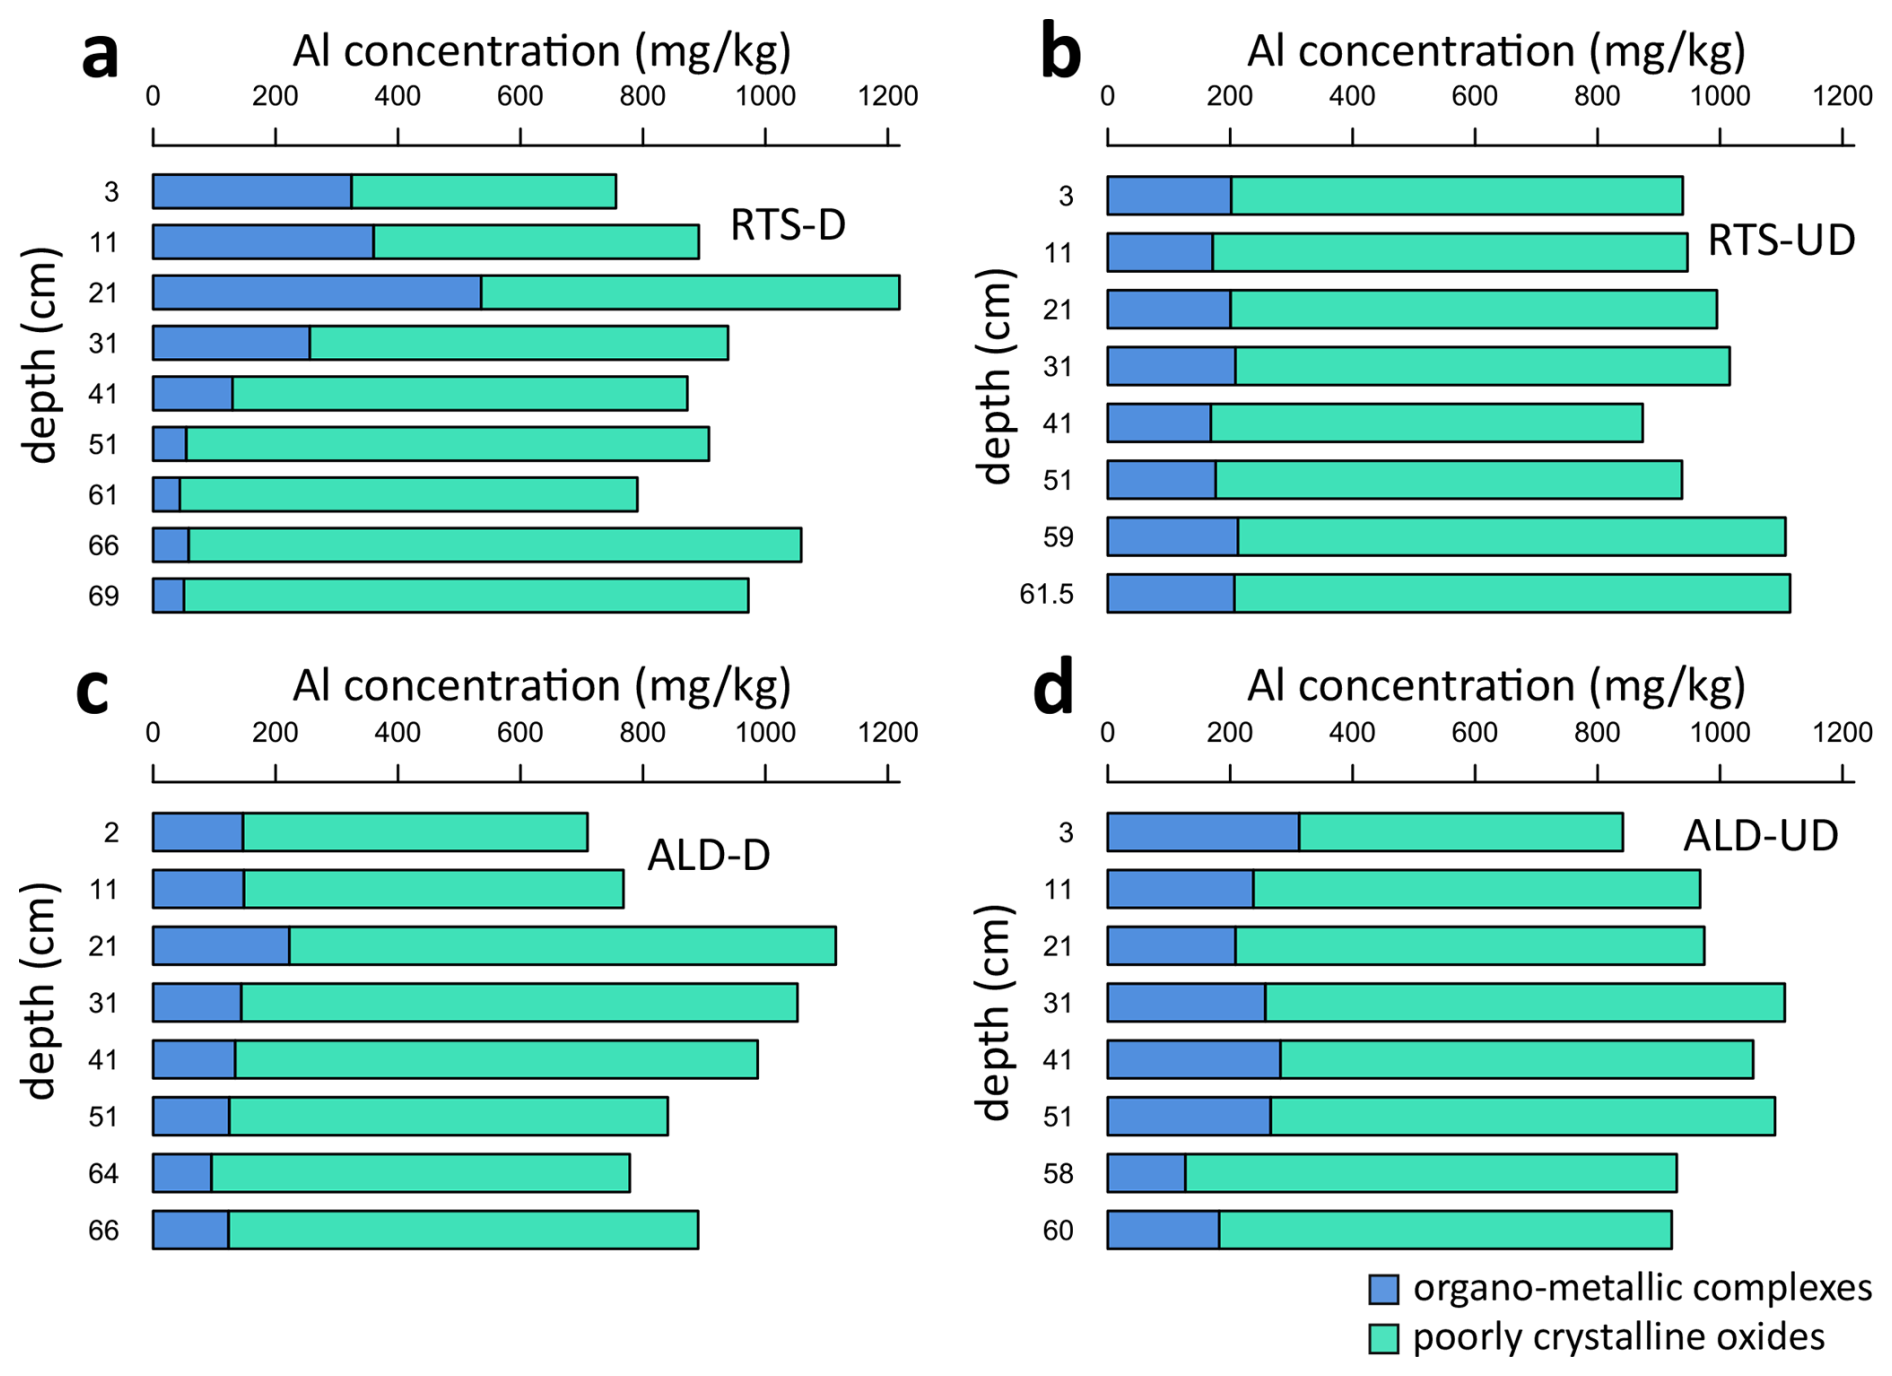
Figure D3Evolution with depth of Al in the form of organo–metallic complexes (Alp) and poorly crystalline oxides (Alo−Alp) for (a) sediments exposed by the retrogressive thaw slump (RTS-D); (b) the corresponding undisturbed profile (RTS-UD); (c) sediments exposed by the active layer detachment (ALD-D); (d) the corresponding undisturbed profile (ALD-UD).
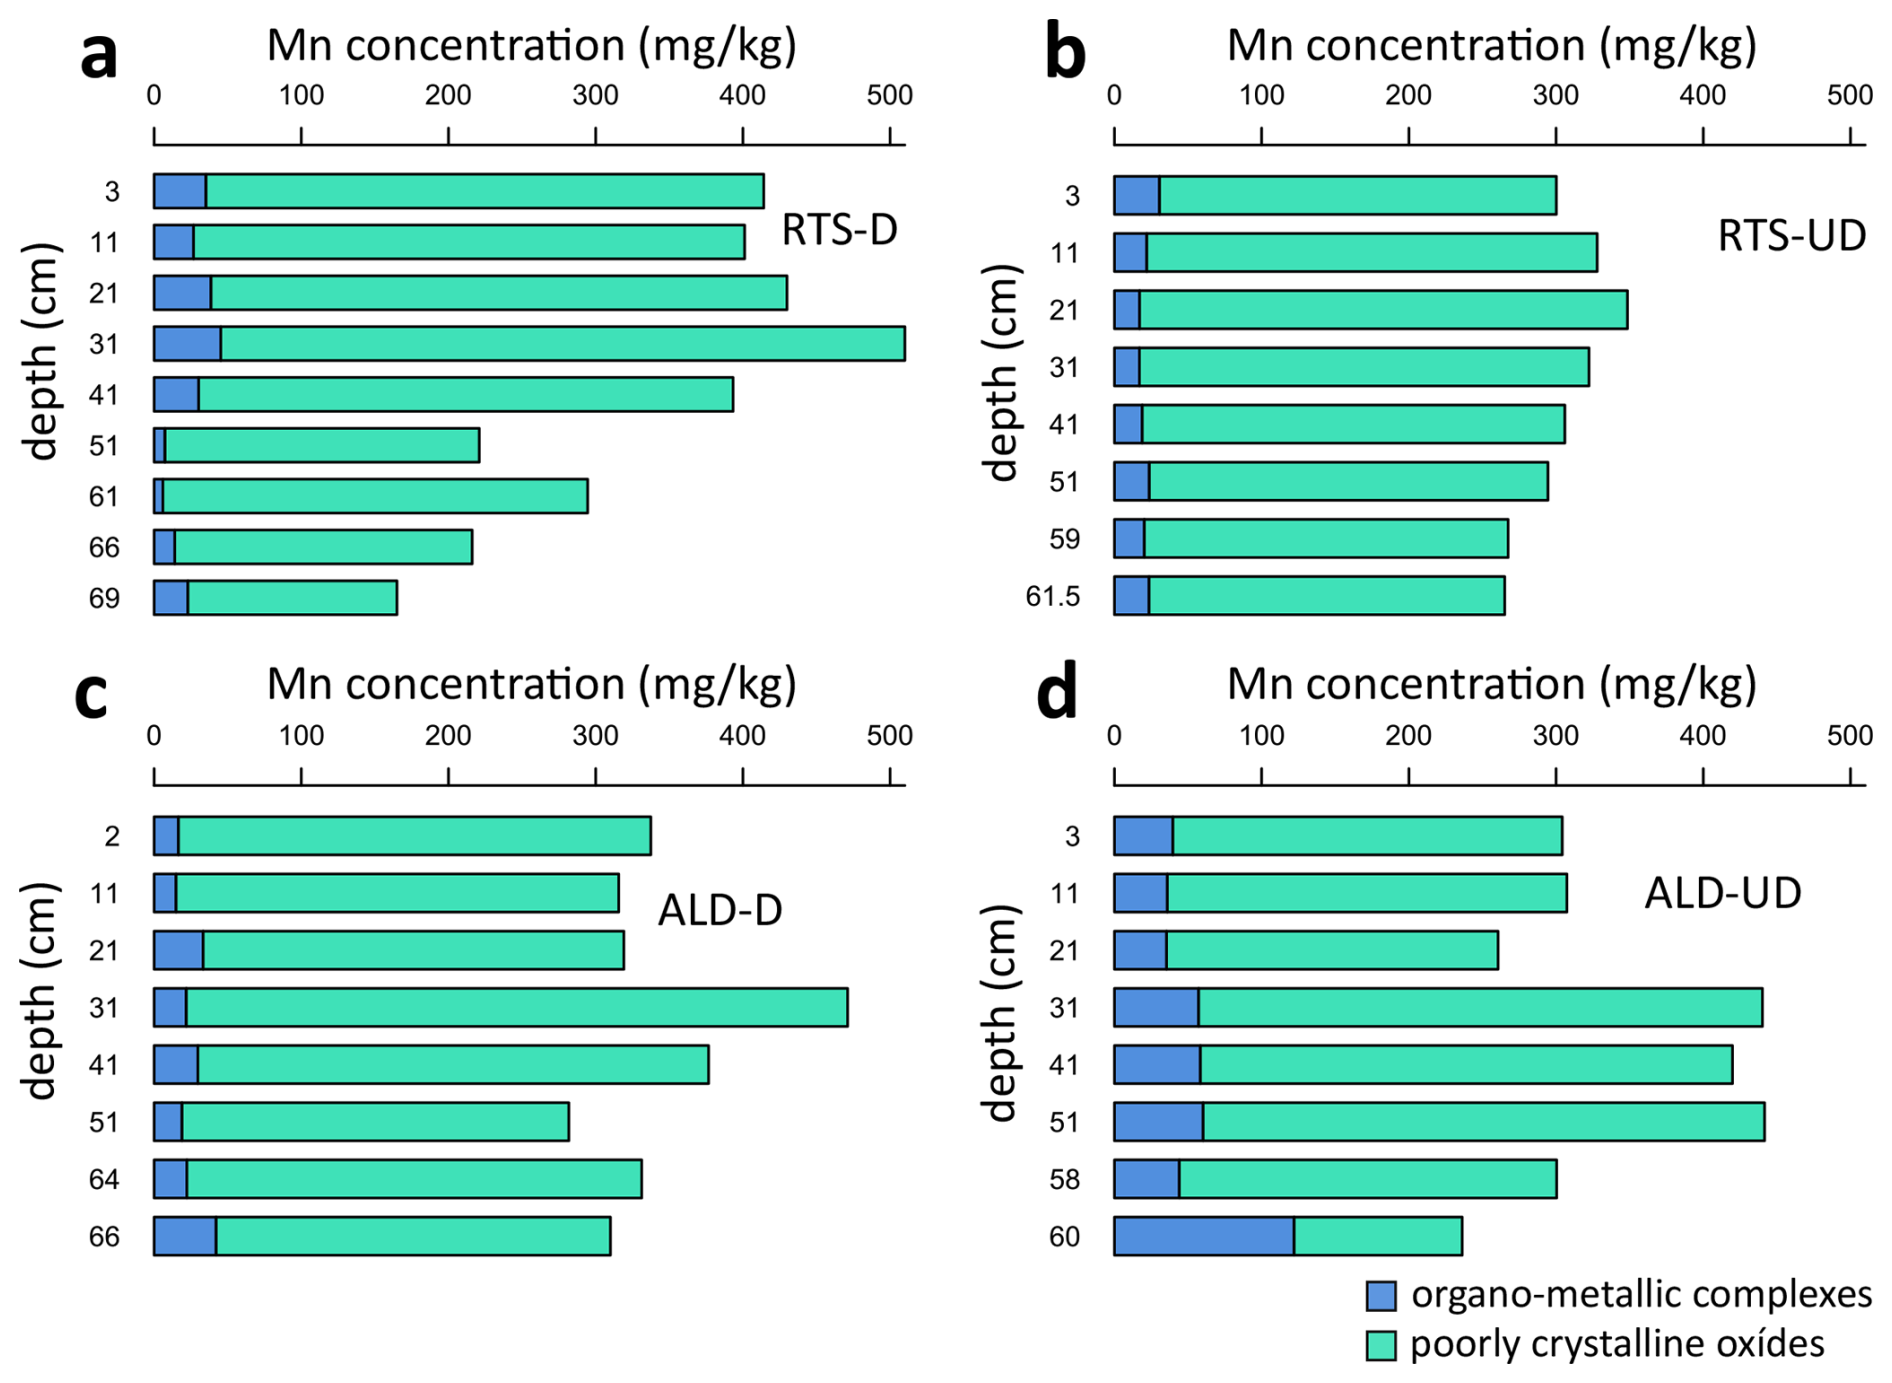
Figure D4Evolution with depth of Mn in the form of organo–metallic complexes (Mnp) and poorly crystalline oxides (Mno−Mnp) for (a) sediments exposed by the retrogressive thaw slump (RTS-D); (b) the corresponding undisturbed profile (RTS-UD); (c) sediments exposed by the active layer detachment (ALD-D); (d) the corresponding undisturbed profile (ALD-UD).
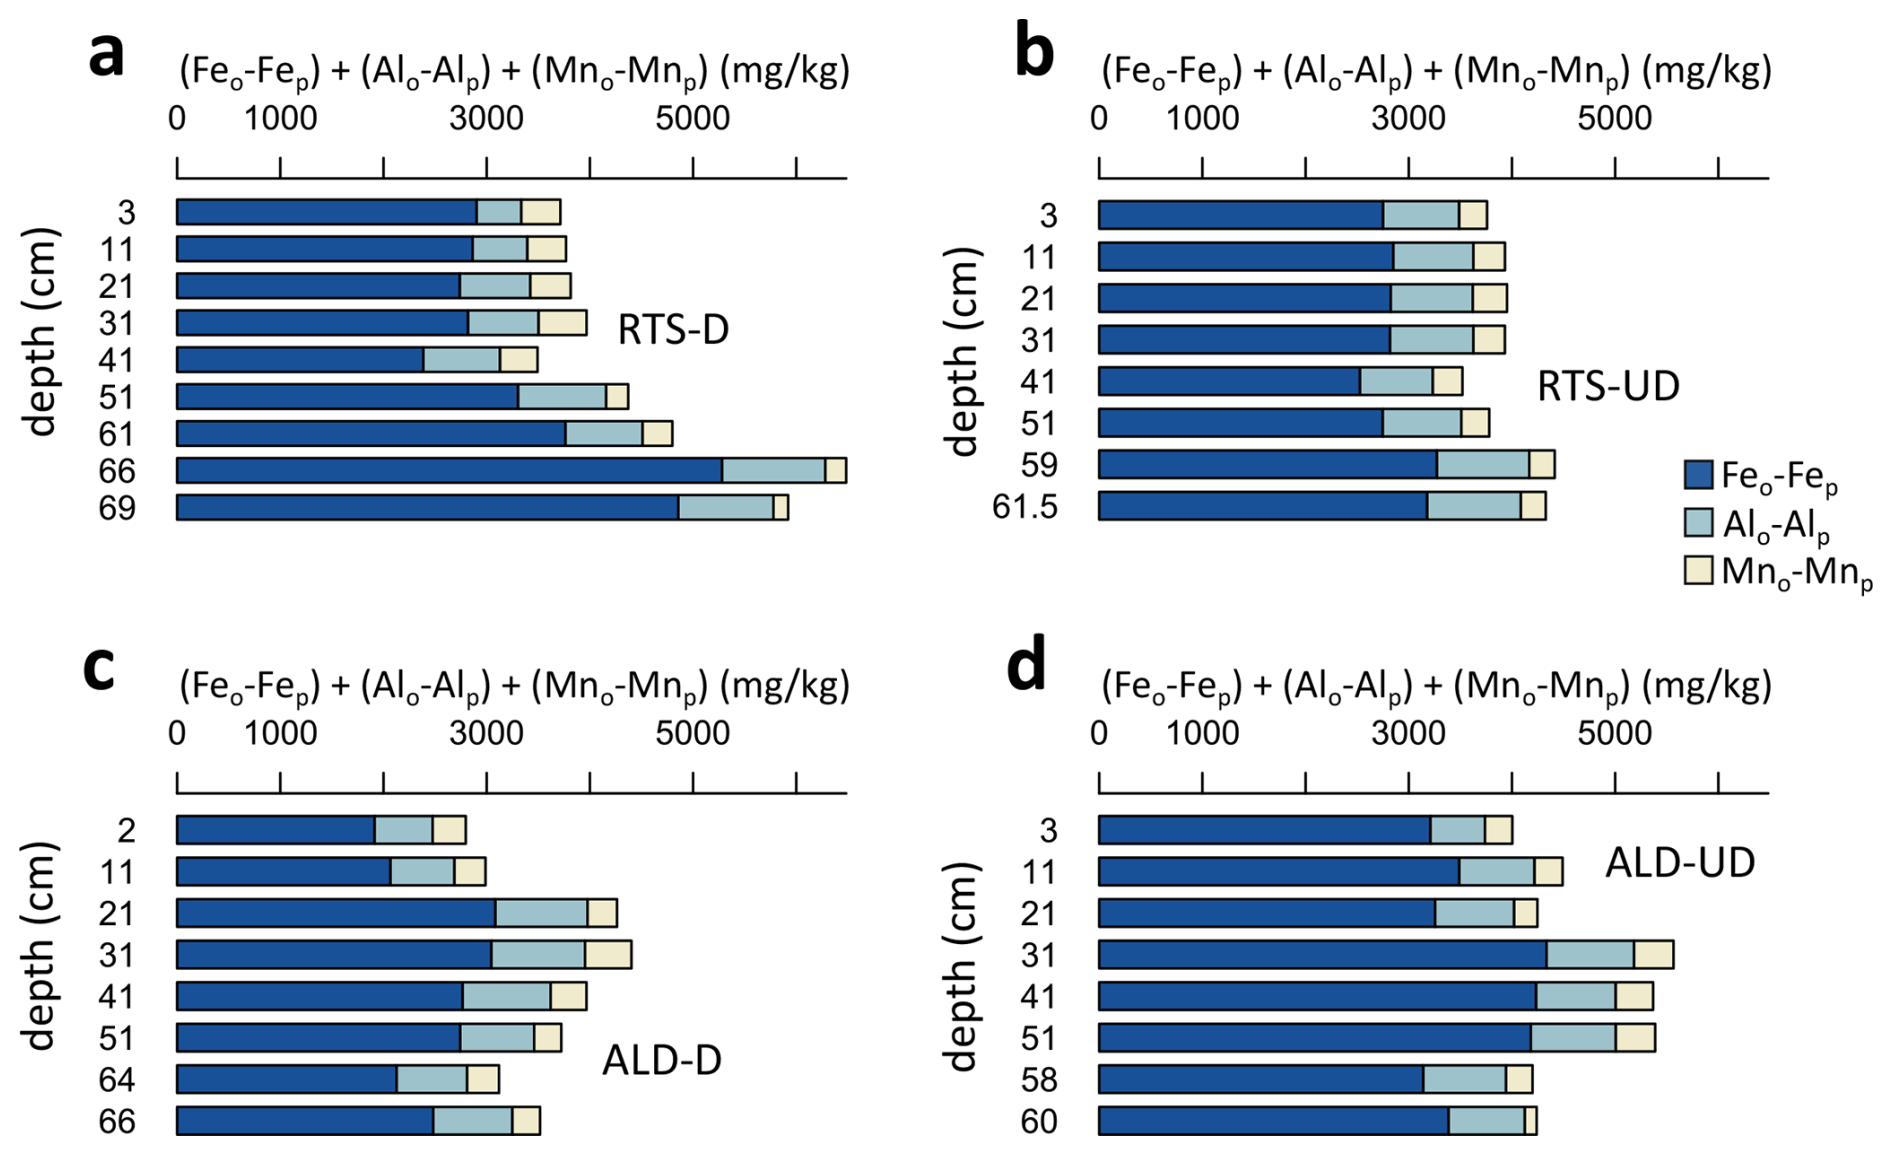
Figure D5Evolution with depth of the metals forming poorly crystalline oxides in (a) sediments exposed by the retrogressive thaw slump (RTS-D); (b) the corresponding undisturbed profile (RTS-UD); (c) sediments exposed by the active layer detachment (ALD-D); (d) the corresponding undisturbed profile (ALD-UD).
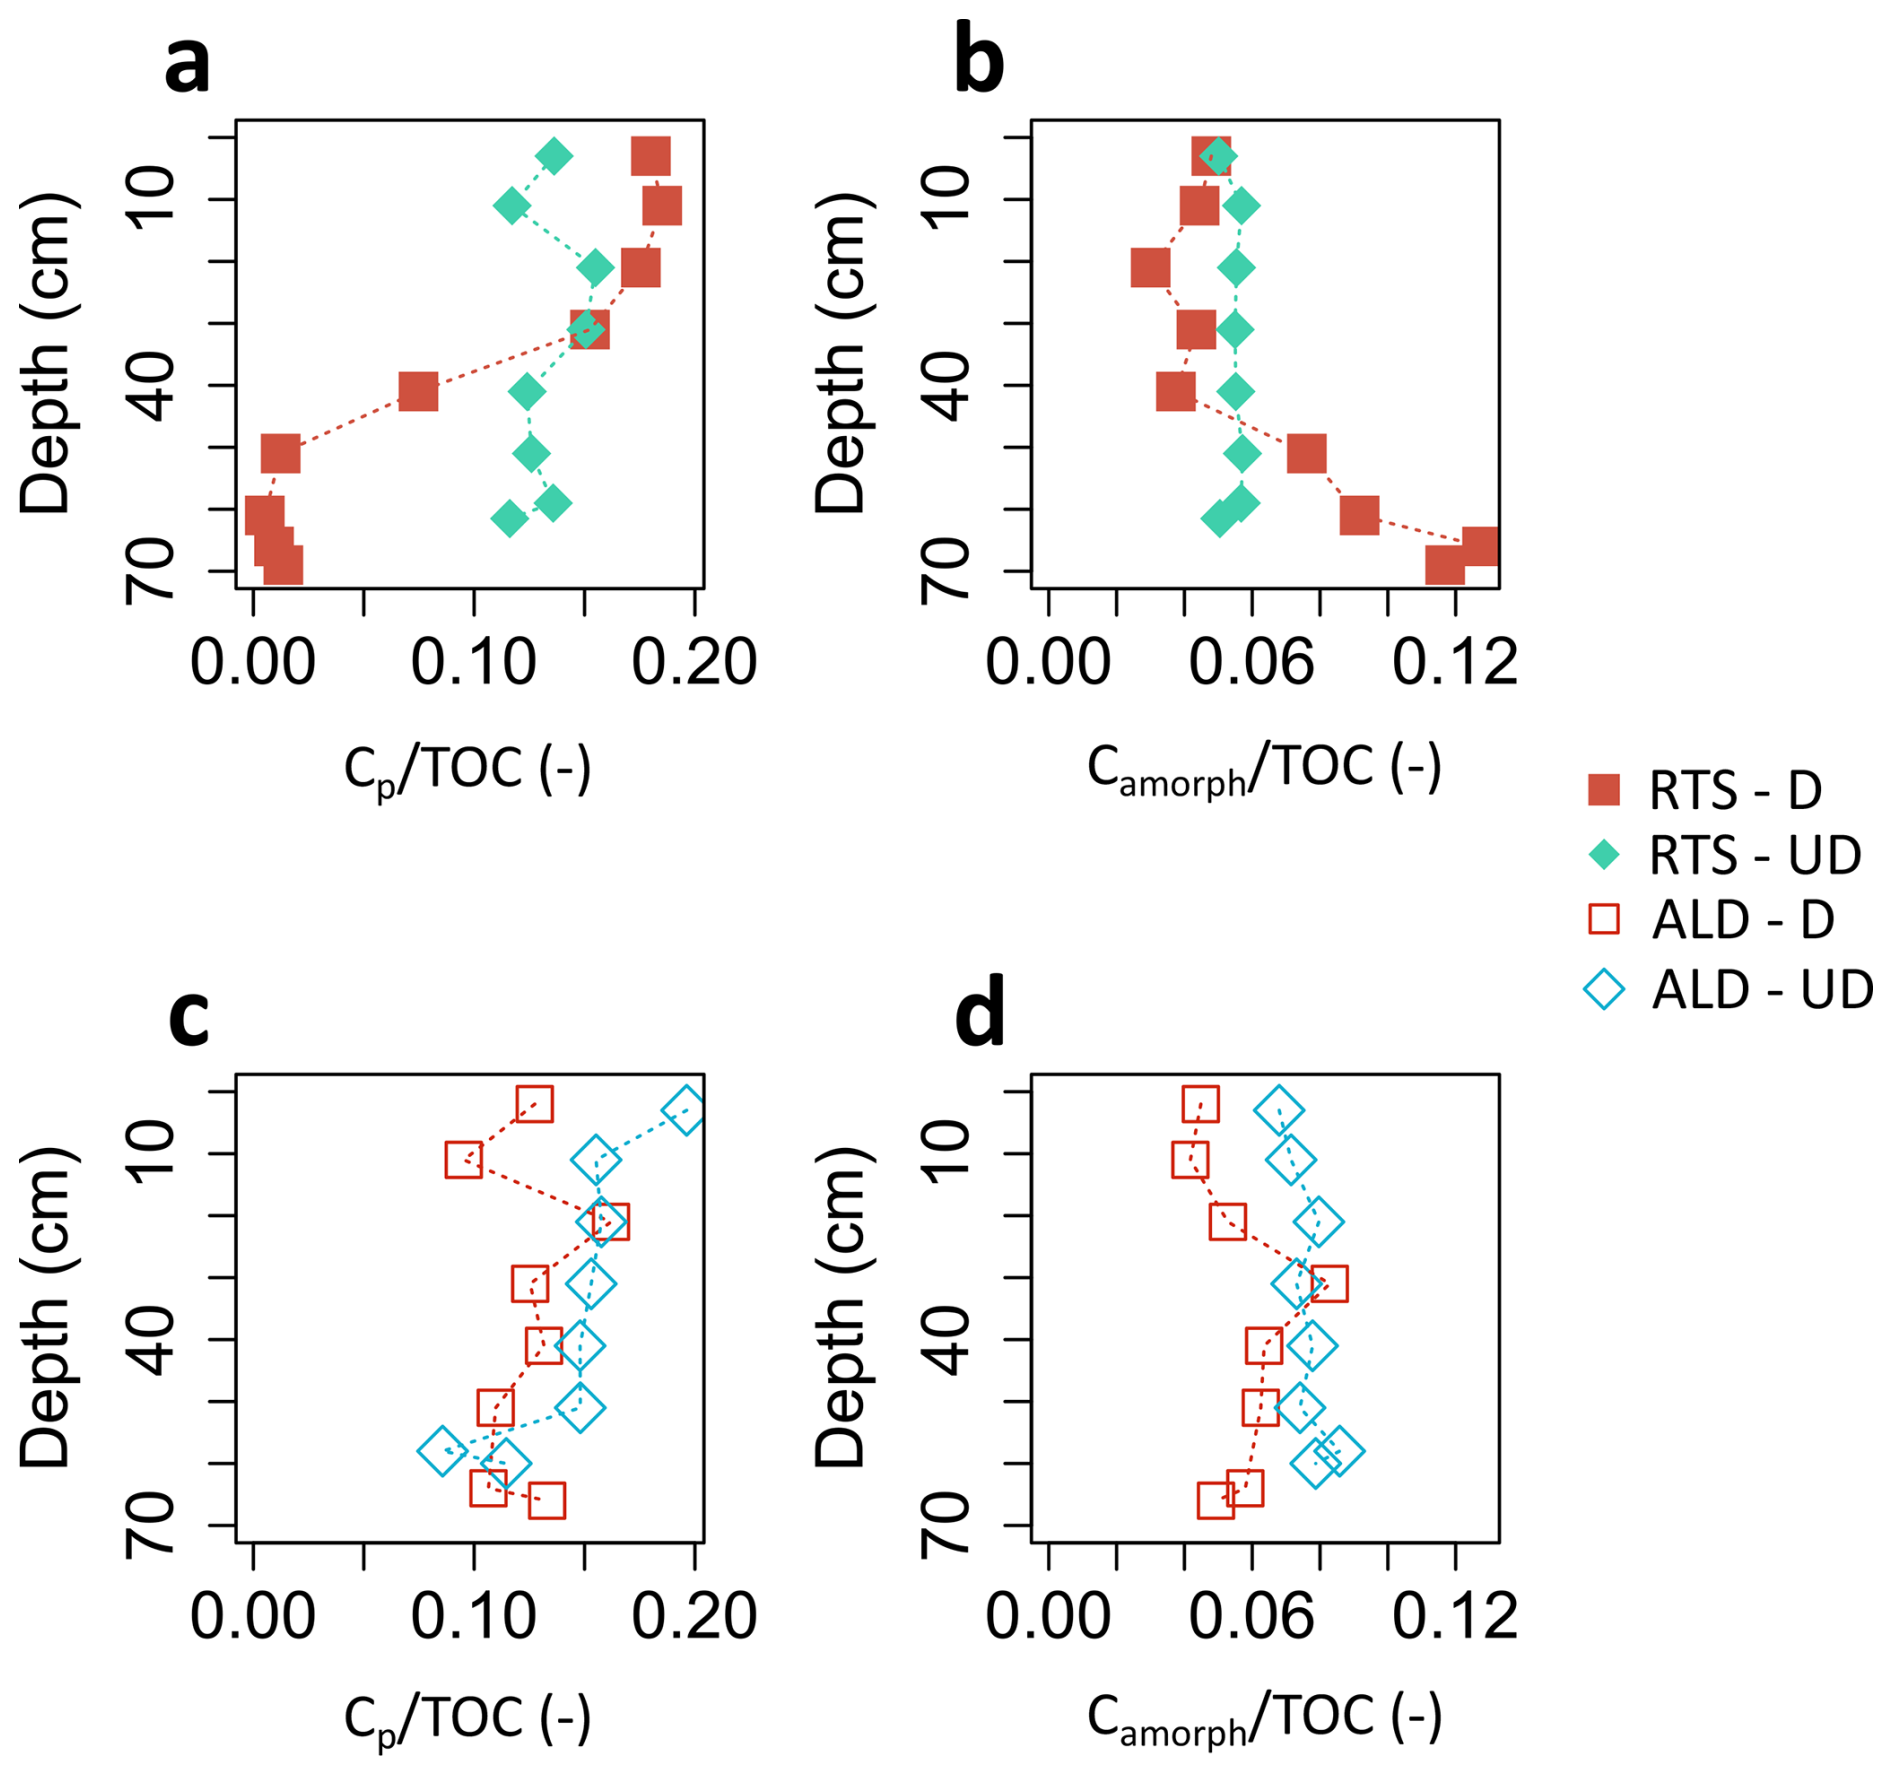
Figure D6Evolution with depth of the proportion of pyrophosphate-extracted carbon relative to the total () and maximum proportion of organic carbon (OC) bound to poorly crystalline Fe oxides, relative to the total () for (a, b) sediments exposed by the retrogressive thaw slump (RTS-D) and the corresponding undisturbed profile (RTS-UD); (c, d) sediments exposed by the active layer detachment (ALD-D) and the corresponding undisturbed profile (ALD-UD). The values of OC bound to crystalline Fe oxides correspond to a calculation with a maximum sorption capacity of 0.22 gOC gas ferrihydrite (Feo−Fep). Color code as in Fig. 5.
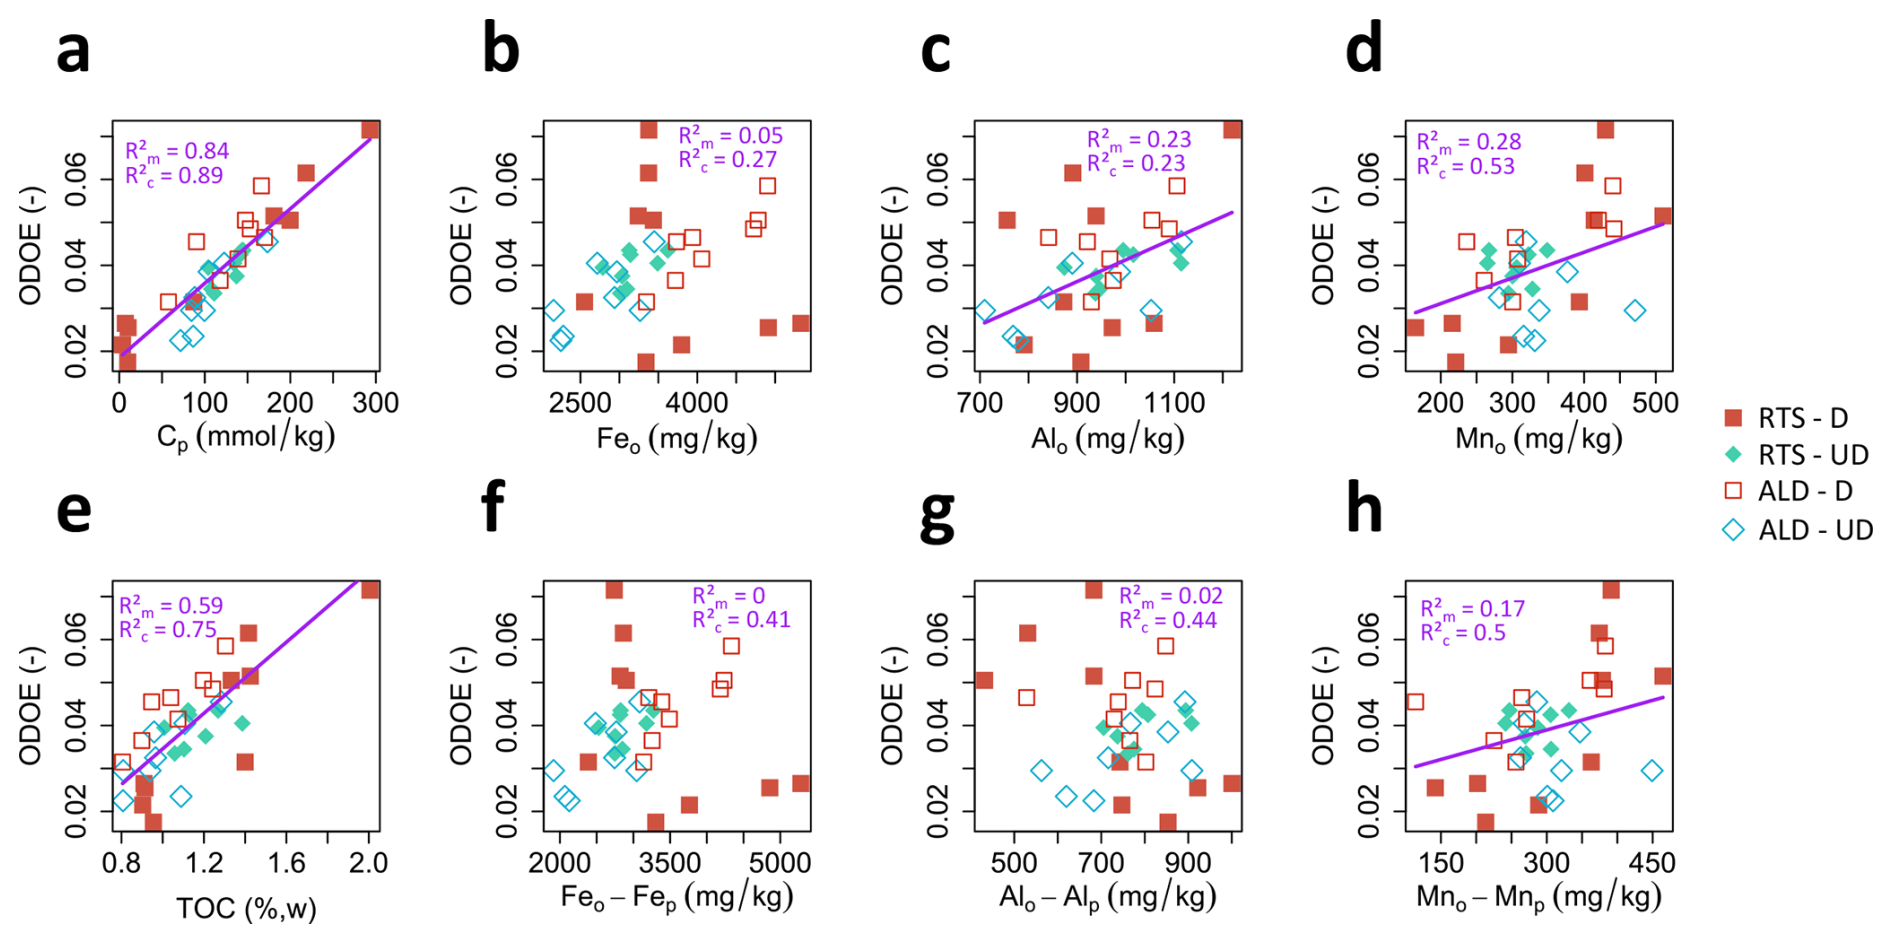
Figure D7Robust linear regression plots between optical density of oxalate extract (ODOE) and (a) carbon extracted by pyrophosphate (Cp); (b) Fe extracted by oxalate (Feo); (c) Al extracted by oxalate (Alo); (d) Mn extracted by oxalate (Mno); (e) total organic carbon (TOC); (f) the concentration in poorly crystalline iron oxides (Feo−Fep); (g) the concentration in poorly crystalline aluminum oxides (Alo−Alp); (h) the concentration in poorly crystalline manganese oxides (Mno−Mnp). RTS = retrogressive thaw slump; ALD = active layer detachment; D = disturbed; UD = undisturbed. Color code as in Fig. 5. The variable “profile” (RTS-D, RTS-UD, ALD D, ALD UD) have been included as a random factor, with random intercept and slope. The marginal R2 (R2 ?), represents the population-level trend (variance explained by fixed effects). The conditional R2 () have been included to account for both fixed and random effects and reflects total model performance.
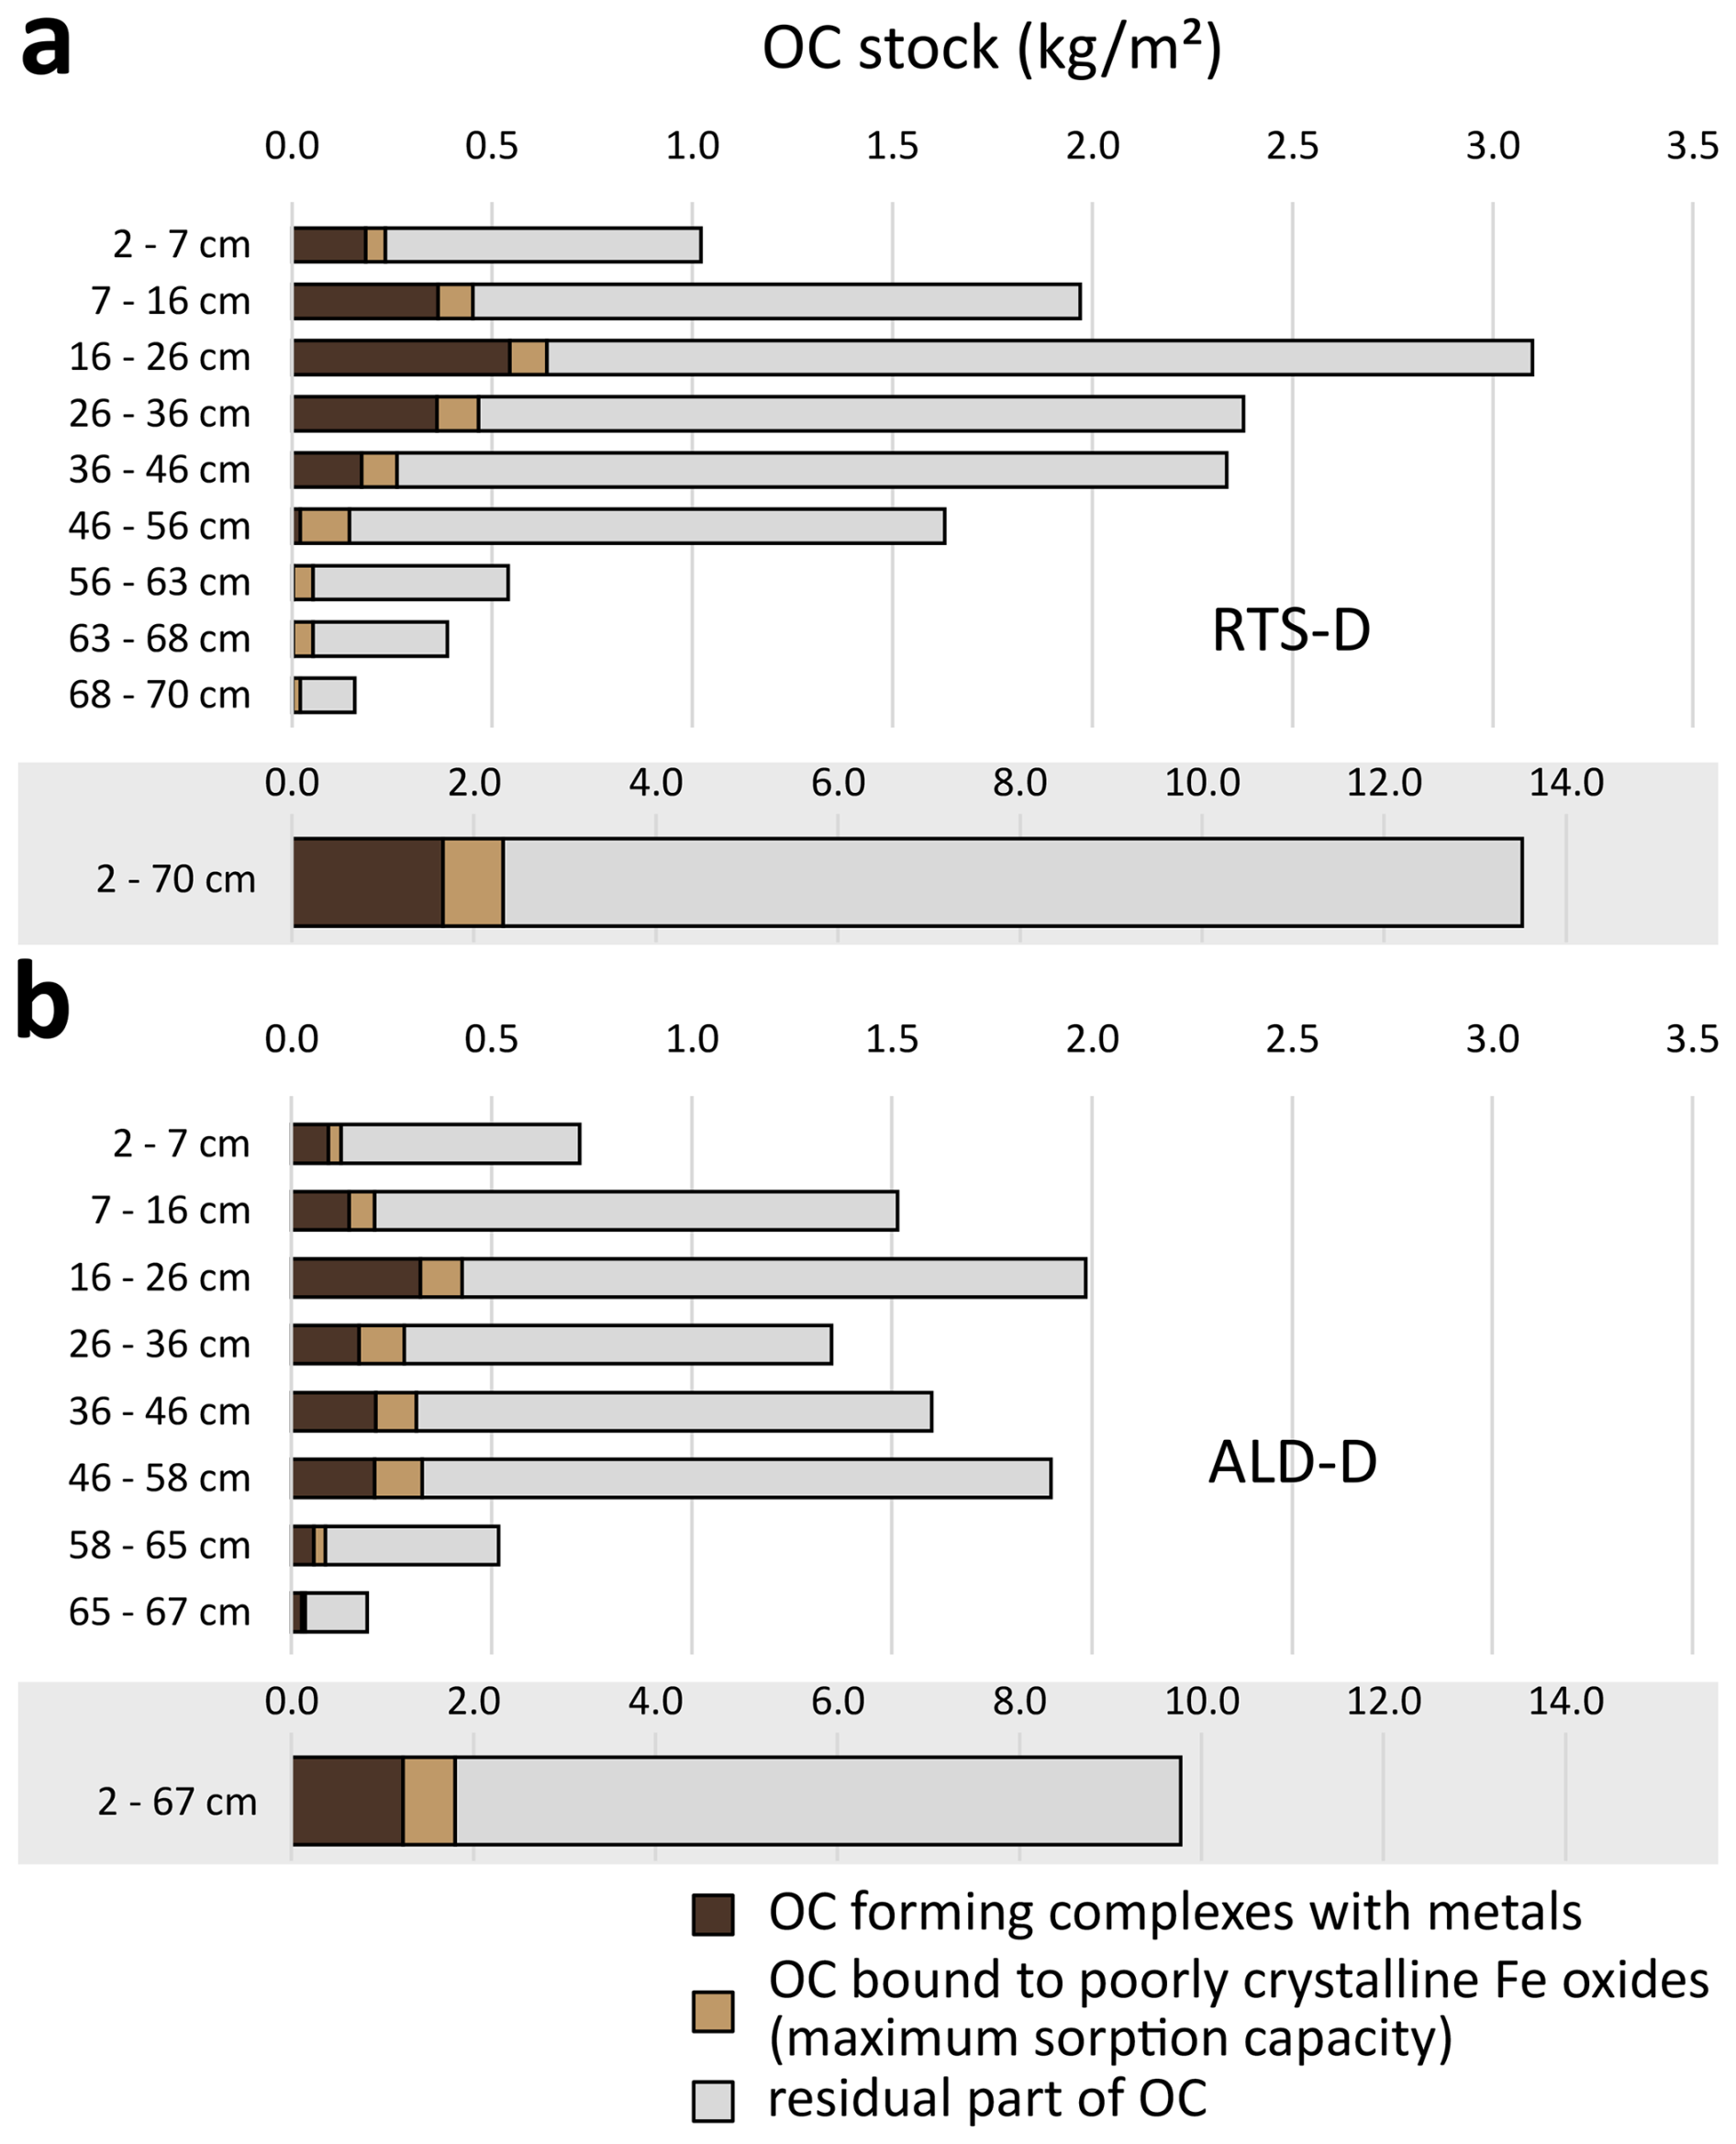
Figure D8Evolution with depth of the stock of pyrophosphate-extracted carbon (Cp) and maximum proportion of organic carbon (OC) bound to poorly crystalline Fe oxides (Camorph) in (a) sediments exposed by the retrogressive thaw slump (RTS-D); (b) sediments exposed by the active layer detachment (ALD-D); Stocks are estimated by assuming an excess ice content of 50 % for depths ≥ 60 cm (Lamhonwah et al., 2016) and dry bulk densities of 1.53 g cm−3 for depths of 0–7 cm, 1.55 g cm−3 for depths of 7–26 cm, 1.67 g cm−3 for depths of 26–46 cm, and 1.71 g cm−3 for depths greater than 46 cm (Stanton, 2023). OC concentrations as in Fig. 7. The bars with the gray background represent the integral over the entire depth.
Table E1Results of soil aggregate and density fractionation and carbon measurements on fractions.
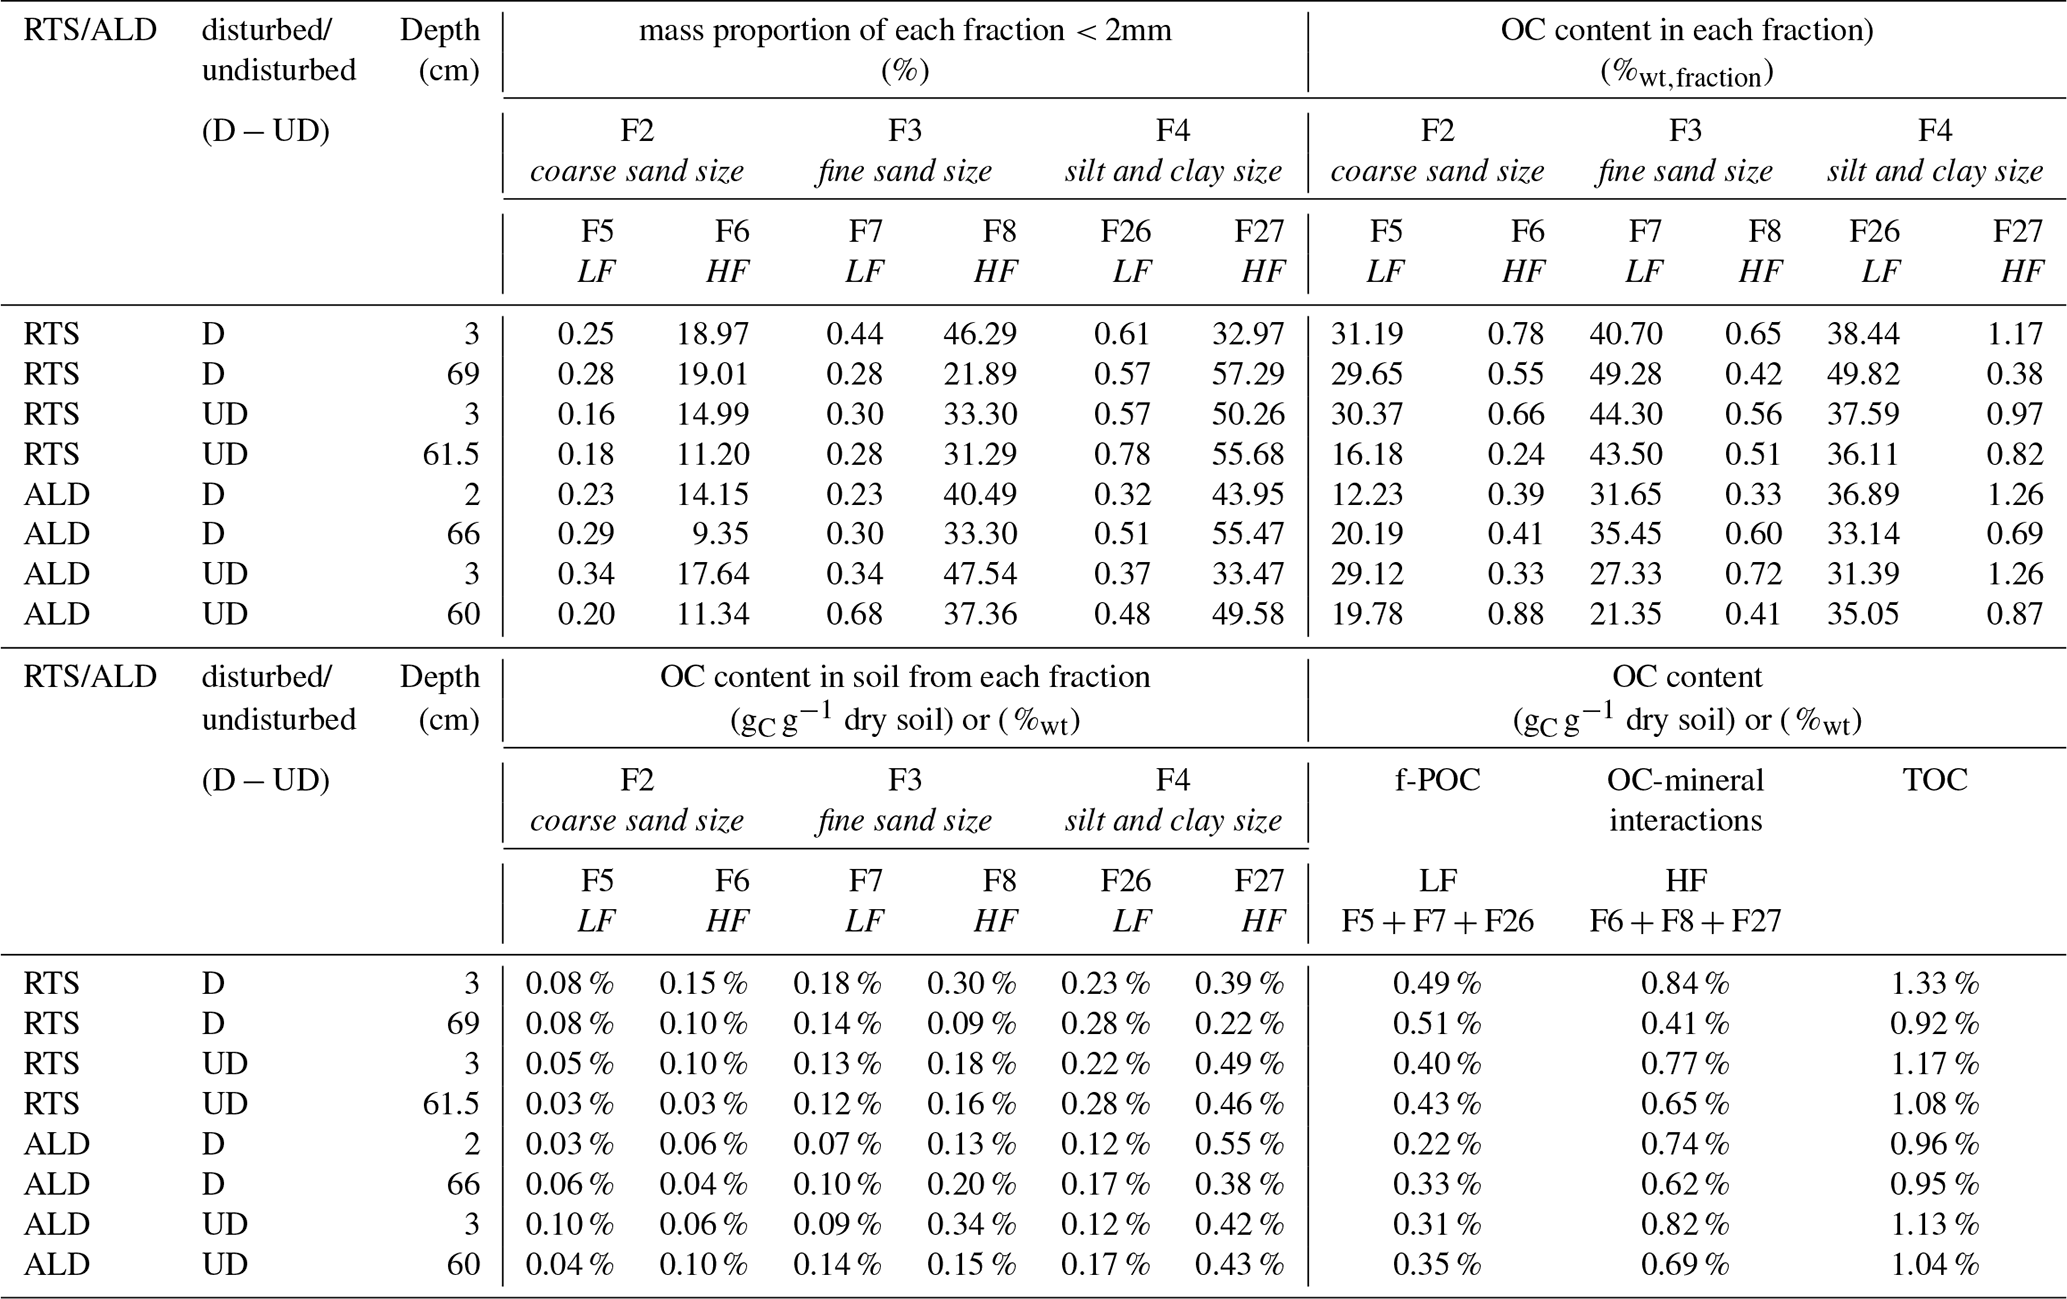
Fx = fraction as defined in Burgeon et al. (2021); LF = light fraction; HF = heavy fraction; OC = organic carbon; f-POC = free particulate organic carbon; TOC = total organic carbon.
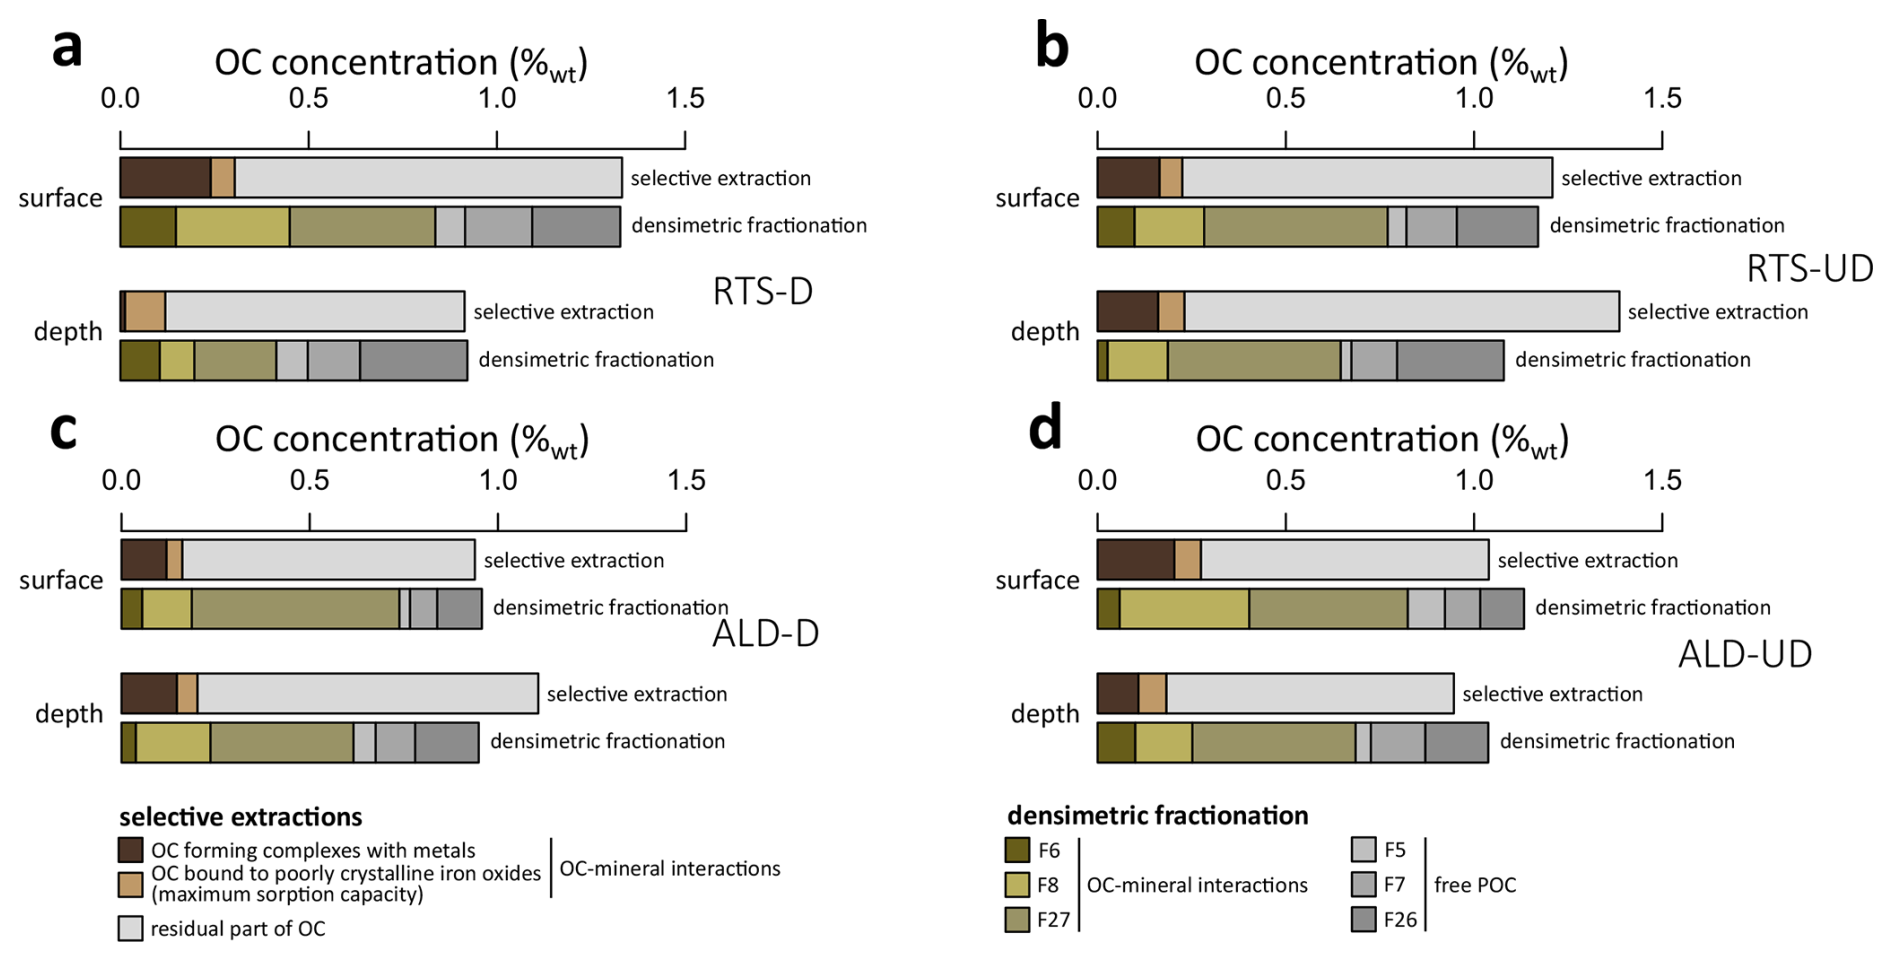
Figure E1Comparative results of organic carbon (OC) stabilized through organo–mineral interactions with the selective chemical extraction protocol and the soil aggregate and density fractionation protocol for the shallowest and deepest samples in (a) sediments exposed by the retrogressive thaw slump (RTS-D); (b) the corresponding undisturbed profile (RTS-UD); (c) sediments exposed by the active layer detachment (ALD-D); (d) the corresponding undisturbed profile (ALD-UD). POC = particulate organic carbon. Fx = fraction as defined in Burgeon et al. (2021). These results are the same as in Fig. 8, but with details of the contribution of each fraction.
A spreadsheet containing concentrations in total Ca, K, Fe, Mn, Al and organic carbon (Ca, K, Fe, Mn, Al and TOC); Ca and K extracted with ultrapure water (Caw, Kw); Fe, Al, Mn, Ca and carbon selectively extracted by pyrophosphate (Fep, Alp, Mnp, Cap and Cp); Fe, Al and Mn selectively extracted by ammonium oxalate (Feo, Alo, Mno); optical density of the oxalate extract (ODOE) is available at https://doi.org/10.14428/DVN/5O6FJ3. Raw data on soil aggregate and density fractionation have been presented in the appendices of the paper.
MT and SO conceived and planned the experimental work. ML and JKH carried out the sampling campaign. JF supervised the size-density fractionation protocol. Water extractions were carried out by MT and NB. Selective extractions and total organic carbon measurements were carried out by MT and CM. Total and mineralogical analyses were carried out by MT under the supervision of SO. ML, JF and JKH contributed their expertise on the study site and Arctic environments. HT contributed with his expertise on selective extractions and organic carbon stability. MT wrote the manuscript under the supervision of SO with inputs from all co-authors.
The contact author has declared that none of the authors has any competing interests.
Publisher's note: Copernicus Publications remains neutral with regard to jurisdictional claims made in the text, published maps, institutional affiliations, or any other geographical representation in this paper. The authors bear the ultimate responsibility for providing appropriate place names. Views expressed in the text are those of the authors and do not necessarily reflect the views of the publisher.
Thomas Rochereau is acknowledged for carrying out the size-density fractionation. Matthieu Leclercq and Brice de Saint-Aubert are acknowledged for the total inorganic carbon and total carbon measurements. Claudine Givron is acknowledged for the carbon measurements on fractions. Elodie Devos and Laurence Monin are acknowledged for element analyses on the selective extractions. Maxime Thomas thanks the Mineral and Organic Chemical Analysis (MOCA) platform at UCLouvain for support in the lab as well as members of the WeThaw project and the ELIe research department for useful critical comments. Maxime Thomas further thanks Sandra Arndt, Veerle Vanacker and François Jonard for their constructive feedbacks.
This project received funding from the European Union's Horizon 2020 research and innovation program under grant agreement No. 714617 to Sophie Opfergelt (WeThaw), and Sophie Opfergelt acknowledges funding from the Fund for Scientific Research FNRS in Belgium (grant no. FC69480).
This paper was edited by Estela Nadal Romero and reviewed by Adrian A. Wackett and two anonymous referees.
Abbott, B. W. and Jones, J. B.: Permafrost collapse alters soil carbon stocks, respiration, CH4, and N2O in upland tundra, Glob. Change Biol., 21, 4570–4587, https://doi.org/10.1111/gcb.13069, 2015.
AMAP: Arctic Climate Change Update 2021: Key Trends and Impacts. Summary for Policy-makers, Arctic Monitoring and Assessment Programme (AMAP), Tromsø, Norway, 2021.
Baize, D.: Guide des analyses en pédologie, in: 3rd Edn., Quae Editions, Versailles, 328 pp., ISBN 978-2-7592-2836-2, 2018.
Bascomb, C. L.: Distribution of Pyrophosphate-Extractable Iron and Organic Carbon in Soils of Various Groups, J. Soil Sci., 19, 251–268, https://doi.org/10.1111/j.1365-2389.1968.tb01538.x, 1968.
Beel, C. R., Lamoureux, S. F., and Orwin, J. F.: Fluvial Response to a Period of Hydrometeorological Change and Landscape Disturbance in the Canadian High Arctic, Geophys. Res. Lett., 45, 10446-10455, https://doi.org/10.1029/2018GL079660, 2018.
Beel, C. R., Lamoureux, S. F., Orwin, J. F., Pope, M. A., Lafrenière, M. J., and Scott, N. A.: Differential impact of thermal and physical permafrost disturbances on High Arctic dissolved and particulate fluvial fluxes, Sci. Rep., 10, 11836, https://doi.org/10.1038/s41598-020-68824-3, 2020.
Beel, C. R., Heslop, J. K., Orwin, J. F., Pope, M. A., Schevers, A. J., Hung, J. K. Y., Lafrenière, M. J., and Lamoureux, S. F.: Emerging dominance of summer rainfall driving High Arctic terrestrial-aquatic connectivity, Nat. Commun., 12, 1448, https://doi.org/10.1038/s41467-021-21759-3, 2021.
Bischoff, N., Mikutta, R., Shibistova, O., Puzanov, A., Silanteva, M., Grebennikova, A., Fuß, R., and Guggenberger, G.: Limited protection of macro-aggregate-occluded organic carbon in Siberian steppe soils, Biogeosciences, 14, 2627–2640, https://doi.org/10.5194/bg-14-2627-2017, 2017.
Blakemore, L. C., Searle, P. L., and Daly, B. K.: Methods for chemical analysis of soils, New Zealand Soil Bur, Sci. Rep., 10A, https://doi.org/10.7931/DL1-SBSR-10A, 1981.
Boudot, J. P., Bel Hadj∧Brahim, A., Steiman, R., and Seigle-Murandi, F.: Biodegradation of synthetic organo-metallic complexes of iron and aluminium with selected metal to carbon ratios, Soil Biol. Biochem., 21, 961–966, https://doi.org/10.1016/0038-0717(89)90088-6, 1989.
Brooker, A., Fraser, R. H., Olthof, I., Kokelj, S. V., and Lacelle, D.: Mapping the Activity and Evolution of Retrogressive Thaw Slumps by Tasselled Cap Trend Analysis of a Landsat Satellite Image Stack, Permafrost Periglac., 25, 243–256, https://doi.org/10.1002/ppp.1819, 2014.
Burgeon, V., Fouché, J., Leifeld, J., Chenu, C., and Cornélis, J.-T.: Organo–mineral associations largely contribute to the stabilization of century-old pyrogenic organic matter in cropland soils, Geoderma, 388, 114841, https://doi.org/10.1016/j.geoderma.2020.114841, 2021.
Cotrufo, M. F. and Lavallee, J. M.: Chapter One– Soil organic matter formation, persistence, and functioning: A synthesis of current understanding to inform its conservation and regeneration, in: Advances in Agronomy, vol. 172, edited by: Sparks, D. L., Academic Press, 1–66, https://doi.org/10.1016/bs.agron.2021.11.002, 2022.
Courchesne, F. and Turmel, M.-C.: Extractable Al, Fe, Mn, and Si, in: Soil sampling and methods of analysis, edited by: Carter, M. R. and Gregorich, E. G., Canadian Society of Soil Science, CRC Press, Pinawa, Manitoba, Boca Raton, FL, 307–315, https://doi.org/10.1201/9781420005271, 2008.
Cui, J., Li, Z., Liu, Z., Ge, B., Fang, C., Zhou, C., and Tang, B.: Physical and chemical stabilization of soil organic carbon along a 500-year cultived soil chronosequence originating from estuarine wetlands: Temporal patterns and land use effects, Agr. Ecosyst. Environ., 196, 10–20, https://doi.org/10.1016/j.agee.2014.06.013, 2014.
Daly, B. K.: Identification of podzols and podzolised soils in New Zealand by relative absorbance of oxalate extracts of A and B horizons, Geoderma, 28, 29–38, https://doi.org/10.1016/0016-7061(82)90038-6, 1982.
Derrien, D., Barré, P., Basile-Doelsch, I., Cécillon, L., Chabbi, A., Crème, A., Fontaine, S., Henneron, L., Janot, N., Lashermes, G., Quénéa, K., Rees, F., and Dignac, M.-F.: Current controversies on mechanisms controlling soil carbon storage: implications for interactions with practitioners and policy-makers. A review, Agron. Sustain. Dev., 43, 21, https://doi.org/10.1007/s13593-023-00876-x, 2023.
Dutta, K., Schuur, E. a. G., Neff, J. C., and Zimov, S. A.: Potential carbon release from permafrost soils of Northeastern Siberia, Glob. Change Biol., 12, 2336–2351, https://doi.org/10.1111/j.1365-2486.2006.01259.x, 2006.
England, J. H., Furze, M. F. A., and Doupé, J. P.: Revision of the NW Laurentide Ice Sheet: implications for paleoclimate, the northeast extremity of Beringia, and Arctic Ocean sedimentation, Quaternary Sci. Rev., 28, 1573–1596, https://doi.org/10.1016/j.quascirev.2009.04.006, 2009.
Esri, Maxar, Earthstar Geographics, and GIS User Community: “World Imagery” [basemap], https://services.arcgisonline.com/ArcGIS/rest/services/World_Imagery/MapServer (last access: 7 July 2024), 2024.
Fox-Kemper, B., Hewitt, H. T., Xiao, C., Aðalgeirsdóttir, G., Drijfhout, S. S., Edwards, T. L., Golledge, N. R., Hemer, M., Koop, R. E., Krinner, G., Mix, A., Notz, D., Nowicki, S., Nurhati, I. S., Ruiz, L., Sallée, J.-B., Slangen, A. B. A., and Yu, Y.: Ocean, Cryosphere and Sea Level Change, in: Climate Change 2021: The Physical Science Basis. Contribution of Working Group I to the Sixth Assessment Report of the Intergovernmental Panel on Climate Change, edited by: Masson-Delmotte, V., Zhai, P., Pirani, A., Connors, S. L., Péan, C., Berger, S., Caud, N., Chen, Y., Goldfarb, L., Gomis, M. I., Huang, M., Leitzell, K., Lonnoy, E., Matthews, J. B. R., Maycock, T. K., Waterfield, T., Yelekçi, O., Yu, R., and Zhou, B., Cambridge University Press, Cambridge, United Kingdom and New York, NY, USA, 1211–1362, https://doi.org/10.1017/9781009157896.011, 2021.
French, H. M.: The Periglacial Environment, Third Edition, John Wiley & Sons, Ltd, Chichester, England, ISBN 978-1-118-68493-1, 2007.
García-Palacios, P., Bradford, M. A., Benavente-Ferraces, I., de Celis, M., Delgado-Baquerizo, M., García-Gil, J. C., Gaitán, J. J., Goñi-Urtiaga, A., Mueller, C. W., Panettieri, M., Rey, A., Sáez-Sandino, T., Schuur, E. A. G., Sokol, N. W., Tedersoo, L., and Plaza, C.: Dominance of particulate organic carbon in top mineral soils in cold regions, Nat. Geosci., 1–6, https://doi.org/10.1038/s41561-023-01354-5, 2024.
Gentsch, N., Mikutta, R., Shibistova, O., Wild, B., Schnecker, J., Richter, A., Urich, T., Gittel, A., Šantrůčková, H., Bárta, J., Lashchinskiy, N., Mueller, C. W., Fuß, R., and Guggenberger, G.: Properties and bioavailability of particulate and mineral-associated organic matter in Arctic permafrost soils, Lower Kolyma Region, Russia, European J. Soil Sci., 66, 722–734, https://doi.org/10.1111/ejss.12269, 2015.
Georgiou, K., Jackson, R. B., Vindušková, O., Abramoff, R. Z., Ahlström, A., Feng, W., Harden, J. W., Pellegrini, A. F. A., Polley, H. W., Soong, J. L., Riley, W. J., and Torn, M. S.: Global stocks and capacity of mineral-associated soil organic carbon, Nat. Commun., 13, 3797, https://doi.org/10.1038/s41467-022-31540-9, 2022.
Günther, F., Grosse, G., Wetterich, S., Jones, B. M., Kunitsky, V. V., Kienast, F., and Schirrmeister, L.: The Batagay mega thaw slump, Yana Uplands, Yakutia, Russia: permafrost thaw dynamics on decadal time scale, in: PAST Gateways – Palaeo-Arctic Spatial and Temporal Gateways – Third International Conference and Workshop, Potsdam, Germany, 18–22 May 2015, http://hdl.handle.net/10013/epic.45563.d001 (last access: 23 February 2023), 2015.
Heginbottom, J. A., Brown, J., Humlum, O., and Svensson, H.: Permafrost and Periglacial Environments, in: State of the Earth's cryosphere at the beginning of the 21st century: glaciers, global snow cover, floating ice, and permafrost and periglacial environments, U. S. Geological Survey, Reston, VA, A425–A496, 2012.
Hodgson, D. A., Vincent, J.-S., and Fyles, J. G.: Surficial geology, Central Melville Island, Northwest Territories, Map 1583A, scale 1:250 000, Geological Survey of Canada, 1984.
Hugelius, G., Strauss, J., Zubrzycki, S., Harden, J. W., Schuur, E. A. G., Ping, C.-L., Schirrmeister, L., Grosse, G., Michaelson, G. J., Koven, C. D., O'Donnell, J. A., Elberling, B., Mishra, U., Camill, P., Yu, Z., Palmtag, J., and Kuhry, P.: Estimated stocks of circumpolar permafrost carbon with quantified uncertainty ranges and identified data gaps, Biogeosciences, 11, 6573–6593, https://doi.org/10.5194/bg-11-6573-2014, 2014.
Jeanroy, E. and Guillet, B.: The occurrence of suspended ferruginous particles in pyrophosphate extracts of some soil horizons, Geoderma, 26, 95–105, https://doi.org/10.1016/0016-7061(81)90078-1, 1981.
Jilling, A., Grandy, A. S., Daly, A. B., Hestrin, R., Possinger, A., Abramoff, R., Annis, M., Cates, A. M., Dynarski, K., Georgiou, K., Heckman, K., Keiluweit, M., Lang, A. K., Phillips, R. P., Rocci, K., Shabtai, I. A., Sokol, N. W., and Whalen, E. D.: Evidence for the existence and ecological relevance of fast-cycling mineral-associated organic matter, Commun. Earth Environ., 6, 690, https://doi.org/10.1038/s43247-025-02681-8, 2025.
Jongejans, L. L., Mangelsdorf, K., Karger, C., Opel, T., Wetterich, S., Courtin, J., Meyer, H., Kizyakov, A. I., Grosse, G., Shepelev, A. G., Syromyatnikov, I. I., Fedorov, A. N., and Strauss, J.: Molecular biomarkers in Batagay megaslump permafrost deposits reveal clear differences in organic matter preservation between glacial and interglacial periods, The Cryosphere, 16, 3601–3617, https://doi.org/10.5194/tc-16-3601-2022, 2022.
Kaiser, K. and Guggenberger, G.: Sorptive stabilization of organic matter by microporous goethite: sorption into small pores vs. surface complexation, Eur. J. Soil Sci., 58, 45–59, https://doi.org/10.1111/j.1365-2389.2006.00799.x, 2007.
Kaiser, K., Guggenberger, G., Haumaier, L., and Zech, W.: Dissolved organic matter sorption on sub soils and minerals studied by 13C-NMR and DRIFT spectroscopy, Eur. J. Soil Sci., 48, 301–310, https://doi.org/10.1111/j.1365-2389.1997.tb00550.x, 1997.
Klaminder, J., Yoo, K., and Giesler, R.: Soil carbon accumulation in the dry tundra: Important role played by precipitation, J. Geophys. Res.-Biogeo., 114, https://doi.org/10.1029/2009JG000947, 2009.
Kleber, M., Eusterhues, K., Keiluweit, M., Mikutta, C., Mikutta, R., and Nico, P. S.: Mineral–Organic Associations: Formation, Properties, and Relevance in Soil Environments, in: Advances in Agronomy, vol. 130, edited by: Sparks, D. L., Academic Press, 1–140, https://doi.org/10.1016/bs.agron.2014.10.005, 2015.
Kokelj, S. V. and Jorgenson, M. T.: Advances in Thermokarst Research, Permafrost Periglac., 24, 108–119, https://doi.org/10.1002/ppp.1779, 2013.
Kokelj, S. V., Tunnicliffe, J., Lacelle, D., Lantz, T. C., Chin, K. S., and Fraser, R.: Increased precipitation drives mega slump development and destabilization of ice-rich permafrost terrain, northwestern Canada, Global Planet. Change, 129, 56–68, https://doi.org/10.1016/j.gloplacha.2015.02.008, 2015.
Kokelj, S. V., Kokoszka, J., van der Sluijs, J., Rudy, A. C. A., Tunnicliffe, J., Shakil, S., Tank, S. E., and Zolkos, S.: Thaw-driven mass wasting couples slopes with downstream systems, and effects propagate through Arctic drainage networks, The Cryosphere, 15, 3059–3081, https://doi.org/10.5194/tc-15-3059-2021, 2021.
Koller, M.: robustlmm: An R Package for Robust Estimation of Linear Mixed-Effects Models, J. Stat. Softw., 75, 1–24, https://doi.org/10.18637/jss.v075.i06, 2016.
Koven, C. D., Ringeval, B., Friedlingstein, P., Ciais, P., Cadule, P., Khvorostyanov, D., Krinner, G., and Tarnocai, C.: Permafrost carbon-climate feedbacks accelerate global warming, P. Natl. Acad. Sci. USA, 108, 14769–14774, https://doi.org/10.1073/pnas.1103910108, 2011.
Kramer, M. G. and Chadwick, O. A.: Climate-driven thresholds in reactive mineral retention of soil carbon at the global scale, Nat. Clim. Change, 8, 1104–1108, https://doi.org/10.1038/s41558-018-0341-4, 2018.
Kunitsky, V. V., Syromyatnikov, I., Schirrmeister, L., Skachov, Y. B., Grosse, G., Wetterich, S., and Grigoriev, M. N.: Ice-rich Permafrost and thermal denudation in the Batagay area (Yana Upland, East Siberia), Earth Cryosphere (Kriosfera Zemli), 17, 56–58, 2013.
Lacelle, D., Brooker, A., Fraser, R. H., and Kokelj, S. V.: Distribution and growth of thaw slumps in the Richardson Mountains–Peel Plateau region, northwestern Canada, Geomorphology, 235, 40–51, https://doi.org/10.1016/j.geomorph.2015.01.024, 2015.
Lafrenière, M. J. and Lamoureux, S. F.: Thermal Perturbation and Rainfall Runoff have Greater Impact on Seasonal Solute Loads than Physical Disturbance of the Active Layer, Permafrost Periglac., 24, 241–251, https://doi.org/10.1002/ppp.1784, 2013.
Lajeunesse, P. and Hanson, M. A.: Field observations of recent transgression on northern and eastern Melville Island, western Canadian Arctic Archipelago, Geomorphology, 101, 618–630, https://doi.org/10.1016/j.geomorph.2008.03.002, 2008.
Lamhonwah, D., Lafreniere, M., Lamoureux, S., and Wolfe, B.: Multi-year impacts of permafrost disturbance and thermal perturbation on High Arctic stream chemistry, Arctic Science, 3, 254–276, https://doi.org/10.1139/AS-2016-0024, 2016.
Lamhonwah, D., Lafrenière, M. J., Lamoureux, S. F., and Wolfe, B. B.: Evaluating the hydrological and hydrochemical responses of a High Arctic catchment during an exceptionally warm summer, Hydrol. Process., 31, 2296–2313, https://doi.org/10.1002/hyp.11191, 2017.
Lamoureux, S. F. and Lafrenière, M. J.: Fluvial Impact of Extensive Active Layer Detachments, Cape Bounty, Melville Island, Canada, Arct. Antarct. Alp. Res., 41, 59–68, https://doi.org/10.1657/1523-0430-41.1.59, 2009.
Lamoureux, S. F. and Lafrenière, M. J.: More than just snowmelt: integrated watershed science for changing climate and permafrost at the Cape Bounty Arctic Watershed Observatory, WIREs Water, 5, e1255, https://doi.org/10.1002/wat2.1255, 2018.
Lavallee, J. M., Soong, J. L., and Cotrufo, M. F.: Conceptualizing soil organic matter into particulate and mineral-associated forms to address global change in the 21st century, Glob. Change Biol., 26, 261–273, https://doi.org/10.1111/gcb.14859, 2020.
Leibman, M., Kizyakov, A., Zhdanova, Y., Sonyushkin, A., and Zimin, M.: Coastal Retreat Due to Thermodenudation on the Yugorsky Peninsula, Russia during the Last Decade, Update since 2001–2010, Remote Sens., 13, 4042, https://doi.org/10.3390/rs13204042, 2021.
Martens, J., Mueller, C. W., Joshi, P., Rosinger, C., Maisch, M., Kappler, A., Bonkowski, M., Schwamborn, G., Schirrmeister, L., and Rethemeyer, J.: Stabilization of mineral-associated organic carbon in Pleistocene permafrost, Nat. Commun., 14, 2120, https://doi.org/10.1038/s41467-023-37766-5, 2023.
McGuire, A. D., Lawrence, D. M., Koven, C., Clein, J. S., Burke, E., Chen, G., Jafarov, E., MacDougall, A. H., Marchenko, S., Nicolsky, D., Peng, S., Rinke, A., Ciais, P., Gouttevin, I., Hayes, D. J., Ji, D., Krinner, G., Moore, J. C., Romanovsky, V., Schädel, C., Schaefer, K., Schuur, E. A. G., and Zhuang, Q.: Dependence of the evolution of carbon dynamics in the northern permafrost region on the trajectory of climate change, P. Natl. Acad. Sci. USA, 115, 3882–3887, https://doi.org/10.1073/pnas.1719903115, 2018.
Meredith, M., Sommerkorn, M., Cassotta, S., Derksen, C., Ekaykin, A., Hollowed, A., Kofinas, G., Mackintosh, A., Melbourne-Thomas, J., Muelbert, M. M. C., Ottersen, G., Pritchard, H., and Schuur, E. A. G.: Polar Regions, in: IPCC Special Report on the Ocean and Cryosphere in a Changing Climate, edited by: Pörtner, H.-O., Roberts, D. C., Masson-Delmotte, V., Zhai, P., Tignor, M., Poloczanska, E., Mintenbeck, K., Alegría, A., Nicolai, M., Okem, A., Petzold, J., Rama, B., and Weyer, N. M., Cambridge University Press, Cambridge, UK and New York, NY, USA, 203–320, https://doi.org/10.1017/9781009157964.005, 2019.
Mikutta, R., Kleber, M., Torn, M. S., and Jahn, R.: Stabilization of Soil Organic Matter: Association with Minerals or Chemical Recalcitrance?, Biogeochemistry, 77, 25–56, https://doi.org/10.1007/s10533-005-0712-6, 2006.
Monhonval, A., Strauss, J., Mauclet, E., Hirst, C., Bemelmans, N., Grosse, G., Schirrmeister, L., Fuchs, M., and Opfergelt, S.: Iron Redistribution Upon Thermokarst Processes in the Yedoma Domain, Front. Earth Sci., 9, 703339, https://doi.org/10.3389/feart.2021.703339, 2021a.
Monhonval, A., Mauclet, E., Pereira, B., Vandeuren, A., Strauss, J., Grosse, G., Schirrmeister, L., Fuchs, M., Kuhry, P., and Opfergelt, S.: Mineral Element Stocks in the Yedoma Domain: A Novel Method Applied to Ice-Rich Permafrost Regions, Front. Earth Sci., 9, 773, https://doi.org/10.3389/feart.2021.703304, 2021b.
Monhonval, A., Strauss, J., Thomas, M., Hirst, C., Titeux, H., Louis, J., Gilliot, A., du Bois d'Aische, E., Pereira, B., Vandeuren, A., Grosse, G., Schirrmeister, L., Jongejans, L. L., Ulrich, M., and Opfergelt, S.: Thermokarst processes increase the supply of stabilizing surfaces and elements (Fe, Mn, Al, and Ca) for mineral–organic carbon interactions, Permafrost Periglac., 33, 452–469, https://doi.org/10.1002/ppp.2162, 2022.
Monhonval, A., Mauclet, E., Hirst, C., Bemelmans, N., Eekman, E., Schuur, E. A. G., and Opfergelt, S.: Mineral organic carbon interactions in dry versus wet tundra soils, Geoderma, 436, 116552, https://doi.org/10.1016/j.geoderma.2023.116552, 2023.
Natali, S. M., Holdren, J. P., Rogers, B. M., Treharne, R., Duffy, P. B., Pomerance, R., and MacDonald, E.: Permafrost carbon feedbacks threaten global climate goals, P. Natl. Acad. Sci. USA, 118, e2100163118, https://doi.org/10.1073/pnas.2100163118, 2021.
Opfergelt, S.: The next generation of climate model should account for the evolution of mineral-organic interactions with permafrost thaw, Environ. Res. Lett., 15, 091003, https://doi.org/10.1088/1748-9326/ab9a6d, 2020.
Opfergelt, S., Mauclet, E., Lefebvre, B., Monhonval, A., Bertouille, N., Vandeuren, A., Pereira, B., Hirst, C., Kuhry, P., Strauss, J., Grosse, G., and Conley, D. J.: The permafrost mineral reserve: identify potential mineral nutrient hotspots upon thawing, in: 5th European Conference on Permafrost, Chamonix Mont-Blanc, France, 780–781, https://hdl.handle.net/2078.5/127981 (last access; 7 April 2020), 2018.
Paquette, M., Lafrenière, M. J., and Lamoureux, S. F.: Landscape influence on permafrost ground ice geochemistry in a polar desert environment, Resolute Bay, Nunavut, Arctic Science, 9, 465–482, https://doi.org/10.1139/as-2021-0049, 2023.
Parfitt, R. L. and Childs, C. W.: Estimation of forms of Fe and Al – a review, and analysis of contrasting soils by dissolution and Mossbauer methods, Soil Res., 26, 121–144, https://doi.org/10.1071/sr9880121, 1988.
Patzner, M. S., Mueller, C. W., Malusova, M., Baur, M., Nikeleit, V., Scholten, T., Hoeschen, C., Byrne, J. M., Borch, T., Kappler, A., and Bryce, C.: Iron mineral dissolution releases iron and associated organic carbon during permafrost thaw, Nat. Commun., 11, 6329, https://doi.org/10.1038/s41467-020-20102-6, 2020.
Rantanen, M., Karpechko, A. Y., Lipponen, A., Nordling, K., Hyvärinen, O., Ruosteenoja, K., Vihma, T., and Laaksonen, A.: The Arctic has warmed nearly four times faster than the globe since 1979, Commun. Earth Environ., 3, 1–10, https://doi.org/10.1038/s43247-022-00498-3, 2022.
Ravansari, R., Wilson, S. C., and Tighe, M.: Portable X-ray fluorescence for environmental assessment of soils: Not just a point and shoot method, Environ. Int., 134, 105250, https://doi.org/10.1016/j.envint.2019.105250, 2020.
R Core Team: R: A Language and Environment for Statistical Computing, https://www.r-project.org/ (last access: 23 October 2025), 2025.
Rennert, T.: Wet-chemical extractions to characterise pedogenic Al and Fe species – a critical review, Soil Res., 57, 1–16, https://doi.org/10.1071/SR18299, 2019.
Rowley, M. C., Grand, S., and Verrecchia, É. P.: Calcium-mediated stabilisation of soil organic carbon, Biogeochemistry, 137, 27–49, https://doi.org/10.1007/s10533-017-0410-1, 2018.
Rowley, M. C., Pena, J., Marcus, M. A., Porras, R., Pegoraro, E., Zosso, C., Ofiti, N. O. E., Wiesenberg, G. L. B., Schmidt, M. W. I., Torn, M. S., and Nico, P. S.: Calcium is associated with specific soil organic carbon decomposition products, SOIL, 11, 381–388, https://doi.org/10.5194/soil-11-381-2025, 2025.
Rudy, A. C. A., Lamoureux, S. F., Treitz, P., and Collingwood, A.: Identifying permafrost slope disturbance using multi-temporal optical satellite images and change detection techniques, Cold Reg. Sci. Technol., 88, 37–49, https://doi.org/10.1016/j.coldregions.2012.12.008, 2013.
Salvadó, J. A., Tesi, T., Andersson, A., Ingri, J., Dudarev, O. V., Semiletov, I. P., and Gustafsson, Ö.: Organic carbon remobilized from thawing permafrost is resequestered by reactive iron on the Eurasian Arctic Shelf, Geophys. Res. Lett., 42, 8122–8130, https://doi.org/10.1002/2015GL066058, 2015.
Schuur, E. A. G., McGuire, A. D., Schädel, C., Grosse, G., Harden, J. W., Hayes, D. J., Hugelius, G., Koven, C. D., Kuhry, P., Lawrence, D. M., Natali, S. M., Olefeldt, D., Romanovsky, V. E., Schaefer, K., Turetsky, M. R., Treat, C. C., and Vonk, J. E.: Climate change and the permafrost carbon feedback, Nature, 520, 171–179, https://doi.org/10.1038/nature14338, 2015.
Schuur, E. A. G., Abbott, B. W., Commane, R., Ernakovich, J., Euskirchen, E., Hugelius, G., Grosse, G., Jones, M., Koven, C., Leshyk, V., Lawrence, D., Loranty, M. M., Mauritz, M., Olefeldt, D., Natali, S., Rodenhizer, H., Salmon, V., Schädel, C., Strauss, J., Treat, C., and Turetsky, M.: Permafrost and Climate Change: Carbon Cycle Feedbacks From the Warming Arctic, Annu. Rev. Env. Resour., 47, 343–371, https://doi.org/10.1146/annurev-environ-012220-011847, 2022.
Séjourné, A., Costard, F., Fedorov, A., Gargani, J., Skorve, J., Massé, M., and Mège, D.: Evolution of the banks of thermokarst lakes in Central Yakutia (Central Siberia) due to retrogressive thaw slump activity controlled by insolation, Geomorphology, 241, 31–40, https://doi.org/10.1016/j.geomorph.2015.03.033, 2015.
Shakil, S., Tank, S. E., Kokelj, S. V., Vonk, J. E., and Zolkos, S.: Particulate dominance of organic carbon mobilization from thaw slumps on the Peel Plateau, NT: Quantification and implications for stream systems and permafrost carbon release, Environ. Res. Lett., 15, 114019, https://doi.org/10.1088/1748-9326/abac36, 2020.
Stanton, T.: Soil Properties and Trace Gas Fluxes in a Chronosequence of Permafrost Disturbances, Cape Bounty, Melville Island, Nunavut, Master Thesis, Queen's University, Kingston, Ontario, Canada, 128 pp., 2023.
Strauss, J., Abbott, B. W., Hugelius, G., Schuur, E. A. G., Treat, C., Fuchs, M., Schädel, C., Ulrich, M., Turetsky, M., Keuschnig, M., Biasi, C., Yang, Y., and Grosse, G.: Permafrost, in: Recarbonizing global soils – A technical manual of recommended management practices, vol. Volume 2: Hot spots and bright spots of soil organic carbon, FAO, Rome, Italy, https://doi.org/10.4060/cb6378en, 2021.
Strauss, J., Fuchs, M., Hugelius, G., Miesner, F., Nitze, I., Opfergelt, S., Schuur, E., Treat, C., Turetsky, M., Yang, Y., and Grosse, G.: Organic matter storage and vulnerability in the permafrost domain, in: Reference Module in Earth Systems and Environmental Sciences, Elsevier, https://doi.org/10.1016/B978-0-323-99931-1.00164-1, 2024.
Tanski, G., Lantuit, H., Ruttor, S., Knoblauch, C., Radosavljevic, B., Strauss, J., Wolter, J., Irrgang, A. M., Ramage, J., and Fritz, M.: Transformation of terrestrial organic matter along thermokarst-affected permafrost coasts in the Arctic, Sci. Total Environ., 581–582, 434–447, https://doi.org/10.1016/j.scitotenv.2016.12.152, 2017.
Thomas, M., Monhonval, A., Hirst, C., Bröder, L., Zolkos, S., Vonk, J. E., Tank, S. E., Keskitalo, K. H., Shakil, S., Kokelj, S. V., van der Sluijs, J., and Opfergelt, S.: Evidence for preservation of organic carbon interacting with iron in material displaced from retrogressive thaw slumps: Case study in Peel Plateau, western Canadian Arctic, Geoderma, 433, 116443, https://doi.org/10.1016/j.geoderma.2023.116443, 2023.
Thomas, M., Jongejans, L. L., Strauss, J., Vermylen, C., Calcus, S., Opel, T., Kizyakov, A., Wetterich, S., Grosse, G., and Opfergelt, S.: A Third of Organic Carbon Is Mineral Bound in Permafrost Sediments Exposed by the World's Largest Thaw Slump, Batagay, Siberia, Permafrost Periglac., 35, 278–293, https://doi.org/10.1002/ppp.2230, 2024.
Thomas, M., Fouché, J., Titeux, H., Morelle, C., Bemelmans, N., Lafrenière, M., Heslop, J. K., and Opfergelt, S.: Mineral-bound organic carbon exposed by hillslope thermokarst terrain: case study in Cape Bounty, Canadian High Arctic, V1, Open Data @ UCLouvain [data set], https://doi.org/10.14428/DVN/5O6FJ3, 2025.
Treitz, P. M., Atkinson, D. M., Blaser, A., Bonney, M. T., Braybrook, C. A., Buckley, E. C., Collingwood, A., Edwards, R., van Ewijk, K., Freemantle, V., Gregory, F., Holloway, J., Hung, J. K. Y., Lamoureux, S. F., Liu, N., Ljubicic, G., Robson, G., Rudy, A. C. A., Scott, N. A., Shang, C., and Wall, J.: Remote sensing of biogeophysical variables at the Cape Bounty Arctic Watershed Observatory, Melville Island, Nunavut, Canada, Arctic Science, 10, 281–304, https://doi.org/10.1139/as-2023-0043, 2024.
Turetsky, M. R., Abbott, B. W., Jones, M. C., Anthony, K. W., Olefeldt, D., Schuur, E. A. G., Grosse, G., Kuhry, P., Hugelius, G., Koven, C., Lawrence, D. M., Gibson, C., Sannel, A. B. K., and McGuire, A. D.: Carbon release through abrupt permafrost thaw, Nat. Geosci., 13, 138–143, https://doi.org/10.1038/s41561-019-0526-0, 2020.
Vadakkedath, V., Zawadzki, J., and Przeździecki, K.: Multisensory satellite observations of the expansion of the Batagaika crater and succession of vegetation in its interior from 1991 to 2018, Environ. Earth Sci., 79, 150, https://doi.org/10.1007/s12665-020-8895-7, 2020.
van der Sluijs, J., Kokelj, S. V., Fraser, R. H., Tunnicliffe, J., and Lacelle, D.: Permafrost Terrain Dynamics and Infrastructure Impacts Revealed by UAV Photogrammetry and Thermal Imaging, Remote Sens., 10, 1734, https://doi.org/10.3390/rs10111734, 2018.
van der Sluijs, J., Kokelj, S. V., and Tunnicliffe, J. F.: Allometric scaling of retrogressive thaw slumps, The Cryosphere, 17, 4511–4533, https://doi.org/10.5194/tc-17-4511-2023, 2023.
von Lützow, M., Kögel-Knabner, I., Ekschmitt, K., Matzner, E., Guggenberger, G., Marschner, B., and Flessa, H.: Stabilization of organic matter in temperate soils: mechanisms and their relevance under different soil conditions – a review, European J. Soil Sci., 57, 426–445, https://doi.org/10.1111/j.1365-2389.2006.00809.x, 2006.
Wagai, R. and Mayer, L. M.: Sorptive stabilization of organic matter in soils by hydrous iron oxides, Geochim. Cosmochim. Ac., 71, 25–35, https://doi.org/10.1016/j.gca.2006.08.047, 2007.
- Abstract
- Introduction
- Materials and Methods
- Results
- Discussion
- Conclusion
- Appendix A: Bulk elements concentrations assessment
- Appendix B: Total concentrations
- Appendix C: Bulk mineralogy
- Appendix D: Selective extractions
- Appendix E: Soil aggregate and density fractionation
- Data availability
- Author contributions
- Competing interests
- Disclaimer
- Acknowledgements
- Financial support
- Review statement
- References