the Creative Commons Attribution 4.0 License.
the Creative Commons Attribution 4.0 License.
 | 11 Jun 2021
Impact of freeze–thaw cycles on soil structure and soil hydraulic properties
Steffen Schlüter
The ploughing of soils in autumn drastically loosens the soil structure and, at the same time, reduces its stability against external stresses. A fragmentation of these artificially produced soil clods during wintertime is often observed in areas with air temperatures fluctuating around the freezing point. From the pore perspective, it is still unclear (i) under which conditions frost action has a measurable effect on soil structure, (ii) what the impact on soil hydraulic properties is, and (iii) how many freeze–thaw cycles (FTCs) are necessary to induce soil structure changes.
The aim of this study was to analyse the cumulative effects of multiple FTC on soil structure and soil hydraulic properties for two different textures and two different initial structures. A silt clay with a substantial amount of swelling clay minerals and a silty loam with fewer swell/shrink dynamics were either kept intact in undisturbed soil cores taken from the topsoil from a grassland or repacked with soil clods taken from a ploughed field nearby. FTCs were simulated under controlled conditions and changes in pore structure ≥ 48 µm were regularly recorded using X-ray µCT. After 19 FTCs, the impact on hydraulic properties were measured, and the resolution of structural characteristics were enhanced towards narrow macropores with subsamples scanned at 10 µm.
The impact of FTC on soil structure was dependent on the initial structure, soil texture, and the number of FTCs. Frost action induced a consolidation of repacked soil clods, resulting in a systematic reduction in pore sizes and macropore connectivity. In contrast, the macropore systems of the undisturbed soils were only slightly affected. Independent of the initial structure, a fragmentation of soil clods and macro-aggregates larger than 0.8 to 1.2 mm increased the connectivity of pores smaller than 0.5 to 0.8 mm. The fragmentation increased the unsaturated hydraulic conductivity of all treatments by a factor of 3 in by a factor of 3 in a matrix potential range of −100 to −350 hPa, while water retention was only slightly affected for the silt clay soil. Already 2 to 5 FTCs enforced a well-connected pore system of narrow macropores in all treatments, but it was steadily improved by further FTCs. The implications of fewer FTCs during milder winters caused by global warming are twofold. In ploughed soils, the beneficial seedbed consolidation will be less intense. In grassland soils, which have reached a soil structure in dynamic equilibrium that has experienced many FTCs in the making, there is still a beneficial increase in water supply through increasing unsaturated hydraulic conductivity by continued FTCs that might also be less efficient in the future.
- Article
(3046 KB) - Full-text XML
-
Supplement
(1077 KB) - BibTeX
- EndNote


Soil structure is shaped by various biotic and abiotic drivers, such as bioturbation or wetting and drying, but also by ploughing or compaction (Rabot et al., 2018). In the mid-latitudes, where winter months are dominated by fluctuating temperatures around an air temperature of 0 ∘C, frost is an important pedogenic agent on structure development, consolidation, deformation, and particle transport (Van Vliet-Lanoë and Fox, 2018). When farmers plough their fields in late autumn, they create a rough soil surface of soil clods that are exposed to temperature and moisture change throughout the winter. Soil cultivation in spring can be facilitated if the soil clods are broken up into a fine and fragmented soil structure by exposure to frost (Edwards, 2013). For compacted soils, Jabro et al. (2014) evaluated freezing and thawing associated with typical winter weather conditions as the most effective and economical way to alleviate soil compaction in a clay loam. Soil fragmentation and the creation of new pores by frost can change hydraulic properties of soils (Qi et al., 2006; Chamberlain and Gow, 1979) and reduce the risk of soil and nutrient loss in spring snowmelt (Deelstra et al., 2009). The prospect of milder and drier winters in the mid-latitudes due to climate change (Kjellström et al., 2018) could influence this seasonal structural transformation (Daigh and DeJong-Hughes, 2017).
The regular periodic alternation of radiation leads to temperature fluctuations in the topsoil, the amplitude of which depends on the heat capacity of the soil and its thermal conductivity. Both properties vary among different soil constituents, which affects the freezing process of soils. Water has a low thermal conductivity compared to quartz and clay minerals but a high specific heat capacity (Bolt and Miller, 1958). The heat transfer in soil is also dependent on the connectivity of the porous medium, which, for solid matter, is limited to single contact points. A high water content increases the area between particles for heat transfer and, thus, promotes the heat transport to depths. As water is moving in such a porous system, additional heat is transferred by convection. The different thermal conductivities of the soil constituents can lead to an uneven spatial distribution of ice crystal formation. A well-known example is the upheaval of stones to the soil surface due to their comparably high thermal conductivity and the resulting formation of ice crystals on their underside (Van Vliet-Lanoe and Dupas, 1991). During frost action, the resulting forces that lead to the disintegration of large aggregates by pressure release are strongly dependent on the soil water content (Henry, 2007; Kværnø and Øygarden, 2006; Oztas and Fayetorbay, 2003). In saturated and nearly saturated systems, the volumetric extension of freezing water in soil pores by about 10 % can reach a surface pressure ranging up to 460 kPa (Dagesse, 2013). This potential can only be reached when the extension of water is blocked by soil particles and entrapped air; thus, in unsaturated soil freezing water can expand into empty larger pores. At the microscale, the temperature at which water freezes is dependent on the pore diameter and the amount of solutes, which govern matric potential and osmotic potential, respectively (Ashworth and Abeles, 1984; Ren and Vanapalli, 2019). Experiments with defined filter pores sizes have shown that, in pores smaller than 100 nm, the freezing point of water was reduced to −0.8 ∘C and further to −4 ∘C for pores with 15 nm in diameter. When ice crystals are built, surrounding water flows towards them and accumulates at the freezing front (Hansson et al., 2004; Loch, 1982; Torrance et al., 2008). While the desiccation process during freezing may initially increase the stability of soil aggregates, structural breakdown may be associated to the rewetting process during thawing (Dagesse, 2013).
Differences in heat transfer, the freezing temperature of soil solution in pores, and the affinity of water to move to the border of ice formation can induce local heterogeneities of ice formation processes, wetting, and drying, and, thus, cause soil structure changes by frost. Previous studies on the impact of FTCs on microstructure focused mainly on measurements of soil structure stability and not on the impact on the pore network. Based on wet sieving and stability measurements, it was shown that aggregate stability decreased with number of FTCs and with increasing water content. Soils with clay contents between 30 % and 60 % were more susceptible to stability deterioration than loamy soils with less clay (Oztas and Fayetorbay, 2003; Dagesse, 2013). Lehrsch (1998) observed an increase in stability after 2 to 3 FTCs with little changes thereafter for aggregates from different loamy soils at field moisture. Ma et al. (2019) found a continuous and significant reduction in aggregate size distribution for different soil conditions after 1 to 30 FTCs. Six et al. (2004) summarized that the described differences in ice formation at the microscale lead to opposing processes of aggregate degradation by wetting and aggregate stabilization by drying. Therefore, aggregate stability measurements on bulk samples would result in an average of both processes. On a soil column scale, Starkloff et al. (2017) determined, via X-ray µCT scanning, a reduction in macroporosity (> 140 µm pore diameter), pore thickness, and their specific surface area after 6 FTCs for a silty clay loam and especially for a loamy sand. For fine-textured soils, the creation of new vertical shrinkage cracks increased the water permeability, although a reduction in total larger voids was observed (Chamberlain and Gow, 1979). In his review about FTC experiments in soil science, Henry (2007) remarked that many experiments used artificially rapid rates of temperature change and unrealistic minima of −20 ∘C, using a typical laboratory freezer. Rapid freezing could reduce the impact of FTCs by promoting the formation of relatively small ice crystals (Henry, 2007). In addition, most studies were based on a small number of FTCs and neglected the chance that mechanical stress can accumulate with multiple FTCs.
The aim of this study was to analyse how multiple FTCs change the structure of two differently textured soils and which structural features promote the decay of clods as observed by farmers. The development of soil structure during the experiment, in terms of macropore characteristics and pore distances in the solid phase, was analysed by X-ray µCT at a resolution of 48 µm. At the end of the experiment, the results were complemented by structural information of small macropores ≥ 10 µm obtained by X-ray computed tomography (CT) scans of subsamples. Furthermore, the determination of the hydraulic properties contributed indirect information on the development of the pore system towards the mesopores (0.2–10 µm). The experimental set-up followed the recommendations of Henry (2007), i.e. the cumulative effect of 19 FTCs was investigated, the temperature amplitude was adapted to field conditions, and the freezing process was conducted from top to bottom. The hypotheses were that (i) multiple freezing and thawing alter soil structure and hydraulic properties by the decay of soil clods and the creation of new pores, (ii) the magnitude of structural changes through FTCs varies with the amount of swelling clay minerals, and (iii) a soil structure that has been developed over a long time is more stable against mechanical stresses imposed by FTCs than an unconsolidated structure produced by ploughing.
2.1 Field site, sampling, and sample preparation
Soils from two different study sites in Germany were used, which differ in texture, organic matter content, and clay mineralogy. The soil in Giessen was characterized as Fluvic Gleysol on loamy sandy sediments over a clay layer (FAO taxonomy), where the soil texture was a silt clay (20 % sand, 40 % silt, and 40 % clay), and the organic matter content was 4.46 % (Jäger et al., 2003). The volume fraction of clay minerals was ordered as vermiculite > vermiculite–illite interstratifications = illite > chlorite = kaolinite with overall high swelling capacity (Diel et al., 2019). The soil texture of the Haplic Chernozem at Bad Lauchstaedt was a silty loam (11 % sand, 68 % silt, and 21 % clay), and the soil organic matter content was 2.05 % (Altermann et al., 2005). The order of clay mineral fractions was illite > kaolinite > vermiculite (Dreibrodt et al., 2002), and the swelling capacity was comparably lower. Undisturbed samples were taken at both field sites below the grass cover at a depth of 5 cm with 250 cm3 aluminium sample cylinders. The mean bulk density of the undisturbed silt clay samples was 1.06 g cm−3 (SD ± 0.04), and that of the silty loam was 1.46 g cm−3 (SD ± 0.06). In Bad Lauchstaedt, soil clods were taken from the surface of a ploughed bare fallow next to the grassland. In Giessen, clods were taken in the vicinity of the undisturbed soil cores from a ploughed grassland. Sampling took place in winter 2019–2020 before the first frost. Temperature profiles at 5, 10, and 20 cm depth below the soil surface from November to April 2017–2018 and 2018–2019 are provided in the Supplement (Sects. S1 and S2).
Empty 250 cm3 cylinders were repacked with soil clods at a bulk density of 0.70 g cm−3 (SD ± 0.01) for the silt clay and 0.85 g cm−3 (SD ± 0.06) for the silty loam to simulate the loose packing at the very surface of a ploughed field (Daraghmeh et al., 2009). The repacking of the soil clods of a specific size range reduced the structural heterogeneity often observed in a ploughed field with a much larger range of clod sizes. This reduction in heterogeneity was required to enable a statistical analysis of the structural development. The samples were not compacted in order to maintain the stability of the soil clods taken from the ploughed fields.
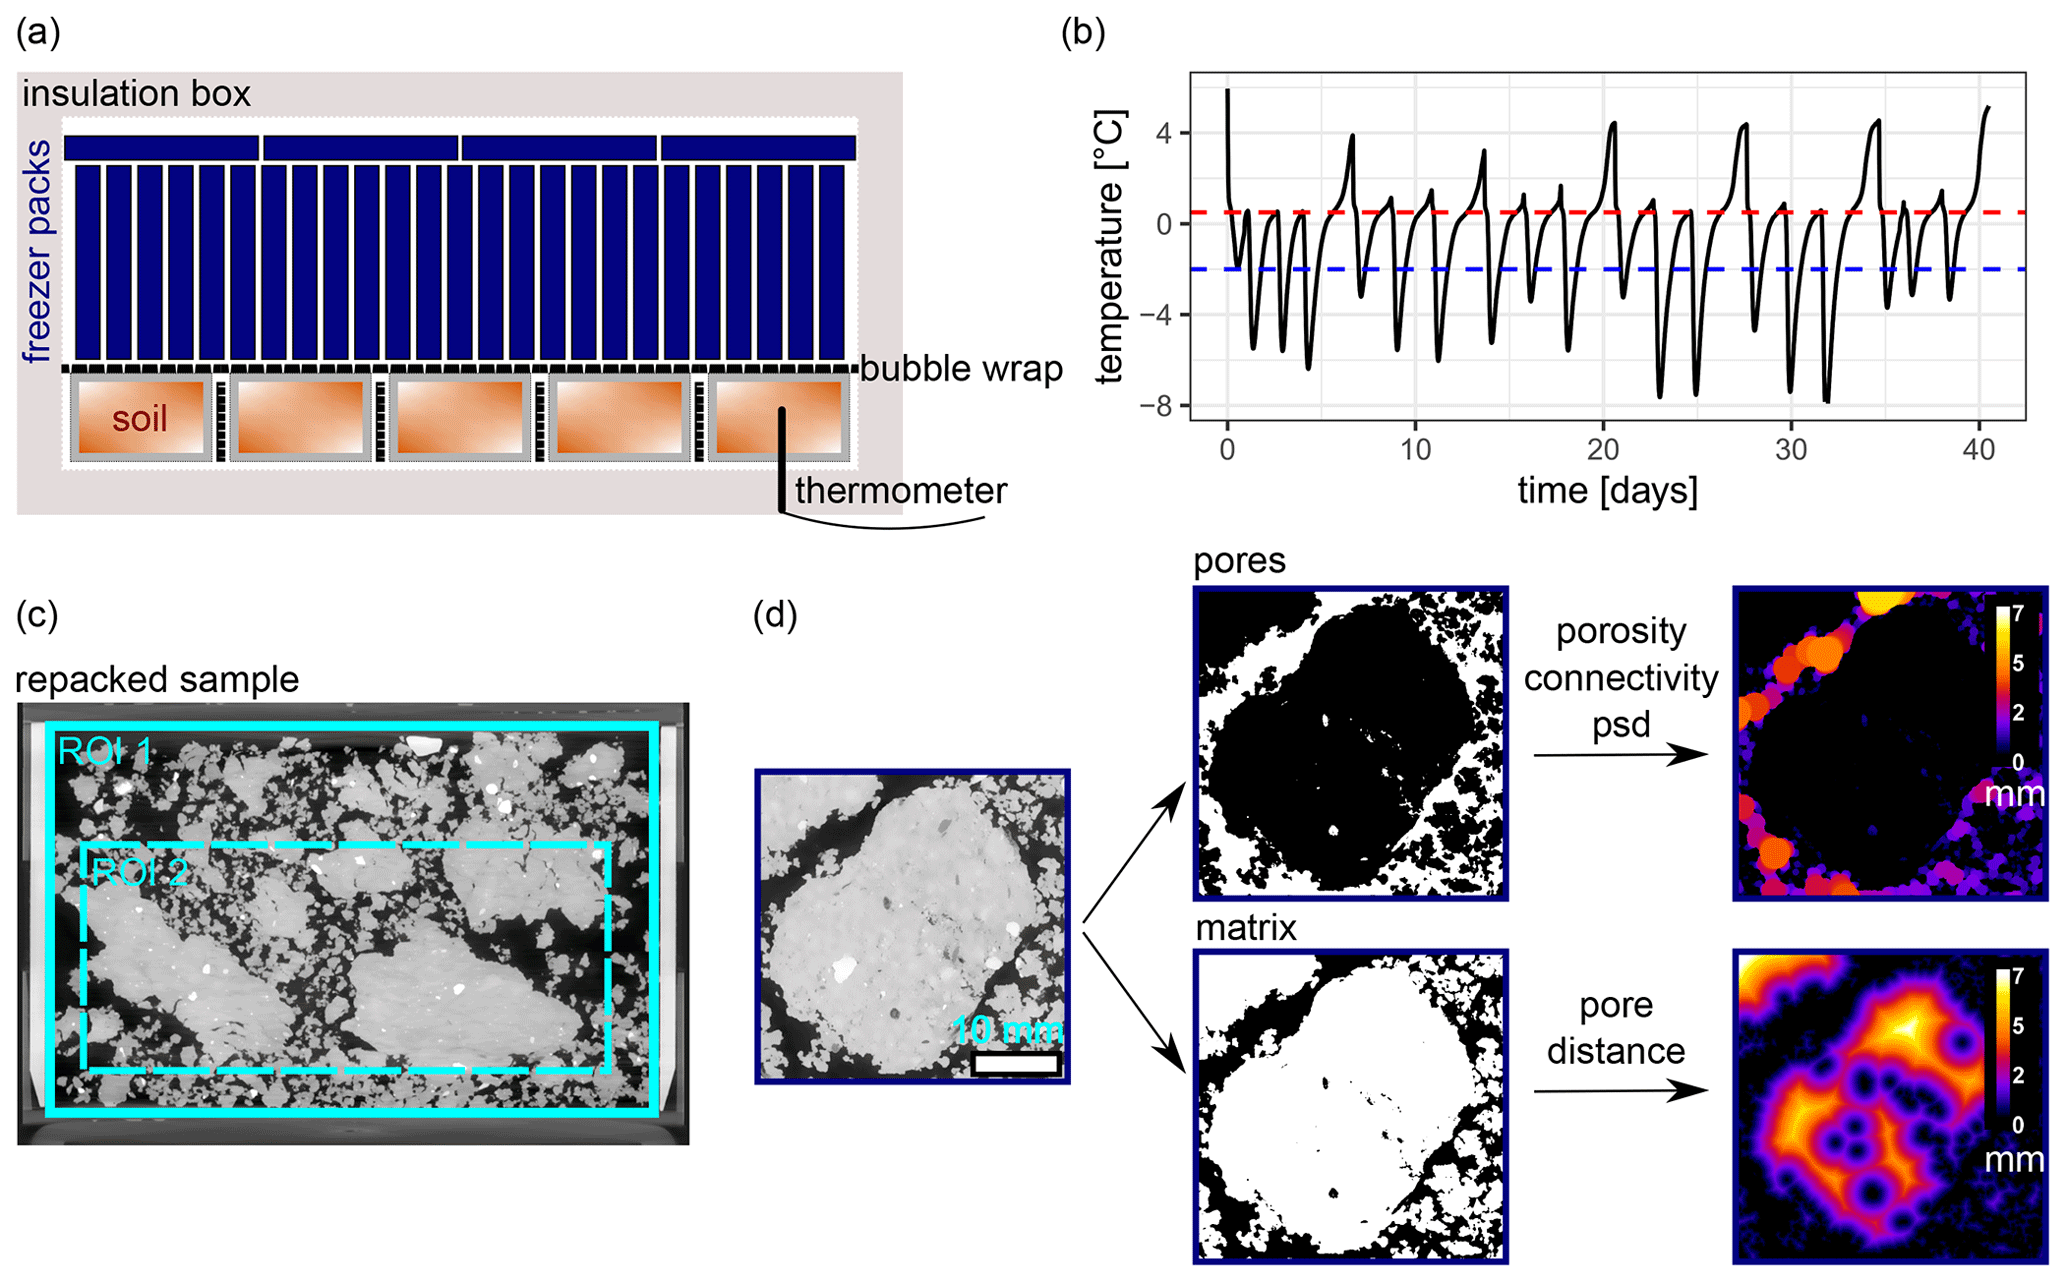
Figure 1Experimental set-up of the study (a), the temperature profile during the experiment (b), vertical view of a repacked silt clay sample with two different regions of interests for image analysis (c), and an overview of the different parameters determined via image analyses to detect structural transformation (d). The shown examples for pore size distribution (d, top right) and pore distance measurements (d, bottom right) contain 3-dimensional information.
The repacked and undisturbed 250 cm3 soil cores were placed in a sandbox (Eijkelkamp Soil & Water, the Netherlands) and capillary saturated at 0 hPa water pressure at the lower boundary. Then the matrix potential was adjusted to −10 hPa for 48 h to achieve rather uniform saturation within one treatment and to drain the largest macropores (∅ > 280 µm, according to Young–Laplace equation). The adjusted water contents of the undisturbed samples only slightly increased compared to the observed field conditions on the day of sampling (+0.8 vol. % silt clay; +6.2 vol. % silty loam). Samples were covered by a lid, sealed with Parafilm to prevent water loss by evaporation throughout the experiment, and weighed. Controls were kept in a refrigerator at 4 ∘C, and samples for FTC were randomly placed at the bottom of an insolation box (Fig. 1a). The space between samples was filled with bubble wrap to prevent freezing from the side. A layer of air-filled bubble wrap was also placed on top of the samples to slow down the freezing process. The set-up was covered with freezer packs that had an initial temperature of −25 ∘C. The temperature inside a soil column was measured every 10 min in the centre of a repacked control adjusted to the same water content using a Pt 100 thermometer (Omega Engineering GmbH, Germany) and a DT80 data logger (Thermo Fisher Scientific Inc., USA). The 0 ∘C point of the thermometer was calibrated with ice water before the start of the experiments. Every 2 to 3 d, when the soil temperature was above 0.5 ∘C and the freezer packs were completely thawed, the freezing packs were replaced to start the next FTC (Fig. 1b; representative temperature curve). Freezing was considered when soil temperature dropped below −2.0 ∘C. Those temperature thresholds (−2 and +0.5 ∘C) were only minimum requirements, i.e. FTCs were allowed to progress beyond them. For each study site, seven repacked samples (R) and five undisturbed samples (U) were subjected to FTCs, while five repacked samples (R control) and three undisturbed samples (U control) were kept as a control.
After 19 FTCs, eight to 10 subsamples (16 mm in diameter; 16 mm in height) per treatment were taken from the top of two 250 cm3 samples. To do so, the soil was slowly pushed out of the 250 cm3 cylinders from the bottom, and in doing so, sharpened aluminium cylinders with a fixed position were gently pushed into the soil from the top. Before scanning, the subsamples were dried for 6 to 10 h at room temperature to drain the water retained in the visible macropores ≥ 10 µm, which corresponds to a water potential of −300 hPa. The targeted water loss was calculated by the treatment-specific water retention curves and carefully observed on a precision balance. The slightly reduced water content of the subsamples increased the image contrast for smallest visible pores but was well above causing a structural change due to clay mineral shrinkage.
2.2 X-ray CT and image processing
X-ray µCT scans were made after 0, 2, 5, 10, and 19 FTCs of both, control, and FTC subjected samples to track the cumulative soil structure alteration. Imaging was done with an industrial X-ray µCT device (X-Tek Systems Ltd; XT H 225, Nikon Metrology, Belgium). The 250 cm3 samples were scanned for 47 min using a 0.7 mm copper filter at 150 kV, 310 µA, resulting in 2000 projections (0.708 s per projections). A voxel resolution of 48 µm was achieved at an 8 bit greyscale resolution in the reconstructed tomogram. The energy settings of the subsamples were 125 kV and 95 µA without a filter, and a spatial resolution of 10 µm was achieved.
Image processing and analysis were done with the open source software packages Fiji ImageJ v1.53 (Schindelin et al., 2012) and Quantim (Vogel et al., 2010). The protocol mainly followed the procedure described in detail by Schlüter et al. (2016). First, the 250 cm3 samples were filtered with a 2D non-local means filter with a sigma of 15, as an estimate of the standard deviation of the grey value noise (Buades et al., 2011). Second, vertical differences in average image intensity due to uneven beam intensity were removed. Third, images were segmented into two classes, i.e. pore system and soil matrix, using the fuzzy c-means thresholding method (Jawahar et al., 1997; Schlüter et al., 2014).
Total visible macroporosity, defined as the CT-derived porosity, and its vertical variability were determined as the ratio between pore voxels to the total volume of sample cylinders. Therefore, the same region of interest (ROI 1) with 1600 voxel in diameter and 1000 voxel in height was adjusted to the lower boundary of each sample tomogram (Fig. 1c). The pore size distribution (PSD) was determined for a second ROI (ROI 2; Fig. 1c) placed in the centre of the sample to avoid the contribution by an empty headspace due to the settling of repacked samples by FTCs. The PSD was computed by the maximum inscribed sphere method, using the local thickness method (Fig. 1d) in Fiji ImageJ. The connectivity of the pore network was described by the connection probability (Γ) and the Euler number density (χ). The dimensionless Γ indicator reflects the probability of two randomly chosen pore voxels to belong to the same pore cluster (Renard and Allard, 2013) and was calculated for the entire sample (ROI 1) by the following:
where np is the total number of pore voxels in the analysed volume Xp, and ni is the number of pore voxels per cluster. χ, which quantifies the connectivity as the number of isolated pores minus the number of redundant connections plus the number of cavities (Vogel et al., 2010), was calculated with the MorphoLibJ plugin (Legland et al., 2016) and expressed as a density (mm−3) for ROI 2. Structural changes of the solid phase, i.e. the fragmentation of soil clods or the creation of new pores (Fig. 1d), were measured by the Euclidean distance of every voxel classified as soil matrix to the nearest pore (ROI 2). The mean pore size and the mean Euclidean distance of each sample was derived from the respective frequency distributions.
The settings of the subsamples differed slightly to those of the larger volumes. Here, a sigma of 10 was used to remove image noise, and correction of vertical image intensity was not necessary. The contrast between matrix and pores was enhanced by an unsharp mask (Schlüter et al., 2014). Image segmentation was based on the maximum variance between image classes (Otsu, 1979). The various structural parameters for the entire subsample volume were determined as described above.
2.3 Soil hydraulic properties
The soil water retention curve and the unsaturated hydraulic conductivity were measured using the HYPROP device (METER Group, Inc., USA) based on the evaporation method (Schindler et al., 2010). For each soil texture, five undisturbed FTC samples and three undisturbed controls were saturated and analysed for a pF range from 0 to 3.7. For the repacked samples (five R and five R control), a saturation of the sample was not possible due to their fragile soil structure. Here, the measurement of hydraulic properties started with the initial water content which was adjusted to −10 hPa (pF 1). The water content and hydraulic properties at pF 1.8, pF 2.5, and pF 3.7 were used for statistical analysis. At the end of the experiments, the soil cores were dried at 105 ∘C to determine the bulk density and the total porosity ϕ.
2.4 Statistical analysis
Data management, data analysis, and figures were done using the open source packages tidyverse (Wickham et al., 2019) and ggplot2 (Wickham, 2016) in R version 4.0.2 (R Core Team, 2020). The comparisons of means for each soil property as a function of FTC were done using a one-way analysis of variance (ANOVA) for repeated measures in the rstatix package (Kassambara, 2020). Parameters were tested for normality and homogeneity of variance for each time point by the Shapiro–Wilk test and Levene's test, respectively. The p values of the pairwise t tests were adjusted using the Bonferroni multiple testing correction method. Mean soil parameters determined at the end of the experiment, hydraulic properties, and structural characteristics of the subsamples, were checked for equal variance (F test) and compared with the Welch two-sample t test (control vs. FTC 19). The model fitting for trend analysis of the frequency distribution, i.e. the pore size distribution and pore distance, was done with the ggeom_smooth function in ggplot2, a local fitting of a polynomial surface determined by one or more numerical predictors. Γ is a dimensionless number between 0 and 1; hence, a statistical analysis with the used test models was not possible.

Figure 2Soil water retention curve (a) and unsaturated hydraulic conductivity (b) determined for the control samples (green) and after 19 FTCs (orange) for two different soil structures, i.e. repacked (top) and undisturbed (bottom), and two different soil textures, i.e. silt clay (left) and silty loam (right).
Table 1The mean total porosity (ϕ) and the mean soil hydraulic properties at different potentials, i.e. the water retention (θ) and unsaturated hydraulic conductivity (ku).
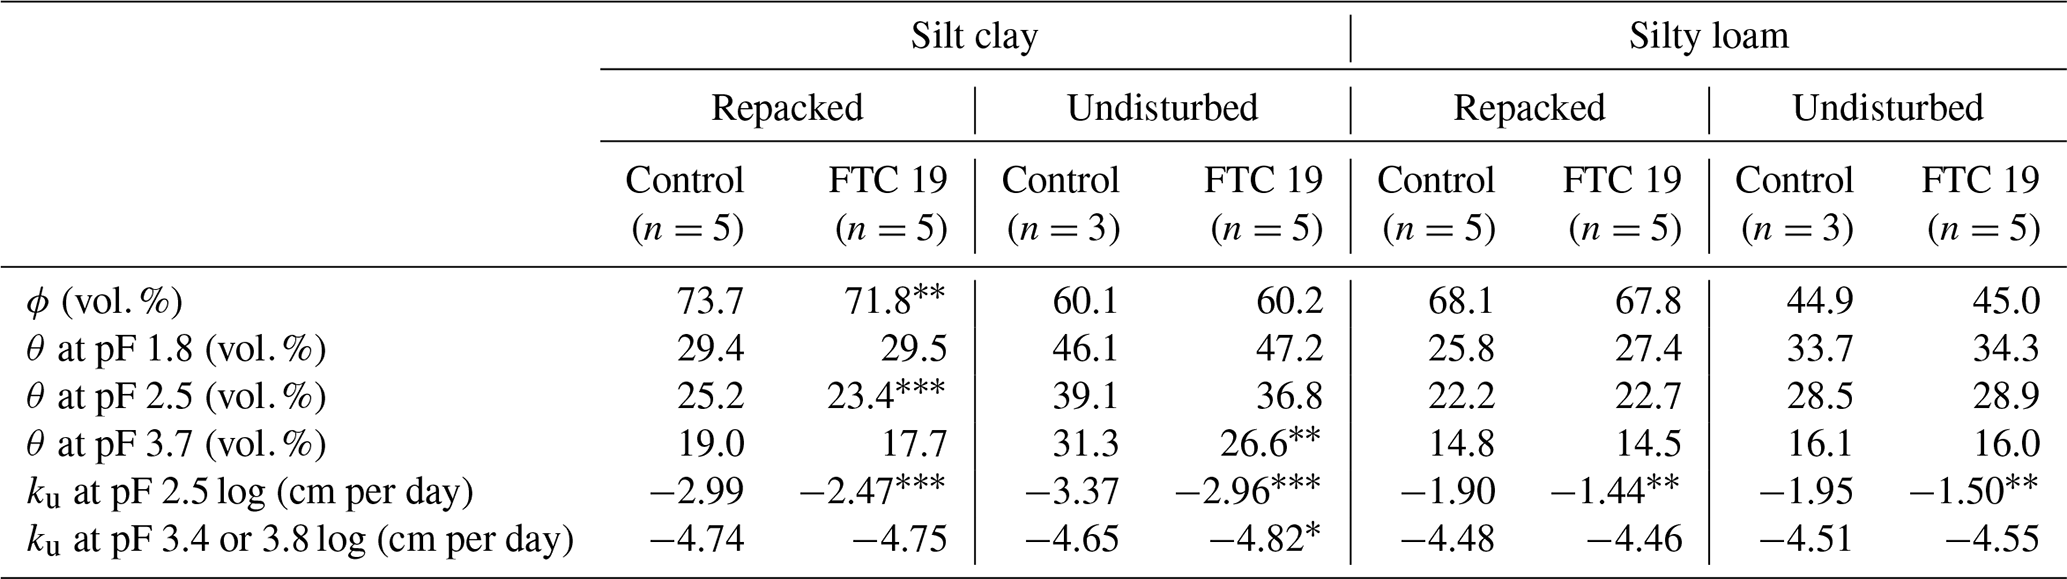
The level of statistical significance difference between FTC treatment and control within a soil texture and treatment determined by a t test refers to ∗ = p≤ 0.05, = p< 0.01, and = p < 0.001.
3.1 Soil hydraulic properties
The bulk density and, thus, the total porosity ϕ changed significantly after 19 FTCs for the repacked silt clay from 0.70 g cm−3 (ϕ = 73.7 vol. %) to 0.75 g cm−3 (ϕ = 71.8 vol. %), while the other treatments were not significantly affected (Table 1). In the repacked samples, 55 % (silt clay) to 35 % (silty loam) of the total pore volume was already drained at −10 hPa, the starting condition of the measurement. Thus, potential differences in water retention close to saturation were not detected. Figure 2 shows the soil water retention curve (Fig. 2a) and the unsaturated hydraulic conductivity (Fig. 2b) as a function of the negative logarithm of matrix potential (pF). With the exception of one repacked silty loam sample, a sample which was compacted most due to FTCs, the water retention curve shows little variability within the treatments. After 19 FTCs (Fig. 2; orange), freezing and thawing significantly changed the hydraulic properties of both soils textures and initial structures (Table 1). Compared to the controls (Fig. 2; green), water retention of the repacked silt clay was significantly reduced at pF 2.5 and for the undisturbed silt clay at pF 3.4. No significant differences in water retention were observed for the silty loam. In contrast, the unsaturated hydraulic conductivity of all treatments was significantly increased over a wide range from pF 2.0 to pF 3.0. The impact of 19 FTCs on soil hydraulic properties was significantly more pronounced for the unsaturated conductivity than for the water retention curve, especially for the silt clay.
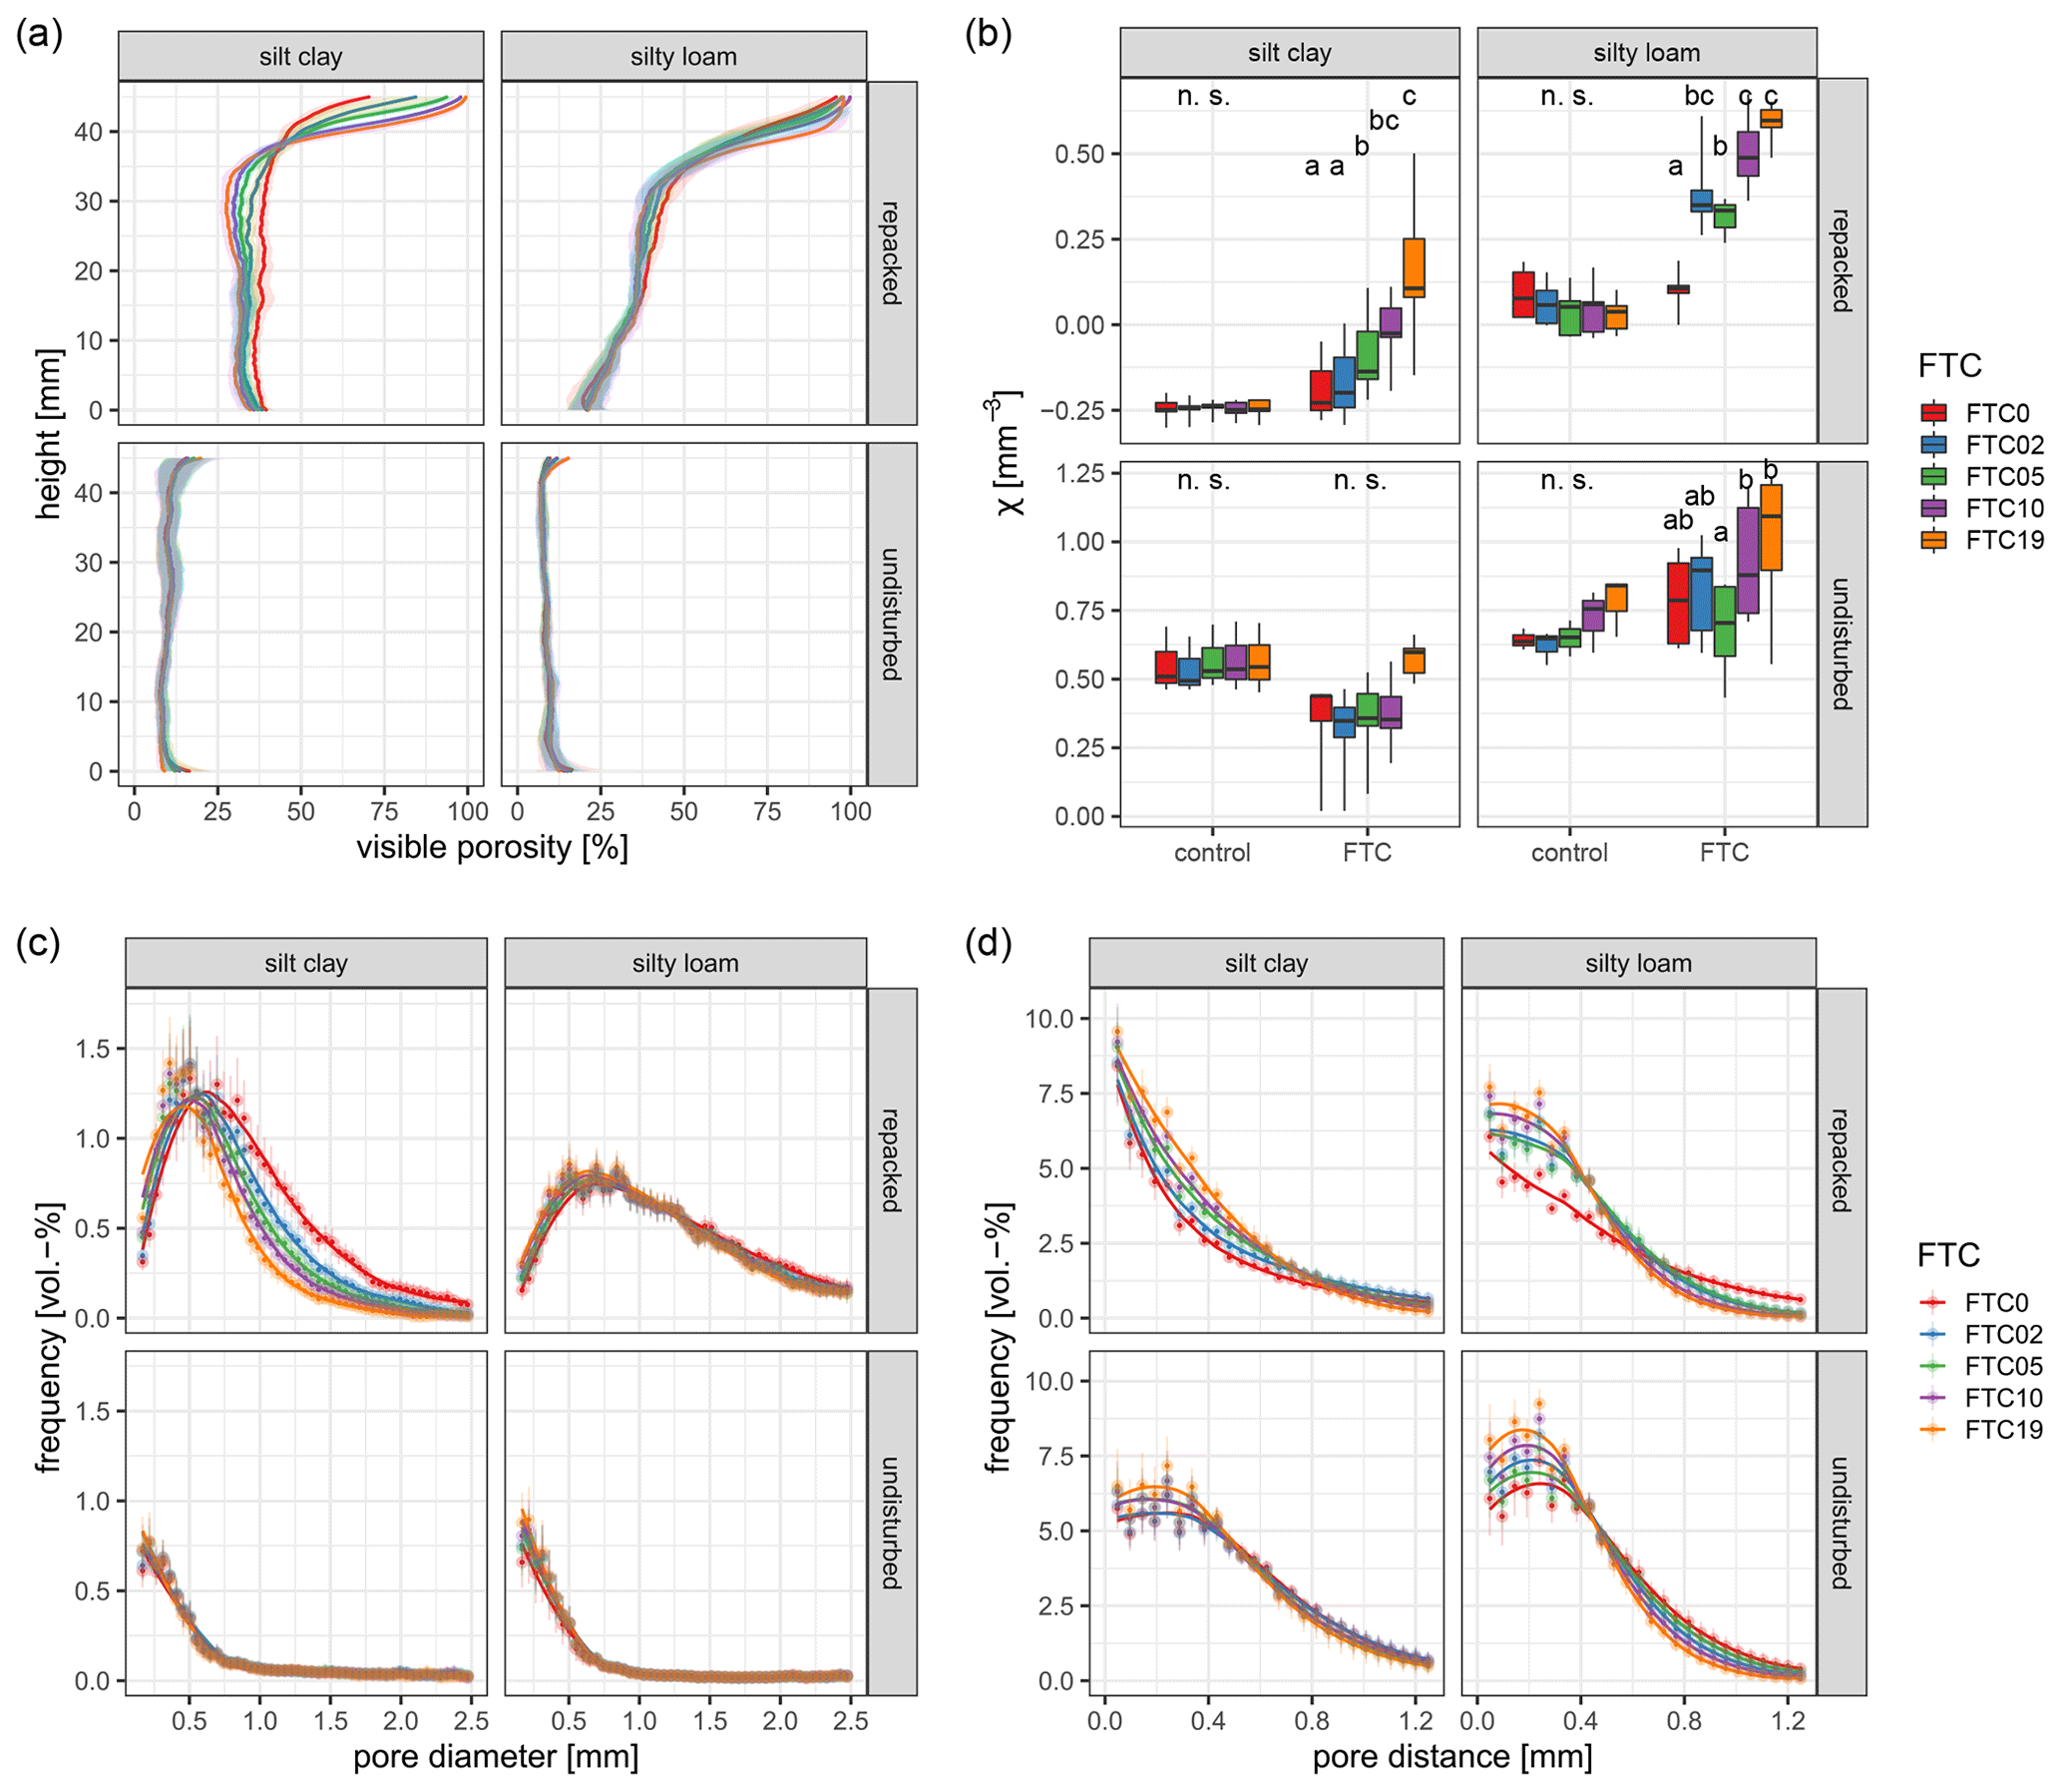
Figure 3Soil structure characteristics determined at a resolution of 48 µm as after multiple freeze–thaw cycles (FTCs), showing the mean visible porosity profile over the sample height (a), the Euler number density χ (b), the mean pore size distribution and their fits (c), and the mean pore distance distribution and their fits (d). The shaded area in (a) and the point ranges in (c) and (d) mark the 95 % confidence interval of the represented data (2 standard errors), with the latter in (b) depicting significant differences at p< 0.05 within a treatment (n.s. – not significant). Note that the y axis in (b) differs for repacked and undisturbed samples.
Table 2Soil structural parameters as arithmetic means and their standard errors determined via X-ray µCT at a resolution of 48 µm. The Γ indicator describes the connectivity for the entire sample. Γ was not statistically tested. The porosity, Euler number density χ, mean pore size, and mean pore distance were determined for the centre of the samples (Fig. 1c; ROI 2).
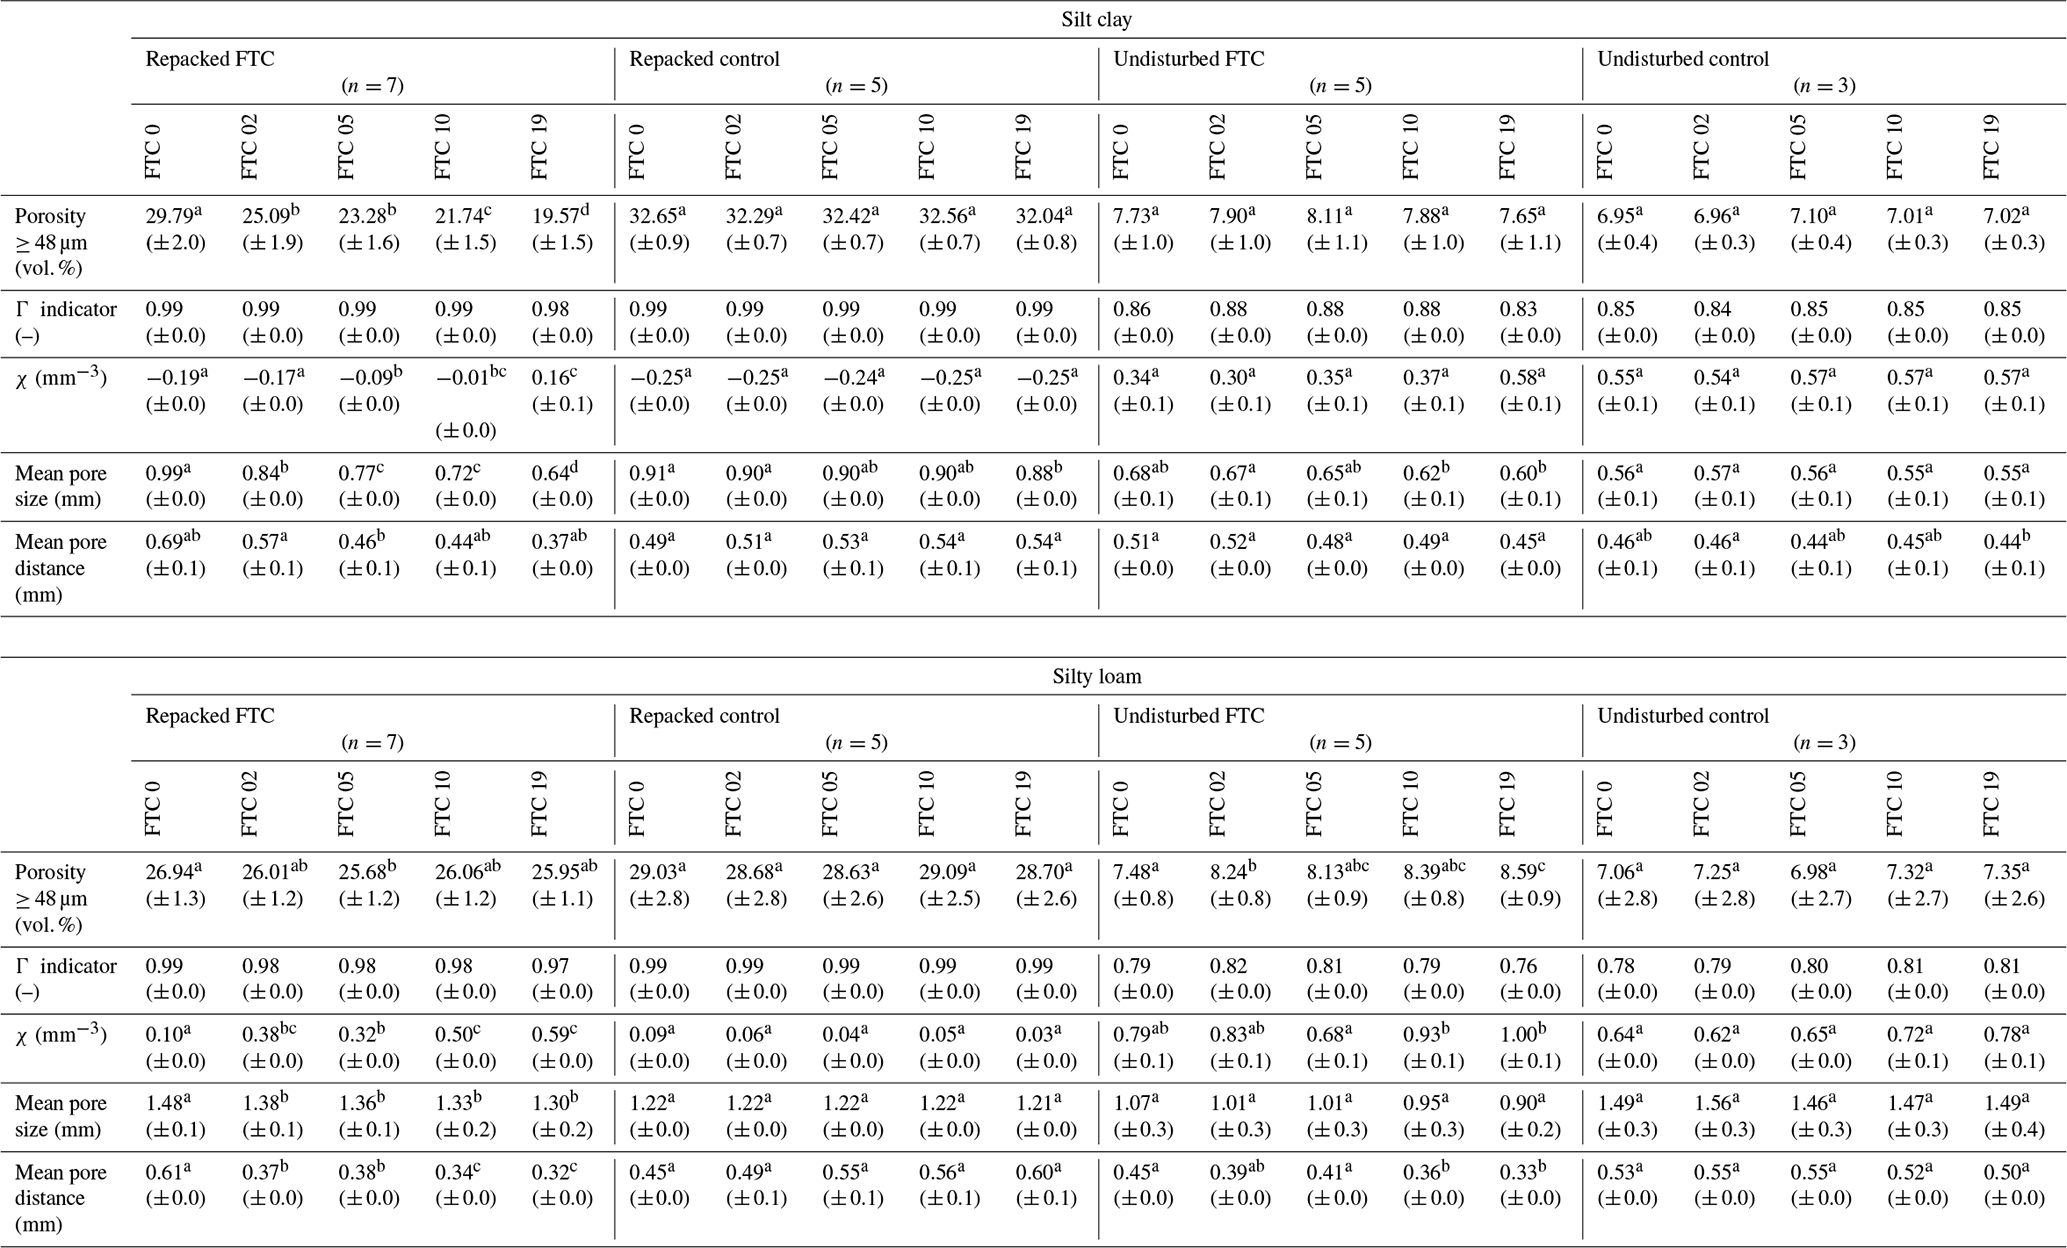
Different letters (a, b, c, d) within a treatment indicate significant difference between values at p<0.05.
3.2 Soil structure development throughout the experiment
Multiple FTC significantly changed the mean soil structure characteristics (≥ 48 µm) of the repacked samples (Table 2), while in the undisturbed samples the changes occurred mainly in certain areas or specific size ranges (Fig. 3). The profiles of visible porosity from soil column top to soil column bottom (Fig. 3a), and the decrease in mean porosity at the centre of the samples (Table 2), indicate that the repacked samples of both soil textures underwent settling and compaction. The settlement occurred along the sample profile, resulting in both an increase in visible porosity in the uppermost part (35 to 45 mm) and compaction in the lower part of the sample (0 to 35 mm). The measured visible porosity in the sample centre (ROI 2; 29.8 vol. % silt clay; 26.9 vol. % silty loam) decreased sharply at the beginning of the experiment (−4.7 vol. % silt clay after 2 FTCs; −1.26 vol. % silty loam after 5 FTCs), while compaction in subsequent FTCs was less pronounced. For the silty clay, another significant decrease was determined after 10 FTCs (−8.1 vol. %) and after 19 FTCs (−10.2 vol. %). In contrast, the mean visible porosity of the repacked silty loam was not significantly changing after 5 FTCs. Settling and compaction were not observed for the undisturbed samples. Here, visible porosity slightly increased at the sample top, which can be assigned to the formation of a platy soil structure determined by visible inspection of the X-ray CT images (Fig. S3 in the Supplement). This was particularly pronounced for the silty loam and increased with the number of FTCs. In the centre of the samples, a significant increase in macroporosity was determined after 2 and 19 FTCs for the silty loam, while the silt clay was not affected.
Settlement and compaction had different effects on the connectivity parameters of the treatments. The mean initial Γ indicators, which indicates the probability for a connected pore system, were close to 1 for the repacked samples of both textures, 0.86 for the undisturbed silt clay, and 0.79 for the undisturbed silty loam, mainly reflecting differences in initial macroporosity (Table 2). These Γ values close to 1 indicate that all treatments had a well-connected pore system. During the experiment, the Γ indicator was slightly reduced for the repacked samples. The Euler number density χ increased systematically but non-monotonically with FTC for the repacked samples and varied considerably for the undisturbed samples (Fig. 3b; Table 2). χ is more sensitive to subtle changes in pore connectivity, as it does not only reflect if a pore structure is well or poorly connected but also by how many connections or into how many isolated pores. An increase in the Euler number density can thus be associated with an increase in isolated pores; a Euler number density below 0 describes a well-connected pore system and above 0 is a poorly connected pore system. With the exception of the repacked silt clay, the pore systems ≥ 48 µm of all other treatments were poorly connected. The connectivity of the repacked silt clay decreased continuously with the number of FTCs. The connectivity of the repacked silty loam decreased significantly after 2 FTCs and after 10 FTCs. For the undisturbed silt clay, no significant effect of FTCs on χ was observed, while for the silty loam, the connectivity was first slightly decreasing (5 FTCs) and then increasing (10 and 19 FTCs). Both treatments showed a high variability among samples compared to the control.
The decrease in porosity and connectivity was accompanied by a reduction in mean pores sizes in the centre of the samples. A significant reduction, from 0.99 to 0.64 mm, was observed for the repacked silt clay throughout the experiment. For the silty loam, the mean pore size was decreasing from 1.48 to 1.30 mm, mainly after 2 FTCs. For the undisturbed samples, the reduction from 0.68 to 0.60 mm for the silt clay and from 1.07 to 0.90 mm for the silty loam was gradual and not significant. The pore size distribution in Fig. 3c shows that the decrease in pore size was caused by a shift from larger macropores to smaller macropores. The frequency of pores larger than 0.5 and 1 mm decreased systematically with the increasing FTC number for the repacked silt clay and silty loam, respectively. At the same time, the frequency of smaller macropores increased continuously. A slightly increasing frequency of smaller macropores less than 0.5 mm in diameter was also observed for both undisturbed treatments.
The fragmentation of soil clods and macro-aggregates was measured by the average distance of all soil voxels to the nearest pore. For all treatments, the mean pore distance was found to decrease with the increasing number of FTCs. For the silty loam, a significant decrease with reference to the initial structure was observed after 10 FTCs for the undisturbed samples and after 2 and 10 FTCs for the repacked samples. The initial variability in the repacked silt clay was high; hence, a significant reduction was determined between 2 to 5 FTCs. The frequency distribution of pore distances in Fig. 3d shows that, for the repacked samples, there was a significant decrease in frequency of compact soil areas with pore distances larger than 0.6 to 0.8 mm. For the undisturbed samples, compact soil areas with distances larger than 0.4 mm were fragmented.
3.3 Soil structure of subsamples after 19 FTCs
The main effects on soil structure determined at a resolution of 48 µm occurred at the lower resolution boundary of the X-ray µCT scans. However, structural features smaller than 4 to 5 voxels are systematically underestimated due to image processing (Vogel et al., 2010; Leuther et al., 2019). Hence, subsamples taken at the end of the experiment extended the information of soil structure characteristics at the lower resolution limit of the larger experimental containers. A resolution of 10 µm further describes the pore system which determine hydraulic properties at around pF 2, which is the pF value at which all FTC treatments had an increased hydraulic conductivity.
Table 3Soil structural parameters as arithmetic means and their standard errors determined via X-ray µCT at a resolution of 10 µm.
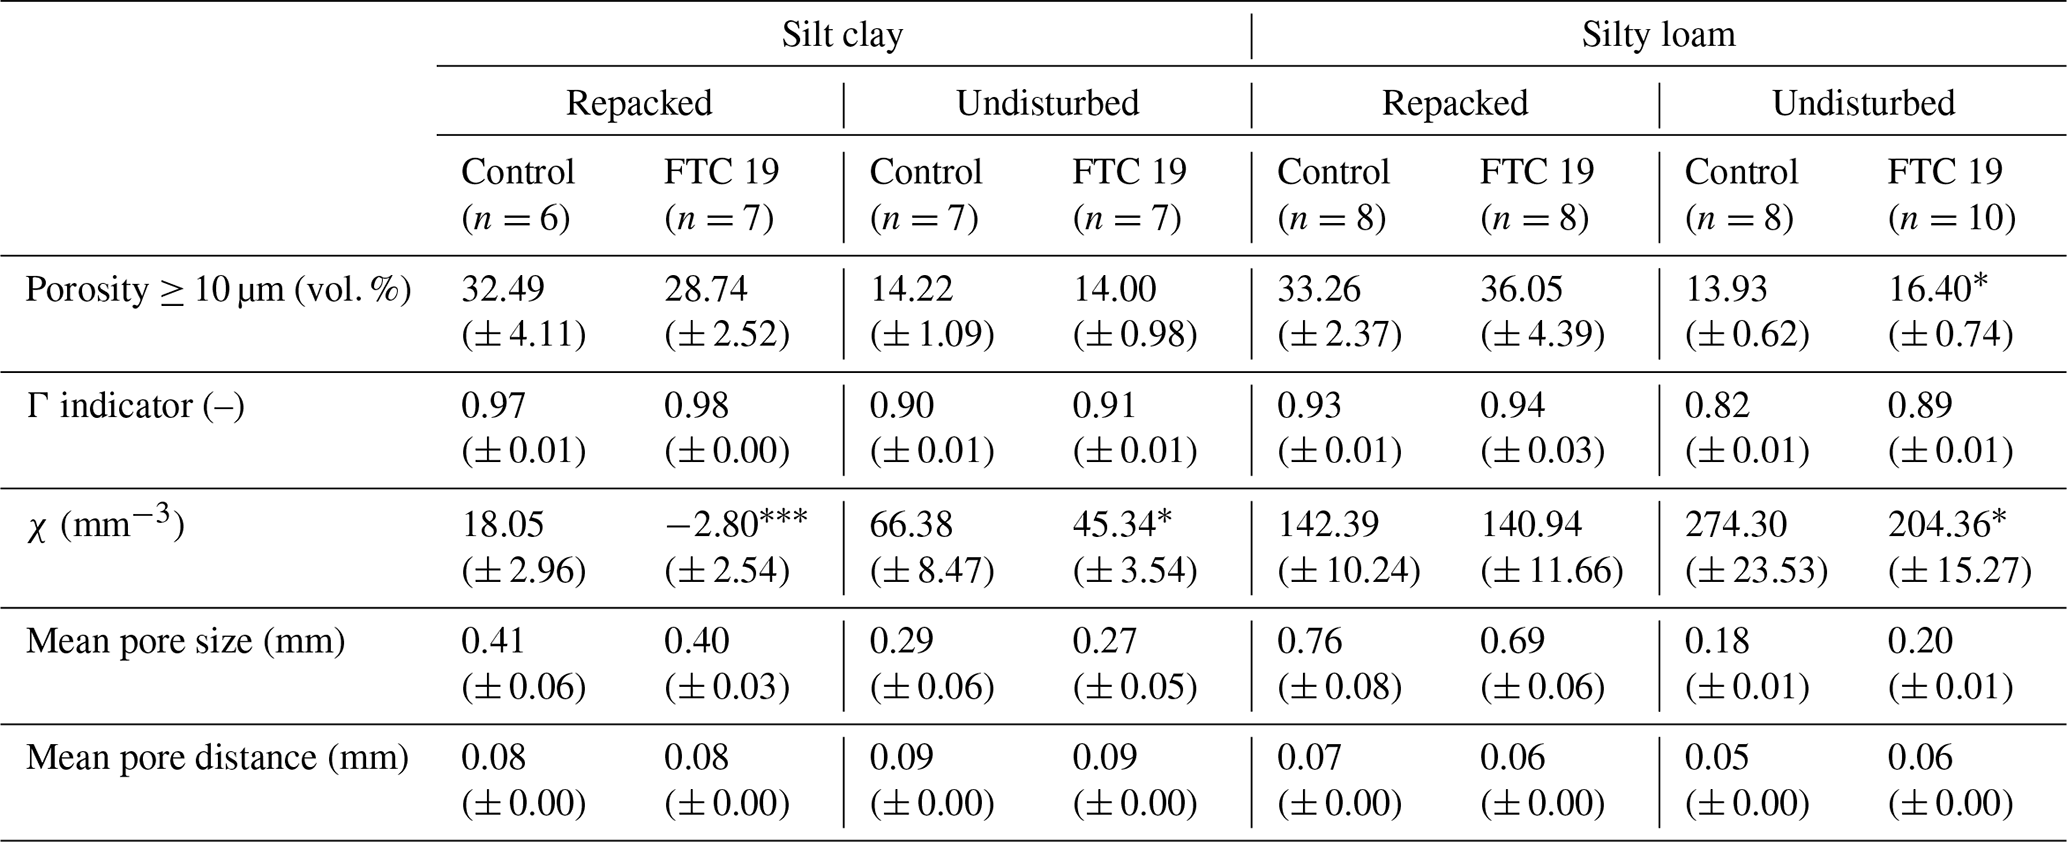
The level of statistical significance difference between the FTC treatment and control within a soil texture and treatment determined by a t test refers to ∗ = p ≤ 0.05, = p < 0.01, and = p < 0.001. Γ was not statistically tested.
Statistically significant differences in pore structure between the subsamples from the control and the samples after 19 FTCs were found mainly in the connectivity parameters (Table 3). With the exception of the repacked silty loam, the Euler number density χ was significantly reduced in all treatments after 19 FTC, implying an increase in redundant connections in the pore network. The absolute χ values increased by a factor of 2 to 3 compared to 250 cm3 samples, as the chance of detecting small isolated pores increases with resolution. For the undisturbed silty loam, Γ increased from 0.82 (control) to 0.89 (FTC) as a result of a significant increase in macroporosity ≥ 10 µm (13.9 vol. % to 16.4 vol. %, respectively). The connection probabilities of all other treatments ranged from 0.90, for the undisturbed control of the silt clay, to 0.98, for the repacked silt clay (FTC), corresponding to a very well-connected pore system. No additional increases in porosity were found for these treatments.
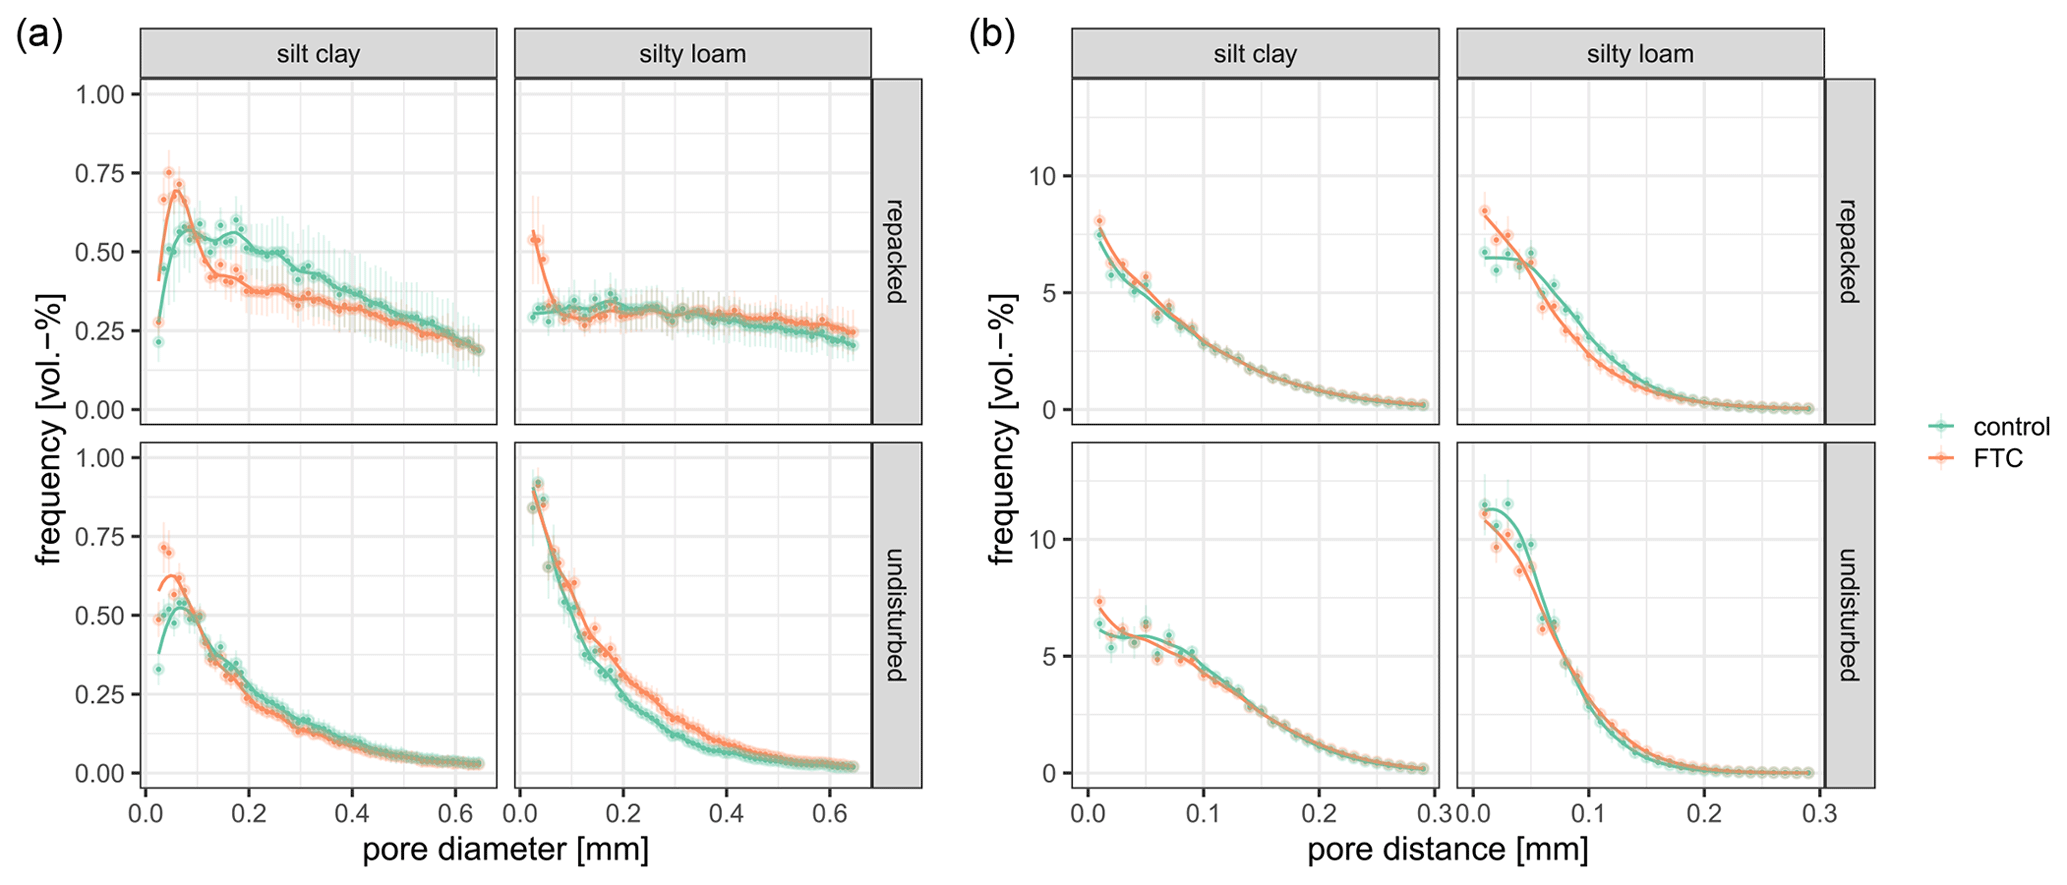
Figure 4The mean pore size distribution (a) and the mean pore distance distribution (b) determined at a resolution of 10 µm. The point ranges mark the 95 % confidence interval of the represented data (2 standard errors). Data from the control are shown in green, and data obtained from subsamples taken after 19 FTCs are shown in orange.
The 19 FTCs induced an increase in the volume fraction of pore diameters of < 0.1 mm (Fig. 4a). However, the effect was too small to significantly reduce the mean pore size in any of the treatments, partly due to high variability among the replicates (Table 3). This was also the case for the mean pore distance, where the volume fraction of distances < 0.05 mm was slightly increased for most of the FTC treatments, with the exception of the undisturbed silty loam (Fig. 4b). However, these small effects on the pore distance distributions were not reflected by the mean pore distances. Here, no significant effects were determined for the subsamples taken after 19 FTCs.
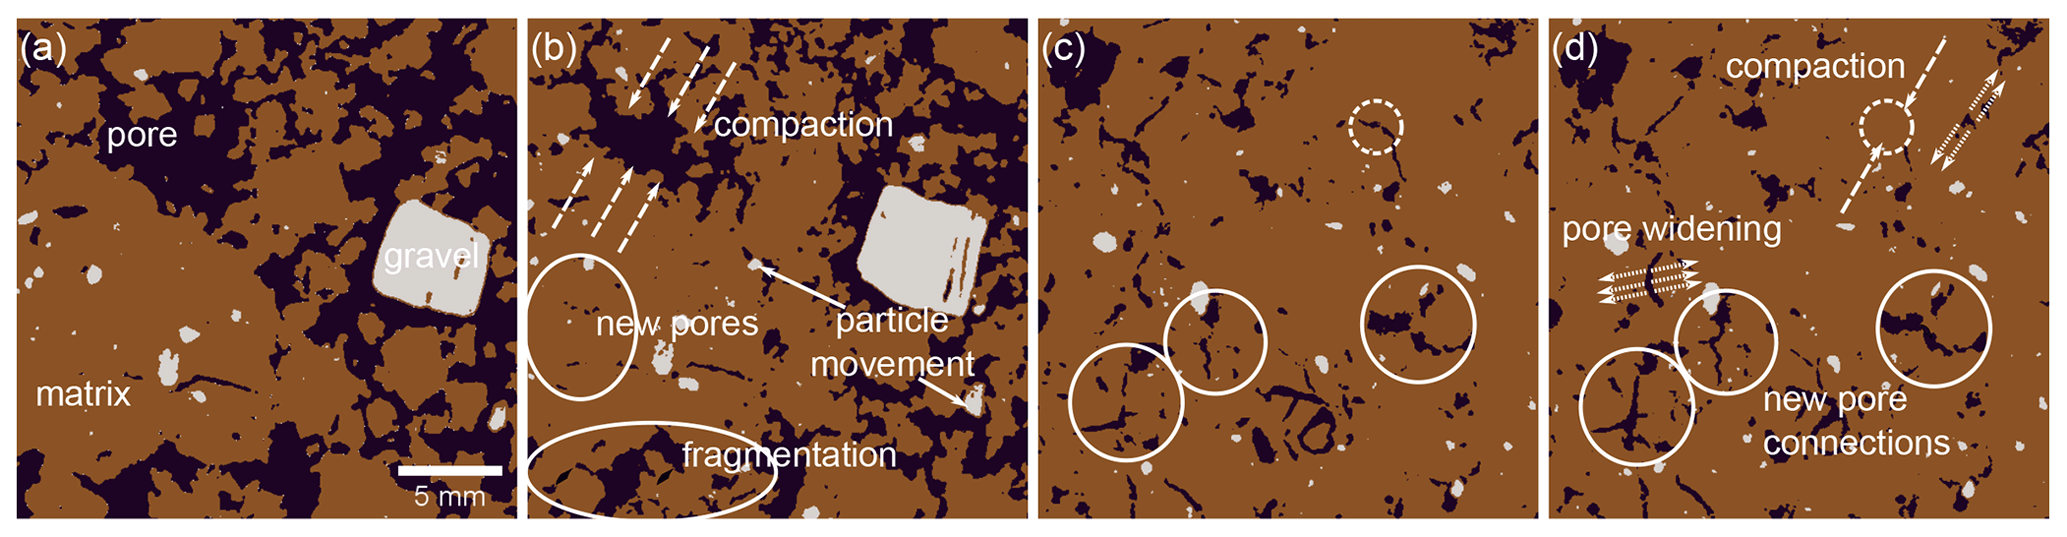
Figure 5Scheme of soil structure transformation of a repacked sample after 0 (a) and 19 FTCs (b) and of an undisturbed sample after 0 (c) and 19 FTCs (d).
The combination of X-ray µCT and hydraulic property measurements allowed the detection of soil structural changes over a wide range of pore diameters. Multiple freezing and thawing of soils changed soil structural and soil hydraulic properties of all investigated treatments. A very loose structure at the direct soil surface, resembled by repacked soil clods taken from a ploughed field, was more sensitive to FTC than an intact soil structure under grassland which has developed over decades. This is consistent with the field measurements of soil stability under different management systems, where ploughed soil layers showed lower resistance to physical stresses compared to reduced or no-till treatments (Schjønning and Rasmussen, 1989; Wiermann et al., 2000; Munkholm et al., 2008). Regarding the impact of FTCs on soil structure, Ma et al. (2019) concluded that well-structured soils are more difficult to be fragmented by FTC than degraded or compacted soils. In our experiments, the settling and compaction of soil clods were the main factors for changes in the macropore system of the repacked samples, with silt clay (40 % of clay content) being more affected than silty loam (21 % of clay content). Multiple FTCs caused a significant reduction in porosity, mean pore size, and connectivity of the macropore system, which is schematically shown in Fig. 5a and b. The reduction occurred gradually with the increasing number of FTCs, so that already 2 to 5 FTCs had a significant influence on the investigated structural parameters. Such a low number of FTCs occurs under natural conditions directly at the soil surface at both sites (2017 – 13 and 15 FTCs; 2018 – 7 and 16 FTCs in 5 cm depth; Figs. S1 and S2 in the Supplement) but is barely reached in deeper layers (1 to 3 FTCs in 10 and 20 cm depth).
In addition to the collapse of the fragile macrostructure, new pores formed at the transition from small macropores to mesopores (pF 2–3). On the one hand, this was caused by the compaction of the samples, where a continuous shift of larger macropores towards smaller macropores was observed (Fig. 5). On the other hand, new pores were developed by the formation of cracks that fragmented larger soil clods. This is consistent with Ma et al. (2019), where the amount of small aggregates increased after multiple FTC (up to 30) compared to the control. Surprisingly, the fragmentation of soil, as indicated by the reduction in pore distances, was more pronounced for the silty loam than for the silt clay, with larger swell–shrink dynamics. Lehrsch (1998) found an increase in aggregate stability after 1 or 2 FTCs, but it was also shown that macro-aggregates with high clay contents were less vulnerable to FTCs than a loam and silt loam. Dagesse (2013) also found that clay content is an important factor that determines the extent of the freeze-induced desiccation process (improvement of aggregate stability) and thaw-induced degradation of aggregate stability due to attendant liquid water.
For the intact, well-structured soils samples taken under grassland, changes in pore size distribution and pore distance were observed mainly in the silty loam. Here, a platy soil structure with horizontal orientation developed in the uppermost 5 to 10 mm of the columns (Fig. S3). They are typical for low cooling rates when water is moving towards the ice front and surrounding soil areas are desiccated. This promotes the formation of new ice-nucleation centres in the wet soil below, and consequently, elongated soil aggregates between ice lenses which are regarded as being stable structural elements (Taina et al., 2013; Van Vliet-Lanoë and Fox, 2018). When analysing the soil structure in the centre of the undisturbed samples, only small effects on the pore size distribution, porosity, and connectivity of the macropore network by FTCs were observed, but there was a significant fragmentation of soil fragments larger than 0.5 mm after 10 FTCs. The results indicate that two different processes are taking place at the same time, which are opposing each other and, thus, keeping the determined pore parameters rather constant (Fig. 5c and d). On the one hand, the fragmentation of denser soil areas produced new pores and connections which were at the lower-resolution limit of this study (48 µm). On the other hand, it also caused a compaction and reduction of the already existing pore volumes and disconnection of existing macropores. For aggregates, Six et al. (2004) have described these opposing processes of degradation and stabilization as well, where stability measurements of bulk samples yielded an average of both processes.
Starkloff et al. (2017) analysed the impact of 1 to 6 FTCs on a pore system larger than 140 µm with X-ray µCT. The undisturbed soil cores taken from a ploughed layer experienced 6 FTCs and much higher and faster temperature gradients between freezing (−15 ∘C) and thawing (40 ∘C). For a loamy sand, a slight settlement of the samples was observed, accompanied by a decrease in macroporosity for the pore sizes investigated (≥ 0.3 mm). For a silty clay loam, no settlement was observed, but there was a shift from larger macropores (≥ 1.9 mm) towards smaller macropores (0.4–1.5 mm). The presented results in our study, based on a higher resolution, confirm the trends in soil structure development identified by Starkloff et al. (2017), which were limited in resolution and in number of FTCs at the time. Also in the current experiments, many of the described changes in soil structure were detected at the lower resolution boundary of the X-ray µCT scans and were only revealed by subsampling at the end of the experiment. The information obtained at two different resolutions shows that FTCs confirm structural changes towards a well-connected pore system for pores smaller 0.5 to 0.8 mm in diameter.
This was corroborated by the highly significant increase in unsaturated hydraulic conductivity between pF 2 to pF 3 for all samples. In comparison, water retention in the same range of matrix potential was only slightly affected for the repacked samples. This indicates that the pore size distribution from 0.002 to 0.05 mm (according to the Young–Laplace equation) was only slightly affected, and that the connectivity of these pores increased significantly after 19 FTCs. Most studies investigated the impact of FTCs on saturated hydraulic conductivity and measured its increase, which was mainly related to the creation of vertical voids (Qi et al., 2006). After 30 FTCs, Ma et al. (2019) found no consistent effects of FTC on soil water retention curves among different soils, but in total there was a significant increase in the plant-available water content for all tested treatments. They related the increase to changes in the pore size distribution. Since the determined pore structure characteristics still changed after 19 FTCs, there is a possibility that another 11 FTCs could have had a greater impact on the water retention of our tested soils. The consistency of the data show that multiple FTCs promoted a well-connected pore system which increased the unsaturated conductivity by a factor of 3.
Freezing and thawing of soils have a large impact on soil structure development in areas where air temperature is fluctuating around the freezing point. It was shown that multiple FTCs fragmented large soil clods and intact soil. Hence, it is an important factor for farmers to modify the soil surface for seedbed preparation and, potentially, to loosen compacted soil areas or consolidate very loose soil. The creation of a well-connected pore system in the diameter range of mesopores to narrow macropores increased the unsaturated hydraulic conductivity, independent of the soil texture and the initial soil structure. This is a beneficial feature for the soil quality in spring, as the water transport of melting snow is increased and the seedbed has an improved hydraulic connection to the soil underneath.
With the prospect of milder winters due to climate change, soils in the mid-latitudes may experience a decreasing number of FTCs in winter. This could lead to farmers having to spend more time on field preparation in spring and to a degradation of soil structure over years. We could show that already 2 to 5 FTCs significantly affected the soil structure and that the effects per FTC on the tested parameters were decreasing with the number of FTCs. However, it was also shown that changes were still accumulating after multiple FTCs, and that further significant changes occurred after 10 and 19 FTCs. While the impact on the macropore network was largest for the silt clay, loamy sand was more susceptible to the fragmentation of soil compartments. Even though the topsoil of intact grassland can be considered to have reached a soil structure in dynamic equilibrium that has experienced many FTCs in the making, the soil structure is still affected by FTC.
The data are available within the article and in the Supplement.
The supplement related to this article is available online at: https://doi.org/10.5194/soil-7-179-2021-supplement.
FL designed and carried out the experiments, with contributions from StS. Both authors developed and evaluated the X-ray µCT image analysis steps. FL prepared the paper, with contributions from StS.
The authors declare that they have no conflict of interest.
We would like to thank Kristina Kleineidam from the University of Giessen for giving us the opportunity to take soil samples at the long-term study site in Giessen. Special thanks goes to Max Köhne for his help and support with the lab work, especially during COVID-19 pandemic.
This research has been supported by the Deutsche Forschungsgemeinschaft (grant no. 416883305).
The article processing charges for this open-access
publication were covered by the Helmholtz Centre for
Environmental Research – UFZ.
This paper was edited by Estela Nadal Romero and reviewed by two anonymous referees.
Altermann, M., Rinklebe, J., Merbach, I., Körschens, M., Langer, U., and Hofmann, B.: Chernozem – soil of the year 2005, J. Plant Nutr. Soil Sci., 168, 725–740, 2005.
Ashworth, E. N. and Abeles, F. B.: Freezing behavior of water in small pores and the possible role in the freezing of plant tissues, Plant Physiol., 76, 201–204, 1984.
Bolt, G. H. and Miller, R. D.: Calculation of total and component potentials of water in soil, T. Am. Geophys. Un., 39, 917–928, https://doi.org/10.1029/TR039i005p00917, 1958.
Buades, A., Coll, B., and Morel, J.-M.: Non-local means denoising, Image Processing On Line, 1, 208–212, 2011.
Chamberlain, E. J. and Gow, A. J.: Effect of Freezing and Thawing on the Permeability and Structure of Soils, in: Developments in Geotechnical Engineering, edited by: Jessberger, H. L., Elsevier, Amsterdam, the Netherlands, 73–92, 1979.
Dagesse, D. F.: Freezing cycle effects on water stability of soil aggregates, Can. J. Soil Sci., 93, 473–483, https://doi.org/10.4141/cjss2012-046, 2013.
Daigh, A. L. M. and DeJong-Hughes, J.: Fluffy soil syndrome: When tilled soil does not settle, J. Soil Water Conserv., 72, 10A–14A, 2017.
Daraghmeh, O. A., Jensen, J. R., and Petersen, C. T.: Soil structure stability under conventional and reduced tillage in a sandy loam, Geoderma, 150, 64–71, https://doi.org/10.1016/j.geoderma.2009.01.007, 2009.
Deelstra, J., Kværnø, S. H., Granlund, K., Sileika, A. S., Gaigalis, K., Kyllmar, K., and Vagstad, N.: Runoff and nutrient losses during winter periods in cold climates—requirements to nutrient simulation models, J. Environ. Monitor., 11, 602–609, 2009.
Diel, J., Vogel, H.-J., and Schlüter, S.: Impact of wetting and drying cycles on soil structure dynamics, Geoderma, 345, 63–71, 2019.
Dreibrodt, S., Kleber, M., and Jahn, R.: Das mineralinventar der versuchsfläche “statischer dauerdüngungsversuch v120, bad lauchstädt”, Arch. Agron. Soil Sci., 48, 227–240, https://doi.org/10.1080/03650340213841, 2002.
Edwards, L. M.: The effects of soil freeze–thaw on soil aggregate breakdown and concomitant sediment flow in Prince Edward Island: A review, Can. J. Soil Sci., 93, 459–472, 2013.
Hansson, K., Šimůnek, J., Mizoguchi, M., Lundin, L.-C., and van Genuchten, M. T.: Water Flow and Heat Transport in Frozen Soil: Numerical Solution and Freeze–Thaw Applications, Vadose Zone J., 3, 693–704, https://doi.org/10.2136/vzj2004.0693, 2004.
Henry, H. A.: Soil freeze–thaw cycle experiments: trends, methodological weaknesses and suggested improvements, Soil Biol. Biochem., 39, 977–986, 2007.
Jabro, J. D., Iversen, W. M., Evans, R. G., Allen, B. L., and Stevens, W. B.: Repeated Freeze-Thaw Cycle Effects on Soil Compaction in a Clay Loam in Northeastern Montana, Soil Sci. Soc. Am. J., 78, 737–744, https://doi.org/10.2136/sssaj2013.07.0280, 2014.
Jäger, H., Schmidt, S. W., Kammann, C., Grünhage, L., Müller, C., and Hanewald, K.: The University of Giessen free-air carbon dioxide enrichment study: description of the experimental site and of a new enrichment system, Journal of Applied Botany, 77, 117–127, 2003.
Jawahar, C., Biswas, P. K., and Ray, A.: Investigations on fuzzy thresholding based on fuzzy clustering, Pattern Recogn., 30, 1605–1613, 1997.
Kassambara, A.: rstatix: pipe-friendly framework for basic statistical tests, R package version 0.4.0, avaliable at: https://CRAN.R-project.org/package=rstatix (last access: 9 June 2021), 2020.
Kjellström, E., Nikulin, G., Strandberg, G., Christensen, O. B., Jacob, D., Keuler, K., Lenderink, G., van Meijgaard, E., Schär, C., Somot, S., Sørland, S. L., Teichmann, C., and Vautard, R.: European climate change at global mean temperature increases of 1.5 and 2 ∘C above pre-industrial conditions as simulated by the EURO-CORDEX regional climate models, Earth Syst. Dynam., 9, 459–478, https://doi.org/10.5194/esd-9-459-2018, 2018.
Kværnø, S. H. and Øygarden, L.: The influence of freeze–thaw cycles and soil moisture on aggregate stability of three soils in Norway, Catena, 67, 175–182, 2006.
Legland, D., Arganda-Carreras, I., and Andrey, P.: MorphoLibJ: integrated library and plugins for mathematical morphology with ImageJ, Bioinformatics, 32, 3532–3534, 2016.
Lehrsch, G. A.: Freeze-thaw cycles increase near-surface aggregate stability, Soil Sci., 163, 63–70, 1998.
Leuther, F., Schlüter, S., Wallach, R., and Vogel, H.-J.: Structure and hydraulic properties in soils under long-term irrigation with treated wastewater, Geoderma, 333, 90–98, 2019.
Loch, J. P.: State-of-the-art report–frost action in soils, in: Developments in Geotechnical Engineering, edited by: Frivik, P. E., Janbu, N., Saetersdal, R., and Finborud, L. I., Elsevier, Amsterdam, the Netherlands, 213–224, 1982.
Ma, Q., Zhang, K., Jabro, J. D., Ren, L., and Liu, H.: Freeze–thaw cycles effects on soil physical properties under different degraded conditions in Northeast China, Environ. Earth Sci., 78, 1–12, https://doi.org/10.1007/s12665-019-8323-z, 2019.
Munkholm, L. J., Hansen, E. M., and Olesen, J. E.: The effect of tillage intensity on soil structure and winter wheat root/shoot growth, Soil Use Manage., 24, 392–400, https://doi.org/10.1111/j.1475-2743.2008.00179.x, 2008.
Otsu, N.: A threshold selection method from gray-level histograms, IEEE T. Syst. Man. Cyb., 9, 62–66, 1979.
Oztas, T. and Fayetorbay, F.: Effect of freezing and thawing processes on soil aggregate stability, Catena, 52, 1–8, 2003.
Qi, J., Vermeer, P. A., and Cheng, G.: A review of the influence of freeze-thaw cycles on soil geotechnical properties, Permafrost Periglac., 17, 245–252, 2006.
R Core Team: R: A language and environment for statistical computing, Vienna, Austria, 2020.
Rabot, E., Wiesmeier, M., Schlüter, S., and Vogel, H.-J.: Soil structure as an indicator of soil functions: a review, Geoderma, 314, 122–137, 2018.
Ren, J. and Vanapalli, S. K.: Comparison of Soil-Freezing and Soil-Water Characteristic Curves of Two Canadian Soils, Vadose Zone J., 18, 180185, https://doi.org/10.2136/vzj2018.10.0185, 2019.
Renard, P. and Allard, D.: Connectivity metrics for subsurface flow and transport, Adv. Water Resour., 51, 168–196, https://doi.org/10.1016/j.advwatres.2011.12.001, 2013.
Schindelin, J., Arganda-Carreras, I., Frise, E., Kaynig, V., Longair, M., Pietzsch, T., Preibisch, S., Rueden, C., Saalfeld, S., Schmid, B., Tinevez, J.-Y., White, D. J., Hartenstein, V., Eliceiri, K., Tomancak, P., and Cardona, A.: Fiji: an open-source platform for biological-image analysis, Nature Methods, 9, 676–682, https://doi.org/10.1038/nmeth.2019, 2012.
Schindler, U., Durner, W., von Unold, G., and Müller, L.: Evaporation Method for Measuring Unsaturated Hydraulic Properties of Soils: Extending the Measurement Range, Soil Sci. Soc. Am. J., 74, 1071–1083, https://doi.org/10.2136/sssaj2008.0358, 2010.
Schjønning, P. and Rasmussen, K. J.: Long-term reduced cultivation. I. Soil strength and stability, Soil Till. Res., 15, 79–90, https://doi.org/10.1016/0167-1987(89)90065-2, 1989.
Schlüter, S., Sheppard, A., Brown, K., and Wildenschild, D.: Image processing of multiphase images obtained via X-ray microtomography: a review, Water Resour. Res., 50, 3615–3639, 2014.
Schlüter, S., Leuther, F., Vogler, S., and Vogel, H.-J.: X-ray microtomography analysis of soil structure deformation caused by centrifugation, Solid Earth, 7, 129–140, https://doi.org/10.5194/se-7-129-2016, 2016.
Six, J., Bossuyt, H., Degryze, S., and Denef, K.: A history of research on the link between (micro) aggregates, soil biota, and soil organic matter dynamics, Soil Till. Res., 79, 7–31, 2004.
Starkloff, T., Larsbo, M., Stolte, J., Hessel, R., and Ritsema, C.: Quantifying the impact of a succession of freezing-thawing cycles on the pore network of a silty clay loam and a loamy sand topsoil using X-ray tomography, Catena, 156, 365–374, 2017.
Taina, I. A., Heck, R. J., Deen, W., and Ma, E. Y.: Quantification of freeze–thaw related structure in cultivated topsoils using X-ray computer tomography, Can. J. Soil Sci., 93, 533–553, 2013.
Torrance, J., Elliot, T., Martin, R., and Heck, R.: X-ray computed tomography of frozen soil, Cold Reg. Sci. Technol., 53, 75–82, 2008.
Van Vliet-Lanoe, B. and Dupas, A.: Development of soil fabric by freeze/thaw cycles-Its effect on frost heave, International Symposium on Ground Freezing, 189–195, 1991.
Van Vliet-Lanoë, B. and Fox, C. A.: Frost Action, Chapt. 20, in: Interpretation of Micromorphological Features of Soils and Regoliths, second edn., edited by: Stoops, G., Marcelino, V., and Mees, F., Elsevier, Amsterdam, the Netherlands, 575–603, 2018.
Vogel, H. J., Weller, U., and Schlüter, S.: Quantification of soil structure based on Minkowski functions, Comput. Geosci., 36, 1236–1245, https://doi.org/10.1016/j.cageo.2010.03.007, 2010.
Wickham, H.: ggplot2: elegant graphics for data analysis, Springer, Heidelberg, 2016.
Wickham, H., Averick, M., Bryan, J., Chang, W., McGowan, L. D. A., François, R., Grolemund, G., Hayes, A., Henry, L., and Hester, J.: Welcome to the Tidyverse, Journal of Open Source Software, 4, 1686, https://doi.org/10.21105/joss.01686, 2019.
Wiermann, C., Werner, D., Horn, R., Rostek, J., and Werner, B.: Stress/strain processes in a structured unsaturated silty loam Luvisol under different tillage treatments in Germany, Soil Till. Res., 53, 117–128, https://doi.org/10.1016/S0167-1987(99)00090-2, 2000.