the Creative Commons Attribution 4.0 License.
the Creative Commons Attribution 4.0 License.
 | 26 Aug 2020
Short- and long-term temperature responses of soil denitrifier net N2O efflux rates, inter-profile N2O dynamics, and microbial genetic potentials
Kate M. Buckeridge
Kate A. Edwards
Kyungjin Min
Susan E. Ziegler
Sharon A. Billings
Production and reduction of nitrous oxide (N2O) by soil denitrifiers influence atmospheric concentrations of this potent greenhouse gas. Accurate projections of the net N2O flux have three key uncertainties: (1) short- vs. long-term responses to warming, (2) interactions among soil horizons, and (3) temperature responses of different steps in the denitrification pathway. We addressed these uncertainties by sampling soil from a boreal forest climate transect encompassing a 5.2 ∘C difference in the mean annual temperature and incubating the soil horizons in isolation and together at three ecologically relevant temperatures in conditions that promote denitrification. Both short-term exposure to warmer temperatures and long-term exposure to a warmer climate increased N2O emissions from organic and mineral soils; an isotopic tracer suggested that an increase in N2O production was more important than a decline in N2O reduction. Short-term warming promoted the reduction of organic horizon-derived N2O by mineral soil when these horizons were incubated together. The abundance of nirS (a precursor gene for N2O production) was not sensitive to temperature, whereas that of nosZ clade I (a gene for N2O reduction) decreased with short-term warming in both horizons and was higher from a warmer climate. These results suggest a decoupling of gene abundance and process rates in these soils that differs across horizons and timescales. In spite of these variations, our results suggest a consistent, positive response of denitrifier-mediated net N2O efflux rates to temperature across timescales in these boreal forests. Our work also highlights the importance of understanding cross-horizon N2O fluxes for developing a predictive understanding of net N2O efflux from soils.
- Article
(1239 KB) - Full-text XML
-
Supplement
(373 KB) - BibTeX
- EndNote


Nitrous oxide (N2O) is a potent greenhouse gas with ∼300 times the global warming potential of carbon dioxide on a 100-year timescale and uncertain climate feedback effects (Ciais et al., 2013; Portmann et al., 2012). Although increases in atmospheric N2O are attributed to nitrogen (N) fertilizer use (Mosier et al., 1998), emissions from natural systems dominate terrestrial fluxes (Ciais et al., 2013) and experimental manipulations indicate that warming may enhance these fluxes (Benoit et al., 2015; Billings and Tiemann, 2014; Kurganova and Lopes de Gerenyu, 2010; Szukics et al., 2010; Wang et al., 2014). One of the most important biogeochemical pathways of N2O formation in natural systems is denitrification – the stepwise reduction of to N2. In this pathway, soil denitrifiers can both produce and reduce N2O, and the incomplete reduction of N2O during the final step to N2 can result in N2O release to the atmosphere (Baggs, 2011; Firestone and Davidson, 1989). Soil microorganisms play a critical role in climate change (Cavicchioli et al., 2019); however, how sensitive the denitrification pathway is to a warming climate remains unclear.
Translating empirically derived knowledge about soil denitrifiers into climate projections is difficult due to the dynamic and variable nature of the many interacting steps and their controls (Butterbach-Bahl et al., 2013). The indirect influences of temperature on strong, proximate controls of denitrification (i.e., the availability of C, , or soil O2) are likely important features governing soil denitrifier response to climate change (Butterbach-Bahl and Dannenmann, 2011; Wallenstein et al., 2006). Here, we instead address three key challenges that are associated with the temperature sensitivity of denitrification. First, we do not know if short-term responses of denitrifying communities to warming (Billings and Tiemann, 2014; Kurganova and Lopes de Gerenyu, 2010; Szukics et al., 2010; Wang et al., 2014) are maintained across longer timescales. Therefore, we are uncertain if laboratory studies can provide the empirical data needed to project longer-term fluxes. Studies of heterotrophic soil CO2 efflux suggest that enhanced rates of microbial respiration with warming may be dampened over the long-term, prompted by a combination of microbial acclimation and adaptation (Billings and Ballantyne, 2013; Bradford, 2013), and it is feasible that denitrifying communities may also exhibit only ephemeral responses to warming. Such a response is consistent with inconclusive results of multiple in situ warming experiments, although such studies necessarily reflect both denitrification and other N2O-producing processes in soils (Bai et al., 2013; Butler et al., 2012; Dijkstra et al., 2012; McDaniel et al., 2013). Assuming microbial acclimation, denitrifying communities may be more effective at reduction and transformation to N2 within their acclimated climate's typical temperature range. In principle, this could result in relatively lower rates of N2O loss in that particular temperature regime (i.e., more complete denitrification) compared with less effective processing by those microbial communities if the mean temperature were to shift. Although this phenomenon has not been demonstrated for the more complicated soil denitrification with its multiple enzymatic steps, the so-called “home field advantage” has been demonstrated in studies exploring rates of other soil microbial processes (Alster et al., 2013; Wallenstein et al., 2013).
A second knowledge gap limiting our ability to project future soil N2O climate feedbacks is potential variation with temperature in interactions between microbial production and reduction of N2O across soil horizons. Implicit in the concept that such cross-horizon interactions may control net profile N2O efflux is the assumption that soil denitrifiers have different patterns of production and reduction in different horizons. This may arise because the conditions that control N2O production or reduction differ between horizons, or it may arise because the metabolic potentials of the soil microbial community in different horizons are intrinsically different (Blume et al., 2002; Fierer et al., 2003). Consistent with this idea, Goldberg and Gebauer (2009) illustrated clear variation in patterns of δ15N of N2O across soil depth in response to drought, which could have been caused by variations in either N2O production or reduction (Billings, 2008). Thus, the exchange of substrates between soil horizons can be an important process dictating whole-soil N2O efflux, and it may contribute to apparent inconsistencies between warming effects in the laboratory and the field (reviewed in Bai et al., 2013). Indeed, profile interactions have recently been demonstrated as important drivers of soil CO2 efflux: temperature responses of whole-soil core respiration can be distinct from the sum of those observed for horizons incubated in isolation from each other, which is likely due to the exchange of substrates and microbes among horizons (Podrebarac et al., 2016). Although evidence suggests that N2O produced in one soil horizon may be reduced in another (Goldberg and Gebauer 2009), the degree to which this may occur, and why, has not been determined.
A third feature challenging our ability to project soil N2O effluxes in a warmer climate regime is the potentially different response to warming of distinct steps in the denitrification pathway (this may be for one or multiple microbes within the community that carry out the enzymatic steps). For instance, if the activity of nosZ, a gene that codes for an enzyme catalyzing N2O reduction, experiences a different response to temperature than nirK, a gene coding for an enzyme catalyzing reduction (and, thus, N2O production), the net flux of N2O may either increase or decrease with temperature depending on the direction and magnitude of both responses. Although gene abundances sometimes exhibit decoupling from function (Peterson et al. 2012), quantifying any changes in these functional gene abundances with temperature can help discern the propensity for temperature responses from relevant microbial communities' structure and, thus, the driving mechanisms for net N2O production responses. Differential responses of these genes' abundances to short-term temperature manipulation have been observed in grassland soils (an increase in nosZ with short-term temperature increases; Billings and Tiemann, 2014), but it is unknown whether these observations are relevant for soil microbial communities subjected to long-term exposure to distinct temperature regimes.
In this study, we explore the following three issues: short- vs. long-term responses of soil denitrifying communities' net production of N2O to warming, the exchange of denitrification-derived N2O among horizons as a driver of the temperature response of net N2O efflux, and the potentially different responses of the relative abundances of microbial genes linked to N2O production vs. reduction to temperature. We invoked a space-for-time substitution to test our long-term warming hypothesis, using a climate transect along which the mean annual temperature (MAT) varies but dominant vegetation, soil type, and soil moisture are similar. To elucidate both the short- and long-term temperature responses of soils' denitrifying communities, we incubated soils that came from different latitudes and climate regimes along this transect (long-term warming) for 60 h at 5, 15, and 25 ∘C (short-term warming) in order to reflect typical current (5 and 15 ∘C) and projected future (25 ∘C) soil temperatures. Specifically, laboratory incubations of mesic organic and mineral boreal forest soil horizons were established under conditions that promote denitrification. To understand the potential for interactions among soil horizons as a driver of the temperature response of net N2O efflux, we incubated organic and mineral soils both individually and in combination. We measured net rates of N2O efflux and abundances of representative functional genes linked to the production and reduction of N2O and estimated N2O reduction using an isotopic tracer.
We expected that short-term warming would enhance net N2O production in these boreal soils, as in the majority of past incubation studies (Billings and Tiemann, 2014; Kurganova and Lopes de Gerenyu, 2010; Szukics et al., 2010; Wang et al., 2014). As outlined above, we also tested the hypothesis that a warmer temperature regime over a longer timescale would show the opposite effect: a dampened net N2O efflux from the historically warmer soils, where organic N turnover is faster (Philben et al., 2016) and where denitrifying communities can presumably function effectively as transformers of to N2 at warmer temperatures compared with their more northern counterparts. Here, we define “effective” as a denitrifier community that is able to transform to the end product, N2. We also hypothesized that N2O produced in one horizon would be reduced in the other when incubated together, resulting in lower net N2O efflux than a simple linear combination of these horizons' individual efflux rates. Specifically, we anticipated that organic soils, which are relatively rich in microbial abundance and diversity compared with mineral soils, would reduce mineral-produced N2O, following dominant diffusion gradients. Finally, we hypothesized that soils that exhibit higher rates of net N2O production would also exhibit some combination of increased nir abundance and decreased nos abundance as well as the associated higher ratios of nir : nos gene abundances, reflecting shifts in microbial genetic potentials with temperature regime.
2.1 Study site and soil sampling
Soil was collected from three mature forest stands at each of three regions along the Newfoundland and Labrador Boreal Ecosystem Latitudinal Transect (NL-BELT), Canada (Table 1, Fig. 1; Ziegler et al., 2017). The NL-BELT spans the north–south extent of the balsam-fir-dominated boreal biome in Eastern Canada, from southwest Newfoundland to southeast Labrador. This transect has long-term (century-scale) temperature regime differences but otherwise similar conditions. For instance, the three study regions along this transect (from south to north), the Grand Codroy, Salmon River, and Eagle River watersheds (Fig. 1), have similar Orthic Humo-Ferric Podzols (Spodosols; Soil Classification Working Group, 1998) and vegetation dominated by balsam fir (Abies balsamea). The difference in the MAT and precipitation is 5.2 ∘C and 431 mm, respectively, between the Grand Codroy (southernmost) and Eagle River (northernmost) climate stations (Environment and Climate Change Canada, 2020). The soils are mesic, and the regions have an evaporative demand gradient (Table 1) that considerably reduces the precipitation gradient, making the transect an excellent proxy for investigating soil temperature responses while mitigating confounding features of differing soil moisture. Three replicate forest stands were established in each of the three climate regions, allowing us to assess the influence of long-term differences in the MAT (and the associated differences in climate) along the transect without concerns about pseudoreplication, which is a rarity in large-scale space-for-time substitutions (Ziegler et al., 2017).
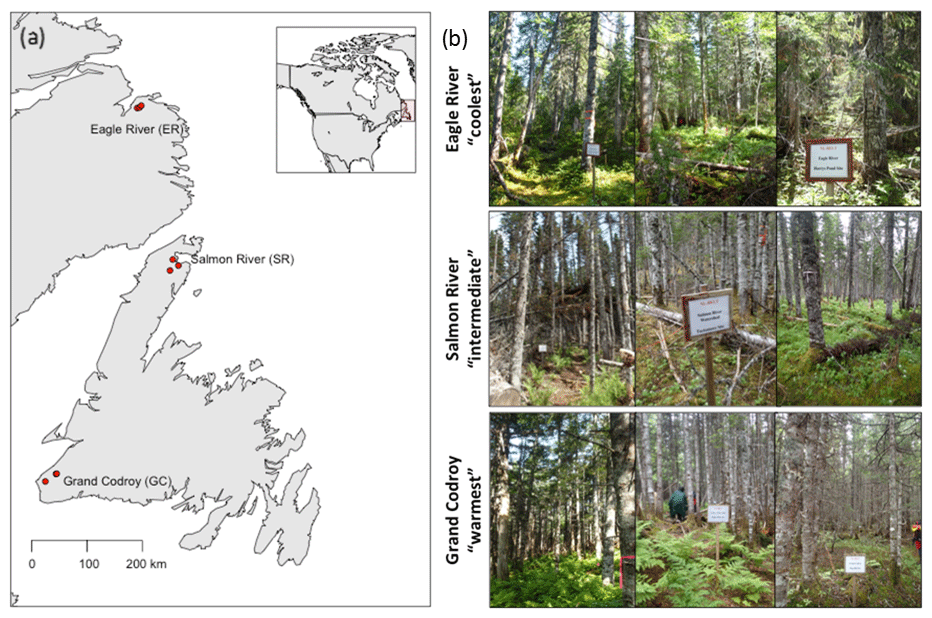
Figure 1(a) Map and (b) pictures of the three forests in each region along the Newfoundland and Labrador Boreal Ecosystem Latitude Transect (NL-BELT) in Canada.
Table 1Characteristics of the nine forests in the three study regions along the Newfoundland and Labrador Boreal Ecosystem Latitude Transect (NL-BELT) in Canada.
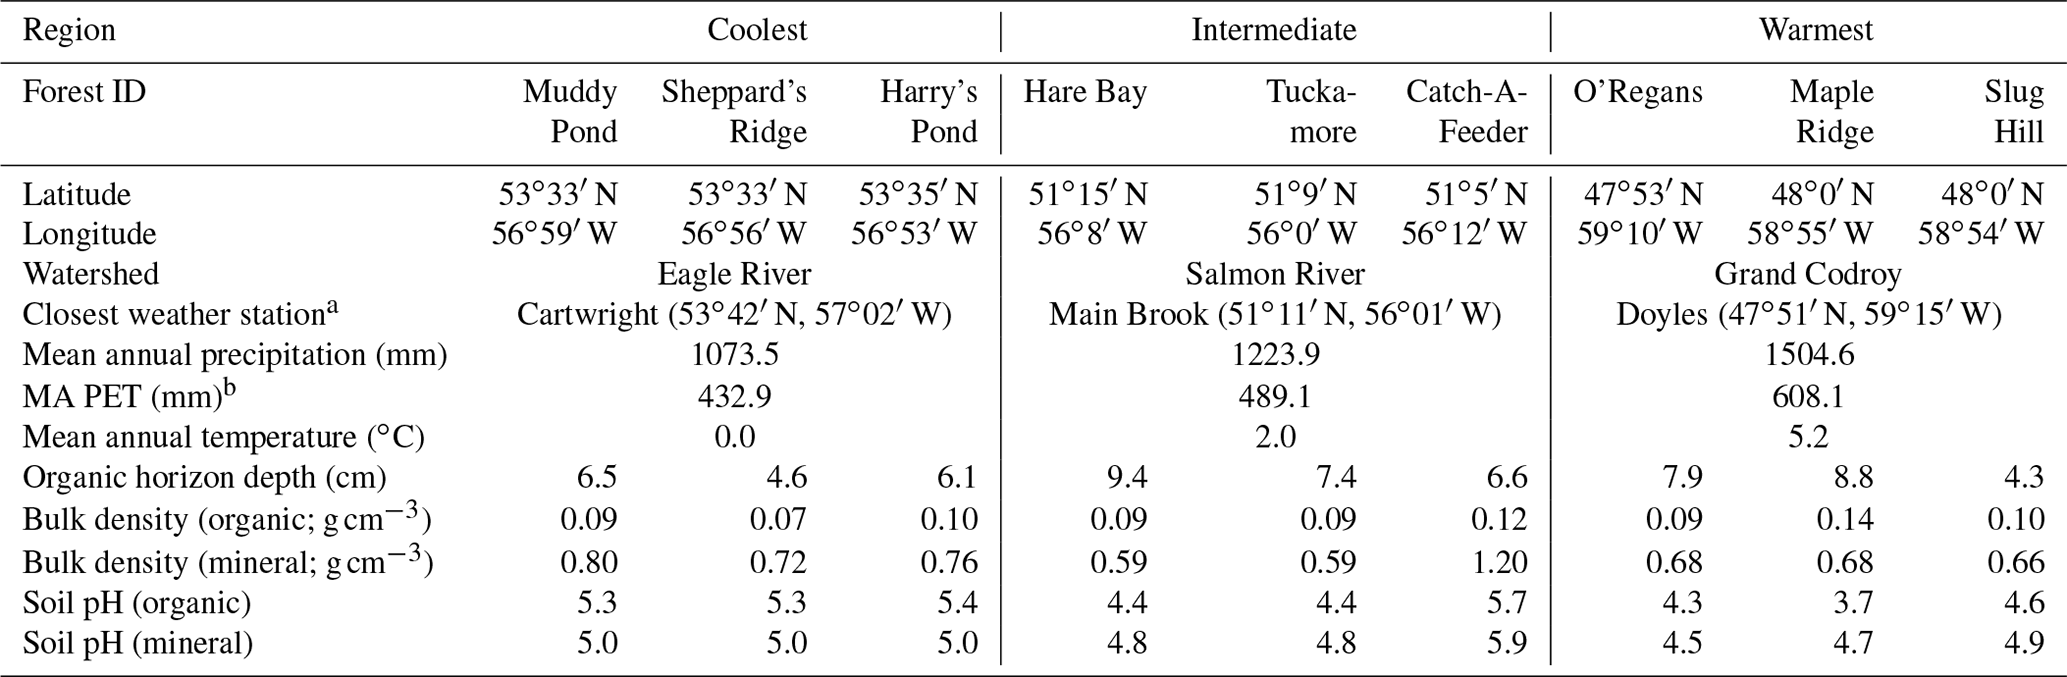
a Climate normal data (1981–2000) were sourced from http://climate.weather.gc.ca/climate_normals/index_e.html (last access: 23 August 2020). b “MA PET” refers to the mean annual potential evapotranspiration.
Two large (30 cm2) peds of organic (LFH or O horizon) and mineral (B horizon) soil were collected at each forest stand on a different calendar date but an equivalent ecological date: 22–24 October 2013 in Eagle River, 4–5 November 2013 in Salmon River, and 22–23 November 2013 in Grand Codroy. This pre-freeze, post-growing season period typically exhibits relatively large and active microbial biomass in northern-latitude organic soils (Buckeridge et al., 2013). The Ah and Ae horizons were not present at all sites; therefore, they were not included in the incubation at any site. Each collection was shipped to the University of Kansas (4–5 d transit in insulated coolers, on ice) and processed immediately. Because regions were processed as separate experimental blocks we cannot separate the region and block effects. However, we confounded these factors knowingly, because we believed the ecological date and rapid processing were more important than minimal differences in laboratory practice between blocks.
2.2 Incubation and headspace gas collection
Aboveground vegetation (i.e., moss, herbaceous plants, and tree seedlings) was removed from the peds with scissors. The two peds of organic and mineral soil from each forest site were pooled within horizon and mixed by hand, producing an organic and mineral sample for each forest. This process was repeated nine times – for the three forests in each of the three regions. Subsamples (the fresh mass of the organic sample was 50 g, and the fresh mass of the mineral sample was 40 g) were placed in half-pint (237 mL) Mason jars. To test the potential for N2O producers and reducers from one horizon to interact with their counterparts in the other horizon, “combined” samples were also prepared: an open container of mineral soil (20 g) was placed within a jar next to organic soil (25 g) such that they had a shared headspace but were not physically mixed. Each sample was replicated for three temperature incubation scenarios (5, 15, and 25 ∘C), and three blank jars (no soil) were included for each temperature. To maximize the potential for denitrification, we promoted anaerobic conditions and substrate diffusion by evacuating headspace air and replacing it with He, and we adjusted the water-holding capacity to 80 % with a –N solution (δ15N 3000 ‰) that added 18 and 1.3 µg N g−1 dry weight (dw) soil to the organic and mineral soil samples, respectively (18× background levels at the time of sampling, although within the annual range of soil availability based on unpublished field data). Our approach was distinct from a potential denitrification assay, which calls for non-limiting C and additions to soils (Pell et al., 1996); instead, we intended to promote conditions conducive to denitrification using natural C pools and as close to natural concentrations as was feasible. Therefore, this experiment is not predictive of bulk soil N2O rates and instead explores controls on N2O rates in soil zones with low O2 concentrations. Such “hot spots” for biogeochemical cycles in soils are well-documented (McClain and others 2003).
Over 60 h of incubation, we collected headspace gas eight times for determination of the N2O concentration. The first sample was collected immediately after initiating the incubations, the second sample was collected at ∼3 h, and further samples were then collected every 10 h. At each collection point, 14 mL of headspace gas was removed with a needle and gastight syringe and injected into pre-evacuated 12 mL borosilicate vials with a silicone septum and aluminum crimp (Teledyne Instruments, Inc., CA, USA); at the second and last collection an additional 14 mL of headspace gas was removed and injected into pre-evacuated Exetainers (Labco Ltd., High Wycombe, UK) for isotopic analysis of N2O in the headspace. After each gas sampling, He of an equivalent volume was injected into the incubation vessels to maintain pressure in the containers. At the end of the incubation all jars were opened and soils were destructively harvested to quantify soil inorganic N as well as for DNA extraction.
2.3 N2O concentration and isotope analysis
Headspace samples were analyzed for N2O concentration in an auto-injected 5 mL subsample on a gas chromatograph fitted with an electron capture detector (CP-3800, Varian), and they were calibrated against a four-point standard curve that encompassed the sample range. Blank-corrected headspace concentrations were adjusted for the dilution at each sampling with He replacement and were converted to the rate of net N2O–N production () by application of the ideal gas law (PV=nRT), multiplication by the molar mass of N in N2O, and correction by the dry weight of soil (in grams) in the sample and the change in time since the previous sample. Then rates of net N2O production were calculated as the average of the eight sample collections' rates. Net N2O flux changed throughout the course of the 60 h incubation (Fig. S1 in the Supplement); we focus on the average of these rates to integrate both production and reduction into an aggregate value across the whole incubation. Samples for isotope analysis (δ15N of N2O) were submitted to the University of California, Davis, Stable Isotope Facility, where they were analyzed on a Thermo Finnigan GasBench + PreCon trace gas concentration system interfaced to a Thermo Scientific Delta V Plus isotope ratio mass spectrometer (Bremen, Germany). The analysis was conducted with four standards of 0.4–10 ppm N2O in He, with a precision (standard deviation on five replicate natural abundance standards) of 0.1 ‰ 15N.
The change in the percentage of added 15N found in the N2O between incubation sampling times at 3 and 60 h was used to quantify the gross reduction of N2O to N2 (Billings and Tiemann 2014). Because our tracer contained far more 15N than is present naturally, any natural fractionation during N2O reduction was negligible compared with the isotopic signature of the tracer in the N2O pool, and we can use 15N2O abundance as a means of assessing N2O production vs. reduction. If 15N2O abundance at 60 h is higher than at 3 h, it suggests that the tracer was continuing to flow into the N2O pool more so than out of it and, thus, that N2O production outpaced N2O reduction (transformation into N2) at that time point. In contrast, if 15N2O abundance at 60 h is lower than at 3 h, it suggests that the tracer was flowing out of the N2O pool at a greater pace than it was flowing into it and, thus, that N2O reduction outpaced N2O production at that time point. We calculated 15N2O by multiplying the isotopic ratio of the sample by the concentration of N2O in that sample. We then computed the change in the percentage of the 15N tracer added that was found in headspace N2O across incubation time as follows:
where 15N2O represents nanograms of 15N in headspace N2O per gram of dry weight soil, –N represents nanograms of 15N in per gram of dry weight soil, “final” refers to the end of the incubation (∼60 h), and “initial” refers to the first time point at which the change in 15N of N2O was assessed (∼3 h).
To assess the potential for N2O to be reduced to N2 by denitrifiers in the other horizon when incubated together, we calculated the combination effect (ng N2O–N ) as the difference between observed net N2O fluxes when soil horizons shared the incubation headspace (observed) and the expected flux determined as the linear, additive effect of the rate for horizons in separate headspaces (). The combination effect was also expressed as a percentage of the expected flux:
where a negative combination effect implies reduction caused by the inclusion of one of the horizons.
2.4 Soil nutrient analysis
To observe changes in extractable inorganic N during the incubation, we extracted soil subsamples prior to and following the incubation (fresh mass of the organic sample was 12 g, and fresh mass of the mineral sample was 10 g) by shaking for 1 h with 40 mL 0.5 M K2SO4. After shaking all of the samples were filtered and the extracts were frozen at −20 ∘C until further analysis. Soil –N and –N in the extracts were analyzed on a Lachat QuikChem 8500 autoanalyzer (Hach Co., Loveland, CO, USA) using the cadmium reduction and phenol red methods, respectively.
2.5 Functional gene abundance
Soil DNA was extracted from approximately 0.25 g fresh weight soil using a MoBio PowerSoil DNA extraction kit and purified with a MoBio PowerClean DNA clean-up kit (MoBio Laboratories, Carlsbad, CA, USA; now Qiagen). DNA was quantified with a Qubit 2.0 fluorometer (Invitrogen, Carlsbad, CA, USA), diluted by a factor of 10, and stored at −20 ∘C until further analysis. We assayed several functional gene primers in the denitrification pathway via polymerase chain reaction (PCR) (nirK, Henry et al., 2006; nirS, Throbäck et al., 2004; norB, Braker and Tiedje, 2003; nosZ, Rösch et al., 2002; nosZ clade II, Jones et al., 2013; Table S1 in the Supplement) and selected nirS and nosZ as the most tractable indicators of N2O production and reduction in these soils using quantitative PCR (qPCR), based on successful amplification of these genes across all samples. qPCR was accomplished using ABI StepOnePlus (Applied Biosystems) with Brilliant III Ultra-Fast SYBR® Green QPCR Master Mix (Agilent/Life Technologies, Carlsbad, CA, USA). Each reaction consisted of 5 µL (∼2 ng) genomic DNA, 400 nM of primer, 300 nM of reference dye, and 1 X Brilliant III in a final volume of 20 µL. The qPCR program consisted of an initial denaturing temperature of 95 ∘C for 3 min followed by 40 cycles of denaturing at 95 ∘C for 5 s and a combined annealing and extension step of 10 s at 60 ∘C for both nirS and nosZ genes. Melt curves were calculated at the end of each qPCR run to confirm product specificity. Each qPCR plate contained one primer pair, three negative controls, and a four-point standard curve (ranging from 300 to 300 000 copies). Standard curves were generated using genomic DNA from a lab stock of cultured Pseudomonas fluorescens, and gene copy numbers were calculated assuming a mass of g per base pair (Wallenstein and Vilgalys, 2005), one gene copy per genome, and a genome size of 7.07 Mb (NCBI). All gene abundance data were corrected by soil ovendry mass based on the dry : fresh mass ratio of an oven-dried subsample collected post-incubation.
2.6 Statistical analysis
We used a three-way ANOVA to assess the influence of the fixed effects of soil horizon, “region” (historical temperature), “temperature” (short-term, incubation temperature), and their interactions on inorganic N pools, net N2O flux averaged across the incubation, change in percent of added 15N tracer found in headspace N2O, the effects of mixing horizons in the incubation on net N2O flux, and functional gene abundances. For all analyses, we followed up significant main effects with a Tukey's post hoc analyses and report adjusted P values. For all variables, we assessed whether they met the assumptions required for performing these statistical tests, and we log-transformed variables before analysis when required. All statistical analyses were performed in R (R Core Team, 2014), using the MASS package (Venables and Ripley, 2003). All significant (α=0.05) results and interactions are reported except for significant main effects that have the significant interactions of their terms reported instead. Errors reported are one standard error (±1SE) of the mean.
3.1 Changes in inorganic N pools after the incubation
Temperature altered the pool sizes of –N differently in each region and horizon (: P=0.05), increasing relative to preincubation pool sizes in the organic soils at some of the incubation temperatures (coolest region, 25 ∘C: P=0.04; intermediate region, 25 ∘C: P=0.02; warmest region, 15 ∘C: P<0.0001, 25 ∘C: P=0.0001), as shown in Fig. 2a and b. Mineral soil –N pool sizes post-incubation did not differ from preincubation pool sizes.
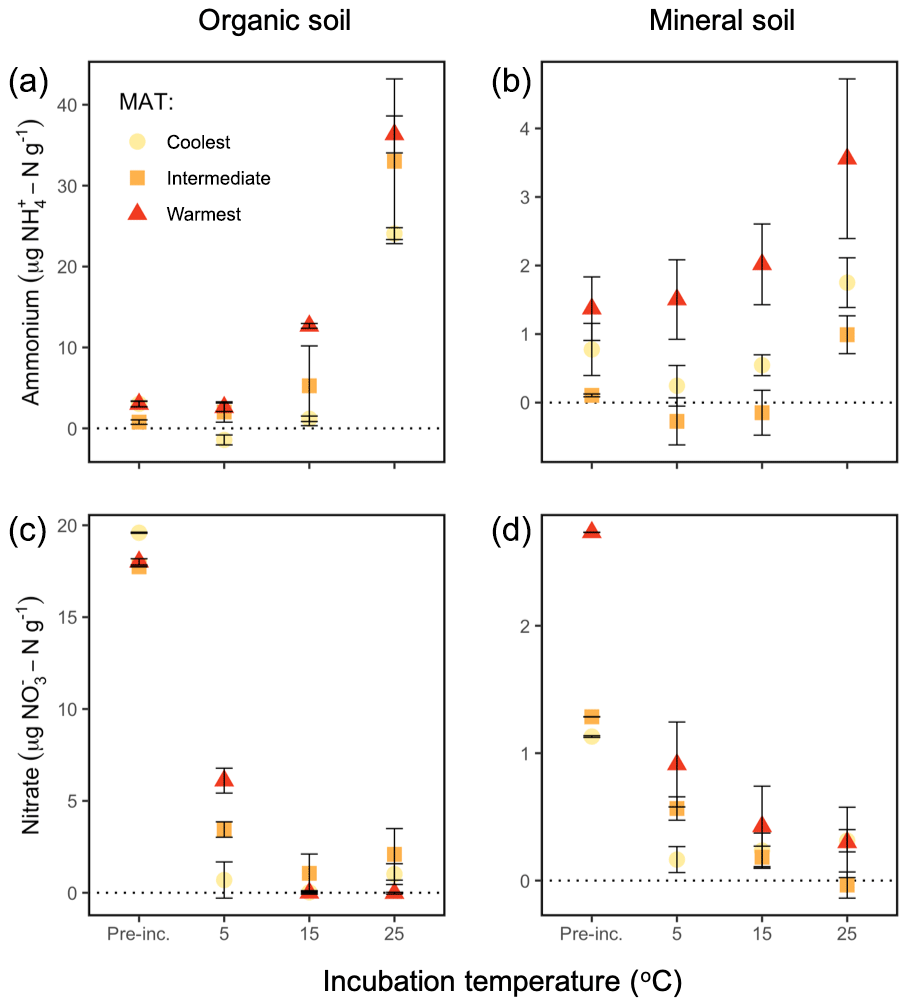
Figure 2Soil –N and –N pools in the organic (a, c) and mineral (b, d) soil, preincubation (“Pre-inc.”) and at the end of the incubations at 5, 15, and 25 ∘C of soils from along a boreal forest latitudinal transect. Preincubation values for nitrate are calculated as ambient concentrations including added –N. Note the different y axis values. “MAT” refers to the mean annual temperature. The “coolest” region is the Eagle River watershed (northern boreal), the “intermediate” region is the Salmon River watershed (mid-boreal), and the “warmest” region is the Grand Codroy watershed (southern boreal). See the text for site descriptions. Values are provided as the mean ± 1SE (n=3 forests per latitudinal region).
Temperature also altered the pools sizes of –N differently for each region and horizon (: P=0.03), decreasing relative to preincubation pool sizes in the organic soils at all temperatures in all regions (coolest, 5 ∘C: P=0.001, 15 ∘C: P=0.0007, 25 ∘C: P=0.003; intermediate, 5 ∘C: P=0.04, 15 ∘C: P=0.002, 25 ∘C: P=0.008; warmest, 5 ∘C: P<0.0001, 15 ∘C: P<0.0001, 25 ∘C: P<0.0001). –N pool sizes also decreased in the mineral soils at all temperatures in the coolest (5 ∘C: P=0.0005, 15 ∘C: P=0.0008, 25 ∘C: P=0.002) and intermediate (5 ∘C: P=0.02, 15 ∘C: P=0.002, 25 ∘C: P=0.0004) regions, although not in the warmest region (Fig. 2c, d). These results imply that the anaerobic conditions we generated by replacing headspace air with He and maintaining an 80 % water-holding capacity generally supported denitrification and limited nitrification.
3.2 N2O net production rates with short- and long-term warming
Net N2O flux was influenced by regions (P=0.002), incubation temperature (P=0.006), and soil type (P<0.0001) without any significant effect of any interaction among or between these independent variables. When averaged across all incubation temperatures and the two soil horizons, the warmest region (3.8±0.8 ng N2O–N ) had a higher rate than the intermediate (1.9±0.6 ng N2O–N , P=0.008) and coolest region (1.2±0.3 ng N2O–N , P=0.003), whereas the intermediate-latitude and coolest regions' net N2O production did not differ from each other (Fig. 3). Averaged across all regions and the two soil types, the warmest incubation temperature (3.4±0.8 ng N2O–N ) exhibited a higher net N2O flux than the lowest temperature (1.1±0.3 ng N2O–N , P=0.003). Averaged across all regions and soil temperatures, the organic soil (4.9±0.8 ng N2O–N ) exhibited a higher rate than the mineral soil (0.6±0.2 ng N2O–N , P<0.0001) and the combined incubation (1.3±0.3 ng N2O–N , P<0.0001), which had a higher rate than the mineral soil alone (P=0.005).
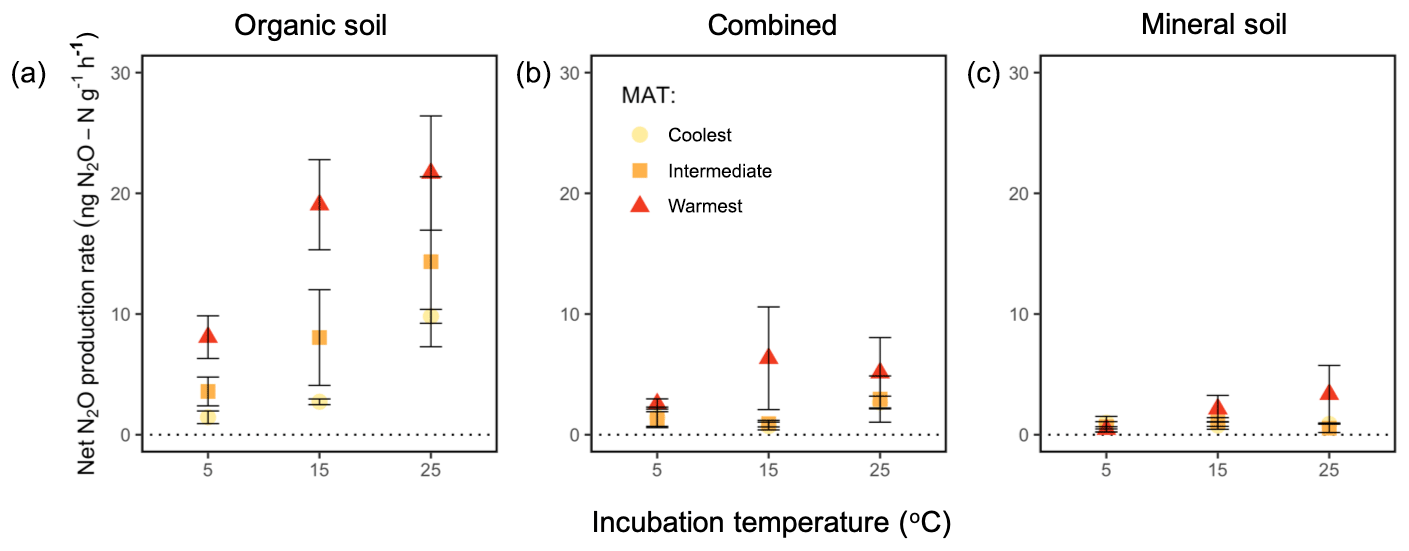
Figure 3Net N2O flux (“production rate”) averaged for 60 h of incubation at 5, 15, and 25 ∘C from organic soil alone (a), combined organic and mineral soil (b), and mineral soil alone (c) from three regions along a boreal forest latitudinal transect. “Combined” refers to incubations with organic and mineral soil in the same jar, which are physically isolated but share the headspace. “MAT” refers to the mean annual temperature. The “coolest” region is the Eagle River watershed (northern boreal), the “intermediate” region is the Salmon River watershed (mid-boreal), and the “warmest” region is the Grand Codroy watershed (southern boreal). See the text for site descriptions. Values are provided as the mean ± 1SE (n=3 forests per latitudinal region).
We used N2O emission from organic and mineral soil in isolation (Fig. 3a, c) to compute the expected net N2O flux for the combined soils (Fig. 4a, b). Observed rates of net N2O production in the headspace surrounding the combined organic and mineral soils (Fig. 3b) were less than the expected values (Fig. 4a, b) and often exhibited net N2O reduction, implying inter-profile interactions and differential temperature responses of the two horizons. The absolute effect of the combined horizons' reduction of N2O differed by incubation temperature (P=0.002), with higher net reduction in the warmest incubation compared with the coolest (25 vs. 5 ∘C: P=0.001) and a trend towards more reduction in the intermediate-latitude region compared with the coolest (P=0.098). In proportional terms, the effect of combining horizons decreased the combined net N2O flux by up to 175 % of the expected combined net production rate, and this effect differed by temperature (P=0.009). In particular, it was more pronounced at 15 ∘C relative to 5 ∘C (P=0.004). There was no significant interaction between region and temperature on this combined-horizon rate.
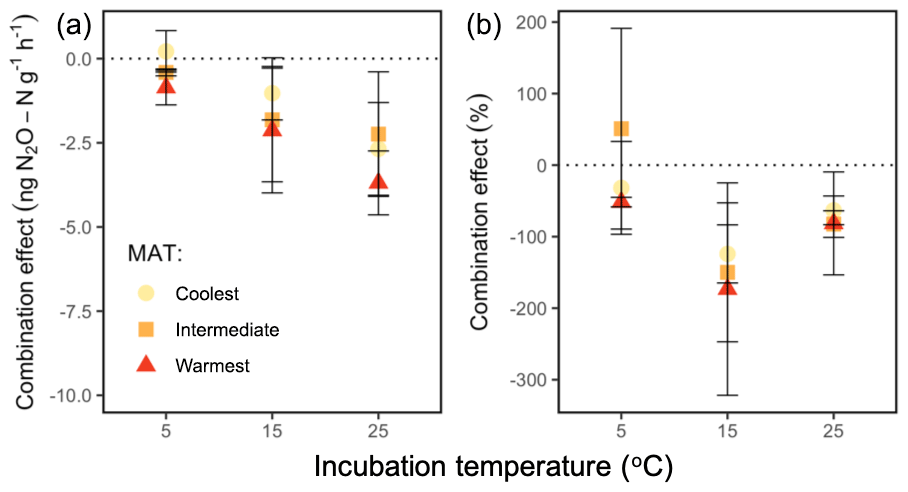
Figure 4The combination effect of shared headspace surrounding physically separated organic and mineral horizons on the absolute net N2O flux (a) and as a percentage of the expected N2O production rate (b), at the end of a 60 h incubation at 5, 15, and 25 ∘C, for soils from three regions along a boreal forest latitudinal transect. The combination effect (negative denotes reduction) is calculated as the difference between observed net N2O fluxes when soil horizons shared the incubation headspace (observed) and the linear, additive effect of rate differences between horizons in separate headspaces (). The percent combination effect was calculated as . The nonzero values suggest that the shared headspace generated a nonlinear, interactive effect on net N2O effluxes. “MAT” refers to the mean annual temperature. The “coolest” region is the Eagle River watershed (northern boreal), the “intermediate” region is the Salmon River watershed (mid-boreal), and the “warmest” region is the Grand Codroy watershed (southern boreal). See the text for site descriptions. Values are provided as the mean ± 1SE (n=3 forests per latitudinal region).
We used the change in 15N in the N2O (t60 h−t3 h) as a proxy for estimating how the relative contribution of the production and reduction of N2O varied among regions, across horizons, and with incubation temperature. Specifically, a negative net 15N abundance in N2O from t60 h to t3 h would indicate that consumption outpaced production, given that all the was reduced over this period. Instead, the change in 15N abundance in N2O across the incubation time was consistently positive, suggesting that rates of N2O production consistently outpaced rates of N2O reduction during the 60 h incubation. These values differed by region (P=0.001), which was a feature driven by the warmest region exhibiting the largest change compared with the coolest region (P=0.0007), and a similar trend was found between the warmest and intermediate-latitude regions (P=0.081; Fig. 5). There was no significant effect of incubation temperature or soil type or any interaction between temperature, region, and soil type on this change in N2O–15N.
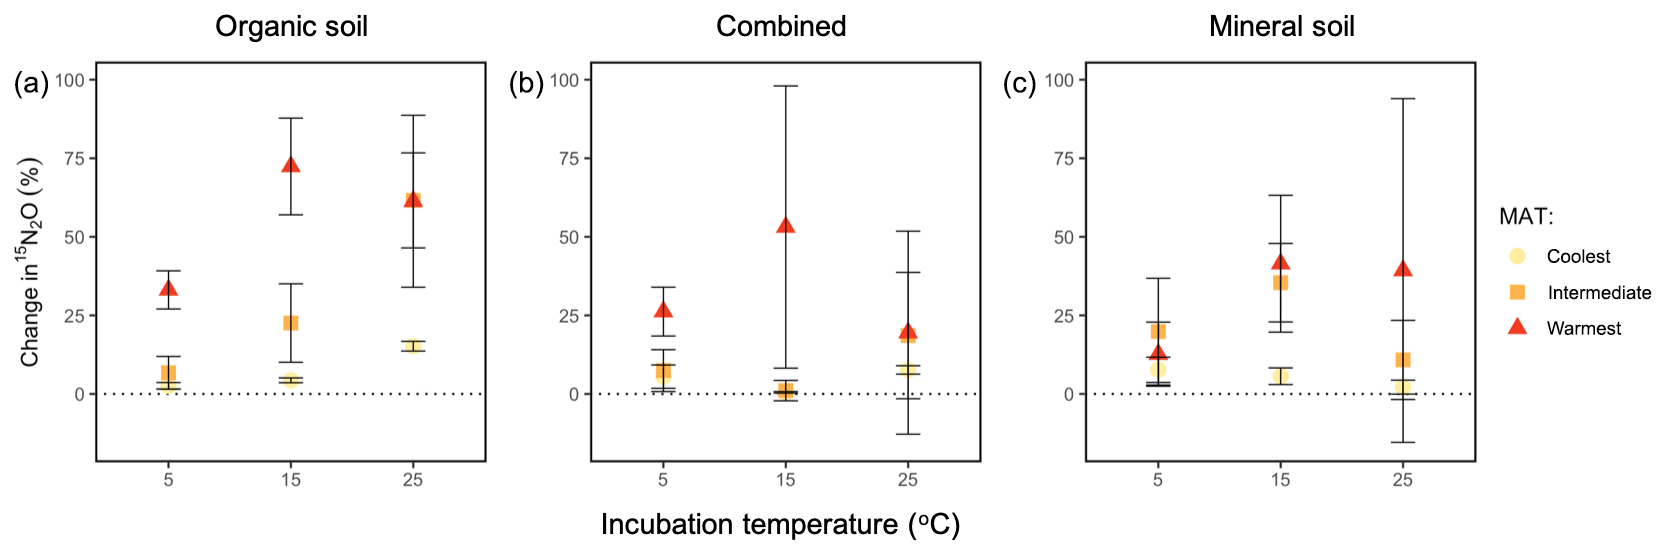
Figure 5Change in the percentage of added 15N observed in the headspace N2O over the course of a 60 h incubation at 5, 15, and 25 ∘C (t60 h−t3 h) for organic (a), combined organic and mineral (b), and mineral (c) soils from three regions along a boreal forest latitudinal transect. “Combined” refers to incubations with organic and mineral soil in the same jar, which are physically isolated but share the headspace. “MAT” refers to the mean annual temperature. The “coolest” region is the Eagle River watershed (northern boreal), the “intermediate” region is the Salmon River watershed (mid-boreal), and the “warmest” region is the Grand Codroy watershed (southern boreal). See the text for site descriptions. Values are provided as the mean ± 1SE (n=3 forests per latitudinal region).
3.3 Functional gene abundance
At the end of the 60 h incubation period, the abundance of one functional gene indicative of N2O production, nirS, did not vary significantly by incubation temperature or region but differed strongly by soil horizon (P<0.0001). There was a higher abundance of this gene in the organic soil ( g−1) vs. the mineral soil ( g−1), as shown in Fig. 6. There was no significant effect of any interaction among or between the independent variables on nirS abundance. Functional gene abundance for N2O reduction, nosZ, differed by region (P=0.0002), incubation temperature (P=0.04), and soil (P<0.0001). It was higher in soils from the warmest region ( g−1) relative to the intermediate-latitude region ( g−1, P=0.0006) and the coolest region ( g−1, P=0.001), at the coolest ( g−1) relative to the warmest incubation temperature ( g−1, P=0.02), and in organic ( g−1) relative to mineral soils ( g−1). There was no significant effect of any interaction among or between the independent variables on nosZ abundance, although there was a near-significant trend for soil type to alter the regional effect (P=0.052). The resulting nirS : nosZ ratio ranged from 0.03 to 0.55 and displayed an interaction between region and soil horizon (P=0.04), driven by lower nirS : nosZ ratios in organic soil in the warmest relative to intermediate-latitude region (P<0.0001) and the warmest relative to the coolest region (P=0.003); these effects were not exhibited in the mineral soil.
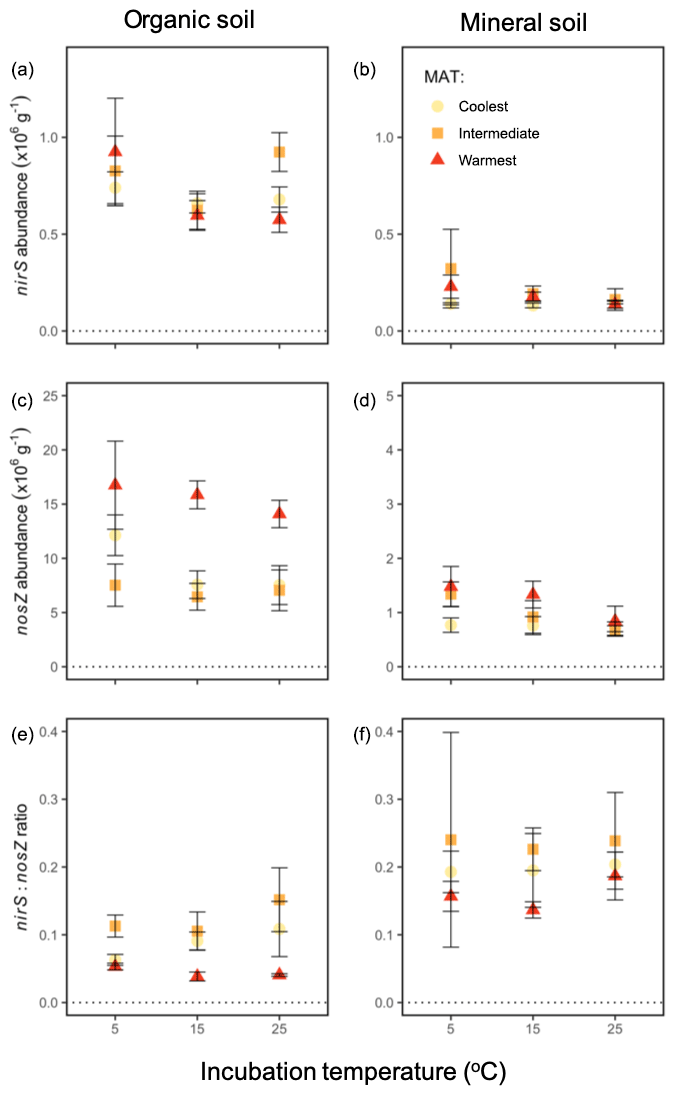
Figure 6Functional gene abundances during a 60 h incubation at 5, 15, and 25 ∘C from soil from three boreal forest regions along a latitudinal transect: nirS in the organic (a) and mineral (b) soil; nosZ in the organic (c) and mineral (d) soil; and the ratio of nirS : nosZ in the organic (e) and mineral (f) soil. Note that the y axis scales differ for each row and between panels (c) and (d). “MAT” refers to the mean annual temperature. The “coolest” region is the Eagle River watershed (northern boreal), the “intermediate” region is the Salmon River watershed (mid-boreal), and the “warmest” region is the Grand Codroy watershed (southern boreal). See the text site descriptions. Values are provided as the mean ± 1SE (n=3 forests per latitudinal region).
By promoting the denitrification pathway we aimed to (1) distinguish short- (via laboratory manipulations) and long-term (via a natural climate gradient) responses of the denitrification-derived net N2O flux to temperature, (2) assess the degree to which net N2O fluxes in these soils are sensitive to interactions between soil horizons, and (3) leverage the abundance of genes responsible for denitrifier production and reduction of N2O as a means of assessing differences in these processes' responses to short- and long-term temperature responses. Our first hypothesis was not supported: although short-term warming enhanced net N2O effluxes from these soils, soils from a historically warmer environment exhibited a greater net N2O efflux than those from cooler environments, suggesting a positive response of net N2O fluxes to both short- and long-term warming (Fig. 3). Indeed, an isotopic proxy for N2O reduction derived from the use of a stable isotope tracer suggests that enhancement of net N2O production with long-term warming can be greater than any enhancement in N2O reduction (Fig. 5). Our second hypothesis was supported in that the combined incubation of mineral and organic soils exhibited net N2O efflux rates that did not match the linear sum of separate incubation flux rates. However, we observed the reduction of N2O by mineral soil and not by organic soil as we predicted. Specifically, net N2O production was tempered by more mineral soil N2O reduction at warmer incubation temperatures (Figs. 4, 5), indicating that soil horizon interactions may be critical to rates of net N2O efflux to the aboveground atmosphere. Finally, our third hypothesis that linked gene abundance to process rates was only partially supported. NosZ decreased at the warmest incubation temperature (i.e., lower N2O reduction gene abundance with warming, Fig. 6), consistent with rates. However, in the organic soils, nosZ was higher under higher historical temperature (i.e., higher N2O reduction gene abundance with warming, Fig. 6), which was inconsistent with rates that increase with warming. There was no response to short- or long-term warming in nirS abundance in either soil horizon nor to long-term warming in nosZ abundance in the mineral soil. Combined, these data suggest complex microbial responses to short- and long-term exposure to distinct temperature regimes, which we expand upon below.
4.1 Warming-induced enhancement of N2O production exceeds that of N2O reduction
Long-term climate gradients substitute space for time and encompass variation in multiple ecosystem phenomena driven by centuries of exposure to distinct climate regimes. For instance, we know that in situ soil N cycling is more rapid (Philben et al., 2016) and likely supports greater forest productivity in the relatively warm, southernmost boreal forests of this transect (Ziegler et al., 2017). The net N2O efflux rate data from this set of lab incubations suggest that, especially in the organic soil horizons, both short-term warming and a long-term warmer climate enhance net N2O production, which is a result consistent with the stable isotope tracer data (Fig. 5). These data correspond with the enhanced, short-term warming-induced N2O fluxes observed in several systems (Billings and Tiemann, 2014; Kurganova and Lopes de Gerenyu, 2010; Szukics et al., 2010; Wang et al., 2014). The apparent lack of long-term, denitrifier adaptation to rising temperatures (i.e., the continued enhancement of N2O production with long-term exposure to warmer temperatures that outstrips enhancement of N2O reduction) is consistent with recent work in soils from these same sites demonstrating no change in the responses of microbial biomass-specific decay or CO2 efflux rates to warmer temperatures over decadal timescales (Min et al., 2019). However, results from the current study contrast with our hypothesis of microbial adaptations to a warmer climate over the long term, which assume that a soil denitrifying community that is well adapted to its temperature regime is effective at complete denitrification with relatively little N2O byproduct. Such predictions arise from more conceptual studies presenting ideas about microbial metabolic responses to warming (Billings and Ballantyne, 2013; Bradford, 2013) and not collective longer-term warming effects, such as substrate or microbial community compositional changes, that may further control microbial responses.
The similar difference in net N2O rates between the northern region and southern region (2.6 ng N2O–N ) and between the coolest and warmest incubation temperature (2.3 ng N2O–N , both 68 % of the average range across treatments) indicates that net rates were enhanced to a similar degree by both short-term warming of 20 ∘C and a long-term MAT difference of 5 ∘C. Temperature sensitivity (i.e., change per degree Celsius) of net N2O flux increased at lower latitudes, and the isotopic tracer experiment indicated that N2O production increases outpaced N2O reduction increases in warmer regions. Enhanced soil organic matter inputs and nitrogen availability and cycling rates in the warmer climate forests (Philben et al., 2016; Ziegler et al., 2017) may contribute to greater net N2O production in the incubations and in situ. In this short-term incubation, the pulse of added minimized any differences in availability for denitrifiers, likely leaving varying abilities of the soil denitrifier community to respond to warming as a key difference across the incubated soils. Therefore, the additive, positive result from both historically warmer soils and warmer incubation temperatures suggests that community-level denitrifier effectiveness declines (i.e., more incomplete denitrification) in warmer temperatures if they are from soils with historically warmer temperatures. This pattern contradicts a home field advantage (Wallenstein et al., 2013) for denitrifiers. More N2O production in warmer climates may arise from multiple changes that overcome adaptive home field advantages, such as shifts in the community composition (Delgado-Baquerizo et al., 2016) and an increased number of inefficient N2O producers, increases in the number of microbial cells and transfer points involved in the denitrification pathway (i.e., nitrifier-denitrification in a single organism vs. coupled nitrification–denitrification in distinct organisms (Butterbach-Bahl et al., 2013), or a changed contribution of alternate, possibly less-efficient electron donors (i.e., co-denitrification; Spott et al., 2011).
Despite increased net N2O production with higher temperatures, soil horizon interactions temper the response to warming. Two of our methods supported the potential for mineral soil N2O reduction: (1) calculated differences in flux values between shared headspace N2O flux values and the isolated headspace N2O flux values of the two isolated horizons, and (2) the change in the isotopic enrichment of the shared and isolated headspace N2O. The first method demonstrated that short-term warming enhanced the degree of inter-profile interaction that increased N2O reduction during the incubation, whereas long-term warming did not significantly influence inter-profile N2O dynamics (Fig. 4a, b). The similarities in the net N2O flux between the combined and mineral soil incubations (Fig. 3b, c), and the fact that both of these incubations have lower flux than the organic soil alone, indicate that the mineral soil served as a net N2O reducer, especially in response to short-term temperature increases. A caveat to this soil horizon interaction is that while our O2-limited experimental environment was necessary to promote denitrification, this design may have exaggerated total soil reduction processes that occur naturally in anaerobic microsites.
Our second method of detecting horizon interactions driving net N2O efflux used 15N2O headspace differences from the start to the end of the incubation as an indicator of reduction. We expected an increase in the 15N in the headspace N2O as is reduced, followed by a decline in 15N in the headspace N2O as the tracer flows into the N2 pool, with balance of these processes over the 60 h incubation indicating net production or reduction (Billings and Tiemann, 2014). pools declined and the change in our 15N2O abundance was positive, suggesting that N2O production still outweighed reduction at the end of the 60 h for both the individual horizons and the combination incubation (Fig. 5a). Large variation in 15N2O abundance among forest sites led to no significant difference between soil horizons and did not allow us to confirm the direction of horizon interactions. Horizon interactions drove net profile N2O fluxes in a field drought manipulation in a Norwegian spruce forest, during which soils exhibited a net N2O sink via upper mineral soil reduction of deep mineral soil N2O production (Goldberg and Gebauer, 2009). It remains unknown if the relatively shallow mineral soils we sampled are analogous reducers of deeper mineral soil N2O produced in this system or if they could continue to reduce large portions of organic soil N2O efflux (Fig. 4) in situ. Contrary to our original hypothesis, shallow mineral soils in situ may be better suited than organic soils to N2O reduction, as mineral soils experience frequent inputs of leached and DOC (dissolved organic carbon) from the surface organic soils and represent a sudden change in the soil structure and porosity towards well-packed fines and smaller pores. These conditions may promote leachate pooling, anaerobic microsites, and a microbial community that proves more effective at reduction.
Mineral soil reduction of organic soil-generated N2O becomes most relevant when diffusion of N2O from the upper soil profile to the atmosphere is restricted, and N2O produced in those surface layers diffuses downwards according to Fick's Law as has been discussed in the literature for soil CO2 dynamics (Oh et al., 2005; Richter et al., 2015). Such a situation is likely to occur in “hot spots” (McClain et al., 2003) such as frozen surface soil patches during winter. Similarly, “hot moments” may occur in the spring snow melt or in winter, despite cold temperatures reducing N cycling rates: subnivean N2O production can be an important contribution to annual N budgets in pastures (reviewed in Uchida and Clough, 2015), and winter N dynamics also appear to be important in northern temperate forest systems. For example, winter N2O production equaled ∼30 % of the summer N2O production in a southeastern Canadian forest (Enanga et al., 2016) and ∼60 % of the annual atmospheric N inputs in a northeastern US forest (Morse et al., 2015). Mineral soil reduction of winter organic soil-generated N2O may temper net fluxes and may be an important feature of N cycling in these forests that likely varies with snowpack dynamics.
4.2 Linking biogeochemical process rates to genetic potential
The functional gene associated with N2O reduction that we could quantify in these soils was sensitive to both short-term and historical temperature, although it was not consistently associated with process rates. While we did not detect the atypical nosZ clade II in these soils, other, yet unknown genes that we did not measure may be responsible for N2O reduction. Beyond this possibility, our results suggest a decoupling of process rates and denitrifier genetic controls or that the long-term temperature-related increase in genetic potential for N2O reduction did not translate to rates as effectively as the short-term temperature-related decrease in genetic potential for N2O reduction.
Consistent with enhanced net N2O production in these soils at warmer incubation temperatures, the nosZ abundances were reduced after 60 h exposure to 25 ∘C relative to cooler incubations. Although functional gene abundances are assumed to integrate longer-term changes in the microbial community and, thus, have a reduced dynamism relative to instantaneous rates (Petersen et al., 2012), our results appear to reflect a capacity of denitrifiers to respond rapidly to temperature, as indicated in other laboratory incubations that assayed temperature responses of denitrification functional gene abundances (Billings and Tiemann, 2014; Cui et al., 2016; Keil et al., 2015). However, inconsistent with enhanced net N2O production in the soils from warmer historical temperatures, we found a reduced nirS : nosZ ratio in the southern forest soils. A possible explanation for this apparent decoupling between gene abundances and biogeochemical outcomes may be an interference between potential and transcription (i.e., better detected with mRNA) or inadequate measurement of all genes relevant to N2O dynamics in these soils. Although our experimental setup promoted denitrification, our incubation may also have supported dissimilatory nitrate reduction to ammonium (DNRA; Schmidt et al., 2011). This pathway is poorly characterized, but it has been detected in both aerobic and anaerobic environments of many soil types; it may account for a large proportion of –N reduction in forest soils (Bengtsson and Bergwall 2000). DNRA represents a process that can reduce via a different nitrite reduction enzyme (nrf) than denitrification (nir) and can result in an accumulation of NH4–N, as we observed during our incubation. The process also produces and reduces N2O (Luckmann et al., 2014). The potential existence of this alternate pathway of reduction and N2O production and reduction does not negate the observed N2O efflux nor the nosZ response to short-term and historical temperature shifts; however, it does imply that a deeper understanding of the complex genetic N cycle is required to link soil process rates to genetic potential.
Contrasting efficiencies of N2O scavenging is another possible explanation for the decoupling between gene abundances and biogeochemical fluxes in these soils, as the catalytic efficiency of enzymes can vary with community structure and resource availability (Tischer et al., 2015), which are conditions that vary between boreal soil horizons. The observation that mineral soil has the capacity to reduce a substantial amount of organic soil-derived N2O even as nosZ abundances are reduced in mineral compared with organic soil, provides a strong indication that nosZ in mineral soil is more efficient at scavenging N2O from the headspace than nosZ in the organic horizon. Alternatively, it would be beneficial to increase efforts to detect the nosZ clade II in boreal forest soil organic and mineral horizons, as this clade is not detected by the nosZ primer and has a higher N2O consumption capacity than nosZ in European mineral soils (Jones et al., 2014). Consistent with our combination samples in the current study, there is increasing evidence that soils can serve as sinks for atmospheric N2O (Chapuis-Lardy et al., 2007) and, interestingly, that this phenomenon can be particularly evident when soil water is limited (Goldberg and Gebauer, 2009). Therefore, given the varying gene abundance and enzyme efficiency with depth implied in this study, a likely fruitful area of research would be to explore the mineral soil N2O sink capacity and mineral soil genetic response as moisture availability varies – the occurrence of which is particularly notable during snowmelt periods and in fall within these boreal soils.
The sensitivity of soil N2O efflux to global change factors such as rising temperature can be high, as supported by this study, but the mechanisms driving N2O sources and sinks remain challenging to elucidate. Indeed, variation of net soil denitrifier N2O efflux within climate region in this study, although less than variation across regions, warrants further consideration of within-region controls on N2O efflux. The meaningful differences in the responses to temperature that we observed across regions, however, permitted us to address the three critical issues framed at the outset of this study; we conclude with three observations and questions for future research. To improve Earth system models of greenhouse gas emissions we need to address the importance of varying N2O dynamics with soil depth. Indeed, this research highlights the potentially different effectiveness of organisms possessing N2O-relevant functional genes as we move across depth. Is it ubiquitous that organisms possessing nosZ are more effective at reducing N2O to N2 in subsurface soils? We have taken the first step towards this characterization, but similar studies should address this question in diverse ecosystems. Our results also illustrate that both denitrifier-mediated rates of N2O production and reduction can increase with warming, over both short- and long-term timescales, in boreal forest soils. In situ variables would undoubtedly alter the ex situ fluxes observed in this study, but we demonstrate that the net response to warming in these boreal forest soils is dominated by N2O production when conditions promote denitrification. Finally, we remain uncertain of the relative importance of the denitrification pathway in N2O emissions in boreal forest soils (i.e., compared with nitrification, co-denitrification, DNRA, and others) and suggest similar approaches to explore the importance of the historic climate regime, shorter-term temperature variation, and interactive responses among soil horizons in other biochemical pathways of soil N2O emission.
The data and code for the figures and analysis are publicly available at https://doi.org/10.5281/zenodo.3934598 (Buckeridge, 2020).
The supplement related to this article is available online at: https://doi.org/10.5194/soil-6-399-2020-supplement.
KMB and SAB designed the experiment, and KAE, SEZ, and SAB conceptualized the site aims and managed research for the site. KAE conducted the field sampling, and KMB and KM carried out the lab incubations and analysis. KMB prepared the paper with contributions from all co-authors.
The authors declare that they have no conflict of interest.
We gratefully acknowledge field assistance from Andrea Skinner and laboratory assistance from Carl Heroneme, Samantha Elledge, Yanjun Chen, and Mitch Sellers. Research support was provided by an Association for Women Geoscientists Graduate Research Scholarship (the University of Kansas) and the Kansas Biological Survey Graduate Summer Research Fund to Kyungjin Min. The Canadian Forest Service of Natural Resources Canada provided valuable logistical support.
This research has been supported by the National Science Foundation, Division of Environmental Biology (grant no. NSF-DEB 0950095) and the Natural Sciences and Engineering Research Council of Canada (grant no. RGPIN#341863).
This paper was edited by Steven Sleutel and reviewed by three anonymous referees.
Alster, C. J., German, D. P., Lu, Y., and Allison, S. D.: Microbial enzymatic responses to drought and to nitrogen addition in a southern California grassland, Soil Biol. Biochem., 64, 68–79, https://doi.org/10.1016/j.soilbio.2013.03.034, 2013.
Baggs, E. M.: Soil microbial sources of nitrous oxide: Recent advances in knowledge, emerging challenges and future direction, Curr. Opin. Environ. Sustain., 3, 321–327, https://doi.org/10.1016/j.cosust.2011.08.011, 2011.
Bai, E., Li, S., Xu, W., Li, W., Dai, W., and Jiang, P.: A meta-analysis of experimental warming effects on terrestrial nitrogen pools and dynamics, New Phytol., 199, 431–440, https://doi.org/10.1111/nph.12252, 2013.
Bengtsson, G. and Bergwall, C.: Fate of 15N labelled nitrate and ammonium in a fertilized forest soil, Soil Biol. Biochem., 32, 545–557, https://doi.org/10.1016/S0038-0717(99)00183-2, 2000.
Benoit, M., Garnier, J., and Billen, G.: Temperature dependence of nitrous oxide production of a luvisolic soil in batch experiments, Process Biochem., 50, 79–85, https://doi.org/10.1016/j.procbio.2014.10.013, 2015.
Billings, S. A.: Nitrous oxide in flux, Nature, 456, 888–889, 2008.
Billings, S. A. and Ballantyne, F.: How interactions between microbial resource demands, soil organic matter stoichiometry, and substrate reactivity determine the direction and magnitude of soil respiratory responses to warming, Glob. Change Biol., 19, 90–102, https://doi.org/10.1111/gcb.12029, 2013.
Billings, S. A. and Tiemann, L. K.: Warming-induced enhancement of soil N2O efflux linked to distinct response times of genes driving N2O production and consumption, Biogeochemistry, 119, 371–386, https://doi.org/10.1007/s10533-014-9973-2, 2014.
Blume, E., Bischoff, M., Reichert, J. M., Moorman, T., Konopka, A., and Turco, R. F.: Surface and subsurface microbial biomass, community structure and metabolic activity as a function of soil depth and season, Appl. Soil Ecol., 20, 171–181, https://doi.org/10.1016/S0929-1393(02)00025-2, 2002.
Bradford, M. A.: Thermal adaptation of decomposer communities in warming soils, Front. Microbiol., 4, 1–16, https://doi.org/10.3389/fmicb.2013.00333, 2013.
Braker, G. and Tiedje, J. M.: Nitric Oxide Reductase (norB) Genes from Pure Cultures and Environmental Samples Nitric Oxide Reductase (norB) Genes from Pure Cultures and Environmental Samples, Appl. Environ. Microb., 69, 3476–3483, https://doi.org/10.1128/AEM.69.6.3476-3483.2003, 2003.
Buckeridge, K. M.: NLBELT_N2O (Version v.1.0), Zenodo, https://doi.org/10.5281/zenodo.3934598, 2020.
Buckeridge, K. M., Banerjee, S., Siciliano, S. D., and Grogan, P.: The seasonal pattern of soil microbial community structure in mesic low arctic tundra, Soil Biol. Biochem., 65, 338–347, https://doi.org/10.1016/j.soilbio.2013.06.012, 2013.
Butler, S. M., Melillo, J. M., Johnson, J. E., Mohan, J., Steudler, P. A., Lux, H., Burrows, E., Smith, R. M., Vario, C. L., Scott, L., Hill, T. D., Aponte, N., and Bowles, F.: Soil warming alters nitrogen cycling in a New England forest: Implications for ecosystem function and structure, Oecologia, 168, 819–828, https://doi.org/10.1007/s00442-011-2133-7, 2012.
Butterbach-Bahl, K. and Dannenmann, M.: Denitrification and associated soil N2O emissions due to agricultural activities in a changing climate, Curr. Opin. Environ. Sustain., 3, 389–395, https://doi.org/10.1016/j.cosust.2011.08.004, 2011.
Butterbach-Bahl, K., Baggs, E. M., Dannenmann, M., Kiese, R., and Zechmeister-Boltenstern, S.: Nitrous oxide emissions from soils: how well do we understand the processes and their controls?, Philos. Trans. R. Soc. B-Biol. Sci., 368, 20130122, https://doi.org/10.1098/rstb.2013.0122, 2013.
Cavicchioli, R., Bakken, L. R., Baylis, M., Foreman, C. M., Karl, D. M., Koskella, B., Welch, D. B. M., Martiny, J. B. H., Moran, M. A., Rich, V. I., Singh, B. K., Stein, L. Y., Stewart, F. J., Sullivan, M. B., Webb, E. A., and Webster, N. S.: Scientists' warning to humanity: microorganisms and climate change, Nat. Rev. Microbiol., 17, 569–586, https://doi.org/10.1038/s41579-019-0222-5, 2019.
Chapuis-Lardy, L., Wrage, N., Metay, A., Chotte, J. L., and Bernoux, M.: Soils, a sink for N2O? A review, Glob. Change Biol., 13, 1–17, https://doi.org/10.1111/j.1365-2486.2006.01280.x, 2007.
Ciais, P., Sabine, C., Bala, G., Bopp, L., Brovkin, V., Canadell, J., Chhabra, A., DeFries, R., Galloway, J., Heimann, M., Jones, C., Le Quéré, C., Myneni, R. B., Piao, S., and Thornton, P.: Carbon and Other Biogeochemical Cycles Supplementary Material, in: Climate Change 2013: The Physical Science Basis. Contribution of Working Group I to the Fifth Assessment Report of the Intergovernmental Panel on Climate Change, edited by: Stocker, T. F., Qin, D., Plattner, G.-K., Tignor, M., Allen, S. K., Boschung, J., Nauels, A., Xia, Y., Bex, V., and Midgley, P. M., Cambridge University Press, Cambridge, United Kingdom and New York, NY, USA, 2013.
Cui, P., Fan, F., Yin, C., Song, A., Huang, P., Tang, Y., Zhu, P., Peng, C., Li, T., Wakelin, S. A., and Liang, Y.: Long-term organic and inorganic fertilization alters temperature sensitivity of potential N2O emissions and associated microbes, Soil Biol. Biochem., 93, 131–141, https://doi.org/10.1016/j.soilbio.2015.11.005, 2016.
Delgado-Baquerizo, M., Grinyer, J., Reich, P. B., and Singh, B. K.: Relative importance of soil properties and microbial community for soil functionality: insights from a microbial swap experiment, Funct. Ecol., 30, 1862–1873, https://doi.org/10.1111/1365-2435.12674, 2016.
Dijkstra, F. A., Prior, S. A., Runion, G. B., Torbert, H. A., Tian, H., Lu, C., and Venterea, R. T.: Effects of elevated carbon dioxide and increased temperature on methane and nitrous oxide fluxes: Evidence from field experiments, Front. Ecol. Environ., 10, 520–527, https://doi.org/10.1890/120059, 2012.
Enanga, E. M., Creed, I. F., Fairweather, T., and Casson, N. J.: Snow-covered soils produce N2O that is lost from forested catchments, J. Geophys. Res.-Biogeosci., 121, 2356–2368, https://doi.org/10.1002/2016JG003411, 2016.
Environment and Climate Change Canada: Climate Change Normals 1981–2010 Station Data, available at: http://climate.weather.gc.ca/climate_normals/, last access: 20 August 2020.
Fierer, N., Schimel, J. P., and Holden, P. A.: Variations in microbial community composition through two soil depth profiles, Soil Biol. Biochem., 35, 167–176, 2003.
Firestone, M. K. and Davidson, E. A.: Microbiologial Basis of NO and N2O production and consumption in soil, in: Exchange of Trace Gases between Terrestrial Ecosystems and the Atmosphere, edited by: Andreae, M. O. and Schimel, D. S., 7–21, Wiley and Sons Ltd., Bernhard, Dahlem Konferenzen, 1989.
Goldberg, S. D. and Gebauer, G.: Drought turns a Central European Norway spruce forest soil from an N2O source to a transient N2O sink, Glob. Change Biol., 15, 850–860, https://doi.org/10.1111/j.1365-2486.2008.01752.x, 2009.
Henry, S., Bru, D., Stres, B., Hallet, S., and Philippot, L.: Quantitative detection of the nosZ gene, encoding nitrous oxide reductase, and comparison of the abundances of 16S rRNA, narG, nirK, and nosZ genes in soils, Appl. Environ. Microb., 72, 5181–5189, https://doi.org/10.1128/AEM.00231-06, 2006.
Jones, C. M., Graf, D. R. H., Bru, D., Philippot, L., and Hallin, S.: The unaccounted yet abundant nitrous oxide-reducing microbial community: A potential nitrous oxide sink, ISME J., 7, 417–426, https://doi.org/10.1038/ismej.2012.125, 2013.
Jones, C. M., Spor, A., Brennan, F. P., Breuil, M.-C., Bru, D., Lemanceau, P., Griffiths, B., Hallin, S., and Philippot, L.: Recently identified microbial guild mediates soil N2O sink capacity, Nat. Clim. Change, 4, 801–805, https://doi.org/10.1038/nclimate2301, 2014.
Keil, D., Niklaus, P. A., von Riedmatten, L. R., Boeddinghaus, R. S., Dormann, C. F., Scherer-Lorenzen, M., Kandeler, E., and Marhan, S.: Effects of warming and drought on potential N2O emissions and denitrifying bacteria abundance in grasslands with different land-use, FEMS Microbiol. Ecol., 91, 1–9, https://doi.org/10.1093/femsec/fiv066, 2015.
Kurganova, I. N. and Lopes de Gerenyu, V. O.: Effect of the temperature and moisture on the N2O emission from some arable soils, Eurasian Soil Sci., 43, 919–928, https://doi.org/10.1134/S1064229310080090, 2010.
Luckmann, M., Mania, D., Kern, M., Bakken, L. R., Frostegård, A., and Simon, J.: Production and consumption of nitrous oxide in nitrate-ammonifying Wolinella succinogenes cells, Microbiology, 160, 1749–1759, https://doi.org/10.1099/mic.0.079293-0, 2014.
McClain, M. E., Boyer, E. W., Dent, C. L., Gergel, S. E., Grimm, N. B., Groffman, P. M., Hart, S. C., Harvey, J. W., Johnston, C. A., Mayorga, E., McDowell, W. H., and Pinay, G.: Biogeochemical hot spots and hot moments at the interface of terrestrial and aquatic ecosystems, Ecosystems, 6, 301–312, https://doi.org/10.1007/s10021-003-0161-9, 2003.
McDaniel, M. D., Kaye, J. P., and Kaye, M. W.: Increased temperature and precipitation had limited effects on soil extracellular enzyme activities in a post-harvest forest, Soil Biol. Biochem., 56, 90–98, https://doi.org/10.1016/j.soilbio.2012.02.026, 2013.
Min, K., Buckeridge, K., Ziegler, S. E., Edwards, K. A., Bagchi, S., and Billings, S. A.: Temperature sensitivity of biomass-specific microbial exo-enzyme activities and CO2 efflux is resistant to change across short- and long-term timescales, Glob. Change Biol., 25, 1793–1807, https://doi.org/10.1111/gcb.14605, 2019.
Morse, J. L., Durán, J., and Groffman, P. M.: Soil Denitrification Fluxes in a Northern Hardwood Forest: The Importance of Snowmelt and Implications for Ecosystem N Budgets, Ecosystems, 18, 520–532, https://doi.org/10.1007/s10021-015-9844-2, 2015.
Mosier, A., Kroeze, C., Nevison, C., Oenema, O., and Seitzinger, S.: Closing the global N2O budget?: nitrous oxide emissions through the agricultural nitrogen cycle inventory methodology, Nutr. Cycl. Agroecosys., 52, 225–248, https://doi.org/10.1023/A:1009740530221, 1998.
Oh, N.-H., Kim, H.-S., and Richter, D. D.: What Regulates Soil CO2 Concentrations? A Modeling Approach to CO2 Diffusion in Deep Soil Profiles, Environ. Eng. Sci., 22, 38–45, https://doi.org/10.1089/ees.2005.22.38, 2005.
Pell, M., Stenberg, B., Stenstrom, J., and Torstensson, L.: Potential denitrification activity assay in soil – With or without chloramphenicol?, Soil Biol. Biochem., 28, 393–398, https://doi.org/10.1016/0038-0717(95)00149-2, 1996.
Petersen, D. G., Blazewicz, S. J., Firestone, M., Herman, D. J., Turetsky, M., and Waldrop, M.: Abundance of microbial genes associated with nitrogen cycling as indices of biogeochemical process rates across a vegetation gradient in Alaska, Environ. Microbiol., 14, 993–1008, https://doi.org/10.1111/j.1462-2920.2011.02679.x, 2012.
Philben, M., Ziegler, S. E., Edwards, K. A., Kahler, R., and Benner, R.: Soil organic nitrogen cycling increases with temperature and precipitation along a boreal forest latitudinal transect, Biogeochemistry, 127, 397–410, https://doi.org/10.1007/s10533-016-0187-7, 2016.
Podrebarac, F. A., Laganière, J., Billings, S. A., Edwards, K. A., and Ziegler, S. E.: Soils isolated during incubation underestimate temperature sensitivity of respiration and its response to climate history, Soil Biol. Biochem., 93, 60–68, https://doi.org/10.1016/j.soilbio.2015.10.012, 2016.
Portmann, R. W., Daniel, J. S., and Ravishankara, A. R.: Stratospheric ozone depletion due to nitrous oxide: influences of other gases, Philos. Trans. R. Soc. B-Biol. Sci., 367, 1256–1264, https://doi.org/10.1098/rstb.2011.0377, 2012.
R Core Team: R: A language and environment for statistical computing, R Foundation for Statistical Computing, Vienna, Austria, 2014.
Richter, D., Richter, D., and Billings, S. A.: Tansley review “One physical system”: Tansley's ecosystem as Earth's critical zone, New Phytol., 206, 900–912, 2015.
Rösch, C., Mergel, A., Bothe, H., and Ro, C.: Biodiversity of Denitrifying and Dinitrogen-Fixing Bacteria in an Acid Forest Soil, Appl. Environ. Microb., 68, 3818–3829, https://doi.org/10.1128/AEM.68.8.3818-3829.2002, 2002.
Schmidt, C. S., Richardson, D. J., and Baggs, E. M.: Constraining the conditions conducive to dissimilatory nitrate reduction to ammonium in temperate arable soils, Soil Biol. Biochem., 43, 1607–1611, https://doi.org/10.1016/j.soilbio.2011.02.015, 2011.
Soil Classification Working Group: The Canadian System of Soil Classification, 3rd Edn., Agric. and Agri-Food Can. Publ. 1646 (Revised), Ottawa, Canada, 1998.
Spott, O., Russow, R., and Stange, C. F.: Formation of hybrid N2O and hybrid N2 due to codenitrification: First review of a barely considered process of microbially mediated N-nitrosation, Soil Biol. Biochem., 43, 1995–2011, https://doi.org/10.1016/j.soilbio.2011.06.014, 2011.
Szukics, U., Abell, G. C. J., Hödl, V., Mitter, B., Sessitsch, A., Hackl, E., and Zechmeister-Boltenstern, S.: Nitrifiers and denitrifiers respond rapidly to changed moisture and increasing temperature in a pristine forest soil, FEMS Microbiol. Ecol., 72, 395–406, https://doi.org/10.1111/j.1574-6941.2010.00853.x, 2010.
Throbäck, I. N., Enwall, K., Jarvis, Å., and Hallin, S.: Reassessing PCR primers targeting nirS, nirK and nosZ genes for community surveys of denitrifying bacteria with DGGE, FEMS Microbiol. Ecol., 49, 401–417, https://doi.org/10.1016/j.femsec.2004.04.011, 2004.
Tischer, A., Blagodatskaya, E., and Hamer, U.: Microbial community structure and resource availability drive the catalytic efficiency of soil enzymes under land-use change conditions, Soil Biol. Biochem., 89, 226–237, https://doi.org/10.1016/j.soilbio.2015.07.011, 2015.
Uchida, Y. and Clough, T. J.: Nitrous oxide emissions from pastures during wet and cold seasons, Grassl. Sci., 61, 61–74, https://doi.org/10.1111/grs.12093, 2015.
Venables, W. N. and Ripley, B. D.: Modern Applied Statistics With S, Technometrics, 45, 111–111, https://doi.org/10.1198/tech.2003.s33, 2003.
Wallenstein, M. D. and Vilgalys, R. J.: Quantitative analyses of nitrogen cycling genes in soils, Pedobiologia (Jena), 49, 665–672, https://doi.org/10.1016/j.pedobi.2005.05.005, 2005.
Wallenstein, M. D., Myrold, D. D., Firestone, M., and Voytek, M.: Environmental controls on denitrifying communities and denitrification rates?: Insights from molecular methods, Ecol. Appl., 16, 2143–2152, 2006.
Wallenstein, M. D., Haddix, M. L., Ayres, E., Steltzer, H., Magrini-Bair, K. A., and Paul, E. A.: Litter chemistry changes more rapidly when decomposed at home but converges during decomposition-transformation, Soil Biol. Biochem., 57, 311–319, https://doi.org/10.1016/j.soilbio.2012.09.027, 2013.
Wang, J., Song, C., Zhang, J., Wang, L., Zhu, X., and Shi, F.: Temperature sensitivity of soil carbon mineralization and nitrous oxide emission in different ecosystems along a mountain wetland-forest ecotone in the continuous permafrost of Northeast China, Catena, 121, 110–118, https://doi.org/10.1016/j.catena.2014.05.007, 2014.
Ziegler, S. E., Benner, R., Billings, S. A., Edwards, K. A., Philben, M., Zhu, X., and Laganière, J.: Climate warming can accelerate carbon fluxes without changing soil carbon stocks, Front. Earth Sci., 5, 2, https://doi.org/10.3389/feart.2017.00002, 2017.