the Creative Commons Attribution 4.0 License.
the Creative Commons Attribution 4.0 License.
 | 24 Apr 2026
Drivers and vertical CO2 flux balances in a Sahelian agroforestry system: Insights from high frequency measurements
Olivier Roupsard
Lydie Chapuis-Lardy
Frédéric Bouvery
Yélognissè Agbohessou
Maxime Duthoit
Aleksander Wieckowski
Torbern Tagesson
Mohamed H. Assouma
Espoir K. Gaglo
Claire Delon
Bienvenu Sambou
Dominique Serça
Agroforestry systems – combining trees with crops and/or livestock – are increasingly promoted as sustainable and climate-resilient land-use strategies. Despite their widespread presence in the Sahel, experimental data on their potential as carbon sinks are scarce. This study presents a full-year, high-frequency dataset of CO2 fluxes in a Sahelian agro-silvo-pastoral parkland dominated by Faidherbia albida, located in Senegal's groundnut basin. CO2 fluxes were continuously measured using automated dynamic chambers, allowing the quantification of soil and crop respiration (Rch), gross primary production (GPPch), and net carbon exchange (FCO2ch) under both full sun and shaded (under tree canopies) environments. Seasonal patterns of CO2 fluxes were similar in both environments, with peaks during the rainy season. Rch and GPPch were significantly higher under tree canopies, indicating a “fertile island” effect. CO2 flux variability was primarily driven by soil moisture and leaf area index. Chamber-based GPP estimates closely matched those from Eddy Covariance measurements. On an annual scale, F. albida trees contributed approximately 23 % of total ecosystem GPP, with a carbon use efficiency of 0.48. Net annual vertical CO2 exchange was estimated at −1.4 ± 0.46 and −1.8 ± 0.17 Mg C-CO2 ha−1 using chamber and Eddy Covariance methods, respectively. These findings underscore the role of F. albida-based agroforestry systems as effective carbon sinks in Sahelian landscapes, supporting their potential contribution to climate change mitigation.
- Article
(2852 KB) - Full-text XML
-
Supplement
(1383 KB) - BibTeX
- EndNote


-
Long-term high frequency CO2 flux measurements using automated dynamic chambers in a Sahelian F. albida parkland.
-
Empirical gap-filling and flux partitioning methods validated against Eddy Covariance GPP.
-
Fluxes peaked during the rainy season both at a distance from trees in full sun (FS) and under tree canopies (Sh), driven mainly by soil moisture and leaf area.
-
F. albida trees enhance CO2 fluxes under canopies (“fertile island” effect) and account for ∼ 23 % of annual ecosystem GPP.
Plant photosynthesis and respiration – both autotrophic (plant) and heterotrophic (microbial) – are fundamental processes driving carbon dioxide (CO2) fluxes in terrestrial ecosystems (Lambers et al., 2008; Raich et al., 2014; Reichle, 2020). Accurate quantification of these processes is critical for assessing ecosystem carbon (C) sink potential (Baldocchi, 2020), particularly for informing climate-smart land management strategies.
To capture these processes at the ecosystem scale, the Eddy Covariance (EC) technique has emerged as a transformative method, enabling continuous and high-frequency CO2 flux measurements (Baldocchi, 2003, 2008). The EC technique quantifies CO2 exchanges between ecosystems and the atmosphere by correlating fluctuations in vertical wind velocity with simultaneous variations in CO2 concentrations, providing a direct and non-invasive estimate of CO2 fluxes (Baldocchi, 2003). Extensive EC networks in Europe (Stojanović et al., 2024), Asia (Yu et al., 2011), and the Americas (Chu et al., 2021) have significantly advanced our understanding of the global C cycle. In contrast, sub-Saharan Africa remains critically underrepresented (Bombelli et al., 2009; Houghton and Hackler, 2006; Williams et al., 2007). Although some studies have used EC (Ardö et al., 2008; Brümmer et al., 2008; Merbold et al., 2009; Tagesson et al., 2016b), static chambers (Assouma et al., 2017; Owusu-Prempeh et al., 2024; Rosenstock et al., 2016; Wachiye et al., 2020), or modeling approaches (Agbohessou et al., 2023, 2024; Delon et al., 2019; Rahimi et al., 2021), they remain sparse and methodologically heterogeneous, limiting comparability and regional C budget integration.
Among these underrepresented landscapes, agroforestry systems in the Sahel – particularly agro-silvo-pastoral systems (ASPS) that combine trees, crops, and livestock – are increasingly promoted for sustainable land management and climate resilience (Cardinael et al., 2021; Gupta et al., 2023; Mbow et al., 2014; Stetter and Sauer, 2024). However, the structural and functional heterogeneity of these systems poses significant challenges for accurately quantifying and upscaling C fluxes. Faidherbia albida, a keystone agroforestry tree species in these ASPS (Leroux et al., 2022; Lu et al., 2022), is of particular interest due to its reverse phenology, capacity to enhance soil fertility and crop yields (Bayala et al., 2020; Roupsard et al., 2020; Sileshi, 2016; Sileshi et al., 2020). Yet, its functional role in modulating both the magnitude and seasonal dynamics of CO2 fluxes remains poorly understood.
Addressing this knowledge gap requires integrated approaches capable of capturing both aggregate and component-specific CO2 fluxes. While EC remains the gold standard method for CO2 flux measurements at the landscape scale (Baldocchi, 2003), it captures net ecosystem exchange (NEE) as an aggregate signal, without separating the contributions from individual compartments such as soil, crops, and trees. This limits its utility for disentangling processes and attributing sources in heterogeneous systems like ASPS. Automated dynamic chambers provide a valuable complement to EC, as they enable continuous, high-frequency measurements at finer scales and at the level of specific ecosystem components. This approach facilitates component-specific quantification of CO2 fluxes, particularly from soil and crop compartments (Luo and Zhou, 2006; Denmead, 2008; Zaman et al., 2021). When combined with EC, this dual-method approach strengthens source attribution and improves the partitioning of fluxes across complex agroforestry landscapes.
This study presents one of the first integrated quantification of CO2 fluxes in a Sahelian ASPS dominated by F. albida, combining EC and automated dynamic chambers.
Specifically, the study aims to (1) conduct year-round, high-frequency in situ CO2 flux measurements from soil and crops using automated dynamic chambers; (2) partition the net CO2 fluxes (FCO2ch) into respiration (Rch) and photosynthesis (GPPch); (3) investigate the environmental drivers of fluxes and the spatial variability linked to tree presence; and (4) compare chamber-based flux estimates with ecosystem-scale measurements derived from the EC method.
Based on these objectives, we hypothesize that (1) Rch and GPPch are higher under the canopy of F. albida than in full sun, (2) soil moisture is the main environmental factor directly controlling both Rch and GPPch, (3) when extrapolated to the field scale, the chamber-based method provides seasonal dynamics of respiration and photosynthesis fluxes comparable to those derived from EC technique.
2.1 Site description
The study was conducted in the agroforestry parkland of Sob village (Niakhar municipality, Fatick region), located in the groundnut basin of Senegal, within the Sahelo-Sudanian climatic zone of West Africa (Fig. 1). The climate is characterized by a long dry season (8–9 months) with high temperatures and strong diurnal variations, and a short rainy season from late June to mid-October (Delaunay et al., 2019).
Soils are locally known as “Dior” and classified as Arenosols (IUSS Working Group WRB, 2022). The topsoil has low organic matter (< 1 %) and phosphorus (< 3 mg kg−1), a sandy texture (> 85 % sand), and an acidic pH (Malou et al., 2021; Siegwart et al., 2022). Rainfed agriculture predominates. The main cropping system includes pearl millet (Pennisetum glaucum L.) and groundnut (Arachis hypogaea L.) in biennial rotation, with occasional intercropping of cowpea (Vigna unguiculata L.).
The site hosts the “Faidherbia Flux” station (14°29′44.916′′ N; 16°27′12.851′′ W; FLUXNET ID: SN-Nkr), a long-term research platform for monitoring ecosystem services in agroforestry systems. It is dominated by F. albida, a nitrogen-fixing, reverse-phenology tree with deep roots accessing groundwater (Roupsard et al., 1999). The tree density is ∼ 13 trees ha−1, with canopies covering ∼ 10 % of the soil surface (Roupsard et al., 2020). The EC tower is installed at 20 m height, approximately 12.5 m above the canopy. The study field is a typical 'bush field', characterized by low soil fertility, no mineral fertilization, and off-site export of crop residues and manure (Malou et al., 2021).
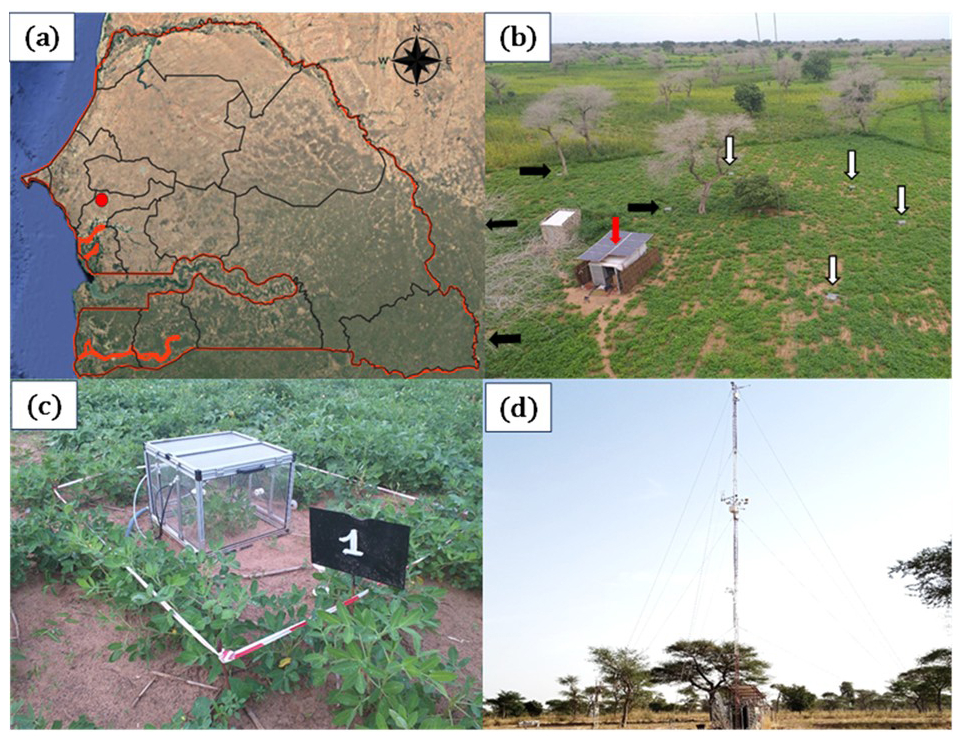
Figure 1Study area. (a) geographical location of Sob, Groundnut basin, Senegal (Map data © Google Earth, 2025), (b) overview (image from the Eddy Covariance tower located in the same bush-field) of the Faidherbia albida parkland during the rainy season, depicting groundnut crops with bare soil in the inter-row, F. albida trees (defoliated during the rainy season, average height = 13 m) and location of the chambers under the Shade of trees (horizontal black arrows; N=4) and in Full sun (vertical white arrows; N=4); The shelter (red arrow) with solar panels is to fit the analyser, automation and batteries (c) automatic chamber enclosing a groundnut plant (during the rainy season) or bare soil (during the dry season), (d) Eddy Covariance (EC) tower (measurement height = 20 m) during the dry season.
2.2 Experimental setup
2.2.1 CO2 flux measurements in automatic chambers
Continuous net CO2 fluxes (FCO2ch) from soil and groundnut plants were measured over a full phenological year (17 June 2021–17 June 2022) using eight automated dynamic chambers (50 × 50 × 50 cm), each enclosing one groundnut plant. Four chambers were installed in full sun (FS), at least 20 m from trees, and four under F. albida canopy shade (Sh). The chambers were transparent, custom-built (Duthoit et al., 2020), and installed on metal bases embedded 10 cm into the soil one month prior to measurements.
During the rainy season (June–November), groundnut coexisted briefly with spontaneous weeds until weeding (mid-July), after which chambers contained only groundnut. Post-harvest (early November), chambers remained bare while surrounding plots experienced weed regrowth.
CO2 concentrations were measured at 1 Hz using a Picarro G2508 gas analyser (Picarro Inc., Santa Clara, CA, USA) (Fleck et al., 2013; Reum et al., 2019; Valujeva et al., 2022). A fully automated system was built for sequential half-hour flux measurements alternating FS and Sh chambers (Table S2). Measurement duration was 15 min per chamber in the dry season, reduced to 5 min during the rainy season to limit condensation effects.
2.2.2 CO2 flux measurements by Eddy Covariance
The EC system (Li-COR SMARTFLUX®, including a Gill MasterPro 3D sonic anemometer and a LI-7500 RS open path CO2 and H2O gas analyser) was mounted at a height of 20 m on a 30 m mast, above F. albida. It continuously monitored net CO2 exchange from the ecosystem. Raw data were collected at 20 Hz frequency and post-processed from binary files using the advanced mode of the EddyPro® v7.0, with standard corrections and procedures: sonic tilt correction (double rotation), block averaging, covariance maximisation for time lag, and WPL correction (Webb et al., 1980). Quality control followed Foken et al. (2004) and Vickers and Mahrt (1997); random uncertainty was estimated per Finkelstein and Sims (2001). Spectral corrections were applied according to Moncrieff et al. (1997, 2004). Footprints were computed according to Kormann and Meixner (2001), using the FREddyPro R package (Xenakis, 2016), indicating a ∼ 1 ha source area covering the entire field. Gap-filling and flux partitioning were conducted using ReddyProc (Wutzler et al., 2018), applying the daytime partitioning approach of Lasslop et al. (2010).
2.2.3 Ancillary measurements
Environmental and vegetation variables were monitored continuously throughout the study. Global radiation (Rg) was estimated from photosynthetically active radiation (PAR) using a Skye sensor (averaged over 30 min intervals). The normalised difference vegetation index (NDVI) of crops under full sun was recorded semi-hourly by a calibrated downward-facing sensor installed at 20 m height (Pontailler et al., 2003), processed following Soudani et al. (2012), and used to estimate the leaf area index (LAI) time series for groundnut, weeds, and cowpea based on end-of-season field LAI measurements in six 15 m2 plots (as in Roupsard et al., 2020).
Rainfall was recorded by an automatic weather station (CR1000 with TE525MM rain gauge, Campbell Scientific), and soil volumetric water content (VWC) and temperature (Tsoil, at 6 cm depth) were monitored using TOMST® TMS-4 sensors, benchmarked prior to field deployment inside and outside the chambers (Wild et al., 2019). Air temperature (Tair) was recorded inside each chamber at 15 cm above ground, all at 5 min intervals. These measurements contribute to the SoilTemp global database (Lembrechts et al., 2020, 2022).
Groundnut development was tracked weekly by counting leaves in each chamber. Total groundnut LAI (LAIch) was then derived from average single-leaf area and chamber surface.
A detailed description of the data used in this study is provided in Supplement (Table S1).
2.3 Data processing
2.3.1 Flux calculation
Net CO2 fluxes (FCO2ch, in µmol CO2 m−2 s−1) from the chambers were calculated from the linear change in CO2 concentration over time (ΔC Δt; Figs. S1 and S2) using the Eq. (1).
where P is atmospheric pressure (101 325 N m−2), R is the ideal gas constant (8.31 N m mol−1 K−1), Tk is air temperature inside the chamber in Kelvin, V (0.125 m3) is the total system volume (chamber, tubing, analyser cavity, pump, and water trap), and A (0.25 m2) is the chamber footprint. The slope was obtained via linear regression (Duthoit et al., 2020).
Mean FCO2ch values were computed separately for the four replicate chambers in full sun (FS) and under F. albida shade (Sh). By convention, negative values indicate net CO2 uptake (photosynthesis), and positive values indicate net CO2 release (respiration).
2.3.2 Quality control of chamber-based CO2 flux measurements
The quality of chamber-based CO2 flux measurements was assessed using a threshold of R2≥0.8 of the linear increase in CO2 concentration during chamber closure. The minimum detectable flux (MDF) was then calculated following Nickerson (2016) (Eq. 2). The MDF defines the flux detection threshold, below which data are considered unreliable due to instrument sensitivity and sampling constraints (Zaman et al., 2021). In this study, the MDF was ± 0.0004 µmol CO2 m−2 s−1 .
where Aa is the analytical precision of the Picarro analyser (0.6 ppm; Picarro Inc., 2015), tc the closure time (s), ps the sampling frequency (1 Hz), V the chamber volume, P the atmospheric pressure (101 325 N m−2), A the chamber footprint, R the gas constant (8.3 N m mol−1 K−1), and T the air temperature in Kelvin.
Following this quality control, fluxes were partitioned (Sect. 2.3.3) and gap-filled (Sect. 2.3.4).
2.3.3 Partitioning of chamber-based CO2 fluxes
The net CO2 fluxes (FCO2ch), averaged from four chambers per environment (FS and Sh), were partitioned into two components according to Eq. (3) (Reichstein et al., 2005).
Rch includes heterotrophic respiration (Rh) from soil and other autotrophic respiration (Ra) from groundnut plants and roots of F. albida (Ra Groundnut + Ra tree below-ground). Rch is always positive (Rch > 0). GPPch (Gross Primary Productivity) represents the photosynthetic CO2 uptake by the groundnut plants and is negative during the day (GPPch < 0), and zero at night, when FCO2ch = Rch.
Half-hourly FCO2ch fluxes were partitioned as follows: (1) an Arrhenius-type function (Lloyd and Taylor, 1994) was fitted between nocturnal Rch and Tsoil during nighttime periods, for each 5 d throughout the time series (Eq. 4). This empirical formulation is based on several key assumptions. First, the relationship between nocturnal respiration and soil temperature is assumed to follow an exponential response, reflecting the temperature sensitivity of respiration processes. Second, the model assumes temporal stability of the respiration–temperature relationship between night and day, allowing diurnal respiration to be extrapolated from fitted parameters in Eq. (4) and daytime Tsoil. Third, we assumed that no abrupt changes in substrate availability or soil moisture occur between day and night – conditions that could otherwise disrupt the temperature–respiration relationship. These assumptions are widely applied in CO2 flux partitioning approaches (Reichstein et al., 2005; Lasslop et al., 2010). (2) Diurnal Rch was estimated by applying the Lloyd and Taylor function, previously calibrated on nocturnal data, to the corresponding daytime Tsoil measurements for each 5 d interval. (3) GPPch was subsequently derived as the residual component of the net CO2 flux during the day, according to:
where Rref (µmol CO2 m−2 s−1) is a fitted parameter representing the base respiration at the reference temperature [Tref (K), (set at 288.15 K)]. E0 (K) is the temperature sensitivity (set at 250 K), Tsoil (K) the soil temperature (K), and T0 (K) is kept constant at 231.13 K, according to Lloyd and Taylor (1994).
where diurnal FCO2ch and diurnal Rch represent the daytime net CO2 fluxes and respiration in µmol CO2 m−2 s−1 , respectively.
2.3.4 Gap-filling procedure
Missing Rch data were gap-filled using the model derived from Eq. (4) (Lloyd and Taylor, 1994). Prior to gap-filling GPPch, raw data were standardised by LAI to reduce variability between chambers due to differences in leaf surface area (Eq. 6). A light-response model was then fitted to the standardised GPPch data, every 5 d period, to gap-fill missing values. The model is based on a rectangular hyperbolic function that describes the relationship between photosynthetic CO2 uptake and incoming global radiation (Rg) (Eq. 7). It corresponds to a Michaelis–Menten-type light-response curve, commonly used in ecosystem carbon exchange studies (Falge et al., 2001; Lasslop et al., 2010).
where GPPch.stand (µmol CO2 m−2 s−1) is the standardised GPPch. LAIch and LAI.field (m2 leaves m−2 soil) represent the groundnut LAI inside the chambers and the groundnut + weeds + cowpea LAI for the whole field, respectively.
where α (µmol CO2 J−1) represents the light use efficiency of the groundnut plants inside the chambers, and refers to the initial slope of the light-response curve, β (µmol CO2 m−2 s−1) is the maximum CO2 uptake rate by the groundnut plants at light saturation, and Rg the global radiation (W m−2).
2.3.5 Comparing chamber-based (Ch) and Eddy Covariance (EC) methods
Chamber measurements were upscaled to field-level CO2 fluxes and compared with EC-derived fluxes. Before comparison, a correction was applied (Eq. 6) to account for differences in LAI between chambers (LAIch) and the field (LAI.field), due to the presence of cowpea and weeds in the field but not in the weeded chambers.
Upscaling considered tree cover, with FS and Sh chamber fluxes weighted at 90 % and 10 %, respectively. Rch.stand and GPPch.stand, representing chamber-based respiration and photosynthesis at field scale. These fluxes were compared, on a half-hourly basis, to EC-derived Reco.EC and GPP.EC (Table S4). The November–December transition period was excluded due to weed-driven uncertainties after groundnut harvest.
During the rainy season (F. albida leafless), GPP.EC represented ground vegetation (groundnut, cowpea, weeds), while Reco.EC included autotrophic respiration from all vegetation (including trees), and heterotrophic respiration (Reco.EC = Ra tree below-ground + Ra tree above-ground + Ra groundnut + Ra cowpea + Ra weeds + Rh). Rch.stand could not be fully upscaled to the field due to uncertainty in its partitioning between Ra and Rh. Rch.stand accounted only for Ra tree below-ground, Ra groundnut, and Rh.
In the dry season (leafy trees, bare soil), GPP.EC reflected tree photosynthesis only (GPP tree), while GPPch.stand was nil. Reco.EC included Ra tree (above- and below-ground) and Rh. Rch.stand, measured on bare soil, represented only Ra tree below-ground + Rh.
2.3.6 Contribution of trees to full ecosystem respiration and photosynthesis
During the dry season, when the trees (F. albida) maintained their foliage, a comparison between chamber and EC measurements allowed for the estimation of the contribution of the above-ground tree compartments to total ecosystem respiration (Table S4). Based on this estimate, total tree respiration (Ra tree) was then calculated under the assumption that the tree root systems (Ra tree below-ground) represent of the above-ground biomass (Jackson et al., 1996).
Given the GPP measured during the dry season was equivalent to GPP of trees (GPP trees) from EC measurements, the carbon use efficiency of the trees (CUE tree) was then calculated (Table S4). The resulting CUE value was assessed to determine whether it approximated the typical value of 0.5, which is often used as a default in ecosystem models (Zhou et al., 2019, 2020).
2.3.7 Net annual vertical C balance at the ASPS scale
The net C balance of CO2 fluxes in a yearly basis was estimated for chambers and EC measurements in Mg C-CO2 ha−1. The chambers CO2 flux balances were obtained by calculating the annual sum of the net CO2 flux measurements and then weighting with the tree cover rate (10 % for the Sh, 90 % for the FS). These annual balances for the field are considered apparent representing vertical CO2 exchanges only, as they do not account for the biomass exported from the field after the harvest, the decomposition of which therefore escaped both the chambers and the EC. Additionally, the inputs and the outputs of faecal matter resulting from livestock wandering during the dry season were not quantified and are therefore neglected. The objective here is to compare two approaches at different scales using vertical net C balances, rather than to provide an absolute C budget which would also include horizontal transfers of carbon.
2.4 Statistical analyses
Statistical analyses were performed using the R software (R Core Team, 2023). To compare the mean values of climatic parameters between the FS and Sh situations, a non-parametric Mann-Whitney test was used when both the normality (shapiro.test) and the homogeneity of the variance (Levene Test, R package “Car”; Fox et al., 2023) were not confirmed. This approach was similarly applied to compare the seasonal dynamics of CO2 fluxes between FS and Sh, as well as between the chamber-based and Eddy Covariance (EC) methods. Means and standard deviations were computed using the “skim” function from the R package “skimr” (Waring et al., 2022).
Respiration (Rch) (Eq. 4) and GPP (GPPch) models (Eq. 7) were fitted using non-linear least squares regression, implemented in the library in R “nls.multstart” (Padfield et al., 2025). For the GPPch model, parameters α and β with non-significant p-values were removed, and then the remaining values were interpolated and smoothed using a “spline” function from the “zoo” library in R (Zeileis et al., 2024). Ordinary least-square linear regressions were fitted between the measured and the modeled values derived from. Model performance of Eqs. (4) and (7) was evaluated by fitting ordinary least-square linear regressions between the measured and the modeled values using R2, root mean square error (RMSE), and the bias metrics. Given that the primary objective of these equations was to accurately reproduce the seasonal dynamics of the CO2 fluxes to fill gaps in data, particular emphasis was placed on R2, with a higher value reflecting a better fit of the model to the measurements.
Correlation analysis was conducted between chamber CO2 fluxes (FCO2ch, Rch, GPPch) and soil temperature (Tsoil, °C), air temperature (Tair, °C), VWC, the leaf area index of groundnut plants in the chambers (LAIch), and the fitted parameters for respiration – Rref – and photosynthesis – α and β. This analysis was performed using the “cor.test” function from the “stats” package in R (Lüdecke et al., 2021), applying the Spearman method.
The threshold of the daily mean soil temperature (Tsoil, °C) at which the cumulative daily respiration (Rch, g C-CO2 m−2 d−1) began to decline was determined using segmented regression from the R package “segmented” (Muggeo, 2003). The associated uncertainty (standard error) of this estimate was evaluated through a bootstrap procedure.
The standard error of the total annual flux was estimated using the error propagation method. This calculation considered the mean standard deviation of daily fluxes (g C–CO2 d−1) and the effective number of measurement days (365). For each FS and Sh condition, the mean daily standard deviation was multiplied by the square root of 365 to obtain the annual standard error. The resulting values were then weighted by 90 % for FS and 10 % for Sh to derive the overall standard error of the annual flux sum, which was subsequently converted to Mg C–CO2 ha−1.
3.1 Microclimatic conditions
During the experiment, the cumulative rainfall was 550 mm, which was representative of the interannual average. Precipitations were lowest in July and highest between August and September, a period that typically corresponds to the peak of the rainy season (Fig. 2a). Global radiation ranged between 5.8 and 32.4 MJ m−2 d−1 (data not shown). The daily mean VWC in the chambers showed significant variation, ranging from 1 % at the end of the dry season to a maximum of 30 % during the rainy season (Fig. 2a). While VWC was similar during the rainy season, it remained consistently higher in FS than in Sh throughout the dry season (p < 0.05), which was unexpected. However, it should be noted that the last rain of October 2021 recharged the FS chambers more effectively, likely due to foliage rainfall interception by F. albida which had just put on leaves at that time, potentially explaining this discrepancy in VWC.
Within the chamber, the daily mean Tsoil ranged from 26 °C in April to 37.5 °C at the end of the dry season (Fig. 2b), while Tair varied between 23.7 °C and 35.5 °C (Fig. 2c). However, during instantaneous daily peaks, Tsoil could exceed 45 °C in May (data not shown). As expected, both daily mean Tsoil and Tair were significantly higher in FS compared to Sh situations (p < 0.05), with Tsoil and Tair averaging respectively 1 and 0.5 °C lower under the tree canopy.
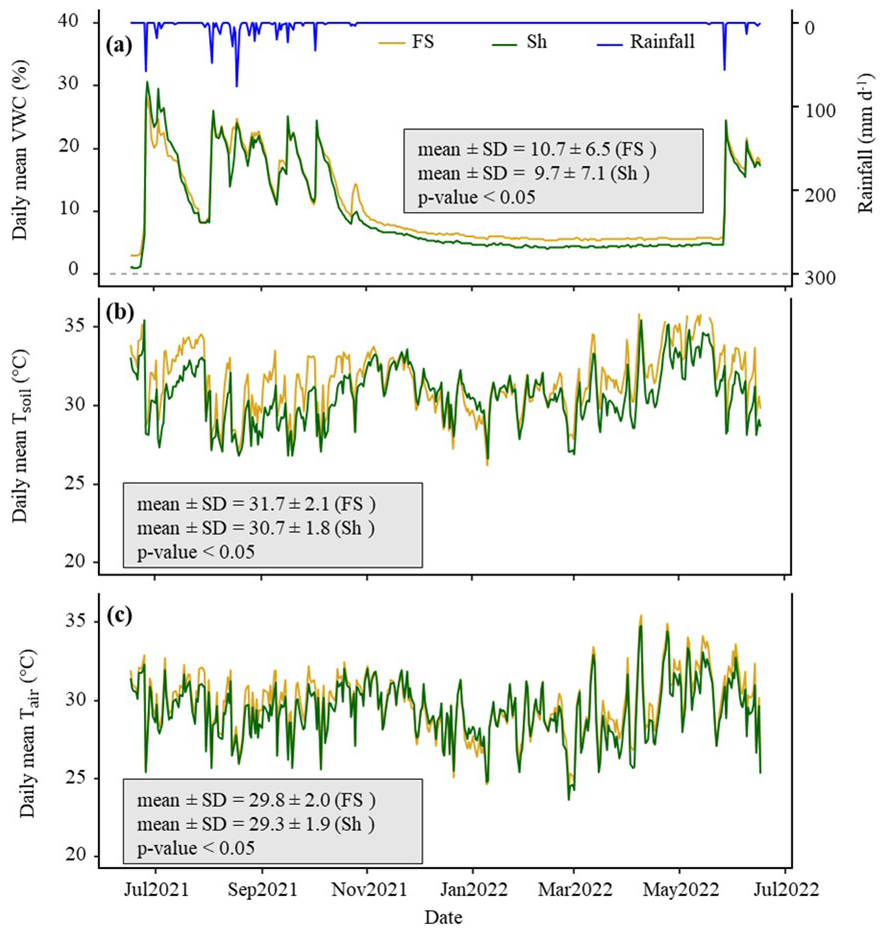
Figure 2One-year time series of daily average microclimatic parameters measured inside the chambers. (a) Volumetric soil water content (VWC) at a depth of 6 cm ( %). (b) Soil temperature (Tsoil) at a depth of 6 cm (°C), (c) air temperature (Tair) at a height of 15 cm (°C). The blue line depicts the daily rainfall (mm d−1) throughout the year. FS: Full sun chambers; Sh: Shaded chambers. Mean and SD represent respectively the mean value and the standard deviation. The p-value indicates the probability associated with the statistical test, assessing the differences in means between FS and Sh with the significance level α set to 0.05.
3.2 Modeling the chamber-based total respiration (Rch) and photosynthesis (GPPch)
3.2.1 Dynamics of reference respiration, light use efficiency, and maximum CO2 uptake rate at light saturation (Rref, α, and β)
The reference respiration (Rref) showed comparable seasonal dynamics both at a distance from the trees (FS) and under the tree canopies (Sh) (Fig. S4). In both situations, Rref showed strong variability during the rainy season, peaking in September 2021 at 2.4 µmol CO2 m−2 s−1 for FS and 2.9 µmol CO2 m−2 s−1 for Sh (Table S3). In contrast, during the dry season – from November 3, 2021 (after harvest) until the onset of the following rainy season (June 2022) – Rref values dropped both for FS and Sh, averaging 0.3 ± 0.5 µmol CO2 m−2 s−1 for FS and 0.5 ± 0.6 µmol CO2 m−2 s−1 for Sh. This represents a reduction by a factor of 8 for FS and 6 for Sh compared to the rainy season. The mean annual Rref values were significantly higher under Sh than in FS, with value approximately 1.5 times greater (Table S3).
Regarding GPP in chambers, the light use efficiency (α) and the maximum CO2 uptake by groundnut plants in the chambers (β), also reached their maximum during the peak of the rainy season (Fig. S5a and b). The maximum value of α reached 0.2 µmol CO2 J−1 in FS and 0.3 µmol CO2 J−1 in Sh (Table S3). Similarly, the maximum values of optimum CO2 uptake rate at light saturation (β) were 40.2 µmol CO2 m−2 s−1 for FS and 42.8 µmol CO2 m−2 s−1 for Sh (Table S3). In the dry season, when photosynthetic activity ceased in the chambers, both α and β were assumed to be nil (Fig. S5a and b). On average, α and β were significantly higher in Sh than in FS, by a factor of 1.7 and 1.2, respectively (Table S3). We noted that the decline in photosynthetic activity of the groundnut crop occurred earlier and rapidly at a distance from the trees (FS), as reflected by the sharply observed recession of α and β in FS.
3.2.2 Dynamics of nocturnal respiration in chambers
The averaged nocturnal respiration (nocturnal Rch) calculated from the measurements across each treatment (FS and Sh), showed similar seasonal patterns (Fig. 3a and c). Following the first rains, Rch values increased dramatically, with a nocturnal “Birch effect” – a sudden pulse of CO2 release following soil rewetting – observed to be more pronounced under Sh compared to FS, approximately by a factor of 2. At the peak of the rainy season (September), the maximum nocturnal Rch values reached approximately 6.0 µmol CO2 m−2 s−1 in FS and 9.0 µmol CO2 m−2 s−1 in Sh (Fig. 3a and c). Thereafter, nocturnal Rch declined well before the groundnut harvest along with the rainfall spacing and the groundnut crop senescence (data not shown). During the dry season nocturnal Rch continued to decrease, with maximum values around 1.0 µmol CO2 m−2 s−1 in FS and 2.0 µmol CO2 m−2 s−1 in Sh (Fig. 3a and c).
The modeled nocturnal Rch values closely matched the measured nocturnal Rch values (mean across four chambers per treatment), as indicated by the model performance metrics (R2 = 0.9, with bias and RMSE values of 0.3 and 0.5 µmol CO2 m−2 s−1, respectively, for FS; R2 = 0.7, with bias and RMSE values of 0.4 and 0.6 µmol CO2 m−2 s−1, respectively, for Sh) (Fig. 3b and d). Similarly, the daily mean modeled values also fitted well with the measured values, with FS showing (mean ± standard deviation) 0.9 ± 0.9 µmol CO2 m−2 s−1 (modeled) and 1.2 ± 1.2 µmol CO2 m−2 s−1 (measured), while Sh recorded 1.4 ± 0.9 µmol CO2 m−2 s−1 (modeled) and 1.5 ± 1.2 µmol CO2 m−2 s−1 (measured). Given the close match between the measured and modeled values, the fitted model parameters were used subsequently to fill data gaps and estimate diurnal Rch values, as presented in Fig. 4a and c.
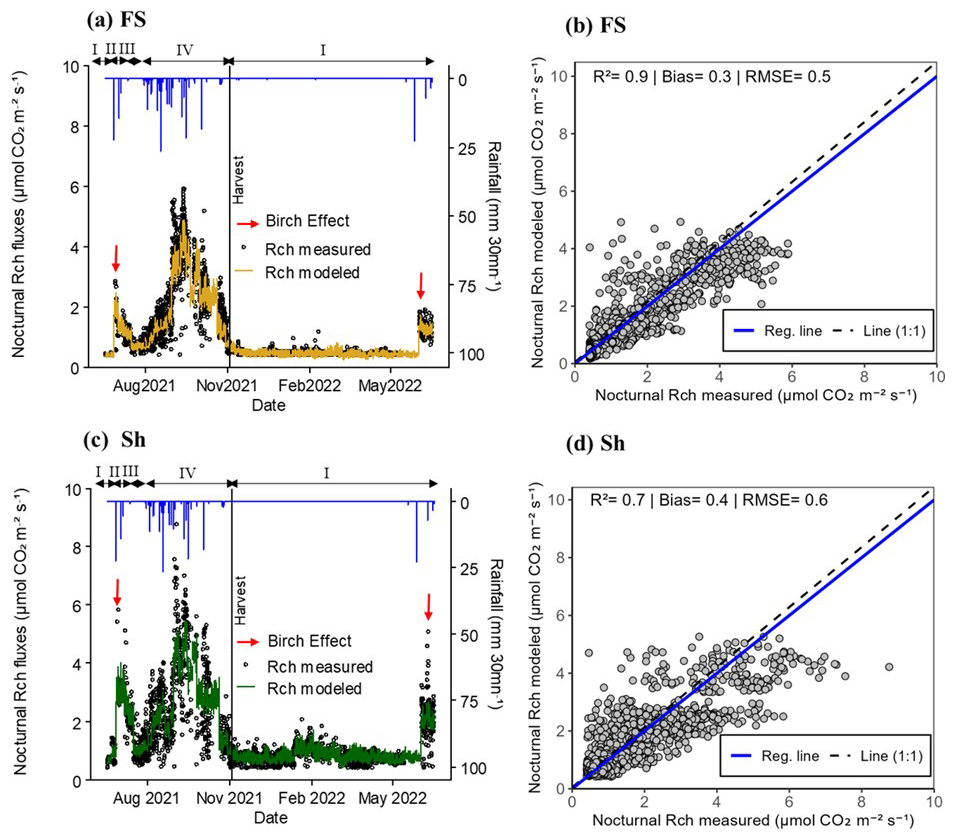
Figure 3Dynamics of instantaneous nocturnal CO2 fluxes in chambers in Full sun (FS; a and b) and Shaded (Sh; c and d) environments (data filtered based on R2 of the CO2 variation over the time of chamber closure and Minimum Detectable Flux, Eq. 2). (a) and (c): measured nocturnal respiration in chambers (Rch: black dots; average of measurements in 4 chambers per location) vs. modeled (coloured line). The vertical black line indicates the harvest date of groundnuts inside the chambers. The red arrows indicate the “Birch” effect and the blue line represents the rainfall (mm 30 mn−1). Roman numerals (above the black arrows) refer to vegetation conditions prevailing inside the chambers, i.e. (I) bare soil, (II) weeds, (III) weeds + groundnuts, and (IV) groundnuts only. (b) and (d): scatter plot between measured and modeled nocturnal Rch. The solid blue line indicates the regression line and the dashed black one the (1:1) line RMSE and bias are expressed as fluxes (in µmol CO2 m−2 s−1). Each point represents the mean value from 4 chambers within the FS or Sh environments.
3.2.3 Dynamics of daytime fluxes in chambers
The measured GPPch.stand, as well as GPP modeled with Eq. (6), showed similar seasonal dynamics inFS and Sh (Fig. 4a and c). The fluxes peaked during the rainy season (Fig. 4a and c), coinciding with periods of vigorous vegetative growth characterised by a high leaf area index (LAIch) of groundnut plants within the chambers (Fig. S3). The maximum calculated and standardised GPPch values reached −50 µmol CO2 m−2 s−1 for FS and −37 µmol CO2 m−2 s−1 for Sh. As expected, these fluxes were nil during the dry season when the soil was bare (Fig. 4a and c).
The modeled GPPch values closely followed the same trends as the calculated values, although model performance was slightly better for FS (R2 = 0.7 with bias and RMSE values of 4.2 and 6.1 µmol CO2 m−2 s−1, respectively) compared to Sh (R2 = 0.6 with bias and RMSE values of 6.1 and 5.6 µmol CO2 m−2 s−1, respectively) (Fig. 4b and d).
The calculated diurnal respiration values (diurnal Rch calculated) for FS and Sh revealed a “Birch effect” similar to that observed during the night, though slightly more pronounced under Sh by a factor of 1.2. Diurnal Rch values increased significantly during the rainy season, reaching a maximum of 6.0 µmol CO2 m−2 s−1 for both FS and Sh (Fig. 4a and c). In the dry season, on bare soil, these values declined, with maximum respiration reaching only 0.5 µmol CO2 m−2 s−1 for both situations (FS and Sh) (Fig. 4a and c).
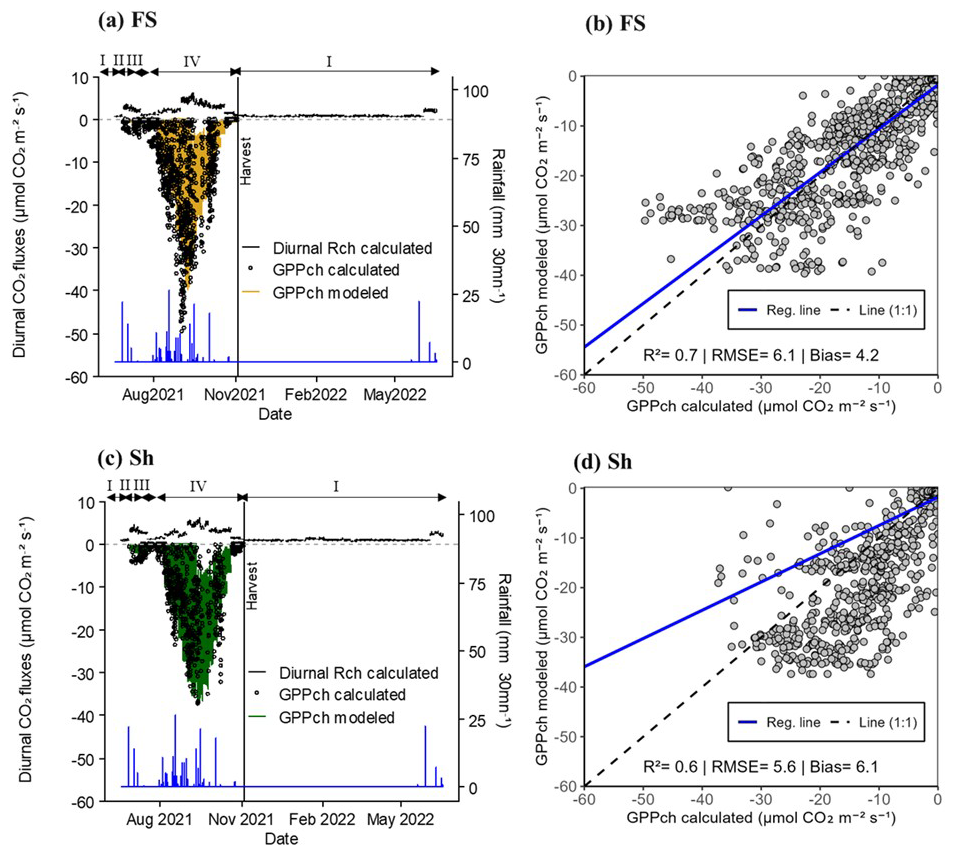
Figure 4Dynamics of instantaneous diurnal CO2 fluxes in chambers in Full sun (FS; a and b) and Shaded (Sh; b and d) environments (filtered based on R2 of the CO2 variation over the time closure in FS and Sh and Minimum Detectable Flux, Eq. 2). (a) and (c): non-gap-filled diurnal Rch calculated (black line, positive values; average of measurements in 4 chambers per location) and GPPch calculated from Eq. (5) then standardised for LAI (black dots, negative values) and modeled (coloured line, negative values). The vertical black line indicates the harvest date of groundnuts inside the chambers and the blue line represents the rainfall (mm 30 mn−1). Roman numerals (above the black arrows) refer to conditions prevailing inside the chambers, i.e., (I) bare soil, (II) weeds, (III) weeds + groundnuts, and (IV) groundnuts. (b) and (d): scatter plot between calculated and modeled GPPch. The solid blue line indicates the regression line and the dashed black one the (1:1) line. RMSE and bias are expressed as fluxes (in µmol CO2 m−2 s−1). Each point represents the mean value from 4 chambers within the FS or Sh environments.
3.3 Dynamics of daily cumulative CO2 fluxes in chambers
The seasonality of daily cumulative of GPPch.stand showed similar dynamics between FS and Sh, with higher variability during the rainy season than during the dry season (Fig. 5). Daily total Rch peaked during the rainy season at 5.1 g C-CO2 m−2 d−1 for FS and 5.4 g C-CO2 m−2 d−1 for Sh, while the maximum GPPch.stand values were comparable at around −15.0 g C-CO2 m−2 d−1 for both FS and Sh (Table 1; Fig. S7a, b, c, and d). In the dry season, Rch decreased (Fig. 5), averaging 0.5 g C-CO2 m−2 d−1 for FS and 1.0 g C-CO2 m−2 d−1 for Sh. GPPch declined well before harvest (senescence) and remained nil during the dry season (Fig. 5). During the rainy season FCO2ch peaked in absolute value at around 11.0 g C-CO2 m−2 d−1 for FS and Sh (Fig. 5) (Table 1; Fig. S7e and f), while FCO2ch values were the same as Rch during the dry season. In absolute terms, the mean Rch and GPPch were significantly higher under Sh as compared to FS, by factors of 1.3 and 1.2, respectively. Conversely, the mean FCO2ch was significantly higher in absolute value under FS (0.4 g C-CO2 m−2 d−1) than under Sh (0.2 g C-CO2 m−2 d−1) (Table 1).
The annual cumulative Rch values were 392.8 g C-CO2 m−2 for FS and 574.5 g C-CO2 m−2 for Sh. The GPPch fluxes reached −539.5 g C-CO2 m−2 for FS and −632.6 g C-CO2 m−2 for Sh. The net annual cumulative C exchange (FCO2ch) was −146.7 g C-CO2 m−2 in FS and −58.1 g C-CO2 m−2 in Sh.
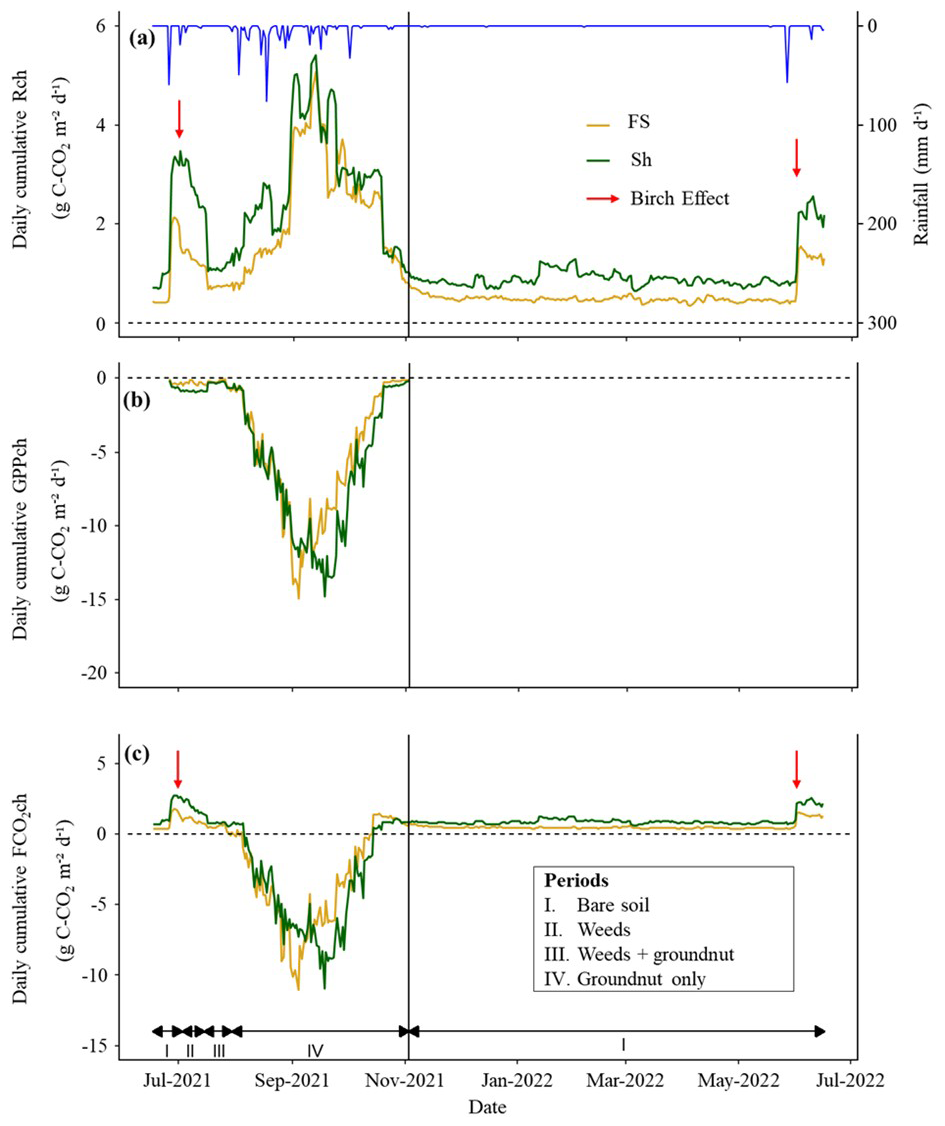
Figure 5Seasonal dynamics of daily gap-filled cumulative fluxes (in g C-CO2 m−2 d−1) in chambers. (a) soil + crop respiration (Rch), (b) photosynthesis (GPPch, standardised for LAI) and (c) net CO2 exchange (FCO2ch). The yellow and green solid lines compare the FS and Sh environments, respectively. The vertical black line indicates the harvest date of groundnuts inside the chambers. The blue line depicts the daily cumulative rainfall (mm d−1) throughout the rainy season, and the red arrow indicates the “Birch” effect. Roman numerals (above the black arrows) in (a) and (c) refer to the prevailing conditions inside the chambers: (I) bare soil, (II) weeds, (III) weeds + groundnuts, (IV) groundnuts.
Table 1Comparison of daily cumulative and gap-filled chamber CO2 fluxes (Rch, GPPch standardised for LAI, and FCO2ch in g C-CO2 m2 in the FS and Sh condition.
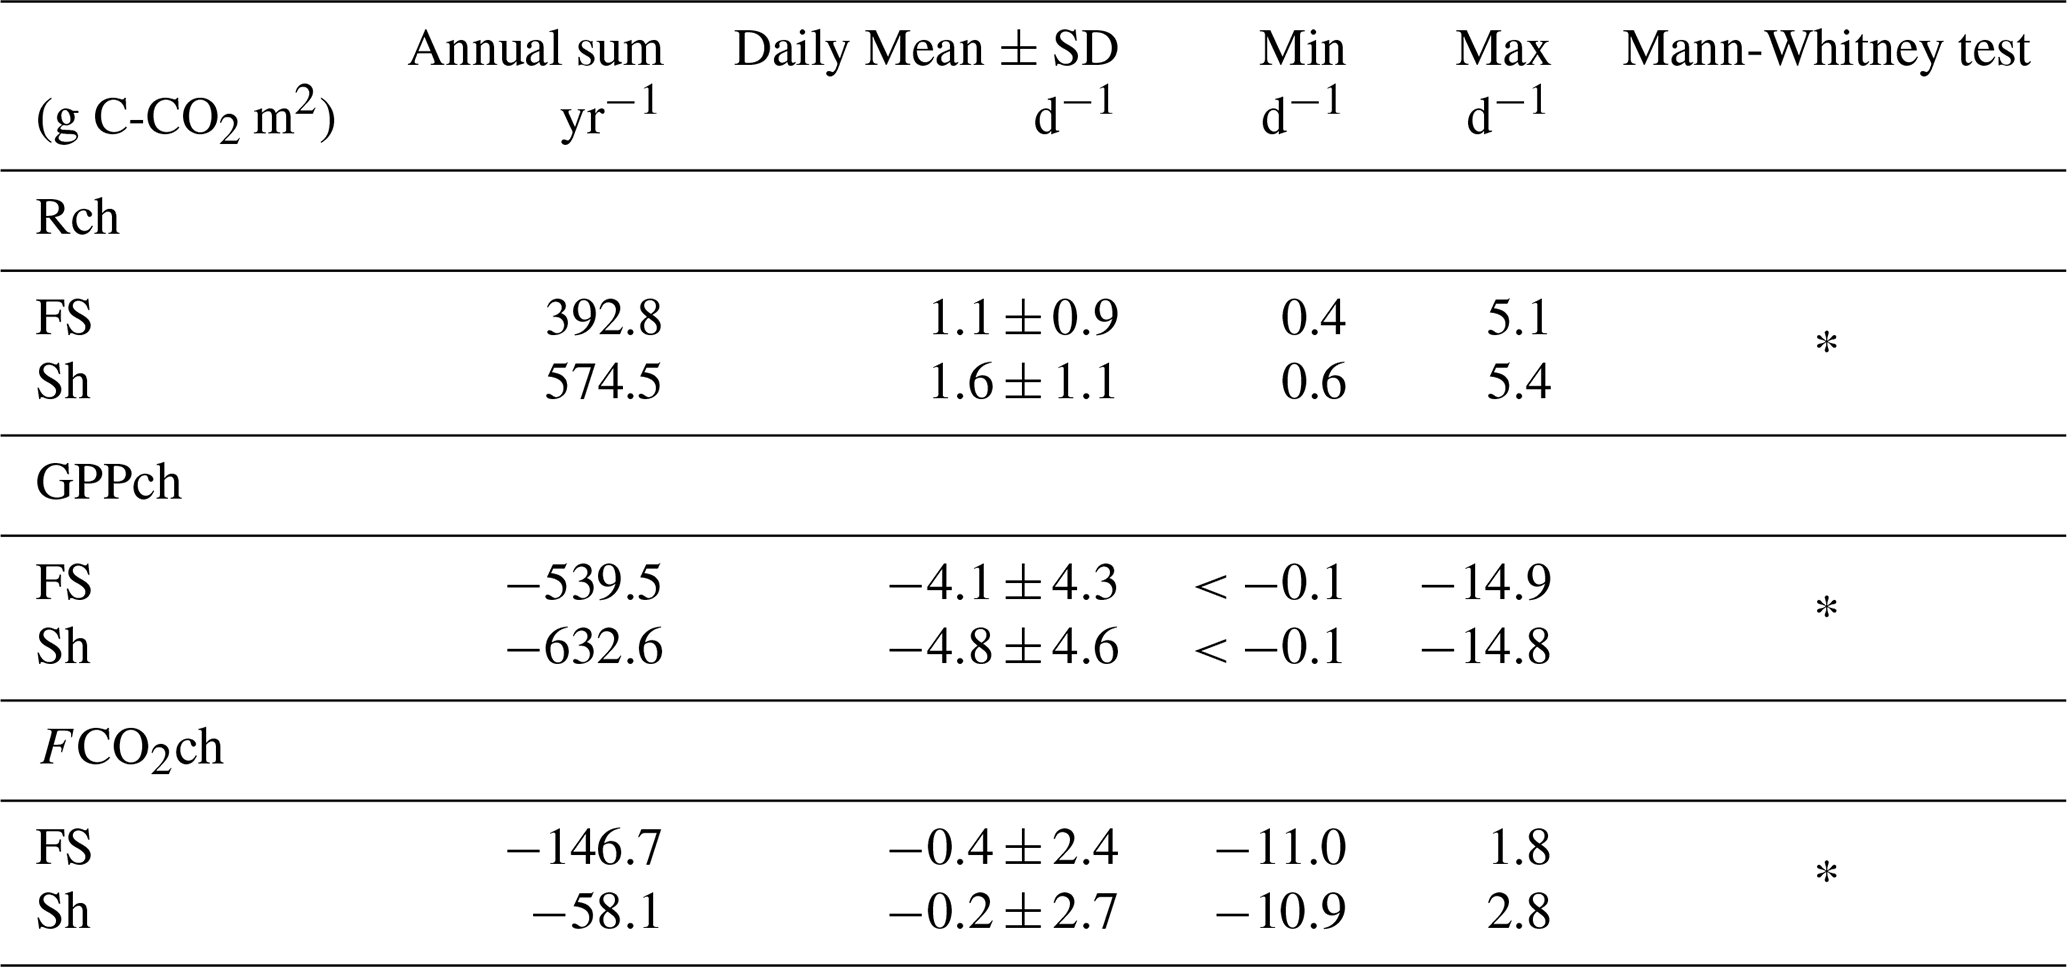
Annual sum corresponds to the annual cumulative fluxes (g C-CO2 m−2 yr−1). Mean, SD, Min, and Max represent respectively the mean, standard deviation, minimum, and maximum values at the daily scale (g C-CO2 m−2 d−1). Asterisks (*) indicate the p-values from the Mann-Whitney test, used to assess differences in mean between FS and Sh (p< 0.05). Positive values indicate CO2 emissions, while negative values represent CO2 uptake.
3.4 Drivers of daily respiration and photosynthesis in chambers
The chamber-based daily cumulative respiration (Rch) and GPPch showed significant and positive correlations with the leaf area index (LAIch), both at a distance from the trees (FS) and under the trees (Sh) (Table 2). The influence of LAIch on GPPch was stronger (r = 0.86 for FS and Sh) than its influence on Rch (r = 0.60 for FS; r = 0.69 for Sh). Soil VWC was also positively correlated with Rch and GPPch, both in FS and Sh. However, the influence of soil VWC on Rch was stronger under Sh compared to FS, while its influence on GPPch was similar in both situations (FS and Sh). Soil temperature showed weak negative correlations with Rch (in FS and Sh) and with GPPch (only in Sh). Finally, no significant correlations were found between Tair, and any of the CO2 fluxes (Table 2).
Table 2Spearman correlation matrix based on daily cumulative and gap-filled CO2 fluxes from full year chamber measurements (g C-CO2 m2 d1) with microclimatic parameters.
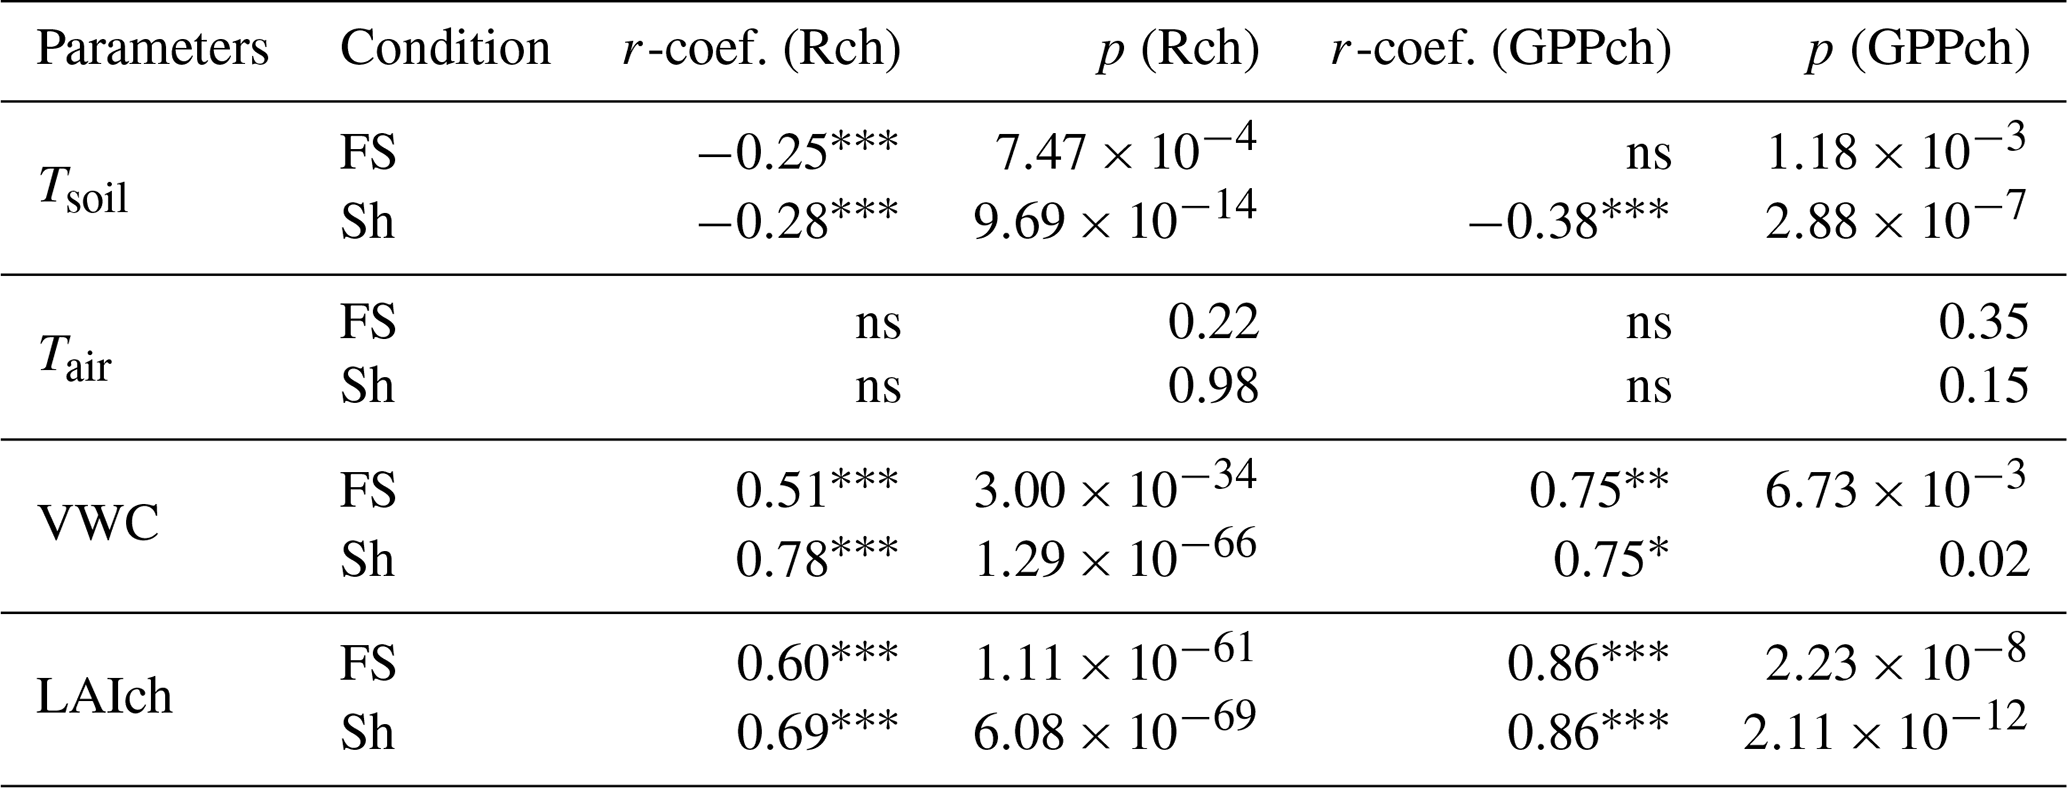
Spearman correlation coefficients (r-coef.) between daily cumulative and gap-filled CO2 flux components (Rch and GPPch, with GPPch in absolute terms) and daily mean microclimatic parameters in full sun (FS) and shaded chambers (Sh). Tsoil (°C) is the daily mean soil temperature at 6 cm depth, Tair (°C) the daily mean air temperature at 15 cm height, VWC ( %) the daily mean volumetric water content (VWC, %), and LAIch (m2 leaf m2 soil) the chamber leaf area index value for a given day. Letter p represents the p-value and significance levels are indicated by ( p<0.001; p<0.01; * p<0.05); ns p>0.05.
3.5 Comparison of respiration and GPP measurements between chambers (Ch) and Eddy Covariance (EC) methods
The chamber-based daily total CO2 fluxes, gap-filled and weighted according tree cover were compared with the fluxes obtained using the EC method (Fig. 6).
During the rainy season, both total respiration and GPP showed comparable dynamics between the two methods, with synchronised peaks and higher variability compared to the dry season (Fig. 6). The maximum value of Reco.EC, peaked at 13.5 g C-CO2 m−2 d−1 (Table 3). The initial value of Rch.stand was comparable to Reco.EC but peaked only at 5.1 g C-CO2 m−2 d−1 (Table 3), meaning
a third of the peak of Reco.EC. The maximum GPP, was −14.3 g C-CO2 and −14.6 g C-CO2 m−2 d−1 for GPP.EC and GPPch.stand, respectively (Table 3). This indicates that the LAI-based standardisation and upscaling approach were realistic, at least up to the peak of groundnut growth.
On average, Reco.EC was significantly higher than Rch.stand, by a factor of 2.3. GPP.EC was also significantly higher than GPPch.stand, but only by a factor of 1.2 (Table 3).
During the dry season, Reco.EC and Rch.stand gradually decreased. The values for Reco.EC remained higher than for Rch.stand, which was fairly consistent with the contribution of the Ra tree above-ground compartment, even if this difference seemed to disappear at the end of the dry season (Fig. 6). The measured “Birch effect” was highest for Rch.stand in 2021, but was the opposite in 2022 due to a system failure at the beginning of the rainy season. The maximum value of GPP.EC reached −2.4 g C-CO2 m−2 d−1 when the trees were at their maximum of foliage, after harvest and while weeds were still present in the field. However, after the harvest, chamber photosynthesis (GPPch.stand) was nil (Table 3).
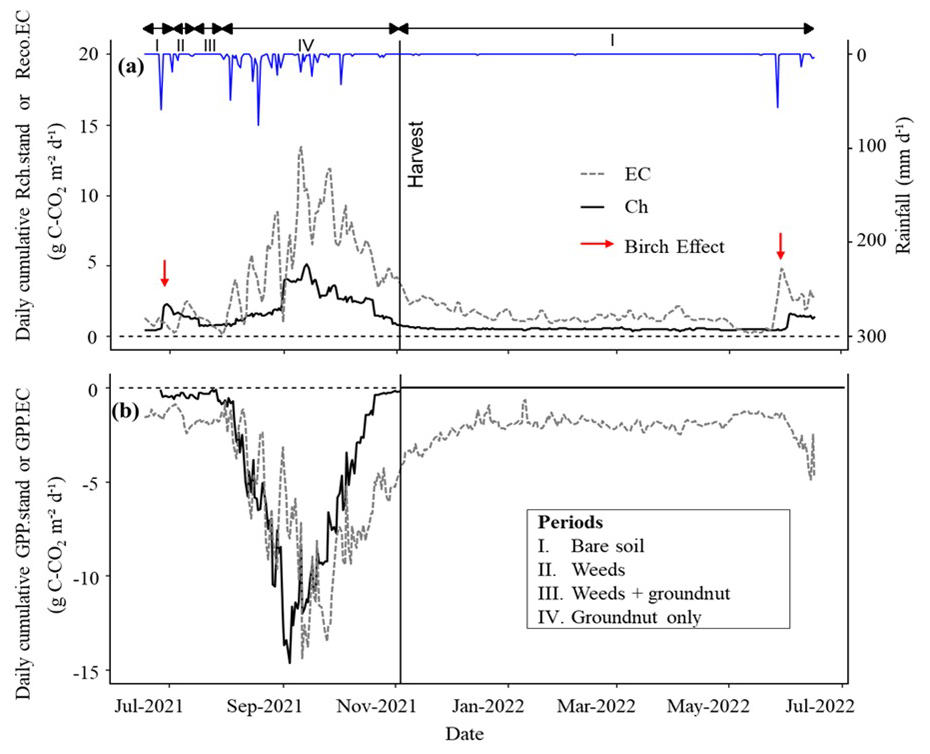
Figure 6Comparing the seasonal dynamics of CO2 fluxes between Eddy Covariance (EC) measurements and upscaled chamber measurements (ch.stand). (a) represent the seasonal dynamics of soil + crop respiration (Rch.stand) and ecosystem respiration (Reco.EC) and (b) photosynthesis (GPP.stand and GPP.EC). The black and dashed grey lines show Ch and EC seasonal dynamics, respectively. The vertical black line indicates the harvest date of groundnuts inside the chambers. The blue line depicts the daily cumulative rainfall (mm d−1), and the red arrow indicates the “Birch” effect. Roman numerals (above the black arrows) refer to conditions prevailing inside the chambers: (I) bare soil, (II) weeds, (III) weeds + groundnuts, (IV) groundnuts.
3.6 The contribution of F. albida to Reco and GPP
During the dry season, the cumulative contribution of F. albida to ecosystem respiration (Ra tree) was 139.6 g C-CO2 m−2. This represent 14 % of the total annual cumulative Reco, which was estimated at 1000.0 g C-CO2 m−2 (Table S4). The contribution of trees (GPP tree) to total annual GPP in absolute term was 270.2 g C-CO2 m−2, equivalent to ∼ 23 % of the total annual cumulative GPP of the ecosystem measured by EC (1180.0 g C-CO2 m−2) (Table S4).
The ratio between these two components (Ra tree/GPP tree) in absolute terms was 0.52, reflecting a carbon use efficiency (CUE) of 0.48 (Table S4).
3.7 Annual vertical CO2 balances at the field-scale
The upscaled chamber-based annual cumulative total respiration flux (Rch.stand) was estimated to be 4.1 ± 0.18 Mg C-CO2 ha−1 (Table 4). In comparison, the annual Reco.EC was 10.0±0.49 Mg C-CO2 ha−1 (Table 4), more than two times larger than Rch.stand.
The upscaled GPPch.stand reached an annual cumulative value of −5.5 ± 0.83 Mg C-CO2 ha−1, whereas the annual cumulative GPP.EC was −11.8 ± 0.53 Mg C-CO2 ha−1 (Table 4).
The net annual vertical C balance, based on both methods, was estimated at −1.4 ± 0.46 Mg C-CO2 ha−1 for chambers (FCO2ch.stand) and −1.8 ± 0.17 Mg C-CO2 ha−1 for Eddy Covariance (NEE.EC) (Table 4).
4.1 Soil respiration modeling and limitations
In this study the Lloyd and Taylor (1994) model, based on a modified Arrhenius-type formulation, was used to model nocturnal soil respiration fluxes for estimating daytime respiration. Unlike the classical Arrhenius equation, this model includes the (Tsoil−T0) term in the denominator of the exponential expression (Eq. 4), which inherently limits the effects of high temperatures by progressively reducing the temperature sensitivity of soil respiration as temperatures rise above a given threshold. This structural feature produces a flattening of the respiration–temperature relationship at elevated temperatures, thereby preventing the overestimations (Lloyd and Taylor, 1994).
The Lloyd and Taylor model has successfully been widely applied, primarily in boreal and temperate ecosystems (Lasslop et al., 2010; Reichstein et al., 2003), and relies on the assumption of comparable thermal conditions between daytime and nighttime periods (Juszczak et al., 2012). In our study, instantaneous soil temperatures ranged from 20.7 to 45.8 °C during the day and from 22.1 to 45.0 °C at night, indicating largely overlapping thermal ranges between the two periods. Model parameters were recalibrated using five-day fixed windows, which provided sufficient temporal resolution while capturing seasonal dynamics of soil respiration.
This study represents one of the first applications of the Lloyd and Taylor model in a Sahelian semi-arid context. While Arrhenius based models are known to potentially overestimate fluxes under extreme temperatures due to physiological limitations, over the range of temperatures observed in this study, the modeled soil respiration was not overestimated (Fig. S6a and b). Thus, the model used in this study appears to provide a realistic representation of soil respiration under local conditions. However, this conclusion is site-specific and should not be interpreted as a general validation of temperature-based models across all semi-arid environments. Such models should be systematically validated with respect to temperature to ensure their reliability.
4.2 Seasonality and drivers of chamber-based CO2 fluxes
In our agroforestry context, seasonal variability in CO2 fluxes closely followed rainfall dynamics, peaking during the wet season and declining sharply in the dry season, consistent with soil moisture depletion and crop senescence. This pattern is typical of semi-arid ecosystems (Ago et al., 2016a; Brümmer et al., 2008; Guillen-Cruz et al., 2023; Macharia et al., 2020; Mosongo et al., 2022; Wieckowski et al., 2024).
Respiration and photosynthesis were primarily driven by soil moisture and LAI, reflecting the system's sensitivity to water availability and crop dynamics. Soil moisture enhanced both processes by stimulating microbial activity and supporting plant growth (Borken et al., 2002; Conant et al., 2004; Merbold et al., 2009; Yu et al., 2020; Zhao et al., 2016). The stronger correlation between soil moisture and respiration under F. albida canopy (Sh: r = 0.78) compared to full sun (FS: r = 0.51) suggests greater microbial sensitivity to moisture beneath trees. This likely reflects enhanced substrate availability, resulting in stronger post-rainfall respiration pulses (Meisner et al., 2015) and supporting the “fertile island” effect, where trees improve local soil conditions (Eldridge et al., 2024). Photosynthetic capacity also responded to soil moisture, as shown by positive correlations with LAI and key physiological traits such as light use efficiency (α) and maximum CO2 uptake rate (β) (Gonsamo et al., 2019; Qiu et al., 2023; Zhang et al., 2024b).
In contrast, the influence of soil temperature (Tsoil) on respiration was weakly negative in both FS and Sh, indicating a thermal threshold beyond which respiration declined – estimated at 32 ± 1.5 °C in FS and 29.5 ± 1.9 °C in Sh (Fig. S9a and b), similar to findings in Eastern Ghana (Owusu-Prempeh et al., 2024). This inhibition likely results from decreased enzymatic and microbial activity under combined heat and water stress (Liu et al., 2018; Richardson et al., 2012). In semi-arid regions, soil respiration often becomes decoupled from temperature due to seasonal moisture constraints (Jia et al., 2020; Tucker and Reed, 2016; Warren, 2014), with microbial activity limited during dry periods despite favourable temperatures. This decoupling helps explain the weak or absent correlation between Tsoil and soil moisture (Fig. S8b), particularly under Sh (r = –0.28). Management practices such as organic inputs can also modulate these dynamics, adding further variability to soil respiration responses (Meena et al., 2020; Oyonarte et al., 2012; Rong et al., 2015; Xue and Tang, 2018).
Table 3Comparison of gap-filled CO2 fluxes between Eddy Covariance (EC) and upscaled chamber (Ch.stand) measurements, by season (rainy or dry).
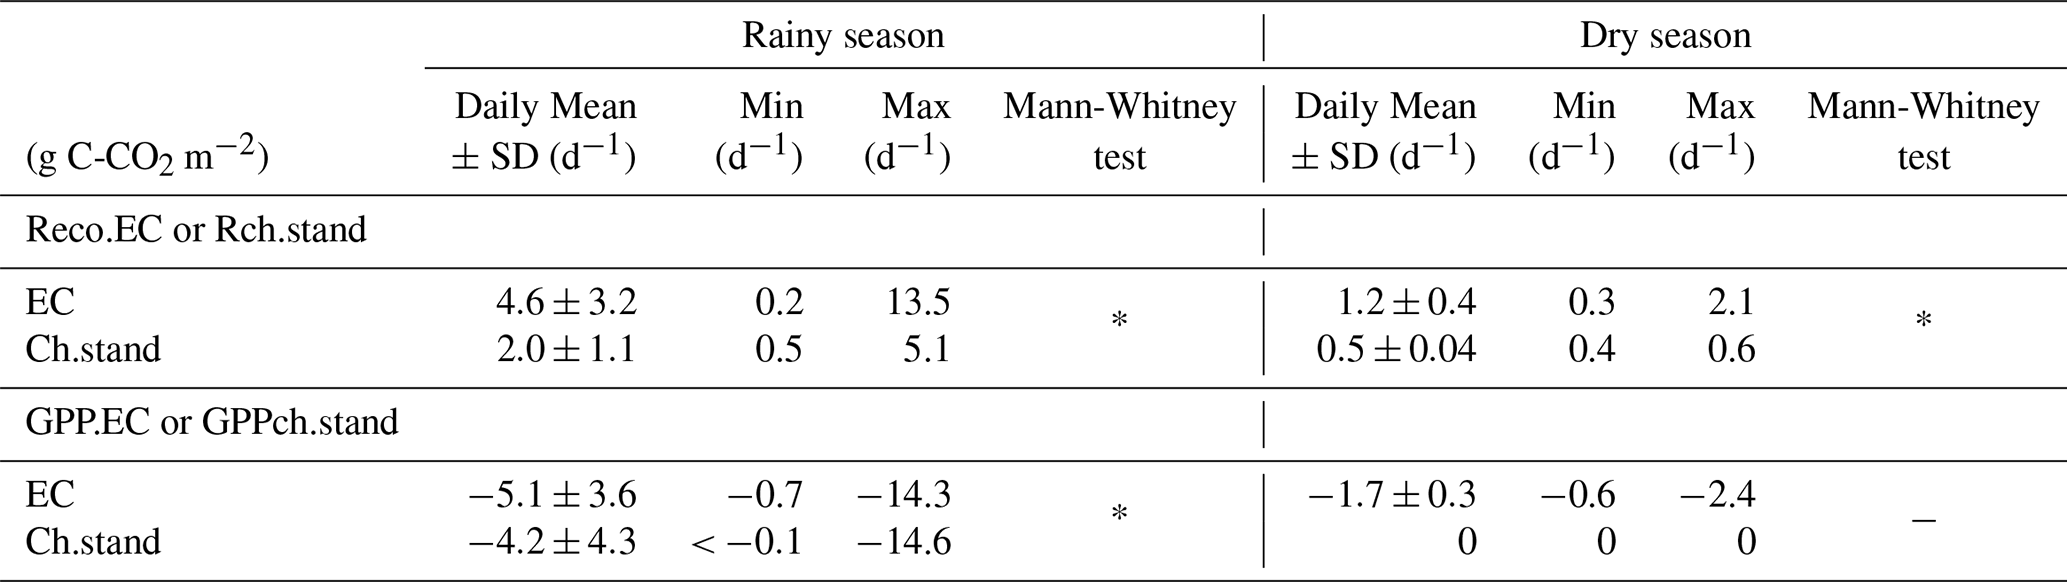
Mean, SD, Min, and Max represent the daily mean fluxes, standard deviation, minimum, and maximum values, respectively (g C-CO2 m−2 d−1). The Asterisks (*) indicate the p-values from the Mann-Whitney test, used to assess differences in mean between EC and Ch. Positive values indicate CO2 emissions, while negative values represent CO2 uptake.
Table 4Annual budget of CO2 fluxes based on Eddy Covariance (EC) and upscaled chamber methods (Ch.stand).
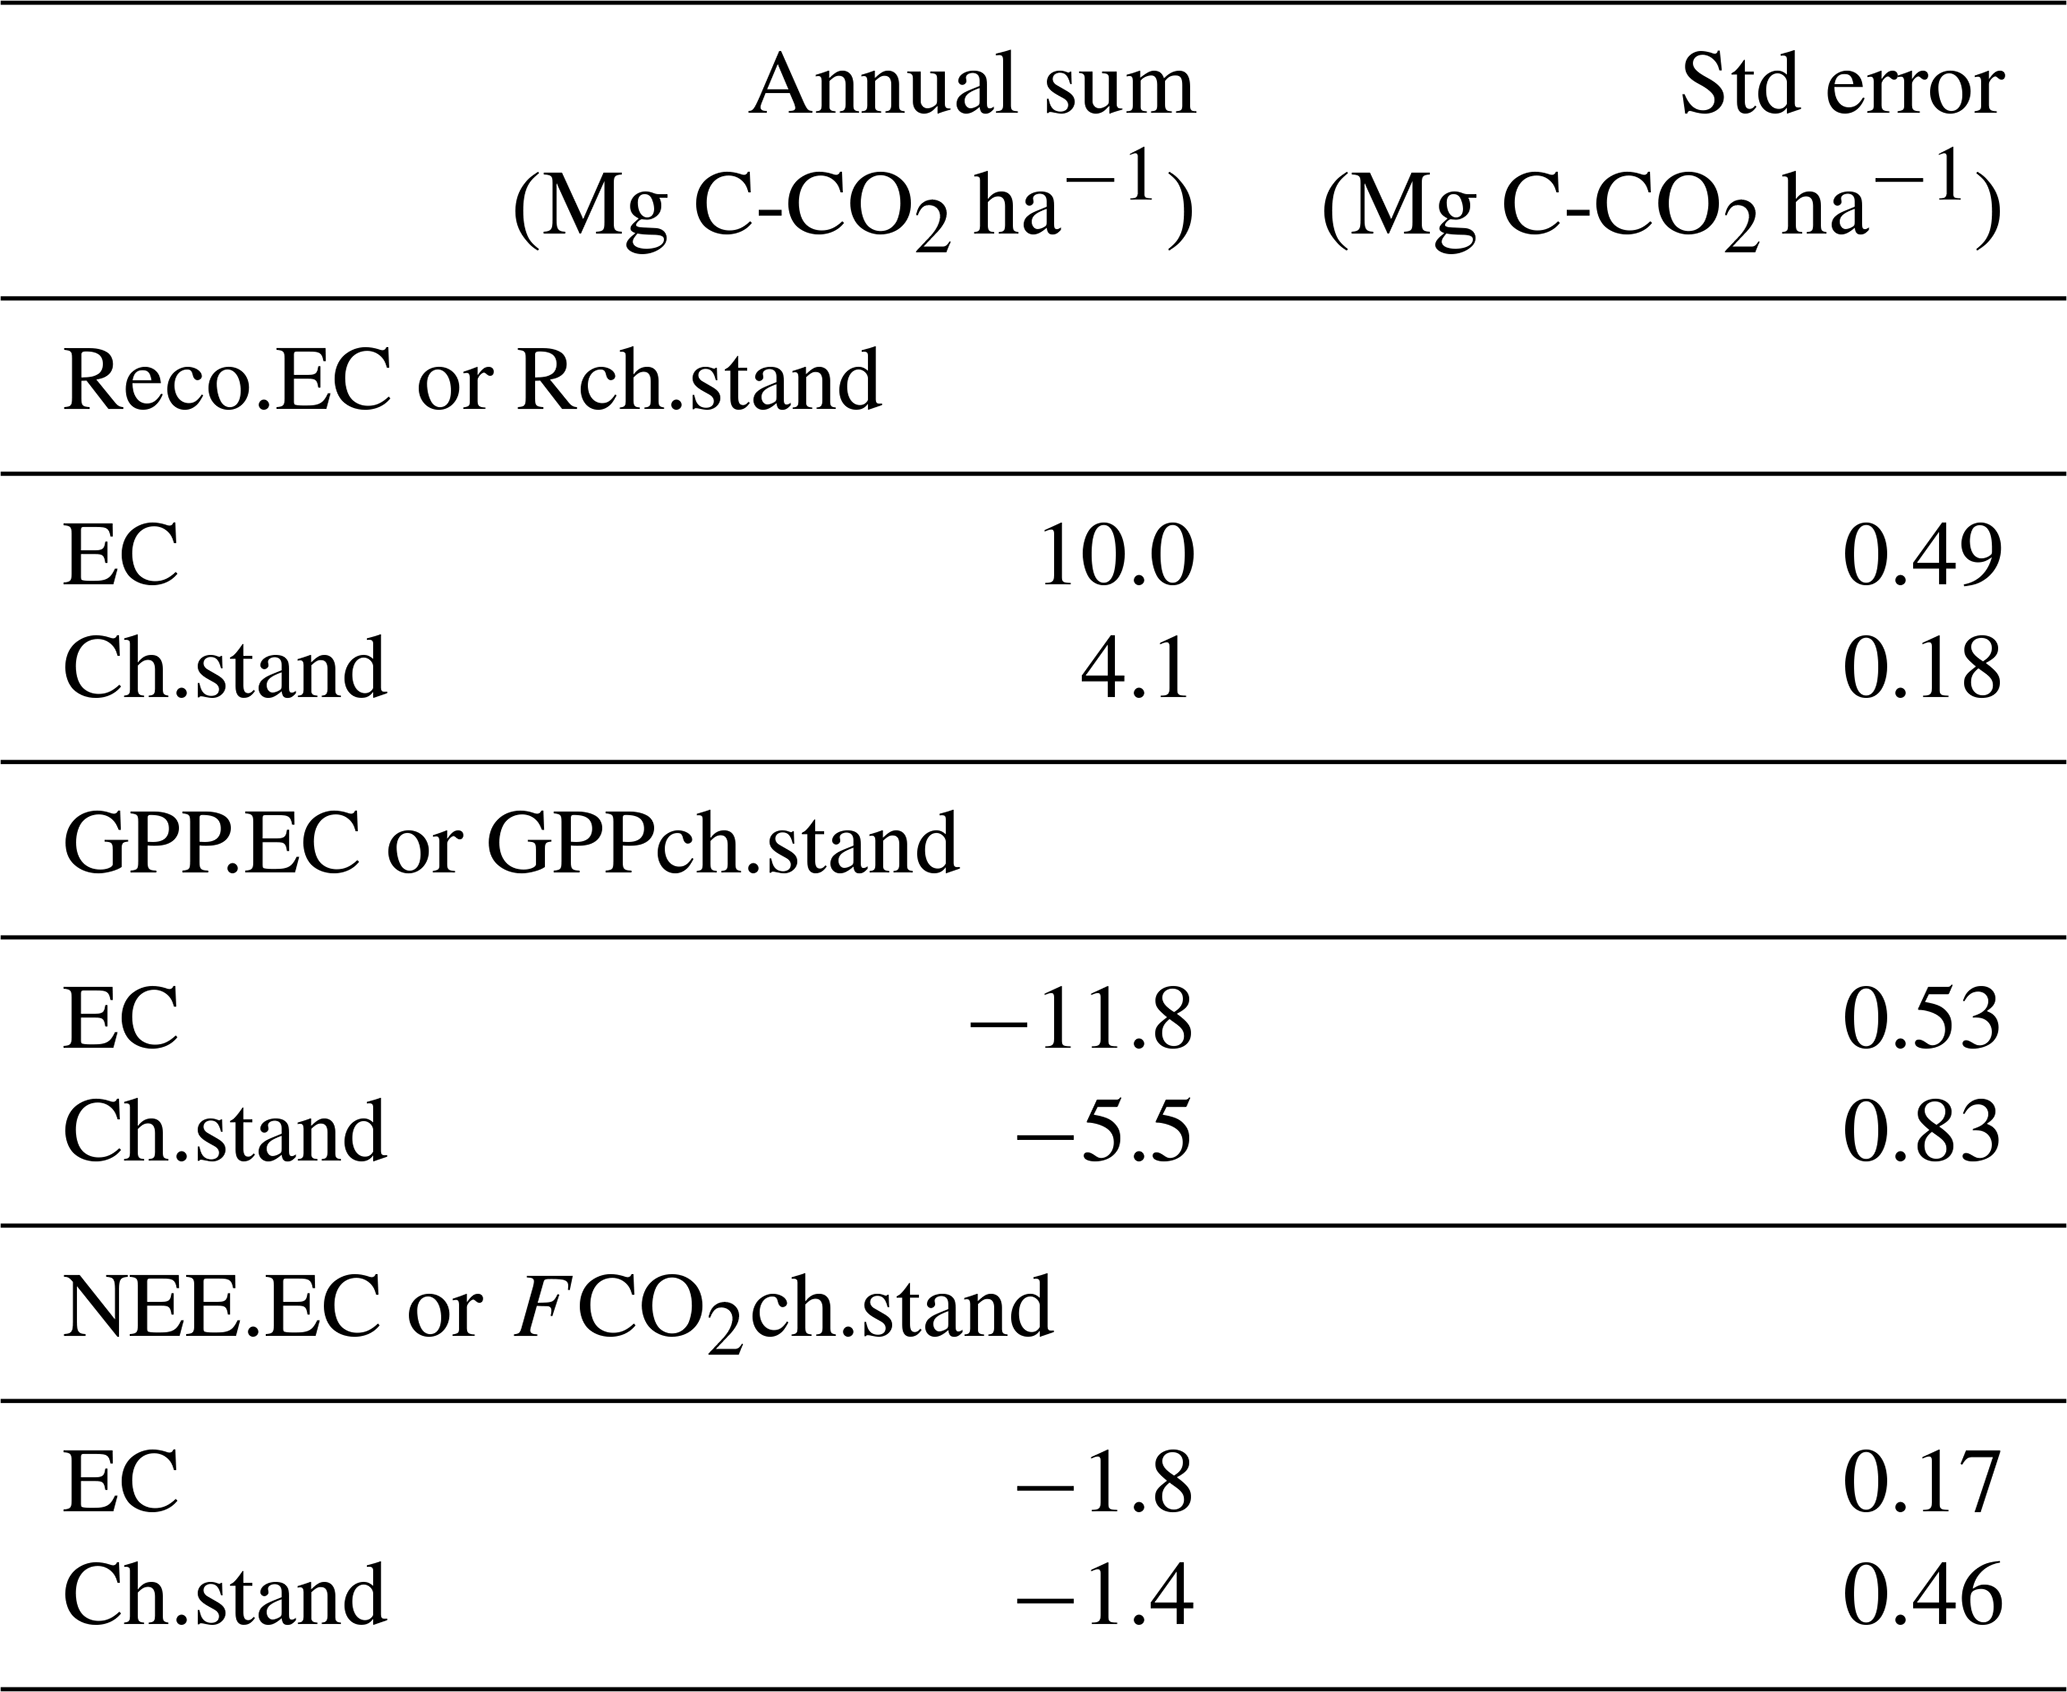
Annual sum corresponds to the annual cumulative fluxes for full year measurements (Mg C-CO2 ha−1). EC refers to fluxes measured by the Eddy Covariance method, and Ch refers to the fluxes measured by chambers, which are then upscaled to the whole field. Rch.stand represents the chamber respiration, while Reco.EC denotes the ecosystem respiration according to the EC method. GPP.EC and GPPch.stand are the gross primary production or photosynthesis flux, measured by EC and Ch methods, respectively. NEE.EC and FCO2ch.stand represent the net ecosystem exchange for EC and Ch, respectively. The associated standard error is denoted as Std error (Mg C-CO2 ha−1). Positive values indicate CO2 emissions, while negative values represent CO2 uptake.
4.3 Magnitude of chamber-based total CO2 respiration fluxes
Mean total soil respiration values were consistent with those reported in other low-input agricultural systems across sub-Saharan Africa (Mapanda et al., 2010; Pelster et al., 2017; Rosenstock et al., 2016). In full sun (FS), the mean respiration (1.0 ± 0.9 g C-CO2 m−2 d−1) closely matched values measured by Wachiye et al. (2020) in a semi-arid Kenyan field at 1158 m altitude (1.1 ± 0.1 g C-CO2 m−2 d−1). This similarity likely reflects comparable environmental conditions, including moderate rainfall (∼ 550 mm yr−1) and low soil organic carbon and nitrogen contents (< 1 %) in the 0–20 cm layer of sandy soil. In contrast, respiration under F. albida canopy (Sh: 1.6 ± 1.1 g C-CO2 m−2 d−1) was higher, likely due to additional autotrophic respiration from tree roots and greater organic inputs beneath the canopy. Nonetheless, this flux remains close to values observed in low-input sorghum fields on sandy loam soils in eastern Ghana (1.7 ± 1.1 g C-CO2 m−2 d−1), despite higher rainfall (950–1000 mm yr−1) in that region (Owusu-Prempeh et al., 2024).
Cumulative annual respiration fluxes fell within the range reported for Sahelian croplands (250–450 g C-CO2 m−2) (Brümmer et al., 2009) and other sub-Saharan African agricultural systems (Kim et al., 2016). The cumulative flux under tree cover is similar to that measured in cassava fields in eastern Tanzania (440 g C-CO2 m−2 yr−1), despite the latter receiving higher rainfall (∼ 1115 mm yr−1) (Rosenstock et al., 2016). This convergence may stem from comparable soil fertility constraints, with low soil organic carbon (1 %–1.7 %) and nitrogen contents (< 0.5 %). In contrast, the slightly lower cumulative flux in FS may reflect less favourable microclimatic conditions – such as elevated soil temperatures and increased aridity away from tree cover – limiting microbial activity (see Sect. 4.1).
Across sub-Saharan Africa, soil respiration fluxes based on static chamber measurements show high spatial variability, largely shaped by climate and land use. For example, Owusu-Prempeh et al. (2024) found higher respiration in woodlands (3.8 ± 0.8 g C-CO2 m−2 d−1) and grazed areas (2.7 ± 1.7) than in croplands (1.7 ± 1.1) in humid eastern Ghana. This gradient was linked to differences in soil moisture and organic matter. Similarly, Rosenstock et al. (2016) reported much higher fluxes in highland pastures in Kenya (3.8–4.4 g C-CO2 m−2 d−1) compared to cultivated fields in eastern Tanzania (1.2 ± 0.2), highlighting the role of vegetation cover and soil fertility.
4.4 Effect of trees on chamber-based soil respiration and photosynthesis
A notable increase in respiration and photosynthesis fluxes was observed under F. albida trees (Sh) compared at a distance from trees (FS). This increase may indicate the potential role of F. albida in modulating CO2 exchange dynamics (Rch and GPPch) within this agro-silvo-pastoral system. These results are consistent with preliminary findings from similar environments (Duthoit et al., 2020).
Numerous studies have investigated the effect of tree species on greenhouse gas fluxes, particularly CO2, revealing significant variations across different ecological contexts (Bréchet et al., 2021, 2025; Klaus et al., 2024; Mazza et al., 2021; Ramesh et al., 2013; Rheault et al., 2024). However, the underlying mechanisms by which trees influence these dynamics are not yet fully understood.
In general, agroforestry systems have been well-documented for their ability to provide a range of ecosystem services (e.g., Assefa et al., 2024; Bado et al., 2021; Kuyah et al., 2019; Rolo et al., 2023). Specifically, Faidherbia-based agroforestry systems may play a crucial role in regulating CO2 exchanges between the soil and atmosphere. F. albida-based agroforestry systems are recognized for enhancing both soil organic and mineral fertility (Bayala et al., 2020; Dilla et al., 2019; Sileshi, 2016; Sileshi et al., 2020; Stephen et al., 2020), mainly through litter accumulation and direct inputs from livestock excreta under their canopies. Additionally, the extensive root system of F. albida trees helps concentrate mineral nutrients, contributing to the formation of a “fertile island” effect under the trees (Siegwart et al., 2022; Eldridge et al., 2024). Moreover, F. albida improve water infiltration (Diongue et al., 2023; Faye et al., 2020; Sarr et al., 2023), enhance soil moisture retention (Clermont-Dauphin et al., 2023) and contribute to reduced soil temperatures (de Carvalho et al., 2021; Lopes et al., 2024; Sida et al., 2018). These changes foster a more favourable environment for soil microbial activity and crop development (Diack et al., 2024; Diene et al., 2024; Leroux et al., 2020; Roupsard et al., 2020) under the trees compared to open areas. Consequently, this likely explains the stronger effect of soil moisture and the leaf area index of groundnuts on Rch under the trees, resulting in higher total respiration (Table 2). For photosynthesis, the effect of these parameters was similar in both FS and Sh (Table 2). However, the significantly higher intensity of GPPch under Sh can be explained by greater light use efficiency (α) and a higher maximum CO2 uptake rate at light saturation (β) in this shaded environment. In agroforestry systems, light use efficiency can at least partially mitigate the reduction in photosynthetically active radiation under tree canopies (Charbonnier et al., 2017).
Similar results have been observed in different climatic conditions and ecosystems. Gomes et al. (2016) investigated soil respiration using mobile chambers (LI-8100-102 model) under trees in coffee-based agroforestry systems and in the open areas in Minas Gerais, Brazil. These studies were conducted with agroecological management practices, such as weeding, intercropping maize between coffee rows, and mulching. The agroforestry systems exhibited lower air and soil temperatures (at 5 and 10 cm depth) and higher air and soil humidity compared to the open areas (Gomes et al., 2016). These authors observed greater spatial variability in soil respiration in agroforestry system (34.1 %) compared to the open areas (24.2 %). This variability was mainly linked with fluctuations in labile carbon and total nitrogen, reflecting more favourable soil microclimate for microbial activity in agroforestry system. In contrast, soil temperature (10 cm depth) accounted for most of the variability observed in the open areas, where the absence of tree canopy resulted in high soil temperatures and low soil moisture (Gomes et al., 2016). Likewise, Van Haren et al. (2010) reported 38 % higher soil respiration near large trees (DBH > 35 cm) in clay-rich Amazonian forests compared to open sites. Interestingly, the magnitude of CO2 fluxes was independent of tree species, indicating that canopy effects may outweigh species-specific traits in some contexts. In our study, F. albida's influence on CO2 fluxes aligns with this general pattern observed in tropical agroforestry. However, the mechanisms linking individual tree species to microbial and physicochemical drivers of CO2 dynamics remain insufficiently understood and warrant further investigation (Jevon et al., 2023).
4.5 Birch Effect
A rapid increase in soil respiration was observed following the first rainfall events, particularly under F. albida. This phenomenon can be attributed to the lower bulk density of the soil under the trees (Clermont-Dauphin et al., 2023; Siegwart et al., 2023), which potentially lead to CO2 accumulation during the dry season due to higher soil organic matter (SOM) (Siegwart et al., 2023). Additionally, the sensitivity of microbial communities to subtle variations in soil moisture, compounded by the tree effect, may further explain this phenomenon, as outlined in Sections 4.1 and 4.3. This phenomenon, known as the “Birch effect” (Birch, 1958), has been reported across various semi-arid ecosystems in sub-Saharan Africa (Ago et al., 2016b; Fan et al., 2015; Wieckowski et al., 2024), as well as other semi-arid ecosystems globally (Roby et al., 2022; Yan et al., 2014; Yu et al., 2020). In these contexts, the “Birch effect” may result from the displacement of soil gas phases by the piston effect generated during water infiltration (Singh et al., 2023). Furthermore, microbial communities in semi-arid environments adopt osmoregulatory mechanisms to withstand water deficit (Warren, 2014), which is particularly pronounced during the dry season. This phenomenon reduces soil microbial metabolism (Schimel et al., 2007). Upon rapid soil rewetting, especially after prolonged dry periods, soil microbial metabolism process is swiftly reactivated, leading to a transient pulse in respiration and a CO2 release (Barnard et al., 2020; Kim et al., 2012; Manzoni et al., 2020; Vargas et al., 2018). Isotopic signatures of soil respiration provide evidence supporting the hypothesis that these pulses result from the rapid mineralisation of necromass or osmolytes excreted by microorganisms under drought stress (Schimel et al., 2007; Unger et al., 2010). Additional factors may amplify the “Birch effect”. For instance, drying-rewetting cycles can induce physical disruption of soil aggregates, enhance oxygen penetration and thereby expose previously protected organic matter to microbial decomposition (Rabbi et al., 2024). This increases substrate availability and subsequently boosts soil respiration fluxes.
The magnitude of the “Birch effect” is modulated by the severity and duration of drought. Thus, at our study site, given the 8- to 9-month-long dry season, the “Birch effect” is particularly intense. Indeed, extended drought periods promote greater accumulation of microbial necromass and intensify hypo-osmotic stress responses upon rewetting (Singh et al., 2023).
4.6 Comparing EC and chamber-based methods
Results revealed high seasonal variability, with higher values during the rainy season compared to the dry season. This seasonal pattern aligns with findings from studies in the Sahel using the EC method for CO2 flux measurements (Brümmer et al., 2008; Tagesson et al., 2015; Agbohessou et al., 2023, Wieckowski et al., 2024). Comparable patterns have also been documented at the ecosystem scale in other semi-arid environments (Ago et al., 2014; Archibald et al., 2009; Ardö et al., 2008; Jia et al., 2020; Quansah et al., 2015; Williams et al., 2009; Zhang et al., 2024a).
Several comparative studies between chamber and EC methods have reported both congruent and divergent CO2 flux estimates (Bastviken et al., 2022; Poyda et al., 2017; Riederer et al., 2014; Tang et al., 2008; Wang et al., 2010). In the present study, ecosystem respiration fluxes during the rainy season exhibited notable discrepancies measurements between EC (Reco.EC) and upscaled chamber-based (Rch.stand). This is attributable to differences in the flux components captured by each method. Specifically, Reco.EC included respiration from below- and above-ground tree parts, crops (groundnuts and cowpeas), weeds, and soil, whereas Rch.stand accounted only respiration from below-ground tree, groundnut crop, and soil. Therefore, as expected, Reco.EC (4.6 ± 3.2 g C-CO2 m−2 d−1) were significantly higher than Rch.stand (2.0 ± 1.1 g C-CO2 m−2 d−1).
For chamber-based GPP measurements, values were standardised (GPP-stand) by the field leaf area index (LAI.field). This allowed it to improve comparability with GPP.EC when trees were leafless in the rainy season. In both cases, GPP accounted only for crops (groundnut and cowpea) and weeds, as trees were non-photosynthetic in the rainy season. Despite this standardisation, GPP.EC values (−5.1 ± 3.6 g C-CO2 m−2 d−1) were significantly higher than GPPch.stand values (−4.2 ± 4.3 g C-CO2 m−2 d−1). However, no divergence was observed in August, and the intensity of the peak of GPP in September was similar in both methods, but from the onset of groundnut senescence, when weeds became the dominant photosynthetic contributors. Thus, during the groundnut growth season, with leafless F. albida trees and almost no weeds, GPP measurements from EC and chambers generate closely comparable results. Therefore, this provides an initial form of cross-validation between the two methods. It is important to note that the EC method integrates CO2 fluxes over a larger spatial scale, encompassing all ecosystem components (Baldocchi, 2003), while the chamber method captures fluxes on a smaller scale (i.e., at the 0.25 m2 scale). This scale disparity can introduce uncertainties when upscaling chamber-based fluxes to the field, as vegetation composition within chambers does not represent the EC footprint average vegetation. This makes upscaling chamber-based measurements challenging. Nevertheless, the standardisation we applied on chamber photosynthesis by LAI has been relatively successful.
During the dry season, Reco.EC included respiration from below- and above-ground tree parts (with leaves) and bare soil, while Rch.stand measured only below-ground tree and bare soil respiration. Consequently, the difference between Reco.EC and Rch.stand was solely attributable to above-ground tree respiration (Ra tree above-ground). In terms of GPP, chamber measurements were nil, whereas GPP.EC reflected only GPP trees.
The transition period, characterised by groundnut senescence, tree leaf regrowth, and weed proliferation, introduced further complexity, amplifying method-specific discrepancies. Rch.stand measurements facilitated the estimation of tree contribution to Reco.EC (Ra tree) and the verification of the consistency for EC results in terms of carbon use efficiency (CUE), estimated here at 0.48. This value indicates that nearly 50 % of the carbon captured by trees is allocated to biomass. The CUE estimate here is well comparable to the global average across diverse ecosystems, climates, and management practices (0.49 ± 0.14) (Tang et al., 2019). Similar CUE values have been reported for semi-arid grasslands (0.46 ± 0.10), but our value is notably lower than those documented for wetlands (0.61 ± 0.13) (Tang et al., 2019). Overall, these findings reinforce the plausibility of our assumptions regarding the compartment contributions to Reco.EC and Rch.stand, thereby providing a second cross-validation of the EC-Ch comparison. However, despite a frequently assumed CUE of 0.5 in models, global estimates span a broad range (0.20 to 0.82), depending on ecosystem type and management practices (DeLucia et al., 2007; Tang et al., 2019). This underscores the importance of refining carbon flux models to better represent the biophysical processes governing CO2 exchange in semi-arid agroforestry systems. The combined use of EC and chamber methodologies offers a comprehensive perspective on ecosystem-scale CO2 flux dynamics, advancing the understanding of carbon cycling in these environments.
4.7 Net annual vertical carbon balance
The net annual carbon balance was quantified at −1.4 ± 0.46 Mg C-CO2 ha−1 with the chamber method and −1.8 ± 0.17 Mg C-CO2 ha−1 by the Eddy Covariance (EC), indicating that the studied agro-silvo-pastoral system functions as a net carbon sink. These findings corroborate the system potential role in mitigating greenhouse gas emissions, consistent with previous studies reporting vertical CO2 flux balances in semi-arid ecosystems (Rahimi et al., 2021; Tagesson et al., 2015; Agbohessou et al., 2023, Wieckowski et al., 2024).
The estimated net C exchange balance is close to the reported mean for Sahelian ecosystems (−1.6 ± 0.5 Mg C-CO2 ha−1; Tagesson et al., 2016b). The EC-based net C exchange balance (−1.8 ± 0.17 Mg C-CO2 ha−1) is also similar to the value of −1.9 ± 0.4 Mg C-CO2 ha−1 reported for semi-arid savannas of northeastern Benin, despite higher annual rainfall (1495 mm; Ago et al., 2016b). Furthermore, our EC estimate is close to the average net C exchange reported for West African terrestrial ecosystems (−2.0 ± 1.5 Mg C-CO2 ha−1; Ago et al., 2016a).
However, estimates from Tagesson et al. (2015) (−2.7 ± 0.07 Mg C-CO2 ha−1) for a semi-arid savannah in Dahra, Senegal, located between the 300 and 400 mm isohyets, were comparatively higher. This is potentially attributable to specific characteristics of that specific savannah site, such as herbaceous vegetation cover during the rainy season, the presence of evergreen trees, and land management practices linked to pastoral livestock activities (Tagesson et al., 2016a).
The net annual C balance estimates presented in this study are, in fact, representing vertical fluxes only, given that they exclude organic matter (OM) imports and, more critically, exports, introducing uncertainties. Notably, the export of crop residues and direct inputs from animal excreta – particularly significant in “bush fields” during the dry season – were not accounted for. In our case of “bush field”, crop residues are exported to feed livestock, while livestock faeces are collected for use as fuel or manure in “home fields”. Such practices may lead to a significant soil organic carbon stocks depletion (Malou et al, 2021), potentially diminishing the net C budget (−1.4 ± 0.46 Mg C-CO2 ha−1) over time and shifting the system closer to carbon neutrality (Assouma et al., 2019).
These results should be contextualized within the broader framework of climate change and semi-arid ecosystem management. Although agro-silvo-pastoral systems can function as apparent annual carbon sinks, they remain highly sensitive to interannual rainfall variability and escalating anthropogenic pressures. Sustainable management practices, particularly regarding C inputs/outputs from the system regarding crop harvest, residues exportation, and cattle free manuring, must be taken into account to confirm the capacity of the system to act as effective a carbon sink.
4.8 Limitations of the study
This study benefited from the inverse phenology of F. albida, allowing for direct comparison between chamber-based GPP (GPPch.stand) and ecosystem-level GPP (GPP.EC) during the leafless period of the trees. However, the system spatial heterogeneity – common in agroforestry – posed challenges for accurately partitioning CO2 fluxes among trees, crops, and soil. A key limitation was the development of weeds during the late rainy season, which complicated the attribution of fluxes, particularly during the transitional period. Additionally, while GPPch was successfully standardised by LAI for upscaling, this was not feasible for respiration. Respiration integrates both autotrophic and heterotrophic components, which respond to different drivers and are not directly linked to LAI, limiting the precision of upscaled Rch.
Future improvements should aim to separately quantify respiration sources – tree roots, crops, and microbial (heterotrophic) respiration – and account explicitly for the weed layer, to refine flux partitioning in such complex agroforestry systems.
Furthermore, the present study constitutes only an intermediate step delivering a first integrated estimate of the main vertical CO2 exchanges (photosynthesis, respiration, and net ecosystem exchange) as a base for a forthcoming paper that will present a more comprehensive carbon budget of the ecosystem. Establishing such a carbon budget would require substantial additional data acquisition and poses considerable methodological challenges. In particular, quantifying carbon inputs/outputs associated with free-ranging livestock grazing would be difficult to achieve with acceptable accuracy. It must also be recognised that the system is in a dynamic, non-steady state, characterised by marked inter-annual variability as well as periods of carbon storage and release, which are difficult to constrain empirically except through modeling.
This study demonstrates the successful application of automated dynamic chambers to quantify CO2 fluxes in a Sahelian agroforestry system dominated by F. albida. The continuous, high-frequency measurements captured key seasonal dynamics and short-lived events (e.g., Birch effect), providing a more accurate assessment of carbon exchange than traditional intermittent sampling.
By integrating crop and soil components and applying dynamic partitioning models, the study quantified both respiration and photosynthesis fluxes at fine temporal resolution. The results revealed a clear “fertile island” effect under tree canopies, with higher respiration and photosynthetic activity, and highlighted the significant contribution of F. albida trees to annual carbon uptake.
The consistency between chamber- and eddy covariance-based estimates reinforces the robustness of the methodology. Overall, this work underscores the role of F. albida-based agroforestry systems in the dynamic of C exchanges in semi-arid environments, offering valuable insights for carbon accounting and sustainable land management in the Sahel.
The analyses were performed using standard Rstudio software tools without the development of any original code. All procedures are described in detail in the manuscript.
The data can be accessed via https://doi.org/10.5281/zenodo.19656357 (Ba, 2026).
The supplement related to this article is available online at https://doi.org/10.5194/soil-12-471-2026-supplement.
SMB: Conducting in situ experiments, collecting and processing data, writing-original draft, review and editing. OR: Designing experimental apparatus and methodology, writing, review and editing. LCL: Designing methodology, writing, review and editing. YA: Processing data, review and editing. FB: Designing chambers and connection to the instrument, review and editing. MD: Designing experimental set and methodology, review and editing. AW: Review and editing. MHA: Review and editing. EG: Processing data, review and editing. CD: review and editing. TT: Designing methodology, review, and editing. BS: Review and editing. DS: Designing methodology, writing, review and editing.
The contact author has declared that none of the authors has any competing interests.
Publisher's note: Copernicus Publications remains neutral with regard to jurisdictional claims made in the text, published maps, institutional affiliations, or any other geographical representation in this paper. The authors bear the ultimate responsibility for providing appropriate place names. Views expressed in the text are those of the authors and do not necessarily reflect the views of the publisher.
Our deepest appreciation goes to Ibou Diouf, the observer at our experimental site. Tagesson also acknowledged funding from Formas (Dnr 2021-00644). Lastly, we are deeply grateful to the editor Mariet Hefting and the two reviewers, Riccardo Picone and Jim Boonman, for their insightful and highly constructive comments.
This research was financially supported by the CaSSECS project (Carbon Sequestration and Greenhouse Gas Emissions in (Agro) Silvopastoral Systems of the CILS-Sahel States (FOOD/2019/410-169)), within the framework of the European Union's initiative “Development of Smart Innovation through Agricultural Research” (DeSIRA-UE-EuropAID). We extend our sincere gratitude to the coordination team of the CaSSECS project, the “Laboratoire Mixte International Intensification Écologique des Sols Cultivés en Afrique de l'Ouest” (LMI IESOL) of the of the French National Institute for Development (IRD) in Dakar (Senegal), as well as to the Faidherbia-Flux platform (https://lped.info/wikiObsSN/?Faidherbia-Flux, last access: 7 July 2024), its partners, and affiliated projects: EU-H2020 (SUSTAIN-SAHEL (grant no. 861974)); ANR under the France 2030 program (PEPR FairCarboN-RIFT (reference ANR-22-PEXF-0004)); EU-HORIZON EUROPE (GALILEO (grant no. 101181623)). Tagesson also acknowledged funding from Formas (Dnr 2021-00644).
This paper was edited by Mariet Hefting and reviewed by Riccardo Picone and Jim Boonman.
Agbohessou, Y., Delon, C., Mougin, E., Grippa, M., Tagesson, T., Diedhiou, M., Ba, S., Ngom, D., Vezy, R., Ndiaye, O., Assouma, M. H., Diawara, M., and Roupsard, O.: To what extent are greenhouse-gas emissions offset by trees in a Sahelian silvopastoral system?, Agr. Forest. Meteorl., 343, 109780, https://doi.org/10.1016/j.agrformet.2023.109780, 2023.
Agbohessou, Y., Delon, C., Grippa, M., Mougin, E., Ngom, D., Gaglo, E. K., Ndiaye, O., Salgado, P., and Roupsard, O.: Modelling CO2 and N2O emissions from soils in silvopastoral systems of the West African Sahelian band, Biogeosciences, 21, 2811–2837, https://doi.org/10.5194/bg-21-2811-2024, 2024.
Ago, E., Agbossou, E. K., Galle, S., Cohard, J. M., Heinesch, B., and Aubinet, M.: Long term observations of carbon dioxide exchange over cultivated savanna under a Sudanian climate in Benin (West Africa), Agr. Forest. Meteorl., 197, 13–25, https://doi.org/10.1016/j.agrformet.2014.06.005, 2014.
Ago, E., Agbossou, K., Ozer, P., and Aubinet, M.: Mesure des flux de CO2 et séquestration de carbone dans les écosystèmes terrestres ouest-africains (synthèse bibliographique), Biotechnologie, Biotechnol. Agron. Soc. Environ., 20, 68–82, https://doi.org/10.25518/1780-4507.12565, 2016a.
Ago, E., Agbossou, E. K., Cohard, J. M., Galle, S., and Aubinet, M.: Response of CO2 fluxes and productivity to water availability in two contrasting ecosystems in northern Benin (West Africa), Ann. Forest. Sci., 73, 483–500, https://doi.org/10.1007/s13595-016-0542-9, 2016b.
Archibald, S. A., Kirton, A., van der Merwe, M. R., Scholes, R. J., Williams, C. A., and Hanan, N.: Drivers of inter-annual variability in Net Ecosystem Exchange in a semi-arid savanna ecosystem, South Africa, Biogeosciences, 6, 251–266, https://doi.org/10.5194/bg-6-251-2009, 2009.
Ardö, J., Mölder, M., El-Tahir, B. A., and Elkhidir, H. A. M.: Seasonal variation of carbon fluxes in a sparse savanna in semi-arid Sudan, Carbon Balance and Manag., 3, 7, https://doi.org/10.1186/1750-0680-3-7, 2008.
Assefa, A., Muthuri, C. W., Gebrekirstos, A., Hadgu, K., and Fetene, M.: Tree growth and wheat productivity are affected by pollarding Faidherbia albida in semi-arid Ethiopia, Agroforest. Syst., 98, 783–796, https://doi.org/10.1007/s10457-023-00948-7, 2024.
Assouma, M. H., Serça, D., Guérin, F., Blanfort, V., Lecomte, P., Touré, I., Ickowicz, A., Manlay, R. J., Bernoux, M., and Vayssières, J.: Livestock induces strong spatial heterogeneity of soil CO2, N2O and CH4 emissions within a semi-arid sylvo-pastoral landscape in West Africa, J. Arid Land, 9, 210–221, https://doi.org/10.1007/s40333-017-0001-y, 2017.
Assouma, M. H., Hiernaux, P., Lecomte, P., Ickowicz, A., Bernoux, M., and Vayssières, J.: Contrasted seasonal balances in a Sahelian pastoral ecosystem result in a neutral annual carbon balance, J. Arid Environ., 162, 62–73, https://doi.org/10.1016/j.jaridenv.2018.11.013, 2019.
Ba, S. M.: Drivers and vertical CO2 flux balances in a Sahelian agroforestry system: Insights from high frequency measurements, Zenodo [data set], https://doi.org/10.5281/zenodo.19656357, 2026.
Bado, B. V., Whitbread, A., and Sanoussi Manzo, M. L.: Improving agricultural productivity using agroforestry systems: Performance of millet, cowpea, and ziziphus-based cropping systems in West Africa Sahel, Agr. Ecosyst. Environ., 305, 107175, https://doi.org/10.1016/j.agee.2020.107175, 2021.
Baldocchi, D.: Assessing the eddy covariance technique for evaluating carbon dioxide exchange rates of ecosystems: Past, present and future, Glob. Change Biol., 9, 479–492, https://doi.org/10.1046/j.1365-2486.2003.00629.x, 2003.
Baldocchi, D.: “Breathing” of the terrestrial biosphere: Lessons learned from a global network of carbon dioxide flux measurement systems, Aust. J. Bot., 56, 1, https://doi.org/10.1071/BT07151, 2008.
Baldocchi, D.: How eddy covariance flux measurements have contributed to our understanding of global change biology, Glob. Change Biol., 26, 242–260, https://doi.org/10.1111/gcb.14807, 2020.
Barnard, R. L., Blazewicz, S. J., and Firestone, M. K.: Rewetting of soil: Revisiting the origin of soil CO2 emissions, Soil Biol. Biochem., 147, https://doi.org/10.1016/j.soilbio.2020.107819, 2020.
Bastviken, D., Wilk, J., Duc, N. T., Gålfalk, M., Karlson, M., Neset, T.-S., Opach, T., Enrich-Prast, A., and Sundgren, I.: Critical method needs in measuring greenhouse gas fluxes, Environ. Res. Lett., 17, 104009, https://doi.org/10.1088/1748-9326/ac8fa9, 2022.
Bayala, J., Sanou, J., Bazié, H. R., Coe, R., Kalinganire, A., and Sinclair, F. L.: Regenerated trees in farmers' fields increase soil carbon across the Sahel, Agroforest. Syst., 94, 401–415, https://doi.org/10.1007/s10457-019-00403-6, 2020.
Birch, H. F.: The effect of soil drying on humus decomposition and nitrogen availability, Plant and Soil, 10, 9–31, https://doi.org/10.1007/BF01343734, 1958.
Bombelli, A., Henry, M., Castaldi, S., Adu-Bredu, S., Arneth, A., de Grandcourt, A., Grieco, E., Kutsch, W. L., Lehsten, V., Rasile, A., Reichstein, M., Tansey, K., Weber, U., and Valentini, R.: An outlook on the Sub-Saharan Africa carbon balance, Biogeosciences, 6, 2193–2205, https://doi.org/10.5194/bg-6-2193-2009, 2009.
Borken, W., Xu, Y., Davidson, E. A., and Beese, F.: Site and temporal variation of soil respiration in European beech, Norway spruce, and Scots pine forests, Glob. Change Biol., 8, 1205–1216, https://doi.org/10.1046/j.1365-2486.2002.00547.x, 2002.
Bréchet, L. M., Daniel, W., Stahl, C., Burban, B., Goret, J. Y., Salomn, R. L., and Janssens, I. A.: Simultaneous tree stem and soil greenhouse gas (CO2, CH4, N2O) flux measurements: A novel design for continuous monitoring towards improving flux estimates and temporal resolution, New Phytol., 230, 2487–2500, https://doi.org/10.1111/nph.17352, 2021.
Bréchet, L. M., Salomn, R. L., Machacova, K., Stahl, C., Burban, B., Goret, J. Y., Steppe, K., Damien, B., and Janssens, I. A.: Insights into the sub daily variations in methane, nitrous oxide and carbon dioxide fluxes from upland tropical tree stems, New Phytol., 20401, https://doi.org/10.1111/nph.20401, 2025.
Brümmer, C., Falk, U., Papen, H., Szarzynski, J., Wassmann, R., and Brüggemann, N.: Diurnal, seasonal, and interannual variation in carbon dioxide and energy exchange in shrub savanna in Burkina Faso (West Africa), J. Geophys. Res.-Biogeo., 113, https://doi.org/10.1029/2007JG000583, 2008.
Brümmer, C., Papen, H., Wassmann, R., and Brüggemann, N.: Fluxes of CH4 and CO2 from soil and termite mounds in south Sudanian savanna of Burkina Faso (West Africa), Global Biogeochem. Cy., 23, https://doi.org/10.1029/2008GB003237, 2009.
Cardinael, R., Cadisch, G., Gosme, M., Oelbermann, M., and Van Noordwijk, M.: Climate change mitigation and adaptation in agriculture: Why agroforestry should be part of the solution?, Agr. Ecosyst. Environ., 319, 107555, https://doi.org/10.1016/j.agee.2021.107555, 2021.
Charbonnier, F., Roupsard, O., le Maire, G., Guillemot, J., Casanoves, F., Lacointe, A., Vaast, P., Allinne, C., Audebert, L., Cambou, A., Clément-Vidal, A., Defrenet, E., Duursma, R. A., Jarri, L., Jourdan, C., Khac, E., Leandro, P., Medlyn, B. E., Saint-André, L., Thaler, P., Van Den Meersche, K., Barquero Aguilar, A., Lehner, P., and Dreyer, E.: Increased light-use efficiency sustains net primary productivity of shaded coffee plants in agroforestry system, Plant Cell Environ., 40, 1592–1608, https://doi.org/10.1111/pce.12964, 2017.
Chu, H., Luo, X., Ouyang, Z., Chan, W. S., Dengel, S., Biraud, S. C., Torn, M. S., Metzger, S., Kumar, J., Arain, M. A., Arkebauer, T. J., Baldocchi, D., Bernacchi, C., Billesbach, D., Black, T. A., Blanken, P. D., Bohrer, G., Bracho, R., Brown, S., Brunsell, N. A., Chen, J., Chen, X., Clark, K., Desai, A. R., Duman, T., Durden, D., Fares, S., Forbrich, I., Gamon, J. A., Gough, C. M., Griffis, T., Helbig, M., Hollinger, D., Humphreys, E., Ikawa, H., Iwata, H., Ju, Y., Knowles, J. F., Knox, S. H., Kobayashi, H., Kolb, T., Law, B., Lee, X., Litvak, M., Liu, H., Munger, J. W., Noormets, A., Novick, K., Oberbauer, S. F., Oechel, W., Oikawa, P., Papuga, S. A., Pendall, E.,Prajapati, P., Prueger, J., Quinton, W. L., Richardson, A. D., Russell, E. S., Scott, R. L., Starr, G., Staebler, R., Stoy, P. C., Stuart-Haëntjens, E., Sonnentag, O., Sullivan, R. C., Suyker, A., Ueyama, M., Vargas, R., Wood, J. D., and Zona, D.: Representativeness of Eddy-Covariance flux footprints for areas surrounding AmeriFlux sites, Agr. Forest. Meteorol., 301–302, 108350, https://doi.org/10.1016/j.agrformet.2021.108350, 2021.
Clermont-Dauphin, C., N'dienor, M., Leroux, L., Ba, H. S., Bongers, F., Jourdan, C., Roupsard, O., Do, F. C., Cournac, L., and Seghieri, J.: Faidherbia albida trees form a natural buffer against millet water stress in agroforestry parklands in Senegal, Biotechnol. Agron. Soc. Environ., 182–195, https://doi.org/10.25518/1780-4507.20477, 2023.
Conant, R. T., Dalla-Betta, P., Klopatek, C. C., and Klopatek, J. M.: Controls on soil respiration in semiarid soils, Soil Biol. Biochem., 36, 945–951, https://doi.org/10.1016/j.soilbio.2004.02.013, 2004.
de Carvalho, A. F., Fernandes-Filho, E. I., Daher, M., Gomes, L. de C., Cardoso, I. M., Fernandes, R. B. A., and Schaefer, C. E. G. R.: Microclimate and soil and water loss in shaded and unshaded agroforestry coffee systems, Agroforest. Syst., 95, 119–134, https://doi.org/10.1007/s10457-020-00567-6, 2021.
Delaunay, V., Desclaux, A., and Sokhna, Ch.: Niakhar, mémoires et perspectives: Recherches pluridisciplinaires sur le changement en Afrique, IRD Éditions/L'Harmattan, 536 pp., ISBN 9782140103551, 2140103556 https://www.editions.ird.fr/open_access_download/851/441 (last access: 15 April 2024), 2019.
Delon, C., Galy-Lacaux, C., Serça, D., Personne, E., Mougin, E., Adon, M., Le Dantec, V., Loubet, B., Fensholt, R., and Tagesson, T.: Modelling land–atmosphere daily exchanges of NO, NH3, and CO2 in a semi-arid grazed ecosystem in Senegal, Biogeosciences, 16, 2049–2077, https://doi.org/10.5194/bg-16-2049-2019, 2019.
DeLucia, E. H., Drake, J. E., Thomas, R. B., and Gonzalez-Meler, M.: Forest carbon use efficiency: Is respiration a constant fraction of gross primary production?, Glob. Change Biol., 13, 1157–1167, https://doi.org/10.1111/j.1365-2486.2007.01365.x, 2007.
Denmead, O. T.: Approaches to measuring fluxes of methane and nitrous oxide between landscapes and the atmosphere, Plant Soil, 309, 5–24, https://doi.org/10.1007/s11104-008-9599-z, 2008.
Diack, I., Diene, S., Leroux, L., Diouf, A., Benjamin, H., Olivier, R., Letourmy, P., Alain, A., Sarr, I., and Moussa, D.: Combining UAV and Sentinel-2 Imagery for Estimating Millet FCover in a Heterogeneous Agricultural Landscape of Senegal, IEEE J. Sel. Top. Appl. Earth Obs. Remote Sens., 17, 7305–7322, https://doi.org/10.1109/JSTARS.2024.3373508, 2024.
Diene, S. M., Diack, I., Audebert, A., Roupsard, O., Leroux, L., Diouf, A. A., Mbaye, M., Fernandez, R., Diallo, M., and Sarr, I.: Improving pearl millet yield estimation from UAV imagery in the semiarid agroforestry system of Senegal through textural indices and reflectance normalization, IEEE Access, 12, 132626–132643, https://doi.org/10.1109/ACCESS.2024.3460107, 2024.
Dilla, A. M., Smethurst, P. J., Barry, K., and Parsons, D.: Preliminary estimate of carbon sequestration potential of Faidherbia albida (Delile) A. Chev in an agroforestry parkland in the Central Rift Valley of Ethiopia, For. Trees Livelihoods, 28, 79–89, https://doi.org/10.1080/14728028.2018.1564146, 2019.
Diongue, D., Brunetti, G., Stumpp, C., Do, F., Roupsard, O., Orange, D., Faye, W., Sow, S., Jourdan, C., and Faye, S.: A Probabilistic Framework for Assessing the Hydrological Impact of Faidherbia albida in an Arid Area of Senegal, J. Hydrol., 622, 129717, https://doi.org/10.1016/j.jhydrol.2023.129717, 2023.
Duthoit, M., Roupsard, O., Créquy, N., and Sauze, J.: Conception d'un dispositif automatisé de chambres de mesures d'échanges gazeux du sol à fermeture horizontale, Le Cahier des Techniques de l'Inra, 102, 19 pp., hal-03989886, https://hal.science/hal-03989886/document (last access: 20 April 2024), 2020.
Eldridge, D. J., Ding, J., Dorrough, J., et al: Hotspots of biogeochemical activity linked to aridity and plant traits across global drylands, Nat. Plants 10, 760–770, https://doi.org/10.1038/s41477-024-01670-7, 2024.
Falge, E., Baldocchi, D., Olson, R., Anthoni, P., Aubinet, M., Bernhofer, C., Burba, G., Ceulemans, R., Clement, R., Dolman, H., Granier, A., Gross, P., Grünwald, T., Hollinger, D., Jensen, N.-O., Katul, G., Keronen, P., Kowalski, A., Lai, C. T., Law, B. E., and Wofsy, S.: Agr. Forest Meteorol., 107, 43–69, https://doi.org/10.1016/S0168-1923(00)00225-2, 2001.
Fan, Z., Neff, J. C., and Hanan, N. P.: Modeling pulsed soil respiration in an African savanna ecosystem, Agr. Forest Meteorol., 200, 282–292, https://doi.org/10.1016/j.agrformet.2014.10.009, 2015.
Faye, W., Fall, A. N., Orange, D., Do, F., Roupsard, O., and Kane, A.: Climatic variability in the Sine-Saloum basin and its impacts on water resources: case of the Sob and Diohine watersheds in the region of Niakhar, Proc. IAHS, 383, 391–399, https://doi.org/10.5194/piahs-383-391-2020, 2020.
Finkelstein, P. L. and Sims, P. F.: Sampling error in eddy correlation flux measurements, J. Geophys. Res., 106, 3503–3509, https://doi.org/10.1029/2000JD900731, 2001.
Fleck, D., He, Y., Alexander, C., Jacobson, G., and Cunningham, K. L.: Simultaneous soil flux measurements of five gases – N2O, CH4, CO2, NH3, and H2O – with the Picarro G2508, Picarro Application Note, AN034, https://www.picarro.com/environmental/an034_simultaneous_soil_flux_measurements_of_five_gases_n2o_ch4_co2_nh3_and_h2o_g2508 (last access: 18 May 2024), 2013.
Foken, T., Göockede, M., Mauder, M., Mahrt, L., Amiro, B., and Munger, W.: Post-Field Data Quality Control, in: Handbook of Micrometeorology, Atmos. Ocean. Sci. Lib., vol. 29, edited by: Lee, X., Massman, W., and Law, B., Springer, Dordrecht, https://doi.org/10.1007/1-4020-2265-4_9, 2004.
Fox, J., Weisberg, S., and Price, B.: car: Companion to Applied Regression (version 3.1-3), CRAN (Comprehensive R Archive Network) [code], https://doi.org/10.32614/CRAN.package.car, 2023.
Gomes, L. D. C., Cardoso, I. M., Mendonça, E. D. S., Fernandes, R. B. A., Lopes, V. S., and Oliveira, T. S.: Trees modify the dynamics of soil CO2 efflux in coffee agroforestry systems, Agr. Forest. Meteorol., 224, 30–39, https://doi.org/10.1016/j.agrformet.2016.05.001, 2016.
Gonsamo, A., Chen, J. M., He, L., Sun, Y., Rogers, C., and Liu, J.: Exploring SMAP and OCO-2 observations to monitor soil moisture control on photosynthetic activity of global drylands and croplands, Remote Sens. Environ., 232, 111314, https://doi.org/10.1016/j.rse.2019.111314, 2019.
Guillen-Cruz, G., Campuzano, E. F., Juárez-Altamirano, R., López-García, K. L., Torres-Arreola, R., and Flores-Rentería, D.: Interannual Variation and Control Factors of Soil Respiration in Xeric Shrubland and Agricultural Sites from the Chihuahuan Desert, Mexico, Land, 12, 1961, https://doi.org/10.3390/land12111961, 2023.
Gupta, S. R., Dagar, J. C., Sileshi, G. W., and Chaturvedi, R. K.: Agroforestry for Climate Change Resilience in Degraded Landscapes, in: Agroforestry for Sustainable Intensification of Agriculture in Asia and Africa, Sustain. Sci. in Asia Afr., edited by: Dagar, J. C., Gupta, S. R., and Sileshi, G. W., Springer, Singapore, https://doi.org/10.1007/978-981-19-4602-8_5, 2023.
Houghton, R. A. and Hackler, J. L.: Emissions of carbon from land use change in sub-Saharan Africa, Geophys. Res., 111, https://doi.org/10.1029/2005JG000076, 2006.
IUSS Working Group WRB: World Reference Base for Soil Resources, International soil classification system for naming soils and creating legends for soil maps, 4th edition, International Union of Soil Sciences (IUSS), Vienna, Austria, ISBN 979-8-9862451-1-9, https://www.isric.org/sites/default/files/WRB_fourth_edition_2022-12-18.pdf (last access: 17 April 2024), 2022.
Jackson, R. B., Canadell, J., Ehleringer, J. R., Mooney, H. A., Sala, O. E., and Schulze, E. D.: A global analysis of root distributions for terrestrial biomes, Oecologia 108, 389–411, https://doi.org/10.1007/BF00333714, 1996.
Jevon, F. V., Gewirtzman, J., Lang, A. K., Ayres, M. P., and Matthes, J. H.: Tree Species Effects on Soil CO2 and CH4 Fluxes in a Mixed Temperate Forest, Ecosystems, 26, 1587–1602, https://doi.org/10.1007/s10021-023-00852-2, 2023.
Jia, X., Mu, Y., Zha, T., Wang, B., Qin, S., and Tian, Y.: Seasonal and interannual variations in ecosystem respiration in relation to temperature, moisture, and productivity in a temperate semi-arid shrubland, Sci. Total Environ., 709, 136210, https://doi.org/10.1016/j.scitotenv.2019.136210, 2020.
Juszczak, R., Acosta, M., and Olejnik, J.: Comparison of Daytime and Nighttime Ecosystem Respiration Measured by the Closed Chamber Technique on a Temperate Mire in Poland, Pol. J. Environ. Stud., 21, 643–658, 2012.
Kim, D.-G., Vargas, R., Bond-Lamberty, B., and Turetsky, M. R.: Effects of soil rewetting and thawing on soil gas fluxes: a review of current literature and suggestions for future research, Biogeosciences, 9, 2459–2483, https://doi.org/10.5194/bg-9-2459-2012, 2012.
Kim, D.-G., Thomas, A. D., Pelster, D., Rosenstock, T. S., and Sanz-Cobena, A.: Greenhouse gas emissions from natural ecosystems and agricultural lands in sub-Saharan Africa: synthesis of available data and suggestions for further research, Biogeosciences, 13, 4789–4809, https://doi.org/10.5194/bg-13-4789-2016, 2016.
Klaus, M., Öquist, M., and Macháčová, K.: Tree stem-atmosphere greenhouse gas fluxes in a boreal riparian forest, Sci. Total Environ., 954, 176243, https://doi.org/10.1016/j.scitotenv.2024.176243, 2024.
Kormann, R. and Meixner, F. X.: An analytical footprint model for non-neutral stratification, Bound.-Lay. Meteorol., 99, 207–224, https://doi.org/10.1023/A:1018991015119, 2001.
Kuyah, S., Whitney, C. W., Jonsson, M., Sileshi, G. W., Öborn, I., Muthuri, C. W., and Luedeling, E.: Agroforestry delivers a win-win solution for ecosystem services in sub-Saharan Africa. A meta-analysis, Agron. Sustain. Dev., 39, https://doi.org/10.1007/s13593-019-0589-8, 2019.
Lambers, H., Chapin, F. S., and Pons, T. L.: Plant Physiological Ecology, Springer, New York, https://doi.org/10.1007/978-0-387-78341-3, 2008.
Lasslop, G., Reichstein, M., Papale, D., Richardson, A., Arneth, A., Barr, A., Stoy, P., and Wohlfahrt, G.: Separation of net ecosystem exchange into assimilation and respiration using a light response curve approach: Critical issues and global evaluation, Glob. Change Biol., 16, 187–208, https://doi.org/10.1111/j.1365-2486.2009.02041.x, 2010.
Lembrechts, J. J., Aalto, J., Ashcroft, M. B., et al.: SoilTemp: A global database of near-surface temperature, Glob. Change Biol., 26, 6616–6629, https://doi.org/10.1111/gcb.15123, 2020.
Lembrechts, J. J., van den Hoogen, J., Aalto, J., et al.: Global maps of soil temperature, Glob. Change Biol., 28, 3110–3144, https://doi.org/10.1111/gcb.16060, 2022.
Leroux, L., Falconnier, G. N., Diouf, A. A., Ndao, B., Gbodjo, J. E., Tall, L., Balde, A. A., Clermont-Dauphin, C., Bégué, A., Affholder, F., and Roupsard, O.: Using remote sensing to assess the effect of trees on millet yield in complex parklands of Central Senegal, Agr. Syst., 184, https://doi.org/10.1016/j.agsy.2020.102918, 2020.
Leroux, L., Clermont-Dauphin, C., Ndienor, M., Jourdan, C., Roupsard, O., and Seghieri, J.: A spatialized assessment of ecosystem service relationships in a multifunctional agroforestry landscape of Senegal, Sci. Total Environ., 853, 158707, https://doi.org/10.1016/j.scitotenv.2022.158707, 2022.
Liu, Y., He, N., Wen, X., Xu, L., Sun, X., Yu, G., Liang, L., and Schipper, L. A.: The optimum temperature of soil microbial respiration: Patterns and controls, Soil Biol. Biochem., 121, 35–42, https://doi.org/10.1016/j.soilbio.2018.02.019, 2018.
Lloyd, J. and Taylor, J. A.: On the Temperature Dependence of Soil Respiration, Funct. Ecol., 8, 315–323, https://doi.org/10.2307/2389824,1994.
Lopes, V. S., Cardoso, I. M., Cavalcante, V. S., Gomes, L. de C., Tanure, M. M. C., Moura, W. de M., Mendonça, E. de S., and Fernandes, R. B. A.: Soil CO2 efflux in coffee agroforestry and full-sun coffee systems, Acta Sci.-Agr., 46, e65877, https://doi.org/10.4025/actasciagron.v46i1.65877, 2024.
Lu, T., Brandt, M., Tong, X., Hiernaux, P., Leroux, L., Ndao, B., and Fensholt, R.: Mapping the abundance of multipurpose agroforestry Faidherbia albida trees in Senegal, Remote Sens., 14, 662, https://doi.org/10.3390/rs14030662, 2022.
Lüdecke, D., Ben-Shachar, M., Patil, I., Waggoner, P., and Makowski, D.: Performance: An R Package for Assessment, Comparison and Testing of Statistical Models, J. Open Source Softw., 6, 3139, https://doi.org/10.21105/joss.03139, 2021.
Luo, Y. and Zhou, X.: Methods of Measurements and Estimations, in: Soil Respiration and Environment, edited by: Luo, Y. and Zhou, X., Academic Press, Elsevier, 161–185, https://doi.org/10.1016/B978-0-12-088782-8.X5000-1, 2006.
Macharia, J. M., Pelster, D. E., Ngetich, F. K., Shisanya, C. A., Mucheru-Muna, M., and Mugendi, D. N.: Soil greenhouse gas fluxes from maize production under different soil fertility management practices in East Africa, J. Geophys. Res.-Biogeo., 125, e2019JG005427, https://doi.org/10.1029/2019JG005427, 2020.
Malou, O. P., Moulin, P., Chevallier, T., Masse, D., Vayssières, J., Badiane-Ndour, N. Y., Tall, L., Thiam, A., and Chapuis-Lardy, L.: Estimates of carbon stocks in sandy soils cultivated under local management practices in Senegal's groundnut basin, Reg. Environ. Change, 21, 65, https://doi.org/10.1007/s10113-021-01790-2, 2021.
Manzoni, S., Chakrawal, A., Fischer, T., Schimel, J. P., Porporato, A., and Vico, G.: Rainfall intensification increases the contribution of rewetting pulses to soil heterotrophic respiration, Biogeosciences, 17, 4007–4023, https://doi.org/10.5194/bg-17-4007-2020, 2020.
Mapanda, F., Mupini, J., Wuta, M., Nyamangara, J., and Rees, R. M.: A cross-ecosystem assessment of the effects of land cover and land use on soil emission of selected greenhouse gases and related soil properties in Zimbabwe, Eur. J. Soil Sci., 61, 721–733, https://doi.org/10.1111/j.1365-2389.2010.01266.x, 2010.
Mazza, G., Agnelli, A. E., and Lagomarsino, A.: The effect of tree species composition on soil C and N pools and greenhouse gas fluxes in a Mediterranean reforestation, J. Soil Sci. Plant Nutr., 21, 1339–1352, https://doi.org/10.1007/s42729-021-00444-w, 2021.
Mbow, C., Van Noordwijk, M., Luedeling, E., Neufeldt, H., Minang, P. A., and Kowero, G.: Agroforestry solutions to address food security and climate change challenges in Africa, Curr. Opin. Environ. Sustain., 6, 61–67, https://doi.org/10.1016/j.cosust.2013.10.014, 2014.
Meena, A., Hanief, M., Dinakaran, J., and Rao, K. S.: Soil moisture controls the spatio-temporal pattern of soil respiration under different land use systems in a semi-arid ecosystem of Delhi, India, Ecol. Processes, 9, 15, https://doi.org/10.1186/s13717-020-0218-0, 2020.
Meisner, A., Rousk, J., and Bååth, E.: Prolonged drought changes the bacterial growth response to rewetting, Soil Biol. Biochem., 88, 314–322, https://doi.org/10.1016/j.soilbio.2015.06.002, 2015.
Merbold, L., Ardö, J., Arneth, A., Scholes, R. J., Nouvellon, Y., de Grandcourt, A., Archibald, S., Bonnefond, J. M., Boulain, N., Brueggemann, N., Bruemmer, C., Cappelaere, B., Ceschia, E., El-Khidir, H. A. M., El-Tahir, B. A., Falk, U., Lloyd, J., Kergoat, L., Le Dantec, V., Mougin, E., Muchinda, M., Mukelabai, M. M., Ramier, D., Roupsard, O., Timouk, F., Veenendaal, E. M., and Kutsch, W. L.: Precipitation as driver of carbon fluxes in 11 African ecosystems, Biogeosciences, 6, 1027–1041, https://doi.org/10.5194/bg-6-1027-2009, 2009.
Moncrieff, J., Clement, R., Finnigan, J., and Meyers, T.: Averaging, Detrending, and Filtering of Eddy Covariance Time Series, in: Handbook of Micrometeorology, Atmos. Ocean. Sci. Lib., vol. 29, edited by: Lee, X., Massman, W., and Law, B., Springer, Dordrecht, https://doi.org/10.1007/1-4020-2265-4_2, 2004.
Moncrieff, J. B., Massheder, J. M., De Bruin, H., Elbers, J., Friborg, T., Heusinkveld, B., Kabat, P., Scott, S., Soegaard, H., and Verhoef, A.: A system to measure surface fluxes of momentum, sensible heat, water vapour and carbon dioxide, J. Hydrol., 188, 589–611, https://doi.org/10.1016/S0022-1694(96)03194-0, 1997.
Mosongo, P. S., Pelster, D. E., Li, X., Gaudel, G., Wang, Y., Chen, S., Li, W., Mburu, D., and Hu, C.: Greenhouse Gas Emissions Response to Fertilizer Application and Soil Moisture in Dry Agricultural Uplands of Central Kenya, Atmosphere, 13, 463, https://doi.org/10.3390/atmos13030463, 2022.
Muggeo, V. M. R.: Estimating regression models with unknown break-points, Statist. Med., 22, 3055–3071, https://doi.org/10.1002/sim.1545, 2003.
Nickerson, N. R.: Evaluating gas emission measurements using Minimum Detectable Flux (MDF), Eosene White papers, https://eosense.com/wp-content/uploads/2019/11/Eosense-white-paper-Minimum-Detectable-Flux.pdf (last access: 20 April 2024), 2016.
Owusu-Prempeh, N., Amekudzi, L. K., and Kyereh, B.: Assessment of soil carbon dioxide efflux from contrasting land uses in a semi-arid savannah ecosystem, northeastern Ghana (West Africa), Sci. Afr., 26, e02420, https://doi.org/10.1016/j.sciaf.2024.e02420, 2024.
Oyonarte, C., Rey, A., Raimundo, J., Miralles, I., and Escribano, P.: The use of soil respiration as an ecological indicator in arid ecosystems of the SE of Spain: Spatial variability and controlling factors, Ecol. Indic., 14, 40–49, https://doi.org/10.1016/j.ecolind.2011.08.013, 2012.
Padfield, D., Matheso, G., and Windram, F.: nls.multstart: Robust Non-Linear Regression using AIC Scores, R package version 2.0.0, CRAN (Comprehensive R Archive Network) [code], https://doi.org/10.32614/CRAN.package.nls.multstart, 2025.
Pelster, D., Rufino, M., Rosenstock, T., Mango, J., Saiz, G., Diaz-Pines, E., Baldi, G., and Butterbach-Bahl, K.: Smallholder farms in eastern African tropical highlands have low soil greenhouse gas fluxes, Biogeosciences, 14, 187–202, https://doi.org/10.5194/bg-14-187-2017, 2017.
Picarro Inc.: PICARRO G2508 CRDS Analyzer N2O + CH4+ CO2 + NH3+ H2O in Air, [datasheet], https://www.picarro.com/sites/default/files/product_documents/Picarro_G2508 Analyzer Datasheet_251208.pdf (last access: 20 April 2026), 2015.
Pontailler, J. Y., Hymus, G. J., and Drake, B. G.: Estimation of leaf area index using ground-based remote sensed NDVI measurements: Validation and comparison with two indirect techniques, Can. J. Remote Sens., 29, 381–387, https://doi.org/10.5589/m03-009, 2003.
Poyda, A., Reinsch, T., Skinner, R. H., Kluß, C., Loges, R., and Taube, F.: Comparing chamber and eddy covariance based net ecosystem CO2 exchange of fen soils, J. Plant Nutr. Soil Sci., 180, 252–266, https://doi.org/10.1002/jpln.201600447, 2017.
Qiu, R., Han, G., Li, S., Tian, F., Ma, X., and Gong, W.: Soil moisture dominates the variation of gross primary productivity during hot drought in drylands, Sci. Total Environ., 899, 165686, https://doi.org/10.1016/j.scitotenv.2023.165686, 2023.
Quansah, E., Mauder, M., Balogun, A. A., Amekudzi, L. K., Hingerl, L., Bliefernicht, J., and Kunstmann, H.: Carbon dioxide fluxes from contrasting ecosystems in the Sudanian Savanna in West Africa, Carbon Balance Manag., 10, 1, https://doi.org/10.1186/s13021-014-0011-4, 2015.
Rabbi, S. M. F., Warren, C., Swarbrick, B., Minasny, B., Mcbratney, A., and Young, I.: Microbial decomposition of organic matter and wetting–drying promotes aggregation in artificial soil but porosity increases only in wet-dry condition, Geoderma, 447, 116924, https://doi.org/10.1016/j.geoderma.2024.116924, 2024.
Rahimi, J., Ago, E. E., Ayantunde, A., Berger, S., Bogaert, J., Butterbach-Bahl, K., Cappelaere, B., Cohard, J.-M., Demarty, J., Diouf, A. A., Falk, U., Haas, E., Hiernaux, P., Kraus, D., Roupsard, O., Scheer, C., Srivastava, A. K., Tagesson, T., and Grote, R.: Modeling gas exchange and biomass production in West African Sahelian and Sudanian ecological zones, Geosci. Model Dev., 14, 3789–3812, https://doi.org/10.5194/gmd-14-3789-2021, 2021.
Raich, J. W., Lambers, H., and Oliver, D. J.: Respiration in Terrestrial Ecosystems, in: Treatise on Geochemistry, 2 ed., vol. 10, edited by: Karl, D. M. and Schlesinger, W. H., Elsevier, 613–649, https://doi.org/10.1016/B978-0-08-095975-7.00817-2, 2014.
Ramesh, T., Manjaiah, K. M., Tomar, J. M. S., and Ngachan, S. V.: Effect of multipurpose tree species on soil fertility and CO2 efflux under hilly ecosystems of Northeast India, Agr. Syst., 87, 1377–1388, https://doi.org/10.1007/s10457-013-9645-6, 2013.
R Core Team: R: A language and environment for statistical computing, R Foundation for Statistical Computing [software], Vienna, Austria, https://www.R-project.org (last access: 4 April 2024), 2023.
Reichle, D. E.: Energy flow in ecosystems, in: The Global Carbon Cycle and Climate Change, edited by: Reichle, D. E., Elsevier, 119–156, https://doi.org/10.1016/B978-0-12-820244-9.00008-1, 2020.
Reichstein, M., Rey, A., Freibauer, A., Tenhunen, J., Valentini, R., Banza, J., Casals, P., Cheng, Y., Grünzweig, J. M., Irvine, J., Joffre, R., Law, B. E., Loustau, D., Miglietta, F., Oechel, W., Ourcival, J.-M., Pereira, J. S., Peressotti, A., Ponti, F., Qi, Y., Rambal, S., Rayment, M., Romanyà, J., Rossi, F., Tedeschi, V., Tirone, G., Xu, M., and Yakir, D.: Modeling temporal and large-scale spatial variability of soil respiration from soil water availability, temperature and vegetation productivity indices, Global Biogeochem. Cy., 17, 1104, https://doi.org/10.1029/2003GB002035, 2003.
Reichstein, M., Falge, E., Baldocchi, D., Papale, D., Aubinet, M., Berbigier, P., Bernhofer, C., Buchmann, N., Gilmanov, T., Granier, A., Grünwald, T., Havránková, K., Ilvesniemi, H., Janous, D., Knohl, A., Laurila, T., Lohila, A., Loustau, D., Matteucci, G., Meyers, T., Miglietta, F., Ourcival, J.-M., Pumpanen, J., Rambal, S., Rotenberg, E., Sanz, M., Tenhunen, J., Seufert, G., Vaccari, F., Vesala, T., Yakir, D., and Valentini, R.: On the separation of net ecosystem exchange into assimilation and ecosystem respiration: Review and improved algorithm, Glob. Change Biol., 11, 1424–1439, https://doi.org/10.1111/j.1365-2486.2005.001002.x, 2005.
Reum, F., Gerbig, C., Lavric, J. V., Rella, C. W., and Göckede, M.: Correcting atmospheric CO2 and CH4 mole fractions obtained with Picarro analyzers for sensitivity of cavity pressure to water vapor, Atmos. Meas. Tech., 12, 1013–1027, https://doi.org/10.5194/amt-12-1013-2019, 2019.
Rheault, K., Riis Christiansen, J., and Steenberg Larsen, K.: The role of tree species and microbes for the development of net greenhouse gas fluxes from soils after afforestation of agricultural lands, EGU General Assembly 2024, Vienna, Austria, 14–19 Apr 2024, EGU24-9718, https://doi.org/10.5194/egusphere-egu24-9718, 2024.
Richardson, J., Chatterjee, A., and Darrel Jenerette, G.: Optimum temperatures for soil respiration along a semi-arid elevation gradient in southern California, Soil Biol. Biochem., 46, 89–95, https://doi.org/10.1016/j.soilbio.2011.11.008, 2012.
Riederer, M., Serafimovich, A., and Foken, T.: Net ecosystem CO2 exchange measurements by the closed chamber method and the eddy covariance technique and their dependence on atmospheric conditions, Atmos. Meas. Tech., 7, 1057–1064, https://doi.org/10.5194/amt-7-1057-2014, 2014.
Roby, M. C., Scott, R. L., Biederman, J. A., Smith, W. K., and Moore, D. J. P.: Response of soil carbon dioxide efflux to temporal repackaging of rainfall into fewer, larger events in a semiarid grassland, Front. Environ. Sci., 10, https://doi.org/10.3389/fenvs.2022.940943, 2022.
Rolo, V., Rivest, D., Maillard, É., and Moreno, G.: Agroforestry potential for adaptation to climate change: A soil-based perspective, Soil Use Manag., 39, 1006–1032, https://doi.org/10.1111/sum.12932, 2023.
Rong, Y., Ma, L., Johnson, D., and Yuan, F.: Soil respiration patterns for four major land-use types of the agro-pastoral region of northern China, Agr. Ecosyst Environ., 213, 142–150, https://doi.org/10.1016/j.agee.2015.08.002, 2015.
Rosenstock, T. S., Mpanda, M., Pelster, D. E., Butterbach-Bahl, K., Rufino, M. C., Thiong'o, M., Mutuo, P., Abwanda, S., Rioux, J., Kimaro, A. A., and Neufeldt, H.: Greenhouse gas fluxes from agricultural soils of Kenya and Tanzania: GHG Fluxes From Agricultural Soils of East Africa, J. Geophys. Res.-Biogeo., 121, 1568–1580, https://doi.org/10.1002/2016JG003341, 2016.
Roupsard, O., Ferhi, A., Granier, A., Pallo, F., Depommier, D., Mallet, B., Joly, H. I., and Dreyer, E.: Reverse Phenology and Dry-Season Water Uptake by Faidherbia albida (Del.) A. Chev. in an Agroforestry Parkland of Sudanese West Africa, Funct. Ecol., 13, 460–472, https://doi.org/10.1046/j.1365-2435.1999.00345.x, 1999.
Roupsard, O., Audebert, A., Ndour, A. P., Clermont-Dauphin, C., Agbohessou, Y., Sanou, J., Koala, J., Faye, E., Sambakhe, D., Jourdan, C., le Maire, G., Tall, L., Sanogo, D., Seghieri, J., Cournac, L., and Leroux, L.: How far does the tree affect the crop in agroforestry? New spatial analysis methods in a Faidherbia parkland, Agr. Ecosyst. Environ, 296, 106928, https://doi.org/10.1016/j.agee.2020.106928, 2020.
Sarr, M. S., Diouf, K., Roupsard, O., Rocheteau, A., Orange, D., Jourdan, C., Diehdiou, I., Seghieri, J., and Do, F. C.: Estimation of seasonal water use of Faidherbia albida (Delile) A. Chev. in a Sahelian agroforestry parkland, Biotechnol. Agron. Soc. Environ., 27, 196–204, https://doi.org/10.25518/1780-4507.20512, 2023.
Schimel, J., Balser, T. C., and Wallenstein, M.: Microbial stress-response physiology and its implications for ecosystem function, Ecology, 88, 1386–1394, https://doi.org/10.1890/06-0219, 2007.
Sida, T. S., Baudron, F., Kim, H., and Giller, K. E.: Climate-smart agroforestry: Faidherbia albida trees buffer wheat against climatic extremes in the Central Rift Valley of Ethiopia, Agr. Forest Meteorol., 248, 339–347, https://doi.org/10.1016/j.agrformet.2017.10.013, 2018.
Siegwart, L., Bertrand, I., Roupsard, O., Duthoit, M., and Jourdan, C.: Root litter decomposition in a sub-Sahelian agroforestry parkland dominated by Faidherbia albida, J. Arid Environ., 198, 104696, https://doi.org/10.1016/j.jaridenv.2021.104696, 2022.
Siegwart, L., Bertrand, I., Roupsard, O., and Jourdan, C.: Contribution of tree and crop roots to soil carbon stocks in a Sub-Sahelian agroforestry parkland in Senegal, Agr. Ecosyst. Environ., 352, 108524, https://doi.org/10.1016/j.agee.2023.108524, 2023.
Sileshi, G. W.: The magnitude and spatial extent of influence of Faidherbia albida trees on soil properties and primary productivity in drylands, J. Arid Environ., 132, 1–14, https://doi.org/10.1016/j.jaridenv.2016.03.002, 2016.
Sileshi, G. W., Teketay, D., Gebrekirstos, A., and Hadgu, K.: Sustainability of Faidherbia albida-Based Agroforestry in Crop Production and Maintaining Soil Health, in: Agroforestry for Degraded Landscapes: Recent Advances and Emerging Challenges, vol. 2, edited by: Dagar, J. C., Gupta, S. R., and Teketay, D., Springer, Singapore, 349–369, https://doi.org/10.1007/978-981-15-6807-7_12, 2020.
Singh, S., Mayes, M., Kivlin, S., and Jagadamma, S.: How the Birch Effect differs in mechanisms and magnitudes due to soil texture, Soil Biol. Biochem., 179, 108973, https://doi.org/10.1016/j.soilbio.2023.108973, 2023.
Soudani, K., Hmimina, G., Delpierre, N., Pontailler, J. Y., Aubinet, M., Bonal, D., Caquet, B., de Grandcourt, A., Burban, B., Flechard, C., Guyon, D., Granier, A., Gross, P., Heinesh, B., Longdoz, B., Loustau, D., Moureaux, C., Ourcival, J. M., Rambal, S., Saint André, L., and Dufrene, E.: Ground-based Network of NDVI measurements for tracking temporal dynamics of canopy structure and vegetation phenology in different biomes, Remote Sens. Environ., 123, 234–245, https://doi.org/10.1016/j.rse.2012.03.012, 2012.
Stephen, E. A., Evans, K. D., and Akwasi, A. A.: Effects of Faidherbia albida on some important soil fertility indicators on agroforestry parklands in the semi-arid zone of Ghana, Afr. J. Agr. Res., 15, 256–268, https://doi.org/10.5897/ajar2019.14617, 2020.
Stetter, C. and Sauer, J.: Tackling climate change: Agroforestry adoption in the face of regional weather extremes, Ecol. Econ., 224, 108266, https://doi.org/10.1016/j.ecolecon.2024.108266, 2024.
Stojanović, M., Jocher, G., Kowalska, N., Szatniewska, J., Zavadilová, I., Urban, O., Čáslavský, J., Horáček, P., Acosta, M., Pavelka, M., and Marshall, J. D.: Disaggregation of canopy photosynthesis among tree species in a mixed broadleaf forest, Tree Physiol., 44, tpae064, https://doi.org/10.1093/treephys/tpae064, 2024.
Tagesson, T., Fensholt, R., Cropley, F., Guiro, I., Horion, S., Ehammer, A., and Ardö, J.: Dynamics in carbon exchange fluxes for a grazed semi-arid savanna ecosystem in West Africa, Agr. Ecosyst. Environ., 205, 15–24, https://doi.org/10.1016/j.agee.2015.02.017, 2015.
Tagesson, T., Ardö, J., Guiro, I., Cropley, F., Mbow, C., Horion, S., Ehammer, A., Mougin, E., Delon, C., Galy-Lacaux, C., and Fensholt, R.: Very high CO2 exchange fluxes at the peak of the rainy season in a West African grazed semi-arid savanna ecosystem, Geografisk Tidsskrift – Dan. J. of Geogr., 116, 93–109, https://doi.org/10.1080/00167223.2016.1178072, 2016a.
Tagesson, T., Fensholt, R., Cappelaere, B., Mougin, E., Horion, S., Kergoat, L., Nieto, H., Mbow, C., Ehammer, A., Demarty, J., and Ardö, J.: Spatiotemporal variability in carbon exchange fluxes across the Sahel, Agr. Forest Meteorol., 226–227, 108–118, https://doi.org/10.1016/j.agrformet.2016.05.013, 2016b.
Tang, J., Bolstad, P. V., Desai, A. R., Martin, J. G., Cook, B. D., Davis, K. J., and Carey, E. V.: Ecosystem respiration and its components in an old-growth forest in the Great Lakes region of the United States, Agr. Forest Meteorol., 148, 171–185, https://doi.org/10.1016/j.agrformet.2007.08.008, 2008.
Tang, X., Carvalhais, N., Moura, C., Ahrens, B., Koirala, S., Fan, S., Guan, F., Zhang, W., Gao, S., Magliulo, V., Buysse, P., Liu, S., Chen, G., Yang, W., Yu, Z., Liang, J., Shi, L., Pu, S., and Reichstein, M.: Global variability of carbon use efficiency in terrestrial ecosystems, Biogeosciences Discuss. [preprint], https://doi.org/10.5194/bg-2019-37, 2019.
Tucker, C. L. and Reed, S. C.: Low soil moisture during hot periods drives apparent negative temperature sensitivity of soil respiration in a dryland ecosystem: A multi-model comparison, Biogeochemistry, 128, 155–169, https://doi.org/10.1007/s10533-016-0200-1, 2016.
Unger, S., Máguas, C., Pereira, J. S., David, T. S., and Werner, C.: The influence of precipitation pulses on soil respiration – Assessing the “Birch effect” by stable carbon isotopes, Soil Biol. Biochem., 42, 1800–1810, https://doi.org/10.1016/j.soilbio.2010.06.019, 2010.
Valujeva, K., Pilecka-Ulcugaceva, J., Skiste, O., Liepa, S., Lagzdins, A., and Grinfelde, I.: Soil tillage and agricultural crops affect greenhouse gas emissions from Cambic Calcisol in a temperate climate, Acta. Agr. Scand. B-S-P., 72, 835–846, https://doi.org/10.1080/09064710.2022.2097123, 2022.
Van Haren, J. L. M., De Oliveira, R. C., Restrepo-Coupe, N., Hutyra, L., De Camargo, P. B., Keller, M., and Saleska, S. R.: Do plant species influence soil CO2 and N2 O fluxes in a diverse tropical forest?, J. Geophys. Res.-Biogeo., 115, G03010, https://doi.org/10.1029/2009JG001231, 2010.
Vargas, R., Enrique, S. C. P., Serrano-Ortiz, P., Yuste, J. C., Domingo, F., López-Ballesteros, A., and Oyonarte, C.: Hot-moments of soil CO2 efflux in a water-limited grassland, Soil Syst., 2, 1–18, https://doi.org/10.3390/soilsystems2030047, 2018.
Vickers, D. and Mahrt, L.: Quality Control and Flux Sampling Problems for Tower and Aircraft Data, J. Atmos. Oceanic Technol., 14, 512–526, https://doi.org/10.1175/1520-0426(1997)014<0512:QCAFSP>2.0.CO;2, 1997.
Wachiye, S., Merbold, L., Vesala, T., Rinne, J., Räsänen, M., Leitner, S., and Pellikka, P.: Soil greenhouse gas emissions under different land-use types in savanna ecosystems of Kenya, Biogeosciences, 17, 2149–2167, https://doi.org/10.5194/bg-17-2149-2020, 2020.
Wang, M., Guan, D.-X., Han, S.-J., and Wu, J.-L.: Comparison of eddy covariance and chamber-based methods for measuring CO2 flux in a temperate mixed forest, Tree Physiol., 30, 149–163, https://doi.org/10.1093/treephys/tpp098, 2010.
Waring, E., Quinn, M., McNamara, A., Arino de la Rubia, E., Zhu, H., and Ellis, S.: Skimr: Compact and flexible summaries of data, R package version, 2, CRAN (Comprehensive R Archive Network), https://docs.ropensci.org/skimr/ (last access: 24 August 2024), 2022.
Warren, C. R.: Response of osmolytes in soil to drying and rewetting, Soil Biol. Biochem., 70, 22–32, https://doi.org/10.1016/j.soilbio.2013.12.008, 2014.
Webb, E. K., Pearman, G. I., and Leuning, R.: Correction of flux measurements for density effects due to heat and water vapour transfer, Q. J. R. Meteorol. Soc., 106, 85–100, https://doi.org/10.1002/qj.49710644707, 1980.
Wieckowski, A., Vestin, P., Ardö, J., Roupsard, O., Ndiaye, O., Diatta, O., Ba, S., Agbohessou, Y., Fensholt, R., Verbruggen, W., Gebremedhn, H. H., and Tagesson, T.: Eddy covariance measurements reveal a decreased carbon sequestration strength 2010–2022 in an African semiarid savanna, Glob. Change Biol., 30, e17509, https://doi.org/10.1111/gcb.17509, 2024.
Wild, J., Kopecký, M., Macek, M., Šanda, M., Jankovec, J., and Haase, T.: Climate at ecologically relevant scales: A new temperature and soil moisture logger for long-term microclimate measurement, Agr. Forest Meteorol., 268, 40–47, https://doi.org/10.1016/j.agrformet.2018.12.018, 2019.
Williams, C. A., Hanan, N. P., Neff, J. C., Scholes, R. J., Berry, J. A., Denning, A. S., and Baker, D. F.: Africa and the global carbon cycle, Carbon Balance Manage., 2, https://doi.org/10.1186/1750-0680-2-3, 2007.
Williams, C. A., Hanan, N., Scholes, R. J., and Kutsch, W.: Complexity in water and carbon dioxide fluxes following rain pulses in an African savanna, Oecologia, 161, 469–480, https://doi.org/10.1007/s00442-009-1405-y, 2009.
Wutzler, T., Lucas-Moffat, A., Migliavacca, M., Knauer, J., Sickel, K., Šigut, L., Menzer, O., and Reichstein, M.: Basic and extensible post-processing of eddy covariance flux data with REddyProc, Biogeosciences, 15, 5015–5030, https://doi.org/10.5194/bg-15-5015-2018, 2018.
Xenakis, G.: FREddyPro: Post-Processing EddyPro Full Output File, R package version 1.0.1, Edinburgh, UK, https://www.rdocumentation.org/packages/FREddyPro/versions/1 (last access: 20 April 2026), 2016.
Xue, H. and Tang, H.: Responses of soil respiration to soil management changes in an agropastoral ecotone in Inner Mongolia, China, Ecol. Evol., 8, 220–230, https://doi.org/10.1002/ece3.3659, 2018.
Yan, L., Chen, S., Xia, J., and Luo, Y.: Precipitation regime shift enhanced the rain pulse effect on soil respiration in a semi-arid steppe, PLoS ONE, 9, https://doi.org/10.1371/journal.pone.0104217, 2014.
Yu, H., Xu, Z., Zhou, G., and Shi, Y.: Soil carbon release responses to long-term versus short-term climatic warming in an arid ecosystem, Biogeosciences, 17, 781–792, https://doi.org/10.5194/bg-17-781-2020, 2020.
Yu, X., Zha, T., Pang, Z., Wu, B., Wang, X., Chen, G., Li, C., Cao, J., Jia, G., Li, X., and Wu, H.: Response of soil respiration to soil temperature and moisture in a 50-year-old oriental arborvitae plantation in China, PLoS ONE, 6, https://doi.org/10.1371/journal.pone.0028397, 2011.
Zaman, M., Kleineidam, K., Bakken, L., Berendt, J., Bracken, C., Butterbach-Bahl, K., Cai, Z., Chang, S. X., Clough, T., Dawar, K., Ding, W. X., Dörsch, P., dos Reis Martins, M., Eckhardt, C., Fiedler, S., Frosch, T., Goopy, J., Görres, C.-M., Gupta, A., Henjes, S., Hofmann, M. E. G., Horn, M. A., Jahangir, M. M. R., Jansen-Willems, A., Lenhart, K., Heng, L., Lewicka-Szczebak, D., Lucic, G., Merbold, L., Mohn, J., Molstad, L., Moser, G., Murphy, P., Sanz-Cobena, A., Šimek, M., Urquiaga, S., Well, R., Wrage-Mönnig, N., Zaman, S., Zhang, J., and Müller, C.: Greenhouse Gases from Agriculture, in: Measuring emission of agricultural greenhouse gases and developing mitigation options using nuclear and related techniques, edited by: Zaman, M., Hang, L., Müller, C., Springer, Cham, https://doi.org/10.1007/978-3-030-55396-8_1, 2021.
Zeileis, A., Grothendieck, G., Ryan, J. A., Ulrich, J. M., and Andrews, F.: Package 'zoo': S3 Infrastructure for Regular and Irregular Time Series (Z's Ordered Observations) (version 1.8-12), R Package, R-Forge [code], https://zoo.R-Forge.R-project.org/ (last access: 30 July 2024), 2024.
Zhang, Xu., Bi, J., Zhu, D., and Meng, Z.: Seasonal variation of net ecosystem carbon exchange and gross primary production over a Loess Plateau semi-arid grassland of northwest China, Sci. Rep. 14, 2916, https://doi.org/10.1038/s41598-024-52559-6, 2024a.
Zhang, Xi., Ramakanth, K. K., and Long, Y.: The biomechanics of turgor pressure, Curr. Biol., 34, R986–R991, https://doi.org/10.1016/j.cub.2024.07.013, 2024b.
Zhao, C., Miao, Y., Yu, C., Zhu, L., Wang, F., Jiang, L., Hui, D., and Wan, S.: Soil microbial community composition and respiration along an experimental precipitation gradient in a semiarid steppe, Sci. Rep., 6, 24317, https://doi.org/10.1038/srep24317, 2016.
Zhou, Y., Williams, C. A., Lauvaux, T., Feng, S., Baker, I. T., Wei, Y., Denning, A. S., Keller, K., and Davis, K. J.: ACT-America: Gridded Ensembles of Surface Biogenic Carbon Fluxes, 2003–2019 (Version 1.1), ORNL Distributed Active Archive Center, https://doi.org/10.3334/ORNLDAAC/1675, 2019.
Zhou, Y., Williams, C. A., Lauvaux, T., Davis, K. J., Feng, S., Baker, I., Denning, S., and Wei, Y.: A multiyear gridded data ensemble of surface biogenic carbon fluxes for North America: Evaluation and analysis of results, J. Geophys. Res.-Biogeo., 125, e2019JG005314, https://doi.org/10.1029/2019JG005314, 2020.