the Creative Commons Attribution 4.0 License.
the Creative Commons Attribution 4.0 License.
 | 06 Mar 2026
Modelling long-term soil organic carbon sequestration under varying environmental drivers and internal protection mechanisms – towards a digital twin
W. Marijn van der Meij
Peter Finke
Soil organic carbon (SOC) plays a large role in sustainable soil management and climate change mitigation. To understand the potential of soils to sequester additional carbon requires detailed knowledge of the underlying processes and drivers. In this study, we use soil evolution model SoilGen3.8.2 to assess the effects of environmental drivers (bioclimate, erosion level and land use) and four protection mechanisms on long-term SOC dynamics.
The protection mechanisms (aggregation, clay mineralogy, microporosity and metal oxyhydroxides, MOOHs) showed large differences with different temporal patterns, where aggregation and clay mineralogy dominated during 10 ka of pedogenesis and MOOHs had a negligible effect. Ranking internal and external controls on SOC stocks revealed a decreasing influence of bioclimate > protection mechanism > erosion rate > land use > time.
Topsoil and subsoil SOC recovery after agricultural use revealed different dynamics, controlled by the history of environmental drivers and pedogenesis. Natural SOC recovery showed lowest rates for subsoils and highest rates for topsoils, with a strong control of erosion and pedogenetic history. The addition of ground rock of different mineralogies to enhance SOC sequestration had some effect, mainly for goethite, montmorillonite and a temporary effect of calcite. Our simulations demonstrate how SoilGen can improve understanding of soil processes, while also highlighting knowledge gaps, such as missing experimental insights in key SOC stabilization mechanisms.
Our study shows that soil models such as SoilGen cannot act as digital twins of a soil that represent the entire soil, as not all processes and parameters of the complex soil system are represented. These models can, however, form the basis of topical digital twins that target specific processes or properties. We provide a roadmap for developing such topical digital twins and recommend to start from a complex model that accounts for pedogenetic history.
- Article
(4234 KB) - Full-text XML
- BibTeX
- EndNote


Soils offer a large potential for carbon sequestration, the storage of atmospheric carbon in soils. Enhanced carbon sequestration in soils could partly or completely counterbalance global anthropogenic carbon emissions (Minasny et al., 2017; Nazir et al., 2024). This resulted in incentive legislation that promotes carbon storage through, amongst others, carbon farming (European Commission, 2024, article 4–7), which aims at enhanced, long-term or permanent carbon storage in soils. This requires the development and general acceptance of instruments to evaluate, monitor and predict carbon storage under changing global conditions and link these to implemented or planned soil management. Process knowledge, still in development, is needed for reliable instruments, especially if long-term storage is to be estimated with confidence. Comprehensive simulation models that are data-aware (i.e. that can integrate real-time field data to improve accuracy, Maimour et al., 2024) are needed. Such model-data combinations where information flows between model and (field) data in both ways are often coined digital twins of the field soil. Digital twins allow for dynamic adaptation of the model to changed field conditions while allowing predictions of field conditions and parameters. Here, we aim at using a comprehensive soil development model as first step towards such a digital twin.
Soil organic carbon (SOC) sequestration can be enhanced by promoting natural processes through soil management (Feng et al., 2024). For example, the flux of carbon into soils may be increased by increasing organic carbon inputs from plant residues (Alvarez, 2024) or through removal of atmospheric CO2 by enhanced rock and mineral weathering (Buss et al., 2024) and subsequent sequestration in inorganic form. Additionally, residence times of existing SOC can be prolonged by bonding with soil mineral components (Georgiou et al., 2022) or by increasing the soil microbial bio- and necromass (Kou et al., 2023). To effectively harness these natural mechanisms for SOC sequestration, it is essential to increase our limited understanding of the underlying processes, as well as how they are regulated or limited by environmental factors (Maenhout et al., 2024). It is important here to consider differences in topsoil and subsoil SOC stocks, as subsoils (below 25 cm depth) often contain larger and more stable carbon stocks than topsoils (Zhang et al., 2025), which may be regulated by other controls than SOC in topsoils (Salomé et al., 2010; Hicks Pries et al., 2023). For sustainable and long-term carbon sequestration, the subsoil thus may play an essential role, while it is often overlooked in SOC monitoring studies.
A lot is still unknown about long-term SOC dynamics, as monitoring campaigns cover only decadal timescales and often focus only on the topsoil and ignore the subsoil (van Wesemael et al., 2024). Also, the role of climate, land use and management in SOC dynamics is difficult to assess on a generic level, as comparative sites with only changes in some of the soil forming factors are rare. An alternative is provided by soil evolution models (SEMs). SEMs simulate the long-term (annual – millennial) development of soils and their properties as a function of different environmental drivers (Minasny et al., 2015). SEMs cover different spatial and temporal scales and are designed to simulate one or multiple soil processes. The models are continuously adapted to incorporate additional environmental drivers, which increases their applicability across diverse geographical and topographical settings, and under effects of global change (Van der Meij et al., 2018; Meng et al., 2022). Models simulating a detailed soil organic carbon cycle commonly focus on the pedon scale. Models such as RothC (Jenkinson and Coleman, 1994) and ICBM (Andrén and Kätterer, 1997) have been used and extended to simulate soil organic carbon dynamics in soils under different environmental drivers and soil management (Peltre et al., 2012; Coucheney et al., 2025), while other models aim for a better representation of measurable carbon pools in the models (e.g. Millennial, Abramoff et al., 2022), or aim at better calibration by including additional carbon metrics to reduce equifinality (Van de Broek et al., 2025). More holistic models such as SoilGen simulate the development of the entire soil profile by representing different processes and soil variables (Finke, 2024a, p. 3), including SOC stocks. Since the soil variables are connected via various feedback mechanisms, SoilGen can be considered a digital representation of a field soil if field data suffice to meet input requirements for initialization, at the model boundary and for accuracy assessment and model tuning.
In this contribution, we simulate the evolution of SOC stocks over long timescales (centuries – millennia) under a range of external environmental drivers acting at the modelled soil boundary and internal protection mechanisms that that are active inside the modelled soil, with the aim to identify and quantify controls of long-term SOC sequestration and stabilization. More specifically, we aim to:
- 1.
assess the relative importance of the external drivers (climate, erosion and land use) and internal SOC protection mechanisms on SOC sequestration and stabilization;
- 2.
evaluate the use of SoilGen as a digital twin of soils to study future trajectories in soil properties.
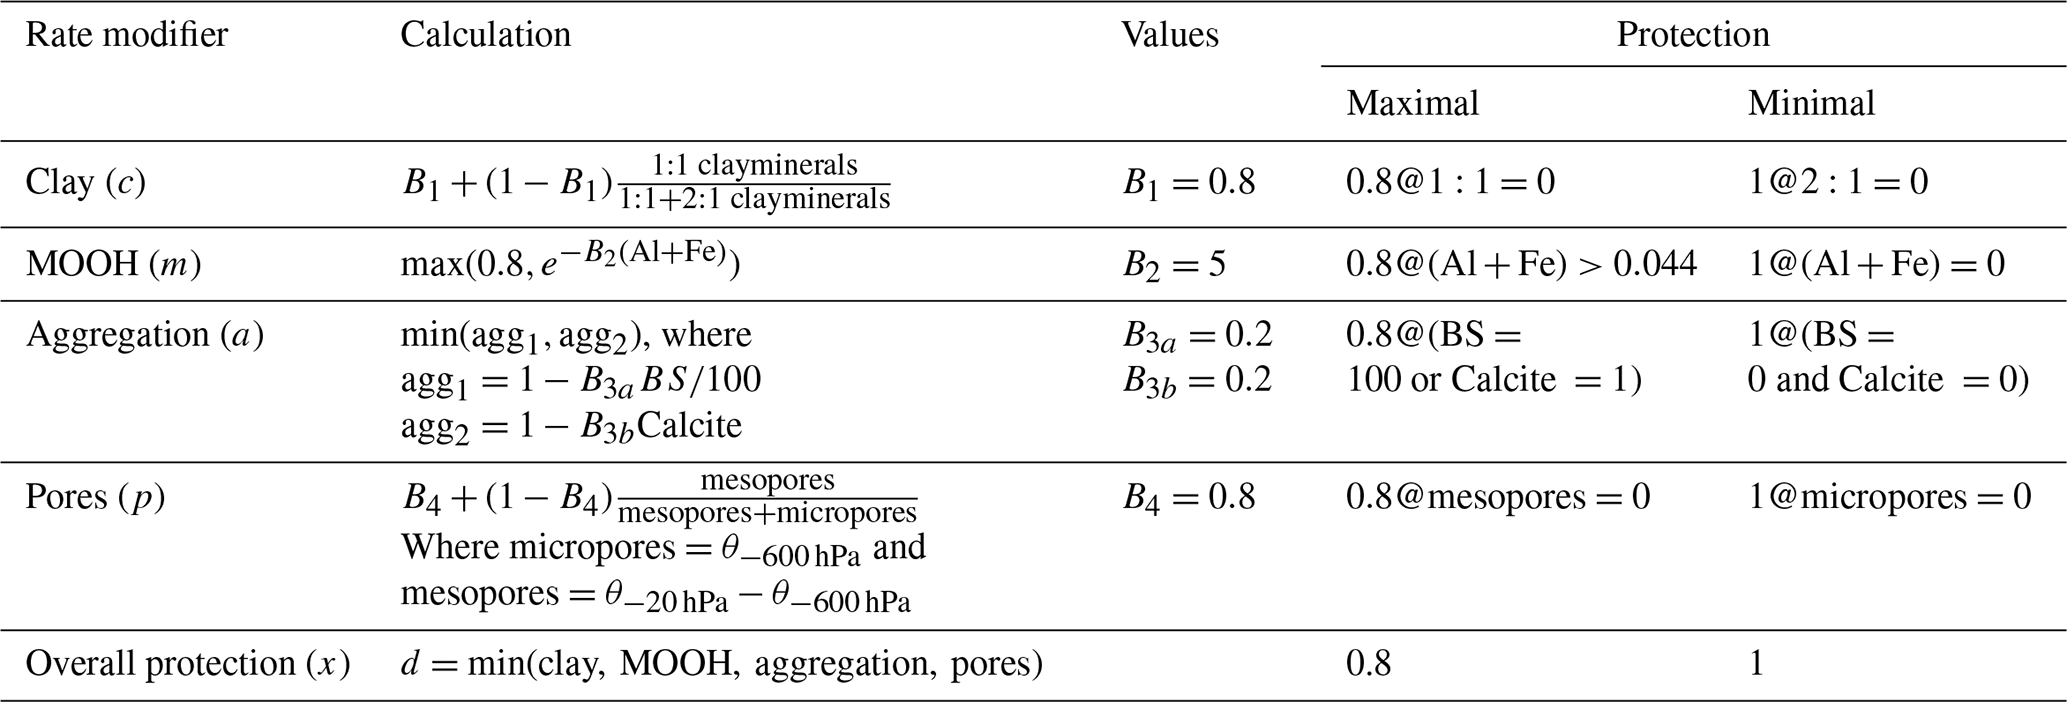
Table 1Setting of the four SOC protection mechanisms in SoilGen. Rate modifiers are within the range of 0.8 and 1. Units are described in the text.
2.1 SoilGen
2.1.1 Model overview
For our simulations, we used SoilGen version 3.8.2 (Finke, 2024a, b). SoilGen simulates a substantial number of soil development processes (e.g. water and solute flow, clay migration, physical and chemical weathering, mineral neoformation, element cycling, plant processes and mixing processes) and their mutual feedbacks over temporal extents from years to millennia. Processes of SOC-turnover follow the concepts of the RothC-model (Jenkinson and Coleman, 1994), in which the fate of dead organic matter is simulated in five different pools (Decomposable Plant Material, Resistant Plant Material, Biomass, Humus and Inert Organic Material). The pool Inert Organic Material has limited meaning in a millennium-scale model and is seldom used. As in RothC, the decay rate constants of the remaining four SOC-pools are subject to dynamic linear correction using soil temperature, soil moisture deficit and crop cover varying along the timeline and controlled by the simulation of the other processes in the model. A detailed description of the SOC module of SoilGen is provided in Appendix A.
SoilGen requires input of the initial soil properties and boundary forcings (i.e. climate, vegetation, fertilization, bioturbation) and can handle events such as erosion, sedimentation and tillage. The model outputs 109 soil variables (chemical, mineralogical and physical) per year and depth interval, including the litter layer, for the entire soil profile and potentially underlying bedrock. Various processes represented in the model have undergone sensitivity analysis, calibration and comparison with independent field data: decalcification (Finke and Hutson, 2008), clay migration (Finke, 2012; Finke et al., 2015; Ranathunga et al., 2022; Finke, 2024a), fate of SOC (Yu et al., 2013; Finke et al., 2019; Anindita et al., 2023), and weathering (Opolot and Finke, 2015; Anindita et al., 2023). Applications of SoilGen cover a wide variety of climates, parent materials and environmental settings, including the temperate and continental climates, loess parent materials and agricultural and natural land uses which were simulated in this study (Sect. 2.3). Examples are provided in Finke (2024a).
2.1.2 Environmental drivers
Decay of SOC responds, among others, to the soil moisture status and soil temperature. SoilGen uses inter-daily rhythms of temperature, precipitation and potential evapotranspiration to downscale annual and monthly climate inputs at the upper model boundary that subsequently drive process-based water flow and heat flow submodels. Climate inputs can be generated by data-driven climate reconstructions (e.g. Davis et al., 2003) and using climate models (e.g. Ranathunga et al., 2022). Additionally, fertilization, erosion, sedimentation and plowing events are annual inputs that also drive the SOC-status. Sensitivity studies demonstrated a sensitivity of SoilGen to climate and agricultural practices (Keyvanshokouhi et al., 2016) and dust deposition (Ranathunga et al., 2022) for various soil properties, including SOC.
2.1.3 SOC protection mechanisms
Finke et al. (2019) and Anindita et al. (2023) found that additional rate modifiers, calculated via linear relations to geochemical data, improved simulation quality of SOC stocks in steppe grassland and volcanic soils, respectively. Using this insight, the loss by decay (lossY, Mg ha−1) of a SOC pool of size Y (Mg ha−1) during ∂t (a) was modified according to Eq. (1),
where R is the reference decay rate constant (a−1), with dimensionless rate modifiers a for temperature, b for topsoil moisture deficit, c for crop cover and d for hydrogeochemistry. Rate modifiers are in the range 0–1, where a value of 1 indicates no effect. SoilGen version 3.8.2 (Finke, 2024a, p. 40) includes four mechanisms to calculate rate modifier d (Table 1):
Bonding by clay mineral surface-cation bridges-SOC (clay). Strong bonding by high activity 2:1 clay minerals, using their mass fractions, slows down decay.
Stabilisation by metal oxyhydroxides (MOOHs). Co-precipitation of SOC with Al and Fe cations slows down decay (Scheel et al., 2008) and adsorption of SOC to Al and Fe oxyhydroxides metal surfaces was found to be a major driver in global SOC stocks and stabilization (Jia et al., 2024). Here, we proxied co-precipitation and adsorption by the summed concentrations of Fe3+, Fe2+ and Al3+ (mmol dm−3) in the soil solution.
Protection by limited intra-aggregate accessibility (aggregates). Strong aggregation driven by soil chemistry (calcite content as mass fraction, base saturation as %), and carried out by macro-organisms, reduces the intra-aggregate accessibility of SOC to micro-organisms.
Protection by limited accessibility of micro-organisms due to pore-size (pores), which is a function of soil texture and SOC (Andrén and Kätterer, 1997; Meurer et al., 2020), where a high microporosity lowers decay. In SoilGen, porosity is dynamically assessed by the water retention characteristic (h-θ relation) as estimated for each simulation year by a pedotransfer function (Wösten et al., 1999).
The overall rate modifier d combines the effects of the four above mechanisms by taking the minimal value (thus maximal protection) of clay, MOOH, aggregation and pores, which varies over model runtime. This means that profiles of clay content and mineralogy, fate of Fe and Al, calcite content and base saturation, texture and SOC must be dynamically simulated as well and thus a complex model is a necessity. Table 1 provides a summary of the calculation of the hydrogeochemical decay rate modifiers, while Appendix A3 provides a detailed description. Note that these mechanisms have impacts limited to the range 0.8–1, which are loosely based on first academic insights in these processes (e.g. Andrén and Kätterer, 1997; Scheel et al., 2008; Meurer et al., 2020). They should be constrained and calibrated when new insights arise. Furthermore, choosing all four ranges between 0.8 (maximal protection) and 1.0 (no protection) will give equal potential effect of each mechanism, which is motivated by the fact that this is a sensitivity analysis.
2.2 Initial conditions and model parameters
The model inputs (this Section) and simulation scenarios (next Section) are roughly based on real-world settings, but are simplified and generalized to facilitate the evaluation and comparison of model outputs for the different scenarios. The model settings described here are shared among all simulation scenarios, with the exception of vegetation type and land use, which are shared by a selection of the scenarios.
We base our simulations on European loess soils, with a homogeneous parent material (at the start of the simulations; 10 ka before now) of a silt loam (16 % clay, 67 % silt, 17 % sand) with a bulk density of 1.22 kg dm−3. The initial calcite content was 9.9 mass % and the Cation Exchange Capacity was 90 soil. The mineralogy was dominantly quartz, with substantial amounts of feldspars and minor amounts of muscovite, chlorite, illite and montmorillonite. The initial soil profiles are divided into soil layers of 5 cm. The initial thicknesses differed per erosion scenario and were chosen to preserve a soil of at least 150 cm at the end of the simulations.
SOC input in the soils was based on an estimation of the Net Primary Production (NPP, ), reduced for losses (e.g. growth, harvest), using a metamodel based on LPJ-GUESS (Sallaba et al., 2015), taking as input temperature and precipitation in winter and summer and a partial CO2 pressure of 0.00038 bar (10 ka before now). The actual SOC input will be called NPPred. During the simulations, land use can change between natural vegetation, extensive agriculture and intensive agriculture. For vegetation under natural conditions, we assumed that all NPPred enters the SOC-decomposition pathway in the form of root- and leaf litter. For agricultural vegetation, the NPPred was reduced to represent the crop residues that enter the SOC decomposition pathway: assuming cereal crops, a fairly low yield and documented harvest indices, 30 % was harvested under extensive agriculture (Sect. 2.3). Similarly, 55 % is harvested under intensive agriculture. The C-inputs are vertically variable, depending on the vertical root distribution and the presence of an ectorganic layer in the case of forest vegetation.
SOC is redistributed vertically in the soil profiles by two processes: (i) Bioturbation, with a fixed rate of 11.9 , mixes soil material over the top 40 cm of the soil. Over the first 25 cm it is (annually) 0.3 % of the mass, decreasing linearly with depth top 0 % at 40 cm depth. (ii) Plowing in the agricultural periods redistributes SOC in the plowed layer, where 50 % of the mass is mixed during each plowing event.
Each soil layer received the same model parameters, such as the SOC decay rate constants. By vertical variation in the drivers of the rate modifiers (e.g. moisture, temperature and drivers mentioned in Sect. 2.1.3), actual degradation rates varied along the soil profile.
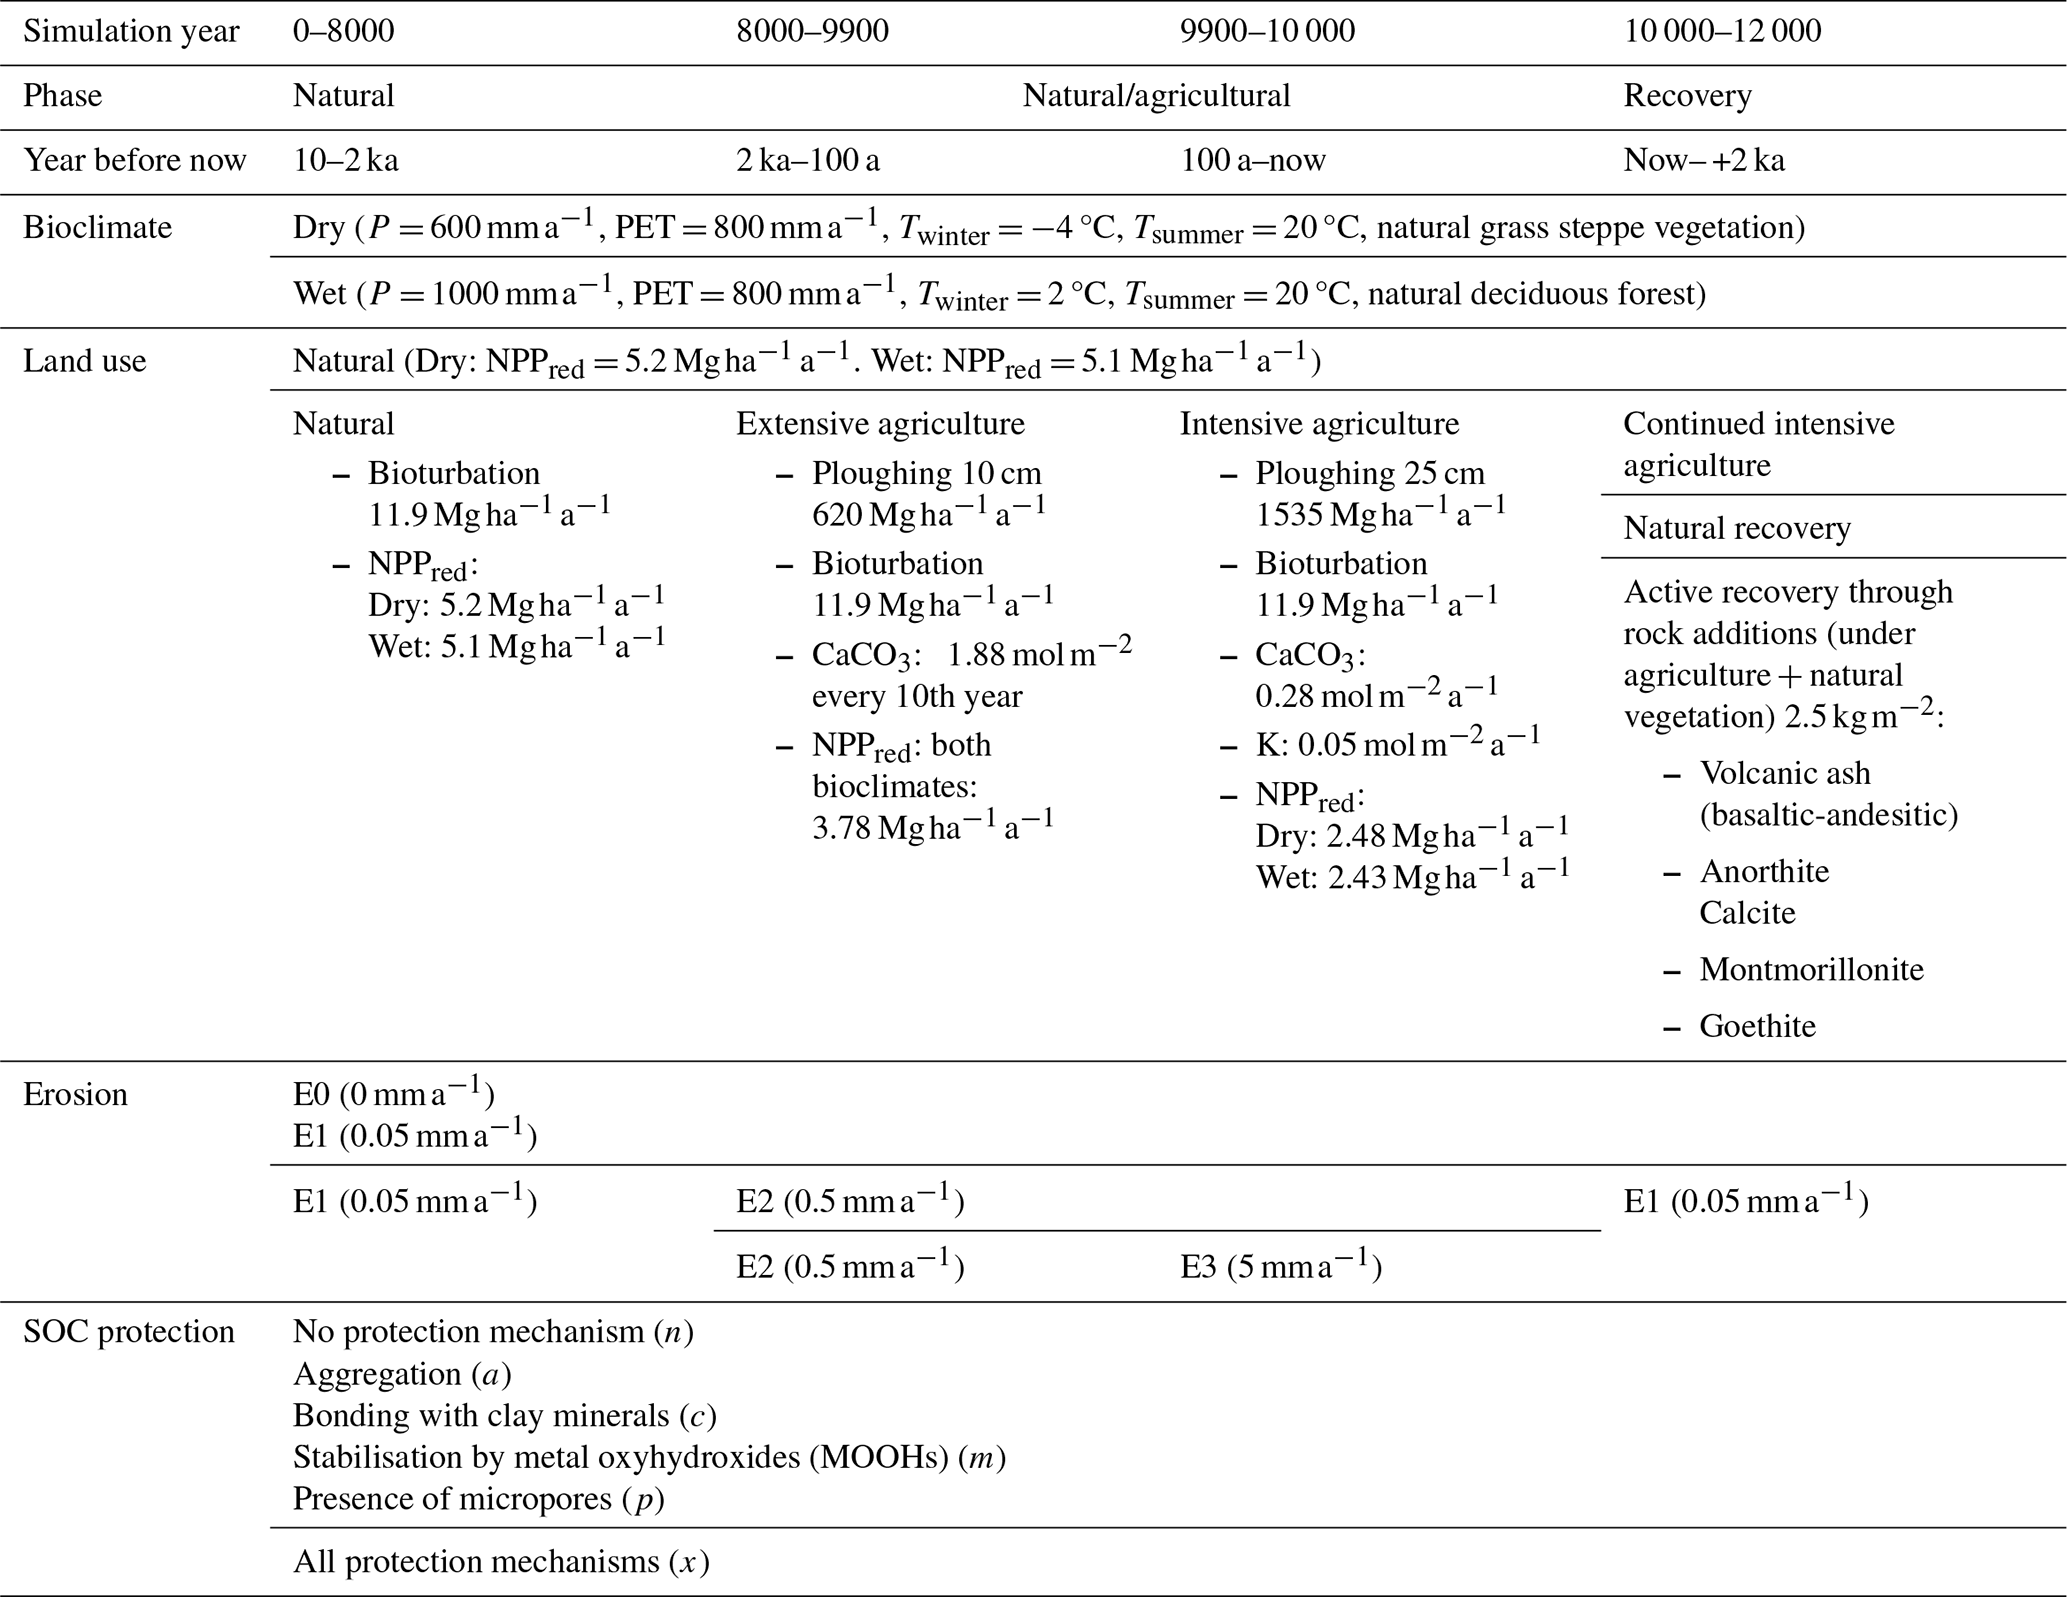
Table 2Overview of variations in environmental drivers, internal SOC protection mechanisms and the following model parametrizations in the simulated scenarios.
2.3 Simulation scenarios
To test how different environmental conditions affect the SOC dynamics in the simulations, we systematically changed bioclimatic setting, erosion intensity, land use and SOC protection mechanism (Table 2).
We developed two bioclimatic scenarios, which are based on climatic conditions found in loess areas in humid NW Europe (wet) and SE Europe with more continental climates (dry). The wet scenario is defined by a precipitation surplus of 200 mm and has a deciduous forest as natural vegetation, while the dry scenario has a precipitation deficit of 200 mm and has a natural grass steppe vegetation. Average July and January temperatures were changed according to these locations as well. The climate was constant over the duration of the simulations. Typical soils for the wet NW Europe loess area are Luvisols and Alisols, characterized by decalcification, low base saturation, clay eluviation and low SOC. For the dry continental loess area these are Chernozems and Phaeozems, characterized by shallow or no decalcification, high base saturation, limited clay eluviation and high SOC (IUSS Working Group WRB, 2022). Surface fertilizer applications (e.g. by liming) were redistributed equally over either 10 or 25 cm by plowing.
The simulations run for 12 000 years. During the first 8000 years, all scenarios represent natural soil development without anthropogenic disturbances. The following 2000 years of simulation either continue the natural development, or transition to agricultural land use. For the latter, years 8000–9900 are defined by extensive agriculture, with a cereal crop, followed by a century (years 9900–10 000) of intensive agriculture, again with cereals. Agricultural intensity determines plough depth, amount of crop residue left on the field and fertilization level (Table 2). The final 2000 years (10 000–12 000) represent forward simulations where we test how SOC stocks evolve when agricultural practices are either continued or stop, and when SOC sequestration is actively enhanced through mineral rock additions. This is simulated by adding 2.5 kg m−2 of crushed rock on the surface at the start of the recovery phase. We add rock of different mineralogy: volcanic ash (basaltic-andesitic), anorthite, calcite, montmorillonite and goethite. Rock additions were redistributed by plowing (25 cm) and/or bioturbation. We name this period the recovery phase.
We defined different erosion intensities for the different land-use periods. Under natural development, these intensities are either 0 or 0.05 mm a−1 (E0 and E1). Under agricultural development, erosion either continues with the natural rates, or they increase to 0.5 mm a−1 (E2) or 5 mm a−1 (E3). In the recovery phase, erosion rates turn back to their natural rates.
For every combination of the external drivers, SOC dynamics are simulated with either no SOC protection, one individual protection mechanism or all protection mechanisms combined (Table 2). For the recovery period we only consider the combination of protection mechanisms (x).
2.4 Data analysis
In SoilGen, erosion is modelled as an event-based rather than a continuous process. The frequency of the erosion events is determined by layer thickness and mean annual erosion rate. Each event removes the top soil layer and the ectorganic layer (if present, i.e. under natural vegetations), which causes a temporary decline in SOC stocks. The SOC stocks stabilize again when the newly exposed topsoil layer reaches a new SOC equilibrium (and possibly a new ectorganic layer has formed). As a result, SOC dynamics under eroding scenarios display saw-tooth patterns with periodic drops and increases of SOC stocks over time. The frequency of this pattern depends on layer thickness and erosion rate, leading to the removal of one layer per 1000, 100 and 10 years for erosion intensities E1, E2 and E3 in this study.
To filter out this implementation effect, we applied a moving average to the simulated SOC stocks, calculated over a pre-defined number of preceding years. The moving window size corresponds to the frequency of layer removal by erosion and is adjusted separately for each land-use phase. This approach reduces the implementation effect without over-smoothing, while preserving differences in SOC dynamics under different land uses.
The results present the total SOC stocks in the first meter of the soil profiles. This includes both endorganic and ectorganic SOC. In the presentation of SOC stock recovery in Sect. 3.3, we split the profile in topsoil (0–25 cm) and subsoil (25–75 cm) compartments.
We applied a linear regression model to the annual SoilGen output to quantify the effects of the controlling factors on SOC stocks. Bioclimate (BC) and protection mechanism (PM) were treated as categorical variables that varied between scenarios, while erosion class (EC) and land use (LU) were categorical variables specified as time-varying categorical variables, reflecting changes in the erosion intensity and land use during the simulations. The simulation year itself was included as a continuous numerical predictor. The regression model is summarized in Eq. (2), where the predictor names correspond to the abbreviations defined above, the subscript t denotes variables that vary dynamically within a simulation scenario and represent vectors of regression coefficients whose sizes depend on the number of categories for each predictor.
We excluded the model output from the first 1000 years of each scenario to avoid effects associated with the start-up phase of the model.
To quantify the contribution of each predictor to the variation in the SOC stocks, we applied a type-II ANOVA, which is robust to the order of variables in the linear model. For each predictor, the proportion of explained variance was calculated using the η2, calculated as the sum of squares of each predictor divided by the total sum of squares.
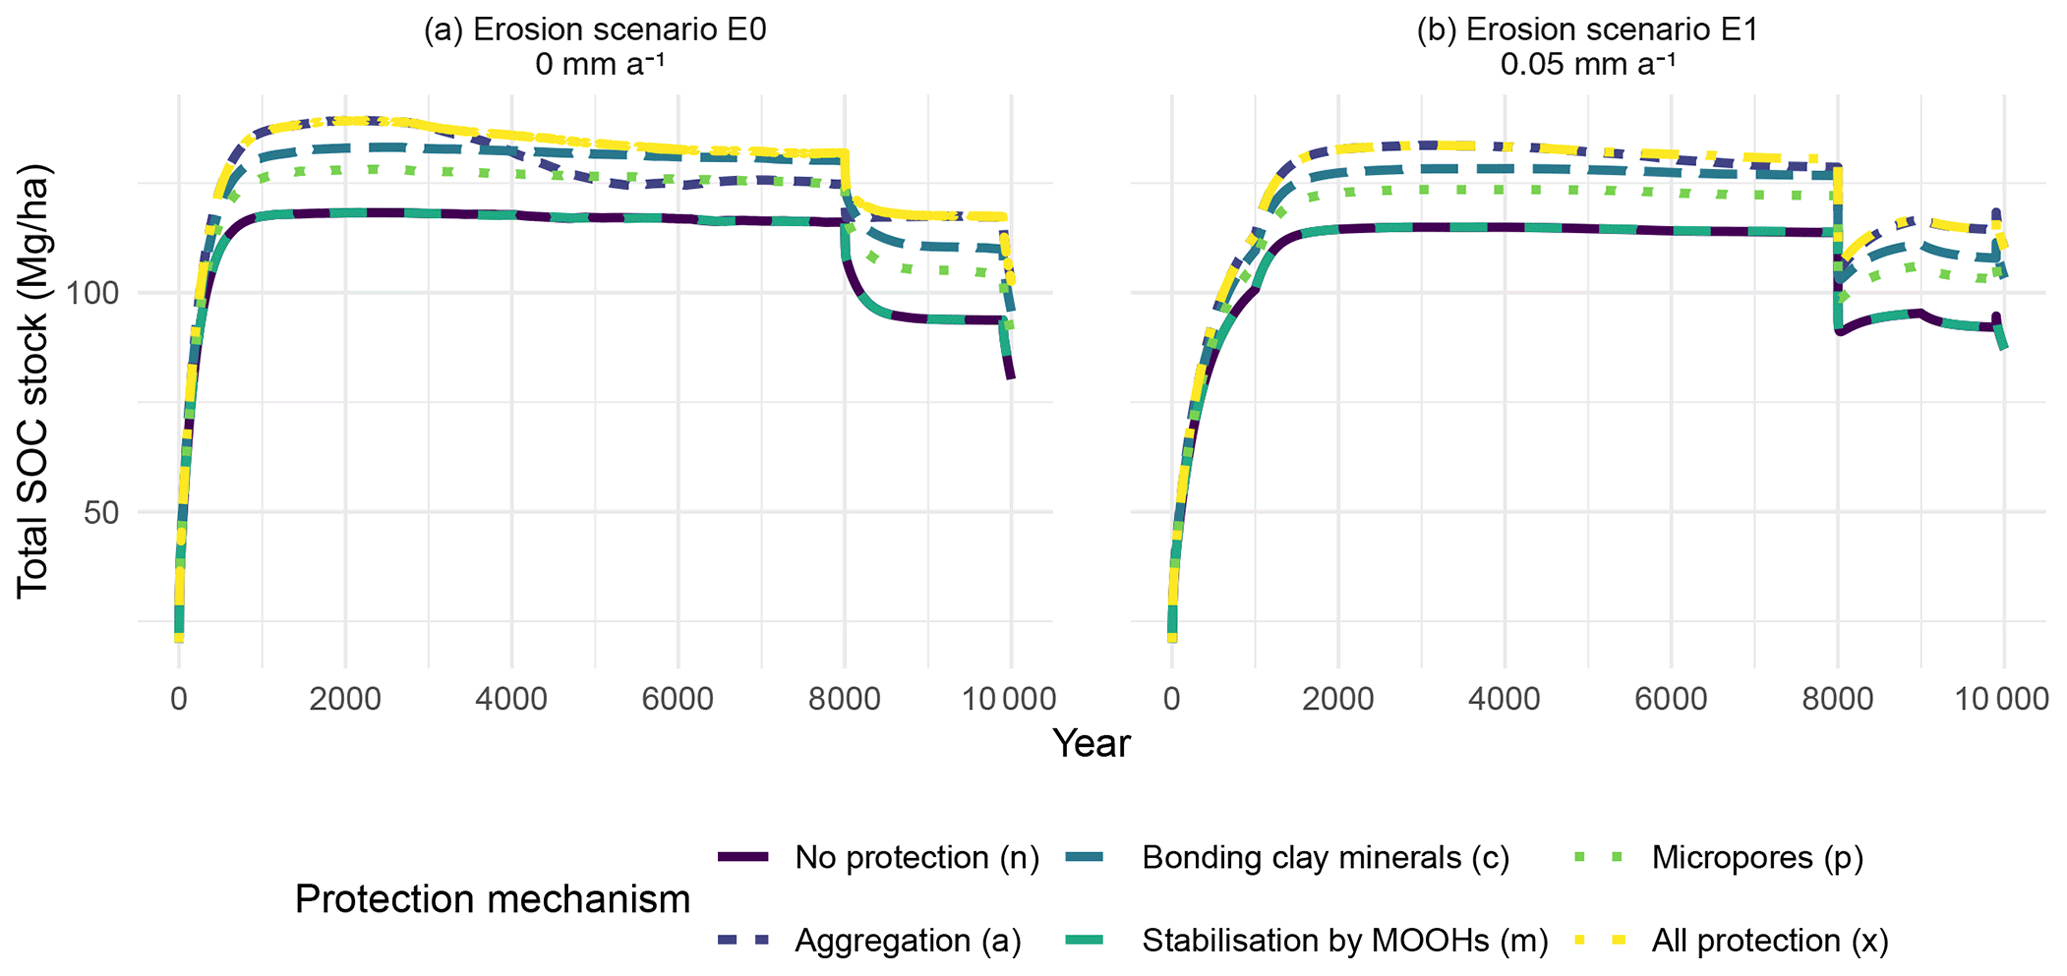
Figure 1Changes in SOC stocks over time under influence of different protection mechanisms. The displayed results come from scenarios with a dry climate, agricultural land use after 8000 years and (a) without erosion, and (b) with erosion of 0.05 mm a−1.
3.1 Influence of SOC protection mechanisms
The simulations show different temporal trends in SOC stocks for each protection mechanism (Fig. 1a). The base scenario without protection (n) shows a quick increase in SOC stocks which reach an equilibrium after ∼ 1500 years. In the extensive agricultural phase starting in year 8000, SOC drops to ∼ 80 % of the natural stocks and drop even further in the intensive agricultural phase. The scenario with SOC protection by stabilisation by metal oxyhydroxides (m) shows no visual differences from the base scenario. Protection by the presence of micropores (m) and bonding with clay minerals (c) give SOC stocks of 11 % and 12 % higher compared to the base scenario.
Protection by aggregation (a) shows a different temporal pattern, with an initial large increase in SOC stocks of 20 %, which reduces towards the end of the natural phase towards 8 %. The reduction coincides with the gradual decalcification of the topsoil. In the agricultural phase after 8000 years, protection by aggregation again becomes the dominant protection mechanism due to liming. SOC stocks under all protection mechanisms (x) follow the mechanism that offers the most protection for different moments in time. First, the SOC stocks follow the trend of protection by aggregation (a). After 5000 years, it follows the trend of protection by bonding with clay minerals (c). In the agricultural phase, it returns to the same trend as protection by aggregation (a).
Under minor erosion, protection by aggregation (a) remains the dominant protection mechanisms throughout the simulations, and results in higher SOC stocks compared to simulations without erosion (Fig. 1b). Protection by other processes show lower SOC stocks under minor erosion. The initial SOC sequestration rate is slower than in the absence of erosion, as is shown by the flatter curves at the start of the simulations.
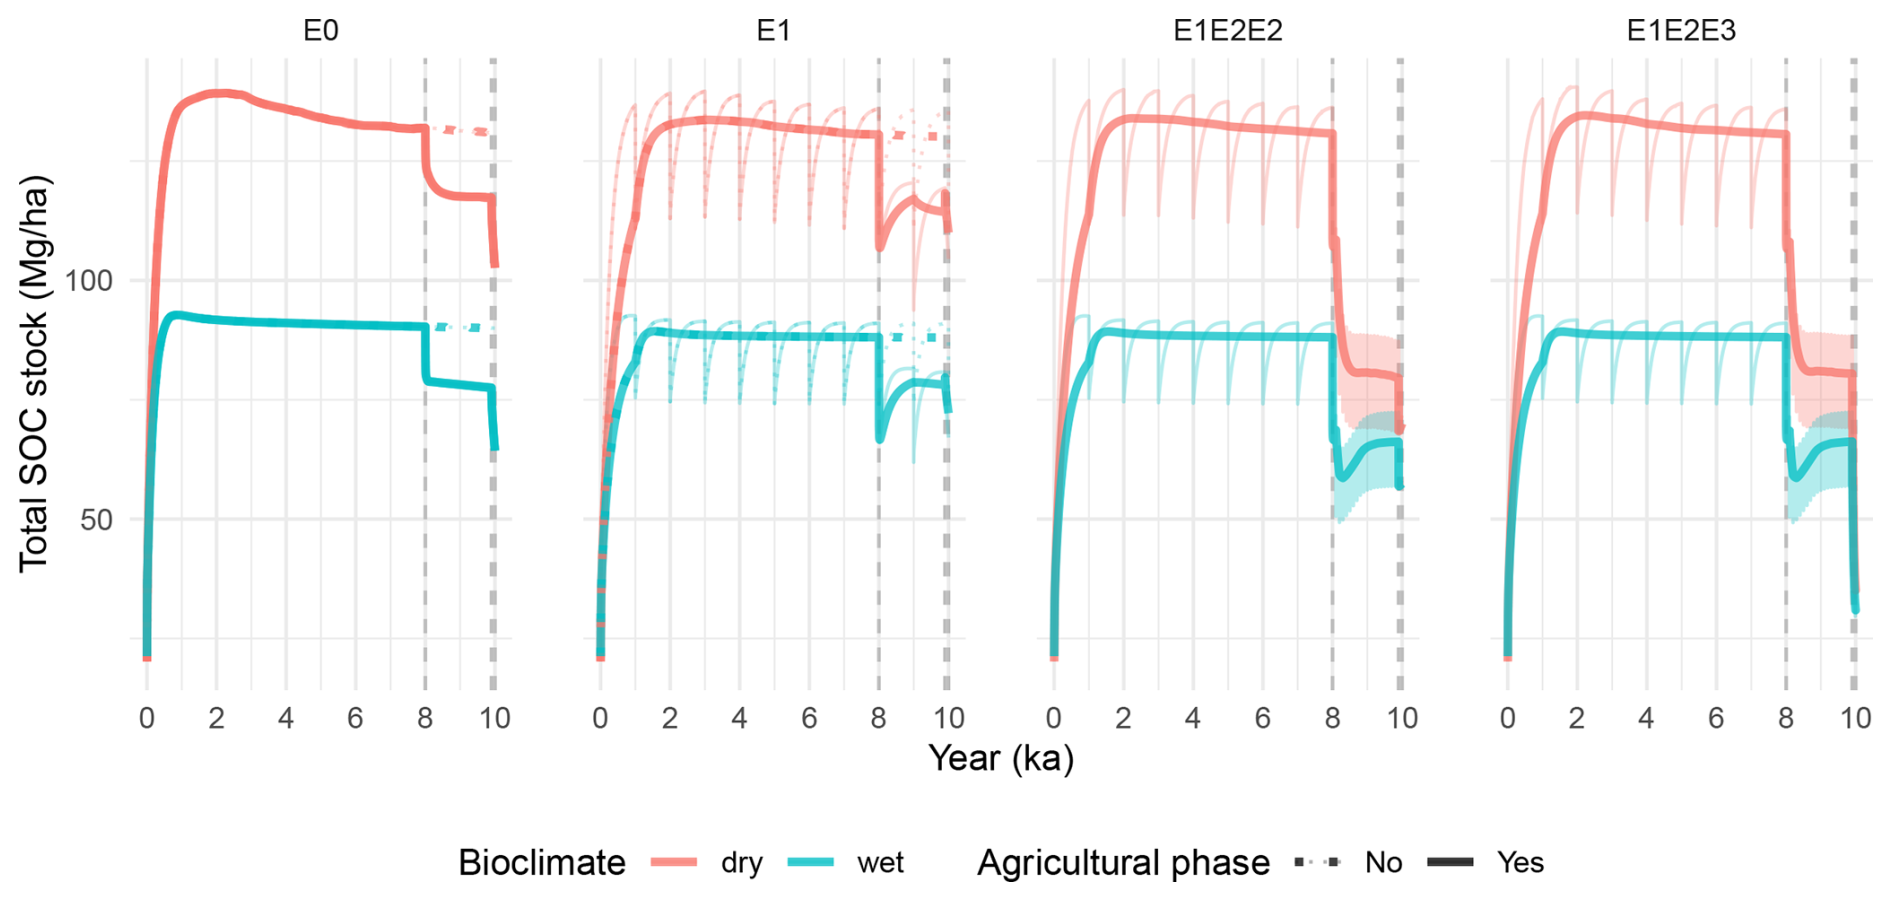
Figure 2Simulated SOC stock dynamics for different erosion scenarios (columns), bioclimates (colours) and anthropogenic effects (line types). The erosion rates corresponding to the erosion scenarios are provided in Table 2. The visualized scenarios are with all protection mechanisms combined (x). The thin lines visualize the raw model output, while the thick lines show the SOC stocks that are smoothed using a moving average. The dotted bold line depicts continued natural evolution.
3.2 Influence of environmental drivers
There is a large spread in simulated SOC stocks under the different environmental conditions (Fig. 2). Overall, simulations under a dry climate with grass steppe vegetation show higher SOC stocks than simulations with a wet climate and deciduous forest vegetation.
Between years 8000 and 10 000, agricultural land use leads to a decline in SOC stocks compared to simulations with only natural development, where SOC stocks continue at similar levels to the preceding natural phase (dotted lines). The natural scenarios are only shown for erosion scenarios E0 and E1, as we did not simulate natural soil development with higher erosion rates. In the agricultural phase, the drop in SOC stocks is larger due to a higher natural SOC stock. The pattern of higher SOC stocks in dry bioclimates persist, even though all scenarios have the same vegetation. Under higher erosion rates, differences between bioclimates decrease.
Figure 2 also shows the saw-tooth effect resulting from periodic erosion of the soil layers. Under erosion scenarios E1, E2 and E3, the frequency of layer removal is 1000, 100 and 10 years, respectively, which is visualized by the thin lines in the background. The bold lines show the smoothed SOC stocks. The smoothed SOC stocks are used in the presentation of the following results. Time series of SOC stocks for each individual protection mechanism are provided in Fig. B1.
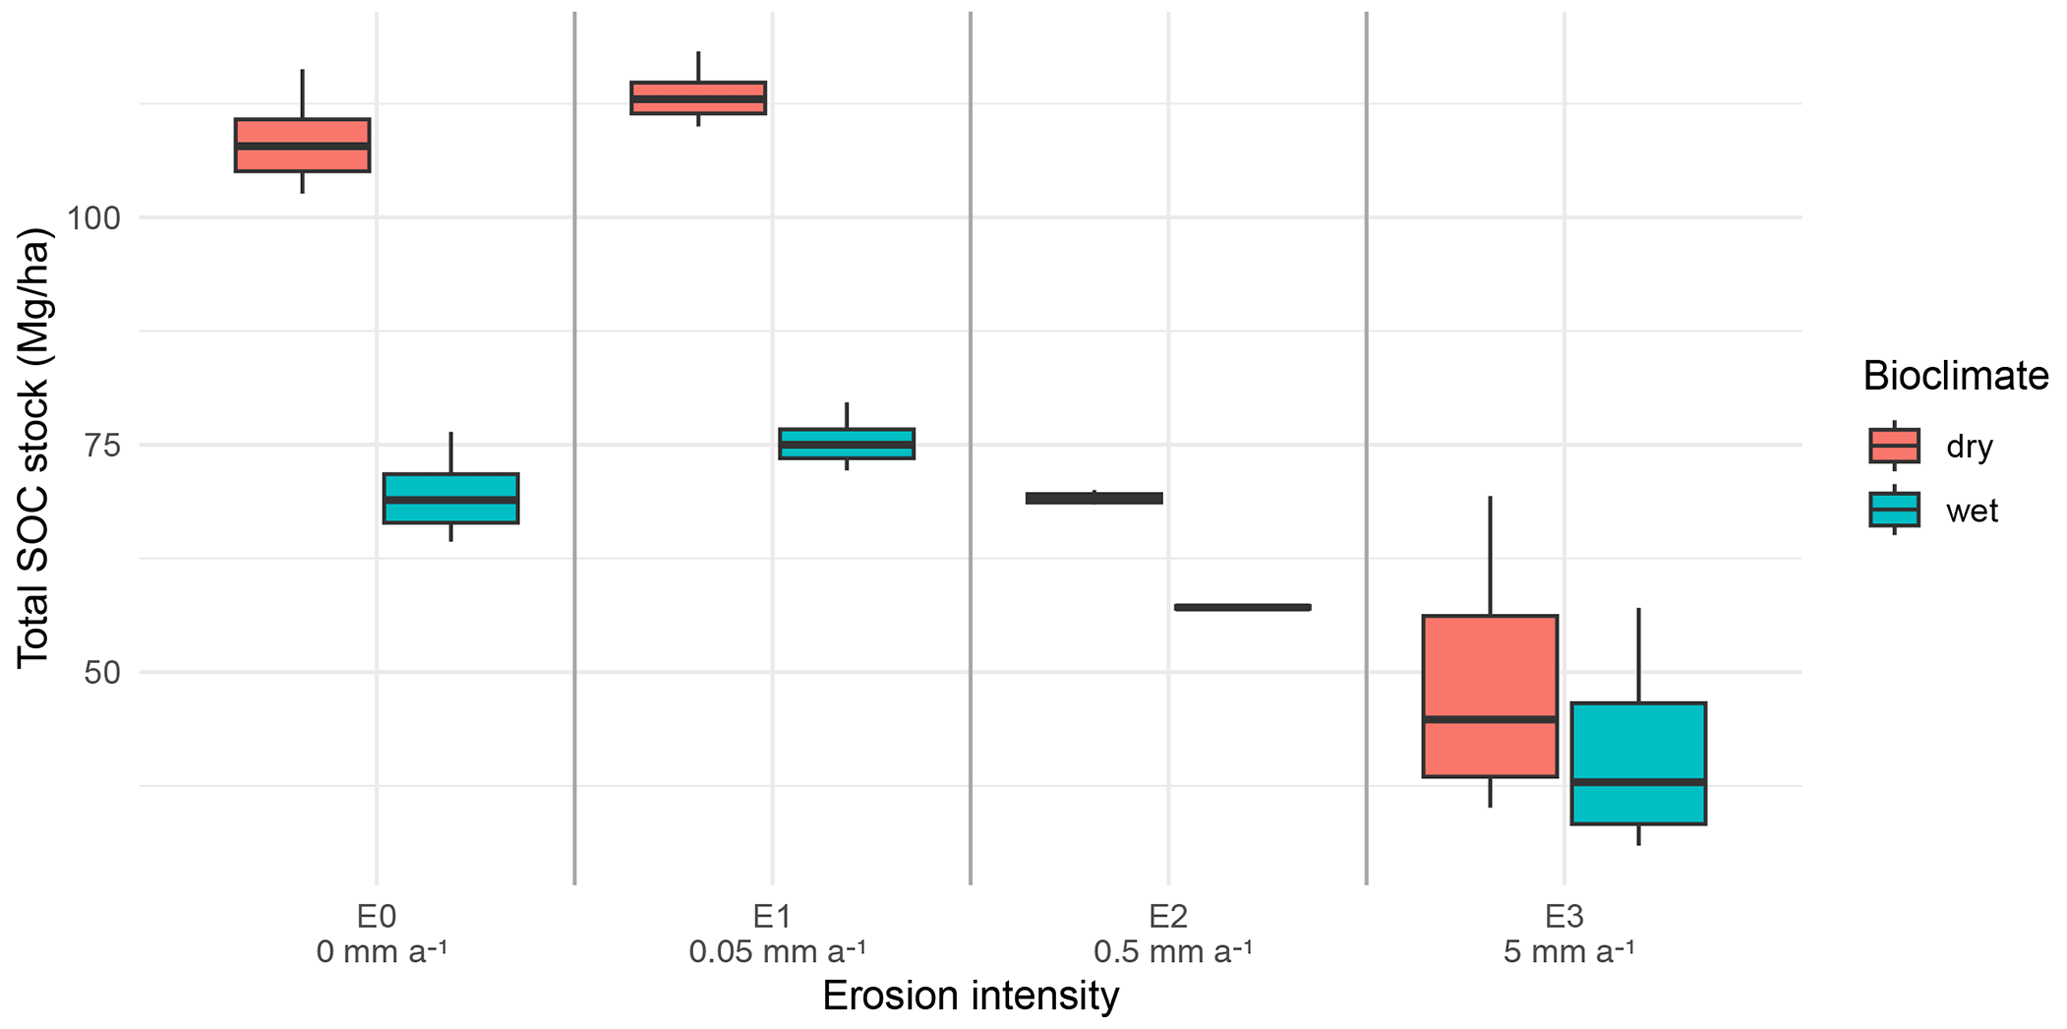
Figure 3Distribution of annual SOC stocks in the intensive agricultural phase (years 9900–10 000), grouped per erosion intensity and bioclimate. The visualized scenarios are with all protection mechanisms combined (x).
The simulated SOC stocks during the intensive agricultural phase (years 9900–10 000) illustrate the combined effects of erosion and bioclimate (Fig. 3). SOC stocks under erosion E1 are slightly higher than the SOC stocks under the scenarios without erosion (E0). With stronger erosion in E2 and E3, the SOC stocks decline to about 25 %–50 % of E0 levels. The simulations for E2 show a narrow range of values, as this scenario has already reached an equilibrium with agricultural SOC inputs during the extensive agricultural phase, resulting in rather constant values in the intensive agricultural phase. In contrast, the stocks in E0 and E1 were still adjusting to the new inputs and the stocks in E3 were pushed out of equilibrium due to the increased erosion rates in the intensive agricultural phase, leading to a larger variation in stocks. The effects of bioclimate are the most pronounced under E0, and decrease with increasing erosion rate, as SOC stocks become more similar for both bioclimatic settings.
Table 3Categorical linear regression of internal and external controls on SOC stocks in the simulations. Reference levels: bioclimate = dry, erosion = E0, land use = natural, protection = no protection (n). Adjusted R2 = 0.96, overall p-value < 0.001.
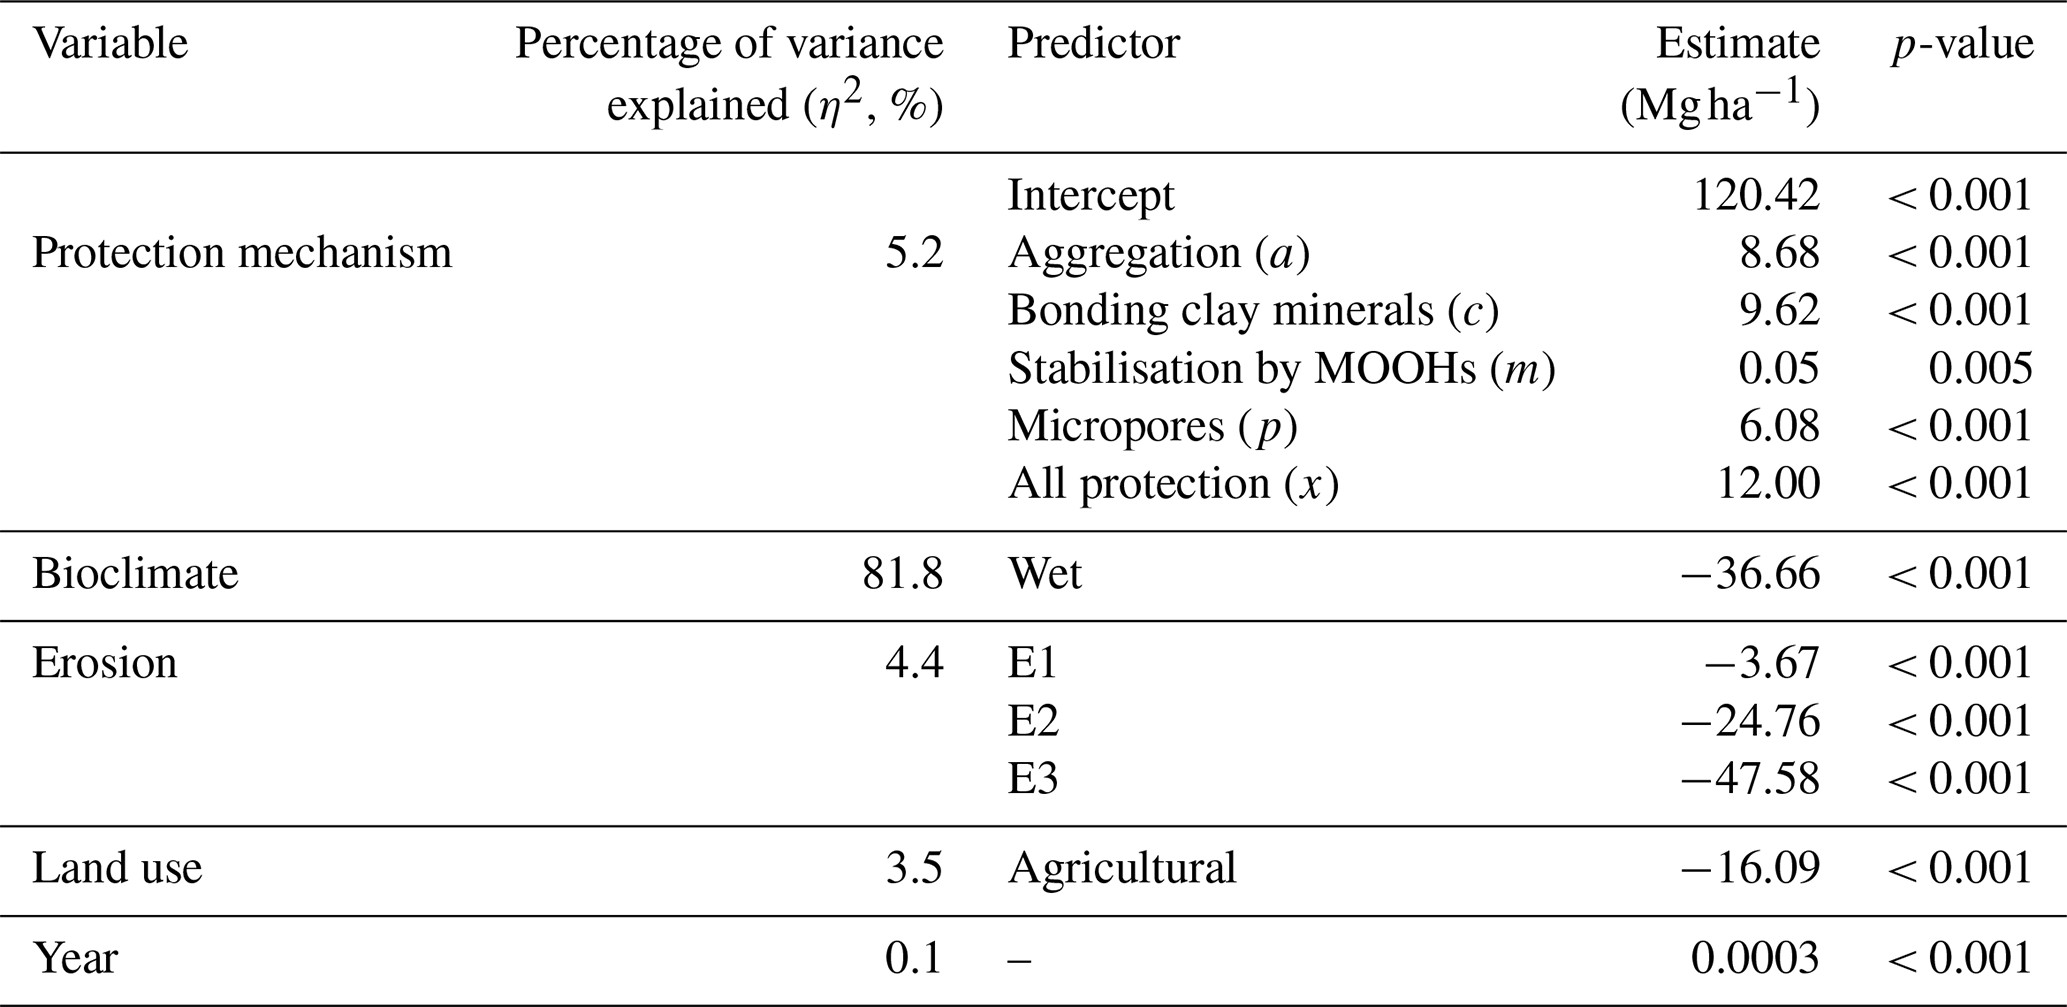
The linear regression quantifies the effects of our formalisms (Table 1) for internal protection mechanisms and external environmental conditions on simulated SOC stocks (Table 3). All protection mechanisms have a positive significant effect on the SOC stocks, with the smallest effect for protection by MOOHs (m). The largest effect comes from all mechanisms combined (x). SOC stocks were lower under a wet climate, agricultural land use and higher erosion rates, compared to the reference levels. Time has a very small positive effect on SOC stocks.
Overall, the adjusted R2 indicates that the linear model explained 96 % of the variance in the simulated SOC stocks, with the remaining variance likely reflecting internal SOC dynamics in SoilGen or non-linearity in the effects. The η2 from the type-II ANOVA indicates that climate by far explains most of the variance in the model, followed by protection mechanism, erosion rate and land use. Simulation year explains a negligible amount of the variance (0.1 %).
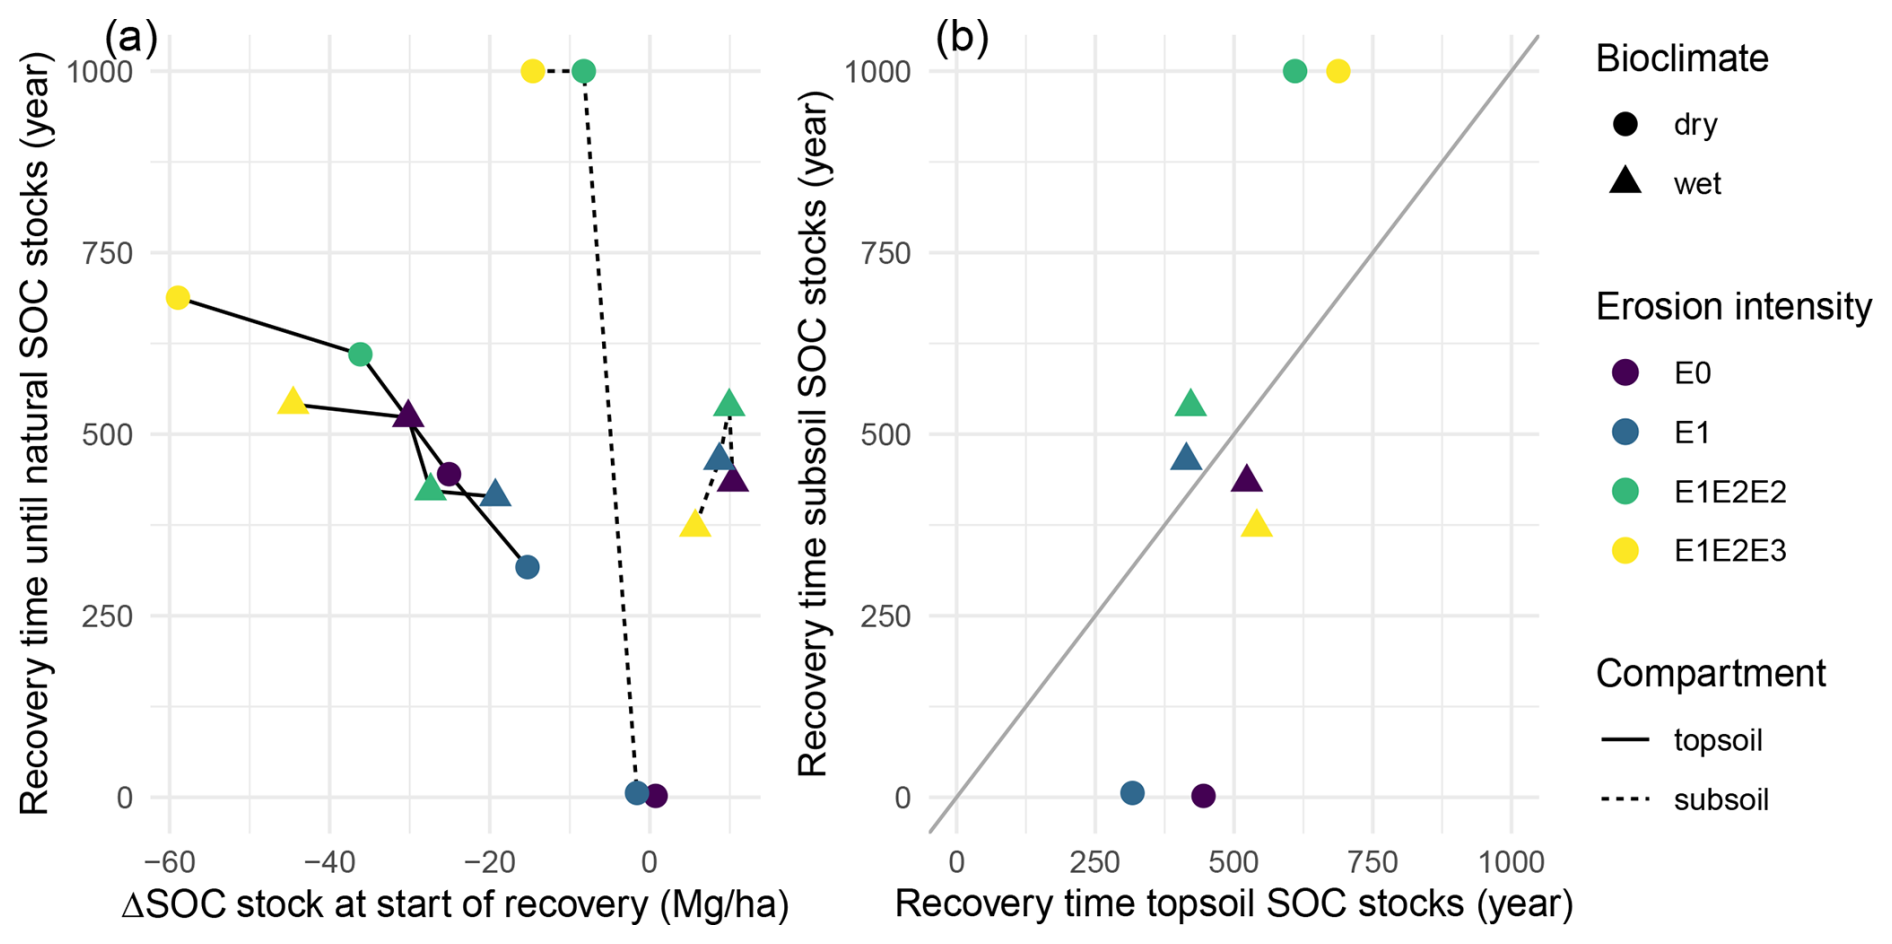
Figure 4Plots of the time until simulated SOC stocks recover to their natural SOC stocks after ceasing agricultural use. (a) plot of recovery time versus the SOC deficit compared to the natural reference at the start of the recovery phase. The lines connect topsoil or subsoil recovery times along different erosion intensities and bioclimates. (b) scatterplot of topsoil (0–25 cm) versus subsoil (25–75 cm) recovery times. The erosion rates corresponding to the erosion intensities are provided in Table 2.
3.3 SOC recovery
Figure 4 shows the recovery time of SOC stocks in the top- and subsoil after ceasing the agricultural land use and returning to the natural conditions. Overall, the topsoil SOC stocks show the largest deviations in SOC stocks from the natural reference, with deficits up to 60 Mg ha−1 (Fig. 4a). The deficit is larger for higher erosion intensities in the agricultural phase for the dry bioclimatic scenarios. For the wet bioclimatic scenarios, deficits are more similar, in the range of −20 to −45 Mg ha−1. The subsoil SOC stocks have lower deficits, with values reaching up to −17 Mg ha−1 for the dry bioclimate scenarios. In the wet bioclimate scenarios, there is actually an increase of up to 10 Mg ha−1 in subsoil SOC stocks at the end of the agricultural phase compared to the natural reference. Here, higher erosion intensities have smaller surpluses. The timeseries provided in Fig. B2 show that increases in subsoil SOC are consistent for all erosion intensities in wet bioclimates, while it also occurs under E0 and E1 for the dry bioclimate. Linear regression of recovery times versus the absolute SOC stock difference suggests that recovery takes ∼ 8 years per Mg C difference in the topsoil (p = 0.001, R2 = 0.84) and ∼ 68 year per Mg C difference in the subsoil (p = 0.010, R2 = 0.70), indicating almost nine times slower recovery in the subsoil.
Topsoil recovery times are centred around ∼ 500 years (Fig. 4b). For the dry bioclimate scenarios, low to minor erosion (E0 and E1) have shorter recovery times, while higher erosion intensities have longer recovery times. This pattern is not visible for topsoils in the wet bioclimate scenarios. Subsoil recovery times show much larger differences (Fig. 4b). Recovery times for the dry bioclimate scenarios range from almost zero (E0 and E1) up to 1000 years for higher erosion intensities (E1E2E2 and E1E2E3). For the wet bioclimate scenarios, recovery times for the subsoil are in the same order of magnitude as those of the topsoil.
SOC stocks in the recovery phase recovery are only partly influenced by artificial rock additions (Fig. 5). When agriculture continues, rock additions have no discernible effect on SOC stock dynamics. Under natural recovery promoted by rock additions, there is a minor effect of some of the rock additions. For the dry bioclimate scenarios, all recovered SOC stocks exceed the natural reference. Maximal recovery is reach in the scenario where goethite is added, because Fe-concentrations remain high in the subsoil due to the high pH and limited leaching. Montmorillonite also increases SOC stocks to levels above the other additions, while calcite has a minor initial positive effect on the rate of SOC sequestration, which evens out after 1000 years. In the wet bioclimatic scenarios, all SOC stocks converge to the natural reference, again with elevated SOC stocks due to montmorillonite additions. Under all scenarios, the effects of volcanic ash and anorthite additions are comparable: even while ash weathers much faster, both rock types do not yield high enough Fe and Al concentrations to impact the rate modifier linked to protection by MOOHs.
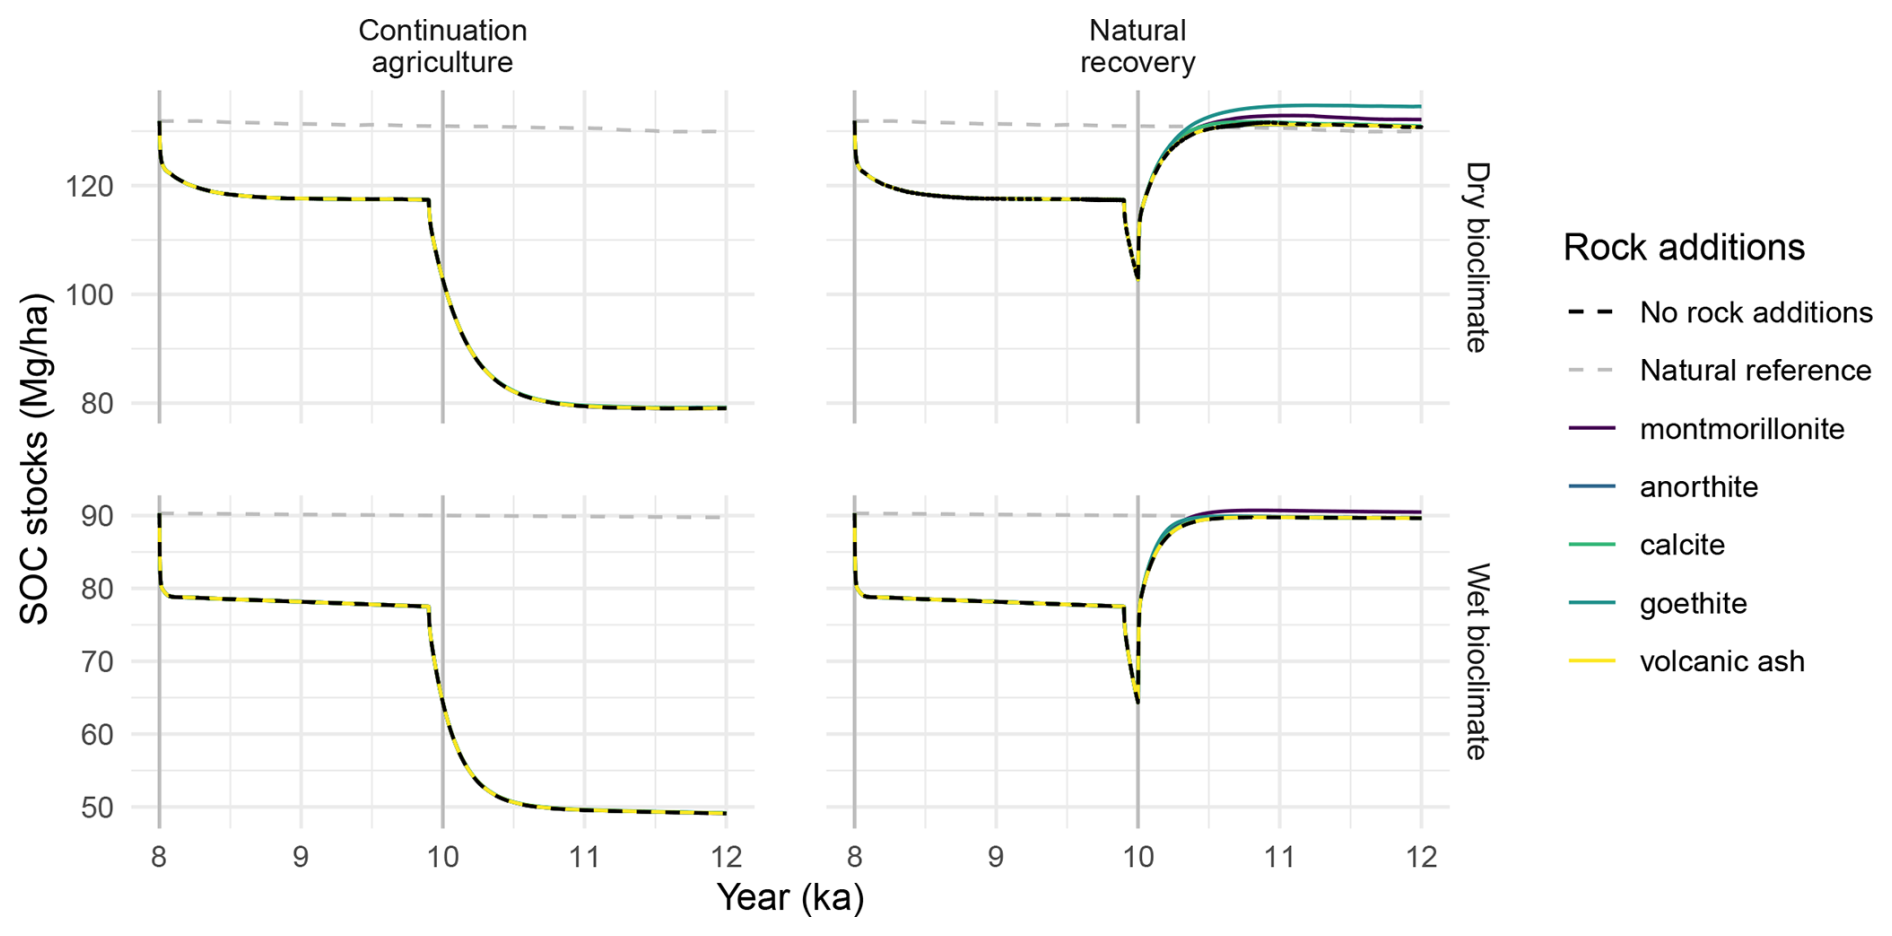
Figure 5Evolution of SOC stocks in the recovery phase under different rock additions regimes. Non-visible lines for rock additions are plotted below the black line that represents no rock additions, indicating no differences. Note the different ranges of the Y axes. The scenarios are without erosion (E0).
4.1 Internal and external drivers of SOC stocks
Soil organic carbon is a property that plays a key role in many soil functions and ecosystem services (Wiesmeier et al., 2019; Creamer et al., 2022). In order to assess the future fate of SOC under changing climatic and management conditions, an advanced understanding of the processes and drivers of SOC dynamics is required. In this study, we used the soil development model SoilGen to evaluate the role of protection mechanisms and environmental drivers on SOC dynamics in loess soils.
The simulation results revealed surprising insights into SOC dynamics in loess soils under different driving factors and in relation to other processes. Here we highlight three examples to illustrate how the model can advance our understanding of these feedbacks and drivers: (1) feedbacks between SOC protection and external drivers, (2) contrasting responses of SOC sequestration for top- and subsoils, and (3) the role of long-term historical soil development in the current-day potential for SOC sequestration.
4.1.1 Feedbacks between SOC protection and external drivers
Our simulations reveal a temporal shift in the dominant SOC protection mechanism over pedogenetic time scales (Fig. 1). Initially, aggregation, controlled by calcite content, is the dominant protection mechanism. As chemical weathering removes calcite from the soil column, bonding with clay minerals becomes the dominant protection mechanism. Under wet bioclimatic scenarios, calcite depletion happens much quicker, which shortens the period during which aggregation is the dominant protection mechanism (Fig. B1). During the agricultural period, liming followed by vertical redistribution (plowing, bioturbation and solution/precipitation) of calcite restores aggregation as the dominant protection mechanism, highlighting a strong control of soil management on SOC protection. Physical SOC protection through enhanced aggregation by liming is recognized as a positive driver on SOC sequestration, but liming can also increase SOC mineralization by increased biological activity (Paradelo et al., 2015). This process can potentially compensate for the increased SOC through aggregation, but is currently not included in the model.
Soil erosion is widely recognized as a degrading process on a soil profile scale, as SOC removals outweigh SOC sequestration rates (Van Oost and Six, 2023) and heavily eroded soils generally contain less SOC (Olson et al., 2016). Surprisingly, SOC stocks under minor natural erosion (E1) were consistently higher than those under no erosion (E0, Fig. 3). This result is due to feedbacks between erosion and the rate of calcite depletion. Under minor erosion, where soil loss by erosion is similar to the decalcification rate, there remains sufficient calcite available in the soil profile to protect SOC through aggregation during the entire simulation (Fig. 1b). Similarly, Ranathunga et al. (2021) concluded in a modelling study that minor erosion not necessarily results in loss of SOC. Experimental studies however are necessary to further explore this feedback mechanism. Under increased agricultural erosion (E2 and E3), the erosion exceeds the soil's capacity to accumulate and protect carbon, leading to carbon losses in these scenarios (Fig. 3), agreeing with observations of lower stocks in agriculturally eroded soils (Zhang et al., 2006).
The relative importance of protection mechanisms reported in this study are specific to our simulated synthetic soils. We did not test effects of other drivers, such as parent material (e.g. Mao et al., 2020), on SOC dynamics, to limit the number of simulations. However, key soil properties influenced by parent material, such as mineralogy, pH and texture, are incorporated in SoilGen, and actively control SOC protection mechanisms (Table 1). Studies for different parent materials, or other settings, could reveal other dominant processes and different feedbacks with external drivers for different settings. The sensitivity of SoilGen to global change parameters enables this evaluation for a large range of soil types and geographical settings (Minasny et al., 2015; Finke, 2024a).
4.1.2 SOC sequestration in top- and subsoils
It is widely recognized that topsoils and subsoils exhibit different dynamics, drivers and turnover times (e.g. Salomé et al., 2010; Luo et al., 2019; Zhang et al., 2025). Our results mainly revealed large differences in SOC deficits and their recovery times after agricultural use (Fig. 4). Topsoil (0–25 cm) SOC deficits after a long period of agricultural use, and sequestration following vegetation restoration (Fig. 5), are widely observed in experimental studies (Nave et al., 2013; Jiang et al., 2019; Huang et al., 2022). The subsoils in our simulations (25–100 cm) did not show these large deficits and even showed a small increase in SOC stocks for the wet bioclimate scenarios (Figs. 4a and B2). This can be attributed to how the model sequesters carbon in soils under different vegetation types. Under natural forested vegetation, organic carbon is mainly supplied as surface litter that takes time to be incorporated in the subsoil. In contrast, agricultural crops supply more organic carbon directly into the subsoil through decaying roots, resulting in higher subsurface SOC stocks in our simulations. These contrasting SOC differences in subsoils were also identified by Nave et al. (2013), who found no significant trend between time since afforestation and SOC stocks in soil layers deeper than 20 cm. These carbon input distributions require calibration when applying the model to site-specific studies.
The SOC recovery times reported in Fig. 4 show large differences between topsoils and subsoils, depending on the size of their deficit or surplus. These recovery times are controlled by our estimated SOC inputs and turnover rates in the model, which were loosely based on real-world settings (Appendix A). They can be used for comparison of SOC dynamics in different parts of the soil profile in this study, but they do not directly represent actual recovery rates. Accurate estimates of SOC sequestration or mineralization across the entire soil profile, and their potential responses to global change, require site-specific, evidence-based model calibration (Keyvanshokouhi et al., 2016), while the explorative modelling performed in this study can provide valuable information about soil system functioning and feedbacks (e.g. Temme et al., 2017).
4.1.3 Potential for SOC sequestration
The dominant effect of bioclimate on the SOC stocks in our simulations shows that SOC stocks are mostly controlled by external controls (Table 3). The soils developed in our simulations under the dry bioclimate could be described as a Chernozem/Phaeozem (IUSS Working Group WRB, 2022), while the soil developed under the wet bioclimate show resemblance to Luvisols/Alisols in terms of their simulated depth distributions of calcite, base saturation and clay content and SOC contents. A comparison between SOC stocks in the natural situation (simulation year 8000) to the new steady state during continued intensive agriculture shows a decrease from 130 to 80 Mg ha−1 (dry bioclimate) and from 90 to 50 Mg ha−1 (wet bioclimate), equivalent to respective losses of 39 % and 44 % compared to antecedent SOC pools (Fig. 5). These values fit well in the range of SOC loss due to agricultural conversion reported by Lal (2013; 25 % and 75 %) and by Sanderman et al. (2017; 14 %–61 %). The differing steady-state SOC stocks under identical agricultural management indicate a continuing climatic control on the SOC stocks under agricultural use.
Factors that can be influenced through management, such as erosion rate and land use, play a relatively smaller role in controlling the SOC stocks, but do suggest SOC sequestration potential by changes in soil management. For example, the linear regression model suggests that a change to natural vegetation could potentially sequester ∼ 20 Mg ha−1 SOC to return to natural SOC stocks (Table 3), in about 500 years depending on the bioclimate (Figs. 4 and 5). This value is in line with a compilation of studies who reported SOC sequestration of ∼ 8–∼ 65 Mg ha−1 in periods of 10–120 years due to afforestation (Minasny et al., 2017). Reduction of agricultural erosion could sequester 20–50 Mg SOC ha−1 according to the linear model. Studies reporting no till, which can serve as proxy of reduced erosion, report sequestration of 0–∼ 12 Mg SOC ha−1 in 3–25 years (Minasny et al., 2017). The shorter observation time can indicate that there is still sequestration potential due to reduction of erosion at these monitored sites, as the SOC stocks take time to recover and approach a new equilibrium.
Perhaps a more important control on SOC sequestration potential is the past trajectory of SOC stocks. Our results show that environmental setting, soil development and erosion history play a large role in the current-day potential of SOC sequestration in soils, not only through direct controls such as carbon removal by erosion or changing carbon inputs following land-use change, but also indirectly by modifying soil properties that affect SOC dynamics. For example, the higher SOC stocks under light erosion (Sect. 4.1.1) illustrate the role of calcite content in SOC dynamics. Thus, accurate projections of SOC changes under future global change require not only better representation of the carbon pools in soils and their environmental drivers (e.g. Abramoff et al., 2022; Bruni et al., 2022), but also a dynamic consideration of other soil properties that actively control SOC dynamics (Gerke et al., 2022).
These model improvements will also assist the evaluation of active carbon sequestration, for example by enhanced weathering through rock additions. Our simulations showed a limited effect of ground rock additions on additional sequestration. This could be due to the amount added (2.5 kg m−2), the texture of the grinded rock which influences the weathering rate, the formalism chosen for stabilisation in the model (e.g. the rate modifier was limited to 0.8), or simply because there is limited potential in rock additions. Additional SOC sequestration mainly occurred under dry bioclimate conditions (Fig. 5). Under these conditions, prior leaching of carbonates and MOOHs was limited, which created the right geochemical conditions for increased protection through aggregation by addition of calcite and through MOOH stabilization by iron ions weathered from the goethite. Protection by increased active 2:1 clay content through addition or neoformation of montmorillonite had a positive effect under both bioclimate conditions. These findings again highlight the need to account for environmental conditions and pedogenetic history in evaluating SOC sequestration. Also here, evidence-based process formulation and calibration are essential for accurate predictions, but experimental data on these processes is still scarce.
4.2 Roadmap towards digital twins of soils
The growing emphasis on long-term carbon storage in soils, for example through carbon farming initiatives (European Commission, 2024), requires the development of monitoring and simulation tools that can assess and evaluate the magnitude and permanence of carbon sequestration measures. Soil digital twins offer a promising framework for accurately representing the current and future states of soils and their properties by dynamically linking monitoring data with process-based simulations and long-term projections. A soil digital twin relies on the tight coupling between the physical soil system, characterized and monitored through instrumentation and sampling, and a virtual counterpart, such as a model representation capable of forward simulation (cf. Bauer et al., 2021; Maimour et al., 2024). Models such as SoilGen can serve as basis for virtual replicas of soil systems, but require the integration of dynamic data acquisition with dynamic modelling of target target soil properties, such as SOC stocks, to function as full digital twins (Blair, 2021). These connections can be added in different ways. Fuller et al. (2020) describe an evolution towards digital twins: (i) data connections between field observations and computer models, largely in the form of manual operations (digital model); (ii) increased automation via instrumentation and data assimilation (digital shadow); and (iii) fully automated data flows (digital twin), in which the (soil) properties of interest are fully synchronized between field and model.
Soils are complex, multi-property systems, shaped by numerous processes that operate on timescales from seconds to millennia, which cannot all be covered by field monitoring. This makes a full synchronization across the full property domain impossible. Moreover, complete soil models do not exist. As an example, SoilGen3.8.2, as one of the most extensive soil models, was estimated to represent 65 % of the processes that formed the soils occurring worldwide (Bockheim and Gennadiyev, 2000; Finke, 2024a, p. 23). Consequently, a true digital twin of a soil is out of reach. Still, some topical aspects and processes of soil behaviour, such as the water cycle, plant growth and element cycles, might be twinned.
This “topical twinning” has been described and implemented for dynamic soil processes operating on daily to seasonal timesteps, such as soil moisture dynamics, soil microbial processes or soil-plant interactions (Silva et al., 2023; Tsakiridis et al., 2023; Parewai and Köppen, 2025; Zeng et al., 2025), but attempts for twinning slower soil processes, such as the SOC cycle, remain scarce. These slow soil processes cannot be directly monitored over relevant timescales and therefore require simulations to capture long-term dynamics. Here, we define a roadmap towards such a topical digital twin of long-term soil processes, consisting of three steps (Fig. 6).
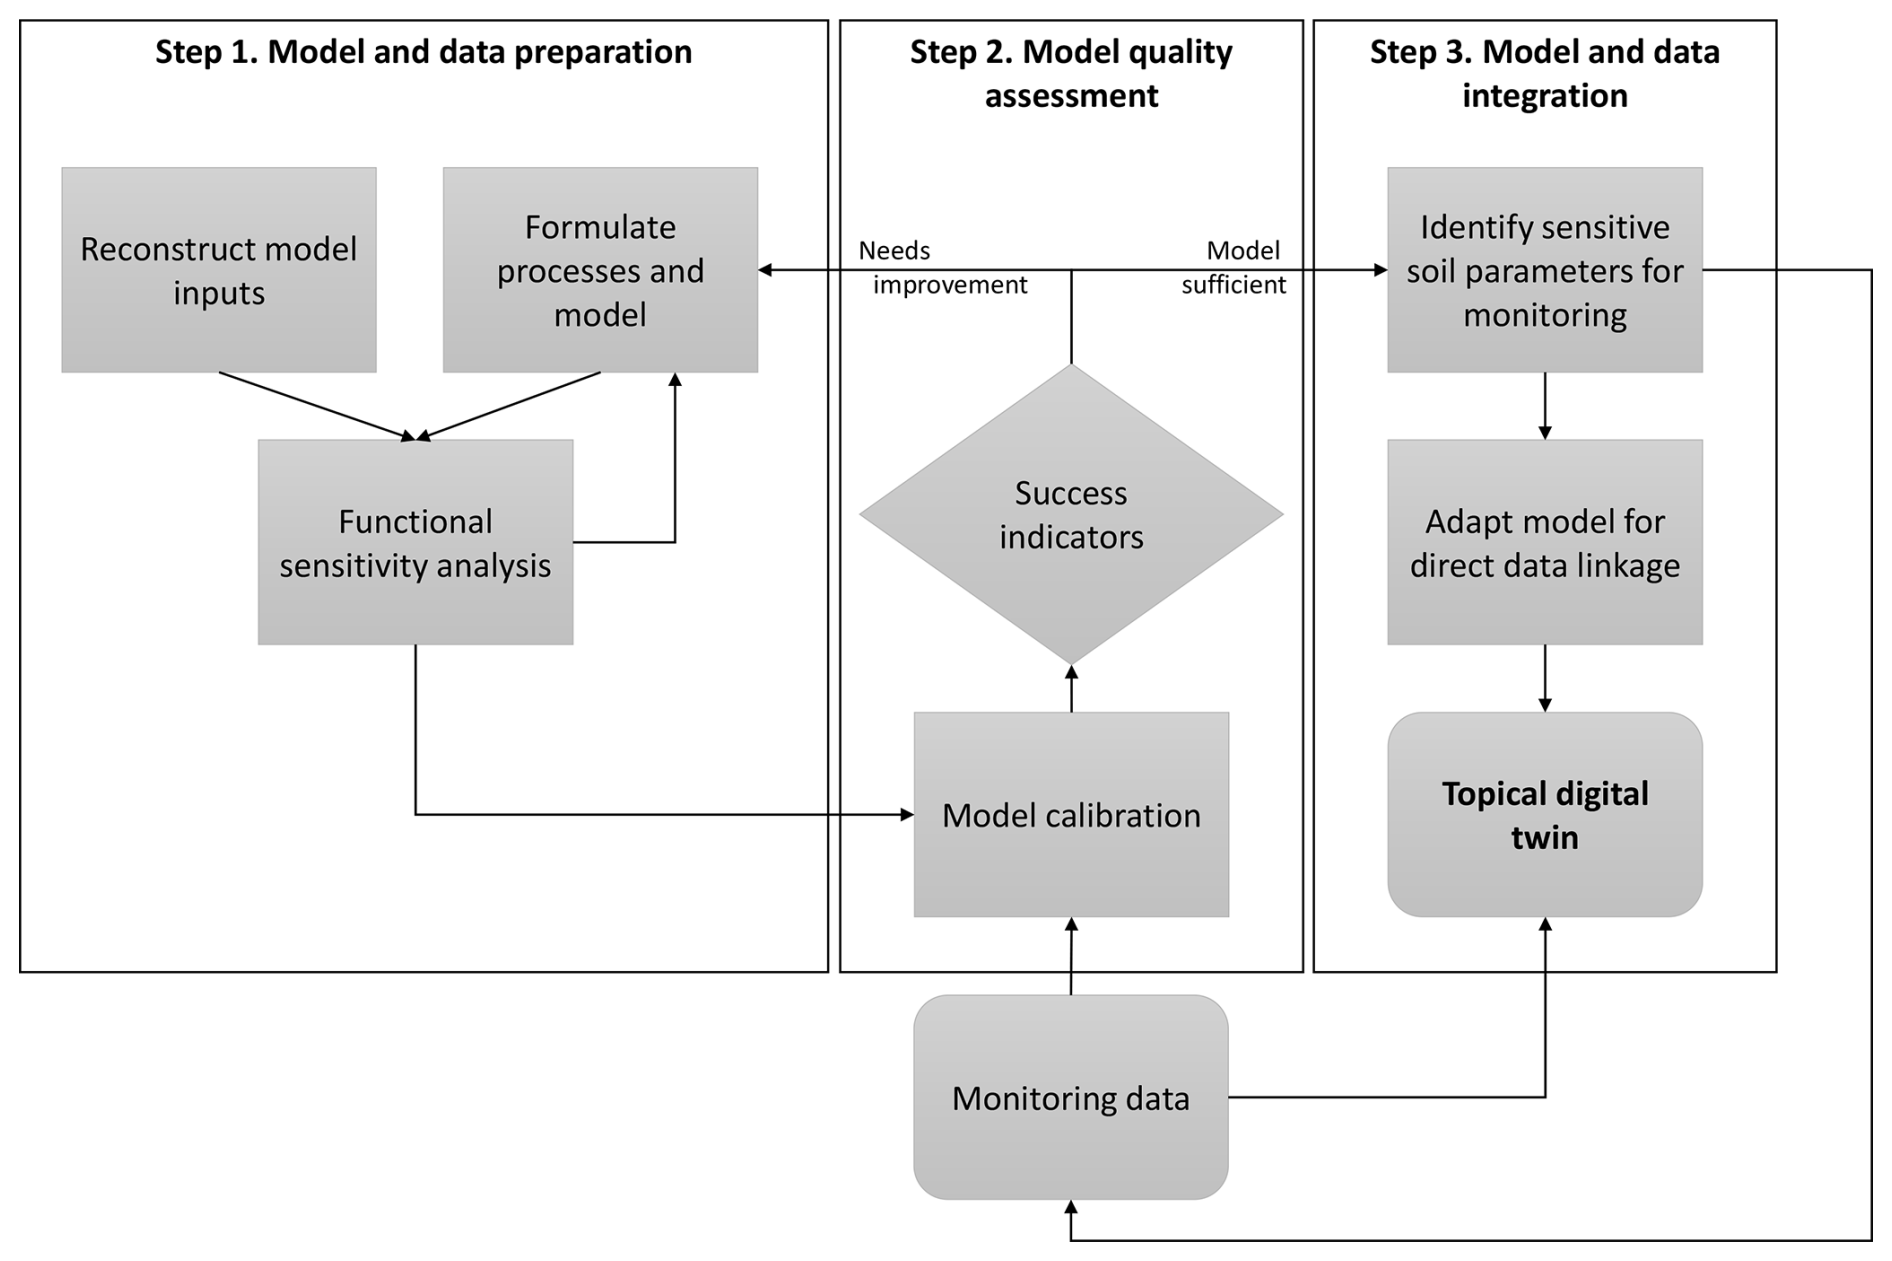
4.2.1 Step 1: model and data preparation
The first step is to prepare the model and its input data for simulating the soil property of interest. This involves (i) reconstructing model inputs over the full timeline of interest, which often extends far beyond the period of monitoring, (ii) globally calibrating the model parameters using current-day soil properties or longer-term observations from long-term field experiments (López i Losada et al., 2025) or chronosequences studies (Sauer et al., 2009) to capture some temporal dynamics, and iii) identifying, developing and testing mechanisms that represent the processes of interest within a comprehensive soil model (c.f. Keyvanshokouhi et al., 2019). A functional sensitivity analysis can help identify these critical processes and feedbacks, after which less influential processes can be pruned from the model. This phase ensures that the model can accurately simulate soil development up to the point where the monitoring starts without any redundant calculation steps, while considering the historical drivers of current-day soil processes.
4.2.2 Step 2: model quality assessment
Using monitoring data of the area of interest, the model parameters can be further calibrated and model results can be evaluated. To avoid bias, the success indicators that determine the quality of success need to be defined prior to step 1. Depending on the quality of the assessment, either step 1 needs to be repeated to improve the model, or the process can proceed to step 3.
4.2.3 Step 3: model and data integration
Depending on the model quality assessment, additional soil parameters could be identified that need to be included in the soil monitoring. These parameters can represent additional soil processes that are relevant for the topical digital twin, parameters that can help in the calibration of the models (Van de Broek et al., 2025), or they can be parameters that represent easily monitored properties that are proxies or representations of the soil property of interest (e.g. Viscarra Rossel et al., 2016). Then, the model needs to be adapted in order to allow synchronization with monitored parameters. This results in a topical digital twin, which is continuously updated with monitoring data, while also enabling forward predictions starting at the current day, informed by all available information on antecedent soil conditions.
In this paper, we focused on step 1 of the roadmap. The current process formalisms of the protection mechanisms are currently based on simple relations and first academic insights (Sect. 2.1.3). Their implementation can be improved through calibration when new monitoring data or process knowledge becomes available, as illustrated for other processes in SoilGen (Finke, 2024a). Even once a topical digital twin is operational, process formalisms may still need to be updated in response to new data, process insights, or changing requirements of the digital twin.
We used the soil evolution model SoilGen in a synthetic modelling study to evaluate effects of environmental drivers and four internal protection mechanisms on long-term SOC dynamics in loess soils, by systematically varying bioclimatic setting, land use scenarios and erosion levels. We found the following process insights:
- 1.
The four protection mechanisms showed different effects, which varied over the course of the simulations: clay mineralogy and microporosity led to an overall 11 %–12 % increase in SOC, while aggregation has a high initial effect (+20 %), which reduced over time following decalcification, leaching of exchangeable bases and liming (+8 %). Protection by MOOHs appeared to be minimal due to the low concentrations in solution and perhaps the chosen formalism.
- 2.
In a categorical linear regression of internal and external controls on SOC stocks, decreasing effects of internal and external drivers were found in the following decreasing order: bioclimate > protection mechanism > erosion rate > land use > time.
- 3.
Feedbacks with erosion revealed that minor natural erosion (0.05 mm a−1) enhanced SOC stocks through shallower decalcification and consequently more SOC protection through aggregation. Increased agricultural erosion (0.5 and 5 mm a−1) strongly reduced SOC stocks, especially in topsoils (< 25 cm). Subsoils revealed smaller deficits, but also recovered much slower back to their natural reference states. Surprisingly, the agricultural land use initially increased subsoil SOC stocks in wet climates with forest vegetation, due to larger SOC inputs from crop roots.
- 4.
Ground rock additions to enhance SOC sequestration had limited effects, mainly for slight SOC increases from goethite, montmorillonite and a small temporary effect of calcite, which was mainly apparent under dry bioclimate conditions.
Although the model parameters require evidence-based parametrization for accurate simulations, our results already reveal insightful SOC-soil process feedbacks and the importance of pedogenetic history in determining SOC sequestration potential. Complex models such as SoilGen have large added values for evaluating and monitoring SOC dynamics, because (i) SoilGen is sensitive to global change drivers which helps to identify the controlling drivers and their relative importance, (ii) we can address the long-term storage of SOC and project future recovery after land use interventions, and (iii) the model is updatable when new academic insights or data arise.
While full digital twins of soils remain unrealistic due to the complexity of soil systems, models such as SoilGen can form the basis of a “topical digital twin”, aimed at a specific soil process or property. We present a roadmap towards such topical digital twins, starting from a comprehensive soil model that is subjected to sensitivity analysis, pruning and calibration, before it can be dynamically linked with soil monitoring data for accurate predictions of soil property dynamics under global change.
The soil organic carbon cycle of SoilGen is modelled following the concepts of the RothC 26.3 model (Jenkinson and Coleman, 1994) with some adaptations. This Appendix describes how the organic inputs are determined, how the SOC cycle redistributes organic carbon over the different pools and how SOC decay is affected by different modifiers and tillage.
A1 Organic inputs
The partitioning of dead organic materials (litter) is visualized in Fig. A1. The annual Net Primary Production (NPP), calculated using Sallaba et al. (2015), is reduced for losses such as yield index and for lower yield levels during the period of extensive agriculture. The resulting NPPred enters the soil as organic input (Fig. A2).
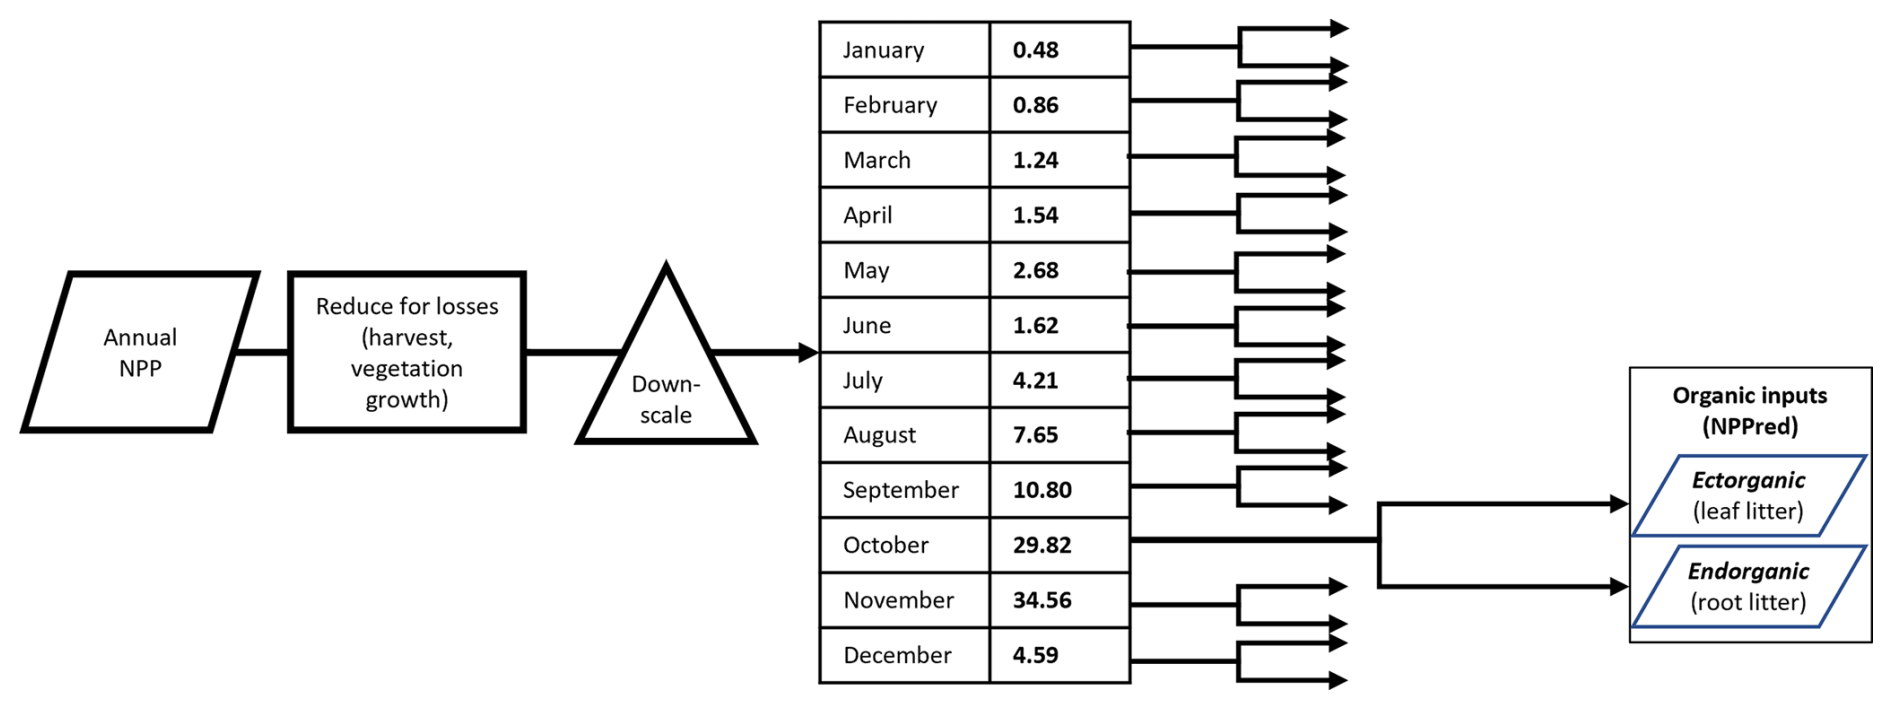
Figure A1Litter inputs (NPPred) derived from annual Net Primary Production (NPP), reduced for losses and downscaled to monthly litter production. The values (user input) are monthly percentages (here: for deciduous forest).
Table A1Litter inputs in this study. NPPred = Net Primary production corrected for yield and growth. i = layer number from top downwards, d = layer thickness.
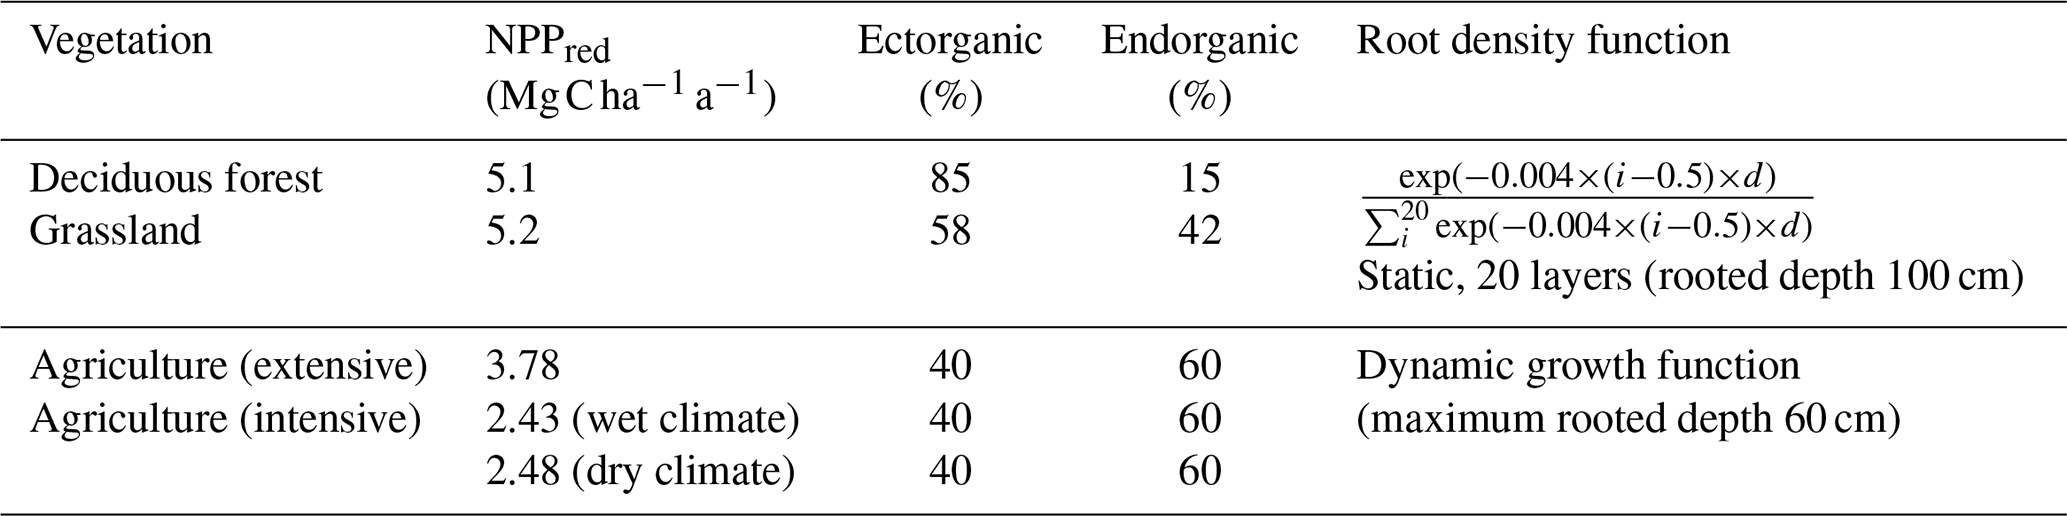
Table A1 gives the NPPred for each one of the vegetation types and the percentages that enter as leaf litter (ectorganic) and root litter (endorganic). Surface crop residues are considered leaf litter. Ectorganic SOC is vertically redistributed by bioturbation, transporting it deeper into the soil. Root litter is vertically distributed according to the root density function, which is static for natural vegetations and dynamic for agricultural crops.
A2 Soil organic carbon cycle
The SOC cycle is simulated using five different organic matter pools (DPM, RPM, BIO, HUM and CO2) and the amount of organic inputs (NPPred) in each soil layer (Fig. A2). IOM is considered to be absent. Every pool has its own decay rate constant (R1–R4, Table A2). The decomposed organic carbon is distributed over subsequent pools and lost as CO2 gas following distribution functions D1–D3.
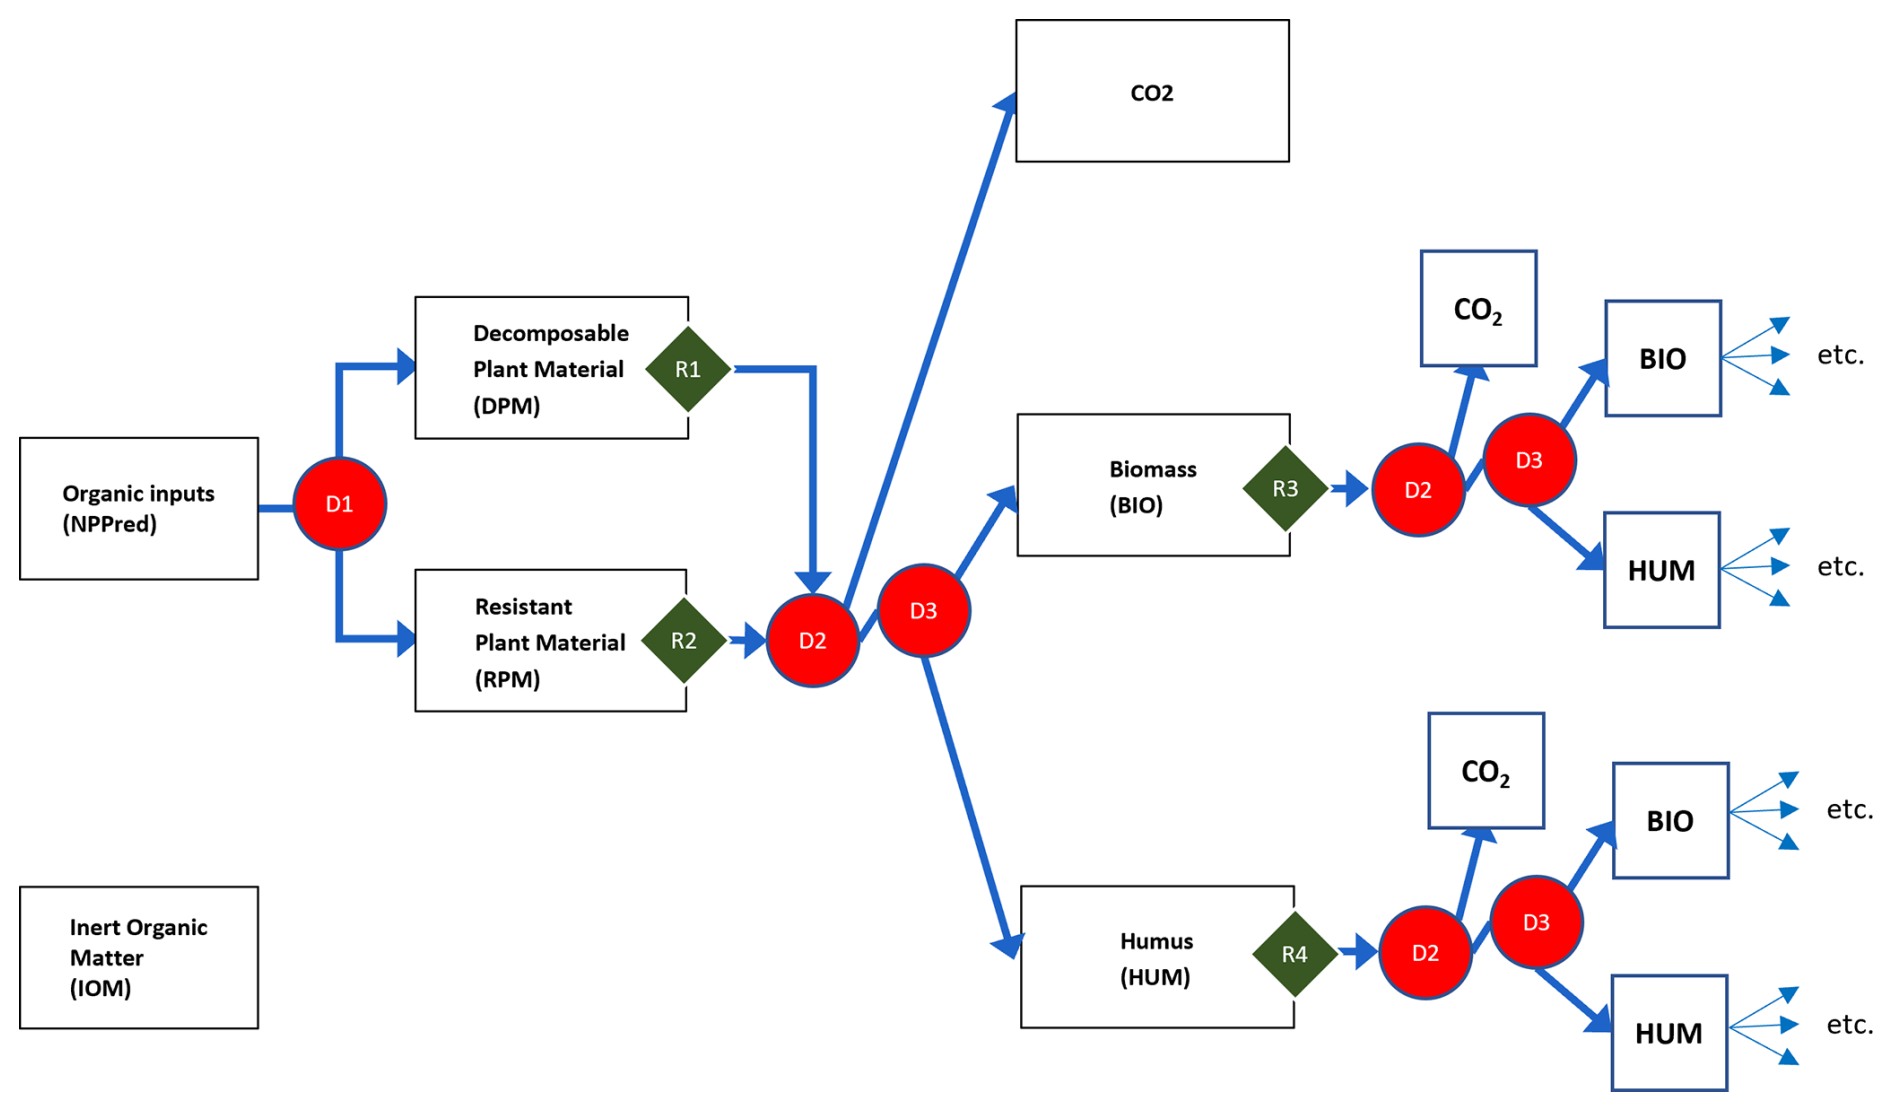
Figure A2Organic carbon pools (boxes) and conversions pathways (blue arrows) in SoilGen, based on RothC26.3 but applied on every layer of the simulated soil. D1, D2 and D3 are distribution functions to subsequent pools, R1, R2, R3 and R4 are pool-specific decay rate constants. “etc.” indicates continued conversion, re-starting at D2 with updated pools.
Table A2Process parameters for the carbon cycle. Abbreviations refer to Fig. A2.
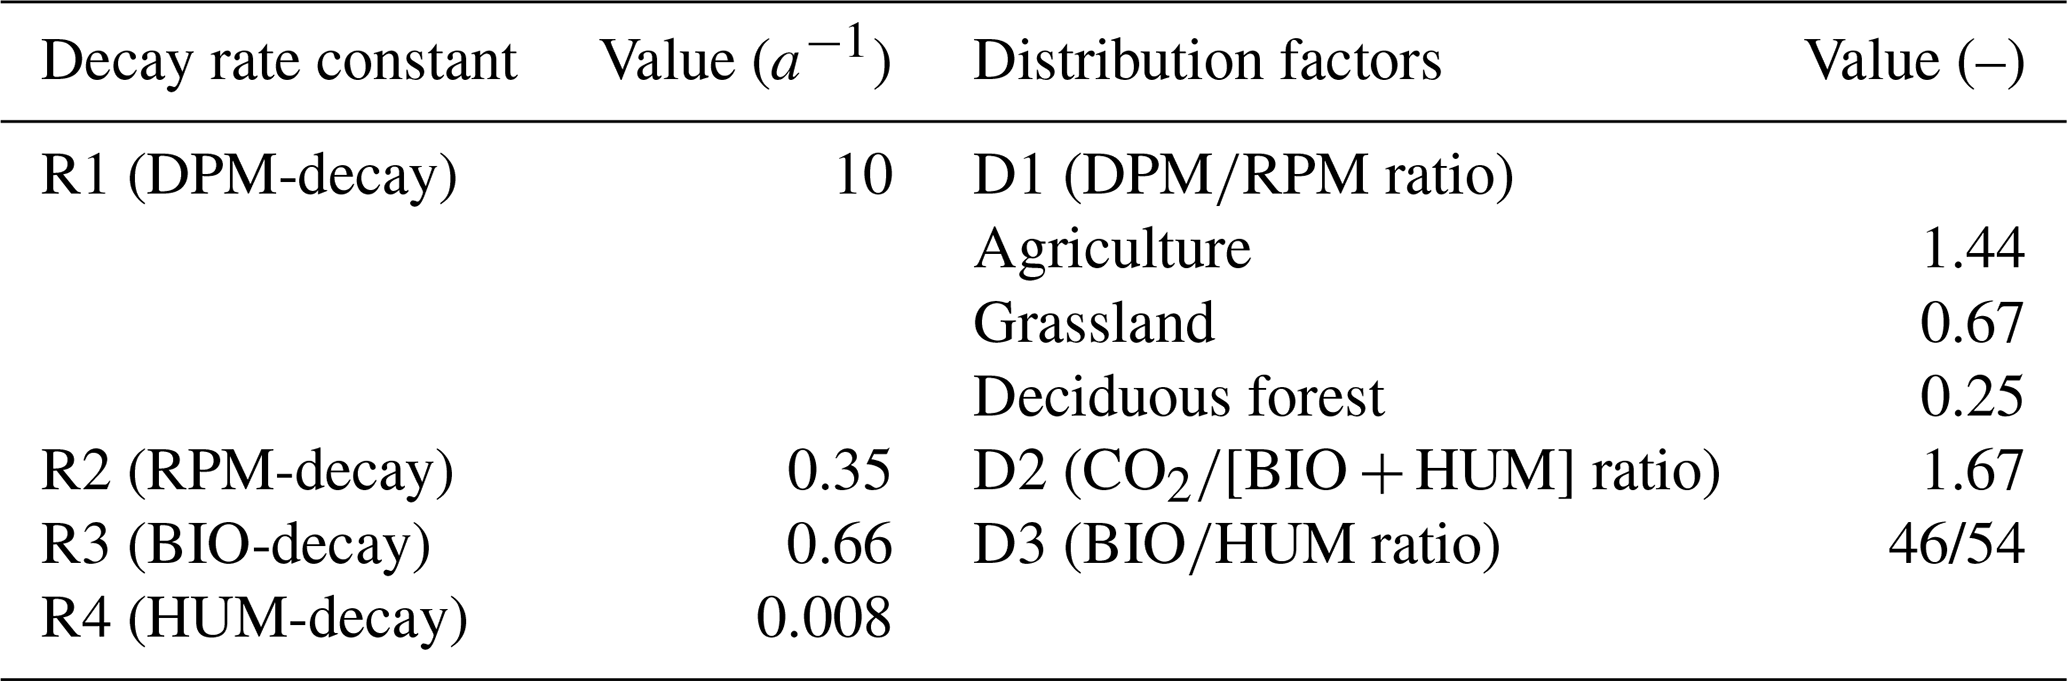
Both the ectorganic and endorganic parts of the organic inputs are divided into a resistant and a decomposable fraction according to a vegetation-dependent ratio (D1). Both fractions decompose into biomass, humus and CO2 with rate constants R1 and R2. Resulting biomass and humus pools further decay with rate constants R3 and R4. All decay rate constants are modified by soil temperature, soil moisture deficit, soil cover fraction, a protection factor and the time increment (c.f. Eq. 1):
where lossY is the loss during ∂t from pool Y, with default rate R and rate modifiers a for temperature, b for topsoil moisture deficit, c for crop cover and d for geochemical composition. All rate constants and distribution factors are the same for each layer, but as inputs and rate constant modifiers may vary vertically due to soil properties, actual SOC dynamics will also vary vertically.
A3 Decay rate constant modifiers
The modifier a for temperature is calculated following Eq. (A2):
where Ti is the average temperature (°C) during ∂t (of 1 d) in layer i. The constants correct for temperature differences to the Rothamsted site and are taken from RothC26.3.
The modifier b for topsoil moisture deficit is calculated slightly different from that in RothC26.3, following Eq. (A3):
where TSDMmax,i and TSDMacc,i are maximal c.q. accumulated topsoil moisture deficit for each soil layer i in the rooted zone (Eq. A4):
where i is the layer number, ∂z is the layer thickness (cm) and clayi is the clay content (%) in i. TSDMacc is calculated for the full rooted profile in any month using precipitation deficits of that month accumulated with deficits of previous months. TSDMacc is then vertically downscaled over the layers using the simulated air-filled pore volume as a (dynamic) indicator of drought. This differs from RothC26.3 in order to accommodate a layered profile and mimics the root water extraction pattern.
The modifier c for crop cover was added, because SOC decomposition has been found to be faster in fallow soil compared to cropped soil. It is calculated as in RothC26.3, using the simulated crop cover cc as input (Eq. A5):
The simulated crop cover in SoilGen depends on vegetation type and, for agricultural crops, the day in the growing season. For agricultural crops (assumedly barley), the crop cover increases from 0 at germination date to 100 % at crop maturity via an exponential function, and is reset to 0 at harvest (Eq. A6):
where t = Julian day, te = emergence day (1 March), tmc = maturity day (maximal crop cover) (1 May). Natural vegetations are assumed to have a constant crop cover of 100 %.
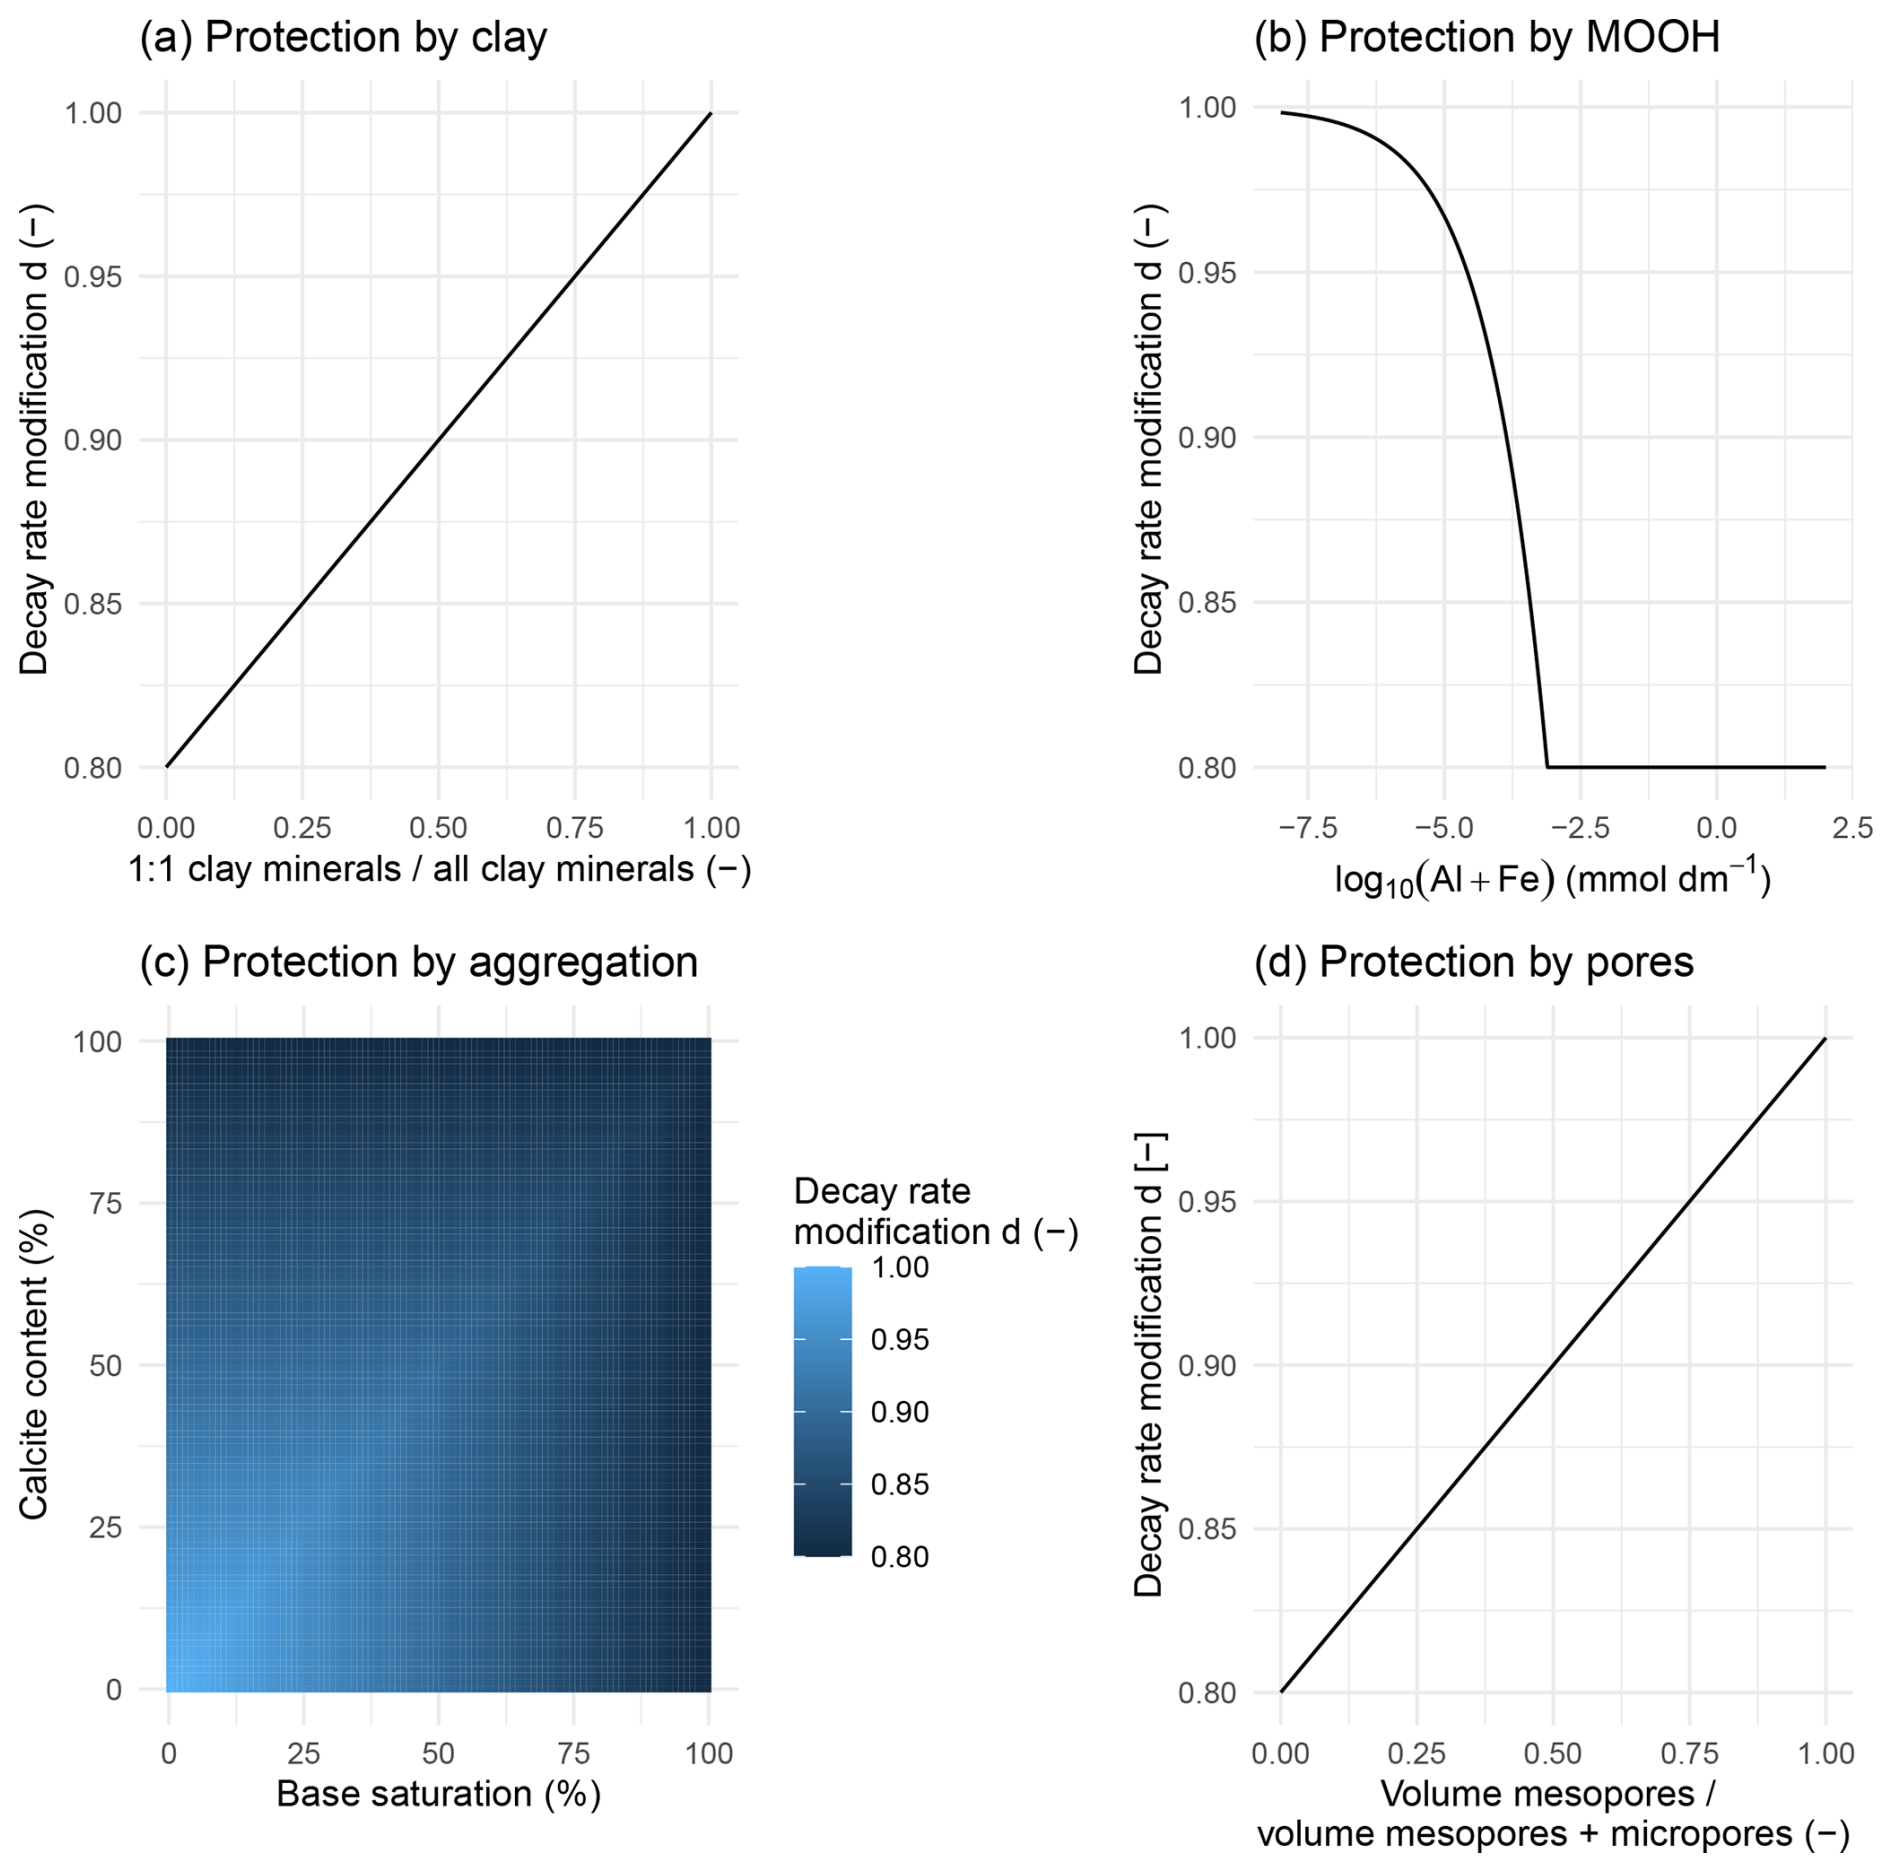
Figure A3SOC decay rate modifiers for (a) clay mineralogy, (b) metal oxyhydroxides (MOOHs), (c) aggregation and (d) porosity as influenced by soil variables. Rate modifiers vary between 0.8 (protection) to 1 (no protection).
The modifier d quantifies chemical and physical protection against decomposers. This modifier is described in detail in Sect. 2.1.3, and its dependence on soil properties are visualized in Fig. A3. Note that a value for d of 1 indicates “no chemical and physical protection”. A decreasing value indicates slower decomposition and thus more protection.
Note that all decay rate constants are the same for each soil layer, but their modifiers may vary due to dynamic soil properties that also vary by depth. All rate modifiers described above impact all pools (DPM, RPM, BIO and HUM) equally and thus affect R1–R4 (Fig. A2).
A4 Effects of agricultural practices
Considered agricultural practices are tillage (depth and intensity), fertilization (ions Ca2+, Mg2+, Na+, K+, Cl−, , and , thus including liming) and application of ground rock (maximally 19 minerals).
Tillage affects SOC decomposition as follows: by mixing, per plowed compartment texture and OC will change, affecting the h-θ-K relations and the bulk density. This will influence heat flow and water flow, impacting the temperature (a) and moisture deficit (b) modifiers (Eq. B1). Additionally, the geochemical modifiers may respond to mixing (e.g. via redistribution of calcite and ground rock, or by affecting texture, pore size distribution and clay mineralogy). The depth of tillage determines the vertical extension of the above adaptations by mixing. The intensity of the mixing determines the rate of homogenization. Tillage depth is higher in the intensive-agriculture period.
The effect of tillage or its absence on the disruption of aggregates is currently not a factor in SoilGen. Limited or no tillage can be simulated by limiting tillage depth and mixing intensity. No-till will in SoilGen lead to the formation of an ectorganic layer which will affect water and heat transport and impacting the temperature and moisture deficit modifiers a and b. However, there not yet comparisons between simulated no-till and field data.
Fertilization (e.g. liming) and addition of ground rock, and subsequent incorporation by tillage will also affect the geochemical modifier.
The effects of erosion and sedimentation due to (or independent from) agricultural activities leads to the removal or addition of compartments on top of the soil, which also removes or buries ectorganic material.
A5 Model calibration and verification
The SOC module was calibrated for various soils worldwide. In two case studies for humid tropical soils (Anindita et al., 2023) and semi-arid steppe soils (Finke et al., 2019), decay rate constants R1–R4 were calibrated using measured pools of DPM, RPM, BIO and HUM. In two other case studies for semi-arid loess soils in China (Ranathunga et al., 2022) and humid loess soils in Belgium (Yu et al., 2013), the total SOC was used to calibrate R1–R4 in a cross-validation approach. In the current study, values for the decay rate constants R1–R4 and distribution factors D1–D3 were averaged from these point calibration studies (Table A2). Several independent (i.e. without calibration) accuracy assessments were performed along a chronosequence of marine clays (Sauer et al., 2012), for various European soils (Opolot et al., 2015), specifically for French loess soils (Keyvanshokouhi et al., 2016) and for Belgian coversand soils (Zwertvaegher et al., 2013). Ranathunga et al. (2021) evaluated the development of SOC-pools over millennia under various levels of erosion with SoilGen.
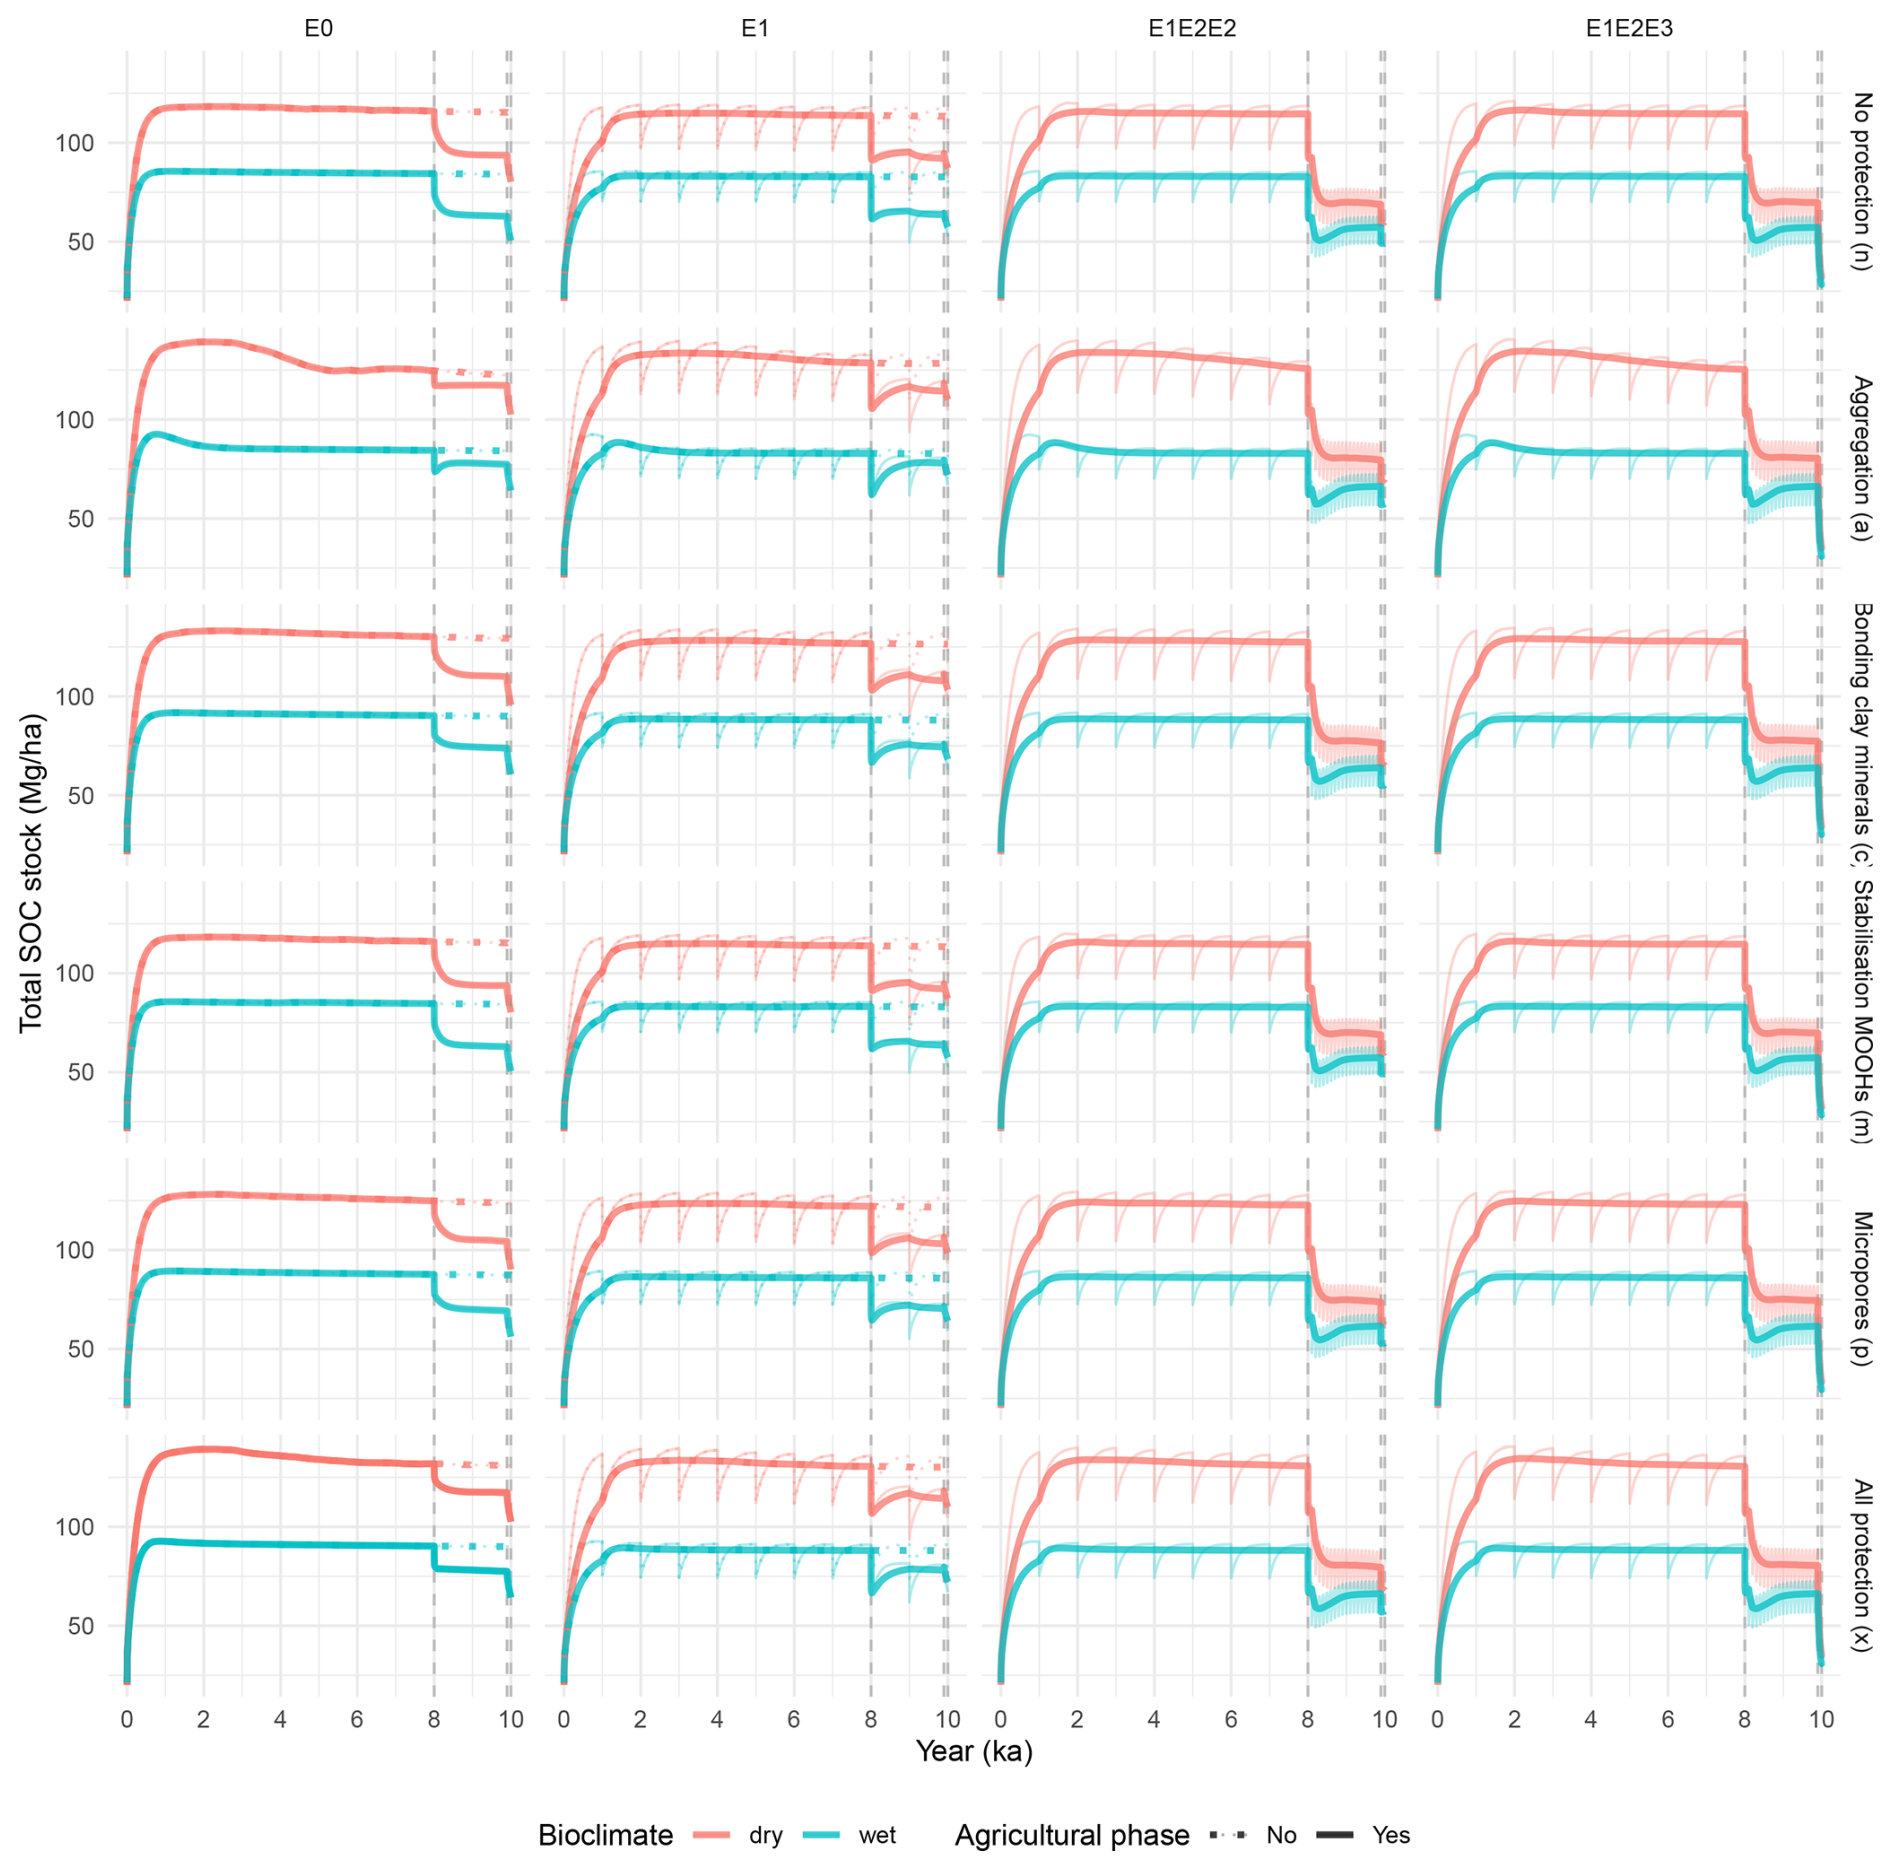
Figure B1Simulated SOC stock dynamics for different protection mechanisms (rows), erosion scenarios (columns), bioclimates (colours) and anthropogenic effects (line types). The thin lines visualize the raw model output, while the bold lines show the SOC stocks that are smoothed using a moving average. The dotted bold line depicts continued natural evolution.
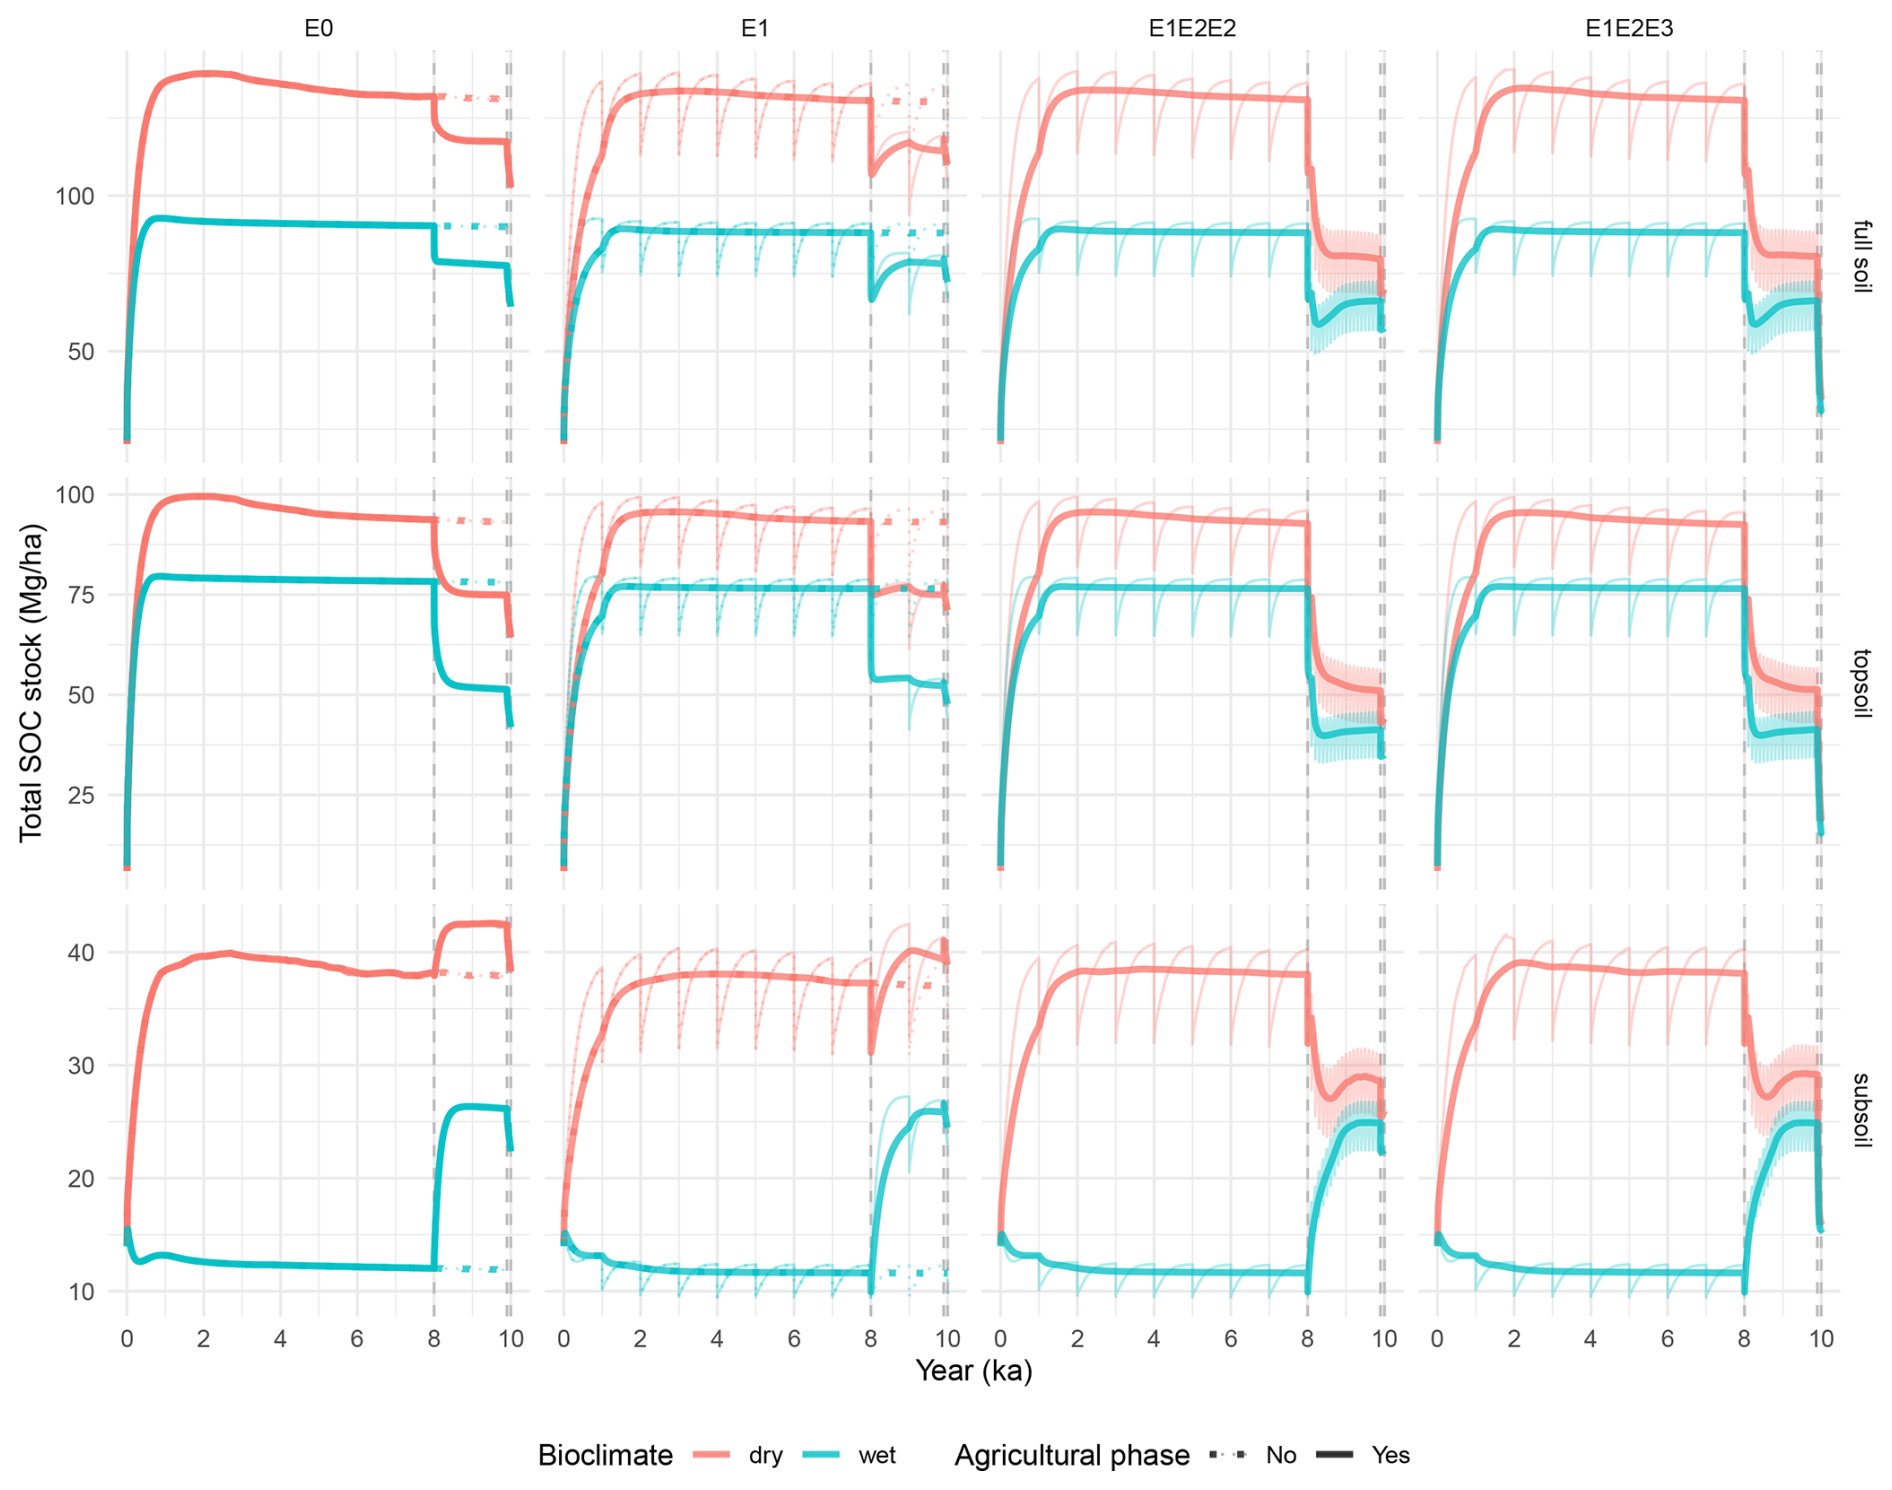
Figure B2Simulated SOC stock dynamics under different erosion scenarios (columns) separated for the entire soil profile, topsoil (< 25 cm) and subsoil (25–100 cm, rows), for both bioclimate scenarios (colours) and anthropogenic effects (line types). The simulations are based on all protection mechanisms combined (x). Note the different ranges on the Y axis. The thin lines visualize the raw model output, while the bold lines show the SOC stocks that are smoothed using a moving average. The dotted bold line depicts continued natural evolution.
SoilGen3.8.2 is freely available via the Zenodo repository (https://doi.org/10.5281/zenodo.13934823, Finke, 2024b) and documentation is provided in Finke (2024a). No data was collected in this study.
The study was conceptualized by both authors. PF ran the simulations, while MvdM analysed and visualised the results. The authors contributed equally to writing the paper.
At least one of the (co-)authors is a member of the editorial board of SOIL. The peer-review process was guided by an independent editor, and the authors also have no other competing interests to declare.
Publisher's note: Copernicus Publications remains neutral with regard to jurisdictional claims made in the text, published maps, institutional affiliations, or any other geographical representation in this paper. The authors bear the ultimate responsibility for providing appropriate place names. Views expressed in the text are those of the authors and do not necessarily reflect the views of the publisher.
This article is part of the special issue “Advances in dynamic soil modelling across scales”. It is not associated with a conference.
The writing in this manuscript has been refined using AI.
This open-access publication was funded by Universität zu Köln.
This paper was edited by Boris Jansen and reviewed by two anonymous referees.
Abramoff, R. Z., Guenet, B., Zhang, H., Georgiou, K., Xu, X., Viscarra Rossel, R. A., Yuan, W., and Ciais, P.: Improved global-scale predictions of soil carbon stocks with Millennial Version 2, Soil Biology and Biochemistry, 164, 108466, https://doi.org/10.1016/j.soilbio.2021.108466, 2022.
Alvarez, R.: A quantitative review of the effects of residue removing on soil organic carbon in croplands, Soil and Tillage Research, 240, 106098, https://doi.org/10.1016/j.still.2024.106098, 2024.
Andrén, O. and Kätterer, T.: ICBM: The Introductory Carbon Balance Model for Exploration of Soil Carbon Balances, Ecological Applications, 7, 1226–1236, https://doi.org/10.2307/2641210, 1997.
Anindita, S., Sleutel, S., and Finke, P. A.: Simulating soil organic carbon stock as affected by land use and climate change on volcanic soils in Indonesia, Geoderma Regional, 34, e00698, https://doi.org/10.1016/j.geodrs.2023.e00698, 2023.
Bauer, P., Stevens, B., and Hazeleger, W.: A digital twin of Earth for the green transition, Nat. Clim. Chang., 11, 80–83, https://doi.org/10.1038/s41558-021-00986-y, 2021.
Blair, G. S.: Digital twins of the natural environment, Patterns, 2, 100359, https://doi.org/10.1016/j.patter.2021.100359, 2021.
Bockheim, J. G. and Gennadiyev, A. N.: The role of soil-forming processes in the definition of taxa in Soil Taxonomy and the World Soil Reference Base, Geoderma, 95, 53–72, https://doi.org/10.1016/S0016-7061(99)00083-X, 2000.
Bruni, E., Chenu, C., Abramoff, R. Z., Baldoni, G., Barkusky, D., Clivot, H., Huang, Y., Kätterer, T., Pikuła, D., Spiegel, H., Virto, I., and Guenet, B.: Multi-modelling predictions show high uncertainty of required carbon input changes to reach a 4 ‰ target, European Journal of Soil Science, 73, e13330, https://doi.org/10.1111/ejss.13330, 2022.
Buss, W., Hasemer, H., Sokol, N. W., Rohling, E. J., and Borevitz, J.: Applying minerals to soil to draw down atmospheric carbon dioxide through synergistic organic and inorganic pathways, Commun. Earth Environ., 5, 602, https://doi.org/10.1038/s43247-024-01771-3, 2024.
Coucheney, E., Herrmann, A. M., and Jarvis, N.: A simple model of the turnover of organic carbon in a soil profile: model test, parameter identification and sensitivity, SOIL, 11, 715–733, https://doi.org/10.5194/soil-11-715-2025, 2025.
Creamer, R. E., Barel, J. M., Bongiorno, G., and Zwetsloot, M. J.: The life of soils: Integrating the who and how of multifunctionality, Soil Biology and Biochemistry, 166, 108561, https://doi.org/10.1016/j.soilbio.2022.108561, 2022.
Davis, B. A. S., Brewer, S., Stevenson, A. C., and Guiot, J.: The temperature of Europe during the Holocene reconstructed from pollen data, Quaternary Science Reviews, 22, 1701–1716, https://doi.org/10.1016/S0277-3791(03)00173-2, 2003.
European Commission: Regulation (EU) 2024/3012 of the European Parliament and of the Council of 27 November 2024 establishing a Union certification framework for permanent carbon removals, carbon farming and carbon storage in products, Regulation (EU) No. 2024/3012, http://data.europa.eu/eli/reg/2024/3012/oj (last access: 13 October 2025), 2024.
Feng, X., Dai, G., Liu, T., Jia, J., Zhu, E., Liu, C., Zhao, Y., Wang, Y., Kang, E., Xiao, J., and Li, W.: Understanding the mechanisms and potential pathways of soil carbon sequestration from the biogeochemistry perspective, Sci. China Earth Sci., 67, 3386–3396, https://doi.org/10.1007/s11430-024-1359-9, 2024.
Finke, P. A.: Modeling the genesis of luvisols as a function of topographic position in loess parent material, Quaternary International, 265, 3–17, https://doi.org/10.1016/j.quaint.2011.10.016, 2012.
Finke, P. A.: Modelling Soil Development Under Global Change, Springer Nature Switzerland, Cham, https://doi.org/10.1007/978-3-031-55583-1, 2024a.
Finke, P. A.: SoilGen3.8 model (code, executable, supporting software and cases), Zenodo [code], https://doi.org/10.5281/zenodo.13934823, 2024b.
Finke, P. A. and Hutson, J. L.: Modelling soil genesis in calcareous loess, Geoderma, 145, 462–479, https://doi.org/10.1016/j.geoderma.2008.01.017, 2008.
Finke, P. A., Samouëlian, A., Suarez-Bonnet, M., Laroche, B., and Cornu, S. S.: Assessing the usage potential of SoilGen2 to predict clay translocation under forest and agricultural land uses, European Journal of Soil Science, 66, 194–205, https://doi.org/10.1111/ejss.12190, 2015.
Finke, P. A., Opolot, E., Balesdent, J., Berhe, A. A., Boeckx, P., Cornu, S., Harden, J., Hatté, C., Williams, E., and Doetterl, S.: Can SOC modelling be improved by accounting for pedogenesis?, Geoderma, 338, 513–524, https://doi.org/10.1016/j.geoderma.2018.10.018, 2019.
Fuller, A., Fan, Z., Day, C., and Barlow, C.: Digital Twin: Enabling Technologies, Challenges and Open Research, IEEE Access, 8, 108952–108971, https://doi.org/10.1109/ACCESS.2020.2998358, 2020.
Georgiou, K., Jackson, R. B., Vindušková, O., Abramoff, R. Z., Ahlström, A., Feng, W., Harden, J. W., Pellegrini, A. F. A., Polley, H. W., Soong, J. L., Riley, W. J., and Torn, M. S.: Global stocks and capacity of mineral-associated soil organic carbon, Nat. Commun., 13, 3797, https://doi.org/10.1038/s41467-022-31540-9, 2022.
Gerke, H. H., Vogel, H.-J., Weber, T. K. D., van der Meij, W. M., and Scholten, T.: 3–4D soil model as challenge for future soil research: Quantitative soil modeling based on the solid phase, Journal of Plant Nutrition and Soil Science, 185, 720–744, https://doi.org/10.1002/jpln.202200239, 2022.
Hicks Pries, C. E., Ryals, R., Zhu, B., Min, K., Cooper, A., Goldsmith, S., Pett-Ridge, J., Torn, M., and Berhe, A. A.: The Deep Soil Organic Carbon Response to Global Change, Annual Review of Ecology, Evolution, and Systematics, 54, 375–401, https://doi.org/10.1146/annurev-ecolsys-102320-085332, 2023.
Huang, Y., Xin, Z., Ran, L., Qin, Y., and Cai, M.: Topsoil carbon sequestration of vegetation restoration on the Loess Plateau, Ecological Engineering, 177, 106570, https://doi.org/10.1016/j.ecoleng.2022.106570, 2022.
IUSS Working Group WRB: World reference base for soil resources 2022: International soil classification system for naming soils and creating legends for soil maps, 4th edition, International Union of Soil Sciences, Vienna, Austria, 2022.
Jenkinson, D. S. and Coleman, K.: Calculating the annual input of organic matter to soil from measurements of total organic carbon and radiocarbon, European Journal of Soil Science, 45, 167–174, https://doi.org/10.1111/j.1365-2389.1994.tb00498.x, 1994.
Jia, N., Li, L., Guo, H., and Xie, M.: Important role of Fe oxides in global soil carbon stabilization and stocks, Nat. Commun., 15, 10318, https://doi.org/10.1038/s41467-024-54832-8, 2024.
Jiang, R., Gunina, A., Qu, D., Kuzyakov, Y., Yu, Y., Hatano, R., Frimpong, K. A., and Li, M.: Afforestation of loess soils: Old and new organic carbon in aggregates and density fractions, CATENA, 177, 49–56, https://doi.org/10.1016/j.catena.2019.02.002, 2019.
Keyvanshokouhi, S., Cornu, S., Samouelian, A., and Finke, P. A.: Evaluating SoilGen2 as a tool for projecting soil evolution induced by global change, Science of The Total Environment, 571, 110–123, https://doi.org/10.1016/j.scitotenv.2016.07.119, 2016.
Keyvanshokouhi, S., Cornu, S., Lafolie, F., Balesdent, J., Guenet, B., Moitrier, N., Moitrier, N., Nougier, C., and Finke, P. A.: Effects of soil process formalisms and forcing factors on simulated organic carbon depth-distributions in soils, Science of The Total Environment, 652, 523–537, https://doi.org/10.1016/j.scitotenv.2018.10.236, 2019.
Kou, X., Morriën, E., Tian, Y., Zhang, X., Lu, C., Xie, H., Liang, W., Li, Q., and Liang, C.: Exogenous carbon turnover within the soil food web strengthens soil carbon sequestration through microbial necromass accumulation, Global Change Biology, 29, 4069–4080, https://doi.org/10.1111/gcb.16749, 2023.
Lal, R.: Intensive Agriculture and the Soil Carbon Pool, Journal of Crop Improvement, 27, 735–751, https://doi.org/10.1080/15427528.2013.845053, 2013.
López i Losada, R., Hedlund, K., Haddaway, N. R., Sahlin, U., Jackson, L. E., Kätterer, T., Lugato, E., Jørgensen, H. B., and Isberg, P.-E.: Synergistic effects of multiple “good agricultural practices” for promoting organic carbon in soils: A systematic review of long-term experiments, Ambio, 54, 1715–1728, https://doi.org/10.1007/s13280-025-02188-8, 2025.
Luo, Z., Wang, G., and Wang, E.: Global subsoil organic carbon turnover times dominantly controlled by soil properties rather than climate, Nat. Commun., 10, 3688, https://doi.org/10.1038/s41467-019-11597-9, 2019.
Maenhout, P., Di Bene, C., Cayuela, M. L., Diaz-Pines, E., Govednik, A., Keuper, F., Mavsar, S., Mihelic, R., O'Toole, A., Schwarzmann, A., Suhadolc, M., Syp, A., and Valkama, E.: Trade-offs and synergies of soil carbon sequestration: Addressing knowledge gaps related to soil management strategies, European Journal of Soil Science, 75, e13515, https://doi.org/10.1111/ejss.13515, 2024.
Maimour, M., Ahmed, A., and Rondeau, E.: Survey on digital twins for natural environments: A communication network perspective, Internet of Things, 25, 101070, https://doi.org/10.1016/j.iot.2024.101070, 2024.
Mao, X., Van Zwieten, L., Zhang, M., Qiu, Z., Yao, Y., and Wang, H.: Soil parent material controls organic matter stocks and retention patterns in subtropical China, J. Soils Sediments, 20, 2426–2438, https://doi.org/10.1007/s11368-020-02578-3, 2020.
Meng, X., Kooijman, A. M., Temme, A. J. A. M., and Cammeraat, E. L. H.: The current and future role of biota in soil-landscape evolution models, Earth-Science Reviews, 103945, https://doi.org/10.1016/j.earscirev.2022.103945, 2022.
Meurer, K. H. E., Chenu, C., Coucheney, E., Herrmann, A. M., Keller, T., Kätterer, T., Nimblad Svensson, D., and Jarvis, N.: Modelling dynamic interactions between soil structure and the storage and turnover of soil organic matter, Biogeosciences, 17, 5025–5042, https://doi.org/10.5194/bg-17-5025-2020, 2020.
Minasny, B., Finke, P. A., Stockmann, U., Vanwalleghem, T., and McBratney, A. B.: Resolving the integral connection between pedogenesis and landscape evolution, Earth-Science Reviews, 150, 102–120, https://doi.org/10.1016/j.earscirev.2015.07.004, 2015.
Minasny, B., Malone, B. P., McBratney, A. B., Angers, D. A., Arrouays, D., Chambers, A., Chaplot, V., Chen, Z.-S., Cheng, K., Das, B. S., Field, D. J., Gimona, A., Hedley, C. B., Hong, S. Y., Mandal, B., Marchant, B. P., Martin, M., McConkey, B. G., Mulder, V. L., O'Rourke, S., Richer-de-Forges, A. C., Odeh, I., Padarian, J., Paustian, K., Pan, G., Poggio, L., Savin, I., Stolbovoy, V., Stockmann, U., Sulaeman, Y., Tsui, C.-C., Vågen, T.-G., Van Wesemael, B., and Winowiecki, L.: Soil carbon 4 per mille, Geoderma, 292, 59–86, https://doi.org/10.1016/j.geoderma.2017.01.002, 2017.
Nave, L. E., Swanston, C. W., Mishra, U., and Nadelhoffer, K. J.: Afforestation Effects on Soil Carbon Storage in the United States: A Synthesis, Soil Science Society of America Journal, 77, 1035–1047, https://doi.org/10.2136/sssaj2012.0236, 2013.
Nazir, M. J., Li, G., Nazir, M. M., Zulfiqar, F., Siddique, K. H. M., Iqbal, B., and Du, D.: Harnessing soil carbon sequestration to address climate change challenges in agriculture, Soil and Tillage Research, 237, 105959, https://doi.org/10.1016/j.still.2023.105959, 2024.
Olson, K. R., Al-Kaisi, M., Lal, R., and Cihacek, L.: Impact of soil erosion on soil organic carbon stocks, Journal of Soil and Water Conservation, 71, 61A-67A, https://doi.org/10.2489/jswc.71.3.61A, 2016.
Opolot, E. and Finke, P. A.: Evaluating sensitivity of silicate mineral dissolution rates to physical weathering using a soil evolution model (SoilGen2.25), Biogeosciences, 12, 6791–6808, https://doi.org/10.5194/bg-12-6791-2015, 2015.
Opolot, E., Yu, Y. Y., and Finke, P. A.: Modeling soil genesis at pedon and landscape scales: Achievements and problems, Quaternary International, 376, 34–46, https://doi.org/10.1016/j.quaint.2014.02.017, 2015.
Paradelo, R., Virto, I., and Chenu, C.: Net effect of liming on soil organic carbon stocks: A review, Agriculture, Ecosystems & Environment, 202, 98–107, https://doi.org/10.1016/j.agee.2015.01.005, 2015.
Parewai, I. and Köppen, M.: A Digital Twin Approach for Soil Moisture Measurement with Physically Based Rendering Simulations and Machine Learning, Electronics, 14, 395, https://doi.org/10.3390/electronics14020395, 2025.
Peltre, C., Christensen, B. T., Dragon, S., Icard, C., Kätterer, T., and Houot, S.: RothC simulation of carbon accumulation in soil after repeated application of widely different organic amendments, Soil Biology and Biochemistry, 52, 49–60, https://doi.org/10.1016/j.soilbio.2012.03.023, 2012.
Ranathunga, K. N., Finke, P. A., Yin, Q., Verdoodt, A., and Yu, Y.: Soil modeling for soil loss tolerance estimations: Exploring natural baselines and long-term variations, Global and Planetary Change, 204, 103548, https://doi.org/10.1016/j.gloplacha.2021.103548, 2021.
Ranathunga, K. N., Finke, P. A., Yin, Q., and Yu, Y.: Calibrating SoilGen2 for interglacial soil evolution in the Chinese Loess Plateau considering soil parameters and the effect of dust addition rhythm, Quaternary International, 607, 100–112, https://doi.org/10.1016/j.quaint.2021.08.019, 2022.
Sallaba, F., Lehsten, D., Seaquist, J., and Sykes, M. T.: A rapid NPP meta-model for current and future climate and CO2 scenarios in Europe, Ecological Modelling, 302, 29–41, https://doi.org/10.1016/j.ecolmodel.2015.01.026, 2015.
Salomé, C., Nunan, N., Pouteau, V., Lerch, T. Z., and Chenu, C.: Carbon dynamics in topsoil and in subsoil may be controlled by different regulatory mechanisms, Global Change Biology, 16, 416–426, https://doi.org/10.1111/j.1365-2486.2009.01884.x, 2010.
Sanderman, J., Hengl, T., and Fiske, G. J.: Soil carbon debt of 12,000 years of human land use, P. Natl. Acad. Sci. USA, 114, 9575–9580, https://doi.org/10.1073/pnas.1706103114, 2017.
Sauer, D., Schülli-Maurer, I., Sperstad, R., Sørensen, R., and Stahr, K.: Albeluvisol development with time in loamy marine sediments of southern Norway, Quaternary International, 209, 31–43, https://doi.org/10.1016/j.quaint.2008.09.007, 2009.
Sauer, D., Finke, P. A., Sørensen, R., Sperstad, R., Schülli-Maurer, I., Høeg, H., and Stahr, K.: Testing a soil development model against southern Norway soil chronosequences, Quaternary International, 265, 18–31, https://doi.org/10.1016/j.quaint.2011.12.018, 2012.
Scheel, T., Jansen, B., Van Wijk, A. J., Verstraten, J. M., and Kalbitz, K.: Stabilization of dissolved organic matter by aluminium: a toxic effect or stabilization through precipitation?, European Journal of Soil Science, 59, 1122–1132, https://doi.org/10.1111/j.1365-2389.2008.01074.x, 2008.
Silva, L., Rodríguez-Sedano, F., Baptista, P., and Coelho, J. P.: The Digital Twin Paradigm Applied to Soil Quality Assessment: A Systematic Literature Review, Sensors, 23, 1007, https://doi.org/10.3390/s23021007, 2023.
Temme, A. J. A. M., Armitage, J., Attal, M., Gorp, W. van, Coulthard, T. J., and Schoorl, J. M.: Developing, choosing and using landscape evolution models to inform field-based landscape reconstruction studies, Earth Surface Processes and Landforms, 42, 2167–2183, https://doi.org/10.1002/esp.4162, 2017.
Tsakiridis, N. L., Samarinas, N., Kalopesa, E., and Zalidis, G. C.: Cognitive Soil Digital Twin for Monitoring the Soil Ecosystem: A Conceptual Framework, Soil Systems, 7, 88, https://doi.org/10.3390/soilsystems7040088, 2023.
Van de roek, M., Govers, G., Schrumpf, M., and Six, J.: A microbially driven and depth-explicit soil organic carbon model constrained by carbon isotopes to reduce parameter equifinality, Biogeosciences, 22, 1427–1446, https://doi.org/10.5194/bg-22-1427-2025, 2025.
Van der Meij, W. M., Temme, A. J. A. M., Lin, H. S., Gerke, H. H., and Sommer, M.: On the role of hydrologic processes in soil and landscape evolution modeling: concepts, complications and partial solutions, Earth-Science Reviews, 185, 1088–1106, https://doi.org/10.1016/j.earscirev.2018.09.001, 2018.
Van Oost, K. and Six, J.: Reconciling the paradox of soil organic carbon erosion by water, Biogeosciences, 20, 635–646, https://doi.org/10.5194/bg-20-635-2023, 2023.
van Wesemael, B., Abdelbaki, A., Ben-Dor, E., Chabrillat, S., d'Angelo, P., Demattê, J. A. M., Genova, G., Gholizadeh, A., Heiden, U., Karlshoefer, P., Milewski, R., Poggio, L., Sabetizade, M., Sanz, A., Schwind, P., Tsakiridis, N., Tziolas, N., Yagüe, J., and Žížala, D.: A European soil organic carbon monitoring system leveraging Sentinel 2 imagery and the LUCAS soil data base, Geoderma, 452, 117113, https://doi.org/10.1016/j.geoderma.2024.117113, 2024.
Viscarra Rossel, R. A., Behrens, T., Ben-Dor, E., Brown, D. J., Demattê, J. A. M., Shepherd, K. D., Shi, Z., Stenberg, B., Stevens, A., Adamchuk, V., Aïchi, H., Barthès, B. G., Bartholomeus, H. M., Bayer, A. D., Bernoux, M., Böttcher, K., Brodský, L., Du, C. W., Chappell, A., Fouad, Y., Genot, V., Gomez, C., Grunwald, S., Gubler, A., Guerrero, C., Hedley, C. B., Knadel, M., Morrás, H. J. M., Nocita, M., Ramirez-Lopez, L., Roudier, P., Campos, E. M. R., Sanborn, P., Sellitto, V. M., Sudduth, K. A., Rawlins, B. G., Walter, C., Winowiecki, L. A., Hong, S. Y., and Ji, W.: A global spectral library to characterize the world's soil, Earth-Science Reviews, 155, 198–230, https://doi.org/10.1016/j.earscirev.2016.01.012, 2016.
Wiesmeier, M., Urbanski, L., Hobley, E., Lang, B., Von Lützow, M., Marin-Spiotta, E., Van Wesemael, B., Rabot, E., Ließ, M., Garcia-Franco, N., Wollschläger, U., Vogel, H.-J., and Kögel-Knabner, I.: Soil organic carbon storage as a key function of soils – A review of drivers and indicators at various scales, Geoderma, 333, 149–162, https://doi.org/10.1016/j.geoderma.2018.07.026, 2019.
Wösten, J. H. M., Lilly, A., Nemes, A., and Le Bas, C.: Development and use of a database of hydraulic properties of European soils, Geoderma, 90, 169–185, https://doi.org/10.1016/S0016-7061(98)00132-3, 1999.
Yu, Y. Y., Finke, P. A., Wu, H. B., and Guo, Z. T.: Sensitivity analysis and calibration of a soil carbon model (SoilGen2) in two contrasting loess forest soils, Geosci. Model Dev., 6, 29–44, https://doi.org/10.5194/gmd-6-29-2013, 2013.
Zeng, Y., Verhoef, A., Vereecken, H., Ben-Dor, E., Veldkamp, T., Shaw, L., Van Der Ploeg, M., Wang, Y., and Su, Z.: Monitoring and Modeling the Soil-Plant System Toward Understanding Soil Health, Reviews of Geophysics, 63, e2024RG000836, https://doi.org/10.1029/2024RG000836, 2025.
Zhang, J., Quine, T. A., Ni, S., and Ge, F.: Stocks and dynamics of SOC in relation to soil redistribution by water and tillage erosion, Global Change Biology, 12, 1834–1841, https://doi.org/10.1111/j.1365-2486.2006.01206.x, 2006.
Zhang, L., Yang, L., Crowther, T. W., Zohner, C. M., Doetterl, S., Heuvelink, G. B. M., Wadoux, A. M. J.-C., Zhu, A.-X., Pu, Y., Shen, F., Ma, H., Zou, Y., and Zhou, C.: Mapping global distributions, environmental controls, and uncertainties of apparent topsoil and subsoil organic carbon turnover times, Earth Syst. Sci. Data, 17, 2605–2623, https://doi.org/10.5194/essd-17-2605-2025, 2025.
Zwertvaegher, A., Finke, P. A., De Smedt, P., Gelorini, V., Van Meirvenne, M., Bats, M., De Reu, J., Antrop, M., Bourgeois, J., and De Maeyer, P.: Spatio-temporal modeling of soil characteristics for soilscape reconstruction, Geoderma, 207, 166–179, https://doi.org/10.1016/j.geoderma.2013.05.013, 2013.