the Creative Commons Attribution 4.0 License.
the Creative Commons Attribution 4.0 License.
 | 17 Nov 2023
The QuantiSlakeTest, measuring soil structural stability by dynamic weighing of undisturbed samples immersed in water
Frédéric Marie Vanwindekens
Brieuc François Hardy
We evaluated the performance of a new, simple test to evaluate soil structural stability. The QuantiSlakeTest (QST) consists in a quantitative approach of the slake test, a dynamic weighing of a dried structured soil sample once immersed in water. The objective of this work was threefold: we aimed to (i) derive indicators from QST curves to evaluate soil structural stability, (ii) establish the relationship between soil properties and QST indicators, and (iii) assess how QST indicators respond to contrasting soil management practices. To reach these goals, we sampled the soil of 35 plots from three long-term field trials in the silt loam region of Belgium dealing respectively with contrasting organic matter inputs, tillage and P–K fertilisation. For each plot, indicators calculated from QST curves (e.g. total relative mass loss, disaggregation speed and time to meet a threshold values of mass loss) were compared to the results of the three tests of Le Bissonnais (1996), used as a reference method for the measurement of soil aggregate stability.
Shortly after immersion in water, soil mass increases due to the rapid replacement of air by water in soil porosity. Then soil mass reaches a maximum before decreasing, once mass loss by disaggregation exceeds mass gain by air loss. Our results confirmed that the early mass loss under water is mainly related to slaking, whereas after a longer time period, clay dispersion and differential swelling become the dominant processes of soil disaggregation. The overall soil structural stability was positively correlated to the soil organic carbon (SOC) content and negatively correlated to the clay content of soil. Consequently, the SOC : clay ratio was closely related to QST indicators. Nevertheless, for a similar mean annual carbon (C) input, green manure and crop residues were more efficient in decreasing clay dispersivity and differential swelling, whereas farmyard manure promoted SOC storage and was more efficient against slaking. QST curves had a strong discriminating power between reduced tillage and ploughing regardless of the indicator, as reduced tillage increases both total SOC content and root biomass in the topsoil.
The QST has several advantages. It (i) is rapid to run, (ii) does not require expensive equipment or consumables, and (iii) provides a high density of information on both specific mechanisms of soil disaggregation and the overall soil structural stability. As an open-access programme for QST data management is currently under development, the test has a strong potential for adoption by a widespread community of end users.
- Article
(3340 KB) - Full-text XML
- BibTeX
- EndNote


Soil structure is one of the main factors controlling the fertility of temperate agricultural soils subject to intensive cultivation (Lal, 1991). This is particularly true for Luvisols of the loess belt of western Europe, which are among the most productive soils of Europe and therefore have experienced a long cropping history (Castaldi et al., 2018). The high productivity of these soils is primarily related to their high plant-available water storage capacity as they are deep and stone-free and have a texture largely dominated by silt, up to 85 % in the topsoil. In addition, these soils, which developed on Quaternary loess deposited < 170 000 years ago (Antoine et al., 2003), still contain unweathered primary minerals in the subsoil, acting as a source of nutrients for plants (Vancampenhout et al., 2013). Their clay fraction is dominated by high-activity clays, which provides a favourable cation exchange capacity for plant-available nutrient retention.
Since deforestation centuries ago, the chemical and biological fertility of these soils has increased over the course of cultivation, with topsoil pH, base saturation and earthworm activity increasing following repeated applications of organic and mineral fertilisers and amendments (Langohr, 2001). Nevertheless, today, many of these soils have poor structural stability, which makes them particularly sensitive to physical damage such as compaction and erosion (Bielders et al., 2003). This structural weakness is related to a silt-dominated texture and enhanced by low soil organic matter (SOM) content in the topsoil. Between the 1960s and 2005, cropland soils of the loess belt of Belgium lost 14 tC ha−1 on average, mainly caused by a shift from mixed crop–livestock farming systems towards arable farming systems, with a progressive disconnection from animal husbandry (Goidts and van Wesemael, 2007). This shift caused a decrease in farmyard manure application on cropland soil and a replacement of cereals and temporary grasslands by spring crops such as sugar beet, potato and chicory (Goidts and van Wesemael, 2007), thereby decreasing soil organic carbon (SOC) inputs. In parallel, the overall increase in ploughing depth, which dilutes SOM vertically, has accentuated the decrease in SOC content in the topsoil layer (Meersmans et al., 2009). The Ap horizon of these soils has a typical SOC content of about 10 g kg−1 (Meersmans et al., 2011), which is clearly below the threshold value of 11.5 g kg−1 generally considered critical for aggregate stability (Van Camp et al., 2004). The combination of a poor soil structural stability with an incomplete soil cover during the winter and spring periods (given the high proportion of spring crops in the rotation) increases erosion risk (Bielders et al., 2003), particularly under the growing risk of occurrence of extreme climatic events induced by climate change (IPCC, 2014).
In this agricultural context, conservation tillage appears to be an effective way to decrease soil susceptibility to erosion and therefore has been increasingly adopted by farmers within the last 20 years. The replacement of moldboard ploughing by reduced tillage operations such as stubble cultivation has a positive effect on soil structure and water infiltration (Chabert and Sarthou, 2020; Holland, 2004), dramatically decreasing erosion risks (Seitz et al., 2019). Soil erosion is governed by rainfall erosivity, topographic factors, soil cover and intrinsic soil erodibility, depending on several soil properties such as hydraulic conductivity and aggregate stability (Alewell et al., 2019; Maugnard et al., 2013). Owing to the difficulty of measuring soil erosion and runoff, soil aggregate stability is often used as an indicator of soil erodibility (Barthès and Roose, 2002).
The process of soil aggregation is key to understanding the factors controlling soil aggregate stability. The theory of aggregate hierarchy of Hadas (1987) is widely accepted to conceptualise the internal organisation of soil aggregates. At the lowest level, elementary clay plates (< 2 µm) combine into clay floccules or domains, with a degree of organisation depending on clay mineralogy (quasi-crystals > domains > assemblage; Dexter, 1988). Domains combine into clusters (2–20 µm) under the action of binding agents such as polyvalent cations (Al3+ in strongly acidic soils and Ca2+ and Mg2+ in slightly acidic to slightly basic soils); Fe, Al and Mn oxides; and organic compounds, mainly polysaccharides from bacterial and fungal mucilages or root exudates (Dexter, 1988; Tisdall and Oades, 1982). They can be very stable and contain organic acids or partially degraded bio-materials. These clusters combine into micro-aggregates 20–250 µm in size (Edwards and Bremner, 1967; Six et al., 2004) that further combine into macro-aggregates (> 250 µm) under the action of wetting and drying cycles (Dexter, 1988). Roots and fungal hyphae enmeshing micro-aggregates are recognised as critical binding agents in macro-aggregates, which are therefore influenced by soil management practices such as crop rotation and tillage (Tisdall and Oades, 1982). Clods (> 25 mm) constitute the upper level of soil aggregation and are, in many agricultural soils, the result of compaction by agricultural machinery (Dexter, 1988). Under disaggregating forces, the destruction of one hierarchical order automatically destroys all higher hierarchical orders (Dexter, 1988).
Aggregate breakdown is controlled by four mechanisms (Le Bissonnais, 1996; Le Bissonnais and Le Souder, 1995): (i) slaking occurs during fast wetting of a soil and consists in the fragmentation of macro-aggregates into micro-aggregates by internal pressure exerted by air entrapment in soil porosity. (ii) Mechanical breakdown by raindrop impact, also known as splash erosion, initiates soil sealing and crusting by liberating elementary particles from soil aggregates. Its magnitude depends on raindrop characteristics as well as on internal soil cohesion, which decreases logarithmically with increasing water content (Dexter, 1988). The resistance of soil to mechanical breakdown possibly also improves resistance to soil compaction due to traffic on the field. (iii) The breakdown by differential swelling occurs during soil wetting and depends on both the abundance and swelling properties of clay particles in soil. Differential swelling plays a role at both macroscopic and microscopic scales and may split the soil into macro- or micro-aggregates (Le Bissonnais, 1996). (iv) Physico-chemical or clay dispersion is the last mechanism, occurring when soil is wet. Clay dispersion depends on the ionic status of the soil (ionic strength in soil solution and the exchangeable sodium percentage) as well as the mineralogy of clays. Clay dispersion jeopardises the smallest level of soil aggregation (namely quasi-crystals, domains or assemblages of clay particles) to liberate elementary particles, which deteriorates any upper level of soil aggregation (Dexter, 1988).
A large number of laboratory methods exist for the measurement of soil aggregate stability. Traditional methods are destructive and rely on the resistance of soil aggregates or undisturbed cores to fragmentation under wet or, less often, dry conditions. Some wet fragmentation methods rely on the disaggregating power of the wetting treatment only, such as percolation stability (e.g. Mbagwu and Auerswald, 1999; Wuddivira et al., 2009), high energy moisture content (e.g. Levy and Mamedov, 2002), or fast and slow wetting (e.g. Le Bissonnais, 1996). Other methods in wet conditions rely on an additional energy input, such as wet sieving methods (e.g. Hénin et al., 1958; Kemper and Rosenau, 1986; Yoder, 1936), those involving shaking or ultrasonication for clay dispersion (e.g. Haynes, 1993; Zhu et al., 2016), disaggregation by raindrop impact (e.g. Imeson and Vis, 1984), or rainfall simulators (e.g. Loch and Foley, 1989).
Recently, the SLAKES mobile application provided encouraging results as a tool for rapid data acquisition on soil structure. The test relies on image recognition to measure the increase in area of a soil aggregate as it disperses in water (Bagnall and Morgan, 2021; Fajardo et al., 2016; Jones et al., 2021). The potential of some non-destructive methods for the evaluation of soil structure and aggregation has also been revealed, such as aggregate delineation by analysis of X-ray microtomography images (Koestel et al., 2021) or aggregate stability prediction by visible–near-infrared (VIS-NIR) spectroscopy (Shi et al., 2020).
The multiplicity of methods highlights how challenging the measurement of soil aggregate stability is. From one study to another, the preferred approach is a matter of compromise depending on (i) the objective of the work (evaluation of soil structure, management of erosion or compaction risks); (ii) local conditions of soil, topography, climate and cropping (the drivers of erosion or compaction risks); (iii) the technicality, cost and labour requirement of measurement; and (iv) the spatial scale of the soil unit to investigate.
In this work, we evaluated the performance of a new, simple test to measure soil structural stability, named the QuantiSlakeTest (QST). It is a quantitative approach of the slake test, a visual qualitative test to illustrate the impact of soil management practices on soil structure. It consists in the dynamic weighing of a structured soil sample suspended in demineralised water. This approach has the advantage of being simple, rapid and dynamic, therefore providing a high density of information throughout the process of soil wetting and disaggregation under water. The test works on soil cores of a large volume (100 cm3); therefore we consider that QST provides measurements of soil “structural stability” rather than aggregate stability (related to the properties of isolated aggregates).
The objective of this work was threefold: we aimed to (i) unravel the mechanisms controlling the change in soil mass upon immersion in water and derive indicators from the QST curves to evaluate soil structural stability; (ii) investigate the relationship between soil properties and QST indicators, particularly SOC and clay contents; and (iii) assess how QST indicators respond to contrasting soil management practices.
To achieve these goals, we sampled the soil of 35 plots from three long-term field trials of the Walloon agricultural research centre (Centre wallon de recherches agronomiques, CRA-W) dealing respectively with contrasting practices of organic matter (OM) inputs, tillage and P–K fertilisation. For each plot, we compared the QST indicators to the mean weight diameters (MWDs) and the percentage of macro-aggregates (MA, > 200 µm) from the three tests of Le Bissonnais (1996), used as a reference method.
2.1 Description of the field trials
The soils under study have been subject to contrasting soil management practices in three long-term field experiments dealing with soil tillage, organic matter inputs and P–K mineral fertilisation, respectively. All trials are located on the agricultural station of the CRA-W in Gembloux, a town in the centre of the silt loam region of Wallonia, southern Belgium. The climate is oceanic temperate, with a mean annual temperature of 10.2 ∘C and a mean annual rainfall of 793 mm for the 1991–2020 period (https://www.meteo.be/resources/climatology/climateCity/pdf/climate_INS92142_9120_fr.pdf, last access: 21 October 2023). All soils are developed from loess, a silt-dominated unconsolidated and stone-free Quaternary sediment (Antoine et al., 2003). Soils are classified as Hortic Luvisols according to the WRB (Anjos et al., 2014). In April 2019, when the soil sampling was carried out, the three trials were covered with winter wheat (Triticum aestivum).
2.1.1 Organic matter trial
The organic matter trial (OM trial; 50.560∘ N, 4.726∘ E) was set up in 1959, with the initial goal of addressing the issue of decreasing organic matter inputs (farmyard manure, crop by-products) on cropland soils of the silt loam region and related consequences for soil properties, crop yields and farm profitability (Roisin, 2018). The trial includes six contrasting treatments of SOM restitution in plots of 70 m × 10 m, repeated six times, following a Latin square design. From 1959 to 1974, the field was cropped according to a 4-year rotation with sugar beet (Beta vulgaris) as the starter crop, followed by 3 years of winter cereals – wheat, oat (Avena sativa), barley (Hordeum vulgare) – or two winter cereals – wheat, barley/oat – and one legume – horse bean (Vicia faba). Cultivation cycle shifted from 1975 onwards to a 3-year sugar beet–winter wheat–winter barley rotation. Among the six treatments described by Buysse et al. (2013b), three were selected for soil sampling in 18 plots. The “residue exportation” (RE) treatment consists in the maximal exportation of by-products (straws and sugar beet heads and leaves) and no farmyard manure application nor green manure during the intercropping period. Since 2009, however, sugar beet heads and leaves have been left on the field. The “farmyard manure” (FYM) treatment consists in one application of 30 to 60 t ha−1 of composted cattle manure once per rotation, after the harvest of the winter barley, in order to enrich the soil for the sugar beet. The last application before soil sampling occurred on the 26 July 2017. In the “residue restitution” (RR) treatment, all crop by-products (cereal straws and sugar beet heads and leaves) are left on the fields, and one cover crop acting as a green manure is sown once per rotation during the intercropping period between the winter barley and the sugar beet. Cover crops were vetches (Vicia sp.) until 2009, except (i) mustard (Sinapis alba) in 1980; (ii) phacelia (Phacelia sp.) in 2011 and 2014; and (iii) a mix of oat, vetch and clover (Trifolium sp.) in 2017. The estimated mean and standard deviation of annual total carbon (C) input amount to 315 ± 76, 472 ± 82 and 487 ± 93 gC m−2 for the RE, FYM and RR treatments, respectively (Buysse et al., 2013a). Since the start of the trial, yearly measurements of topsoil properties (0–25 cm) have shown a drop in SOC content for the RE treatment, an increase for the FYM treatment and a steady state for the RR treatment (Buysse et al., 2013b). For all treatments, the soil has been ploughed annually with a moldboard plough.
2.1.2 Tillage trial
The soil tillage trial (50.560∘ N, 4.727∘ E) was set up in 2004 and follows a 2-year rotation of winter wheat and a spring crop, generally sugar beet or flax (Linum usitatissimum), with an exception in 2018 where corn (Zea mays L.) was cultivated as spring crop. A green manure is sown after tillage following the harvest of the cereal and destroyed during winter time before the spring crop. The trial includes four tillage treatments in plots of 24 m × 21.5 m repeated four times, following a Latin square design. Among the four treatments, the two most contrasting ones were sampled in eight plots: (i) annual ploughing (P) to a depth of 25–30 cm with a moldboard plough and (ii) annual reduced tillage (RT) with a spring tine cultivator tilling to a depth of about 10 cm.
2.1.3 P–K mineral fertiliser trial
The P–K mineral fertiliser trial (50.582∘ N, 4.687∘ E) was set up in 1967, with the initial goal of assessing the effect of the rate of P and K mineral fertiliser application on crop quality and yield, nutrient exportation with harvest, soil properties and farm profitability (Roisin, 2019). The trial comprises three levels of phosphorus (P) fertiliser (applied as superphosphate 18 % or triple superphosphate 45 %) crossed with three levels of potassium (K) fertiliser (applied as KCl 40 % or 60 %), namely nine different treatments repeated six times in two randomised complete blocks (i.e. three repetitions in each block), for a total of 54 plots of 7.5 m × 50 m. The lower level of P and K fertilisation has received no P and K mineral fertiliser since 1975 (P0 and K0). The intermediate level of fertilisation consists in balancing P and K outputs and inputs, according to the nutrient balance method (P1 and K1). The higher level of fertilisation is over-fertilised, multiplying by 2 (until 2000) or 1.5 (onwards) the amount of P and K applied to the P1 and K1 treatments (P2 and K2). The last application of P–K fertilisers before soil sampling occurred on the 15 July 2016. The whole field is cropped according to a 3-year rotation cycle similar to that of the organic matter trial, with sugar beet as the starter crop followed by two winter cereals (winter wheat and winter barley). Since the start of the trial, the soil has not received any exogenous organic matter, but all by-products (cereal straws and sugar beet heads and leaves) have been left on the field to maintain sufficient SOC contents. For all treatments, soil is ploughed annually with a moldboard plough, except before the seeding of sugar beet in 2017 (soil was prepared by deep decompaction with a heavy tine cultivator at about 30 cm depth in August 2016). In this study, we focussed on the potential effect of contrasting levels of KCl application on soil structural stability (Paradelo et al., 2016). Therefore, we selected three repetitions of each level of K within the trial for soil sampling in nine plots.
2.2 Soil sampling
Soils were sampled on 8 and 10 April 2019. For each of the 35 plots previously described, six structured soil samples of 100 cm3 were taken with steel Kopecky cylinders, in the inter-row, at a depth of 2–7 cm. Soil was sampled in an area of 1 m2 that was sprayed 3 weeks earlier with about 32 mL of 10 g L−1 glyphosate, in order to stop plant growth and therefore standardise sampling conditions between plots at the time of sampling. Soils were carefully transported within the cylinders to the laboratory where they were unmoulded. For each plot, five samples were air-dried until constant weight for a period of about 3 months for QST analysis, whereas the last sample was dried at 105 ∘C and weighed for the determination of bulk density. Additionally to structured soil samples, about 2 kg of each soil was sampled at the same location and depth and gently crumbled by hand for the measurement of soil aggregate stability using the Le Bissonnais (1996) method and analysis of physico-chemical soil properties.
2.3 Soil analysis
2.3.1 Physico-chemical properties of soils
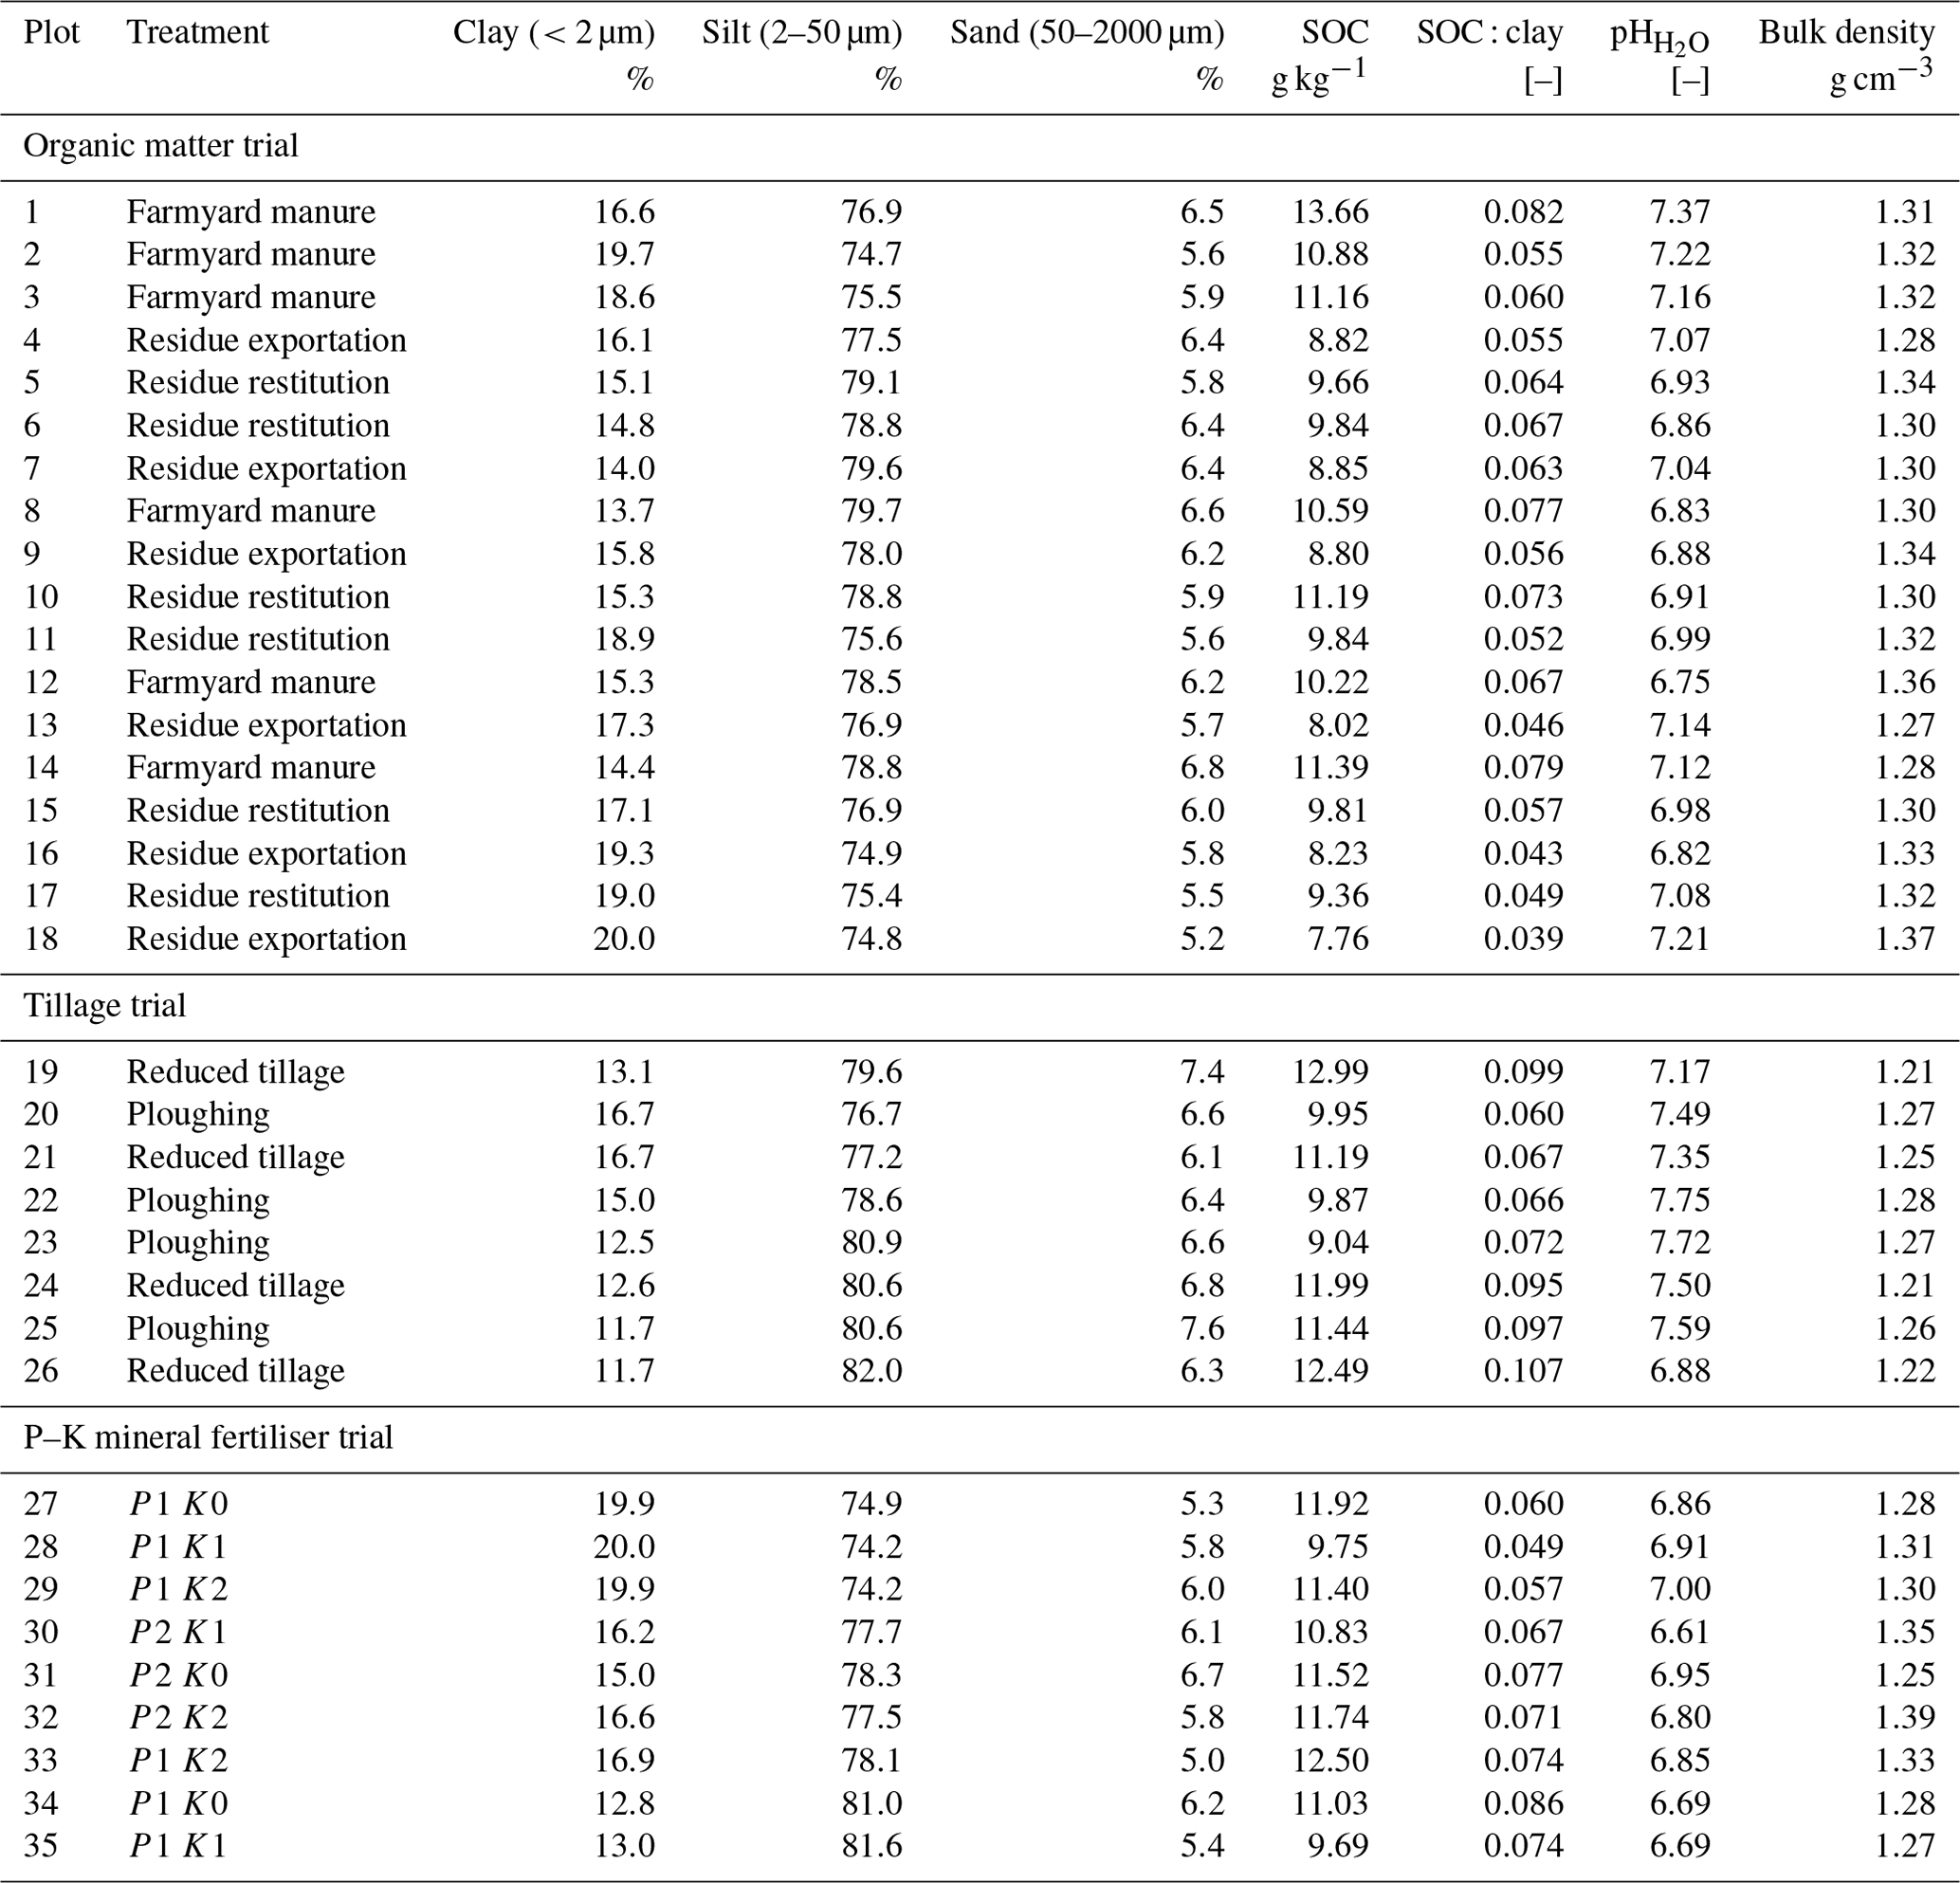
After homogenisation, about 500 g of each disturbed soil sample was gently crushed with a pie roll and sieved to 2 mm, and the fraction < 2 mm was sent to the Centre interprovincial de l'agriculture et de la ruralité in La Hulpe (Belgium) to be analysed. Soil pH was measured in water () with a 1 : 5 soil : solution mass ratio, according to the norm NF-ISO-10390:2005 (International Organization for Standardization, 2005). Total C content was determined by dry combustion according to the norm NF-ISO-10694:1995 (International Organization for Standardization, 1995). Inorganic C content was measured by infrared quantification of CO2 emitted from soil after addition of orthophosphoric acid, according to the norm NF-EN-15936:2012 (Association Française de Normalisation, 2012). SOC content was calculated as the difference between total and inorganic C content. Soil texture (sand, silt and clay contents) was determined by sedimentation and sieving, according to Stokes law, by a method derived from the norm NF-X31-107:2003 (Association Française de Normalisation, 2003). Bulk density was measured from one structured soil sample per plot, dried at 105 ∘C until constant weight, by dividing the mass of dry soil by the core volume (100 cm3). The main properties of the soils of the experimental fields of the three trials are shown in the Table 1 (open data available: https://doi.org/10.5281/zenodo.7405113).
Table 1Soil properties of the 35 plots from the three long-term field trials. SOC is soil organic carbon. The SOC : clay ratio was calculated for harmonised units for SOC and clay (g kg−1). Open data are available at https://doi.org/10.5281/zenodo.7405113.
2.3.2 Measurement of soil aggregate stability using the Le Bissonnais method
Soil aggregate stability was measured according to the method of Le Bissonnais (1996), following the norm ISO-FDIS-10930:2011 (International Organization for Standardization, 2012). For each soil gently crumbled by hand, 5 to 10 g of soil aggregates from 3 to 5 mm in size was subjected to three contrasting disaggregating treatments. The first test consists in the fast wetting of soil aggregates in water, exacerbating the effect of slaking. The second test is a slow wetting of soil aggregates by capillarity, to test their resistance to clay dispersion and differential swelling during wetting independently from the slaking effect. The third test consists in a standardised shaking of the aggregates in water after rewetting them in 95 % ethanol for 30 min, to test their mechanical strength while minimising slaking, differential swelling and dispersion. After each disaggregation treatment, the resulting aggregates were immersed in ethanol and dried at 40 ∘C for 2 h. The size distribution of the remaining aggregates was measured by way of dry sieving, with sieves of 2, 1, 0.5, 0.2, 0.1 and 0.05 mm.
Two main indicators were calculated from the fractions. The first is the mean weight diameter (MWD) of the aggregate fraction that survived each individual test, according to the following equation (International Organization for Standardization, 2012).
The second indicator is the percentage of macro-aggregates (MA) remaining after each individual test, calculated as the mass fraction of soil aggregates > 200 µm.
The Le Bissonnais (1996) method has two main advantages: (i) the three tests target the three main mechanisms of soil disaggregation in field conditions, namely slaking, mechanical breakdown and clay differential swelling and dispersion, and (ii) it measures the size distribution of particles remaining after the disaggregation treatment, which provides further insight into soil susceptibility to water erosion (Le Bissonnais, 1996).
2.3.3 Soil structural stability measurement using the QuantiSlakeTest (QST) method
The QST method consists in plunging an undisturbed soil sample supported by an 8 mm metallic mesh basket into demineralised water and measuring soil mass continuously using the underfloor weighing hook of the balance. The balance is connected to a computer for data logging (Fig. 1). For each plot, the five air-dried structured soil samples were left to slake for approximately 1000 s (around 17 min), with recording time step decreasing from less than 1 s at the start of the experiment to approximately 30 s at the end. Due to some electronic or computer issues during the experiment, some samples were lost. In total, the data from 157 QST curves could be processed and constituted the main database of our study. Most of the 35 plots had five or four usable QST curves (20 and 13 plots respectively). One plot from the OM trial and one from the P–K mineral fertiliser trial had only three and two usable curves, respectively.
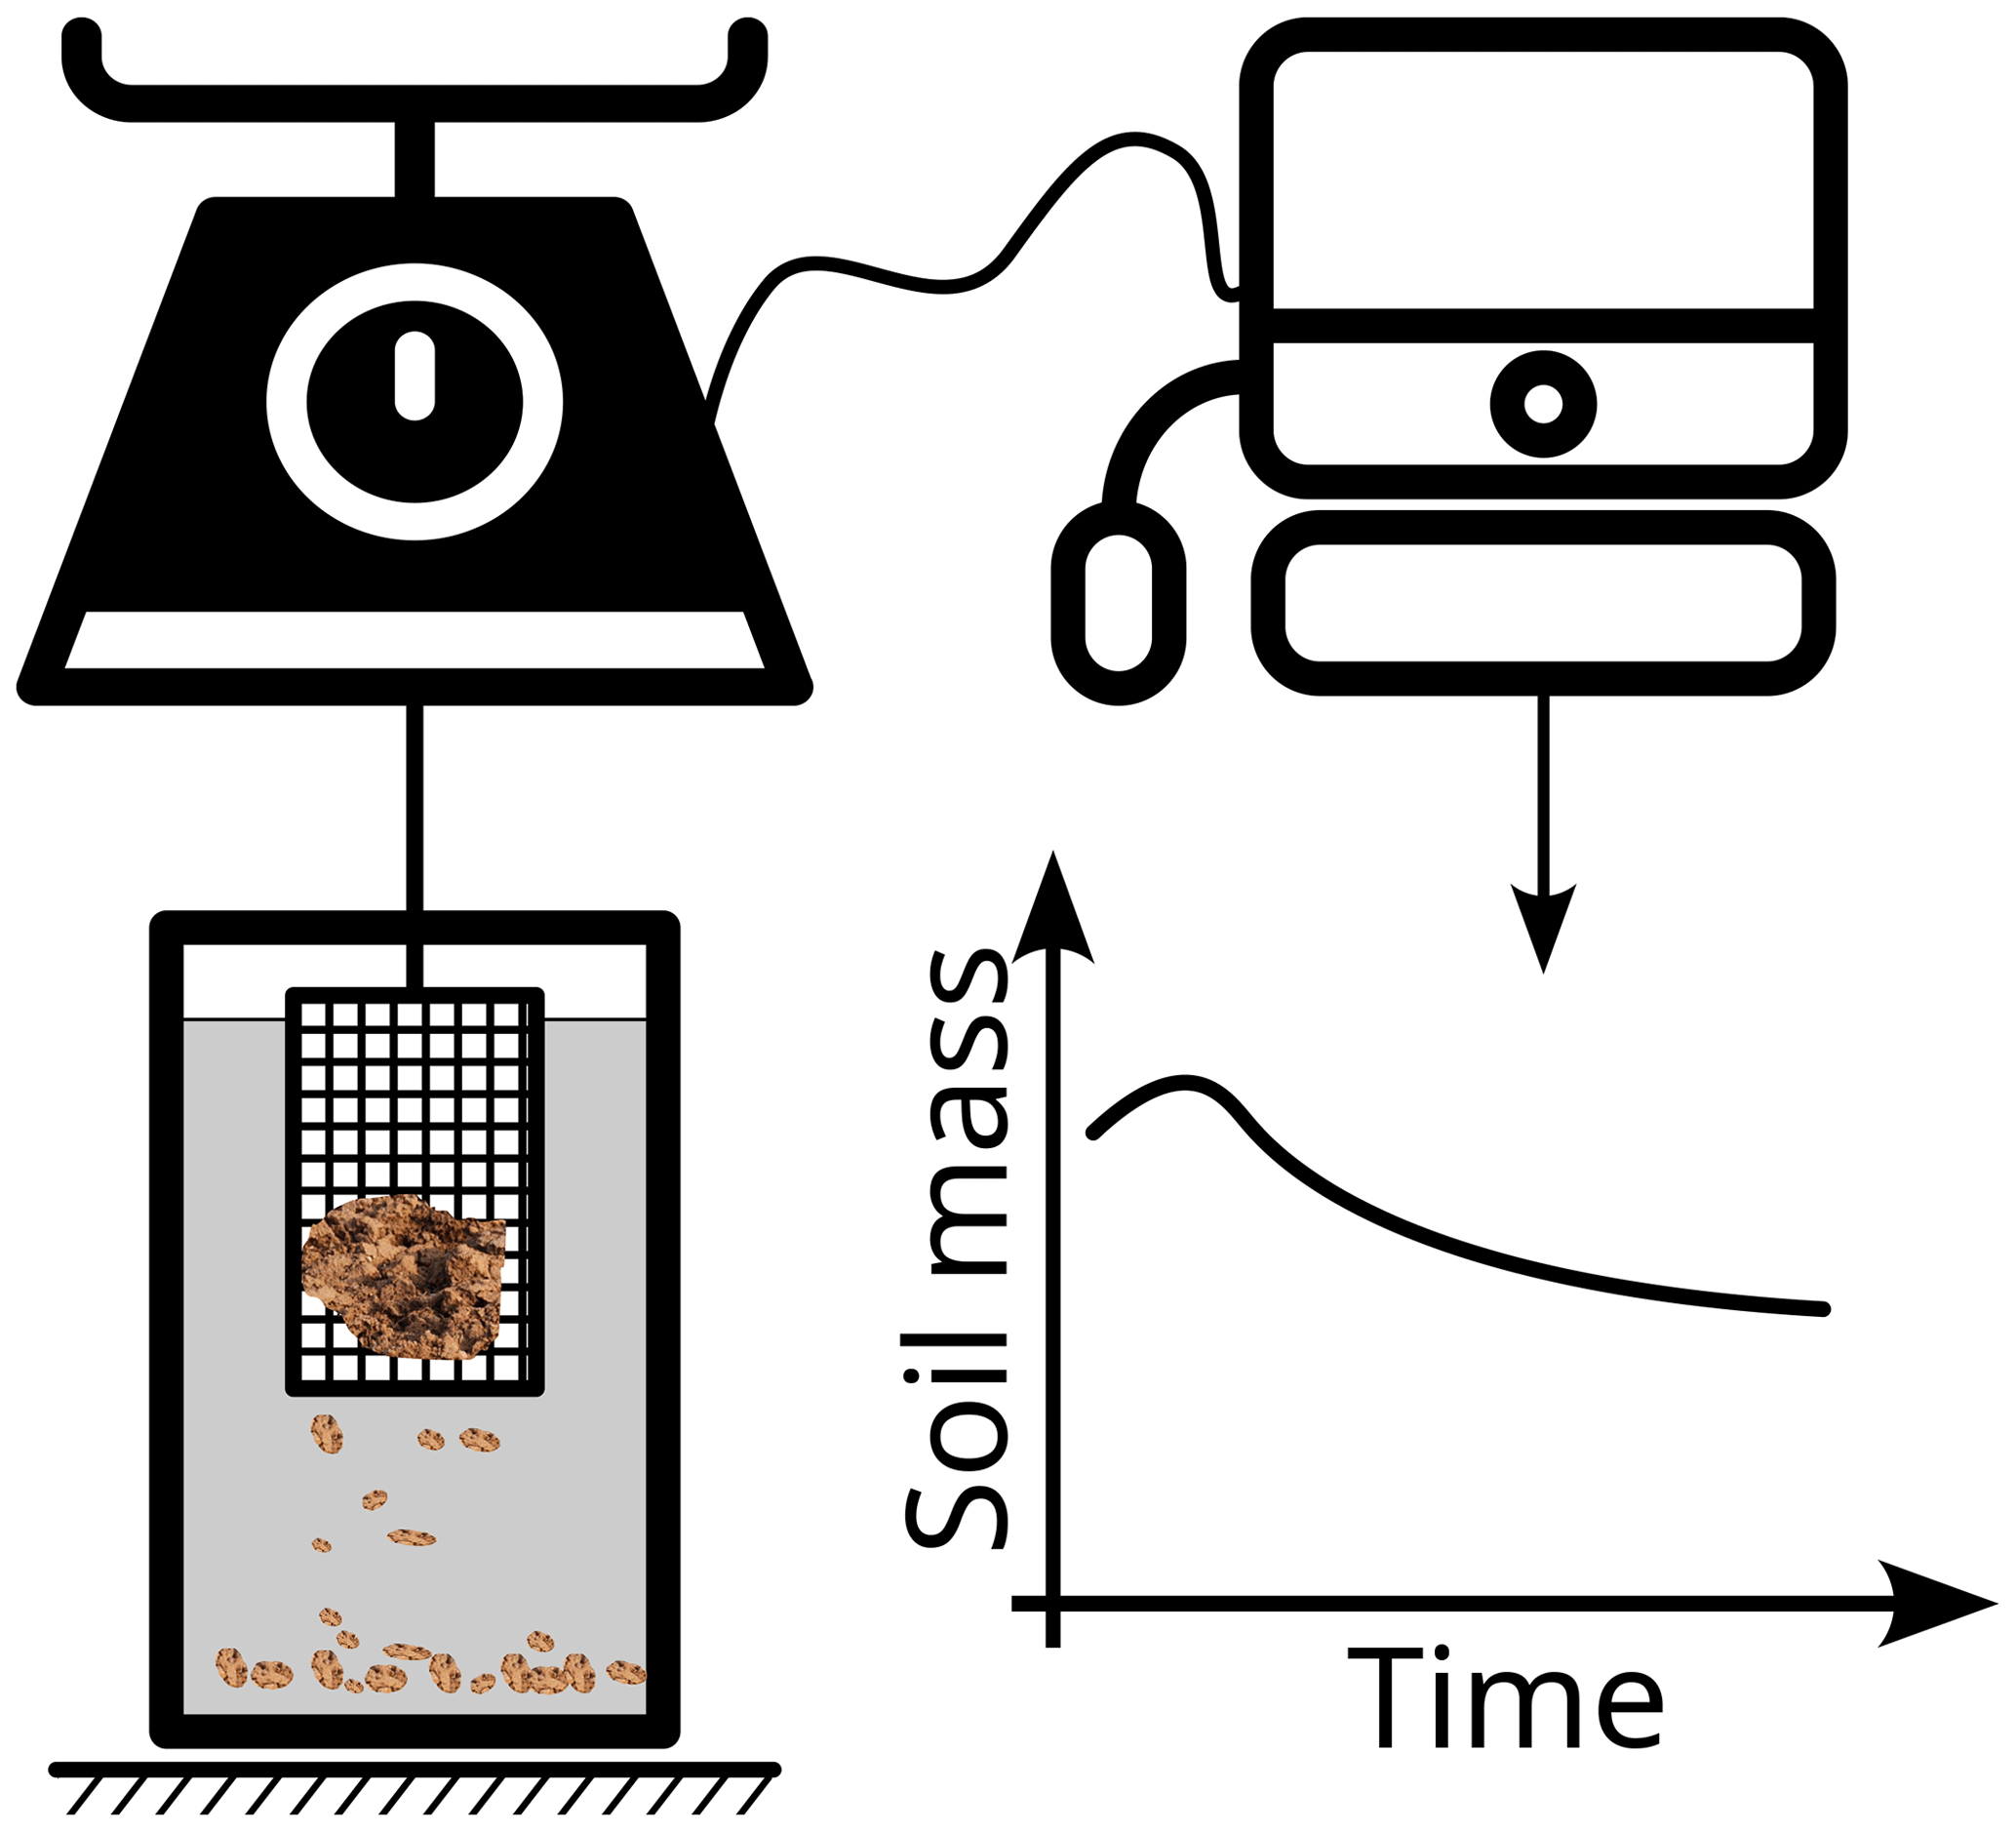
Figure 1The QuantiSlakeTest (QST) aims at weighing an undisturbed soil sample suspended in demineralised water by means of an 8 mm mesh metallic basket. The QST device, illustrated here, consists in a balance connected to a computer for direct data-logging. The open-source application for parametrising and driving the experience and for visualising data is released as a development R package (https://frdvnw.gitlab.io/slaker/dev/, last access: 24 October 2023). A video comparing the QST of two contrasting soil samples can be watched at https://youtu.be/G9UweThvHYI (Vanwindekens, 2018). Credits: figure based on two illustrations by Adnen Kadri from the Noun Project.
The evolution of the relative soil mass from before to after immersion in water is presented in Fig. 2. Immediately after soil immersion in water, the soil mass drops due to Archimedes' upward buoyant force (Fig. 2). The first record of soil mass under water is defined as the time 0 (t0) of the QST (Fig. 2). The general shape of one QST curve from t0 is presented in Fig. 3, as well as the main indicators that have been calculated from the curves. In the initial phase, soil mass generally increases due to water filling the porosity. After a few seconds or minutes, the soil mass reaches a maximum (Wmax at tmax) before decreasing, once mass loss due to disaggregation becomes dominant compared to mass gain by wetting. Soil mass was normalised relative to Wmax ( [–]), so that mass values are relative soil masses, varying between 0 and 1.
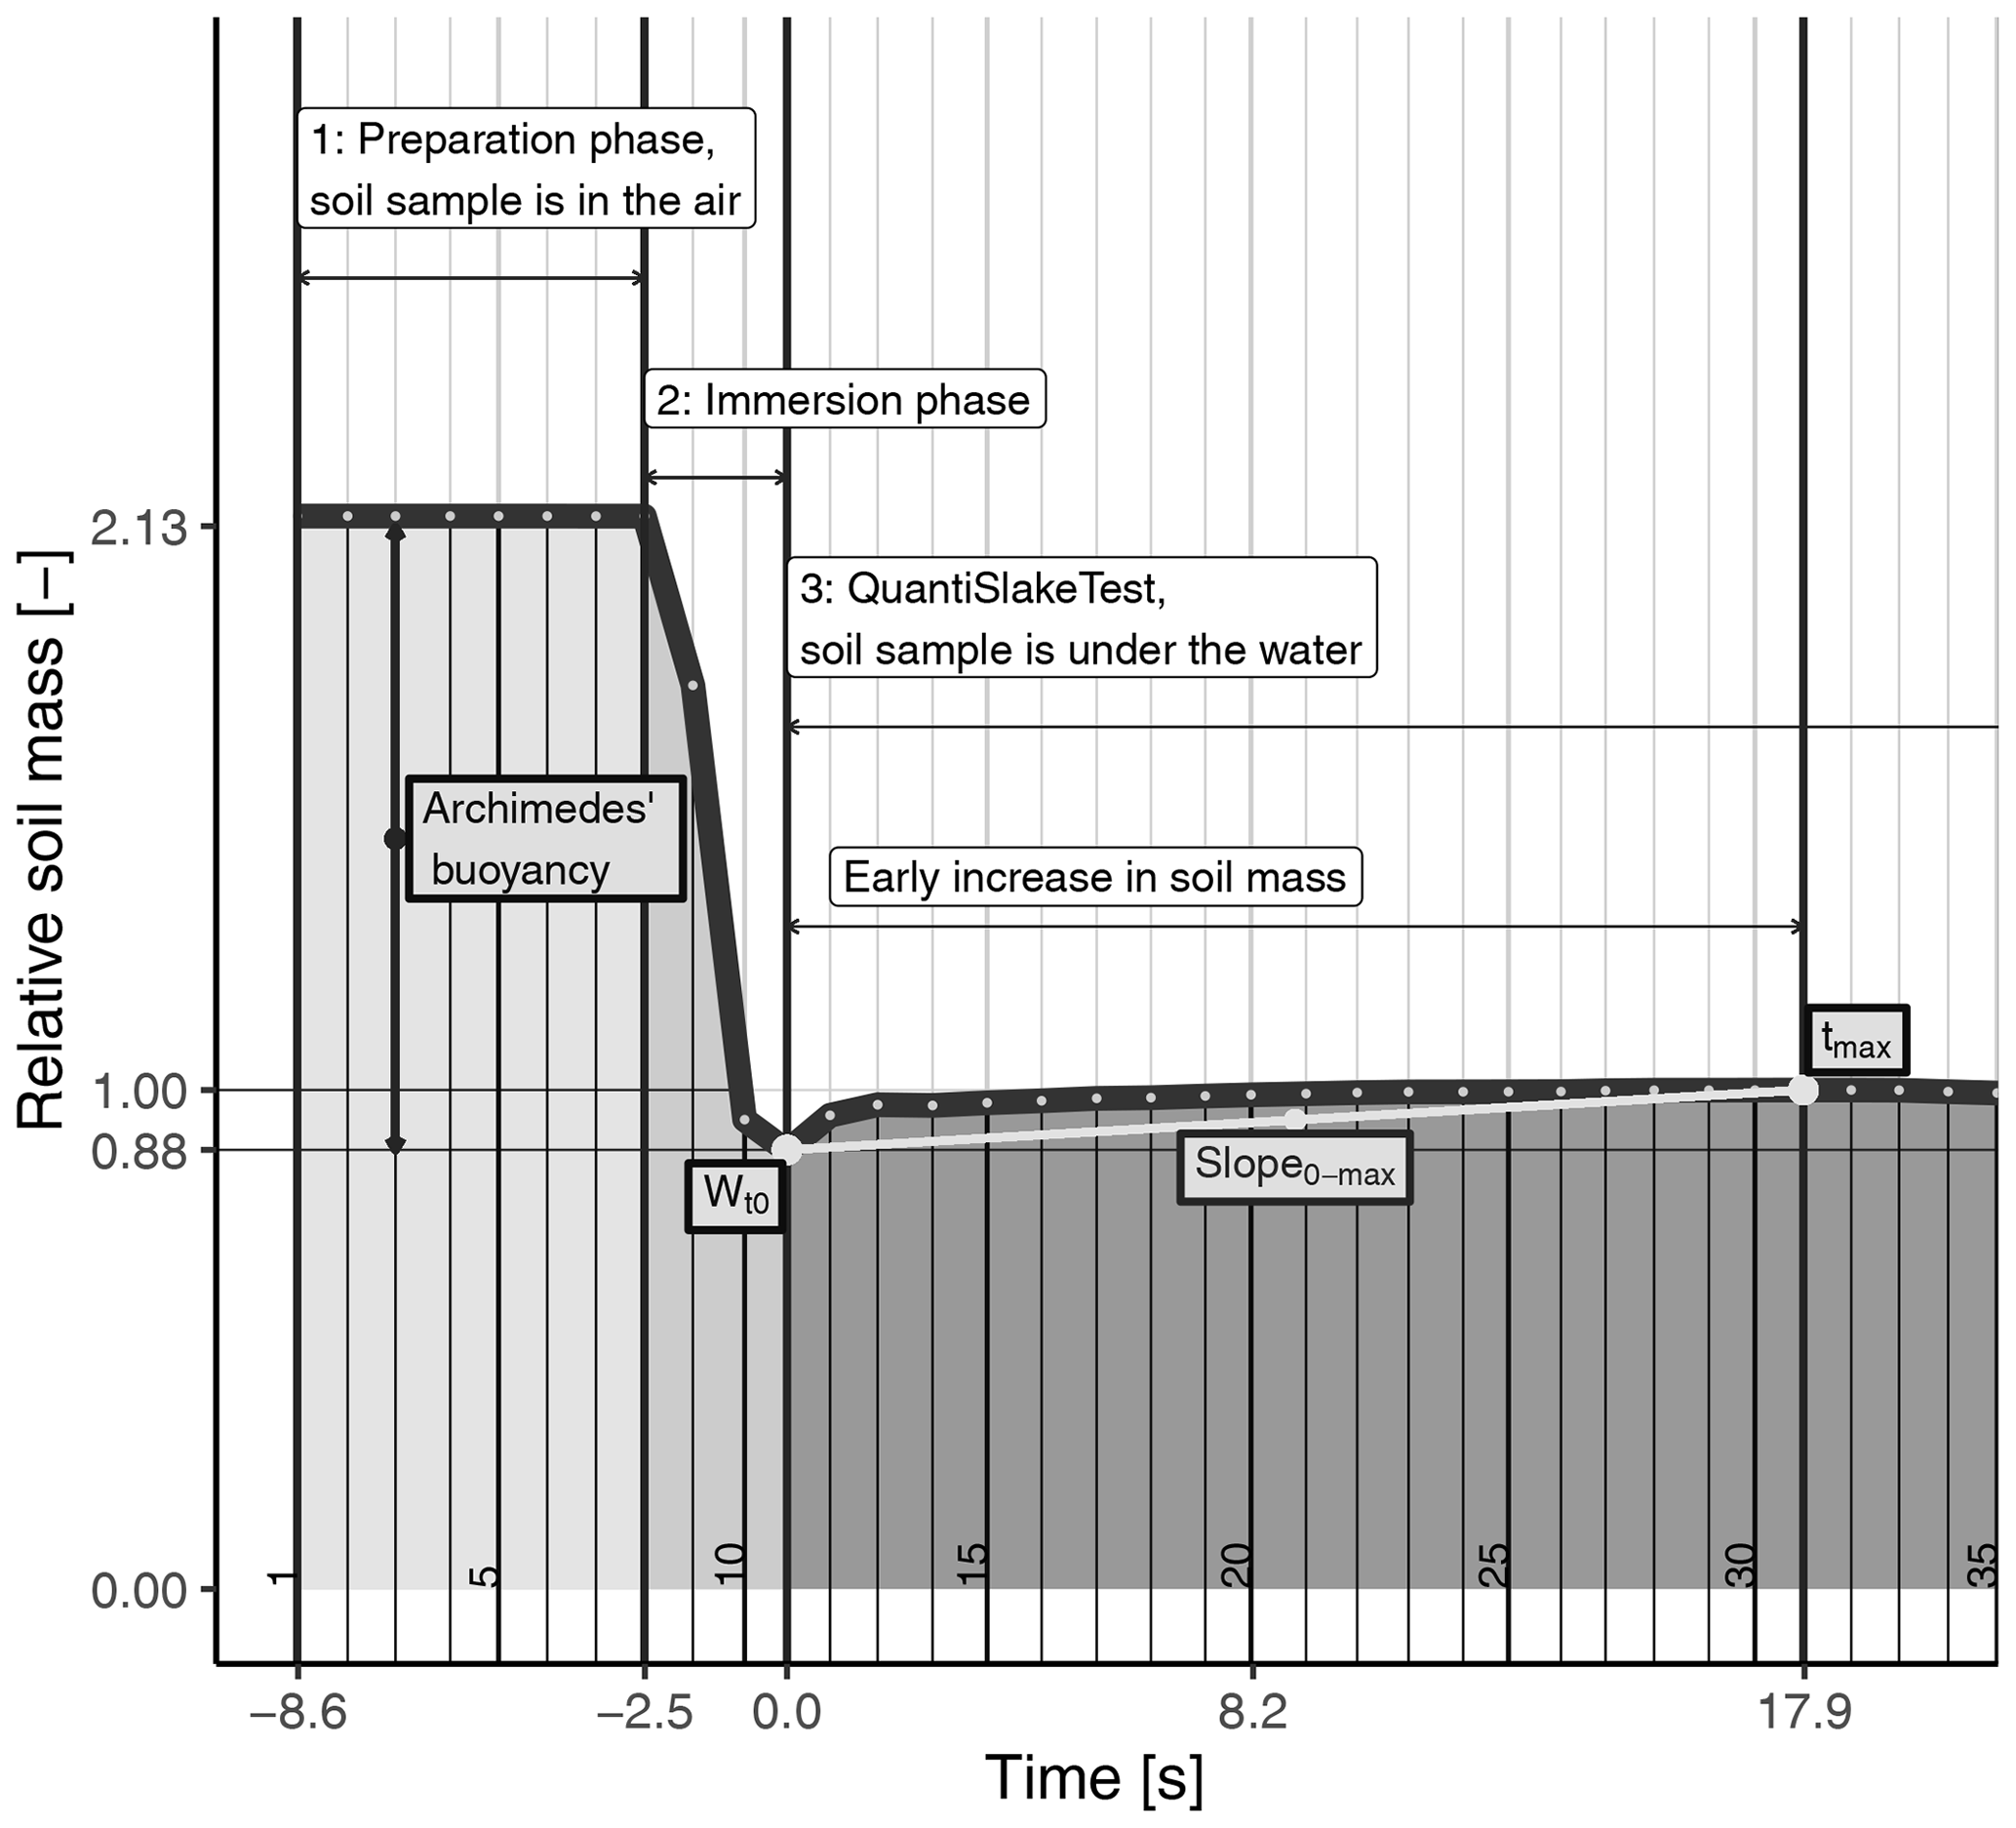
Figure 2Early phases of the QST, before and during the immersion of the soil sample. The Archimedes' buoyancy appears clearly between the first phase (preparation of the QST) and the beginning of the third phase (the QST in itself). Mathematical functions are used to identify automatically the starting of the test, based on first-order and second-order derivatives. The early increase in soil mass is only slightly visible at this scale. Each vertical line represents one pair of data (time and weight) acquired by the computer, i.e. one line of the raw data file.
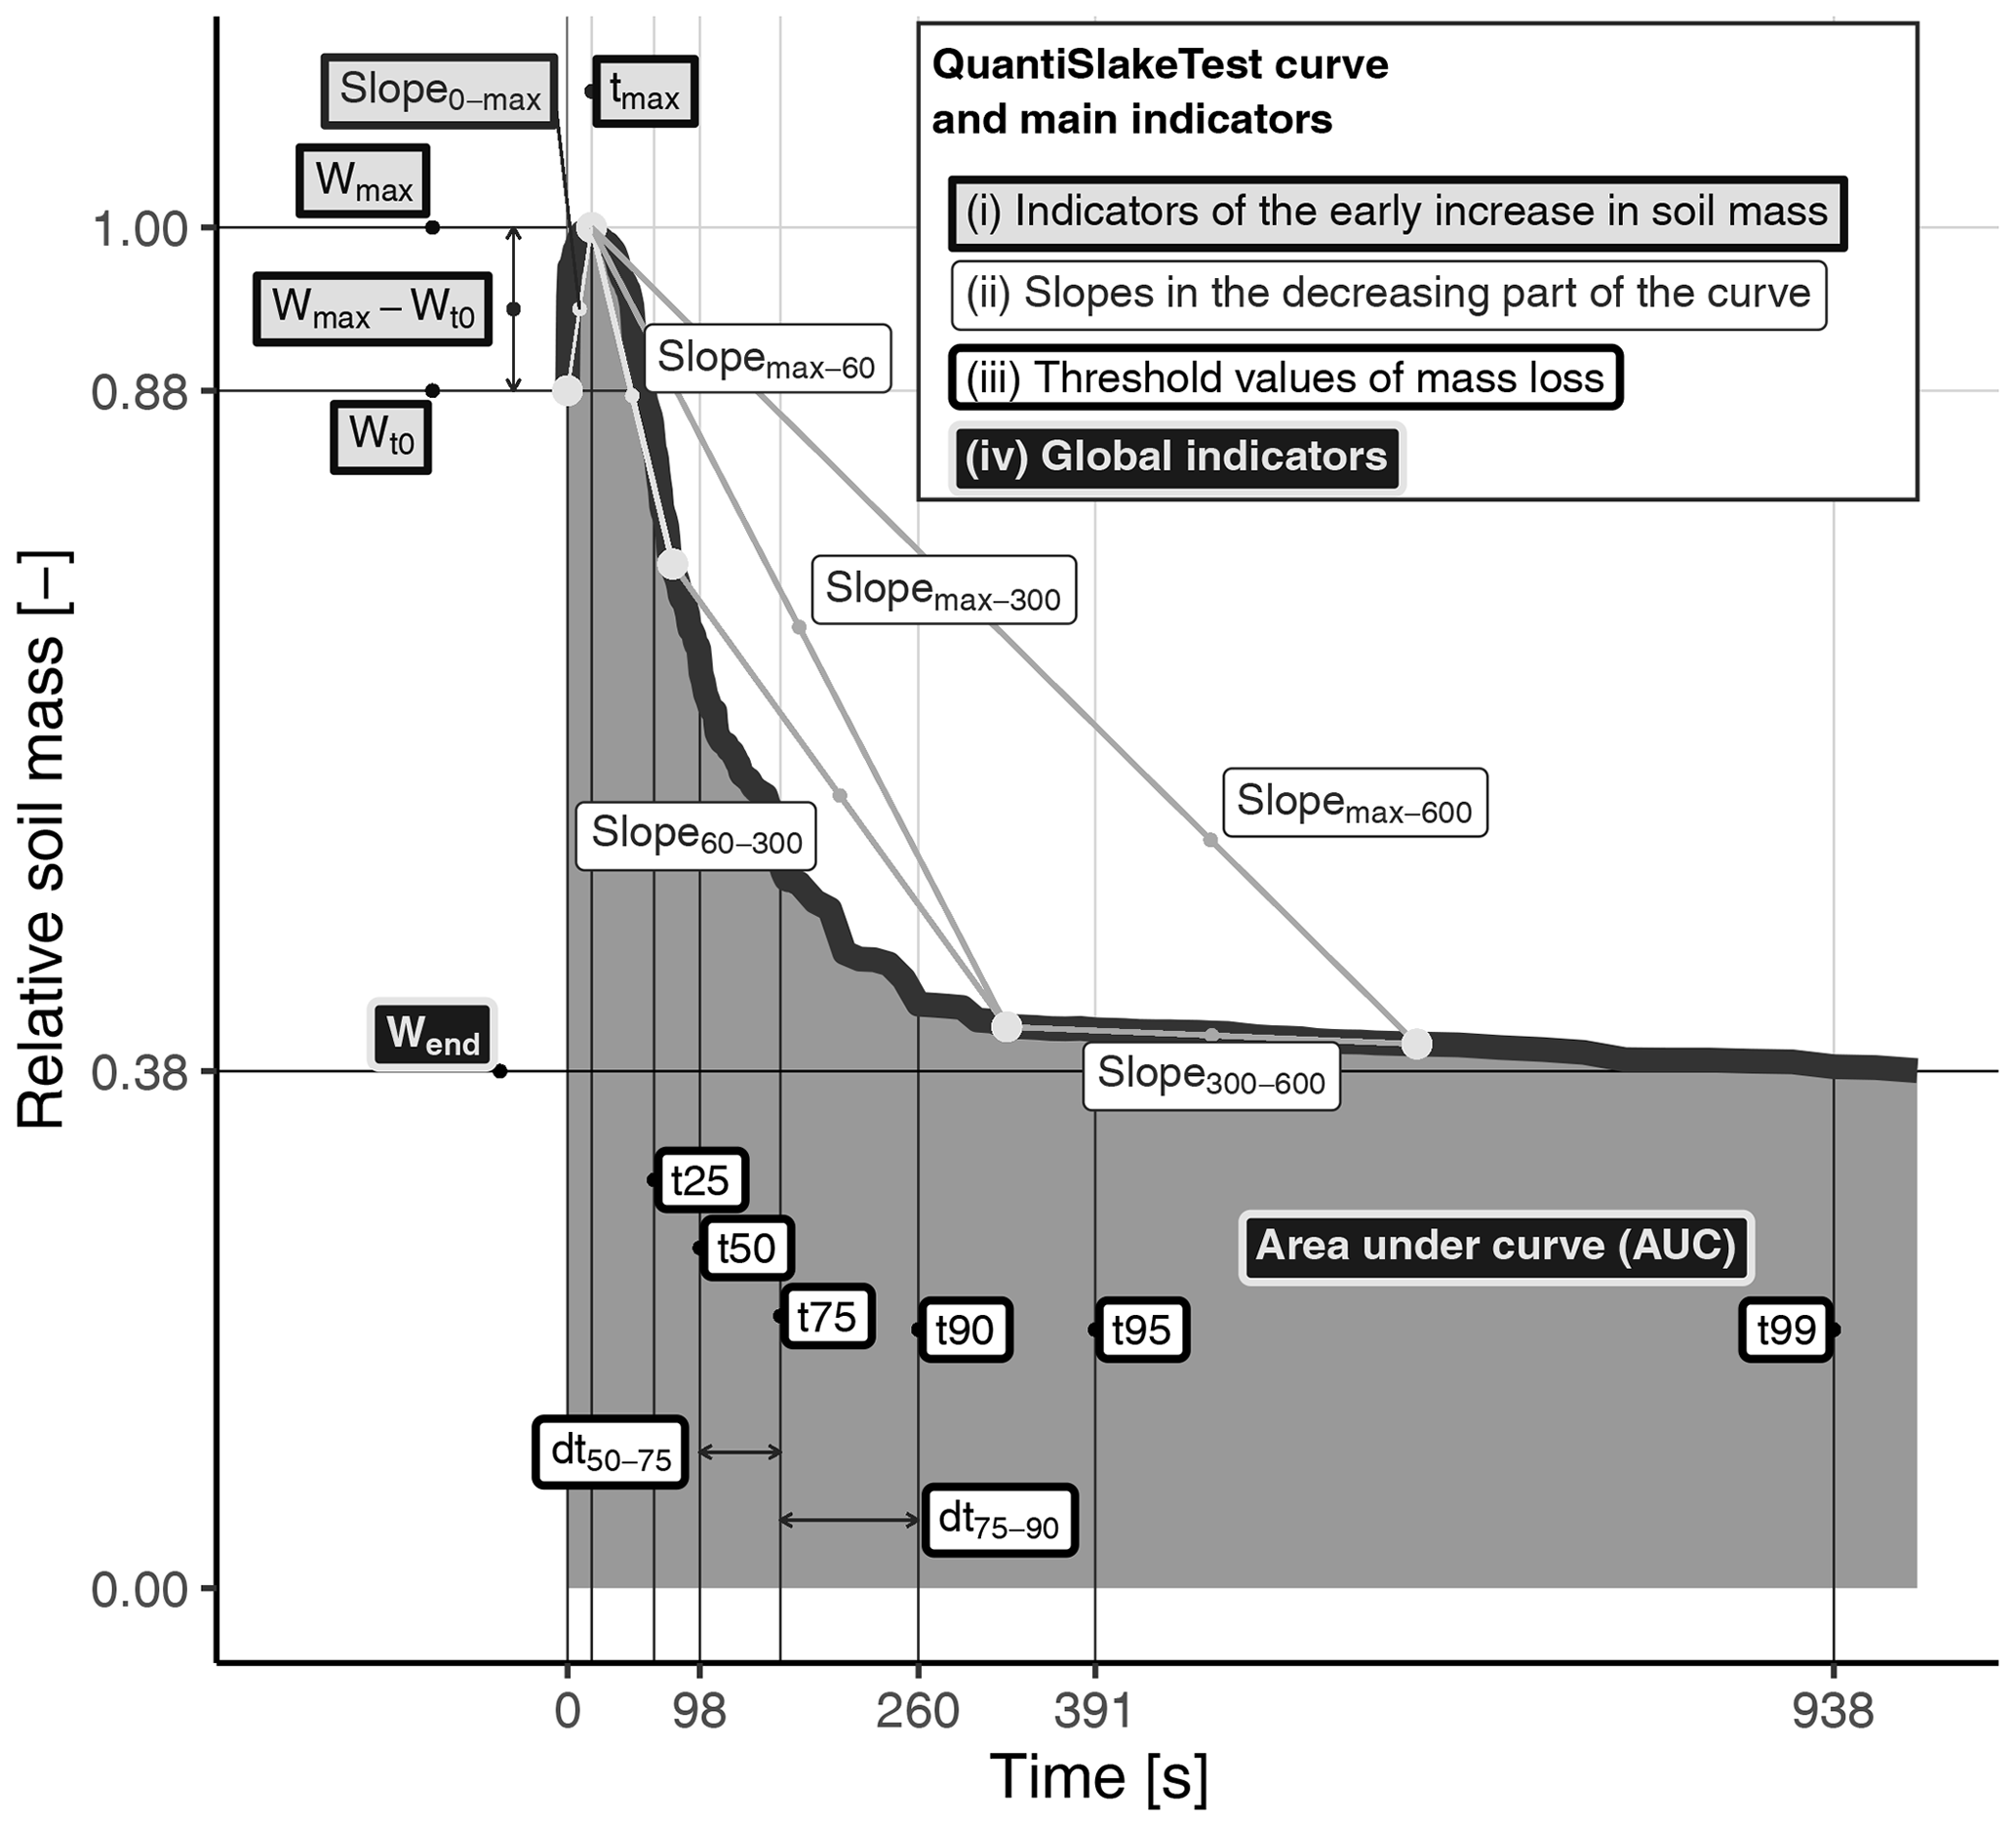
Figure 3Main parameters derived from a QST curve. (i) Inside thick square light-grey boxes (upper left), indicators related to the early increase in soil mass including time to reach the maximum mass value (tmax); the increase in soil mass between t0 and tmax (); and the slope between t0 and tmax (slope). (ii) In thin round white boxes (upper right), slopes at different time steps (after 60, 300 and 600 s) in the decreasing part of the curve, taking tmax as the starting point (slopemax–60, slopemax–300 and slopemax–600) or between these time steps (slope60–300 and slope300–600). (iii) In thick round white boxes (below the curve), time needed to achieve 25 %, 50 %, 75 %, 90 %, 95 % and 99 % of relative mass loss (t25, t50, t75, t90, t95 and t99) and between thresholds (dt50–75 and dt75–90). And finally, (iv) in black boxes, the two global indicators including sample relative mass at the end of the experiment (Wend) and the area under curve (AUC; shaded area). For the sake of clarity, not all calculated indicators are shown here. For this illustration, data were used from a real QST done on a sample from plot 29 of the P–K mineral fertiliser trial (see Table 1).
QST indicators calculated from the QST curves were split into four categories (Fig. 3):
- i.
Indicators related to the early increase in soil mass soon after soil immersion in water. They include the time to reach the maximum mass value (tmax), the increase in soil mass between t0 and tmax (), and the slope between t0 and tmax (slope0–max).
- ii.
Indicators related to slopes in the decreasing part of the curve. Slopes were evaluated at different time steps (after 30, 60, 300 and 600 s) in the decreasing part of the curve, taking tmax as the starting point (slopemax–30, slopemax–60, slopemax–300 and slopemax–600). Local slopes were also calculated between 30 and 60 s (slope30–60), between 60 and 300 s (slope60–300), and between 300 and 600 s (slope300–600).
- iii.
Indicators linked to threshold values of mass loss. They correspond to the time needed to reach a certain fraction of relative mass loss between the maximum and the final mass of soil at the end of the QST experiment. Threshold values of 25 %, 50 %, 75 %, 90 % and 95 % of relative mass loss were calculated (t25, t50, t75, t90 and t95). The time between two threshold values of mass loss was also calculated (dtmax–25, dt25–50, dt50–75, dt75–90 and dt90–95).
- iv.
Global indicators providing an integrative overview of soil mass evolution all over the QST. They include relative soil mass at the end of the experiment (Wend) and the area under curve (AUC). These two indicators were calculated for a reference time of 900 s, for which the loss of soil from the basket was negligible for a majority of samples.
A draft of the “slaker” R package (Vanwindekens, 2023) containing the code used to run the SlakingLab and analyse QST data is available online.
2.3.4 Measurement of root biomass after slaking
For samples from the soil tillage trial, root biomass retained in the 8 mm mesh metallic basket was weighed after running the QST by cleaning remaining soil with a water jet. The roots were dried carefully with Tork paper, air-dried and weighed.
2.3.5 Data analysis
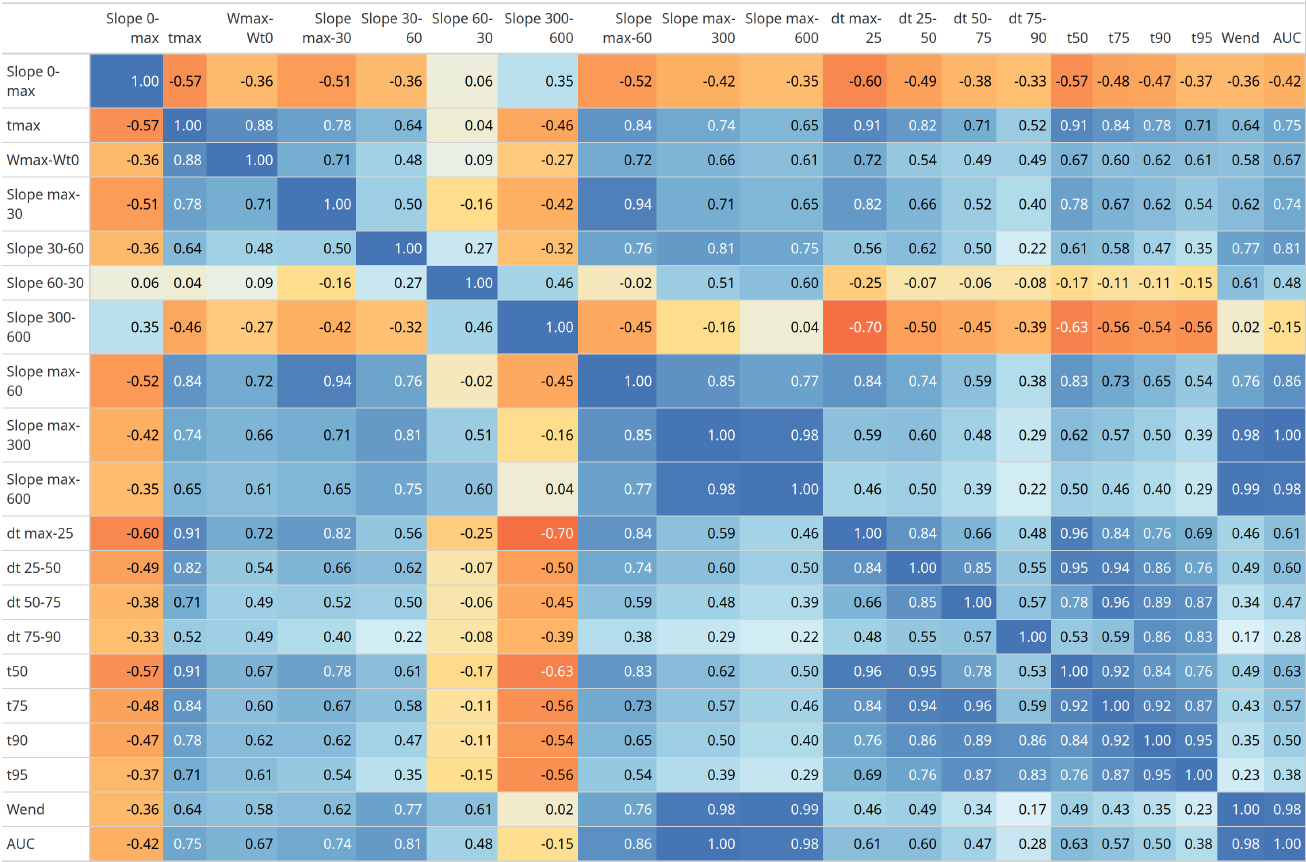
Between continuous variables, correlation coefficients were determined. For QST indicators, average values were calculated at the plot level for comparison with data that were measured only at the plot level: aggregate stability indicators from Le Bissonnais (1996) and physico-chemical soil properties. Since many QST indicators are calculated from the same curve, a correlation matrix was drawn for QST indicators, to evaluate the level of redundancy between them and propose a selection to be used for the statistical analysis of soil management practices in the long-term experiments.
In order to test whether soil management practices affect QST indicators, linear mixed-effects models were fitted. For each model, the QST indicator was used as the outcome variable and the treatments of the trials were used as a fixed explanatory variable, whereas the blocks were defined as a random effect. As several samples were related to one single plot (157 QST in total from 35 plots), the plot identifier was added as a random effect of the model to take into account the dependence between field replicates from one plot.
The normality and the homoscedasticity of the residuals of the models were verified using Shapiro–Wilk and Bartlett tests respectively. For all models, the significance of differences in QST indicators between soil management practices was tested using Type II Wald F tests with the Kenward–Roger estimation of degrees of freedom method (Fox and Weisberg, 2019). When the F test was significant (p<0.05), post hoc comparisons were performed: treatments of the trial were compared pairwise at 0.05 probability level of significance using estimated marginal means (EMMs; also named least-squares means; Lenth, 2022).
All statistical analyses were performed using R version 4.3.0 (21 April 2023) software (R Core Team, 2023). The linear mixed-effect models were performed with the lme4 package (Bates et al., 2015), the Wald F tests with the car package (Fox and Weisberg, 2019) and contrast analyses with the emmeans package (Lenth, 2022).
3.1 Redundancy analysis
The correlation matrix of QST indicators is presented in Appendix A, in Table A1. From this table, it appears that several indicators are strongly positively correlated. A high level of redundancy (r > 0.9) exists between the following:
-
Wend, AUC, slopemax–300 and slopemax–600;
-
slopemax–30 and slopemax–60;
-
tmax, dtmax–25 and t50;
-
t50 and t75, t75 and t90, t90 and t95;
-
various dt and t (e.g. dt25–50 and t50, dt50–75 and t75).
Accordingly, to limit redundancy, the output of the statistical analysis of QST indicators against soil management practices was limited to four QST indicators selected according to the following criteria:
-
One indicator was chosen for each category previously defined in the methods (Fig. 3, i – early increase in soil mass; ii – early to intermediate mass loss; iii – intermediate to late mass loss; and iv – global indicators).
-
The use of highly redundant indicators (r > 0.7) was avoided.
-
In the same category of indicator, the indicator that best discriminates between management practices was chosen. If arbitration between two indicators was necessary, the conceptually simplest one was kept.
According to these decision rules, we focused on (i) tmax, (ii) slope30–60 (for the tillage and PK trial) or slope60–300 (for the OM trial), (iii) dt50–75, and (iv) Wend.
3.2 Comparison of QST indicators with Le Bissonnais
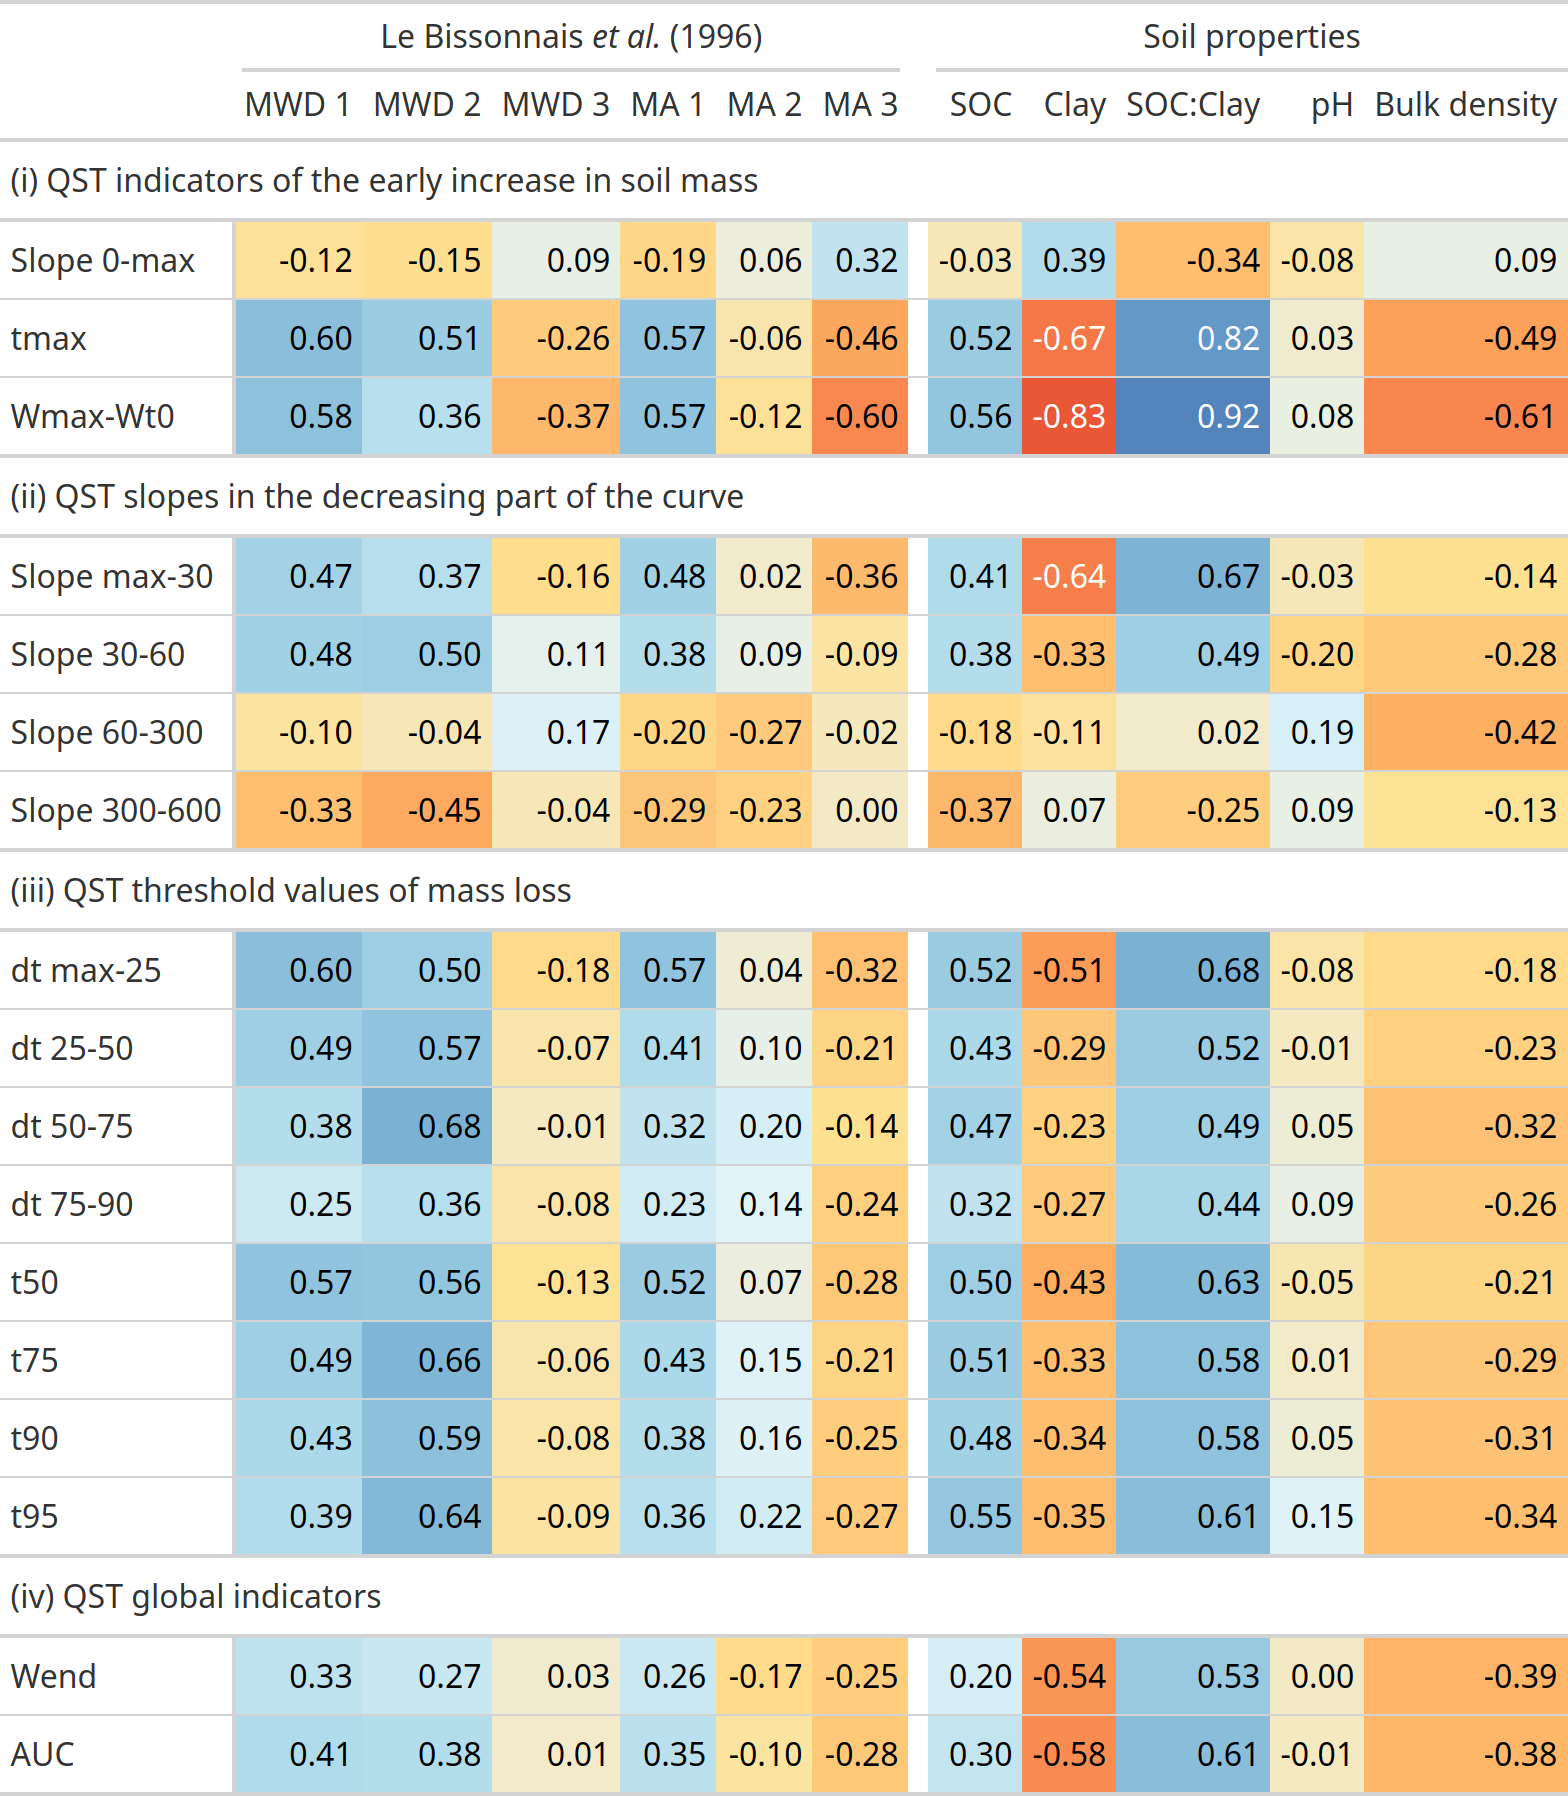
Except for slope0–max, slope60–300 and slope300–600, a positive correlation was found between all QST indicators and the mean weight diameter (MWD1) and the percentage of macro-aggregates (MA1) of the fast-wetting test of Le Bissonnais (Table 2). The higher correlation coefficients were found for QST indicators related to the early stages of the curve (tmax, , slopemax–30, slopemax–60, dtmax–25 and t50). Correlation decreases progressively for later slopes (slopemax–300, slopemax–600) as well as for t75 to t95 and is minimal for sample residual mass at the end of the test (Wend). Similarly, the mean weight diameters (MWD2) of the slow-wetting test of Le Bissonnais also correlate positively with each QST indicator except slope0–max. However, correlations tend to increase for QST indicators related to the intermediate to late stage of the curve, particularly t50 to t95 and dtmax–25, dt25–50 and dt50–75 (Table 2). In contrast to the fast-wetting test, the percentage of macro-aggregates surviving the slow wetting (MA2) is poorly related to QST indicators. For the third test of Le Bissonnais, testing soil resistance to mechanical breakdown, the mean weight diameter (MWD3) correlates poorly with QST indicators. Similarly, correlation between QST indicators and the percentage of macro-aggregates surviving the third test (MA3) is always negative and generally poor, except for (, Table 2). Regardless of the test, sample mass at the end of the experiment (Wend) correlates poorly with MWDs from Le Bissonnais, considered alone or in combination (data not shown). Correlation between the area under curve (AUC) and MWD1 (r=0.41) and MWD2 (r=0.38) is a bit higher but remains poor.
Table 2Correlation coefficients between QST indicators calculated from individual curves, mean weight diameters (MWDs) and percentages of macro-aggregates (MA) from the three tests of Le Bissonnais (1 – fast wetting; 2 – slow wetting; 3 – mechanical breakdown) and soil properties. The gradient of colours relates to the positive (blue) or to the negative (orange) relative amplitude of correlation coefficients.
3.3 Soil aggregate and structural stability against soil properties
3.3.1 Le Bissonnais
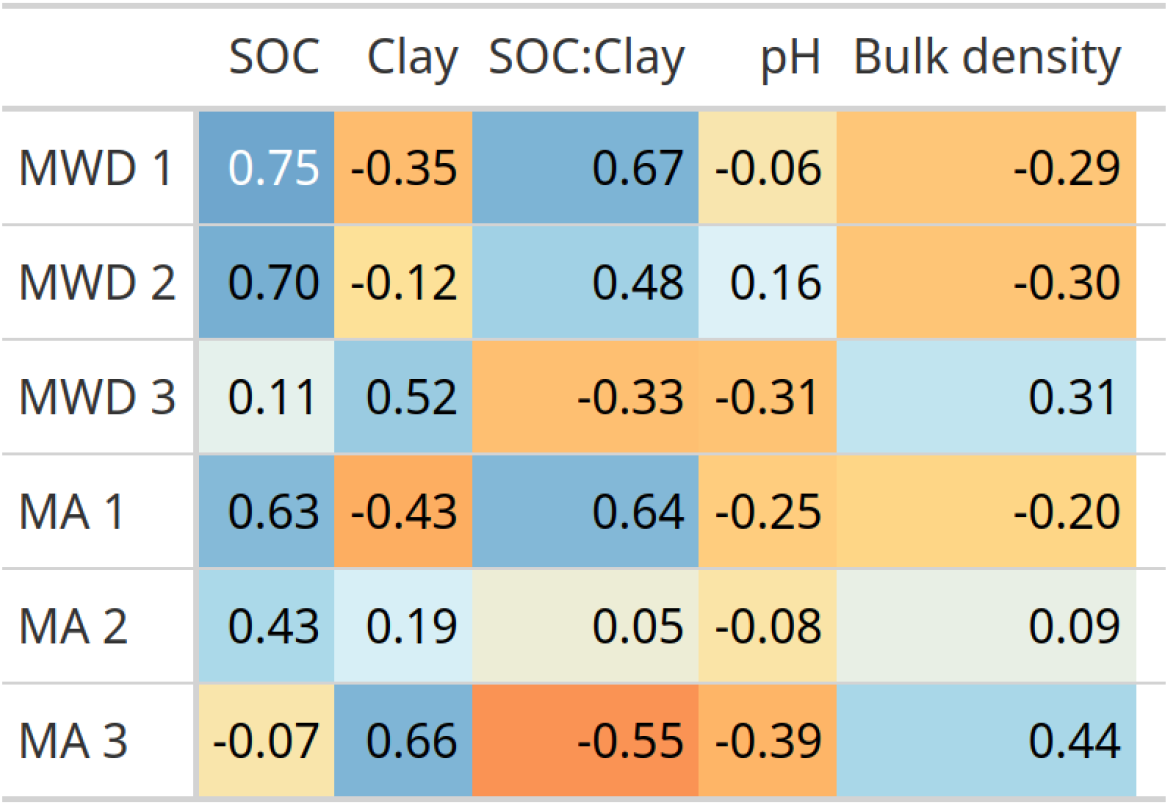
The correlation matrix between Le Bissonnais' indicators and soil properties is shown in Appendix A, in Table A2. A positive correlation exists between total SOC content and both MWD1 (r=0.75) and MWD2 (r=0.70), whereas MWD3 and MA3 correlate poorly with SOC content (r=0.11 and −0.07, respectively). In contrast, clay content correlates positively with MWD3 and MA3 (r=0.52 and 0.66, respectively) but poorly with MWD1 and MWD2 ( and −0.12). A linear relationship with the SOC : clay ratio, evidenced as a proxy for predicting field soil structural quality by visual assessment methods (Johannes et al., 2017), was also tested. The SOC : clay ratio correlated positively with both MWD1 (r=0.67) and MWD2 (r=0.48) and negatively with MWD3 () and MA3 (). No clear linear relationship was found between Le Bissonnais' indicators and pH or bulk density.
3.3.2 QuantiSlakeTest
Generally, indicators derived from QST curves correlate positively with SOC content, except for slope0–max and slope60–300 and slope300–600. Coefficients remain low to moderate though, with the stronger coefficient obtained for (r=0.56) and t95 (r=0.55) (Table 2). In contrast, most QST indicators correlate negatively with clay content. The stronger coefficients were found for (), tmax (), slopemax–30 () and AUC () (Table 2). This antagonist effect of SOC and clay contents on soil resistance to disaggregation under water is well captured by the SOC : clay ratio, which correlates strongly with indicators from the start of QST curves, particularly (r=0.92; Table 2 and detailed in Fig. 4) but also tmax (r=0.82), slopemax–30 (r=0.67) and dtmax–25 (r=0.68). While we observe a clear relationship between and SOC : clay ratio (Fig. 4), we observe a residual variability in the repeated test of a same plot that could be explained by local soil conditions of the sampling sites (microsite heterogeneity related, for example, to micro-relief, the presence of crop residues, roots, earthworm galleries, …).
Similarly to indicators of soil aggregate stability from Le Bissonnais, all indicators from the QST curves correlated poorly with pH. Except for slope0–max, a moderate to poor negative correlation is observed between QST indicators and bulk density, with the lower values obtained for () and tmax ().
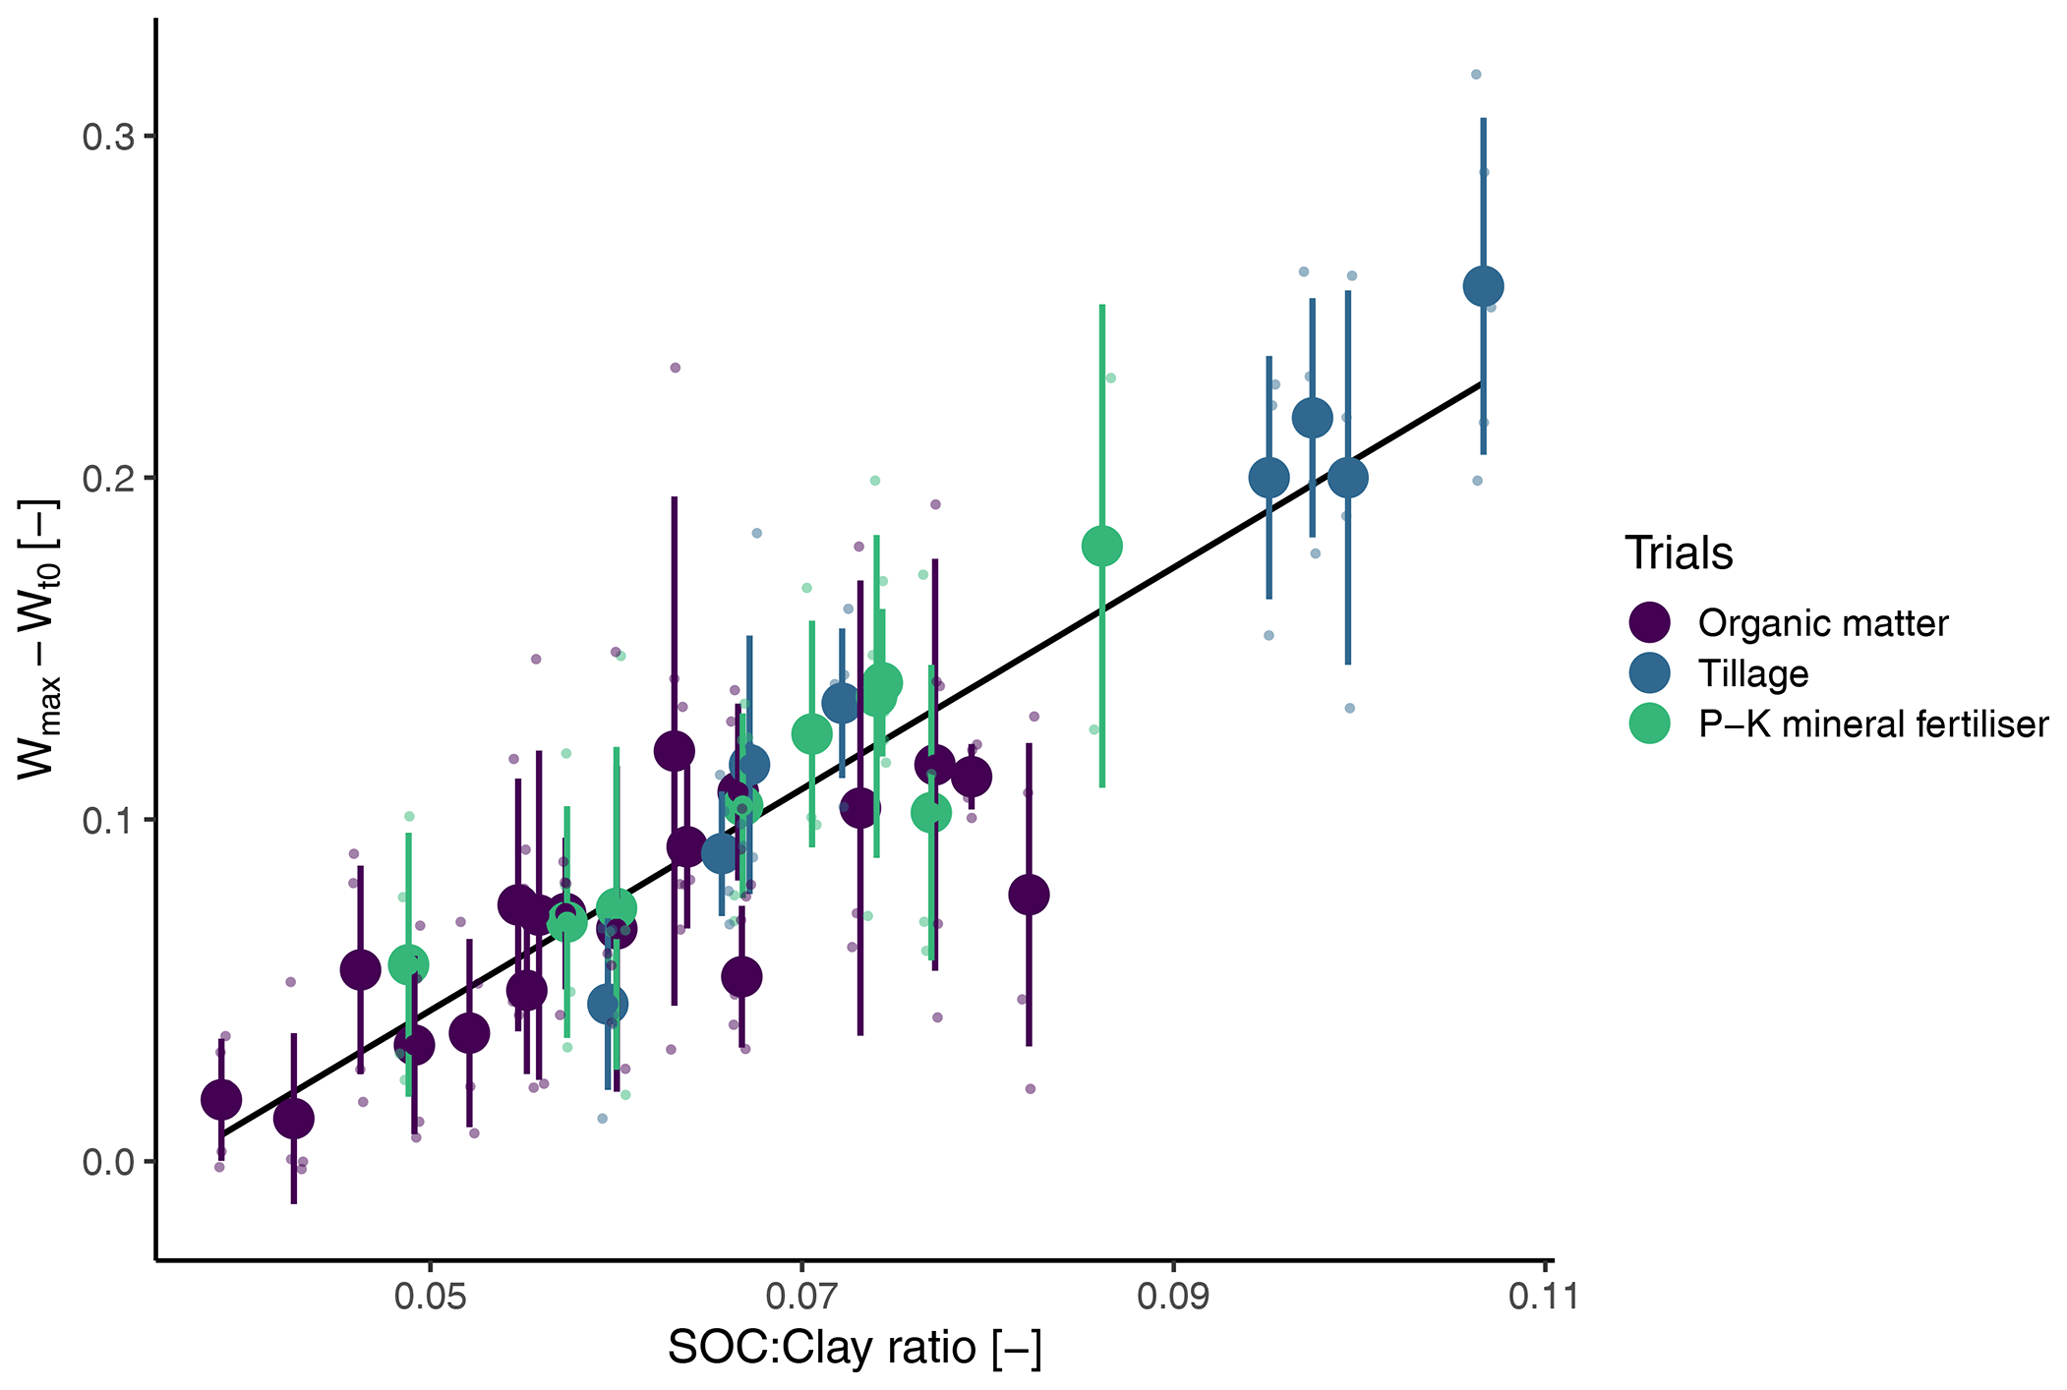
Figure 4Early increase in soil mass under water measured from QST curves () against the SOC : clay ratio of bulk soil (r=0.92). Small dots are individual QST indicator with a small amount of noise added in x. Large dots are the mean and error bars are standard deviation by plot.
3.4 Soil structural stability under contrasting soil management practices
The responses of soil structural stability indicators calculated from QST curves to contrasting long-term soil management practices from the three long-term experiments are presented in this section. As mentioned previously, we have focused on a selection of four indicators: (i) tmax, (ii) slope30–60 for the tillage and PK trial or slope60–300 for the SOM trial, (iii) dt50–75, and (iv) Wend.
3.4.1 Organic matter trial
Soils of the three treatments of OM inputs in the OM trial have different contents of total SOC, with the FYM treatment having the highest SOC content (11.32 g kg−1), the RE treatment having the lowest SOC content (8.41 g kg−1) and the RR treatment having an intermediate value (9.95 g kg−1). Accordingly, tmax tends to respect this gradient of total SOC, with the FYM showing the best scores on average (p = 0.047; Fig. 5a–d). Counter-intuitively though, this order is not respected anymore for QST indicators related to intermediate or late stages of the curves (slope60–300, Wend). The response of treatments follows the order RR > RE > FYM for slope60–300 (p = 0.005, Fig. 5c) and for Wend (p = 0.098, Fig. 5d). Antagonistic results were also obtained between the three tests of Le Bissonnais, with the MWD scores from the fast-wetting test (MWD1) slightly in favour of the FYM treatment (FYM ∼ RR > RE; not significant – n.s., results in Appendix B, Fig. B1) and the scores from the slow-wetting test (MWD2, n.s.) and from the mechanical breakdown (MWD3, p < 0.05) in favour of the RR treatment (RR > FYM ∼ RE; results in Appendix B, Fig. B1).
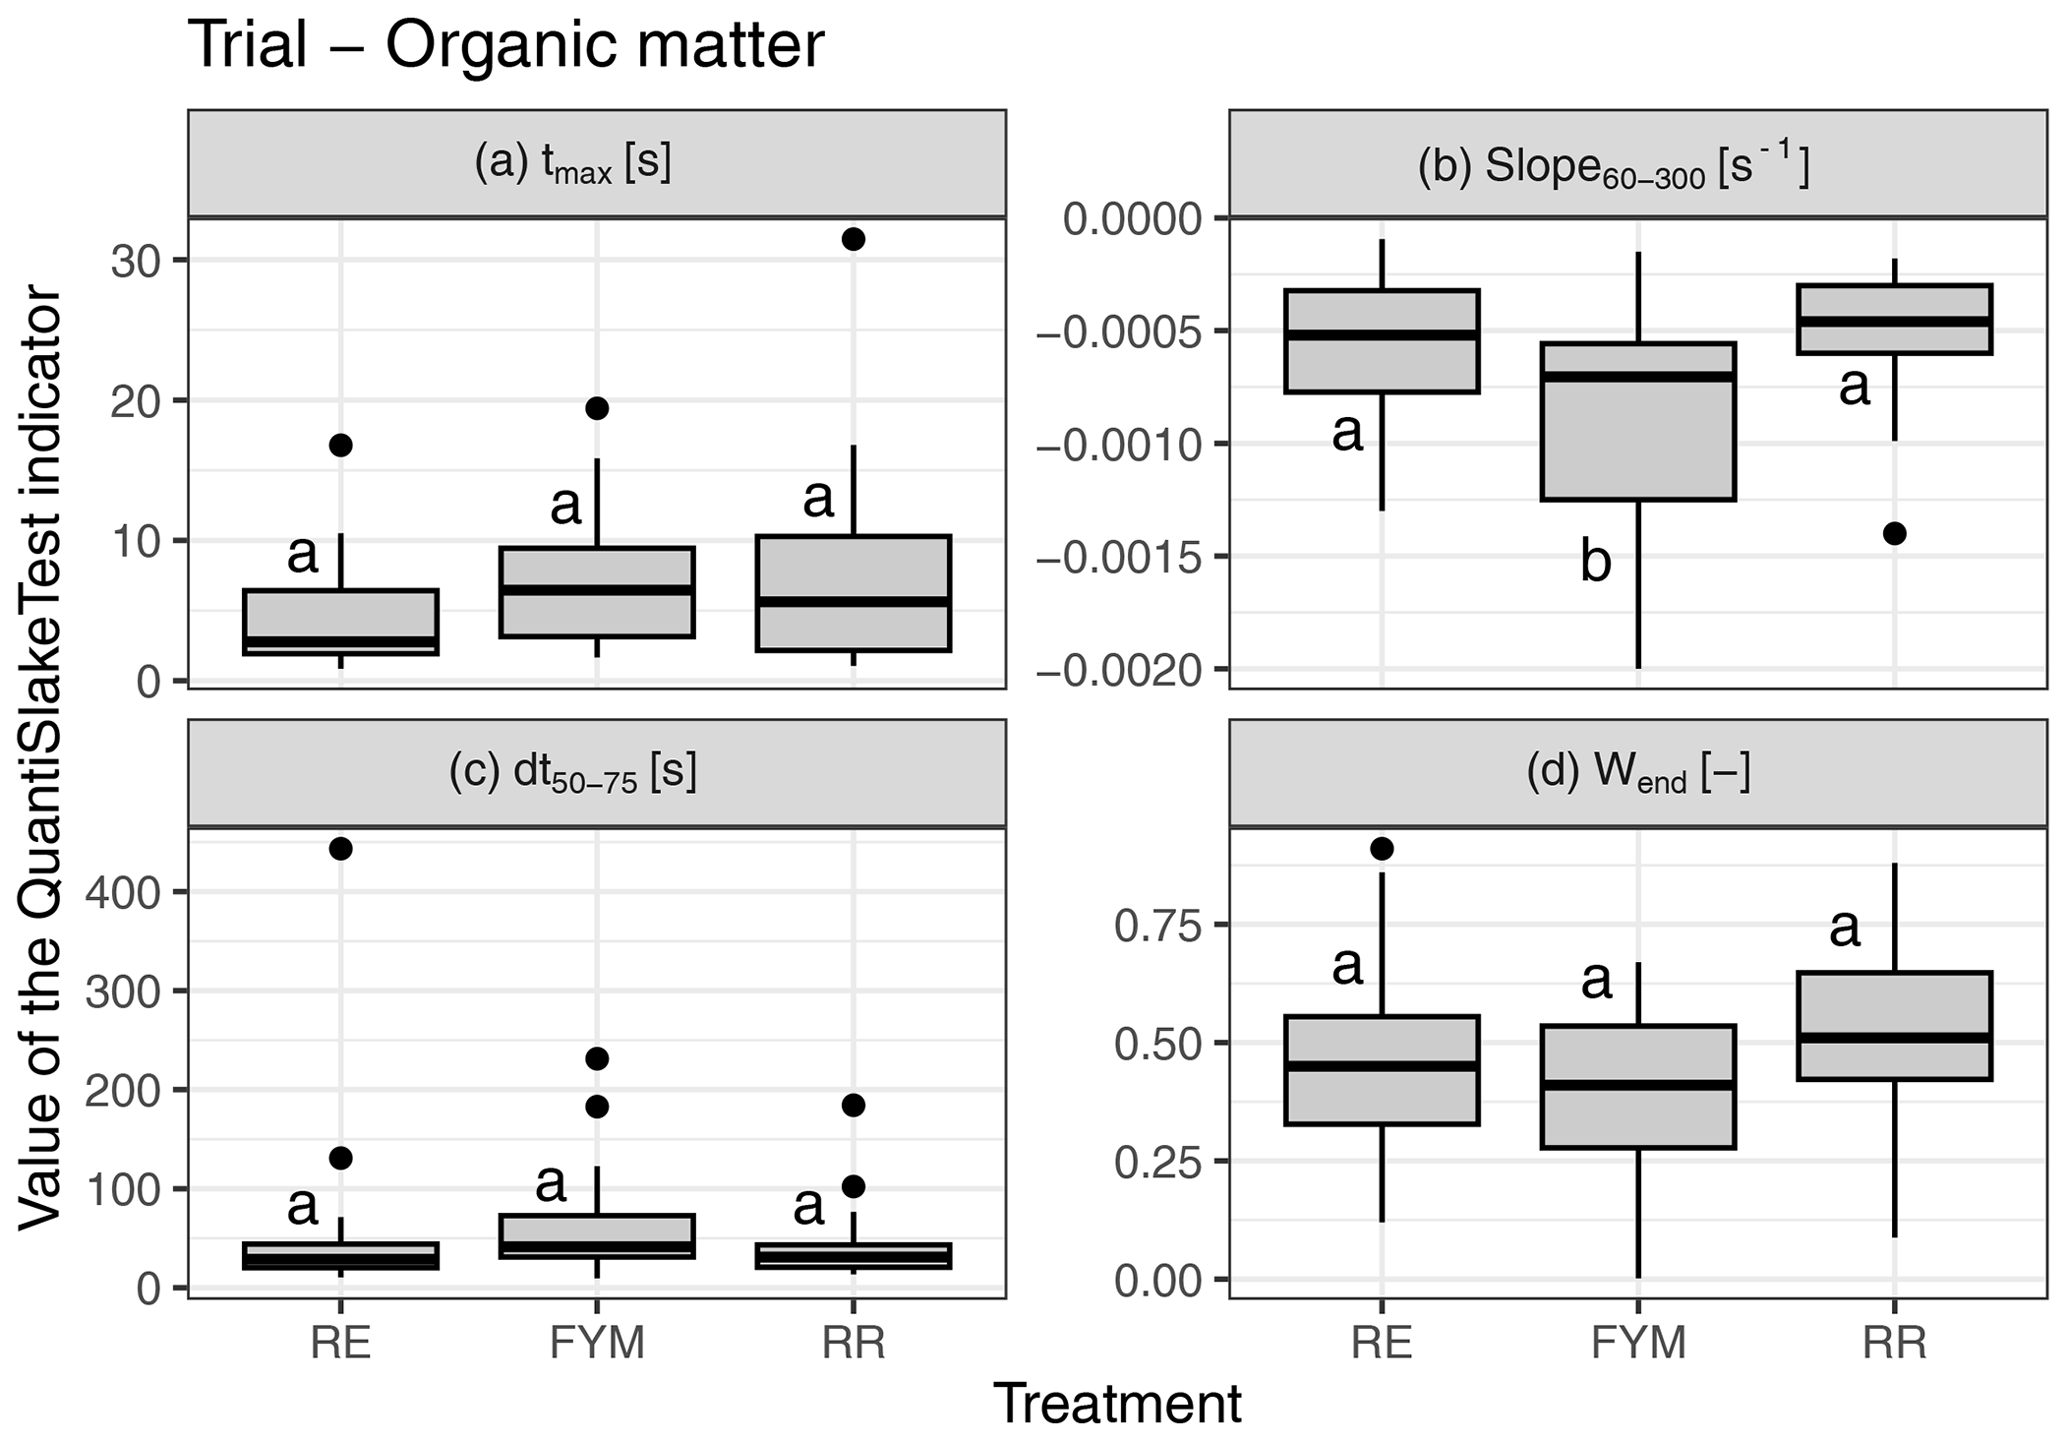
Figure 5Box plots of four QST indicators against treatments of OM input for the soils from the organic matter trial, “residue exportation” (RE), “farmyard manure” (FYM) and “residue restitution” (RR). (a) tmax; (b) slope60–300; (c) dt50–75; (d) Wend.
3.4.2 Tillage trial
Remarkably, the QST responds very well to contrasting tillage treatments, with all QST indicators having a better score for reduced tillage (RT) than for ploughing (P) (Figs. 6 and 7). This result is in agreement with total SOC content, because RT has an average SOC content of 12.16 g kg−1, whereas P treatments have an average SOC content of 10.07 g kg−1. Similarly, a higher root biomass content was measured in the topsoil under RT, with 0.42 ± 0.19 mg cm−3 of root biomass for the RT treatment against 0.31 ± 0.16 mg cm−3 for the P treatment (p=0.168). However, slope30–60 (p < 0.007) and Wend (p < 0.008) are more sensitive to tillage than tmax and dt50–75 (Fig. 7). Indicators from the three tests of Le Bissonnais provide similar results, with the most contrasting response between RT and P tillage treatments obtained for the fast-wetting test (Appendix B, Fig. B2). However, slope30–60 and Wend discriminate better between tillage treatments than MWD1 (p < 0.05).
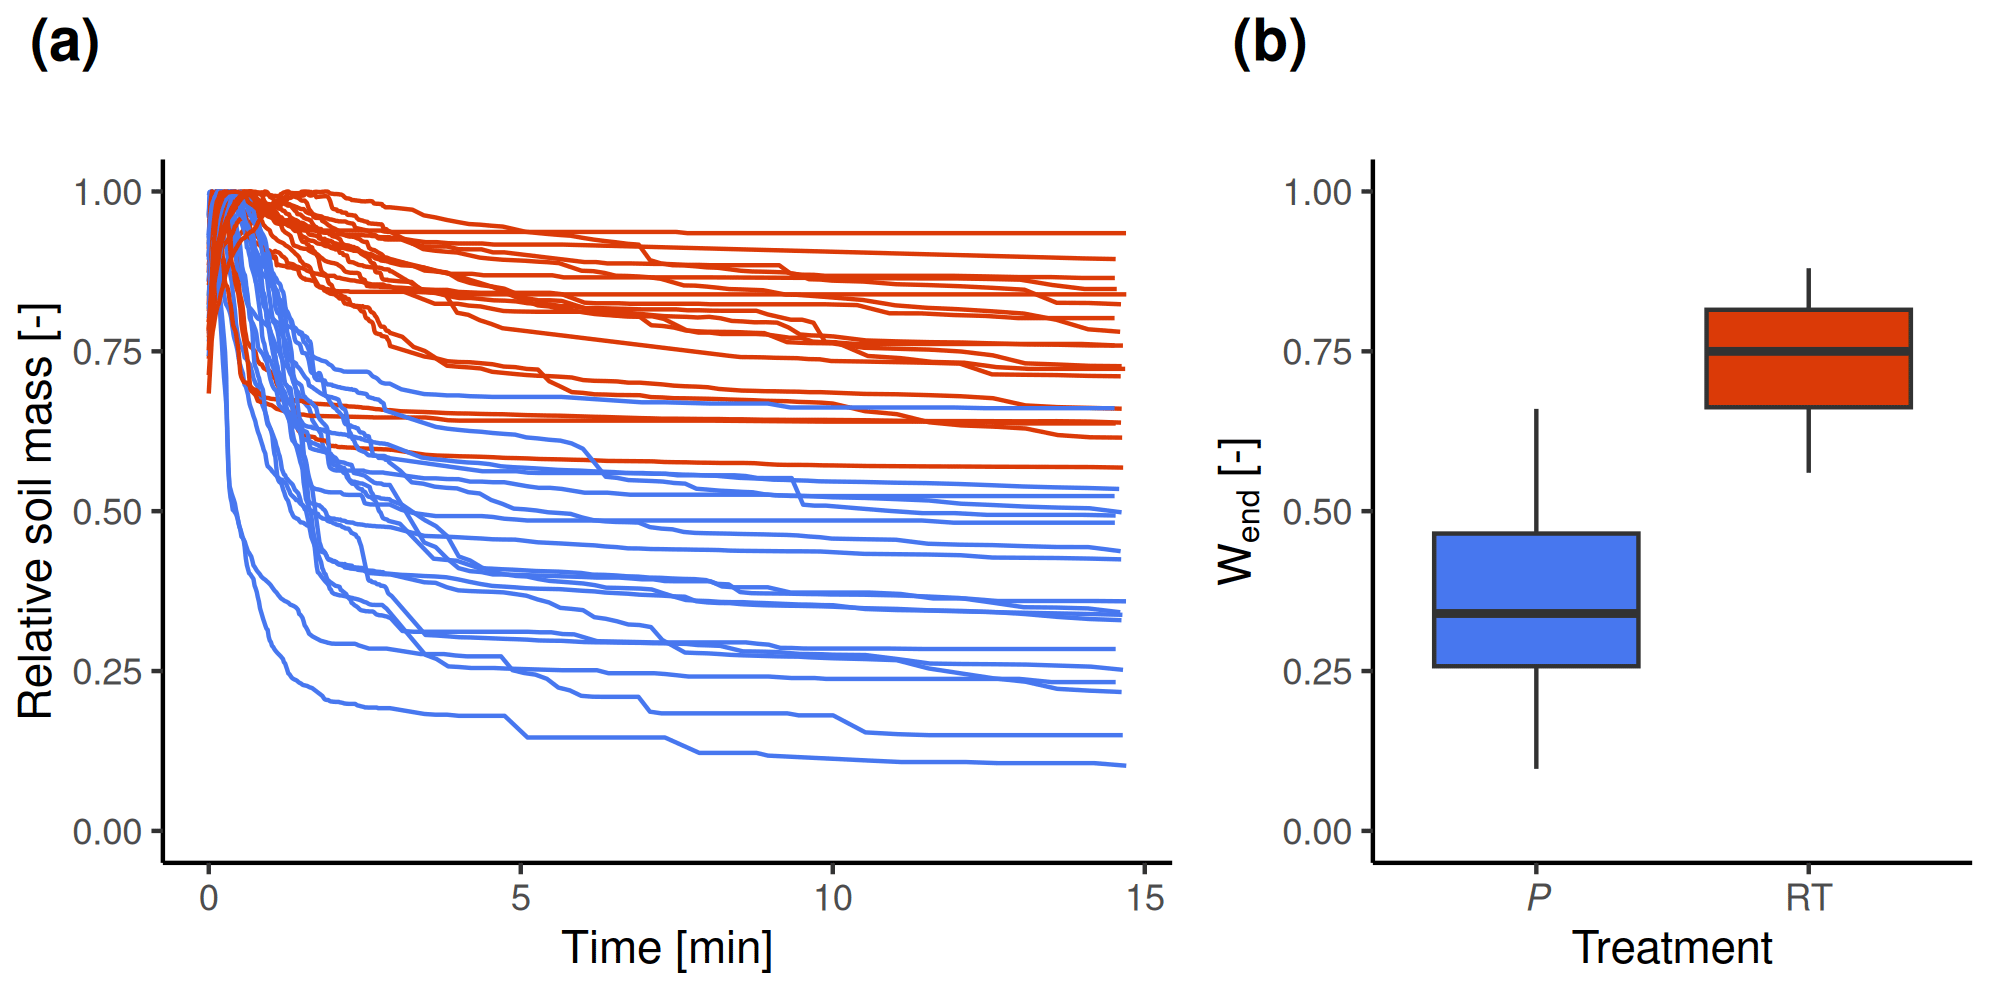
Figure 6QST curves (a) and final relative mass (Wend, b) for ploughing and reduced tillage treatments of the tillage trial.
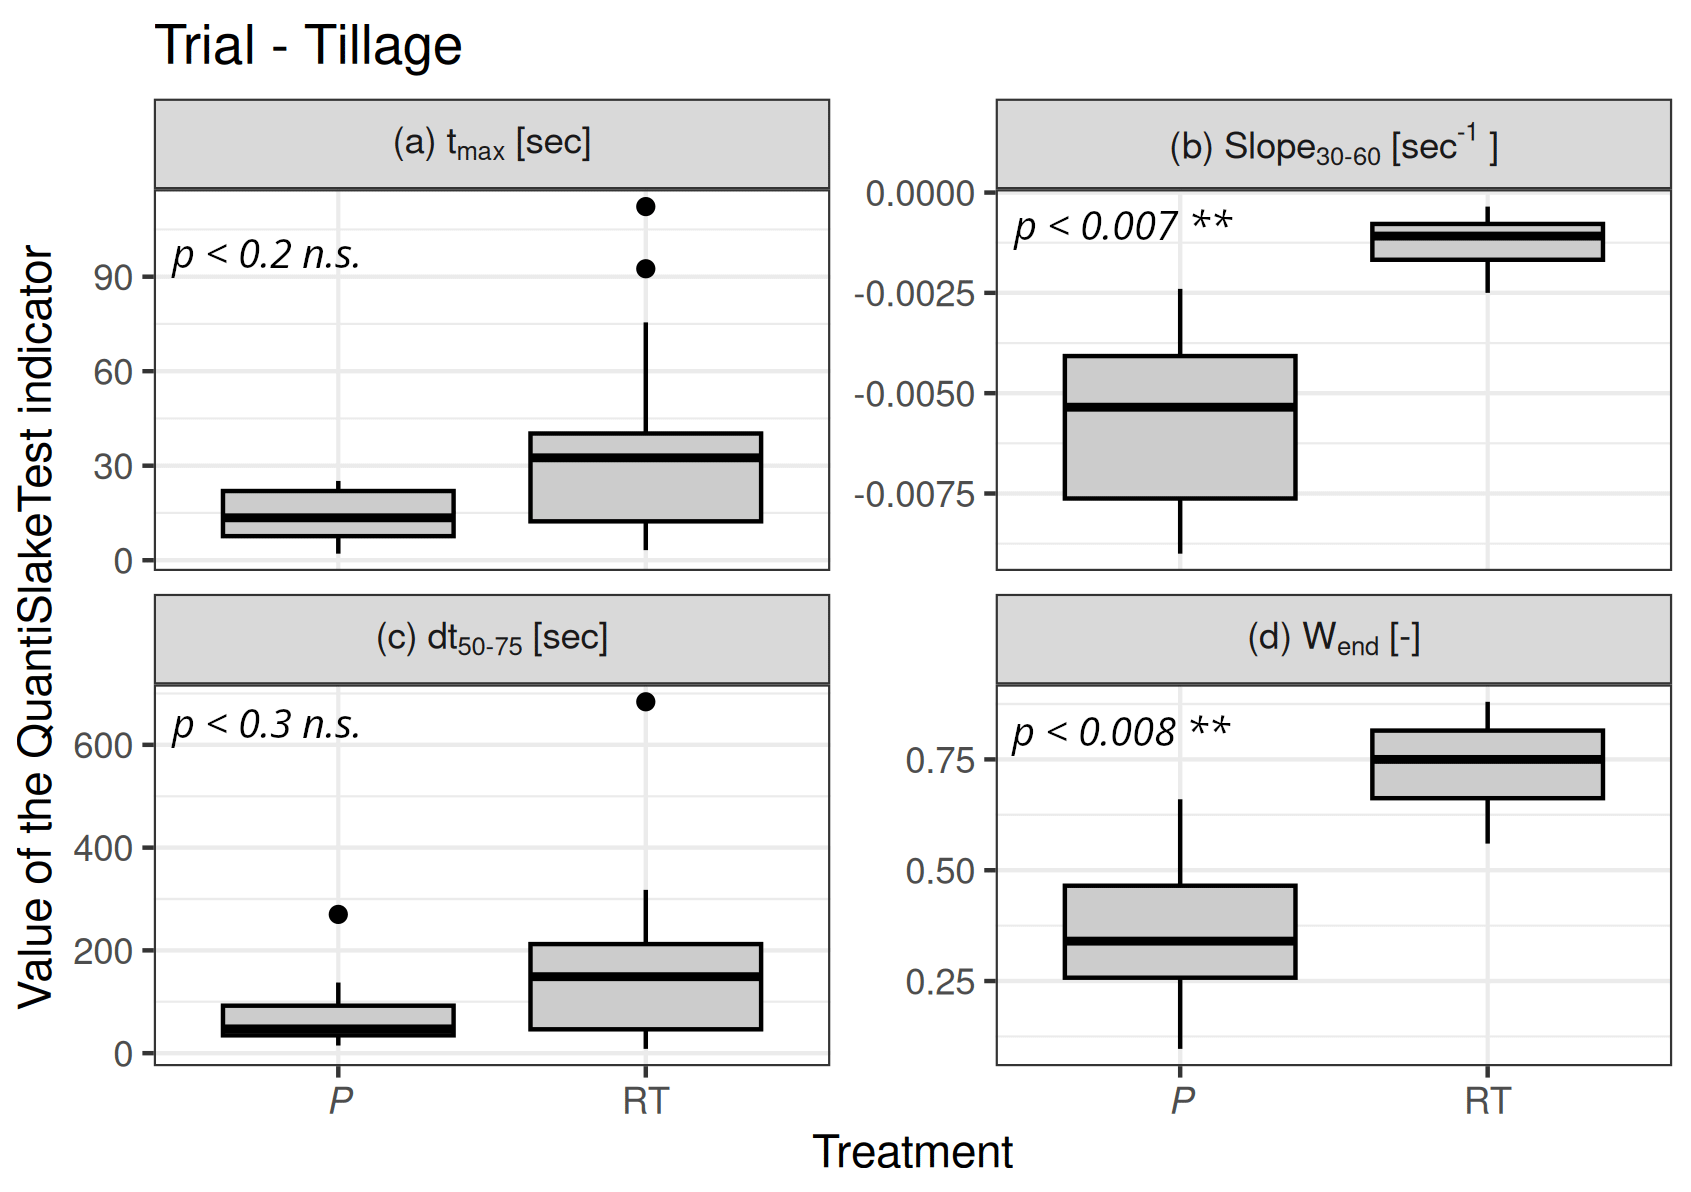
Figure 7Box plots of four QST indicators against tillage treatments, ploughing (P) and reduced tillage (RT) for the soils from the tillage trial. (a) tmax, (b) slope30–60, (c) dt50–75 and (d) Wend.
3.4.3 P–K mineral fertiliser trial
In the P–K mineral fertiliser trial, soil structural stability follows the order K2 > K0 > K1 regardless of the QST indicator (data not shown) but without any significant differences (n.s.). Similar results were obtained with the three tests of Le Bissonnais but with a smaller standard deviation on average than that of QST indicators.
4.1 Interpretation of QST curves in light of mechanisms of soil disaggregation and soil properties
4.1.1 Mechanisms of soil disaggregation
Right after immersion in water, soil mass increases due to the replacement of air by water in soil porosity. Sooner or later, soil mass then reaches a maximum before decreasing when mass loss by disaggregation exceeds mass gain due to filling of soil porosity with water. QST indicators from the start of the curves (e.g. , tmax, slopemax–30) are the most correlated to the fast-wetting test of Le Bissonnais (MWD1 and MA1; Table 2), which suggests that slaking plays a major role in the initial stage of the QST. In contrast, QST indicators from the intermediate to late stages of the curves (e.g. t75 to t95) are more correlated to the slow-wetting test of Le Bissonnais (Table 2), specifically targeting clay dispersion and differential swelling. This indicates that after a longer time period under water, when soil is saturated, the effect of slaking decreases, and clay dispersion and differential swelling become the dominant mechanisms of soil disaggregation. Nevertheless, both mechanisms overlap, with air release from soil further interfering with the measurement of soil mass loss when running QST. This may explain the relatively low correlation coefficients obtained between QST slopes and indicators from the fast- and slow-wetting tests of Le Bissonnais. It is also worth mentioning that the time of wetting of the soils of our study was relatively short (less than 2 min, as indicated by the release of air bubbles from soil). We therefore argue that indicators from the initial stage of the curve, like slope30–60, may provide information much more specific to slaking than indicators from the fast-wetting test of Le Bissonnais, lasting 10 min, which largely exceeds the time during which slaking is the dominant driver of disaggregation.
Except for , QST indicators correlate very poorly to the third test of Le Bissonnais, targeting soil mechanical resistance (Le Bissonnais, 1996). This indicates that little information on soil resistance to raindrop impact or shear strength from agricultural machinery can be inferred from QST curves, which is not surprising. For the soils of this study, soil mechanical resistance (as estimated by the third test of Le Bissonnais) seems to be somehow controlled by the absolute clay content of soil, since clay content correlates positively to MWD3 (r=0.52) and MA3 (r=0.66).
4.1.2 The response of QST indicators to soil properties
Soil mass evolution under water as captured by QST indicators responds in an antagonist way to SOC and clay contents. Indeed, most QST indicators are positively correlated to SOC content and negatively correlated to clay content, with the absolute value of correlation coefficients decreasing for indicators of the later part of the curves (slope60–300, slope300–600 and Wend). Similar trends were observed in other contexts, with the resistance to slaking increasing with SOC content and decreasing with clay content (Jones et al., 2021; Francis et al., 2019). In light of the comparison between QST curves and Le Bissonnais's indicators, the amplitude of the early mass loss under water is mainly controlled by soil resistance to slaking. Accordingly, the absolute SOC content increases soil resistance to slaking, as highlighted by the positive correlation between SOC content and MWD1 (r=0.75). The role of SOM in promoting soil aggregate stability is well-known (Chan and Mullins, 1994; Fukumasu et al., 2022; Kong et al., 2005; Regelink et al., 2015; Six et al., 2004; Tisdall and Oades, 1982), as SOM has long been recognised as one of the main binding agents in micro-aggregates (Dexter, 1988; Edwards and Bremner, 1967). The increase in SOC along a concentration gradient has been shown to decrease the wettability of individual aggregates 3 to 5 mm in diameter and of SOM-associated clay in the < 2 µm fraction of soil (Chenu et al., 2000). This decrease in clay wettability might explain, in part at least, the higher aggregate stability under water of soils rich in SOC, with the slower wettability of macro-aggregates explaining their improved resistance to slaking (Chenu et al., 2000) and the slower wettability of clay decreasing its dispersive character (Chenu et al., 2000; Dexter et al., 2008).
In contrast, while the absolute clay content increases soil mechanical resistance (supported by the positive correlation with MWD3 and MA3), it also tends to decrease soil structural stability under water (as indicated by the negative correlation with most QST indicators). This supports the view that, for cropland soils of this study with low SOC content on average, clay dispersivity and differential swelling are strong drivers of soil disaggregation in wet conditions. This is in agreement with the findings of Dexter et al. (2008), who found that, for a variety of soils from France and Poland, about 1 g of SOM was necessary to decrease the dispersive power of 10 g of clay by organo-mineral association. This threshold value of 0.1 for the mass SOC : clay ratio was reported as pivotal between good and medium structural quality as estimated by field visual soil assessment by the CoreVESS method for 161 agricultural soils of Switzerland (Johannes et al., 2017) and for a large number of forest, grassland and cropland soils from England and Wales (Prout et al., 2020). Additionally, both Johannes et al. (2017) and Prout et al. (2020) found a linear increase in soil structural quality scores with increasing SOC : clay ratios in the range 1 : 13 to 1 : 8, suggesting that SOM has beneficial effects on soil structure beyond the threshold value of 1 : 10 determined empirically by Dexter et al. (2008). We assume that these results can be extrapolated to other temperate European soils under similar pedoclimatic conditions and clay mineralogy, as supported by the linear increase of QST indicator with the SOC : clay ratio in the range 0.04–0.12 (Fig. 4). This supports the idea that , as a predictor of the SOC : clay ratio, has the potential to estimate the overall soil structural quality as measured in field conditions with visual soil assessment methods.
It is important to underline that the close linear relationship found between and the SOC : clay ratio (see Fig. 4) has probably no general character and was obtained here because cropland soils of the current study were sampled under standardised conditions of seeding and cover (winter wheat). It is very unlikely to find an identical relationship for the same soils under contrasting conditions of soil preparation, sampling dates or crop type, since soil structure does also relate to more or less dynamic external factors such as tillage, root and hyphae development, and biological activity. To sum up, we suggest that the SOC : clay ratio, a proxy for soil intrinsic “potential” structural stability, is a valuable indicator of the organic and structural status of agricultural soils (Dexter et al., 2008; Johannes et al., 2017; Prout et al., 2020). On the other hand, QST indicators such as provide a quantitative, direct measurement of the overall structural stability of a soil under a given set of conditions. Both parameters are therefore relevant in terms of appreciation of soil resistance to water erosion and structural damage by farm machinery.
4.2 The response of QST indicators to agricultural practices
One challenge for the interpretation of QST curves is the choice of the most suitable indicator(s) to assess soil structural stability. For the tillage and P–K mineral fertiliser trials, the choice of one indicator rather than another is not critical because indicators from QST curves are consistent with each other and with indicators from Le Bissonnais. In contrast, for the treatments of the organic matter trial, results differ between indicators from the start and the end of the QST curves. This originates from curves having different shapes according to the treatments, suggesting differences in disaggregation mechanisms from one treatment to another. The FYM treatment resists disaggregation more strongly at the start of the QST, whereas RR is the best treatment against disaggregation under water at the end of QST curves (Fig. 5). This last result is counter-intuitive, since the FYM treatment has a higher total SOC content than the RR treatment. Nevertheless, similar results had already been reported on the same trial (Droeven et al., 1980), with the RR treatment resisting better than FYM to disaggregation by wet sieving. This result in conflict with total SOC content must be regarded in light of (i) the quality of SOM inputs and (ii) the frequency of SOM restitution. Buysse et al. (2013a) calculated that the FYM and RR treatments receive on average similar amounts of C inputs, 472 ± 82 and 487 ± 93 gC m−2 yr−1, respectively. Over time, this amount of C input by farmyard manure application has led to an increase of total SOC content (about 12 g kg−1) for the FYM treatment), whereas for the RR treatment, an equivalent C input by green manure and residue restitution only allowed SOC content to be maintained to the initial level (about 10 g kg−1; Buysse et al., 2013b). A smaller SOC storage for a similar C input means a higher rate of mineralisation. The formation of water-stable aggregates under the effect of microbial decomposition of root biomass is a known process (e.g, Dufey et al., 1986). In the present study, the more microbially active, labile biomass from green manure and crop residues seems to have had a stronger impact on the later part of the QST curve, controlled by clay dispersion and differential swelling, whereas the composted, stable biomass of the farmyard manure had more impact on soil resistance to slaking. This is in agreement with an important contribution of root and fungal exudates as well as microbial mucilages, known as critical binding agents in micro-aggregates (Dexter, 1988), to the reduction of clay dispersivity. Dispersive clay has been proved an important driver of soil erodibility (Brubaker et al., 1992; Czyż and Dexter, 2015). In contrast, soil resistance to slaking appears to be more related to the total content of SOC, with slaking having little effect on micro-aggregates < 250 µm (Dexter, 1988). Another important point is the frequency of SOM inputs, with the FYM treatment receiving cattle manure once every 3 years, whereas the RR treatment receives an extra SOM input annually, in the form of green manure or chopped straw. The last FYM application occurred almost 2 years before the sampling campaign.
For the tillage trial, reduced tillage (RT) improves soil structural stability regardless of the QST indicator (Fig. 7). However, indicators from the late part of QST curves (slope60–300, slope300–600) and global indicators (Wend and AUC) tend to discriminate better between tillage treatments. This result is consistent with an increase in both total SOC content and root biomass in the 2–7 cm topsoil. The gradient of concentration of SOC and nutrients from the surface soil under RT is a known effect once vertical dilution by ploughing is stopped (Chervet et al., 2016; D'Haene et al., 2009; Luo et al., 2010). This higher nutrient content in the topsoil may explain the higher root density. Whereas a higher root density is known to play a key role in soil macro-aggregation, higher root density and SOC contents in the topsoil also positively impact the biological activity. This is in line with a better micro-aggregation and a better performance of indicators from the end of QST curves under RT, related to a better resistance to clay dispersion. Overall, results from the OM and the tillage long-term experiment support the view that living and labile biomass play an important role in decreasing clay dispersion.
For the P–K mineral fertiliser trial, the initial assumption that KCl application might decrease soil aggregate stability (Paradelo et al., 2016) was not verified. This might be due to a relatively short-lived disaggregating effect of KCl, since the last application occurred in the summer of 2016, almost 3 years before soil sampling. The beneficial effect of K fertilisation on crop production and restitution of organic matter to soil might also have counteracted a potentially negative short-term effect.
4.3 Advantages, limitations and perspectives of development of the QST test
The main strength of the QST relies on its simplicity, as the test is rapid to run and does not require expensive equipment or laboratory consumables: demineralised water is actually the only consumable required. QST measurements can therefore easily be repeated several times for one single plot, to improve the robustness of the result by decreasing both the impact of field microsite heterogeneity and of analytical error. Another point of attention is that the QST works on a large structured soil volume (Kopecky cylinders of 100 cm3 in the present study), whereas most traditional methods apply to a certain number of small aggregates from a soil previously gently crumbled by hands (Le Bissonnais, 1996; Edwards and Bremner, 1967; Hénin et al., 1958; Kemper and Rosenau, 1986; Yoder, 1936). On the one hand, the use of a large soil volume may increase the representativeness of the soil sample while decreasing the risk of bias introduced by the selection of soil aggregates from a given size fraction: the test then neglects the properties of the soil fraction of inferior or superior equivalent diameter. On the other hand, the test is poorly adapted for a soil that has been crumbled by tillage shortly before sampling, for which sampling of a soil volume of 100 cm3 may be complicated. Currently, the test has not been tested for stone-rich soils, for which the adequacy of the sampling procedure and running of the test needs to be verified. At this point, the relevance of QST curves to assess soil erodibility needs also to be verified.
To promote the adoption of the QST method by a wide public, an open-source R package slaker (Vanwindekens and Roisin, 2022) including a web application is currently under development for QST data logging, management and analysis, including the calculation of relevant indicators and statistics from the curves and the provision of some keys of data interpretation. Therefore, the QST has a strong potential for adoption by a widespread community of end users from soil science laboratories to farmer organisations with no or little expertise in the measurement of soil properties.
Beyond its simplicity and its large adoption potential, the dynamic character of the test is another strong point, since a high density of information is derived from a single curve. It offers the possibility to extract information either related to one specific mechanism of disaggregation (e.g. slope30–60 for slaking and t95 for clay dispersion) or to the overall structural stability of soil (, Wend or AUC). In this regard, the strong linear relationship between and SOC : clay ratio (which can be considered a proxy for the estimation of the “potential” structural stability of a soil; Johannes et al., 2017, Prout et al., 2020) supports the view that is relevant to evaluate the overall soil resistance to disaggregation under field conditions. At the moment, curve analysis was limited to the calculation of indicators, but curve modelling may offer further perspective for curve interpretations.
In its current state, the test does not provide information on the size of aggregates surviving disaggregation under water, which is of interest to predict soil susceptibility to water erosion. Nevertheless, measurement of residual aggregate size distribution with a classic sieving method would decrease the convenience of the test. As it stands, the test does not provide any information on soil resistance to mechanical breakdown. However, soil resistance to sealing and crusting is routinely estimated by pedotransfer functions using pH in water and SOC and clay contents as input variables (Remy and Marin-Laflèche, 1974), which appears complementary with the information offered by the QST.
In this work, we propose a new method to evaluate soil structural stability, the QuantiSlakeTest (QST). It consists in the dynamic weighing of a structured soil sample under water and the calculation of several indicators from the curves to evaluate soil structural stability. The QST presents several advantages. First, it is rapid to run and works with structured soil samples of large size, which improves the representativeness of the sample and allows for multiple field repetitions. Second, the QST does not require expensive equipment or laboratory consumables. Third, a high density of information stands in one single curve, with the possibility to extract information either on specific mechanisms of soil disaggregation (slaking or clay dispersion and differential swelling), or on the overall structural stability of soil. Therefore, the test has a strong potential for adoption by a widespread community of end users from soil science laboratories to farmer organisations with no or little expertise in the measurement of soil properties.
In the present article, the QST was applied to 35 agricultural soil samples from three long-term experiments in the silt loam region of central Belgium. For these soils, the early mass loss under water was mainly related to slaking, whereas after soil saturation with water, clay dispersion and differential swelling became the dominant processes of soil disaggregation. We found that soil resistance to disaggregation correlates positively with SOM content and negatively to clay content, making the SOC : clay ratio a key indicator of the potential structural stability for the soils of central Belgium.
Beyond the absolute amount of SOC for a given level of clay, the response of QST indicators to soil management practices highlighted that the quality and timing of SOM inputs affect both SOC storage and soil resistance to disaggregation. In the organic matter trial, for similar total SOC inputs, farmyard manure favoured the total SOC content and had the best soil resistance to slaking, whereas green manure and restitution of crop residues improved soil resistance to clay dispersion and differential swelling the most. This supports the view that living and labile biomass is more efficient in decreasing clay dispersivity, whereas soil resistance to slaking relates to total SOC content. This underlines that the choice of indicators for the interpretation of QST curves must be done with great caution, as indicators from the start and the end of the curve may lead to conflicting conclusions.
A1 Autocorrelations between QST indicators
A2 Soil properties and indicators from the Le Bissonnais approach
Table A2Correlation coefficients between soil properties, mean weight diameters (MWDs) and percentages of macro-aggregates (MA) from the three tests of Le Bissonnais (1 – fast wetting; 2 – slow wetting; 3 – mechanical breakdown in water after rewetting with EtOH) and soil properties. The gradient of colours relates to the positive (blue) or to the negative (orange) relative amplitude of correlation coefficients.
B1 Organic matter trial
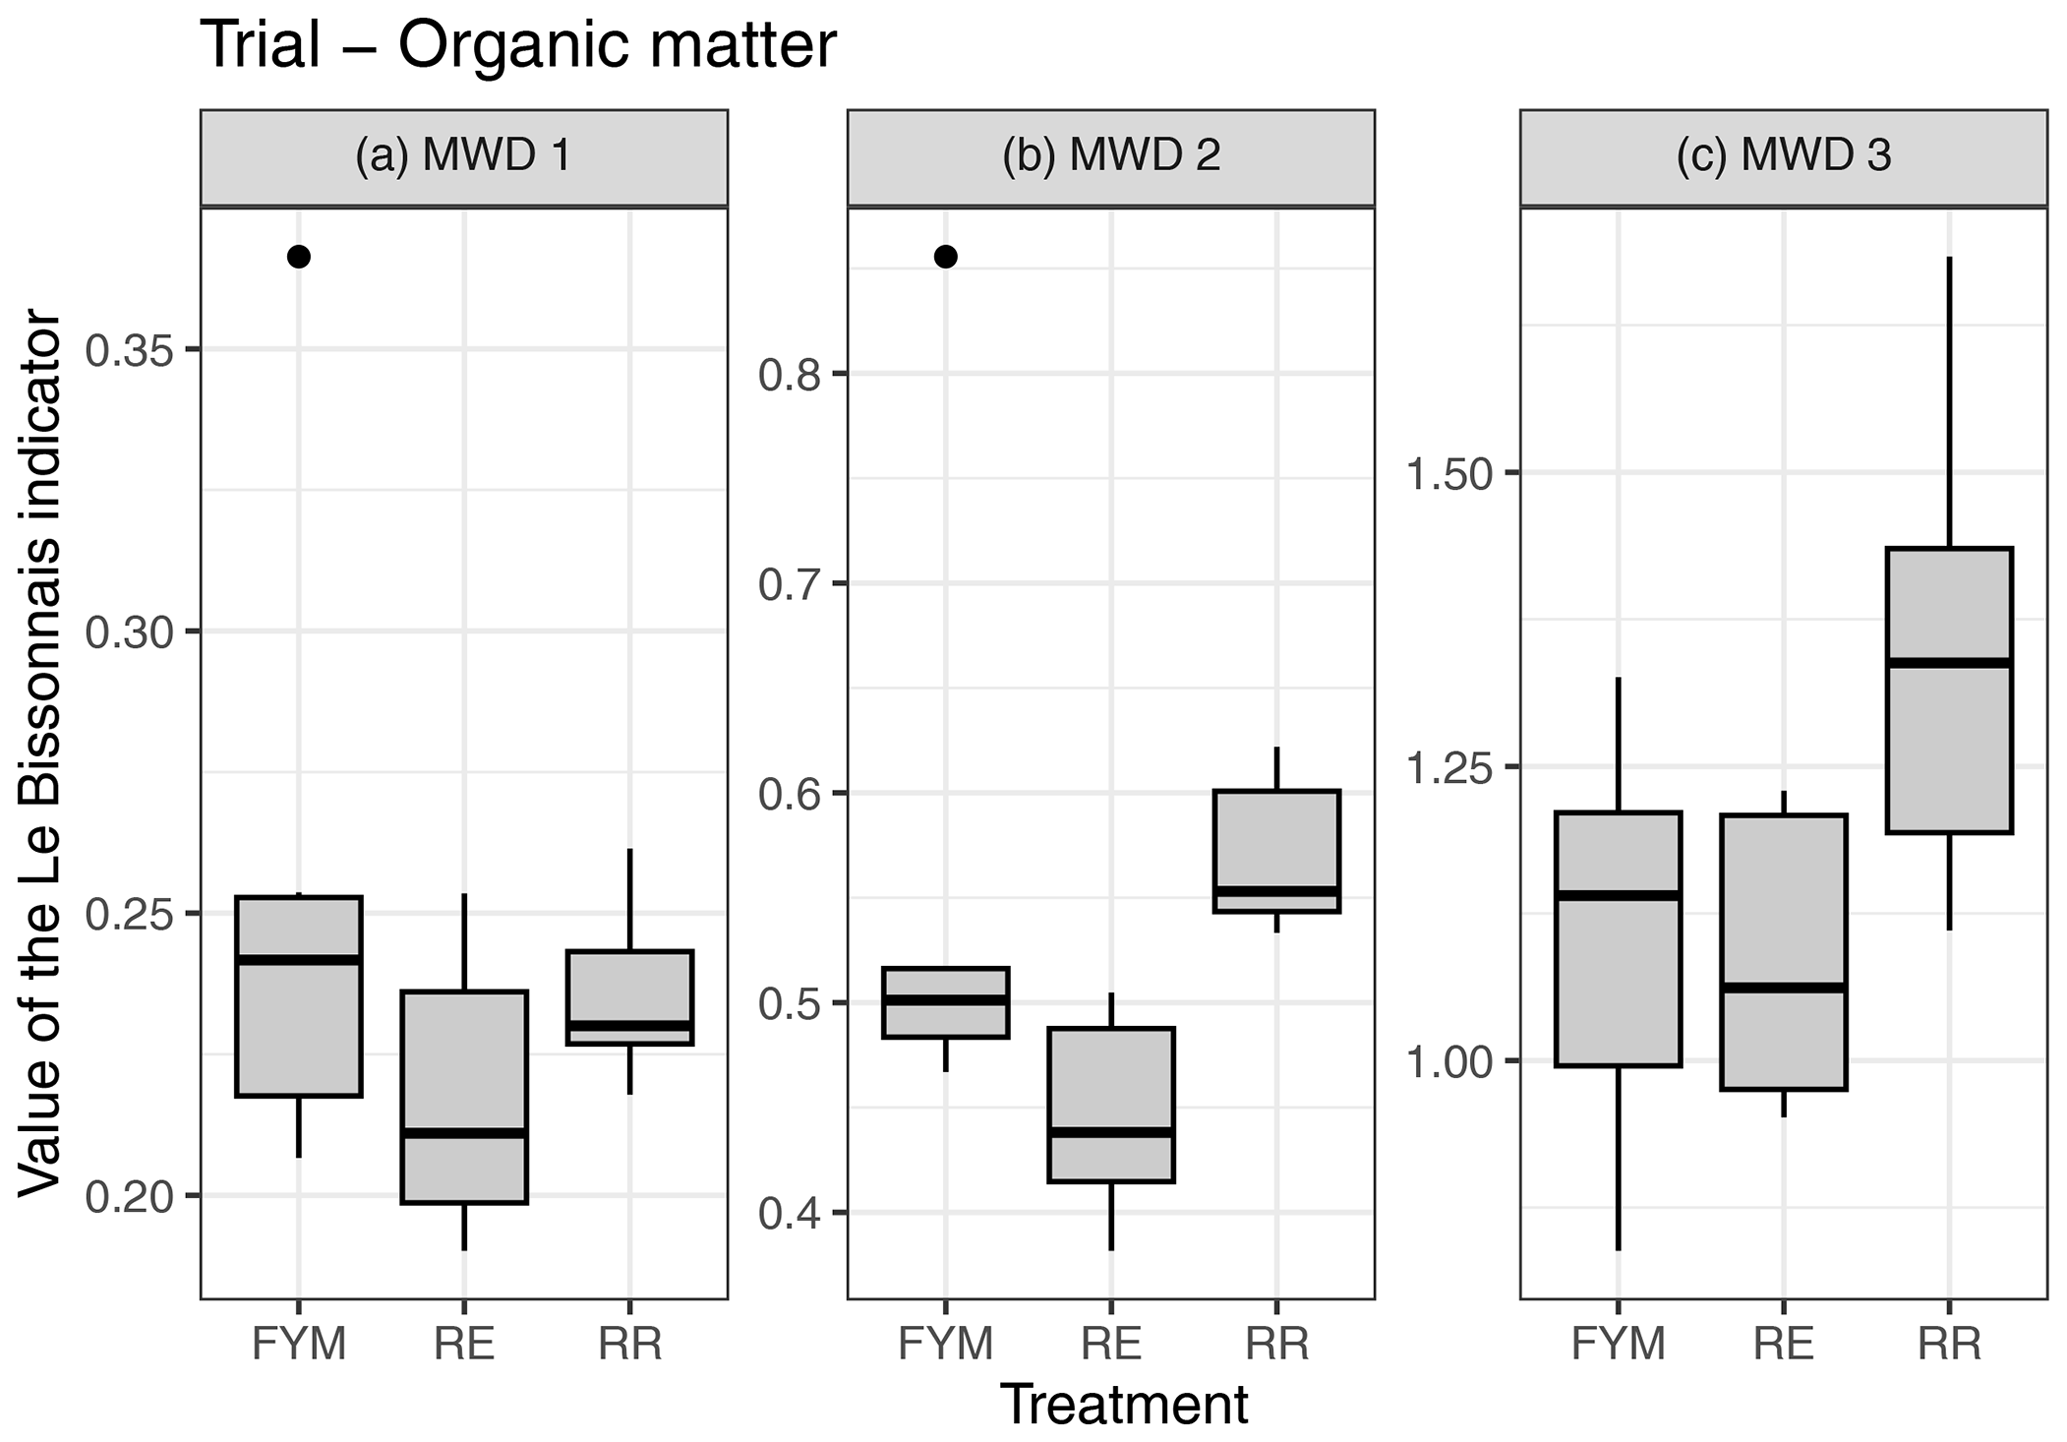
Figure B1Box plots of the three MWDs from the Le Bissonnais test against treatments of OM input for the soils from the organic matter trial, “residue exportation” (RE), “farmyard manure” (FYM) and “residue restitution” (RR).
B2 Tillage trial
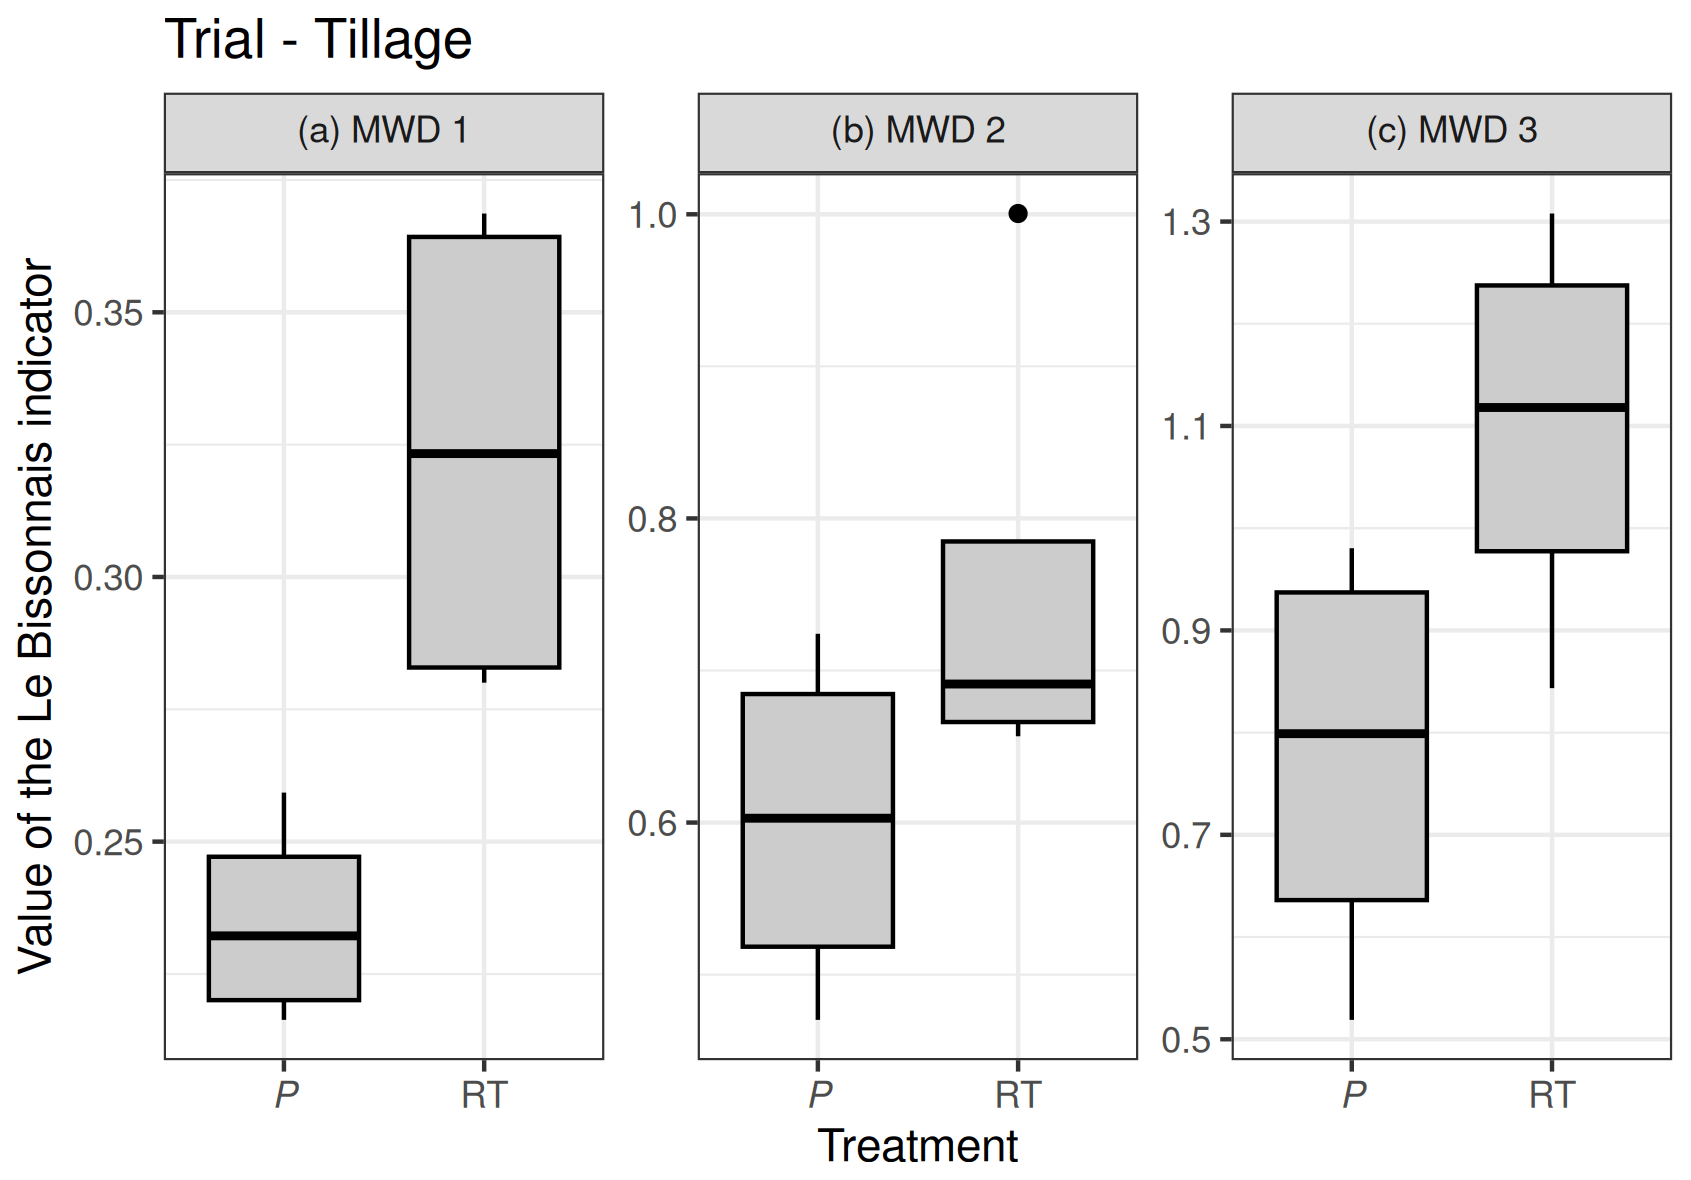
Figure B2Box plots of the three MWDs from the Le Bissonnais test against tillage treatments, ploughing (P) and reduced tillage (RT) for the soils from the tillage trial.
A draft of the slaker R package, containing functions for running the SlakingLab and analysing QST data, is available online, hosted on GitLab: https://gitlab.com/FrdVnW/slaker (Vanwindekens, 2023, https://doi.org/10.5281/zenodo.10030342). The open data supporting this article are available in a data repository in the SlakingLab community on Zenodo https://doi.org/10.5281/zenodo.7142458 (Vanwindekens and Hardy, 2022). The data and the codes used to carry out the statistical analyses and produce the figures, graphs and tables presented in this article are available in a Git repository, including a computational notebook (https://doi.org/10.5281/zenodo.10031948). The two direct links to these resources are as follows: https://gitlab.com/FrdVnW/qst-openscience (Git repository) and https://frdvnw.gitlab.io/qst-openscience/ (computational notebook).
A visualisation of the QuantiSlakeTest and curve generation is available online, comparing two soil samples of contrasting resistance to disaggregation (https://youtu.be/G9UweThvHYI, Vanwindekens, 2018). Two video tutorials to run the QST are also available online: “Slaking Lab – tuto 1” in French (https://youtu.be/J4k1M01jXPQ, Vanwindekens, 2021a) and “Slaking Lab – tuto 1 (part 2)” in French (https://youtu.be/1gOAyz9y-lI, Vanwindekens, 2021b).
FMV and BFH planned the sampling campaign and the measurements, analysed the data, wrote the manuscript draft, and reviewed and edited the manuscript.
The contact author has declared that neither of the authors has any competing interests.
Publisher’s note: Copernicus Publications remains neutral with regard to jurisdictional claims made in the text, published maps, institutional affiliations, or any other geographical representation in this paper. While Copernicus Publications makes every effort to include appropriate place names, the final responsibility lies with the authors.
Many thanks are given to Ir Christian Roisin, whose questions and ideas initiated the development of our approach. We are grateful to the students who contributed to the development of the method by running QuantiSlakeTest for their training or thesis: Vincent Gaucet, Cyril André, Mathieu Dufey, Clément Masson and Fanny Lizin. We would like to thank Gilles San Martin for his insightful comments on the statistical analyses. We thank peers for useful feedback on the method and early results presented in international conferences. We would like to thank the two anonymous reviewers, whose questions, comments and suggestions helped improve and clarify this paper. This study is part of the PIRAT project (CRA-W) and is supported by the action plan BIO2030 (CRA-W/Wallonie).
This research has been supported by the Centre wallon de Recherches agronomiques and La Wallonie, within the scope of the PIRAT project (Moerman funding) and the Plan de développement de la production biologique en Wallonie à l’horizon 2030.
This paper was edited by Estela Nadal Romero and reviewed by Nicolas P. A. Saby and one anonymous referee.
Alewell, C., Borrelli, P., Meusburger, K., and Panagos, P.: Using the USLE: Chances, challenges and limitations of soil erosion modelling, International Soil and Water Conservation Research, 7, 203–225, https://doi.org/10.1016/j.iswcr.2019.05.004, 2019. a
Anjos, L., Gaistardo, C., Deckers, J., Dondeyne, S., Eberhardt, E., Gerasimova, M., Harms, B., Jones, A., Krasilnikov, P., Reinsch, T., Vargas, R., and Zhang, G.: World reference base for soil resources 2014 International soil classification system for naming soils and creating legends for soil maps, edited by: Schad, P., Van Huyssteen, C., and Micheli, E., FAO, Rome (Italy), http://www.fao.org/3/a-i3794e.pdf (last access: 24 October 2023), 2015. a
Antoine, P., Catt, J., Lautridou, J.-P., and Sommé, J.: The loess and coversands of northern France and southern England, J. Quaternary Sci., 18, 309–318, https://doi.org/10.1002/jqs.750, 2003. a, b
Association Française de Normalisation: Qualité du sol – Détermination de la distribution granulométrique des particules du sol – Méthode à la pipette, Standard NF-X31-107, Association Française de Normalisation, https://www.boutique.afnor.org/fr-fr/ (last access: 24 October 2023), 2003. a
Association Française de Normalisation: Sludge, treated biowaste, soil and waste – Determination of total organic carbon (TOC) by dry combustion, Standard NF-EN-15936, Association Française de Normalisation, https://www.boutique.afnor.org/fr-fr/norme/ (last access: 24 October 2023), 2012. a
Bagnall, D. K. and Morgan, C. L.: SLAKES and 3D Scans characterize management effects on soil structure in farm fields, Soil Till. Res., 208, 104893, https://doi.org/10.1016/j.still.2020.104893, 2021. a
Barthès, B. and Roose, E.: Aggregate stability as an indicator of soil susceptibility to runoff and erosion; validation at several levels, Catena, 47, 133–149, https://doi.org/10.1016/S0341-8162(01)00180-1, 2002. a
Bates, D., Mächler, M., Bolker, B., and Walker, S.: Fitting Linear Mixed-Effects Models Using lme4, J. Stat. Softw., 67, 1–48, https://doi.org/10.18637/jss.v067.i01, 2015. a
Bielders, C. L., Ramelot, C., and Persoons, E.: Farmer perception of runoff and erosion and extent of flooding in the silt-loam belt of the Belgian Walloon Region, Environ. Sci. Policy, 6, 85–93, https://doi.org/10.1016/S1462-9011(02)00117-X, 2003. a, b
Brubaker, B., Holzhey, C., and Brasher, B.: Estimating the water-dispersible clay content in soils, Soil Sci. Soc. Am. J., 56, 1226–1232, 1992. a
Buysse, P., Roisin, C., and Aubinet, M.: Fifty years of contrasted residue management of an agricultural crop: Impacts on the soil carbon budget and on soil heterotrophic respiration, Agr. Ecosyst. Environ., 167, 52–59, https://doi.org/10.1016/j.agee.2013.01.006, 2013a. a, b
Buysse, P., Schnepf-Kiss, A. C., Carnol, M., Malchair, S., Roisin, C., and Aubinet, M.: Fifty years of crop residue management have a limited impact on soil heterotrophic respiration, Agr. Forest Meteorol., 180, 102–111, https://doi.org/10.1016/j.agrformet.2013.05.004, 2013b. a, b, c
Castaldi, F., Chabrillat, S., Chartin, C., Genot, V., Jones, A. R., and van Wesemael, B.: Estimation of soil organic carbon in arable soil in Belgium and Luxembourg with the LUCAS topsoil database, Eur. J. Soil Sci., 69, 592–603, https://doi.org/10.1111/ejss.12553, 2018. a
Chabert, A. and Sarthou, J. P.: Conservation agriculture as a promising trade-off between conventional and organic agriculture in bundling ecosystem services, Agr. Ecosyst. Environ., 292, 106815, https://doi.org/10.1016/j.agee.2019.106815, 2020. a
Chan, K. Y. and Mullins, C. E.: Slaking characteristics of some Australian and British soils, Eur. J. Soil Sci., 45, 273–283, https://doi.org/10.1111/j.1365-2389.1994.tb00510.x, 1994. a
Chenu, C., Le Bissonnais, Y., and Arrouays, D.: Organic Matter Influence on Clay Wettability and Soil Aggregate Stability, Soil Sci. Soc. Am. J., 64, 1479–1486, https://doi.org/10.2136/sssaj2000.6441479x, 2000. a, b, c
Chervet, A., Ramseier, L., Sturny, W. G., Zuber, M., Stettler, M., Weisskopf, P., Zihlmann, U., Martínez, I., and Keller, T.: Rendements et paramètres du sol après 20 ans de semis direct et de labour, Recherche agronomique suisse, 7, 216–223, 2016. a
Czyż, E. A. and Dexter, A. R.: Mechanical dispersion of clay from soil into water: Readily-dispersed and spontaneously-dispersed clay, Int. Agrophys., 29, 31–37, https://doi.org/10.1515/intag-2015-0007, 2015. a
Dexter, A. R.: Advances in Characterization of Soil Structure, Soil Till. Res., 11, 199–238, 1988. a, b, c, d, e, f, g, h, i, j
Dexter, A. R., Richard, G., Arrouays, D., Czyz, E. A., Jolivet, C., and Duval, O.: Complexed organic matter controls soil physical properties, Geoderma, 144, 620–627, https://doi.org/10.1016/j.geoderma.2008.01.022, 2008. a, b, c, d
D'Haene, K., Sleutel, S., De Neve, S., Gabriels, D., and Hofman, G.: The effect of reduced tillage agriculture on carbon dynamics in silt loam soils, Nutr. Cycl. Agroecosys., 84, 249–265, https://doi.org/10.1007/s10705-008-9240-9, 2009. a
Droeven, G., Rixhon, L., Crohain, A., and Raimond, Y.: Evolution à long terme de la teneur en humus, de la stabilite structurale et du rendement des cultures sous l'influence de differents modes de restitution de matières organiques sur sols limoneux. Rapport interne, Tech. rep., Centre wallon de Recherches Agronomique, Gembloux, Belgium, 1980. a
Dufey, J. E., Halen, H., and Frankart, R.: Evolution de la stabilité structurale du sol sous l'influence des racines de trèfle (Trifolium pratense L.) et de ray-grass (Lolium multiflorum Lmk.). Observations pendant et après culture, Agronomie, 6, 811–817, https://doi.org/10.1051/agro:19860905, 1986. a
Edwards, A. and Bremner, J.: Microaggregates in soils, J. Soil Sci., 18, 64–73, 1967. a, b, c
Fajardo, M., McBratney, A. B., Field, D. J., and Minasny, B.: Soil slaking assessment using image recognition, Soil Till. Res., 163, 119–129, https://doi.org/10.1016/j.still.2016.05.018, 2016. a
Fox, J. and Weisberg, S.: An R Companion to Applied Regression, Sage, Thousand Oaks CA, 3rd Edn., https://socialsciences.mcmaster.ca/jfox/Books/Companion/ (last access: 24 October 2023), 2019. a, b
Francis, R., Wuddivira, M. N., Darsan, J., and Wilson, M.: Soil slaking sensitivity as influenced by soil properties in alluvial and residual humid tropical soils, J. Soil. Sediment., 19, 1937–1947, 2019. a
Fukumasu, J., Jarvis, N., Koestel, J., Kätterer, T., and Larsbo, M.: Relations between soil organic carbon content and the pore size distribution for an arable topsoil with large variations in soil properties, Eur. J. Soil Sci., 73, e13212, https://doi.org/10.1111/ejss.13212, 2022. a
Goidts, E. and van Wesemael, B.: Regional assessment of soil organic carbon changes under agriculture in Southern Belgium (1955–2005), Geoderma, 141, 341–354, https://doi.org/10.1016/j.geoderma.2007.06.013, 2007. a, b
Hadas, A.: Long-term tillage practice effects on soil aggregation modes and strength, Soil Sci. Soc. Am. J., 51, 191–197, 1987. a
Haynes, R.: Effect of sample pretreatment on aggregate stability measured by wet sieving or turbidimetry on soils of different cropping history, J. Soil Sci., 44, 261–270, https://doi.org/10.1111/j.1365-2389.1993.tb00450.x, 1993. a
Hénin, S., Monnier, G., and Combeau, A.: Method for the analysis of the structural stability of soils, Ann. Agron., 9, 71–90, 1958. a, b
Holland, J. M.: The environmental consequences of adopting conservation tillage in Europe: Reviewing the evidence, Ag. Ecosyst. Environ., 103, 1–25, https://doi.org/10.1016/j.agee.2003.12.018, 2004. a
Imeson, A. and Vis, M.: Assessing soil aggregate stability by waterdrop impact and utrasonic dispersion, Geoderma, 34, 185–200, https://doi.org/10.1016/0016-7061(84)90038-7, 1984. a
International Organization for Standardization: Soil Quality—Determination of Organic and Total Carbon after Dry Combustion (Elementary Analysis), Standard NF-ISO-10694, International Organization for Standardization, https://www.iso.org/fr/standard/18782.html (last access: 24 October 2023), 1995. a
International Organization for Standardization: Soil quality – determination of pH, Standard ISO-10390, International Organization for Standardization, https://www.iso.org/fr/standard/40879.html (last access: 24 October 2023), 2005. a
International Organization for Standardization: Soil quality Measurement of the stability of soil aggregates subjected to the action of water, Standard ISO/FDIS10930:2011, International Organization for Standardization, https://www.iso.org/fr/standard/18782.html (last access: 24 October 2023), 2012. a, b
IPCC: Climate Change 2014: Impacts, Adaptation, and Vulnerability, Part A: Global and Sectoral Aspects, Contribution of Working Group II to the Fifth Assessment Report of the Intergovernmental Panel on Climate Change, edited by: Field, C. B., Barros, V. R., Dokken, D. J., Mach, K. J., Mastrandrea, M. D., Bilir T. E., Chatterjee, M., Ebi, K. L., Estrada, Y. O., Genova, R. C., Girma, B., Kissel, E. S., Levy, A. N., MacCracken, S., Mastrandrea, P. R., and White, L. L. Cambridge University Press, Cambridge, United Kingdom and New York, NY, USA, 1132 pp., https://doi.org/10.1017/CBO9781107415379, 2014. a
Johannes, A., Matter, A., Schulin, R., Weisskopf, P., Baveye, P. C., and Boivin, P.: Optimal organic carbon values for soil structure quality of arable soils. Does clay content matter?, Geoderma, 302, 14–21, https://doi.org/10.1016/j.geoderma.2017.04.021, 2017. a, b, c, d, e
Jones, E. J., Filippi, P., Wittig, R., Fajardo, M., Pino, V., and McBratney, A. B.: Mapping soil slaking index and assessing the impact of management in a mixed agricultural landscape, SOIL, 7, 33–46, https://doi.org/10.5194/soil-7-33-2021, 2021. a, b
Kemper, W. D. and Rosenau, R. C.: Aggregate stability and size distribution, in: Methods of soil analysis, part 1. Agronomy monographs no. 9, edited by: Klute, A. S. A., John Wiley & Sons, Ltd, https://doi.org/10.2136/sssabookser5.1.2ed.c17, Madison, 1986. a, b
Koestel, J., Fukumasu, J., Garland, G., Larsbo, M., and Nimblad Svensson, D.: Approaches to delineate aggregates in intact soil using X-ray imaging, Geoderma, 402, 115360, https://doi.org/10.1016/j.geoderma.2021.115360, 2021. a
Kong, A. Y. Y., Six, J., Bryant, D. C., Denison, R. F., and van Kessel, C.: The Relationship between Carbon Input, Aggregation, and Soil Organic Carbon Stabilization in Sustainable Cropping Systems, Soil Sci. Soc. Am. J., 69, 1078–1085, https://doi.org/10.2136/sssaj2004.0215, 2005. a
Lal, R.: Soil Structure and Sustainability, J. Sustain. Agr., 1, 67–92, https://doi.org/10.1300/J064v01n04_06, 1991. a
Langohr, R.: L'anthropisation du paysage pédologique agricole de la Belgique depuis le Néolithique ancien: apports de l'archéopédologie, Etude Et Gestion Des Sols, 8, 103–118, 2001. a
Le Bissonnais, Y.: Aggregate stability and assessment of soil crustability and erodibility: Theory and methodology, Eur. J. Soil Sci., 46, 425–437, 1996. a, b, c, d, e, f, g, h, i, j, k
Le Bissonnais, Y. and Le Souder, C.: Measurement of aggregate stability for the assessment of soil crustability and erodibility, Étude et Gestion des Sols, 2, 43–56, 1995. a
Lenth, R. V.: emmeans: Estimated Marginal Means, aka Least-Squares Means, r package version 1.7.5, https://CRAN.R-project.org/package=emmeans (last access: 24 October 2023), 2022. a, b
Levy, G. J. and Mamedov, A. I.: High-Energy-Moisture-Characteristic Aggregate Stability as a Predictor for Seal Formation, Soil Sci. Soc. Am. J., 66, 1603–1609, https://doi.org/10.2136/sssaj2002.1603, 2002. a
Loch, R. J. and Foley, J. L.: Measurement of aggregate breakdown under rain: Comparison with tests of water stability and relationships with field measurements of infiltration, Aust. J. Soil Res., 32, 701–720, https://doi.org/10.1071/SR9940701, 1994. a
Luo, L., Lin, H., and Schmidt, J.: Quantitative Relationships between Soil Macropore Characteristics and Preferential Fow and Transport, Soil Sci. Soc. Am. J., 74, 1929–1937, 2010. a
Maugnard, A., Bielders, C., Bock, L., Colinet, G., Cordonnier, H., Degré, A., Demarcin, P., Dewez, A., Feltz, N., Legrain, X., Pineux, N., and Mokadem, A. I.: Cartographie du risque d'érosion hydrique à l'échelle parcellaire en soutien à la politique agricole wallonne (Belgique), Etudes et Gestion des Sols, 20, 127–141, 2013. a
Mbagwu, J. S. and Auerswald, K.: Relationship of percolation stability of soil aggregates to land use, selected properties, structural indices and simulated rainfall erosion, Soil Till. Res., 50, 197–206, https://doi.org/10.1016/S0167-1987(99)00006-9, 1999. a
Meersmans, J., Van Wesemael, B., De Ridder, F., Dotti, M. F., De Baets, S., and Van Molle, M.: Changes in organic carbon distribution with depth in agricultural soils in northern Belgium, 1960-2006, Glob. Change Biol., 15, 2739–2750, https://doi.org/10.1111/j.1365-2486.2009.01855.x, 2009. a
Meersmans, J., Van Wesemael, B., Goidts, E., Van Molle, M., De Baets, S., and De Ridder, F.: Spatial analysis of soil organic carbon evolution in Belgian croplands and grasslands, 1960-2006, Glob. Change Biol., 17, 466–479, https://doi.org/10.1111/j.1365-2486.2010.02183.x, 2011. a
Paradelo, R., van Oort, F., Barré, P., Billiou, D., and Chenu, C.: Soil organic matter stabilization at the pluri-decadal scale: Insight from bare fallow soils with contrasting physicochemical properties and macrostructures, Geoderma, 275, 48–54, https://doi.org/10.1016/j.geoderma.2016.04.009, 2016. a, b
Prout, J. M., Shepherd, K. D., McGrath, S. P., Kirk, G. J., and Haefele, S. M.: What is a good level of soil organic matter? An index based on organic carbon to clay ratio, Eur. J. Soil Sci., 72, 2493–2503, https://doi.org/10.1111/ejss.13012, 2020. a, b, c, d
R Core Team: R: A Language and Environment for Statistical Computing, R Foundation for Statistical Computing, Vienna, Austria, https://www.R-project.org/ (last access: 24 October 2023), 2023. a
Regelink, I. C., Stoof, C. R., Rousseva, S., Weng, L., Lair, G. J., Kram, P., Nikolaidis, N. P., Kercheva, M., Banwart, S., and Comans, R. N.: Linkages between aggregate formation, porosity and soil chemical properties, Geoderma, 247–248, 24–37, https://doi.org/10.1016/j.geoderma.2015.01.022, 2015. a
Remy, J.-C. and Marin-Laflèche, A.: L'analyse de terre : réalisation d'un programme d'interprétation automatique, Ann. Agron., 25, 607–632, 1974. a
Roisin, C.: Essai permanent sur la gestion de la matière organique. Etat des lieux, résultats et réflexions, Tech. rep., Centre wallon de Recherches Agronomiques, Gembloux, Belgium, 2018. a
Roisin, C.: Essai Longue durée sur la gestion de la fumure P-K. Etat des lieux, résultats et réflexions, Tech. rep., Centre wallon de Recherches Agronomiques, Gembloux, Belgium, 2019. a
Seitz, S., Goebes, P., Puerta, V. L., Pereira, E. I. P., Wittwer, R., Six, J., van der Heijden, M. G., and Scholten, T.: Conservation tillage and organic farming reduce soil erosion, Agron. Sustain. Dev., 39, 4, https://doi.org/10.1007/s13593-018-0545-z, 2019. a
Shi, P., Castaldi, F., van Wesemael, B., and Van Oost, K.: Vis-NIR spectroscopic assessment of soil aggregate stability and aggregate size distribution in the Belgian Loam Belt, Geoderma, 357, 113958, https://doi.org/10.1016/j.geoderma.2019.113958, 2020. a
Six, J., Bossuyt, H., Degryze, S., and Denef, K.: A history of research on the link between (micro)aggregates, soil biota, and soil organic matter dynamics, Soil Till. Res., 79, 7–31, https://doi.org/10.1016/j.still.2004.03.008, 2004. a, b
Tisdall, J. M. and Oades, J. M.: Organic matter and water-stable aggregates in soils, J. Soil Sci., 33, 141–163, 1982. a, b, c
Van Camp, G., Gentile, A., Bujarrabal, B., Jones, R., Montanarella, L., Olazabal, C., and Selvaradjou, S.: Reports of the Technical Working Groups Established under the Thematic Strategy for Soil Protection, Tech. Rep. JRC28868, EUR 21319 EN, EC, https://publications.jrc.ec.europa.eu/repository/handle/JRC28868 (last access: 24 October 2023), 2004. a
Vancampenhout, K., Langohr, R., Slaets, J., Buurman, P., Swennen, R., and Deckers, J.: Paleo-pedological record of the Rocourt Pedosequence at Veldwezelt–Hezerwater (Belgian Pleistocene loess belt): Part 1—Evolution of the parent material, Catena, 107, 118–129, 2013. a
Vanwindekens, F. M.: A visualisation of the QuantiSlakeTest, comparing two contrasted samples, YouTube [video], https://youtu.be/G9UweThvHYI (last access: 24 October 2023), 2018. a, b
Vanwindekens, F. M.: Présentation du Slaking Lab et introduction à Slaker (partie 1), YouTube [video], https://youtu.be/J4k1M01jXPQ (last access: 23 October 2023), 2021a. a
Vanwindekens, F. M.: Présentation du Slaking Lab et introduction à Slaker (partie 2), YouTube [video supplement], https://youtu.be/1gOAyz9y-lI (last access: 23 October 2023), 2021b. a
Vanwindekens, F.: slaker – Conduct, analyze and visualize QuantiSlake tests, Zenodo [data set], https://doi.org/10.5281/zenodo.10030342, 2023. a
Vanwindekens, F. M. and Hardy, B.: QST – open data of the article Vanwindekens and Hardy (2022) (1.0), Zenodo [data set], https://doi.org/10.5281/zenodo.7142458, 2022. a
Vanwindekens, F. M. and Hardy, B. F.: Full git repository – QuantiSlakeTest – qst-openscience, GitLab [data set], https://gitlab.com/FrdVnW/qst-openscience (last access: 24 October 2023), 2023a.
Vanwindekens, F. M. and Hardy, B. F.: Notebook with codes, figures and tables – qst-openscience, GitLab [code], https://frdvnw.gitlab.io/qst-openscience/ (last access: 24 October 2023), 2023b.
Vanwindekens, F. M., Hardy, B. F., and SlakingLab community: Data repository in the SlakingLab community on Zenodo, Zenodo [data set], https://doi.org/10.5281/zenodo.7142458, 2022.
Vanwindekens, F. and Roisin, C.: slaker: Conduct and visualize QuantiSlakeTest of soil samples, r package version 0.2, GitLab [code], https://gitlab.com/FrdVnW/slaker (last access: 24 October 2023), 2022. a
Wuddivira, M. N., Stone, R. J., and Ekwue, E. I.: Clay, Organic Matter, and Wetting Effects on Splash Detachment and Aggregate Breakdown under Intense Rainfall, Soil Sci. Soc. Am. J., 73, 226–232, https://doi.org/10.2136/sssaj2008.0053, 2009. a
Yoder, R. E.: A direct method of aggregate analysis of soils and a study of the physical nature of erosion losses, Journal of American Society of Agronomy, 28, 337–351, 1936. a, b
Zhu, Y., Marchuk, A., and McLean Bennett, J.: Rapid Method for Assessment of Soil Structural Stability by Turbidimeter, Soil Sci. Soc. Am. J., 80, 1629–1637, https://doi.org/10.2136/sssaj2016.07.0222, 2016. a
- Abstract
- Introduction
- Materials and methods
- Results
- Discussion
- Conclusions
- Appendix A: Supplementary matrices of correlation coefficients
- Appendix B: Le Bissonnais soil aggregate stability under contrasting soil management practices
- Code and data availability
- Video supplement
- Author contributions
- Competing interests
- Disclaimer
- Acknowledgements
- Financial support
- Review statement
- References