the Creative Commons Attribution 4.0 License.
the Creative Commons Attribution 4.0 License.
 | 05 Jun 2023
Managing soil organic carbon in tropical agroecosystems: evidence from four long-term experiments in Kenya
Marc Corbeels
Antoine Couëdel
Samuel Mathu Ndungu
Monicah Wanjiku Mucheru-Muna
Daniel Mugendi
Magdalena Necpalova
Wycliffe Waswa
Marijn Van de Broek
Bernard Vanlauwe
Johan Six
In sub-Saharan Africa, maize is one of the most important staple crops, but long-term maize cropping with low external inputs has been associated with the loss of soil fertility. While adding high-quality organic resources combined with mineral fertilizer has been proposed to counteract this fertility loss, the long-term effectiveness and interactions with site properties still require more understanding. This study used repeated measurements over time to assess the effect of different quantities and qualities of organic resource addition combined with mineral nitrogen (N) on the change of soil organic carbon (SOC) contents over time (and SOC stocks in the year 2021) in four ongoing long-term experiments in Kenya. These experiments were established with identical treatments in moist to dry climates, on coarse to clayey soil textures, and have been conducted for at least 16 years. They received organic resources in quantities equivalent to 1.2 and 4 t C ha−1 yr−1 in the form of Tithonia diversifolia (high quality, fast turnover), Calliandra calothyrsus (high quality, intermediate turnover), Zea mays stover (low quality, fast turnover), sawdust (low quality, slow turnover) and local farmyard manure (variable quality, intermediate turnover). Furthermore, the addition of 240 kg N ha−1 yr−1 as mineral N fertilizer or no fertilizer was the split-plot treatment. At all four sites, a loss of SOC was predominantly observed, likely because the sites had been converted to cropland only a few decades before the start of the experiments. Across sites, the average decline of SOC content over 19 years in the 0 to 15 cm topsoil layer ranged from 42 % to 13 % of the initial SOC content for the control and the farmyard manure treatments at 4 t C ha−1 yr−1, respectively. Adding Calliandra or Tithonia at 4 t C ha−1 yr−1 limited the loss of SOC contents to about 24 % of initial SOC, while the addition of sawdust, maize stover (in three of the four sites) and sole mineral N addition showed no significant reduction of SOC loss over the control. Site-specific analyses, however, did show that at the site with the lowest initial SOC content (about 6 g kg−1), the addition of 4 t C ha−1 yr−1 farmyard manure or Calliandra with mineral N led to a gain in SOC contents. The other sites lost SOC in all treatments, albeit at site-specific rates. While subsoil SOC stocks in 2021 were little affected by organic resource additions (no difference in three of the four sites), the topsoil SOC stocks corroborated the results obtained from the SOC content measurements (0–15 cm) over time. The relative annual change of SOC contents showed a higher site specificity in farmyard manure, Calliandra and Tithonia treatments than in the control treatment, suggesting that the drivers of site specificity in SOC buildup (soil mineralogy, soil texture, climate) need to be better understood for effective targeting management of organic resources. Farmyard manure showed the highest potential for reducing SOC losses, but the necessary quantities to build SOC are often not realistic for smallholder farmers in Africa. Therefore, additional agronomic interventions such as intercropping, crop rotations or the cultivation of crops with extended root systems are necessary to maintain or increase SOC.
- Article
(4792 KB) - Full-text XML
- BibTeX
- EndNote


Maize cropping in sub-Saharan Africa (SSA) is generally characterized by yields less than 2 t ha−1, far below the world average of about 5.5 t ha−1 (FAO, 2021). This has to a large extent been attributed to a lack of nutrient inputs, leading to nutrient mining and a decrease in soil fertility, including soil organic matter loss (Vanlauwe and Giller, 2006). The longer these low-input cropping systems are maintained, the stronger the decline of soil fertility that occurs and the lower the ability of soils to provide nutrients to crops through mineralization of soil organic matter becomes (Vanlauwe et al., 2015). To counteract this soil fertility decline, sustainable intensification practices are needed, which allow for increased crop yields while simultaneously maintaining or increasing soil fertility (Pretty and Bharucha, 2014). In the context of smallholder farming systems in SSA, integrated soil fertility management (ISFM) is expected to deliver on both aspects (Gentile et al., 2009; Gram et al., 2020). ISFM implies the use of improved germplasm and mineral fertilizer, which mainly targets short-term crop productivity, combined with the application of organic resources (Vanlauwe et al., 2010), which targets long-term system sustainability by providing the needed carbon (C) and nitrogen (N) inputs (Kong et al., 2005) to replenish soil organic carbon (SOC).
Results from several experiments (Adams et al., 2020; Laub et al., 2022) and a recent meta-analysis (Fujisaki et al., 2018) suggest that, given the right quantity and quality of inputs and depending on soil conditions and management, it is possible to increase the SOC contents in tropical soils. However, some other experiments in tropical SSA revealed that it was not possible to maintain SOC in the long term, even with high levels of organic inputs (Kihara et al., 2020). This has been attributed to the initially high SOC levels at the sites, the favorable conditions for SOC decomposition and the low SOC stabilization capability of the 1 : 1 kaolinite clay minerals in tropical soils because of their low surface reactivity (Six et al., 2002; Sommer et al., 2018). Vanlauwe et al. (2015) suggested that differences in local soil conditions are responsible for the observed differences in the success of SOC building practices, and hence local adaptation to different soil conditions is needed.
Besides the effect of soil geochemistry (Doetterl et al., 2015), the quality of organic resources can play an important role in SOC formation (Puttaso et al., 2013), but their relative contribution to SOC storage is still insufficiently understood, especially in heavily weathered tropical soils. It has been established that the quality of organic resources, through the effect of litter stoichiometry (Sinsabaugh et al., 2013), determines the potential to built new, stable microbial-derived SOC (Kallenbach et al., 2016). However, it is less certain if the efficiency of microbial processing of low-quality organic resources (with high C : N ratio) can somehow be enhanced, for example, by increasing the availability of nutrients from mineral sources. The latter has been suggested by comparing microbial efficiencies at low and high N addition rates in forests (J. Li et al., 2021) but has to date not been studied in agroecosystems. A recent study suggested that the combination of low- and high-quality organic resources can enhance the overall microbial carbon-use efficiency (Pingthaisong and Vityakon, 2021), yet we are not aware of any study that investigated whether the same occurs when adding mineral N to low-quality organic resources. Also, the interactions of organic resource quality with geochemistry have been under-investigated. While a recent laboratory study indicated that geochemistry may be as important as organic resource quality in the formation of new, stable SOC (Bucka et al., 2021), both factors and their interactions need to be studied under field conditions. In fact, we are only beginning to understand the fundamental principles behind their interactions, and a better understanding of these factors that regulate the microbial processing, stabilization and decomposition of SOC in soils is needed as old paradigms get cast into doubt (Cotrufo et al., 2021). For example, the theory that low-quality organic resources, rich in recalcitrant lignin and polyphenol, lead to more soil organic matter formation than high-quality resources Palm et al. (2001a, b) has been replaced by concepts that consider SOC of microbial origin, which favorably forms from high-quality resources, to be the most stable (Cotrufo et al., 2013; Denef et al., 2009). Also, the concept that soil texture plays the dominant role in determining how much SOC can be stabilized in a soil (Hassink, 1997) did not hold for adjacent soils differing in texture but with the same mineralogy (Schweizer et al., 2021); the latter suggests that the actual driver behind correlations of soil texture with SOC storage across large scales may be the different soil mineralogy and not the particle size.
As the goal of ISFM is to increase short- and long-term soil fertility, in particular through increasing SOC, there is a need to better understand the extent to which the rate and quality of organic resource additions influence the rate of SOC change under different pedoclimatic conditions. This can help to answer the question of whether organic resource quality, quantity or site properties are most important in building SOC. The answer to this question is crucial for site-specific recommendations. Yet, few studies reported on SOC dynamics following organic resource additions over time spans of decades or longer. Besides, it is not clear in how far the combined application of organic and mineral N fertilizer affects SOC dynamics. To shed light on these questions, we analyzed data from four long-term experiments conducted at different sites in central and western Kenya, with exactly the same organic and mineral resource additions at each site. The objectives of the study were (i) to quantify the efficiency of SOC buildup with the addition of organic resources of different qualities combined with or without mineral N fertilizer, and (ii) to investigate how the efficiency of SOC formation differs between sites. To guide our research, the following hypotheses were formulated:
-
Addition of high-quality organic resources (low C : N and lignin : N ratios) leads to an increase in SOC content, because they are most efficiently processed by soil microbes (Cotrufo et al., 2013). In contrast, low-quality resources maintain less SOC in the long term.
-
Due to a C : N ratio that is too high compared to typical microbial C : N ratios of about 8 to 14, nitrogen availability is a major limitation for SOC buildup from low-quality organic resources. Therefore, low-quality resources have a higher SOC buildup if mineral N fertilizer is added compared to when no mineral N is applied.
-
The efficiency with which new SOC is formed is influenced by both the pedoclimatic conditions and the organic resource quality. Hence, we expect a significant interaction of resource quality with site in the efficiency to store new SOC.
2.1 Site characteristics
This study uses the combined data from four equally designed long-term experiments, located in central and western Kenya (see Table 1). The two experiments in central Kenya (i.e., in Embu and Machanga) were initiated in 2002, whilst the experiments in western Kenya (i.e., in Sidada and Aludeka) were started in 2005. All sites were under continuous maize cropping with two growing seasons per year. The long rainy season lasted usually from March until August–September and the short rainy season from September–October until January–February (Table 1). The sites were specifically selected to represent different altitudes, levels of precipitation, temperatures and soil conditions. The sites in Sidada (1730 mm; 22.6 ∘C) and Aludeka (1660 mm; 24.4 ∘C) have the longest rainy seasons and the highest rainfall amounts of the four sites, with intermediate mean annual temperatures, representing the most favorable climate for maize production. The Embu site (1175 mm; 20.1 ∘C) is slightly less favorable, while Machanga (795 mm; 23.7 ∘C) represents a drier climate, where maize is at considerable risk of crop failure. The soils in Machanga and Aludeka are coarse textured and have less than 15 % of clay, while those in Sidada and Embu both contain more than 55 % of clay. The soils at all four sites are heavily weathered, which was also reflected in the low pH values of between 5.3 and 5.5 at the start of the experiments. Based on reference soil profiles that were dug before establishing the experiment at each site, the soil in Embu was classified as a Humic Nitisol, which has more weatherable minerals than the Humic Ferralsol in Sidada, a soil that is dominated by low-activity clays as well as iron and aluminum oxides. The Haplic Acrisol in Aludeka and the Ferric Alisol in Machanga are both characterized by illuvial clay accumulation in the subsoil and low base saturation. The clay minerals in the Acrisol in Aludeka are characterized by lower activity than those in the Alisol in Machanga (FAO, 1998; IUSS Working Group, 2014). All sites have almost flat land surfaces with gentle slopes in all sites except Embu (Machanga, 2.5 %; Sidada, 2 %; Aludeka, 1 %; Embu 5 %). However, the Embu site has been terraced to reach a flat surface of the plots as at the other sites. The land-use history prior to the establishment of the experiments differed between sites. The sites at Sidada and Aludeka were savanna-type ecosystems, with trees, shrubs and witchgrass Elymus repens, having a tree cover of about 50 % and that had been converted to low-intensity shifting cultivation approximately 25 years prior to the start of the experiments. The Embu site was initially a tropical evergreen forest that was lost about 50 to 100 years ago when low-intensity shifting cultivation had started. The site at Machanga was a steppe grassland, with a tree cover of around 20 % to 30 %, that was only converted upon the start of the experiment. However, the area around Machanga has been subject to intensive grazing by cattle, so the site was far from undisturbed at the start of the experiment.
(IUSS Working Group, 2014)Table 1Location, soil properties and climatic conditions of the study sites. Soil properties are given for the 0–15 cm depth layer and are based on measurements before the start of the experiment (one reference soil profile per site). Coordinates are given in the WGS 84 reference system.
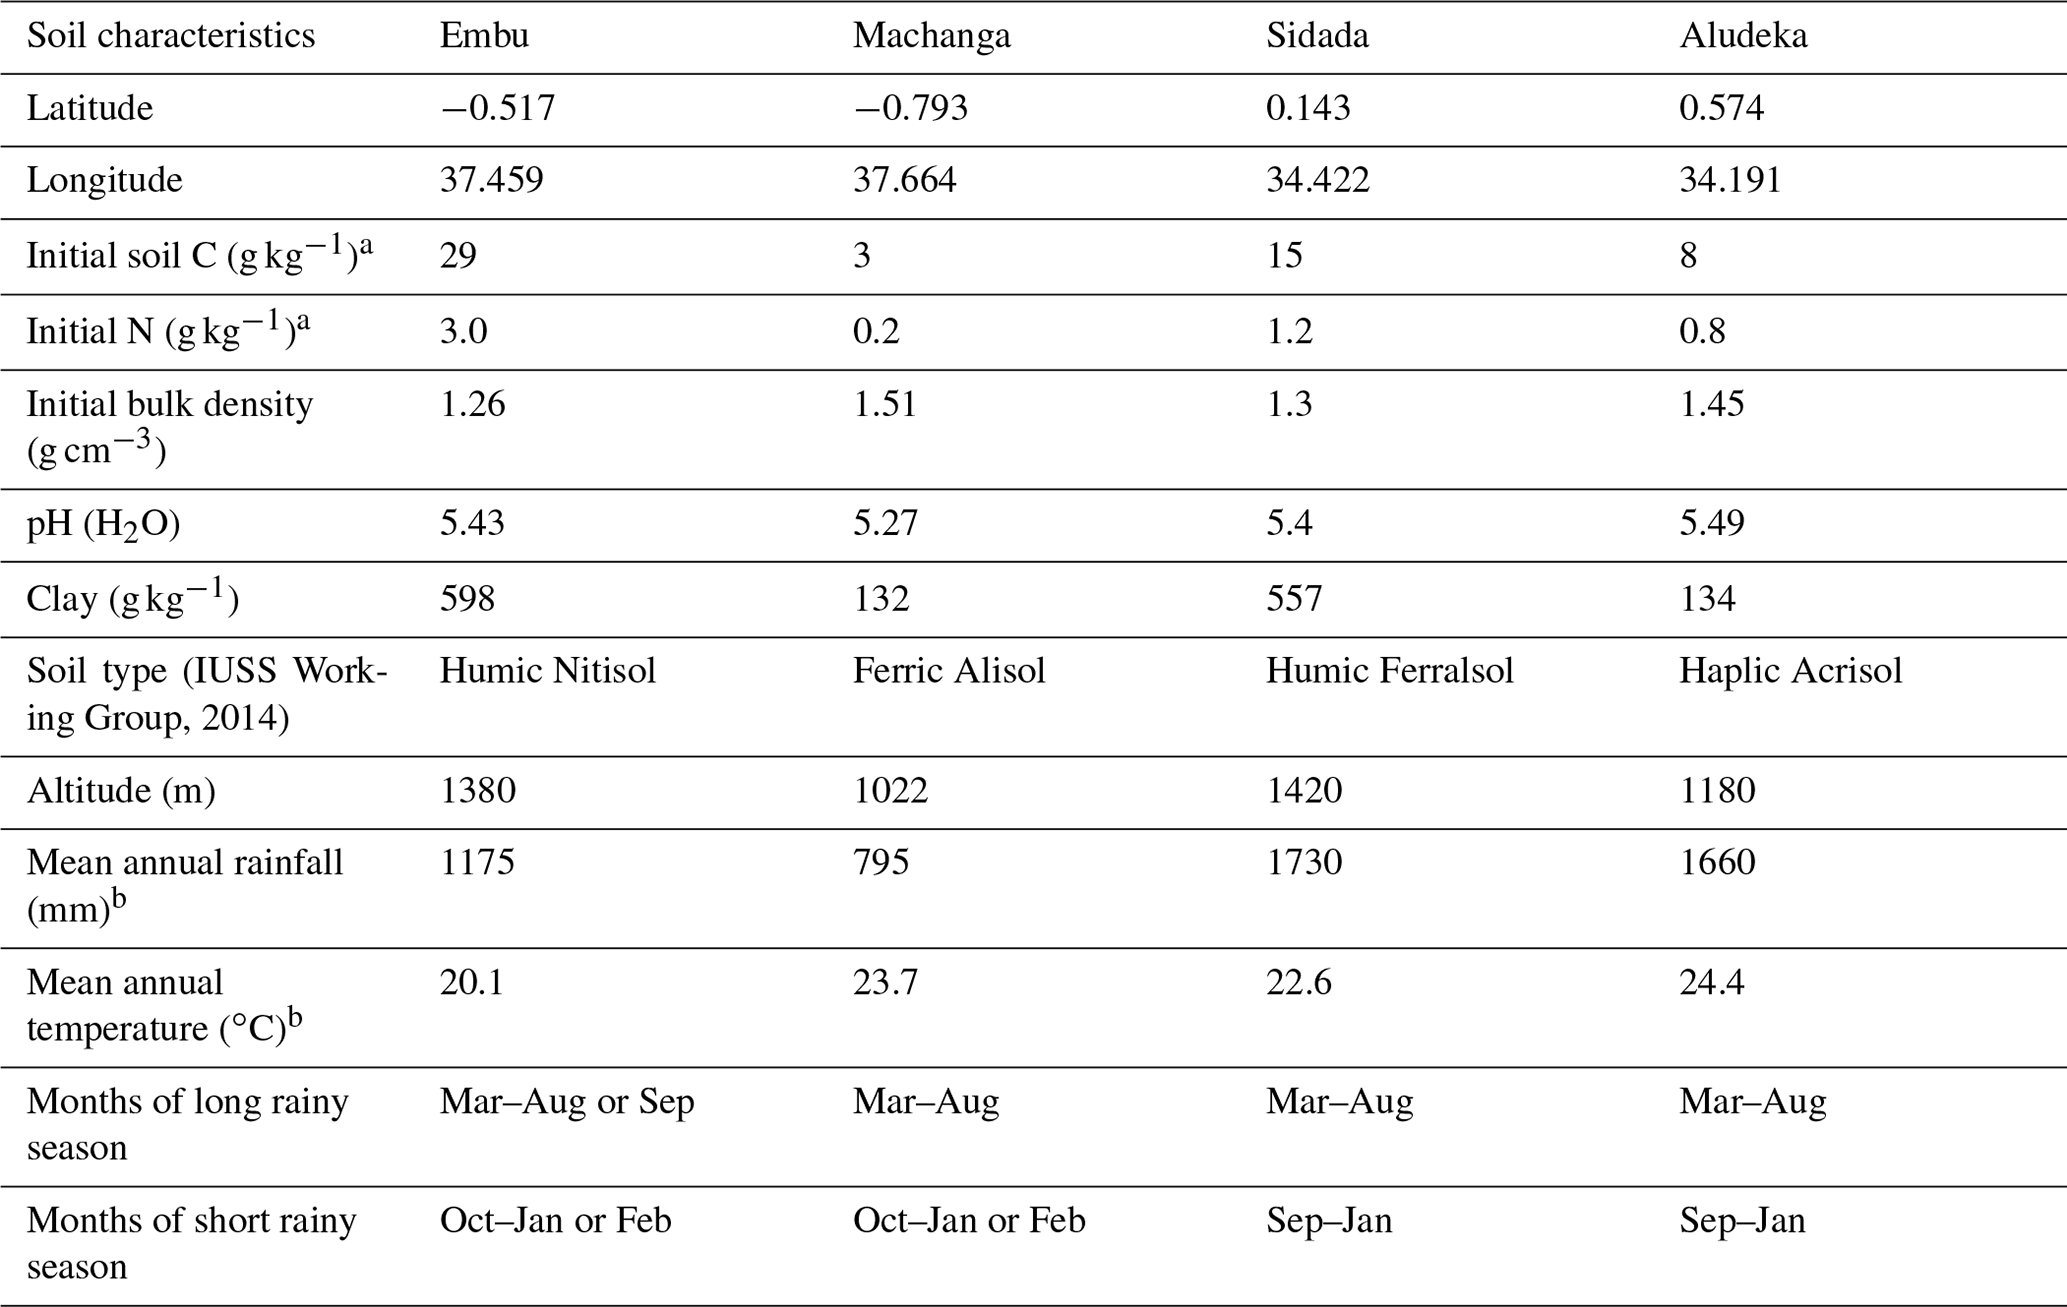
a By dry combustion (CHN628, LECO Corporation, Michigan, USA). b Means calculated based on measured data from 2005 to 2020.
2.2 Experiment description
All four experiments were conducted by using a split-plot design with three replicates (Fig. A1 in the Appendix). The main treatments consisted of the addition of five types of organic resources, applied in quantities of 1200 and 4000 kg C ha−1 yr−1 on plots of 12 × 5 m (Embu) or 12 × 6 m (other sites). The subplot treatment consisted of the application of 120 kg mineral N ha−1 per season (+N treatment) compared to a no N input (−N) treatment. Mineral N (CaNH4NO3) was applied twice during each growing season: the first 40 kg N ha−1 at planting and the remaining 80 kg N ha−1 about 6 weeks later, as top dressing. In each growing season, all plots received a blanket application of 60 kg P ha−1 as triple superphosphate and 60 kg K ha−1 as muriate of potash at planting. The organic resources were applied once a year just before planting at the start of the long rainy season. The incorporation was done using a hand hoe to a soil depth of about 15 cm. The applied organic resources represented all four quality classes that were defined by Palm et al. (2001a), differing in N, lignin and polyphenol contents (Table 2): pruned leaves including stems of <2 cm thickness from Tithonia diversifolia (TD; high quality and fast turnover; class 1), pruned leaves including small stems from Calliandra calothyrsus (CC; high quality and intermediate turnover; class 2), stover of Zea mays (MS; low quality and fast turnover; class 3), sawdust from Grevillea robusta trees (SD; low quality and slow turnover; class 4) and locally available farmyard manure (FYM; no defined class but considered of intermediate to high quality with intermediate turnover; Sileshi et al., 2019; Silva et al., 2014). A treatment without any organic resource addition served as the control (CT). All maize residues were removed from the plots at harvests, so the only C inputs from the maize crop were the roots (and root exudates). In addition, a randomly allocated quarter of each split plot was kept as bare fallow throughout the entire duration of the experiments, receiving the exact same inputs but with no maize planted and with all emerging weeds removed by regular weeding. This was done to study the SOC dynamics without any additional inputs from roots or other plant debris. Further details on the crop management can be found in Chivenge et al. (2009), Gentile et al. (2011) and Laub et al. (2023).
Table 2Dry-matter-based chemical properties (means and 95 % confidence intervals in brackets) of the organic resources applied at all sites. Measurements were done at Embu and Machanga from 2002 to 2004 and in 2018 and at Sidada and Aludeka from 2005 to 2007 and in 2018. Significant differences in properties were found between the different organic resources but not between sites and years. The same letters within the same row indicate the absence of significant differences for that property (p<0.05). Abbreviations: n.c. = not classified.
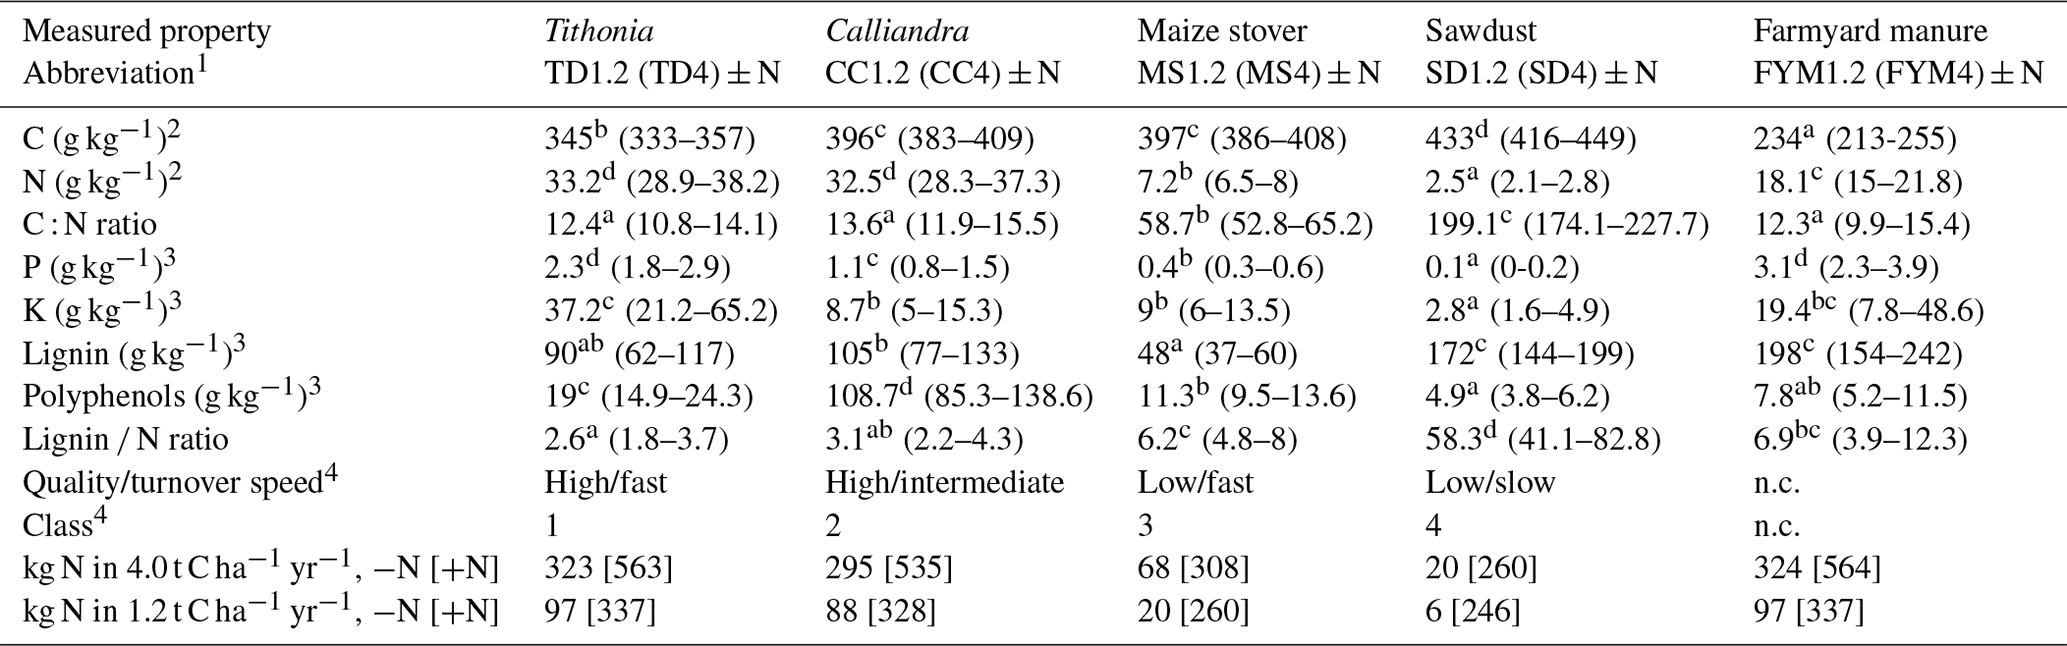
1 For 1.2 (or 4.0) t C ha−1 yr−1 treatments. 2 By dry combustion (CHN628, LECO Corporation, Michigan, USA). 3 Total digestion (P, K), acid detergent fiber (lignin) and Folin–Denis (polyphenols) according to Anderson and Ingram (1993) and 4 according to Palm et al. (2001a). +N and −N indicate 120 or 0 kg mineral N fertilizer application per growing season.
2.2.1 Soil sampling
We used data from all soil sampling campaigns that were conducted throughout the experiments (Vanlauwe et al., 2022), the latest sampling being in 2021 (Overview in Table A1 in the Appendix). In Embu and Machanga, regular soil sampling campaigns were done every 2 to 3 years since the first experimental year (2002), while in Sidada and Aludeka, regular soil samplings were only initiated in 2018, due to budget constraints. With the exception of the 2021 sampling, only topsoil (0–15 cm) samples from the cropped plots were taken, by combining a composite sample of six transect insertions along the two diagonals. During the 2021 sampling campaign, soil samples were taken down to 50 cm depth (the depth intervals were 0–15–30–50 cm), and the bare plots were also sampled. The initial aim was to sample even deeper, but due to the soil being too hard and crumbly (Embu) or too shallow (Aludeka), it turned out to be unfeasible to sample from deeper layers. To minimize plot disturbance, especially below plowing depth, the 2021 samples were collected by only one soil core from the center of each plot, using a gauge auger of 60 mm diameter and 500 mm length at Embu (Eikelkamp Soil & Water, Giesbeek, the Netherlands) and a soil corer of 55 mm diameter and 1000 mm length (Giddings Machine Company, Windsor, USA) at the other sites. The reason we had to use a different and partially open soil auger in Embu was that the other auger type repeatedly broke due to the very hard subsoil. Sampling full cores allowed for bulk density (BD) measurements. On the same day of sampling, all soil samples were sieved through an 8 mm sieve and then air-dried for storage until further analysis in the laboratory. For further analysis, a sub-sample was broken and crushed by pestle and mortar and sieved through a 2 mm sieve. Stone contents of both sieving steps were recorded. The soil moisture content of air-dried samples was based on drying a sub-sample at 105 ∘C for 24 h and subsequently calculating the dry soil weight per known core volume. Bulk density was determined based on the calculated absolute dry weight of stone-free samples and the stone-corrected volume of soil cores, assuming a density of stones of 2.65 g cm−3. At all sites but Aludeka (with 1 %, 5 % and 12 % of stones in 0–15, 15–30 and 30–50 cm depth, respectively), stone content was very low (below 1 % on average). Prior to C and N analysis, samples were finely ground with a ball mill, then soil C and N contents were measured by dry combustion using an elemental analyzer (CHN628; LECO Corporation, Michigan, USA). In addition, soil pH (H2O) was determined on unmilled 0–15 cm topsoil samples (2 mm, sieved) taken in 2018. Because soil pH values lower than 6.5 were observed at all sites, no correction for carbonates was necessary in the calculation of SOC contents. From additional deeper soil sampling down to 60 cm depth carried out in 2018 (data not shown here), it is known that the soil pH was lower than 6.5 in all depths considered.
2.3 Calculation of SOC stocks based on equivalent soil mass
As the measurements conducted in 2021 consisted of both SOC and BD, the equivalent soil mass approach was used to estimate SOC stocks across normalized soil masses (Lee et al., 2009), in addition to SOC contents. For this, the approach of Wendt and Hauser (2013) was followed, by fitting a cubic spline to measured data in order to rescale to equivalent soil masses. First, the soil masses and SOC stocks were computed for each soil depth layer that was sampled. Then, cumulative SOC stocks and soil masses were calculated for combined depth layers to increasing depth (0–15, 0–30 and 0–50 cm) by summing the SOC stocks and soil masses of the depth layer with the values from all above layers. Next, a cubic spline with no intercept was fitted to each individual sampled soil core with cumulative SOC stocks as dependent and cumulative soil masses and the squared value thereof as independent variables. From visual inspection of this fit and R2 values of 0.99, it was concluded that the fitted cubic splines could be used to compute SOC stocks for normalized cumulative soil masses for each sampled soil core. We chose normalized cumulative soil masses of 0–2500 and 2500–7500 t of soil per hectare, which across the sites roughly corresponded to the mean soil masses in the depths of 0–15 and 15–50 cm, respectively. Changes in SOC stocks based on equivalent soil masses are the most reliable way to assess carbon gains or losses but were only available for 2021. Therefore, we tested by correlation analysis whether the 2021 SOC stocks for the top 2500 t ha−1 equivalent soil mass were in alignment with the observed temporal trends of the SOC content in the 0–15 cm soil layer, i.e., whether soils with the highest losses in SOC content had the lowest SOC stocks in 2021.
2.4 Statistical analysis
2.4.1 Creation of statistical models
Statistical analyses of SOC and soil total N contents in 0 to 15 cm depth and their temporal trends were performed using mixed linear models. Random slopes and intercepts of the temporal effect were initially included in a nested structure down to the split-plot level. Because of an almost perfect correlation between changes in SOC and soil total N contents (r>0.95; p<0.001), the focus of this paper was on SOC contents. Two different statistical models were developed. One model focused on site-specific effects (fixed-site model) and another model focused on the general trend of SOC contents across sites in which site was a random effect (random-site model). For the random-site model, the SOC data were normalized to the percentage of initial SOC; i.e., data points from each site were divided by the mean SOC content of each experimental replicate (block) at the start of the experiment (as initial measurements were not available for all plots). The initial fixed effects in the random-site model were (1) time since the experiment had started, (2) the interaction of time since the experiment had started with the organic resource treatment, (3) the interaction of time since the experiment had started with the mineral N treatment and (4) the 3-way interaction of time since the experiment had started with organic resource and mineral N treatments. In the fixed-site model, the fixed effects were (1) the interaction of site with time since the experiment had started, (2) the 3-way interaction of site with time since the experiment had started and with the organic resource treatment, (3) the 3-way interaction of site with time since the experiment had started and with the mineral N treatment, and (4) the 4-way interaction of site with time since the experiment had started, the organic resource treatment and the mineral N treatment. Moreover, the fixed-site model had a fixed site effect without interactions. This assured that different treatments at the same site would start at the same SOC content at the start of the experiment in the fixed-site model. Because the random-site model only had one common intercept, all treatments and sites in that model would start at initially 100 % of SOC. In both statistical models, random effects were systematically eliminated one by one until the best random effects structure with the lowest Akaike information criterion (AIC) was found. This resulted in the removal of the random slope in the models, but a random intercept was kept. The nested random intercepts were dataset/blockInSite/Plot and dataset/Site/blockInSite/Plot, for the models without and with site as random effect, respectively. The random effect of “dataset” accounted for potential systematic effects of the soil sampling in different years. Additionally, visual inspection of model residuals revealed variance heterogeneity between sites. Consequently, a site-dependent residual variance was allowed in the models. After selecting an appropriate random effects structure and visually checking for normality and homoscedasticity, interactions of fixed effects were removed one by one until only significant fixed effects remained, starting at the highest order of interaction. Selection of random effects was done using restricted maximum likelihood, that of fixed effects with maximum likelihood and the final model was then fit again with restricted maximum likelihood (Zuur et al., 2009). Additionally, an alternative version of the site-specific model, using relative SOC data (percent of initial SOC) as the dependent variable, was created to compare SOC changes within the same organic resource treatments across sites.
All statistical analyses of the SOC stock data from 2021, based on equivalent soil mass, and pH data from 2018 were done in a similar way as the analyses of SOC content. Fixed effects were the organic resource and mineral N treatments, the site and the cropping status (cropped vs. bare; in the case of SOC stock data only), and interactions of all were allowed. Models contained a random nested blockInSite/Plot effect and allowed for variance heterogeneity between sites, while no random effect for “dataset” and no interaction with time was needed, given the single time point.
2.4.2 Estimation of carbon storage efficiency
From the temporal trends of SOC content, we further derived an estimate of the apparent carbon storage efficiency (CSEa) of the different organic resources in the 0–15 cm soil layer, i.e., a measure of efficiency to retain C. The CSEa has been defined as the fraction of C inputs contributing to C storage in the soil (Manzoni et al., 2018), e.g., in our case how much the annually added C through organic resources changed the trend of SOC stocks compared to the control treatment. To do so, first the least square means of the change in annual SOC content obtained by site and treatment from the fixed-site model had to be transformed to mean annual change in SOC stocks. The mean BD of each site estimated from topsoil measurements was used for this (treatment-specific differences in BD were absent). These BD estimations were also derived using a mixed linear model, from the available BD measurements which had been conducted in the first and second experimental year and in the calendar year 2021 at each of the sites. This model did not contain any temporal trend; different methods of BD measurements in initial years and in 2021 were used (core method vs. direct measurement from the soil augers), so any trend would have likely been an artifact. While assuming this constant BD for SOC stock calculations is only a rough approximation and not fully consistent with the equivalent soil mass approach, we nonetheless considered that it was a valuable approach to quantify CSEa. Another potential limitation of these calculations considering only the 0–15 cm soil layer (soil layer in which organic resources were incorporated), is that CSEa may be underestimated if significant portions of carbon inputs are stabilized in deeper soil layers from, e.g., leached dissolved organic carbon.
In the final step of CSEa estimations, a linear regression was fit, with the calculated mean annual change in SOC stocks for 0–15 cm as the response variable and the amount of annual C input as the independent variable (i.e., 0, 1.2 and 4 t C ha−1 yr−1). These regressions were site- and organic-resource-specific, so that estimates of CSEa per site and organic resources could be compared:
Here, dSOC is the mean annual change in SOC stocks in 0–15 cm (t C ha−1 yr−1), site is the site-specific intercept, Cin the amount of annual C input (t C ha−1 yr−1) and OR the type of organic resources. Note that “:” represents interactions and that there was no OR-specific intercept. The intercept was set to site specific, i.e., not allowed to vary between different organic resources at the same site (i.e., the SOC change at 0 t C ha−1 yr−1 did not vary between treatments). The slope of this regression on the numerical variable Cin represented the yearly change in SOC stocks (in 0–15 cm) per t C ha−1 yr−1 of organic resources added. It was thus interpreted as an estimate for CSEa of the different organic resources at the different sites (Manzoni et al., 2018), and we tested whether significant differences existed between slopes for different organic resources and at different sites (i.e., testing for a significant effect of organic resource treatment, site and their interaction). Estimated least square means of the slope were converted into percent from t C t C−1 by multiplying them by 100.
2.4.3 Statistical software and definitions
The R software version 4.0.4 (R Core Team, 2021) with the “nlme” package (Pinheiro et al., 2021) was used for all statistical analyses. The post hoc pairwise comparison of different treatments at different times was done with the “cld” function (Piepho, 2004) of package “emmeans” (Lenth, 2021) using the “containment” method to estimate degrees of freedom. Estimated least square means were computed for SOC at different time points, for the temporal trends of SOC contents and for SOC stocks from 2021 and pH data at the time of measurement. Note that in the following text, the term significant refers to the p<0.05 threshold, if not specified otherwise.
2.5 First-order decay model for comparison of SOC loss with other experiments
Finally, we compared the losses of SOC in the control treatments to losses reported in other experiments. A simple modeling approach was used assuming a yearly first-order kinetic SOC loss:
Here, SOCloss and SOCinitial correspond to the initial SOC contents and the SOC loss at the end of the experimental period (g kg−1); k is the annual loss of SOC under a base temperature of 10 ∘C (g g−1 SOC); and t is a site-specific rate modifier, based on site mean annual temperature (MAT) and a Q10 of 2:
The annual turnover of SOC (k) was manually calibrated, and the Nash–Sutcliffe modeling efficiency was calculated for assessing the goodness of model fit, as follows:
Here, EF is Nash–Sutcliffe modeling efficiency, Oz is the measured SOC loss of the zth site at the experiment end, is the mean loss of SOC in all experiments and Pz is the simulated value corresponding to Oz.
3.1 General trends of SOC contents across sites
The analysis of relative SOC change across all sites showed that even at high amounts of added organic resources, a decrease of topsoil SOC content occurred over time with continuous maize cropping (Figs. 1 and 2). Significant differences in the magnitude of annual SOC decrease existed between the different organic resource classes applied at the high rate of 4 t C ha−1 yr−1 and to a lesser extent at the lower rate of 1.2 t C ha−1 yr−1. In contrast, the application of mineral N did not have a significant effect on the annual decrease of SOC content (Fig. 2), so +N and −N were evaluated together. Across the four sites, SOC content decreased strongest under the CT treatment, on average by 2.1 % of initial SOC per year, corresponding to 40 % loss over 19 years. Average SOC decreases in all the 4 t C ha−1 yr−1 treatments, except SD, and were significantly lower than in the control but did not completely halt SOC losses. The FYM and TD treatments resulted in the lowest decrease of SOC content, i.e., 0.6 % and 1.2 % of initial SOC per year, respectively (12 % and 23 % over 19 years). Notably, the FYM treatment at 4 t C ha−1 yr−1 resulted in a significantly lower SOC decrease than all other treatments, followed by TD at 4 t C ha−1 yr−1, which was significantly lower than all but the CC treatment at 4 t C ha−1 yr−1. The application rates of 1.2 t C ha−1 yr−1 were much less effective in reducing SOC decrease; only FYM and CC were significantly different from the control, with average decreases of 1.4 % and 1.7 % of initial SOC per year, respectively.
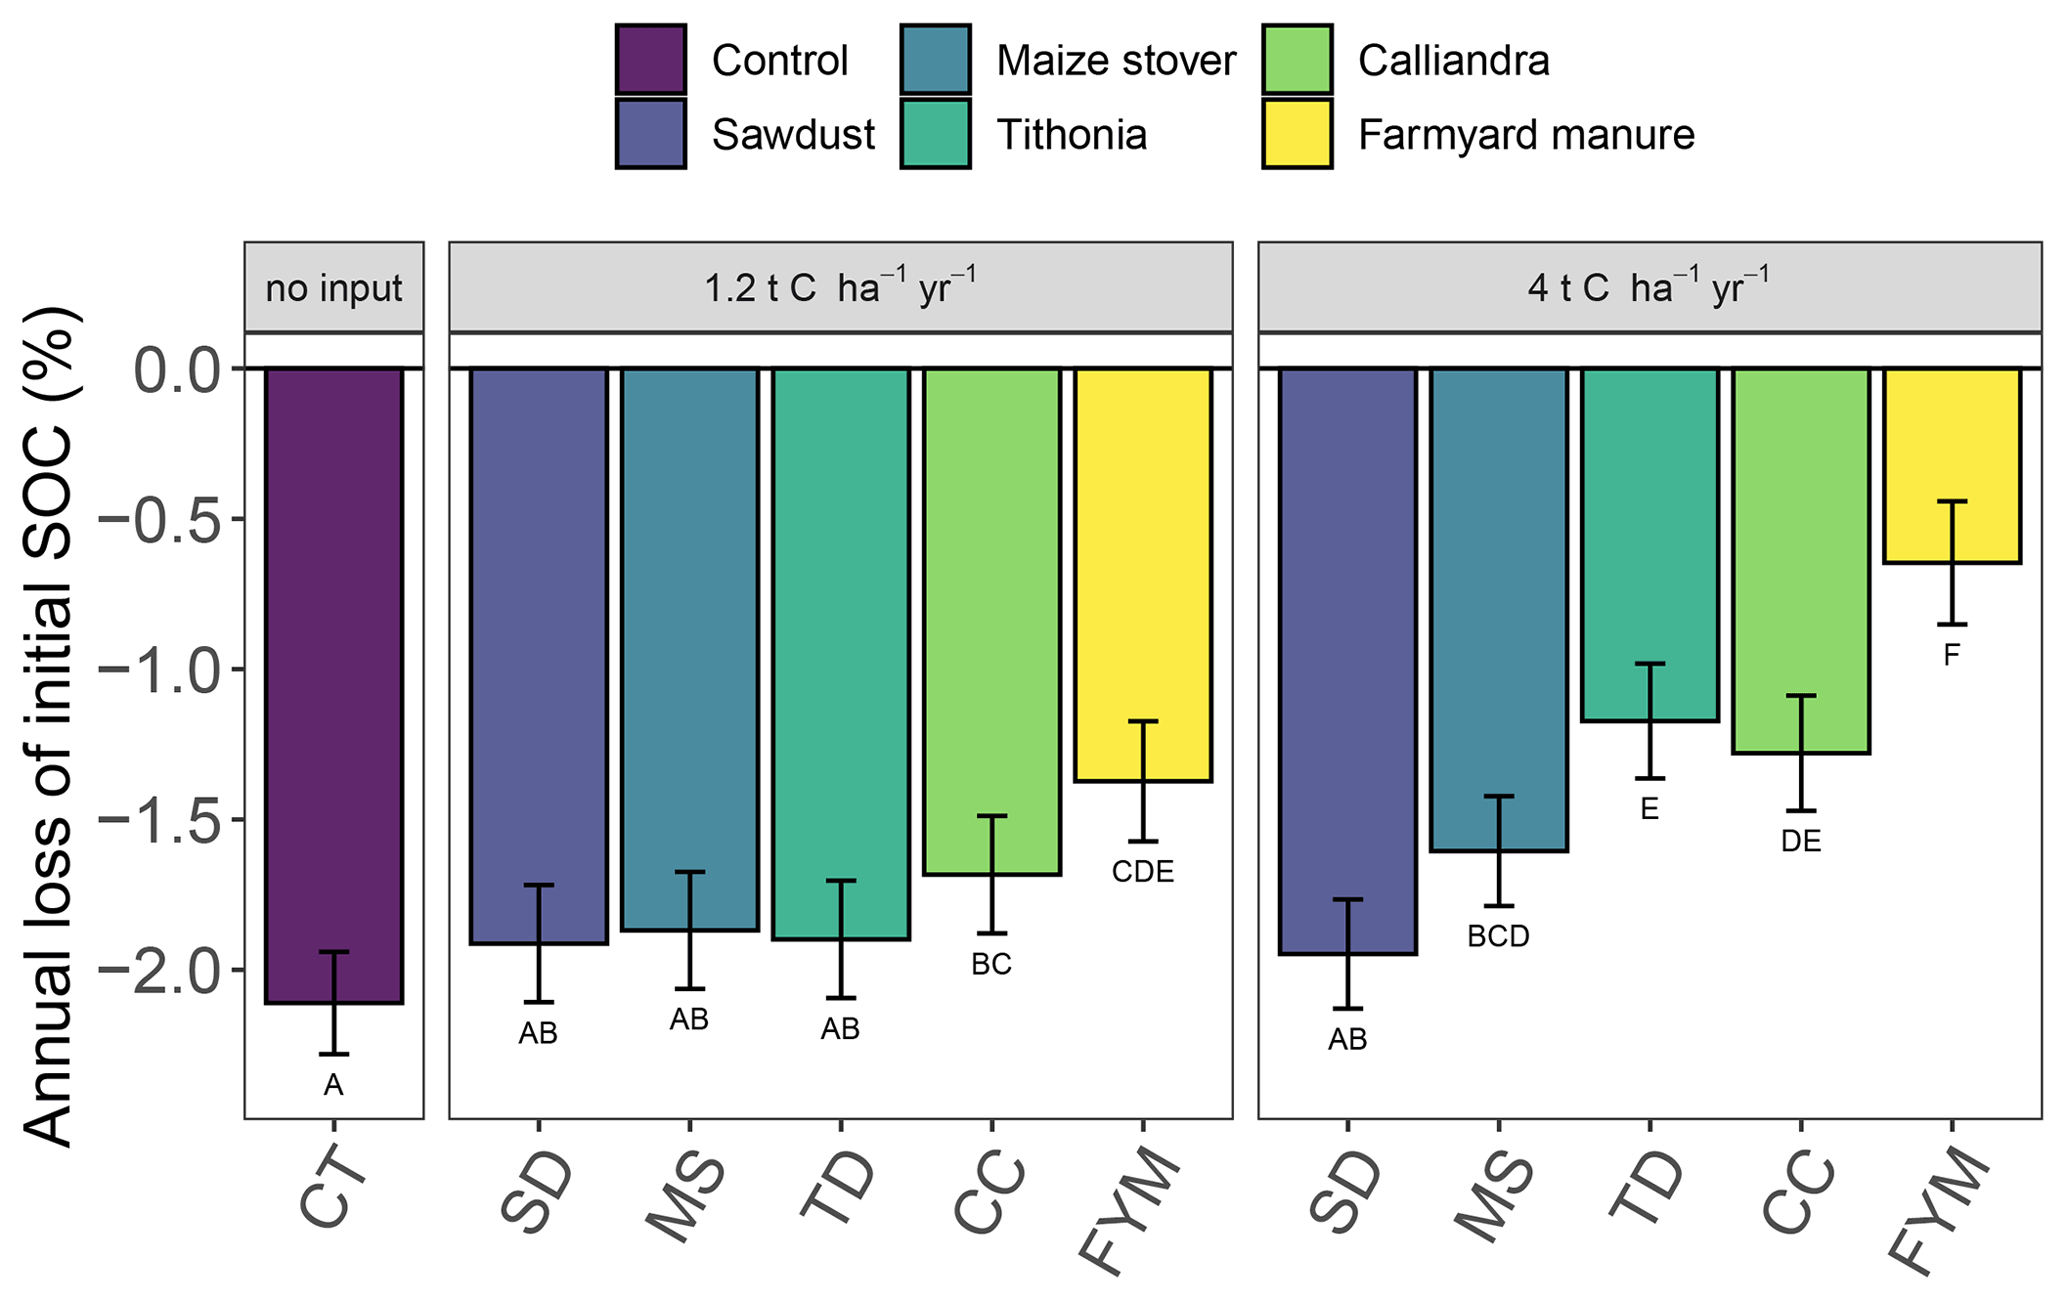
Figure 1Annual changes of SOC contents in the top 0–15 cm soil layer in different organic resource treatments across sites. The annual change in SOC contents represent the slope of the regression against experimental time from the random-site model, using all available data (i.e., 5 (Sidada and Aludeka) or 14 (Embu and Machanga) repeated measurements from three replicates at four sites, comprising both mineral N treatments due to the absence of mineral N effect). They are displayed as percentage of initial SOC (intercept of the model set to 100 %). Treatments with the same capital letter do not differ significantly from each other in the annual change of SOC (p<0.05). The error bars indicate the 95 % confidence intervals for the annual change of SOC. Abbreviations: CT, control; SD, sawdust; MS, maize stover; TD, Tithonia; CC, Calliandra; FYM, farmyard manure.
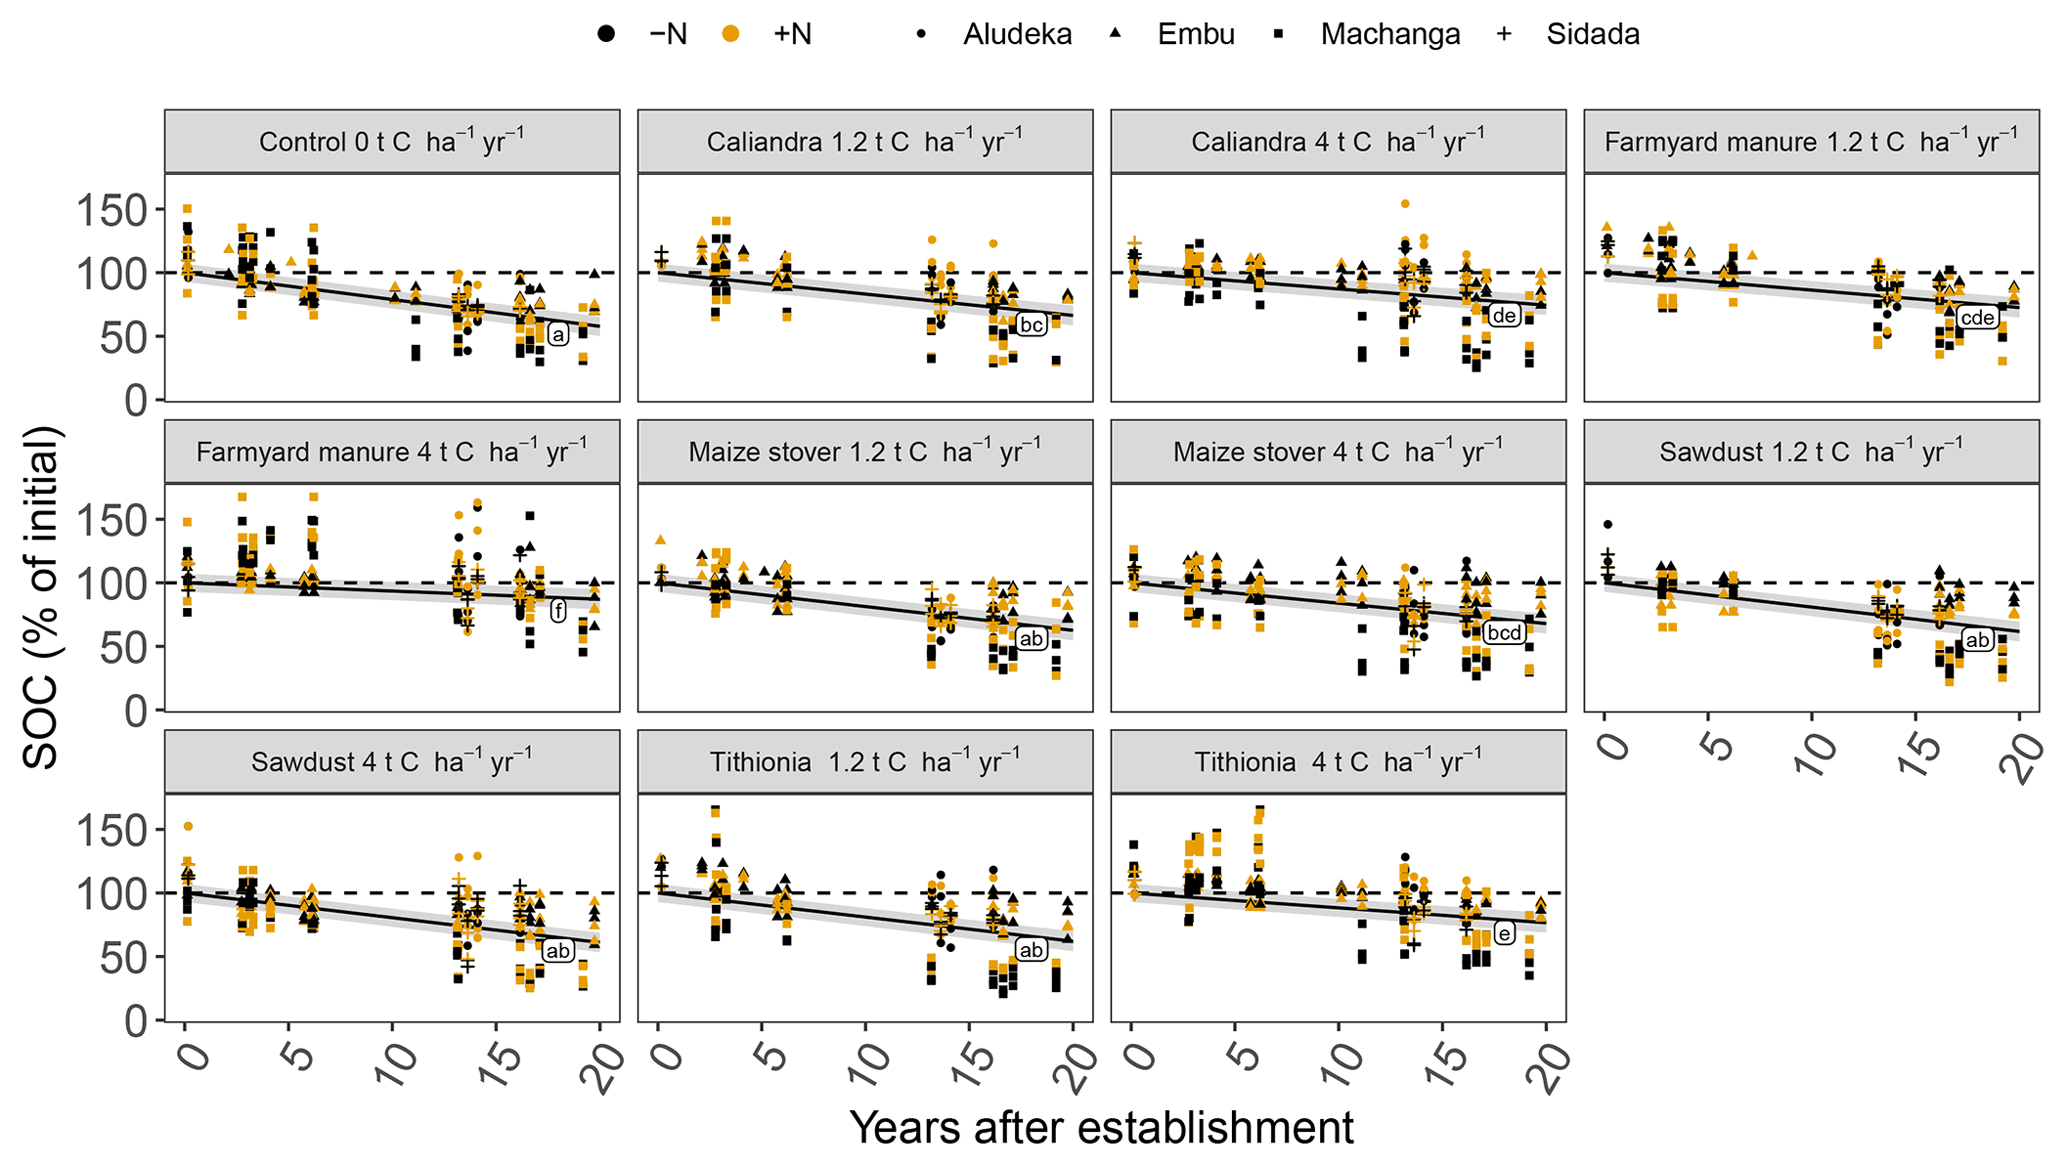
Figure 2General trend of SOC contents in the top 15 cm soil layer under different organic resource treatments across sites. The change in SOC contents is shown as a percentage of initial SOC contents (mean by site). Same lowercase letters indicate the absence of a significant difference between the different organic resource treatments, while the mineral N additions did not have a significant effect (p<0.05). Large initial fluctuations and values above 100 % at the Machanga site are a combined result of measurement variability and low SOC contents. The gray shaded areas indicate the 95 % confidence intervals for true mean of SOC at different times.
3.2 Site-specific differences of the effects of organic resource quality on SOC formation
The analysis of SOC content at the site level revealed strong site specificity of temporal changes in relation to the different organic resource treatments (Fig. 3). For example, at Aludeka, the FYM treatment at 4 t C ha−1 yr−1 showed a significant gain in SOC of 0.1 g C kg−1 yr−1, while at Embu, all treatments lost at least 0.4 g C kg−1 yr−1 (Fig. 4). The order of treatments, however, was similar at all sites. The control treatment resulted in the largest decrease in SOC content, while the application of FYM at the rate of 4 t C ha−1 yr−1 led to the smallest decrease or even increase in SOC content. The SD treatment generally showed similar decreases in SOC content as the control treatment, and CC and TD led to SOC change rates in between the control and FYM treatments. The application of organic resources at the rate of 1.2 t C ha−1 yr−1 did, with a few exceptions (e.g., FYM at Embu and Sidada), not significantly reduce the decrease in SOC content compared to the control. Notably, the absolute annual SOC content decrease in the control treatment was largest at Embu (about 0.6–0.7 g C kg−1 yr−1), followed by Sidada (about 0.5 g C kg−1 yr−1), and was about 0.2 g C kg−1 yr−1 at Machanga and Aludeka. In relative terms, annual decreases were about 2 % to 3 % of initial SOC in the control (Fig. 4). The highest relative SOC decrease was observed at Machanga in the CT−N treatment, which lost almost 3 % of initial SOC per year. Within the control treatments across sites, significantly lower decreases than CT−N at Machanga were found in CT+N at Aludeka, CT−N at Embu and in both control treatments at Sidada, all losing about 2 % yr−1.
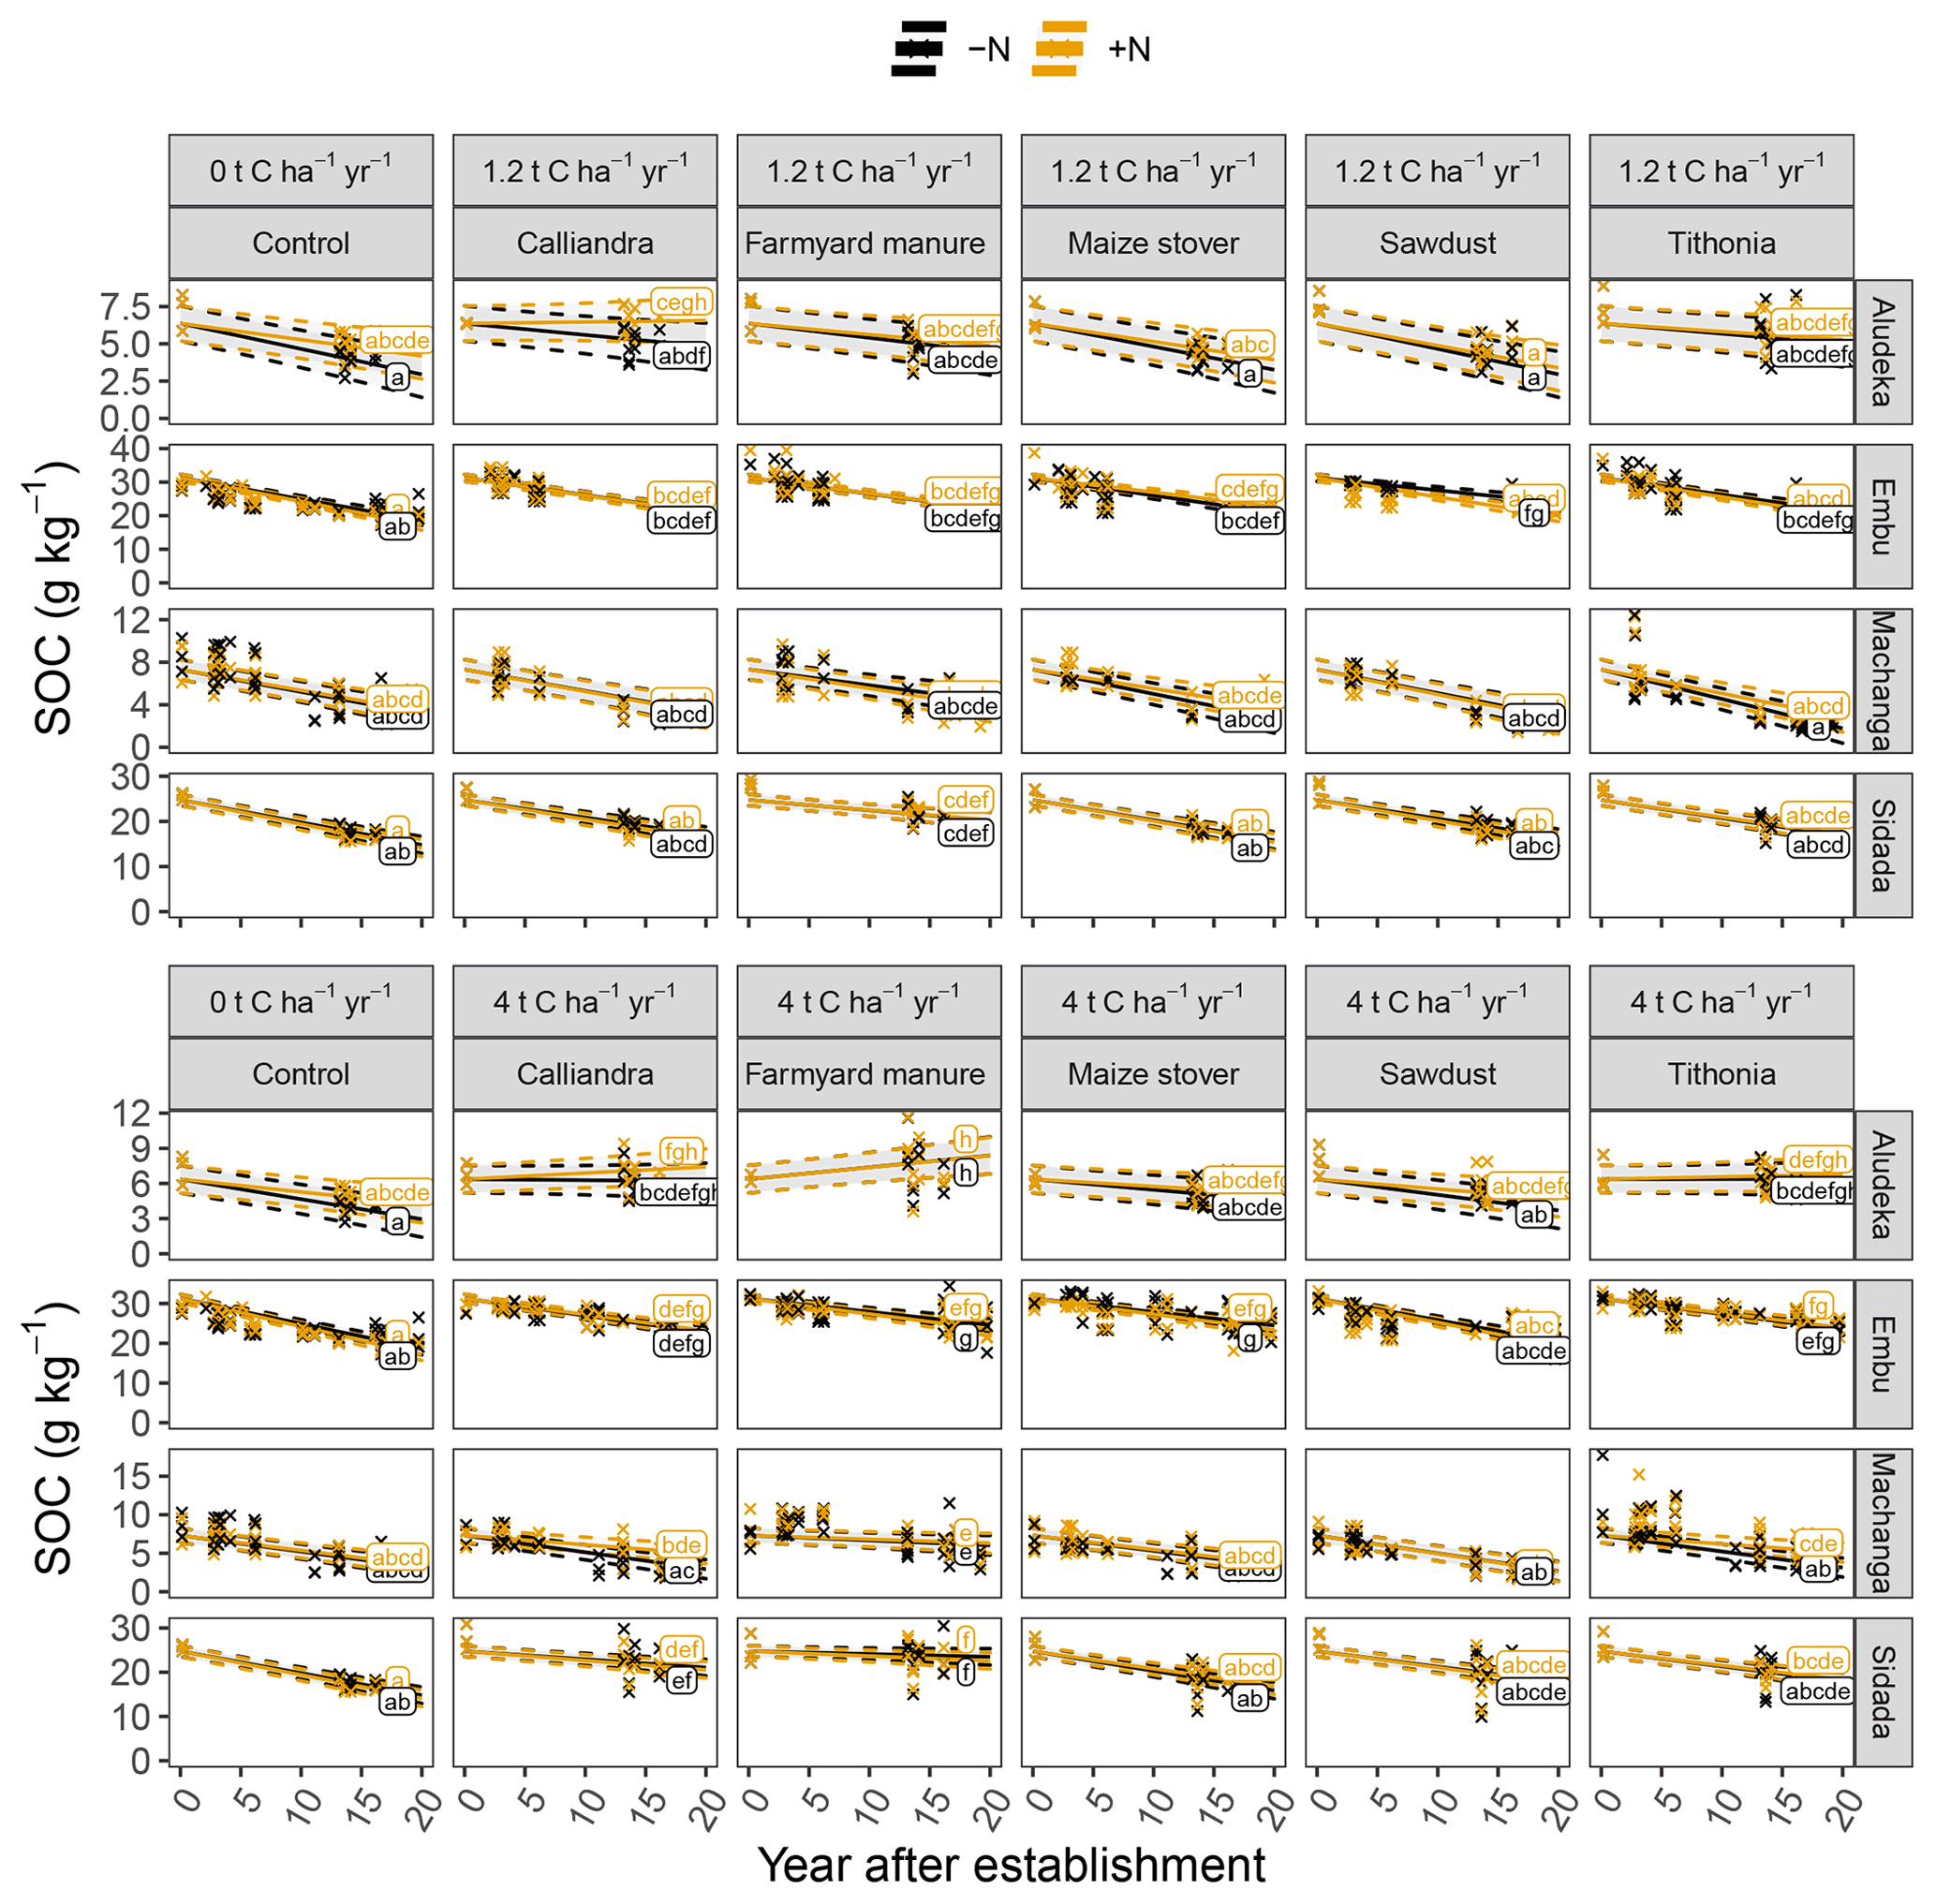
Figure 3Temporal trends of SOC contents in the top 15 cm soil layer by site, organic resource and N treatment, displayed in combination with measured raw data, shown by the crosses. Same lowercase letters indicate the absence of significantly different temporal trends between treatments (p<0.05). The gray shaded areas indicate the 95 % confidence intervals for the true mean of SOC at different times.
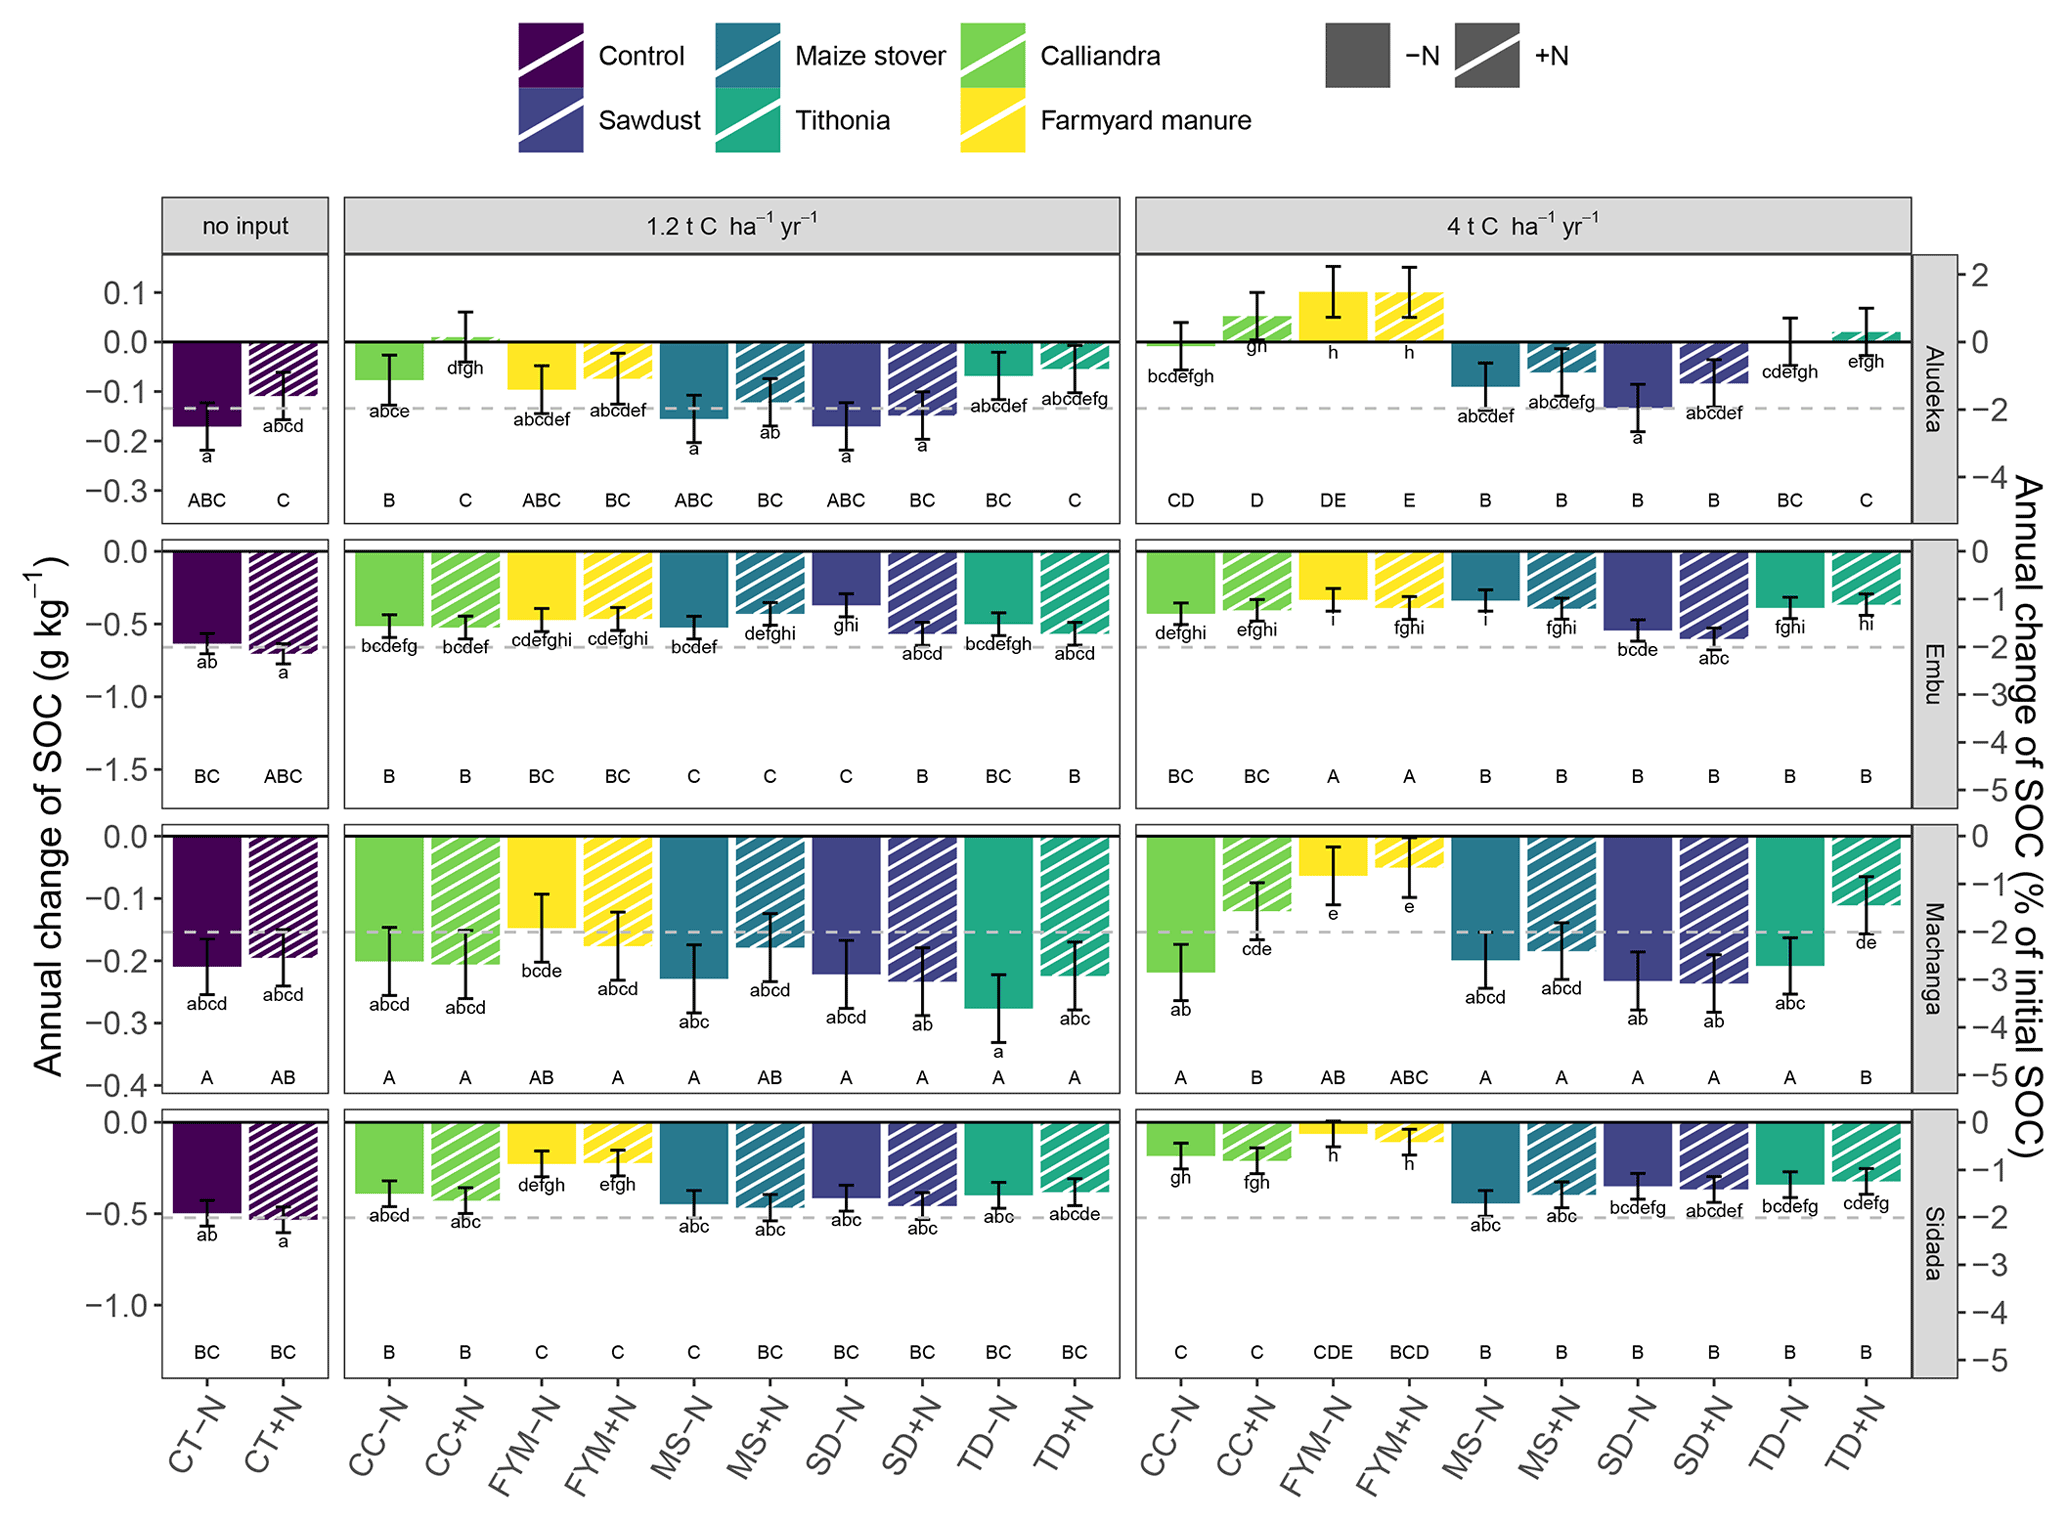
Figure 4Temporal trend of SOC contents in the top 15 cm soil layer by site, organic resource and N treatment in both absolute and relative values. Filled bars represent the −N treatments and dashed bars the +N treatment. Statistics across sites were done based on the relative SOC changes (p<0.05). Same lowercase letters indicate the absence of a significant difference in the temporal trend between treatments at the same site. Same uppercase letters indicate the absence of a significant difference within the same organic resource treatment across sites (resource type and amount, including the comparison between +N and −N of the same treatment). As a reference to the general trends, the gray dashed line indicates the mean annual decrease of 2.1 % yr−1, observed in the control treatment across sites. Error bars indicate the 95 % confidence intervals. Abbreviations: CT, control; SD, sawdust; MS, maize stover; TD, Tithonia; CC, Calliandra; FYM, farmyard manure.
In contrast to the control, the FYM treatment at 4 t C ha−1 yr−1 lost only about 0.4 g C kg−1 yr−1 (corresponding to 1 % of initial SOC) at Embu and about 0.1 g C kg−1 yr−1 at both Machanga (1 % of initial SOC) and Sidada (0.3 % of initial SOC), while at Aludeka it gained about 0.1 g C kg−1 yr−1 (1.5 % of initial SOC). In terms of relative SOC changes, differences between sites within the same organic resource treatment were observed more frequently than in the control. For example, the SOC gains in the FYM treatments at 4 t C ha−1 yr−1 at Aludeka differed significantly from the losses observed within the same treatments at Embu and Machanga. Also, the other 4 t C ha−1 yr−1 treatments showed generally significantly lower relative SOC decreases at Aludeka than at Machanga. Additionally, the +N treatments of CC and TD showed significantly lower relative SOC decreases at Aludeka than at Embu and Sidada (Fig. 4).
In the site-specific analysis, the addition of mineral N showed a significant interaction with the organic resource treatment, but, with a few exceptions, significant differences between +N and −N treatments were absent. Specifically, the CC treatment at 1.2 t C ha−1 yr−1 at Aludeka showed no significant SOC decrease in the +N treatment while the corresponding −N treatment lost about 0.1 g C kg−1 yr−1. Similarly, the +N treatments with 4 t C ha−1 yr−1 addition of either CC or TD at Machanga showed a significantly lower decrease in SOC content than their −N counterparts. Finally, the SD treatment at 1.2 t C ha−1 yr−1 at Embu had a significantly lower decrease in SOC content in the −N treatment compared to the +N treatment, but for all other organic resource treatments at all sites, the +N and −N subplots were not significantly different from each other.
3.3 SOC stocks at different equivalent soil masses and the correlation with SOC contents
A highly significant correlation emerged between losses in SOC content (0–15 cm) and the observed SOC stocks in 2021, explaining 81 % of total variation at the clayey sites, Embu and Sidada, and about 56 % at the two coarse-textured sites, Machanga and Aludeka (Fig. A2). Due to the one sampling point in time, less significant differences in SOC stocks were detected between treatments than in trends of SOC contents. Yet, SOC stocks in the 2500–7500 t ha−1 soil layer showed no significant differences between treatments at any of the sites, except at Aludeka, where the TD treatments at both rates of C input had higher SOC stocks than the FYM treatment at 1.2 t C ha−1 yr−1. Besides, in contrast to the topsoil SOC stocks, the subsoil SOC stocks were much less related to topsoil trends of SOC content. A significant association between the temporal trends of topsoil SOC contents and subsoil SOC stocks was only found at two sites, i.e., at Machanga (R2 of 0.24) and Sidada (R2 of 0.45), but much weaker increases of SOC stocks were found in the subsoil than in the topsoil (Fig. A2). SOC stocks were also assessed in the bare plots (without maize planted), but there was no significant interaction between the plot status (being bare or planted) and the experimental treatments. Yet, the plot status had a site-specific effect on SOC stocks. At Aludeka and Sidada, significantly higher SOC stocks were observed in the planted compared to the bare plots in both the top- and subsoil equivalent soil mass layers, while no effect was found at Machanga. Surprisingly, at Embu, the bare plots showed significantly higher SOC stocks than the planted plots in both soil layers (Fig. 5).
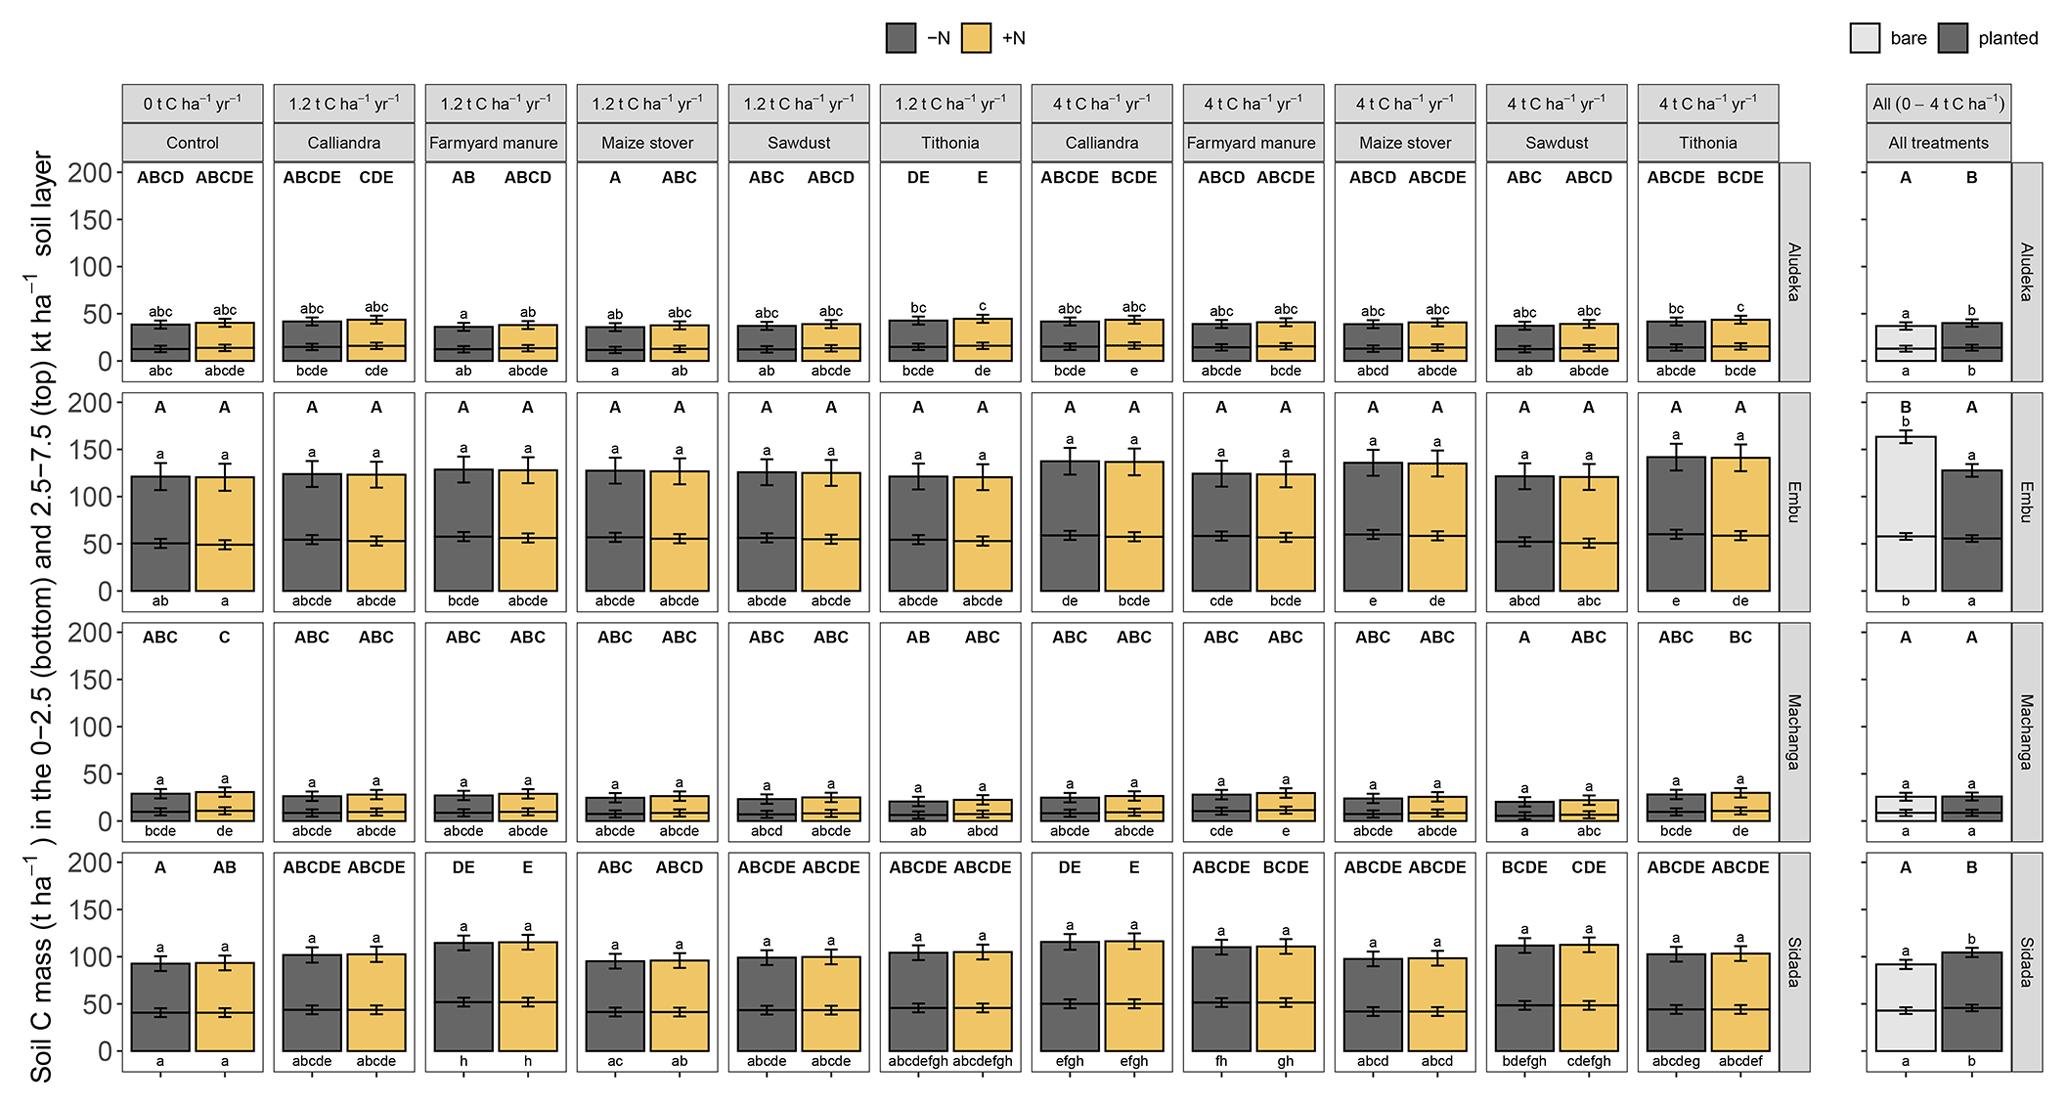
Figure 5Estimated least square means for the SOC stocks across sites in the cumulative equivalent soil masses of 0 to 2500 and 2500 to 7500 t soil ha−1 (bottom and top bar, respectively). As there was no significant interaction between the cropping status (being bare or planted) and the organic resource and N treatments, the results are displayed as the estimated least square means for different organic resource and N treatments for planted plots (left plot) and as mean SOC stocks from all organic resource and N treatments in the bare compared to planted plots (right plot). Error bars display the 95 % confidence intervals. Same lowercase letters indicate the absence of a significant difference in SOC stocks between treatments at the same site and soil mass layer (above bars, 2500 to 7500 t ha−1; below bars, 0 to 2500 t ha−1; all p<0.05). Same uppercase letters indicate the absence of a significant difference between treatments for the whole 0 to 7500 t ha−1 equivalent soil mass layer at the same site (p<0.05).
3.4 Apparent carbon storage efficiency and losses as affected by site and organic resource type
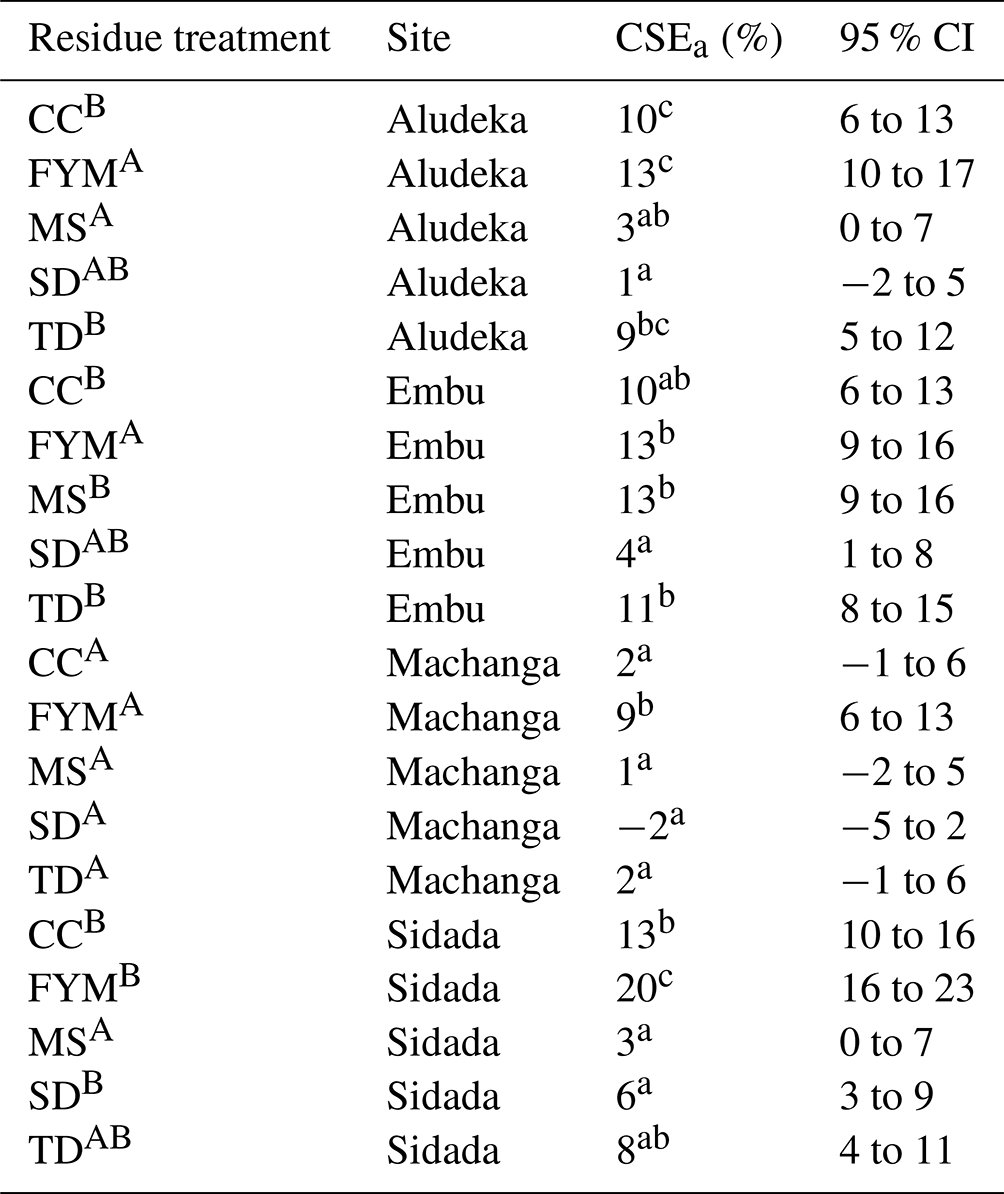
The efficiency with which organic resources were converted into SOC varied by site and treatment (Table 3). The treatments with the highest and lowest decrease in SOC content (FYM and SD) corresponded to the treatments with the lowest and highest CSEa, respectively. The highest CSEa for FYM was found at Sidada (20 %), while it was about 13 % at Aludeka and Embu and 9 % at Machanga. On the other hand, the lowest CSEa for SD (−2 %) was observed at Machanga, while it was between 1 % and 6 % at the other sites. Besides, the differentiation of FYM in terms of CSEa from other treatments varied among sites. At Sidada, the CSEa for FYM was significantly higher than for the other treatments, except for CC; at Embu, it was only significantly higher than for SD; and at Machanga and Aludeka, FYM had a significantly higher CSEa than MS and SD. On the other hand, the SD treatment was outperformed in terms of CSEa by the CC treatment at Aludeka and Sidada and by the TD treatment at Aludeka and Embu. The MS treatment was in the group of lowest CSEa at all sites (1 %–3 %), except at Embu, where, surprisingly, it had a CSEa of 13 %, which was not significantly different from that for FYM. The CSEa within the same organic resource types further varied between sites, as indicated by a significant interaction of organic resource treatment with site. For example, FYM had a significantly higher CSEa at Sidada than at all other sites, while the CSEa for CC and TD was significantly lower at Machanga than at the other three sites.
Table 3Estimated apparent carbon storage efficiency (CSEa) by treatment and site. Same lowercase letters at the same site indicate the absence of a significant difference between treatments at that site. Same uppercase letters of the same organic resource indicate the absence of a significant difference between sites within the same organic resource (p<0.05).
In contrast, when assessing SOC losses of the CT treatments compared to control treatments of other long-term experiments using the simple first-order decay modeling approach, we found that the decrease in SOC content in the control was rather uniform across sites. That is, when adjusting the turnover rate by mean annual temperature, a fairly consistent trend of SOC loss across studies was found (Fig. 6), corresponding to a yearly SOC loss of about 1.5 % at 10 ∘C mean annual temperature.
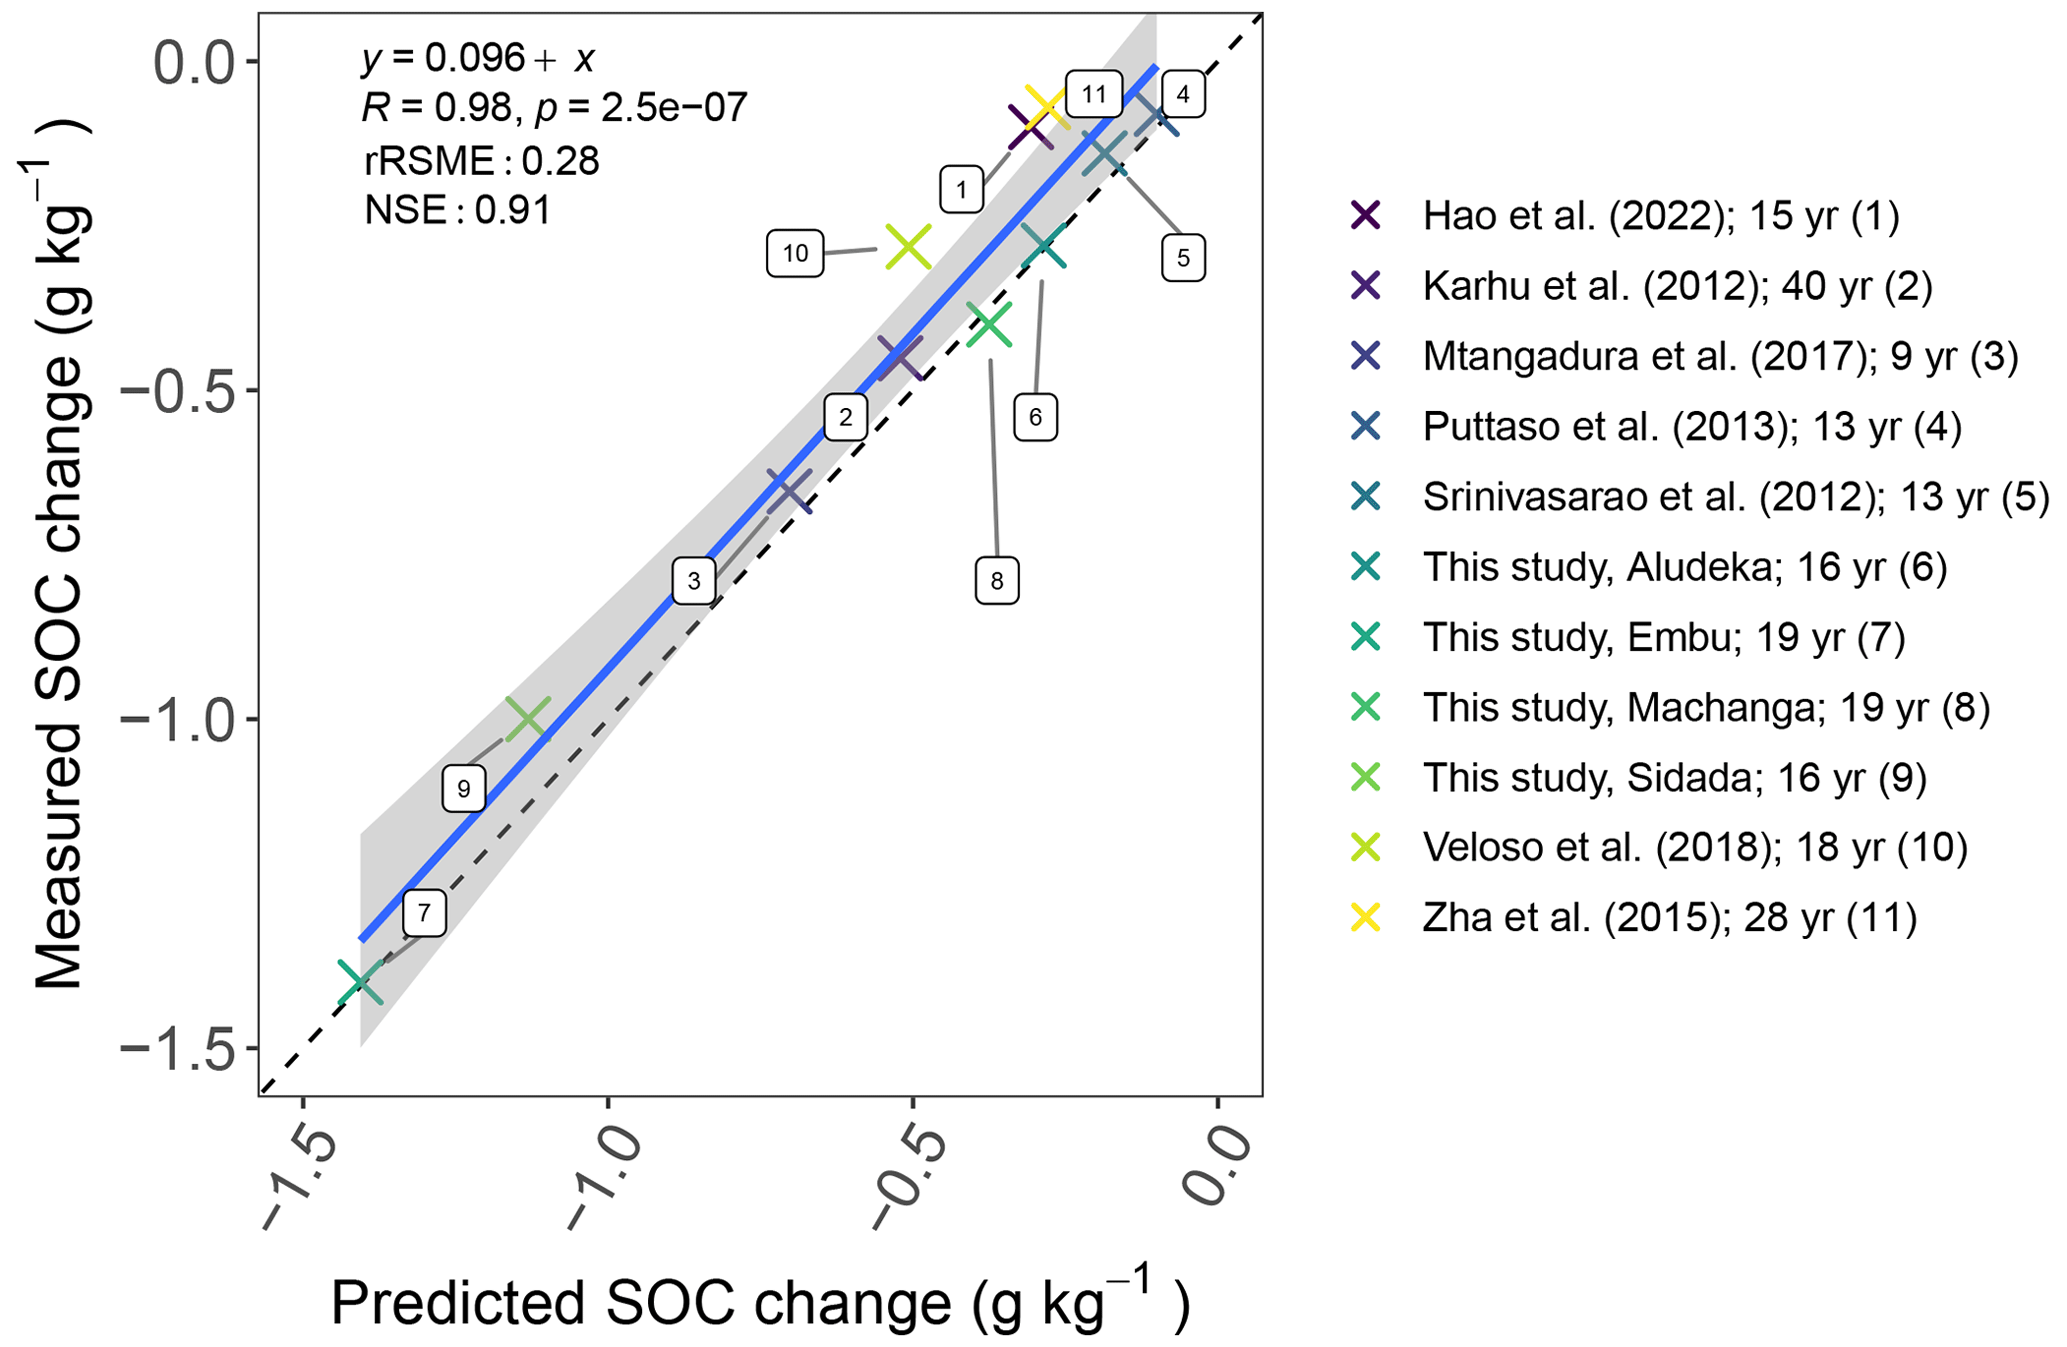
Figure 6Comparison of predicted vs. measured SOC change at the end of different experiments without input of external organic matter and mineral fertilizers assuming a 1.5 % yr−1 first-order decomposition at 10 ∘C mean annual temperature. The decomposition rate was scaled with an exponential temperature function with a Q10 of 2 using the mean annual temperature of each site. The legend shows the different experiments (Srinivasarao et al., 2012; Karhu et al., 2012; Puttaso et al., 2013; Zha et al., 2015; Mtangadura et al., 2017; Veloso et al., 2018; Hao et al., 2022) and their duration in years (yr). Abbreviations: rRSME, relative root mean square error; NSE, Nash–Sutcliffe model efficiency.
4.1 High-quality organic resource addition does not consistently halt SOC loss
The results of our study clearly showed that even at high rates of organic resource addition (4 t C ha−1 yr−1), SOC generally decreased (i.e., of the four sites in this study, only Aludeka showed increased SOC; Fig. 4). This was indicated by the changes in SOC contents in the 0–15 cm topsoil layer and corroborated by their strong correlation with the 2021 topsoil equivalent soil mass-based SOC stocks. Hence, very high amounts of farmyard manure are needed to prevent a loss of SOC contents, with even 4 t C ha−1 yr−1 not being sufficient at Machanga and Embu. The high losses at Machanga, i.e., a relative loss of almost 3 % of initial SOC contents per year, are likely not only caused by SOC mineralization but also by erosion. Despite the gentle slope of the experimental site, Machanga showed strong signs of topsoil erosion, but this was unfortunately not quantified. At Embu, the high initial SOC contents may be responsible for the fact that even the high loads of 4 t C ha−1 yr−1 of farmyard manure could not form enough new SOC to counterbalance the losses. Yet, even at Sidada, considered as having favorable soil conditions for SOC formation, SOC was lost in almost all treatments and none showed a significant gain. In conclusion, our first hypothesis that the addition of high-quality organic resources increases SOC is rejected for all sites except for Aludeka where farmyard manure (but not high-quality Tithonia and Calliandra) could increase SOC.
The generally observed SOC losses in our study corroborate the results of recent studies under similar conditions (Sommer et al., 2018; Cardinael et al., 2022). It seems thus that maintaining SOC in arable cropping systems in the tropics is challenging, even with high C inputs that are aimed at replenishing SOC. Potential explanations for the high SOC losses in tropical soils are manifold. They have been attributed to the humid climate (Ryan and Law, 2005; Todd-Brown et al., 2013), the high weathering status of the soils and thus limited protection of SOC (Six et al., 2002; Doetterl et al., 2015), and the high temperatures (Davidson and Janssens, 2006; Conant et al., 2011; Wei et al., 2014). Besides, if heavy-rainfall events occur, erosion can be considerable and wash away the SOC-rich topsoil, as was the case in Machanga. Furthermore, loss of SOC usually occurs when natural vegetation is converted to arable land (Sanderman et al., 2017) and about 50 % of initial C is usually lost (Guo and Gifford, 2002; Lal, 2018), suggesting a better stabilization of SOC under natural vegetation. In the tropics, SOC loss upon clearing of natural vegetation is usually larger and can be as high as 70 %–85 %, usually strongest in the initial few years following the land clearing (Solomon et al., 2007). Three sites of this study had been under shifting cultivation with considerable fallow time prior to the establishment of the experiment, while Machanga was even converted from natural vegetation. This suggests that soils were still in the initial rapid phase of SOC loss, as observed most strongly in the absolute decreases of SOC contents at Embu and Sidada, the sites with the highest initial SOC contents. On the other hand, it may be possible to increase SOC with inputs of external organic resources on degraded lands with initially low SOC (Sommer et al., 2018). Our results at Machanga indicate, however, that low initial SOC is not the only determinant for successful SOC increase and that suitable pedoclimatic conditions, as in Aludeka, are also required.
4.2 Organic resource quality has a strong effect on SOC buildup and loss
Like in several other studies (e.g., Galicia and García-Oliva, 2011; Laub et al., 2022; Li et al., 2022), our results, despite SOC losses in three of four sites, corroborate the emerging paradigm that organic resources of high quality (i.e., with a low C : N ratio) have the higher potential to form new SOC compared to low-quality organic resources. This paradigm assumes that SOC is mostly of microbial origin (Denef et al., 2009; Cotrufo et al., 2013; Kallenbach et al., 2016) and that high-quality resources are processed with a higher carbon-use efficiency than low-quality resources, such as sawdust and maize stover, that only marginally improved the SOC content over the control on our study (Manzoni et al., 2012; Sinsabaugh et al., 2013). Yet, farmyard manure, which due to high lignin contents is not necessarily considered high quality, was the most effective treatment. Similar results were reported in another long-term experiment in Thailand, where Tamarind leaves of intermediate C : N and moderate lignin contents performed better than low-C : N, low-lignin, groundnut stover (Puttaso et al., 2013). The results of these studies suggest that abiotic condensation of humic substances from lignin-rich materials (Frimmel and Christman, 1988) does not play a major role in SOC formation, contrary to what was postulated in the 1980s (Woomer and Swift, 1994). This finding is highly relevant for ISFM; earlier hypothesized trade-offs between building SOC and providing plant nutrition by organic resources (Palm et al., 2001b) are in fact not supported by the results from long-term experiments. In contrast to this earlier hypothesis, organic resources that have a good synchrony of nutrient release with plant demand, such as farmyard manure and Calliandra, are also the most effective in SOC formation and maintenance. Thus, our results show that the concept of ISFM remains highly relevant for crop productivity and soil fertility improvement.
Despite the trend of a general loss of SOC content in the topsoil layer (0–15 cm) across sites, the different rates of loss for different organic resources show the importance of their quality in SOC formation (Fig. 1). This was observed best with additions of 4 t C ha−1 yr−1, where farmyard manure was most efficient in building SOC at all sites. In contrast, the low-quality sawdust could not reduce SOC losses compared to the control without organic resource addition at any site. Our findings corroborated the results of several other studies that demonstrated that application of farmyard manure is the best option to sustain SOC (Sileshi et al., 2019; Rusinamhodzi et al., 2013; Mtangadura et al., 2017). One important consideration here is that manure quality depends on the animal species and that higher-quality feed generally results in higher-quality manures (Sileshi et al., 2017). Our study also confirmed that cut-and-carry green manures such as Calliandra and Tithonia can be effective in forming new SOC (Kunlanit et al., 2014), yet with lower efficiency than farmyard manure. On the other hand, green manures were shown to be more effective in SOC maintenance compared to low-quality maize residues and sawdust, although not consistently across sites (e.g., not at Embu).
The question is why farmyard manure, despite being similar to Calliandra in terms of C : N ratio and concentrations of aromatic compounds (Table 2), was better in avoiding SOC losses. It could be that farmyard manure, which constitutes an already decomposed form of organic matter, contains more stabilized forms of C that can directly attach to soil minerals (Angst et al., 2021). Alternatively, it is possible that the high amount of lignin in combination with high nutrient contents (i.e., the regulatory effects of N and aromatic components combined; Kunlanit et al., 2014) or the high P content (the only organic resource with a C : P ratio < 100) made it most effective in terms of SOC formation. Xiao et al. (2021) found that the increased microbial carbon-use efficiency of farmyard manure was not only due to a favorable carbon-to-nutrient ratio, but also because its application increased soil pH. Similarly, Mtangadura et al. (2017) found that farmyard manure application significantly increased soil pH and SOC. Such a positive effect of farmyard manure on soil pH was also found at all four sites of our study (Fig. A3), and it is possible that the pH increase achieved by farmyard manure addition alleviated constraints on carbon-use efficiency due to low pH (Malik et al., 2018).
4.3 No coherent SOC response to mineral N fertilizer
Contradicting our second hypothesis, low-quality sawdust or maize stover did not show lower SOC losses in the +N treatment than in the −N treatment (Fig. 4). The failure to enhance the performance of organic resources with low C : N ratios in building SOC by amending mineral nutrients from external sources indicates either that organic resource quality is determined by more than just ratios of nutrients, or that it is difficult for microbes to counterbalance the poor quality of organic amendments by taking up nutrients in a mineral form. It is furthermore surprising that no differences in SOC loss between the +N and −N treatments of the control were found at any site. In contrast with our findings, Ladha et al. (2011) found through a global analysis that SOC does on average increase when mineral fertilizer is added, although to a lesser extent than when organic resources are added. Higher maize productivity for +N compared to −N treatments was found in about half of the treatments of our experiments (Laub et al., 2023), which may suggest that increased aboveground biomass productivity does not automatically translate into increased belowground C inputs. Plants may invest less into roots if they are supplied well with nutrients from mineral fertilizer (Prescott et al., 2021). Additionally, N fertilizer may affect the microbial carbon-use efficiency. For example, Silva-Sánchez et al. (2019) found reduced microbial carbon-use efficiency in forest soils that received mineral N fertilizer.
4.4 Organic resource additions reduce SOC loss, but further agronomic measures are needed to increase SOC
While at Sidada and Aludeka SOC losses could be avoided with high inputs of 4 t C ha−1 yr−1 of farmyard manure, such amounts are usually not available on smallholder farms in SSA (Rufino et al., 2006; Wawire et al., 2021). In fact, the limited availability of manure is one of the main factors creating the gradients of soil fertility and SOC on smallholder farms (Tittonell et al., 2013). The aboveground biomass production in the study regions is around 6 t C ha−1 yr−1 (Running et al., 2004), suggesting that the high rates of 4 t C ha−1 yr−1 of manure are exceeding by far what is available at the landscape scale (Vanlauwe and Giller, 2006). Typical conversion rates of biomass C to manure C are around 30 % (de Azevedo et al., 2021; Dickhoefer et al., 2021), implying that, e.g., a hectare of grassland can maximally produce manure equivalent to 2 t C yr−1. Increased organic resource inputs at one location will therefore happen at the cost of losses at another location, effectively only redistributing SOC in the landscape (Wiesmeier et al., 2020). The typical gradients of lower soil fertility with increasing distance from the homesteads (Vanlauwe et al., 2015; Kayani et al., 2021) indicate that this redistribution has been and continues to happen.
This effectively means that to increase SOC at landscape scale, further agronomic practices that increase primary production and biomass availability, such as intercropping, rotations with grasses or agroforestry practices (Corbeels et al., 2019; Tessema et al., 2020), are needed. Intercropping can produce more biomass than sole crops on the same surface due to complementary use of resources (i.e., light, nutrients, water; Malézieux et al., 2009; Bedoussac et al., 2015). Cereal–legume intercropping was shown to increase SOC in the long term compared to sole crops (X.-F. Li et al., 2021). Recent research (Prescott et al., 2021; Sokol et al., 2019) confirms plant C inputs through roots as most effective contributors to SOC increase (Denef and Six, 2006), because they form new SOC with higher efficiency than external aboveground organic resource inputs (Rasse et al., 2005; Jackson et al., 2017; Sokol and Bradford, 2019). The proximity of microbes to C inputs has been highlighted as the most important factor for SOC formation (Lavallee et al., 2018). Therefore, the use of crop genotypes with strong root systems is seen as a good option to build SOC (e.g., Van de Broek et al., 2020). The higher SOC stocks in planted compared to bare plots at Aludeka and Sidada (Fig. 5) suggest the importance of roots for building SOC; both sites had the highest maize biomass productivity of all four sites (data not shown here; Laub et al., 2023). However, the higher SOC stocks in bare compared to planted plots at Embu do not corroborate these findings. Besides, the strong losses of SOC in the control treatments with and without mineral N fertilizer at all sites indicate that root inputs from maize monocropping systems cannot counterbalance SOC losses. It is estimated that root C inputs represent less than 1 t C ha−1 yr−1 in this type of cropping system (Cardinael et al., 2022).
4.5 Site specificity in the formation of new SOC
The decrease in SOC content in the control treatment without addition of organic resources was rather uniform among the sites, i.e., about 2 % of initial SOC per year, with Machanga being an exception, probably because of erosion losses (−N treatment; 3 %; Fig. 4). Comparing our data with data from other experiments worldwide showed a fairly consistent rate of SOC loss across studies if temperature effects were accounted for (Fig. 6). In contrast to the rather uniform rates of SOC loss, SOC responses to high-quality organic resource and farmyard manure additions were more site specific. In our study this was indicated by large differences between sites in SOC formation predominantly in the farmyard manure treatment but also in the Tithonia and Calliandra treatments at 4 t C ha−1 yr−1 (Fig. 4). Also, the CSEa values were site specific for all organic resources (i.e., significantly lower at Machanga compared to the other sites, and in the case of farmyard manure, higher at Sidada compared to the other sites, (Table 3). These site differences can however not solely be attributed to soil texture differences: Aludeka and Machanga have a similar soil texture, but a significantly higher CSEa was found for Calliandra and Tithonia at Aludeka than at Machanga. Also, Sidada and Embu have similar soil textures, but the CSEa of farmyard manure was significantly higher at Sidada than at Embu. Thus, we confirm our third hypothesis that soil properties are of similar importance for SOC formation as organic resource quality: the differences in CSEa between sites were as large as those between organic resources. Possibly, differences in soil mineralogy between sites play a role here (Zech et al., 1997; Reichenbach et al., 2021; Keller et al., 2022; Mainka et al., 2022), and all soils except Aludeka can be considered as effectively C-saturated under the current maize monocropping (Castellano et al., 2015). Overall, there is a lack of understanding on how CSEa is influenced by the interactions between organic resource quality, soil carbon saturation, climate and soil mineralogy in tropical soils, and this calls for more research efforts. Only a better understanding of all factors influencing CSEa can help to inform local adaptation of ISFM practices (Vanlauwe et al., 2015) in order for smallholder farmers to apply organic resources and mineral fertilizers where they are most effective.
This study showed that continuous maize cropping in sub-Saharan Africa without organic resource inputs is subject to significant SOC losses of on average 2 % yr−1 of initial SOC contents (ca. 40 % over 19 years). While the addition of 4 t C ha−1 yr−1 of farmyard manure, and to a certain degree Tithonia and Calliandra, could counteract the losses in all four study sites, a complete halt of SOC loss or achieving SOC gains was only possible at two sites. Farmyard manure application was the most effective treatment. On the other hand, the addition of 4 t C ha−1 yr−1 of green manures from Calliandra and Tithonia reduced significantly SOC losses compared to the control treatment. In contrast, the application of low-quality organic resources such as sawdust and maize stover did not reduce SOC losses, even at rates of 4 t C ha−1 yr−1. Similarly, mineral N application did not lower SOC losses nor improve SOC stabilization from low-quality organic resources. While the extent of SOC losses in the control treatments was similar across sites, formation efficiency of new SOC from organic resources was found to differ between sites, highlighting the importance of soil properties in the effectiveness of ISFM practices. Overall, our results clearly show that farmyard manure application was the most effective option for SOC formation at all sites. Farmyard manure is a key resource to maintain SOC stocks and soil fertility on smallholder farms in sub-Saharan Africa. However, the required quantities to maintain or build SOC are often not realistic for smallholder farmers. Additional agronomic interventions that enhance in situ biomass production, such as intercropping, crop rotations or the cultivation of crops with extended root systems, are therefore necessary to maintain or increase SOC in the tropical soils of smallholder farms.
A1 Figures and tables
Table A1Overview of the soil data that were available for this study.
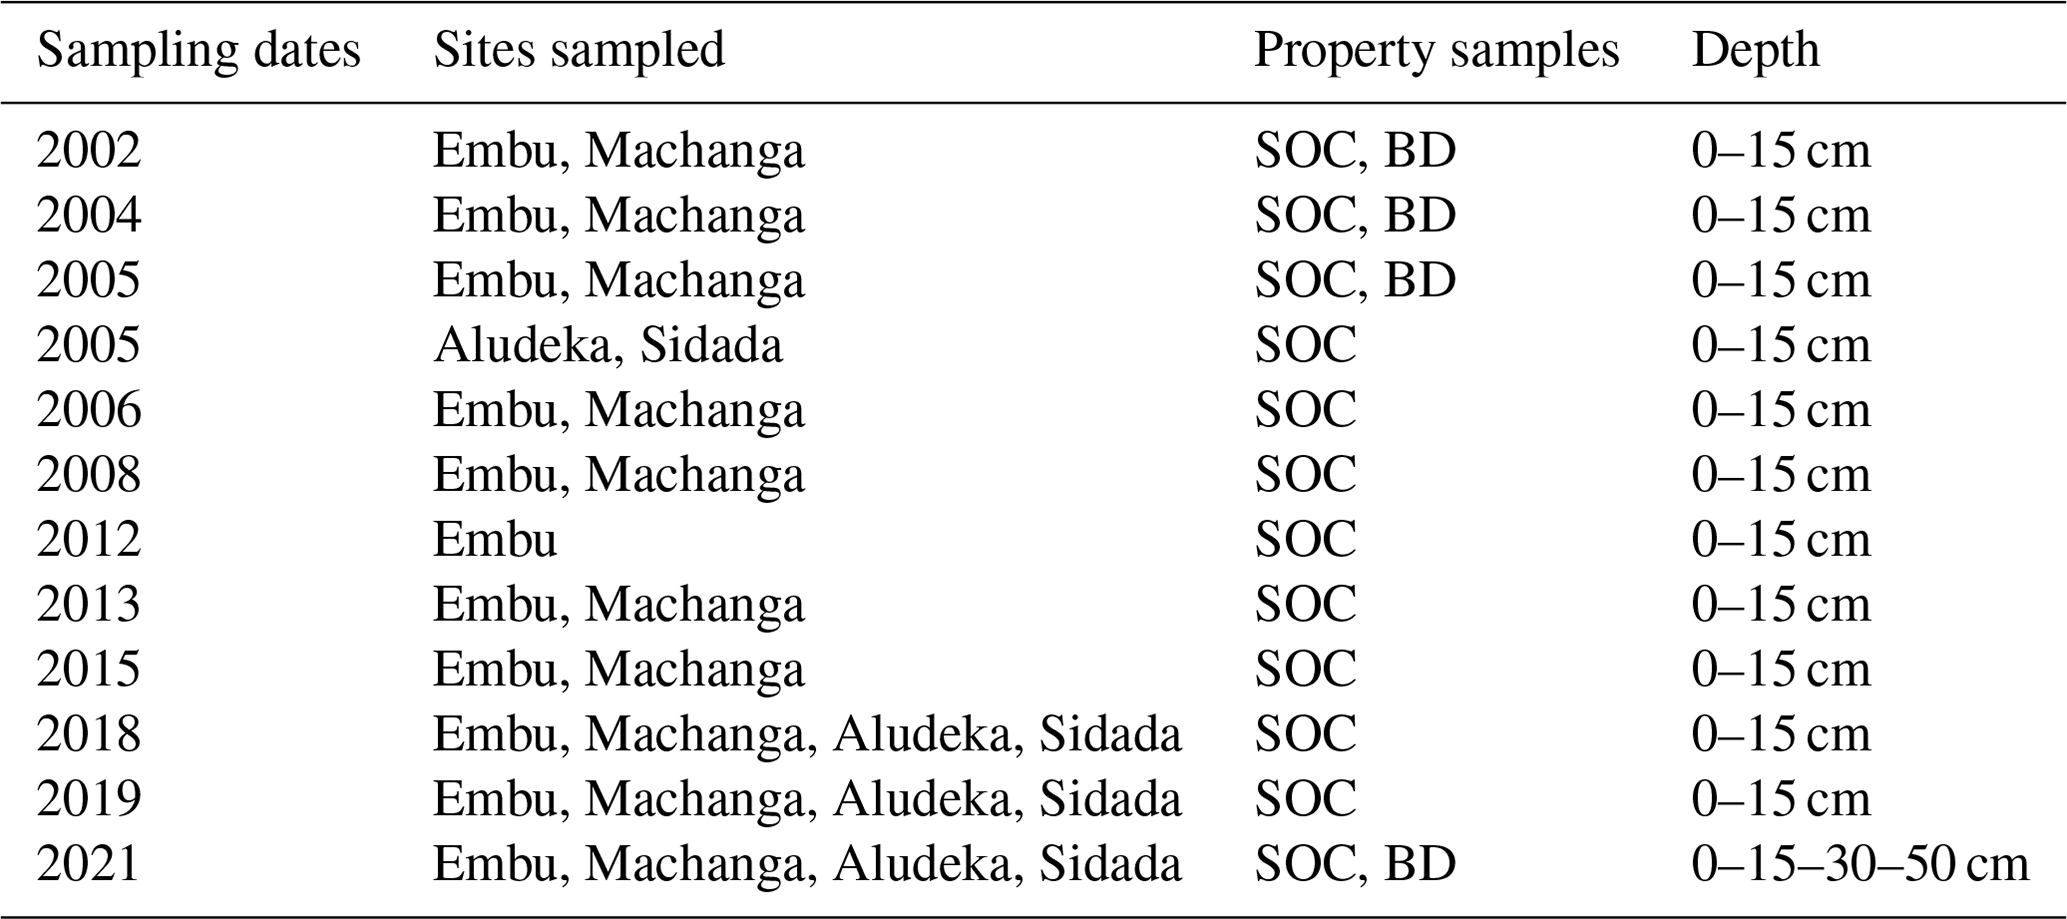

Figure A1Example of the split-plot design of the long-term trials: Aludeka. Red areas indicate the bare-fallow plot.
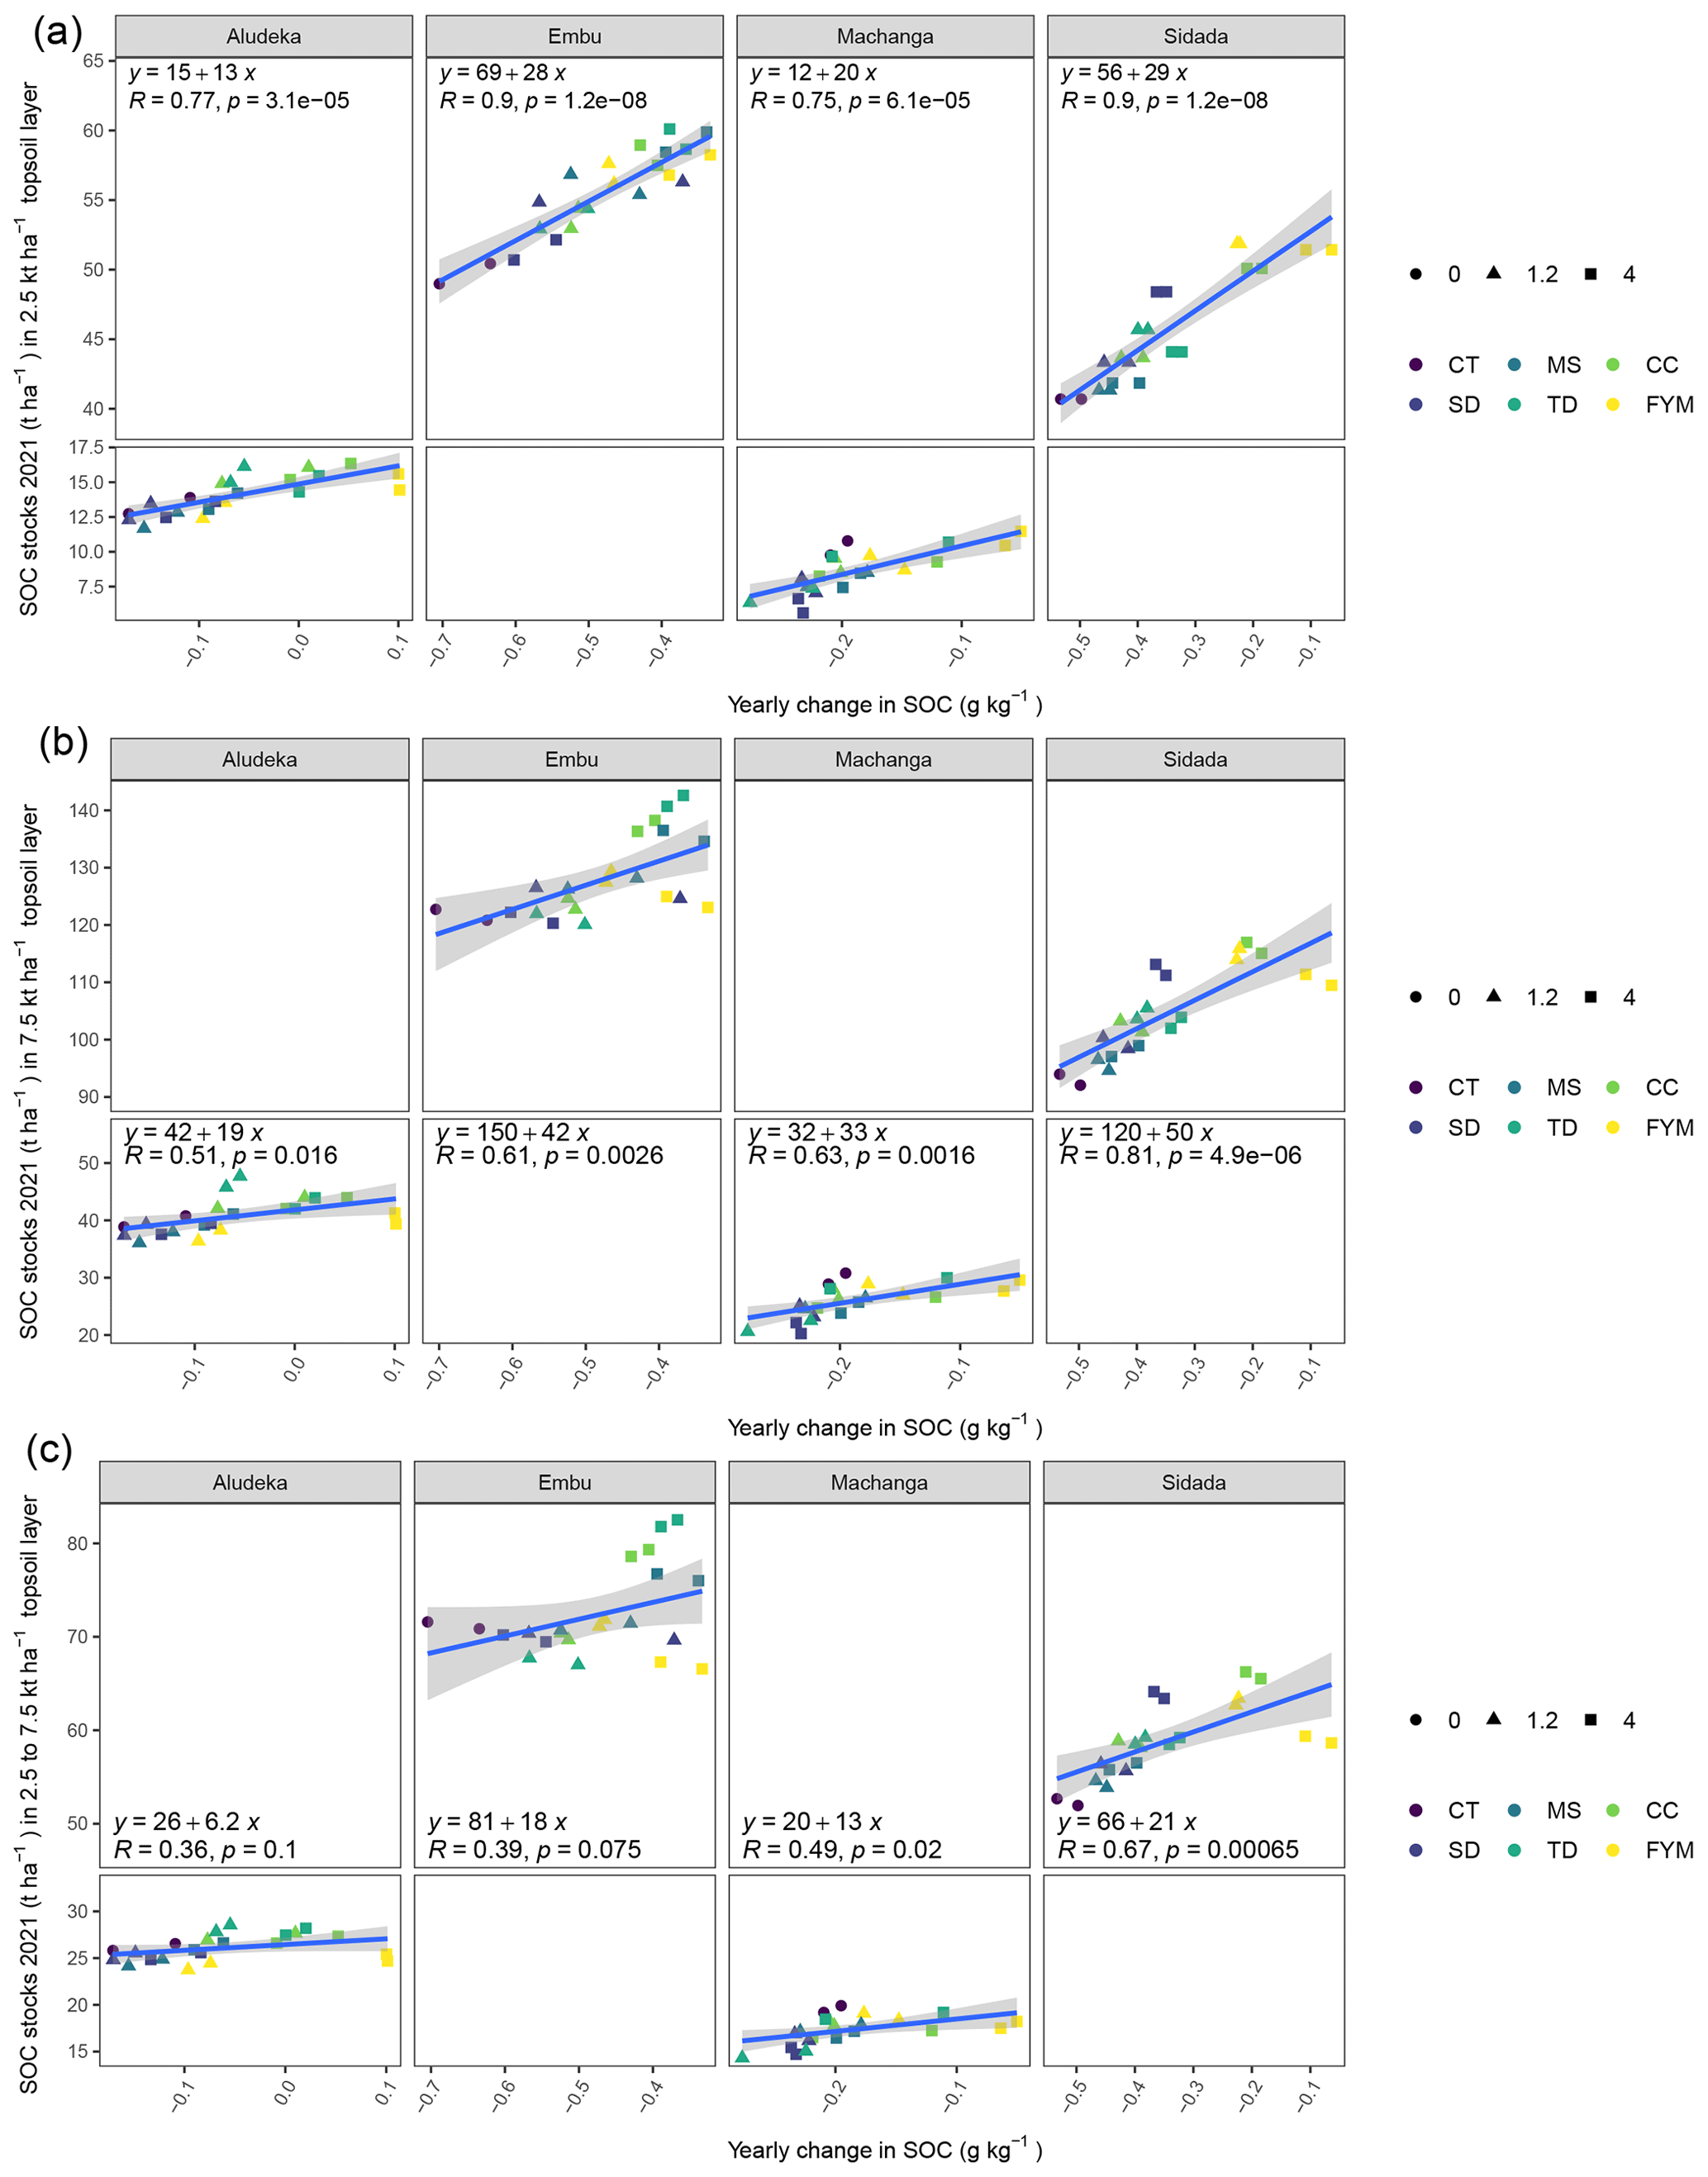
Figure A2Estimated least square means of the SOC stocks in the cumulative equivalent soil masses 0 to 2500, 0 to 7500 and 2500 to 7500 t ha−1 soil mass (a, b and c, respectively) plotted against the least square means for the temporal trend of SOC contents in the 0–15 cm topsoil horizon.
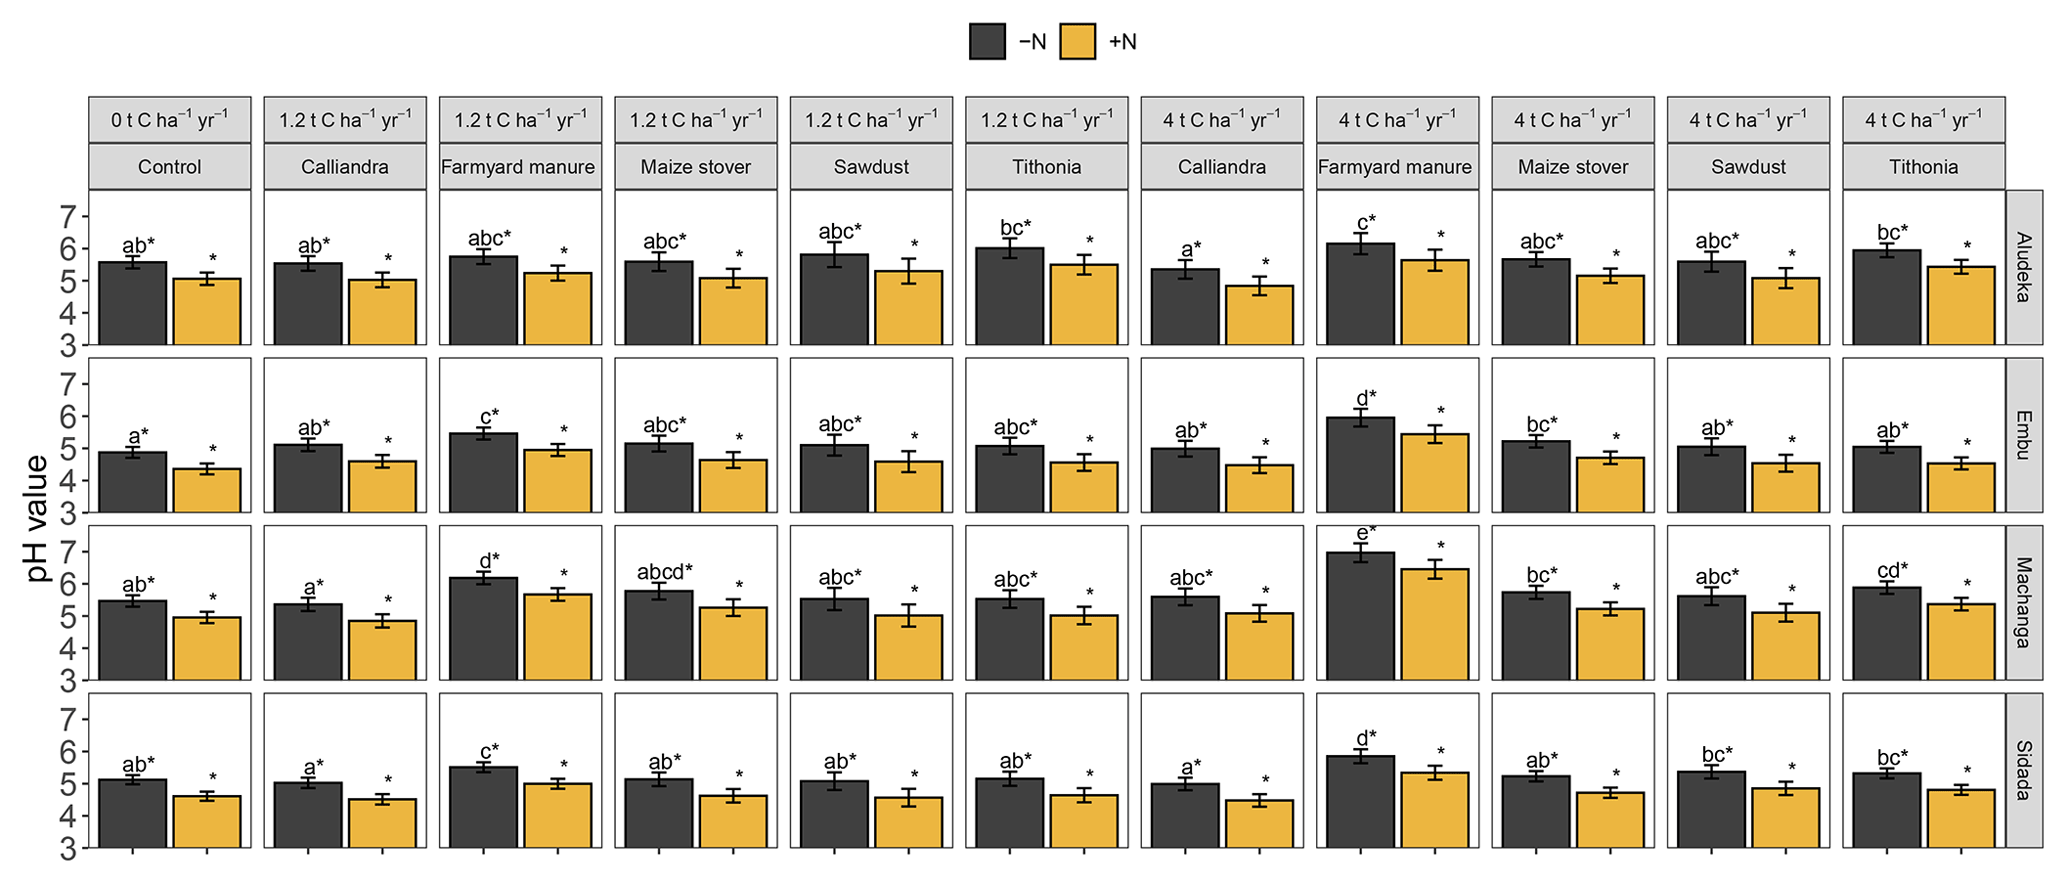
Figure A3Estimated least square means for the topsoil pH value by site. Error bars display the 95 % confidence intervals. Organic resource treatments from the same site which share no lowercase letter are significantly different from each other (p<0.05). The asterisk (∗) indicates that a similar significant difference existed between the +N and −N treatment for all organic resource treatments and at all sites (due to the lack of a significant interaction of ±N with both organic resource treatments and site).
A2 The effect of organic resources and mineral N on soil pH
Mineral N application had a significant negative effect on soil pH, which was consistent across sites, i.e., the +N treatments had a pH of 0.11 units lower than the −N treatments. In addition, there was a highly significant interaction of organic resource treatment with site. In all sites, soil pH values were highest in the FYM treatment at 4 t C ha−1 yr−1, whereas the lowest pH values were found in the control or CC treatments. Yet, the strength of the differentiation of FYM at 4 t C ha−1 yr−1 compared to other treatments differed among sites. For example, the pH values in the FYM treatment at 4 t C ha−1 yr−1 in Embu (5.95 in −N) and Machanga (6.96 in −N) were significantly higher than in all other treatments; in Sidada (5.85 in −N) it was higher than all, except in the FYM treatment at 1.2 t C ha−1 yr−1, while in Aludeka (6.15 in −N), it was only significantly higher than that in the control and CC treatments. While the pH values in SD and CC at both C input rates were not significantly different from that in the control in any site, TD at 4 t C ha−1 yr−1 had a significantly higher pH value than the control in Machanga and a significantly higher pH value than those in CC at 4 t C ha−1 yr−1 in Aludeka and Sidada, as well as those in CC at 1.2 t C ha−1 yr−1 in Machanga and Sidada.
The dataset used for this study including SOC and N is made available under the IITA data repository https://doi.org/10.25502/wdh5-6c13/d (Vanlauwe et al., 2022).
BV and JS designed the research. MWMM, DM, SMN and WW managed and maintained the long-term trials. ML, AC, SMN, MN, WW, MVdB and JS were involved in the various sampling campaigns. MC, MN, BV and JS acquired funding for the research. ML summarized the data, did the statistical analysis and prepared the original draft. All co-authors contributed in writing and editing of the final submitted article.
At least one of the (co-)authors is a member of the editorial board of SOIL. The peer-review process was guided by an independent editor, and the authors also have no other competing interests to declare.
Publisher’s note: Copernicus Publications remains neutral with regard to jurisdictional claims in published maps and institutional affiliations.
We want to thank Silas Kiragu, who is responsible for maintaining the trials in the Embu and Machanga site, and John Mukalama, who implemented and maintained the trials in Aludeka and Sidada. Also, we want to thank John Waruingi for helping with sample processing over the years, Moses Thuita for coordinating the trials for many years, and Britta Jahn-Humphrey for organizing and overseeing the measurement of most SOC and TN in recent years. Additional thanks to Moritz Bach and Julian Koller for their contribution in the measurement of SOC and TN from 2021 and to Lukas Burgdorfer and Franziska Büeler for their contribution to the data from 2018. We further acknowledge funding and technical support from the Tropical Soil Biology and Fertility Institute of CIAT (TSBF-CIAT), the International Institute of Tropical Agriculture (ITTA) and ETH Zurich in maintaining the experiments throughout many years.
This research has been supported by the Schweizerischer Nationalfonds zur Förderung der Wissenschaftlichen Forschung (grant no. 172940), the Agropolis Fondation (grant no. ANR-10-LABX-0001-01), the TOTAL Foundation (patronage agreement), the European Union's Horizon 2020 framework (LANDMARC; grant no. 869367) and the DSCATT project “Agricultural Intensification and Dynamics of Soil Carbon Sequestration in Tropical and Temperate Farming Systems” (grant nos. AF 1802-001 and FT C002181).
This paper was edited by Marta Dondini and reviewed by Mario Reichenbach and one anonymous referee.
Adams, A. M., Gillespie, A. W., Dhillon, G. S., Kar, G., Minielly, C., Koala, S., Ouattara, B., Kimaro, A. A., Bationo, A., Schoenau, J. J., and Peak, D.: Long-term effects of integrated soil fertility management practices on soil chemical properties in the Sahel, Geoderma, 366, 114207, https://doi.org/10.1016/j.geoderma.2020.114207, 2020. a
Anderson, J. M. and Ingram, J. S. I. (Eds.): Tropical Soil Biology and Fertility: A Handbook of Methods, CAB international, Wallingford, 2nd Edn., https://doi.org/10.2307/2261129, 1993. a
Angst, G., Mueller, K. E., Nierop, K. G. J., and Simpson, M. J.: Plant- or microbial-derived? A review on the molecular composition of stabilized soil organic matter, Soil Biol. Biochem., 156, 108189, https://doi.org/10.1016/j.soilbio.2021.108189, 2021. a
Bedoussac, L., Journet, E.-P., Hauggaard-Nielsen, H., Naudin, C., Corre-Hellou, G., Jensen, E. S., Prieur, L., and Justes, E.: Ecological principles underlying the increase of productivity achieved by cereal-grain legume intercrops in organic farming. A review, Agron. Sustain. Dev., 35, 911–935, https://doi.org/10.1007/s13593-014-0277-7, 2015. a
Bucka, F. B., Felde, V. J. M. N. L., Peth, S., and Kögel-Knabner, I.: Disentangling the effects of OM quality and soil texture on microbially mediated structure formation in artificial model soils, Geoderma, 403, 115213, https://doi.org/10.1016/j.geoderma.2021.115213, 2021. a
Cardinael, R., Guibert, H., Kouassi Brédoumy, S. T., Gigou, J., N'Goran, K. E., and Corbeels, M.: Sustaining maize yields and soil carbon following land clearing in the forest–savannah transition zone of West Africa: Results from a 20-year experiment, Field Crop. Res., 275, 108335, https://doi.org/10.1016/j.fcr.2021.108335, 2022. a, b
Castellano, M. J., Mueller, K. E., Olk, D. C., Sawyer, J. E., and Six, J.: Integrating plant litter quality, soil organic matter stabilization, and the carbon saturation concept, Glob. Change Biol., 21, 3200–3209, https://doi.org/10.1111/gcb.12982, 2015. a
Chivenge, P., Vanlauwe, B., Gentile, R., Wangechi, H., Mugendi, D., Kessel, C. v., and Six, J.: Organic and Mineral Input Management to Enhance Crop Productivity in Central Kenya, Agron. J., 101, 1266–1275, https://doi.org/10.2134/agronj2008.0188x, 2009. a
Conant, R. T., Ryan, M. G., Ågren, G. I., Birge, H. E., Davidson, E. A., Eliasson, P. E., Evans, S. E., Frey, S. D., Giardina, C. P., Hopkins, F. M., Hyvönen, R., Kirschbaum, M. U. F., Lavallee, J. M., Leifeld, J., Parton, W. J., Megan Steinweg, J., Wallenstein, M. D., Martin Wetterstedt, J. A., and Bradford, M. A.: Temperature and soil organic matter decomposition rates – synthesis of current knowledge and a way forward, Glob. Change Biol., 17, 3392–3404, https://doi.org/10.1111/j.1365-2486.2011.02496.x, 2011. a
Corbeels, M., Cardinael, R., Naudin, K., Guibert, H., and Torquebiau, E.: The 4 per 1000 goal and soil carbon storage under agroforestry and conservation agriculture systems in sub-Saharan Africa, Soil Till. Res., 188, 16–26, https://doi.org/10.1016/j.still.2018.02.015, 2019. a
Cotrufo, M. F., Wallenstein, M. D., Boot, C. M., Denef, K., and Paul, E.: The Microbial Efficiency-Matrix Stabilization (MEMS) framework integrates plant litter decomposition with soil organic matter stabilization: do labile plant inputs form stable soil organic matter?, Glob. Change Biol., 19, 988–995, https://doi.org/10.1111/gcb.12113, 2013. a, b, c
Cotrufo, M. F., Lavallee, J. M., Zhang, Y., Hansen, P. M., Paustian, K. H., Schipanski, M., and Wallenstein, M. D.: In-N-Out: A hierarchical framework to understand and predict soil carbon storage and nitrogen recycling, Glob. Change Biol., 27, 4465–4468, https://doi.org/10.1111/gcb.15782, 2021. a
Davidson, E. A. and Janssens, I. A.: Temperature sensitivity of soil carbon decomposition and feedbacks to climate change, Nature, 440, 165–173, https://doi.org/10.1038/nature04514, 2006. a
de Azevedo, E. B., Savian, J. V., do Amaral, G. A., de David, D. B., Gere, J. I., Kohmann, M. M., Bremm, C., Jochims, F., Zubieta, A. S., Gonda, H. L., Bayer, C., and de Faccio Carvalho, P. C.: Feed intake, methane yield, and efficiency of utilization of energy and nitrogen by sheep fed tropical grasses, Trop. Anim. Health Pro., 53, 452, https://doi.org/10.1007/s11250-021-02928-4, 2021. a
Denef, K. and Six, J.: Contributions of incorporated residue and living roots to aggregate-associated and microbial carbon in two soils with different clay mineralogy, Eur. J. Soil Sci., 57, 774–786, https://doi.org/10.1111/j.1365-2389.2005.00762.x, 2006. a
Denef, K., Plante, A. F., and Six, J.: Characterization of soil organic matter, in: Soil Carbon Dynamics: An Integrated Methodology, edited by: Heinemeyer, A., Bahn, M., and Kutsch, W. L., 91–126, Cambridge University Press, Cambridge, https://doi.org/10.1017/CBO9780511711794.007, 2009. a, b
Dickhoefer, U., Ramadhan, M. R., Apenburg, S., Buerkert, A., and Schlecht, E.: Effects of mild water restriction on nutrient digestion and protein metabolism in desert-adapted goats, Small Ruminant Res., 204, 106500, https://doi.org/10.1016/j.smallrumres.2021.106500, 2021. a
Doetterl, S., Stevens, A., Six, J., Merckx, R., Van Oost, K., Casanova Pinto, M., Casanova-Katny, A., Muñoz, C., Boudin, M., Zagal Venegas, E., and Boeckx, P.: Soil carbon storage controlled by interactions between geochemistry and climate, Nat. Geosci., 8, 780–783, https://doi.org/10.1038/ngeo2516, 2015. a, b
FAO: World reference base for soil resources, no. 84 in World Soil Resources Report, FAO, Rome, ISBN 92-5-104141-5, 1998. a
FAO: FAOSTAT Online Database, http://www.fao.org/ (last access: 5 August 2021), 2021. a
Frimmel, F. H. and Christman, R. F.: Humic substances and their role in the environment, edited by: Frimmel, F. H., Bracewell, J. M., and Christman, R. F., John Wiley and Sons Ltd., ISBN 9780471918172, 1988. a
Fujisaki, K., Chevallier, T., Chapuis-Lardy, L., Albrecht, A., Razafimbelo, T., Masse, D., Ndour, Y. B., and Chotte, J.-L.: Soil carbon stock changes in tropical croplands are mainly driven by carbon inputs: A synthesis, Agr. Ecosyst. Environ., 259, 147–158, https://doi.org/10.1016/j.agee.2017.12.008, 2018. a
Galicia, L. and García-Oliva, F.: Litter Quality of Two Remnant Tree Species Affects Soil Microbial Activity in Tropical Seasonal Pastures in Western Mexico, Arid Land Res. Manag., 25, 75–86, https://doi.org/10.1080/15324982.2010.528148, 2011. a
Gentile, R., Vanlauwe, B., van Kessel, C., and Six, J.: Managing N availability and losses by combining fertilizer-N with different quality residues in Kenya, Agr. Ecosyst. Environ., 131, 308–314, https://doi.org/10.1016/j.agee.2009.02.003, 2009. a
Gentile, R., Vanlauwe, B., and Six, J.: Litter quality impacts short- but not long-term soil carbon dynamics in soil aggregate fractions, Ecol. Soc. Am., 21, 695–703, https://doi.org/10.1890/09-2325.1, 2011. a
Gram, G., Roobroeck, D., Pypers, P., Six, J., Merckx, R., and Vanlauwe, B.: Combining organic and mineral fertilizers as a climate-smart integrated soil fertility management practice in sub-Saharan Africa: A meta-analysis, PLOS ONE, 15, e0239552, https://doi.org/10.1371/journal.pone.0239552, 2020. a
Guo, L. B. and Gifford, R. M.: Soil carbon stocks and land use change: A meta analysis, Glob. Change Biol., 8, 345–360, https://doi.org/10.1046/j.1354-1013.2002.00486.x, 2002. a
Hao, X., Han, X., Wang, S., and Li, L.-J.: Dynamics and composition of soil organic carbon in response to 15 years of straw return in a Mollisol, Soil Till. Res., 215, 105221, https://doi.org/10.1016/j.still.2021.105221, 2022. a
Hassink, J.: The capacity of soils to preserve organic C and N by their association with clay and silt particles, Plant Soil, 191, 77–87, https://doi.org/10.1023/A:1004213929699, 1997. a
IUSS Working Group: World reference base for soil resources 2014, International soil classification system for naming soils and creating legends for soil maps, World Soil Resources Reports No. 106, FAO, Rome, https://doi.org/10.1017/S0014479706394902, 2014. a, b
Jackson, R. B., Lajtha, K., Crow, S. E., Hugelius, G., Kramer, M. G., and Piñeiro, G.: The Ecology of Soil Carbon: Pools, Vulnerabilities, and Biotic and Abiotic Controls, Annu. Rev. Ecol. Evol. S., 48, 419–445, https://doi.org/10.1146/annurev-ecolsys-112414-054234, 2017. a
Kallenbach, C. M., Frey, S. D., and Grandy, A. S.: Direct evidence for microbial-derived soil organic matter formation and its ecophysiological controls, Nat. Commun., 7, 1–10, https://doi.org/10.1038/ncomms13630, 2016. a, b
Karhu, K., Gärdenäs, A. I., Heikkinen, J., Vanhala, P., Tuomi, M., and Liski, J.: Impacts of organic amendments on carbon stocks of an agricultural soil – Comparison of model-simulations to measurements, Geoderma, 189–190, 606–616, https://doi.org/10.1016/j.geoderma.2012.06.007, 2012. a
Kayani, I. B., Agumas, B., Musyoki, M., Nziguheba, G., Marohn, C., Benz, M., Vanlauwe, B., Cadisch, G., and Rasche, F.: Market access and resource endowment define the soil fertility status of smallholder farming systems of South-Kivu, DR Congo, Soil Use Manage., 37, 353–366, https://doi.org/10.1111/sum.12691, 2021. a
Keller, A. B., Borer, E. T., Collins, S. L., DeLancey, L. C., Fay, P. A., Hofmockel, K. S., Leakey, A. D., Mayes, M. A., Seabloom, E. W., Walter, C. A., Wang, Y., Zhao, Q., and Hobbie, S. E.: Soil carbon stocks in temperate grasslands differ strongly across sites but are insensitive to decade-long fertilization, Glob. Change Biol., 28, 1659–1677, https://doi.org/10.1111/gcb.15988, 2022. a
Kihara, J., Bolo, P., Kinyua, M., Nyawira, S. S., and Sommer, R.: Soil health and ecosystem services: Lessons from sub-Sahara Africa (SSA), Geoderma, 370, 114342, https://doi.org/10.1016/j.geoderma.2020.114342, 2020. a
Kong, A. Y. Y., Six, J., Bryant, D. C., Denison, R. F., and van Kessel, C.: The Relationship between Carbon Input, Aggregation, and Soil Organic Carbon Stabilization in Sustainable Cropping Systems, Soil Sci. Soc. Am. J., 69, 1078–1085, https://doi.org/10.2136/sssaj2004.0215, 2005. a
Kunlanit, B., Vityakon, P., Puttaso, A., Cadisch, G., and Rasche, F.: Mechanisms controlling soil organic carbon composition pertaining to microbial decomposition of biochemically contrasting organic residues: Evidence from midDRIFTS peak area analysis, Soil Biol. Biochem., 76, 100–108, https://doi.org/10.1016/j.soilbio.2014.05.006, 2014. a, b
Ladha, J. K., Reddy, C. K., Padre, A. T., and van Kessel, C.: Role of Nitrogen Fertilization in Sustaining Organic Matter in Cultivated Soils, J. Environ. Qual., 40, 1756–1766, https://doi.org/10.2134/jeq2011.0064, 2011. a
Lal, R.: Digging deeper: A holistic perspective of factors affecting soil organic carbon sequestration in agroecosystems, Glob. Change Biol., 24, 3285–3301, https://doi.org/10.1111/gcb.14054, 2018. a
Laub, M., Schlichenmeier, S., Vityakon, P., and Cadisch, G.: Litter Quality and Microbes Explain Aggregation Differences in a Tropical Sandy Soil, J. Soil Sci. Plant Nut., 22, 848–860, https://doi.org/10.1007/s42729-021-00696-6, 2022. a, b
Laub, M., Corbeels, M., Mathu Ndungu, S., Mucheru-Muna, M. W., Mugendi, D., Necpalova, M., Van de Broek, M., Waswa, W., Vanlauwe, B., and Six, J.: Combining manure with mineral N fertilizer maintains maize yields: Evidence from four long-term experiments in Kenya, Field Crop. Res., 291, 108788, https://doi.org/10.1016/j.fcr.2022.108788, 2023. a, b, c
Lavallee, J. M., Conant, R. T., Paul, E. A., and Cotrufo, M. F.: Incorporation of shoot versus root-derived 13C and 15N into mineral-associated organic matter fractions: results of a soil slurry incubation with dual-labelled plant material, Biogeochemistry, 137, 379–393, https://doi.org/10.1007/s10533-018-0428-z, 2018. a
Lee, J., Hopmans, J. W., Rolston, D. E., Baer, S. G., and Six, J.: Determining soil carbon stock changes: Simple bulk density corrections fail, Agr. Ecosyst. Environ., 134, 251–256, https://doi.org/10.1016/j.agee.2009.07.006, 2009. a
Lenth, R. V.: emmeans: Estimated Marginal Means, aka Least-Squares Means, r package version 1.5.4, https://github.com/rvlenth/emmeans (last access: 1 June 2023), 2021. a
Li, J., Sang, C., Yang, J., Qu, L., Xia, Z., Sun, H., Jiang, P., Wang, X., He, H., and Wang, C.: Stoichiometric imbalance and microbial community regulate microbial elements use efficiencies under nitrogen addition, Soil Biol. Biochem., 156, 108207, https://doi.org/10.1016/j.soilbio.2021.108207, 2021. a
Li, M., Meador, T., Sauheitl, L., Guggenberger, G., and Angst, G.: Substrate quality effects on stabilized soil carbon reverse with depth, Geoderma, 406, 115511, https://doi.org/10.1016/j.geoderma.2021.115511, 2022. a
Li, X.-F., Wang, Z.-G., Bao, X.-G., Sun, J.-H., Yang, S.-C., Wang, P., Wang, C.-B., Wu, J.-P., Liu, X.-R., Tian, X.-L., Wang, Y., Li, J.-P., Wang, Y., Xia, H.-Y., Mei, P.-P., Wang, X.-F., Zhao, J.-H., Yu, R.-P., Zhang, W.-P., Che, Z.-X., Gui, L.-G., Callaway, R. M., Tilman, D., and Li, L.: Long-term increased grain yield and soil fertility from intercropping, Nat. Sustain., 4, 943–950, https://doi.org/10.1038/s41893-021-00767-7, 2021b. a
Mainka, M., Summerauer, L., Wasner, D., Garland, G., Griepentrog, M., Berhe, A. A., and Doetterl, S.: Soil geochemistry as a driver of soil organic matter composition: insights from a soil chronosequence, Biogeosciences, 19, 1675–1689, https://doi.org/10.5194/bg-19-1675-2022, 2022. a
Malik, A. A., Puissant, J., Buckeridge, K. M., Goodall, T., Jehmlich, N., Chowdhury, S., Gweon, H. S., Peyton, J. M., Mason, K. E., van Agtmaal, M., Blaud, A., Clark, I. M., Whitaker, J., Pywell, R. F., Ostle, N., Gleixner, G., and Griffiths, R. I.: Land use driven change in soil pH affects microbial carbon cycling processes, Nat. Commun., 9, 3591, https://doi.org/10.1038/s41467-018-05980-1, 2018. a
Malézieux, E., Crozat, Y., Dupraz, C., Laurans, M., Makowski, D., Ozier-Lafontaine, H., Rapidel, B., de Tourdonnet, S., and Valantin-Morison, M.: Mixing plant species in cropping systems: concepts, tools and models. A review, Agron. Sustain. Dev., 29, 43–62, https://doi.org/10.1051/agro:2007057, 2009. a
Manzoni, S., Taylor, P., Richter, A., Porporato, A., and Ågren, G. I.: Environmental and stoichiometric controls on microbial carbon-use efficiency in soils, New Phytol., 196, 79–91, https://doi.org/10.1111/j.1469-8137.2012.04225.x, 2012. a
Manzoni, S., Čapek, P., Porada, P., Thurner, M., Winterdahl, M., Beer, C., Brüchert, V., Frouz, J., Herrmann, A. M., Lindahl, B. D., Lyon, S. W., Šantrůčková, H., Vico, G., and Way, D.: Reviews and syntheses: Carbon use efficiency from organisms to ecosystems – definitions, theories, and empirical evidence, Biogeosciences, 15, 5929–5949, https://doi.org/10.5194/bg-15-5929-2018, 2018. a, b
Mtangadura, T. J., Mtambanengwe, F., Nezomba, H., Rurinda, J., and Mapfumo, P.: Why organic resources and current fertilizer formulations in Southern Africa cannot sustain maize productivity: Evidence from a long-term experiment in Zimbabwe, PLOS ONE, 12, e0182840, https://doi.org/10.1371/journal.pone.0182840, 2017. a, b, c
Palm, C. A., Gachengo, C. N., Delve, R. J., Cadisch, G., and Giller, K. E.: Organic inputs for soil fertility management in tropical agroecosystems: application of an organic resource database, Agr. Ecosyst. Environ., 83, 27–42, https://doi.org/10.1016/S0167-8809(00)00267-X, 2001a. a, b, c
Palm, C. A., Giller, K. E., Mafongoya, P. L., and Swift, M. J.: Management of organic matter in the tropics: Translating theory into practice, Nutr. Cycl. Agroecosys., 61, 63–75, https://doi.org/10.1023/A:1013318210809, 2001b. a, b
Piepho, H.-P.: An Algorithm for a Letter-Based Representation of All-Pairwise Comparisons, J. Comput. Graph. Stat., 13, 456–466, https://doi.org/10.1198/1061860043515, 2004. a
Pingthaisong, W. and Vityakon, P.: Nonadditive Effects on Decomposition of a Mixture of Rice Straw and Groundnut Stover Applied to a Sandy Soil, Agronomy, 11, 1030, https://doi.org/10.3390/agronomy11061030, 2021. a
Pinheiro, J., Bates, D., and R-core: nlme: Linear and Nonlinear Mixed Effects Models, r package version 3.1-152, https://svn.r-project.org/R-packages/trunk/nlme/ (last access: 1 June 2023), 2021. a
Prescott, C. E., Rui, Y., Cotrufo, M. F., and Grayston, S. J.: Managing plant surplus carbon to generate soil organic matter in regenerative agriculture, J. Soil Water Conserv., 76, 99A–104A, https://doi.org/10.2489/jswc.2021.0920A, 2021. a, b
Pretty, J. and Bharucha, Z. P.: Sustainable intensification in agricultural systems, Ann. Bot., 114, 1571–1596, https://doi.org/10.1093/aob/mcu205, 2014. a
Puttaso, A., Vityakon, P., Rasche, F., Saenjan, P., Treloges, V., and Cadisch, G.: Does Organic Residue Quality Influence Carbon Retention in a Tropical Sandy Soil?, Soil Sci. Soc. Am. J., 77, 1001–1001, https://doi.org/10.2136/sssaj2012.0209, 2013. a, b, c
Rasse, D. P., Rumpel, C., and Dignac, M.-F.: Is soil carbon mostly root carbon? Mechanisms for a specific stabilisation, Plant Soil, 269, 341–356, https://doi.org/10.1007/s11104-004-0907-y, 2005. a
R Core Team: R: A Language and Environment for Statistical Computing, R Foundation for Statistical Computing, Vienna, Austria, https://www.R-project.org/ (last access: 1 June 2023), 2021. a
Reichenbach, M., Fiener, P., Garland, G., Griepentrog, M., Six, J., and Doetterl, S.: The role of geochemistry in organic carbon stabilization against microbial decomposition in tropical rainforest soils, SOIL, 7, 453–475, https://doi.org/10.5194/soil-7-453-2021, 2021. a
Rufino, M. C., Rowe, E. C., Delve, R. J., and Giller, K. E.: Nitrogen cycling efficiencies through resource-poor African crop–livestock systems, Agr. Ecosyst. Environ., 112, 261–282, https://doi.org/10.1016/j.agee.2005.08.028, 2006. a
Running, S. W., Nemani, R. R., Heinsch, F. A., Zhao, M., Reeves, M., and Hashimoto, H.: A Continuous Satellite-Derived Measure of Global Terrestrial Primary Production, BioScience, 54, 547–560, https://doi.org/10.1641/0006-3568(2004)054[0547:ACSMOG]2.0.CO;2, 2004. a
Rusinamhodzi, L., Corbeels, M., Zingore, S., Nyamangara, J., and Giller, K. E.: Pushing the envelope? Maize production intensification and the role of cattle manure in recovery of degraded soils in smallholder farming areas of Zimbabwe, Field Crop. Res., 147, 40–53, https://doi.org/10.1016/j.fcr.2013.03.014, 2013. a
Ryan, M. G. and Law, B. E.: Interpreting, measuring, and modeling soil respiration, Biogeochemistry, 73, 3–27, https://doi.org/10.1007/s10533-004-5167-7, 2005. a
Sanderman, J., Hengl, T., and Fiske, G. J.: Soil carbon debt of 12,000 years of human land use, P. Natl. Acad. Sci. USA, 114, 9575–9580, https://doi.org/10.1073/pnas.1706103114, 2017. a
Schweizer, S. A., Mueller, C. W., Höschen, C., Ivanov, P., and Kögel-Knabner, I.: The role of clay content and mineral surface area for soil organic carbon storage in an arable toposequence, Biogeochemistry, 156, 401–420, https://doi.org/10.1007/s10533-021-00850-3, 2021. a
Sileshi, G. W., Nhamo, N., Mafongoya, P. L., and Tanimu, J.: Stoichiometry of animal manure and implications for nutrient cycling and agriculture in sub-Saharan Africa, Nutr. Cycl. Agroecosys., 107, 91–105, https://doi.org/10.1007/s10705-016-9817-7, 2017. a
Sileshi, G. W., Jama, B., Vanlauwe, B., Negassa, W., Harawa, R., Kiwia, A., and Kimani, D.: Nutrient use efficiency and crop yield response to the combined application of cattle manure and inorganic fertilizer in sub-Saharan Africa, Nutr. Cycl. Agroecosys., 113, 181–199, https://doi.org/10.1007/s10705-019-09974-3, 2019. a, b
Silva, V. B. d., Silva, A. P. d., Dias, B. d. O., Araujo, J. L., Santos, D., and Franco, R. P.: Decomposição e liberação de N, P e K de esterco bovino e de cama de frango isolados ou misturados, Rev. Bras. Ciênc. Solo, 38, 1537–1546, https://doi.org/10.1590/S0100-06832014000500019, 2014. a
Silva-Sánchez, A., Soares, M., and Rousk, J.: Testing the dependence of microbial growth and carbon use efficiency on nitrogen availability, pH, and organic matter quality, Soil Biol. Biochem., 134, 25–35, https://doi.org/10.1016/j.soilbio.2019.03.008, 2019. a
Sinsabaugh, R. L., Manzoni, S., Moorhead, D. L., and Richter, A.: Carbon use efficiency of microbial communities: stoichiometry, methodology and modelling, Ecol. Lett., 16, 930–939, https://doi.org/10.1111/ele.12113, 2013. a, b
Six, J., Feller, C., Denef, K., Ogle, S. M., Sa, J. C. d. M., and Albrecht, A.: Soil organic matter, biota and aggregation in temperate and tropical soils – Effects of no-tillage, Agronomie, 22, 755–775, https://doi.org/10.1051/agro:2002043, 2002. a, b
Sokol, N. W. and Bradford, M. A.: Microbial formation of stable soil carbon is more efficient from belowground than aboveground input, Nat. Geosci., 12, 46–53, https://doi.org/10.1038/s41561-018-0258-6, 2019. a
Sokol, N. W., Sanderman, J., and Bradford, M. A.: Pathways of mineral-associated soil organic matter formation: Integrating the role of plant carbon source, chemistry, and point of entry, Glob. Change Biol., 25, 12–24, https://doi.org/10.1111/gcb.14482, 2019. a
Solomon, D., Lehmann, J., Kinyangi, J., Amelung, W., Lobe, I., Pell, A., Riha, S., Ngoze, S., Verchot, L., Mbugua, D., Skjemstad, J., and Schäfer, T.: Long-term impacts of anthropogenic perturbations on dynamics and speciation of organic carbon in tropical forest and subtropical grassland ecosystems, Glob. Change Biol., 13, 511–530, https://doi.org/10.1111/j.1365-2486.2006.01304.x, 2007. a
Sommer, R., Paul, B. K., Mukalama, J., and Kihara, J.: Reducing losses but failing to sequester carbon in soils – the case of Conservation Agriculture and Integrated Soil Fertility Management in the humid tropical agro-ecosystem of Western Kenya, Agr. Ecosyst. Environ., 254, 82–91, https://doi.org/10.1016/j.agee.2017.11.004, 2018. a, b, c
Srinivasarao, C., Venkateswarlu, B., Lal, R., Singh, A. K., Kundu, S., Vittal, K. P. R., Ramachandrappa, B. K., and Gajanan, G. N.: Long-term effects of crop residues and fertility management on carbon sequestration and agronomic productivity of groundnut–finger millet rotation on an Alfisol in southern India, Int. J. Agr. Sustain., 10, 230–244, https://doi.org/10.1080/14735903.2012.662392, 2012. a
Tessema, B., Sommer, R., Piikki, K., Söderström, M., Namirembe, S., Notenbaert, A., Tamene, L., Nyawira, S., and Paul, B.: Potential for soil organic carbon sequestration in grasslands in East African countries: A review, Grassl. Sci., 66, 135–144, https://doi.org/10.1111/grs.12267, 2020. a
Tittonell, P., Muriuki, A., Klapwijk, C. J., Shepherd, K. D., Coe, R., and Vanlauwe, B.: Soil Heterogeneity and Soil Fertility Gradients in Smallholder Farms of the East African Highlands, Soil Sci. Soc. Am. J., 77, 525–538, https://doi.org/10.2136/sssaj2012.0250, 2013. a
Todd-Brown, K. E. O., Randerson, J. T., Post, W. M., Hoffman, F. M., Tarnocai, C., Schuur, E. A. G., and Allison, S. D.: Causes of variation in soil carbon simulations from CMIP5 Earth system models and comparison with observations, Biogeosciences, 10, 1717–1736, https://doi.org/10.5194/bg-10-1717-2013, 2013. a
Van de Broek, M., Ghiasi, S., Decock, C., Hund, A., Abiven, S., Friedli, C., Werner, R. A., and Six, J.: The soil organic carbon stabilization potential of old and new wheat cultivars: a 13CO2-labeling study, Biogeosciences, 17, 2971–2986, https://doi.org/10.5194/bg-17-2971-2020, 2020. a
Vanlauwe, B. and Giller, K. E.: Popular myths around soil fertility management in sub-Saharan Africa, Agr. Ecosyst. Environ., 116, 34–46, https://doi.org/10.1016/j.agee.2006.03.016, 2006. a, b
Vanlauwe, B., Bationo, A., Chianu, J., Giller, K., Merckx, R., Mokwunye, U., Ohiokpehai, O., Pypers, P., Tabo, R., Shepherd, K., Smaling, E., Woomer, P., and Sanginga, N.: Integrated Soil Fertility Management: Operational Definition and Consequences for Implementation and Dissemination, Outlook Agr., 39, 17–24, https://doi.org/10.5367/000000010791169998, 2010. a
Vanlauwe, B., Descheemaeker, K., Giller, K. E., Huising, J., Merckx, R., Nziguheba, G., Wendt, J., and Zingore, S.: Integrated soil fertility management in sub-Saharan Africa: unravelling local adaptation, SOIL, 1, 491–508, https://doi.org/10.5194/soil-1-491-2015, 2015. a, b, c, d
Vanlauwe, B., Six, J., Laub, M., Mathu, S., and Mugendi, D.: ISFM/SOM long-term trials soil data, IITA [data set], https://doi.org/10.25502/wdh5-6c13/d, 2022. a, b
Veloso, M. G., Angers, D. A., Tiecher, T., Giacomini, S., Dieckow, J., and Bayer, C.: High carbon storage in a previously degraded subtropical soil under no-tillage with legume cover crops, Agr. Ecosyst. Environ., 268, 15–23, https://doi.org/10.1016/j.agee.2018.08.024, 2018. a
Wawire, A. W., Csorba, Á., Tóth, J. A., Michéli, E., Szalai, M., Mutuma, E., and Kovács, E.: Soil fertility management among smallholder farmers in Mount Kenya East region, Heliyon, 7, e06488, https://doi.org/10.1016/j.heliyon.2021.e06488, 2021. a
Wei, X., Shao, M., Gale, W., and Li, L.: Global pattern of soil carbon losses due to the conversion of forests to agricultural land, Sci. Rep.-UK, 4, 4062, https://doi.org/10.1038/srep04062, 2014. a
Wendt, J. W. and Hauser, S.: An equivalent soil mass procedure for monitoring soil organic carbon in multiple soil layers, Eur. J. Soil Sci., 64, 58–65, https://doi.org/10.1111/ejss.12002, 2013. a
Wiesmeier, M., Mayer, S., Burmeister, J., Hübner, R., and Kögel-Knabner, I.: Feasibility of the 4 per 1000 initiative in Bavaria: A reality check of agricultural soil management and carbon sequestration scenarios, Geoderma, 369, 114333, https://doi.org/10.1016/j.geoderma.2020.114333, 2020. a
Woomer, P. and Swift, M. J. (Eds.): The Biological Management of Tropical Soil Fertility, John Wiley, Chichester, UK, ISBN 978-0-471-95095-0, 1994. a
Xiao, Q., Huang, Y., Wu, L., Tian, Y., Wang, Q., Wang, B., Xu, M., and Zhang, W.: Long-term manuring increases microbial carbon use efficiency and mitigates priming effect via alleviated soil acidification and resource limitation, Biol. Fert. Soils, 57, 925–934, https://doi.org/10.1007/s00374-021-01583-z, 2021. a
Zech, W., Senesi, N., Guggenberger, G., Kaiser, K., Lehmann, J., Miano, T. M., Miltner, A., and Schroth, G.: Factors controlling humification and mineralization of soil organic matter in the tropics, Geoderma, 79, 117–161, https://doi.org/10.1016/S0016-7061(97)00040-2, 1997. a
Zha, Y., Wu, X.-P., Gong, F.-F., Xu, M.-G., Zhang, H.-M., Chen, L.-M., Huang, S.-M., and Cai, D.-X.: Long-term organic and inorganic fertilizations enhanced basic soil productivity in a fluvo-aquic soil, J. Integr. Agr., 14, 2477–2489, https://doi.org/10.1016/S2095-3119(15)61191-1, 2015. a
Zuur, A., Ieno, E. N., Walker, N., Saveliev, A. A., and Smith, G. M.: Mixed Effects Models and Extensions in Ecology with R, Statistics for Biology and Health, edited by: Gail, M., Krickeberg, K., Samet, J. M., Tsiatis, A., and Wong, W., Springer-Verlag, New York, https://doi.org/10.1007/978-0-387-87458-6, 2009. a