the Creative Commons Attribution 4.0 License.
the Creative Commons Attribution 4.0 License.
 | 02 May 2023
Elemental stoichiometry and Rock-Eval® thermal stability of organic matter in French topsoils
Amicie A. Delahaie
François Baudin
Dominique Arrouays
Antonio Bispo
Line Boulonne
Claire Chenu
Claudy Jolivet
Manuel P. Martin
Céline Ratié
Nicolas P. A. Saby
Florence Savignac
Lauric Cécillon
The quality and quantity of soil organic matter (SOM) are key elements that impact soil health and climate regulation by soils. The Rock-Eval® thermal analysis technique is becoming more commonly used, as it represents a powerful method for SOM characterization by providing insights into bulk SOM chemistry and thermal stability. In this study, we applied this technique on a large soil sample set from the first campaign (2000–2009) of the French Soil Quality Monitoring Network (RMQS – Réseau de mesures de la qualité des sols). Based on our analyses of ca. 2000 composite surface (0–30 cm) samples collected across mainland France, we observed a significant impact of land cover on both the SOM thermal stability and elemental stoichiometry. Cropland soils had a lower mean hydrogen index value (a proxy for the SOM ratio) and a higher thermal stability than grasslands and forests. Regarding the oxygen index (a proxy for the SOM ratio), we observed significant differences among the values for croplands, grasslands, and forests. Positive correlations of the temperature parameters with the clay content and pH highlight the protective effect of clay on organic matter as well as the impact of pH on microorganisms' mineralization activity. Surprisingly, we found weak effects of climatic parameters on the thermal stability and stoichiometry of SOM. Our data suggest that topsoil SOM is on average more oxidized and biogeochemically stable in croplands. More generally, the high number and even distribution of data across the whole French territory allow one to build a national interpretative reference for these indicators in surface soils.
- Article
(2933 KB) - Full-text XML
- BibTeX
- EndNote


The fate of soil organic carbon (SOC) is crucial from both soil health and climatic perspectives. In terms of soil health, SOC plays an important functional role. Its decomposition by microorganisms provides energy to the whole soil food web as well as key nutrients to plants and soil fauna. SOC also regulates the water cycle by controlling soil structure (Rawls et al., 2003). From a climatic perspective, soils can act as a source or a sink of carbon (Amundson, 2001; Eglin et al., 2010). Maintaining or increasing SOC stocks has become a key policy issue for the coming decades (Rumpel et al., 2018) that raises a number of important scientific challenges regarding our knowledge of SOC dynamics (Dignac et al., 2017).
The evolution of SOC stocks depends on the balance between soil carbon inputs (mostly by plants) and outputs (mostly by microbial decomposition). The persistence of SOC determines soil carbon outputs; thus, estimating the biogeochemical stability of SOC to microbial decomposition (i.e. the difficulty for microorganisms to mineralize SOC) is of paramount importance to infer SOC dynamics (Schmidt et al., 2011; Lehmann and Kleber, 2015). Indeed, a better knowledge of SOC persistence would allow us to refine our estimates of the soil carbon inputs needed to maintain or enhance SOC stocks. However, estimating the biogeochemical stability of SOC is a challenging task because its turnover time encompasses a broad spectrum (ranging from days or weeks to centuries; Balesdent and Guillet, 1982), resulting from a series of interacting SOC stabilization mechanisms. Indeed, SOC can be protected from microbial decomposition due to its chemical nature (e.g. pyrogenic SOC), its interactions with soil mineral surfaces, or its spatial inaccessibility for microbes (Baldock and Skjemstad, 2000; Von Lützow et al., 2006).
Several routine techniques have been proposed to separate fractions that are labile, intermediate, or stable at various timescales (von Lützow et al., 2007; Bispo et al., 2017; Chenu et al., 2015). However, none of these techniques manage to precisely isolate homogeneous fractions with the same biogeochemical stability (von Lützow et al., 2007; Poeplau et al., 2018; Cécillon et al., 2021). Common methods include biological respiration measurements performed during laboratory incubations of soils (e.g. Collins et al., 2000) and various physical (particle size or density) and/or chemical (aqueous or organic extraction) SOC fractionation methods (von Lützow et al., 2007).
Thermal analysis methods have been used for several decades to study the characteristics of soil organic matter (SOM). Many different methods, such as thermogravimetry, differential scanning calorimetry, and evolved gas analysis, exist that measure different variables (Plante et al., 2009). A multitude of variations in temperature ramps, compositions of reaction atmosphere, and measured parameters are encountered within each class of methods. Some thermal analysis methods provide indicators that are related to SOM biogeochemical stability: the more biogeochemically stable SOM is, the more thermally stable and depleted in energy and hydrogen it is (Barré et al., 2016; Sanderman and Grandy, 2020). Among thermal analysis methods, the use of Rock-Eval® thermal analysis is becoming increasingly common to derive thermal indicators related to SOC biogeochemical stability (Gregorich et al., 2015; Saenger et al., 2015; Cécillon et al., 2018, 2021; Poeplau et al., 2019; Chassé et al., 2021).
The Rock-Eval® method was developed in the 1970s. Initially intended for the characterization of petroleum source rocks and sediments in order to estimate their potential for hydrocarbon extraction (Espitalié et al., 1977), this method was then adapted to the study of SOM (Disnar et al., 2003). This technique allows for the measurement of the organic and inorganic carbon content of a soil sample as well as the measurement of numerous indicators of the thermal stability and elemental stoichiometry of SOM. Espitalié et al. (1977) showed that the Rock-Eval® hydrogen index (HI) and oxygen index (OIre6) are a good proxies for the respective and ratios of organic matter in kerogens and, later, soils. Many temperature parameters can also be calculated to provide insights into the thermal stability of SOM (Gregorich et al., 2015; Sebag et al., 2016; Cécillon et al., 2018). With a rate of one sample per hour at a reasonable price (below USD 50 per sample), Rock-Eval® thermal analysis is a particularly fast and simple tool to use; therefore, it is well suited to the study of large soil sample sets, such as those collected in the context of national or continental soil monitoring networks.
However, to date, the different existing global soil monitoring networks have not used thermal analysis methods to infer SOC biogeochemical stability. Some of them have focused on SOC physical fractionation schemes, in combination with infrared spectroscopy or environmental variables (e.g. Vos et al., 2018; Viscarra-Rossel et al., 2019; Lugato et al., 2021; Sanderman et al., 2021). Here, we used Rock-Eval® thermal analysis to investigate the thermal stability and elemental stoichiometry of topsoil samples of the first campaign of the French Soil Quality Monitoring Network (RMQS – Réseau de mesures de la qualité des sols; GisSol; https://www.gissol.fr/le-gis/programmes/rmqs-34, last access: 5 June 2022). The RMQS network has been designed for the long-term monitoring of the soil quality of the whole French territory; the network collects information and samples soils (every 15 years on average) at a set of 2170 sites located on a regular, square grid, forming a systematic sample (Jolivet et al., 2006; English version to be available online). The first campaign took place between 2000 and 2009 in mainland France, covering seven major land cover types (croplands, grasslands, forests, vineyards and orchards, wastelands, environments with little human disturbance, and gardens).
In this study, we first aimed to verify that the Rock-Eval® method was suitable to characterize SOM on archived soil samples at the scale of a monitoring network. For this purpose, we checked if the organic and inorganic carbon yields of the Rock-Eval® thermal analysis for soil samples, calculated by comparing Rock-Eval® estimates to reference methods, were acceptable. Second, we computed several common Rock-Eval®-based indicators in order to perform an unprecedented country-wide evaluation of the thermal stability and elemental composition of the SOM. Third, thanks to the numerous environmental data available at each RMQS site, we aimed to study the relationships between land cover, climate, and soil properties and the SOC-related indicators derived from Rock-Eval® thermal analysis.
2.1 Topsoil sampling and processing
A full description of the RMQS network and the soil sampling process of its first sampling campaign is available in Jolivet et al. (2006). Briefly, soil is monitored at locations across the French territory on a regular, square grid with a resolution of 16 km. Sampling sites were selected, when possible, at the centre of the cell; otherwise, an alternative site was selected within a 1 km radius of the centre of the cell. This resulted in a total of 2170 RMQS sites in mainland France. At each selected site, 25 topsoil samples (0–30 cm or tilled layer depths) were taken with a spiral soil auger from a 20 m × 20 m sampling area and then mixed to provide a composite sample. Subsoil samples were also taken, but they were not considered in the present study.
The composite samples (5 to 10 kg of bulk soil) were air-dried at 30 ∘C in trays for 8 to 10 d on average. The samples were then quartered according to NF ISO 11464 to obtain a subsample of ca. 650 g. They were then crushed by hand to break aggregates while preserving calcareous and/or ferro-manganic nodules and sieved at 2 mm. The remains of the composite samples were stored in water-tight plastic buckets. An aliquot of each air-dried and sieved composite sample was then finely ground using a Cyclotec 1093 (FOSS).
Of the 2170 archived aliquots of finely ground topsoil samples from the first RMQS sampling campaign in mainland France, 2037 were recovered and used for this study. When necessary, the samples were manually ground again using an agate mortar to reach the particle size requirements for Rock-Eval® thermal analysis of soils (below ca. 250 µm).
2.2 Physical and chemical soil analyses
Physical and chemical soil analyses were carried out on the 2 mm sieved composite samples at the Laboratoire d'Analyse des Sols (INRAE, Arras, France). Among the large set of soil properties measured, we selected the following in this study (Jolivet et al., 2006): particle size measurements without decarbonation, in grams per kilogram of sample (Robinson pipette and underwater sieving, method validated in relation to standard NF X31-107), leading to five fractions (clay: ≤ 2 µm; fine silt: 2–20 µm; coarse silt: 20–50 µm; fine sand: 50–200 µm; and coarse sand: 200–2000 µm); pH in a suspension of soil diluted with water (dilution 1 : 5, NF ISO 10390); total carbonate content, in grams per kilogram of sample (volumetric method, NF EN ISO 10693), to estimate the total inorganic carbon, calculated as Cinorg = Total carbonate × 0.12; total carbon content, in grams per kilogram of sample, determined by elemental analysis using dry combustion on non-decarbonated soil; organic carbon content derived from the elemental analysis (TOCea), in grams per kilogram of sample, calculated as Total carbon – Cinorg (NF ISO 10694); total nitrogen, in grams per kilogram of sample (dry combustion, NF ISO 13878); cation exchange capacity (CEC), in centimoles per kilogram of sample (cobaltihexammine chloride extraction, NF X31-130); and free iron oxides, in grams per 100 g, measured with the Tamm method in the dark and Mehra–Jackson method (INRA standard/NF ISO 22036).
2.3 Rock-Eval® thermal analysis
2.3.1 Thermal analysis process
Rock-Eval® thermal analyses on the 2037 recovered samples were carried out at the ISTeP – UMR 7193 (Sorbonne Université, Paris, France) according to the routine classically used for soil samples (Disnar et al., 2003; Baudin et al., 2015). Approximately 60 mg of each finely ground topsoil sample was used for the Rock-Eval® thermal analysis on a RE6 turbo device (Vinci Technologies, 2021). For each analysis, the sample was placed in a special high-temperature-resistant stainless-steel pod, allowing the transport gas to pass through. It first underwent a pyrolysis step under an inert N2 atmosphere. After a 3 min isotherm at 200 ∘C, the sample was heated to 650 ∘C following a temperature ramp of 30 ∘C min−1. The flame ionization detector (FID) monitored the gaseous emissions of carbon from hydrocarbon compounds (HC_PYR Rock-Eval® thermogram), while CO (CO_PYR Rock-Eval® thermogram) and CO2 (CO2_PYR Rock-Eval® thermogram) were detected by an infrared detector. The second step is an oxidation (laboratory air atmosphere with CO2 and H2O previously removed, i.e. in the presence of oxygen): the sample experienced a 1 min isotherm at 300 ∘C, was raised to 850 ∘C following a 20 ∘C min−1 ramp, and finally remained at a 5 min isotherm at 850 ∘C. The evolution of CO and CO2 was again monitored using the infrared detector during the oxidation phase (CO_OX and CO2_OX Rock-Eval® thermograms). The five resulting thermograms were processed using the Geoworks software (Geoworks V1.6R2, Vinci Technologies, 2021), except for the R-index and I-index parameters (defined in Sect. 2.3.2) which were computed using homemade Python scripts according to the formula proposed by Sebag et al. (2016).
Our Rock-Eval® thermal analyses campaign included duplicate soil analyses (one every eight samples), which were performed in order to check the reproducibility of the analyses, along with standard analyses (one every nine samples) to check the calibration of the device and identify possible drift in the analysis. The Rock-Eval® thermal analysis of a soil sample measures its total organic carbon (TOCre6) and total inorganic carbon (MinC) contents that sum to the total carbon content (see Behar et al., 2001, for a detailed description). The organic carbon yield of Rock-Eval® thermal analysis was defined as TOCre6 TOCea, its inorganic carbon yield was defined as MinC Cinorg, and its total carbon yield was defined as (TOCre6 + MinC) (TOCea + Cinorg). We used the organic carbon yield of Rock-Eval® thermal analysis to select soil samples among duplicates: only the one with the best yield was conserved. When assessing SOM thermal stability and elemental stoichiometry, it is essential to ensure that SOM analysed by the thermal analysis method corresponds to SOM measured using the reference elemental analysis method. Therefore, we proposed a quality criterion for Rock-Eval® thermal analysis based on its organic carbon yield, with an arbitrary acceptable range of yields from 0.7 to 1.3.
2.3.2 Rock-Eval® parameters
Many usual Rock-Eval® parameters were calculated from the thermograms (Table A1 in the Appendix). First, there are parameters related to carbon quantities: the total organic carbon (TOCre6; grams per kilogram of sample); the total inorganic carbon (MinC; grams per kilogram of sample); the amount of pyrolyzable organic carbon (PC; grams per kilogram of sample); the ratio of pyrolyzable organic carbon over total organic carbon (PCM / TOCre6; no unit); the carbon released during the first pyrolysis isotherm (PseudoS1; grams per kilogram of sample); the carbon released as hydrocarbons during pyrolysis except during the first isotherm (S2; grams per kilogram of sample); and the ratio of carbon released as hydrocarbons during pyrolysis except during the first isotherm over the pyrolyzable organic carbon (S2 / PC; no unit). Second, there are temperature parameters related to the SOC thermal stability. Their calculation was performed over different intervals of integration depending on the thermogram. The upper limits of the integration ranges were selected to exclude CO and CO2 signals derived from carbonates. The temperature parameters T50_HC_PYR, T70_HC_PYR, and T90_HC_PYR (∘C) are defined as the respective temperatures at which 50 %, 70 %, and 90 % of the hydrocarbon effluents have been emitted during the pyrolysis ramp (the initial isotherm is excluded; the integration ends at 650 ∘C). Similarly, T30_CO2_PYR, T50_CO2_PYR, T70_CO2_PYR, and T90_CO2_PYR (∘C) are the temperatures at which 30 %, 50 %, 70 %, and 90 % of the CO2 has been emitted during the pyrolysis ramp (the beginning isotherm is excluded; the integration ends at 560 ∘C); T50_CO_PYR (∘C) is the temperature at which 50 % of the CO has been emitted during the pyrolysis ramp (the beginning isotherm is excluded; the integration ends at 560 ∘C). T50_CO2_OX, T70_CO2_OX, and T90_CO2_OX (∘C) are the respective temperatures at which 50 %, 70 %, and 90 % of the CO2 has been emitted during the oxidation phase (the integration ends at 611 ∘C); T50_CO_OX and T70_CO_OX (∘C) are the respective temperatures at which 50 % and 70 % of the CO has been emitted during the oxidation phase (the integration ends at 850 ∘C). We also calculated two other parameters previously used in assessing the thermal stability of SOC: the I index, which is related to the thermolabile organic carbon released as hydrocarbon effluents (no unit; Sebag et al., 2016) and the R index, which is the proportion of thermostable organic carbon released as hydrocarbon effluents after 400 ∘C (no unit; Sebag et al., 2016). Finally, we calculated three Rock-Eval® parameters, related to the SOM stoichiometry, as outlined in the following. The hydrogen index (HI) is the ratio of emitted hydrocarbons to TOCre6 (in grams of hydrocarbons per kilogram of TOCre6); it is calculated as follows:
where S2 is the hydrocarbon signal during pyrolysis (Behar et al., 2001). The oxygen index (OIre6) is the ratio of organic oxygen to TOCre6 (in grams of O2 per kilogram of TOCre6); it is calculated as follows:
where S3 and S3CO are the organic CO2 and organic CO signals during pyrolysis, respectively (Behar et al., 2001; Cécillon et al., 2018). The ratio of the hydrogen amount to the oxygen amount is HI OIre6 (no unit).
As presented above, the treatment of the five thermograms can result in the production of a multitude of Rock-Eval® parameters. We have decided to present the results of the following parameters in more detail: T50_HC_PYR, T90_HC_PYR, T50_CO2_PYR, T50_CO2_OX, the I index, the R index, HI, and OIre6. The results obtained for some other Rock-Eval® parameters are presented in Table A2 in the Appendix. The temperature parameters T90_HC_PYR, T50_CO2_PYR, and T50_CO2_OX were selected for two reasons: (1) they are derived from the three different thermograms contributing the most to the Rock-Eval® signals; (2) they are well correlated with the proportion of centennially stable SOC in temperate soils (Cécillon et al., 2021) and have been used in some previous studies (e.g. Barré et al., 2016; Poeplau et al., 2019). The T50_HC_PYR, I-index, and R-index parameters were selected because they have been used in several previous studies (e.g. Gregorich et al., 2015; Sebag et al., 2016; Matteodo et al., 2018; Soucémarianadin et al., 2018). HI and OIre6 were selected because they are usual Rock-Eval® parameters and provide insights into the elemental stoichiometry of SOM.
2.4 Climate data
Climate data were extracted from the French SAFRAN database (https://publitheque.meteo.fr/okapi/accueil/okapiWebPubli/index.jsp, last access: 31 March 2022). The daily data were averaged over the 1969–1999 period in order to compute the mean annual temperature (MAT) and mean annual precipitation (MAP) for each site.
2.5 Statistical analysis
We calculated linear regressions without an intercept using the measurements of the organic, inorganic, and total carbon yield of Rock-Eval® thermal analysis to verify the ability of the Rock-Eval® thermal analysis to accurately measure the carbon amount of the samples. We chose to use no intercepts because the analysis of several empty pods only showed a very weak signal (TOCre6 < 0.2 g C kg−1).
All of the samples collected from the systematic sampling grid, regardless of their land cover, were analysed using Rock-Eval thermal analysis. This included 847 croplands, 571 forests, 496 grasslands, 57 vineyards, 16 wastelands, 46 sites with little human disturbance, and 4 gardens. Considering the very small number of samples for wastelands and gardens compared with the whole set, we decided not to include them in the following statistical treatments regarding land covers. The number of samples comprising environments with little human disturbance can be considered sufficient for statistical treatment; however, these samples represent a very heterogeneous set (10 miscellaneous subclasses, such as peatlands, alpine grasslands, water edge vegetation, heath, and dry siliceous meadows). Thus, we did not consider it relevant to analyse them as a whole.
To assess the effect of land cover on the Rock-Eval® parameters, we performed pairwise comparisons of medians using non-parametric Kruskal–Wallis tests (p<0.05) followed by Wilcoxon tests, with p<0.05 for each pair. The correction of p values within the framework of the multiple comparisons was done using the Holm–Bonferroni method. Correlations between parameters were calculated using the Spearman method. We conducted a principal component analysis (with the FactoMineR R library; Lê and Husson, 2008) using all of the observations and 11 pedoclimatic parameters: clay, total silt and total sand contents, pH in water, residual water content, carbonate content, mean annual temperature, mean annual precipitation, Tamm and Mehra–Jackson iron oxyhydroxide contents, and the ratio (Fig. A2 in the Appendix). The data processing and statistical analysis were carried out using R software (V4.1.2; R Core Team 2021): the base, datasets, graphics, grDevices, methods, stats, and utils packages were already integrated to R, and the corrplot (Wei and Simko, 2021), car (Fox and Weisberg, 2019), ggplot2 (Wickham, 2016), ggpubr (Kassambara, 2020), factoextra (Kassambara and Mundt, 2020), plot3D (Soetaert, 2021), rstatix (Kassambara, 2021), sf (Pebesma, 2018), and tmap (Tennekes, 2018) packages were added. The point maps of the Rock-Eval® hydrogen index and T50_CO2_PYR values were obtained using the tmap and sf R packages.
3.1 Carbon yields of Rock-Eval® thermal analysis
Figure 1a presents TOCre6 plotted against TOCea. We observed a high correlation (R2 = 0.96, n=2037), despite a few points far from the regression line, and an average carbon yield, corresponding to the slope of the regression, equal to 86 %. Limiting the Rock-Eval® dataset to samples passing our quality check with respect to the Rock-Eval® organic carbon yields (yields ranging from 0.7 and 1.3) led to the omission of 145 samples. Another sample was left out because of its TOC content: with a TOC value of 0.57 g kg−1, this sample contained too little organic carbon for the data from the Rock-Eval® thermal analysis to be routinely exploitable (Khedim et al., 2021). The remaining sample set consisted of samples from 785 croplands, 526 forests, 481 grasslands, 42 vineyards, 14 wastelands, 40 sites with little human disturbance, and 3 gardens. A principal components analysis (PCA) conducted on all of the topsoil samples showed no cluster for the samples with poor organic carbon yields (“rejected”) compared with the samples with good yields (“accepted”) (Fig. A2 in the Appendix). However, there was a significant difference between the medians of the two groups for many pedoclimatic parameters. In particular, the total sand content was on average 76 % higher in the rejected samples compared with accepted samples (101 % higher for the coarse sand and 35 % higher for the fine sand), and the carbonate content was also 67 % higher in the rejected samples compared with accepted samples.
The remaining sample selection logically showed a better agreement between TOCre6 and TOCea, although with lower TOCre6 values on average compared with TOCea (Rock-Eval® organic carbon yield of 0.87, R2 = 0.99, n=1891; Fig. 1b). The inorganic carbon content for this sample selection was slightly overestimated by the Rock-Eval® thermal analysis (Rock-Eval® inorganic carbon yield of 1.07, R2 = 0.98, n=1891). Finally, the total carbon content measured with Rock-Eval® thermal analysis for this sample selection is consistent with the total carbon measured using the elemental analysis (Rock-Eval® total carbon yield of 0.96, R2 = 0.99, n=1891).
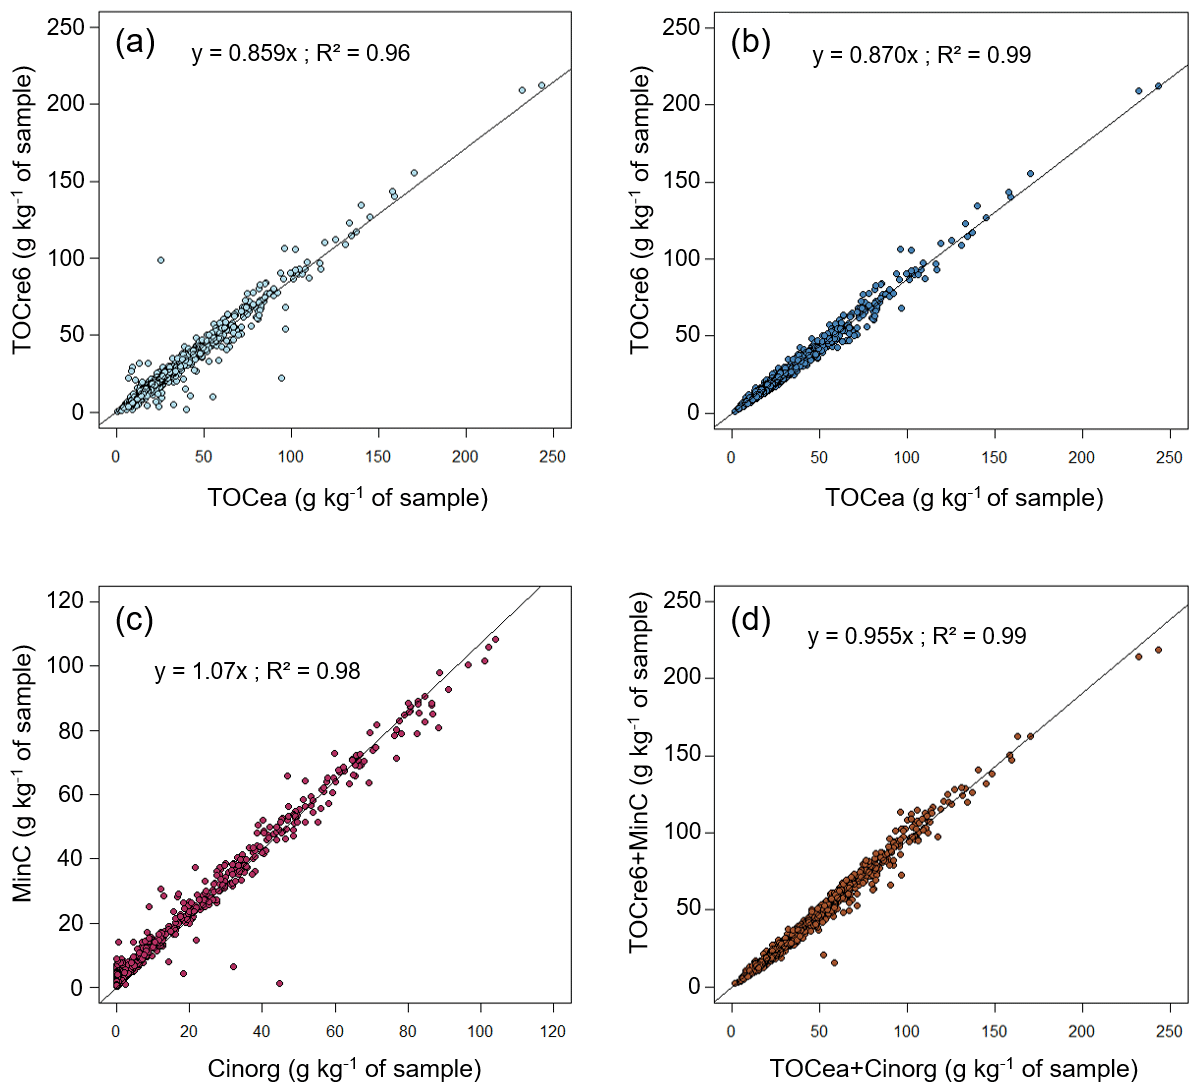
Figure 1Carbon yields of Rock-Eval® thermal analysis. Panel (a) presents the organic carbon yield of TOCre6 as a function of TOCea for all analysed RMQS topsoil (0–30 cm) samples. Panel (b) shows the organic carbon yield of TOCre6 as a function of TOCea for the RMQS topsoil samples limited to those with Rock-Eval® organic carbon yields ranging from 0.7 to 1.3. Panel (c) presents the inorganic carbon yield of MinC as a function of Cinorg for the RMQS topsoil samples limited to those with Rock-Eval® organic carbon yields ranging from 0.7 to 1.3. Panel (d) shows the total carbon yield of TOCre6 + MinC as a function of TOCea + Cinorg for the RMQS topsoil samples limited to those with Rock-Eval® organic carbon yields ranging from 0.7 to 1.3.
3.2 Soil organic matter thermal stability in French topsoils and its relationships with land cover
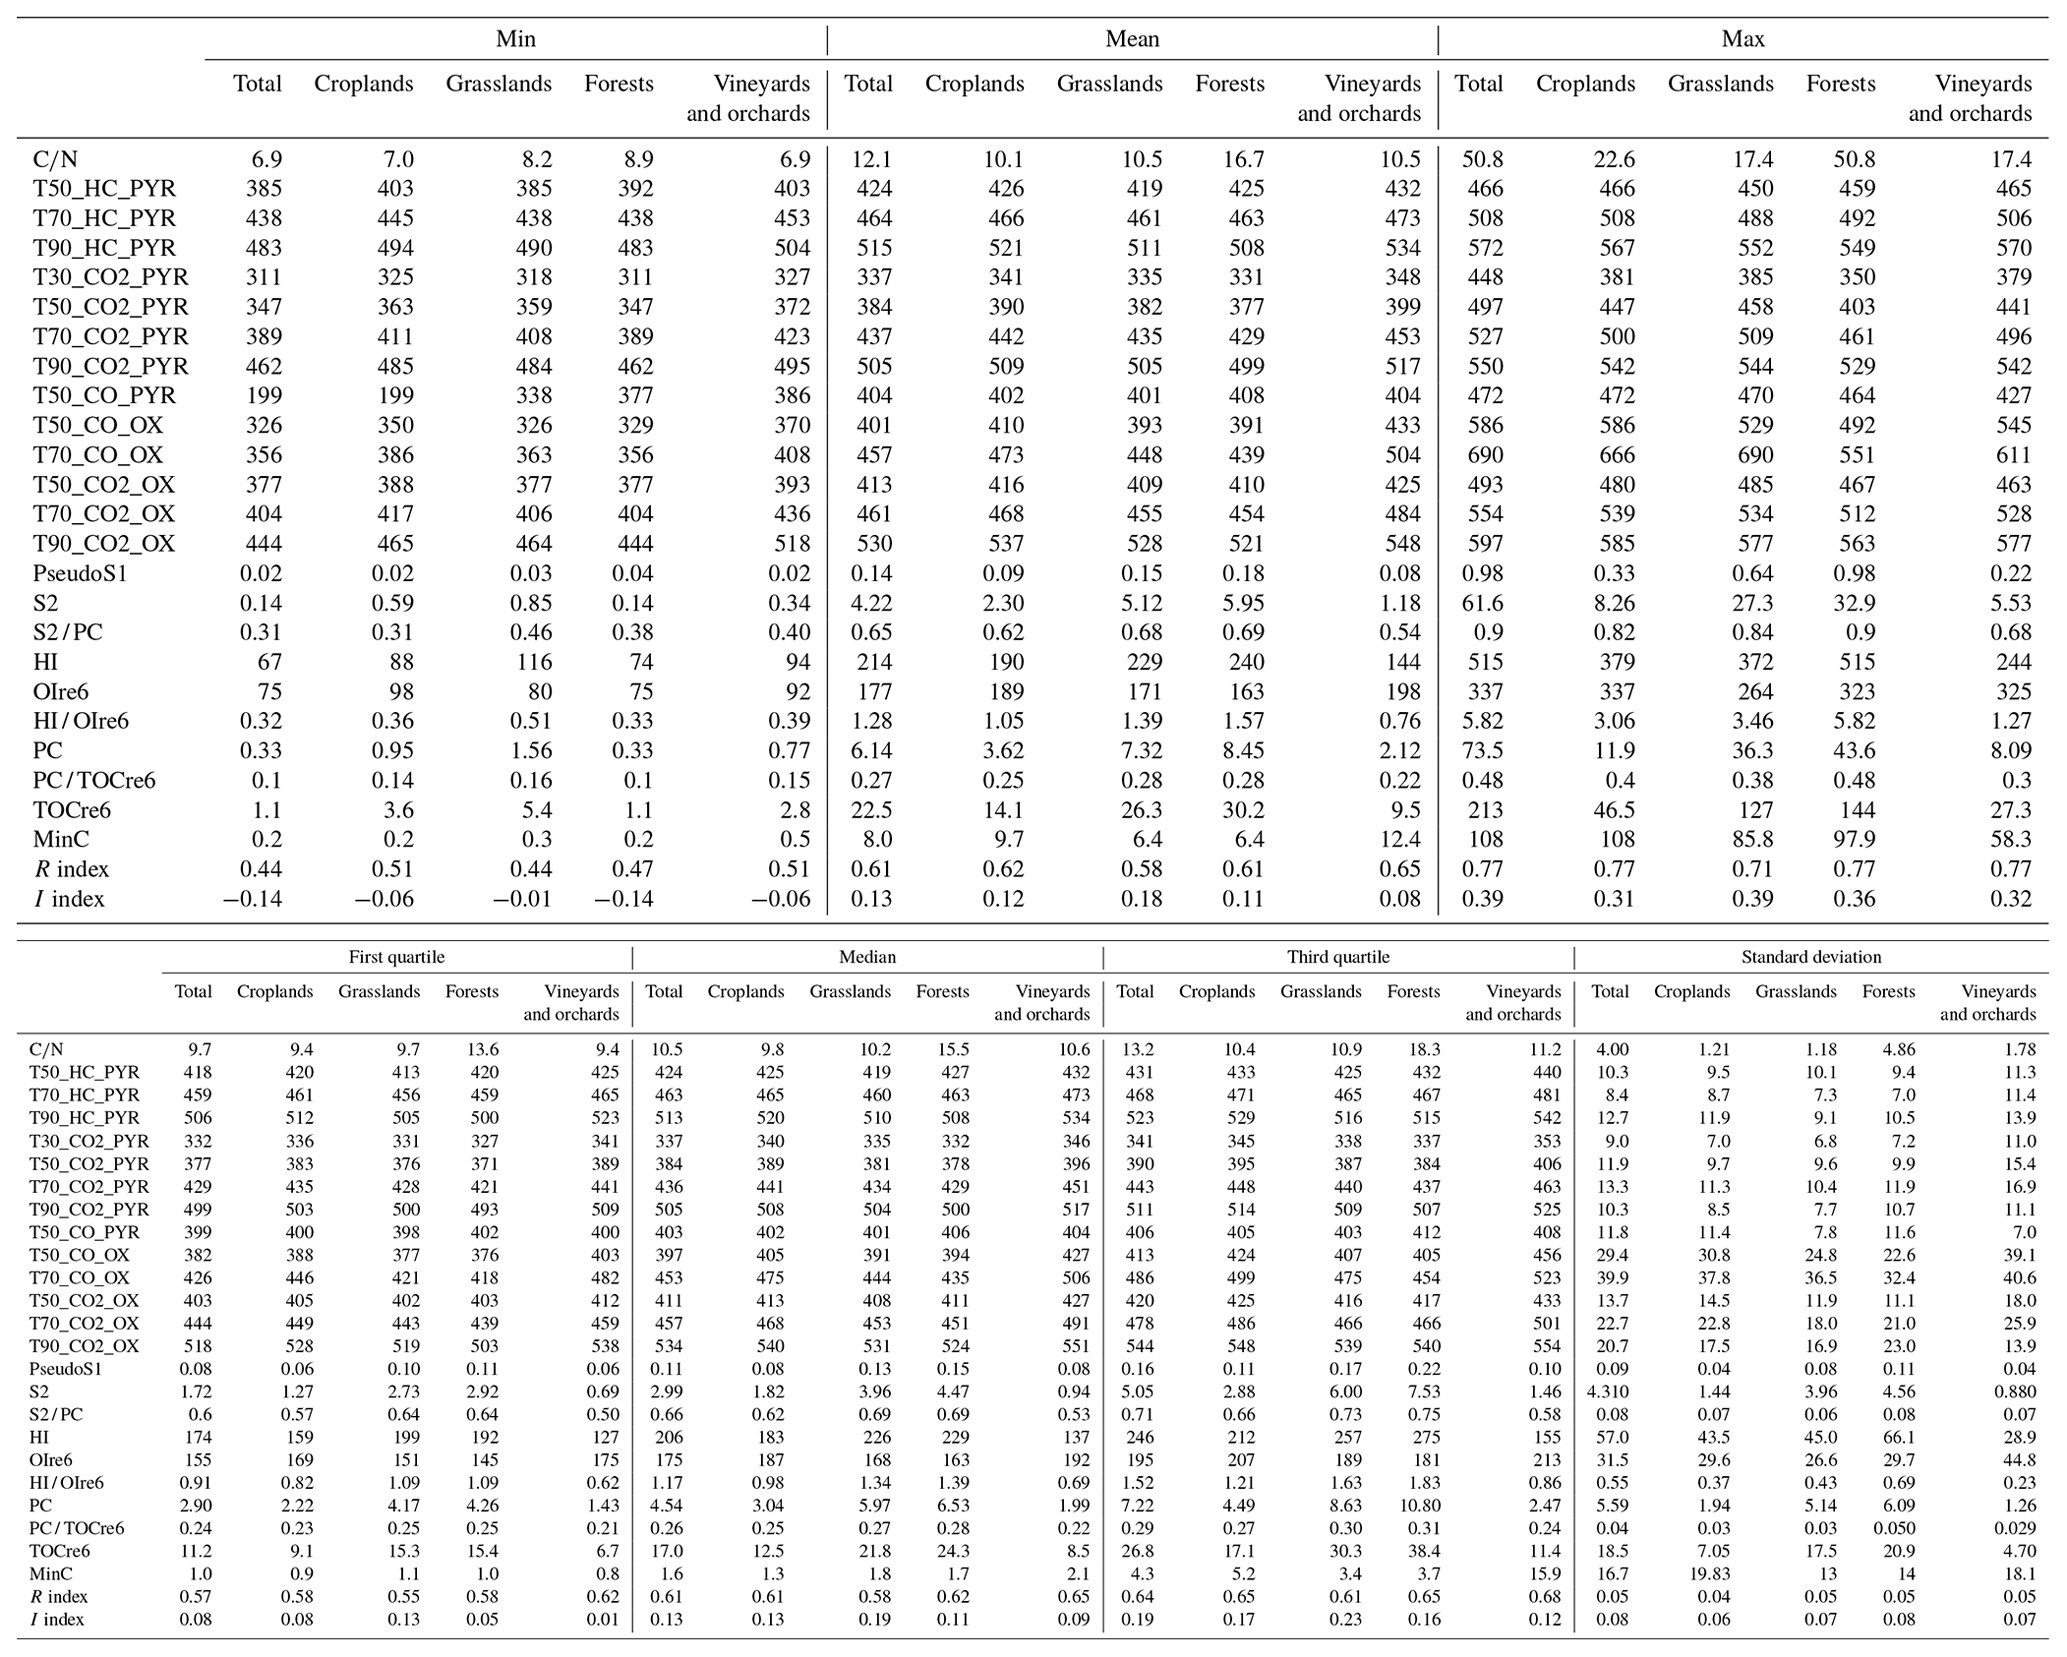
The summary statistics of many different Rock-Eval® temperature parameters for the 1891 RMQS topsoil samples with satisfactory Rock-Eval® organic carbon yields are compiled in Table A2 in the Appendix.
Figure 2 shows the box plots for the six selected parameters (T50_HC_PYR, T90_HC_PYR, T50_CO2_PYR, T50_CO2_OX, the I index, and the R index), focusing on the four major land cover types.

Figure 2Effect of land cover on topsoil organic carbon thermal stability for the RMQS topsoil (0–30 cm) samples under the four major land covers in France: croplands, forests, grasslands, and vineyards and orchards. The individual panels show the (a) T90_HC_PYR distribution, (b) T50_CO2_PYR distribution, (c) T50_CO2_OX distribution, (d) T50_HC_PYR distribution, (e) I-index distribution, and (f) R-index distribution. Samples are limited to those with Rock-Eval® organic carbon yields ranging from 0.7 to 1.3. For the box plots, the solid black midline in each box is the median, the lower and upper edges are the respective first (Q1) and third (Q3) quartiles, and the lower and upper whiskers are the maximum between the minimum value or the first quartile minus 1.5 times the interquartile range (max [min; (Q3–Q1)]) and the minimum between the maximum or the third quartile plus 1.5 times the interquartile range (min [max; (Q3–Q1)]), respectively. Different letters indicate significant differences in the distribution of the values for the land uses according to a Kruskal–Wallis test (p<0.05) and a pairwise Wilcoxon rank sum test (p<0.05). The box width is proportional to the square root of n.
We observed similar results for the temperature parameters T90_HC_PYR, T50_CO2_PYR, and T50_CO2_OX: thermal stability was significantly higher in croplands and in vineyards and orchards compared with forests and grasslands. Topsoil organic carbon was slightly but significantly less thermally stable in forests than in grasslands (Fig. 2a, b, c). Notably, three other Rock-Eval® parameters related to SOC thermal stability in the HC_PYR thermogram (T50_HC_PYR, the I index, and the R index) showed a different response to land cover (Fig. 2d, e, f). T50_HC_PYR and the R index indicated no significant difference in thermal stability in forests and croplands. The I index indicated a value that was significantly lower in forests than in croplands.
3.3 Elemental stoichiometry of soil organic matter in French topsoils and its relationships with land cover
The summary statistics of different elemental stoichiometry parameters for the 1891 RMQS topsoil samples with satisfactory Rock-Eval® organic carbon yields are compiled in Table A2 in the Appendix. The HI, OIre6, and mean values are 214 g of hydrocarbons per kilogram of TOCre6, 177 g of O2 per kilogram of TOCre6, and 12.05, respectively.
We observed significantly higher average HI values in both grasslands and forests compared with croplands and with vineyards and orchards (Figs. 3, A1b). In contrast, grasslands and forests showed smaller OIre6 values compared with croplands and with vineyards and orchards (Figs. 3, A1c).
In addition, Fig. 3 highlights that the distribution of the ratio on the Rock-Eval® pseudo van Krevelen diagrams (HI =f(OIre6)) depends on land cover. We observed a slight trend in the ratio with the hydrogen and oxygen indices: the ratio was higher for high HI and low OIre6. This trend was more pronounced for croplands and forests.
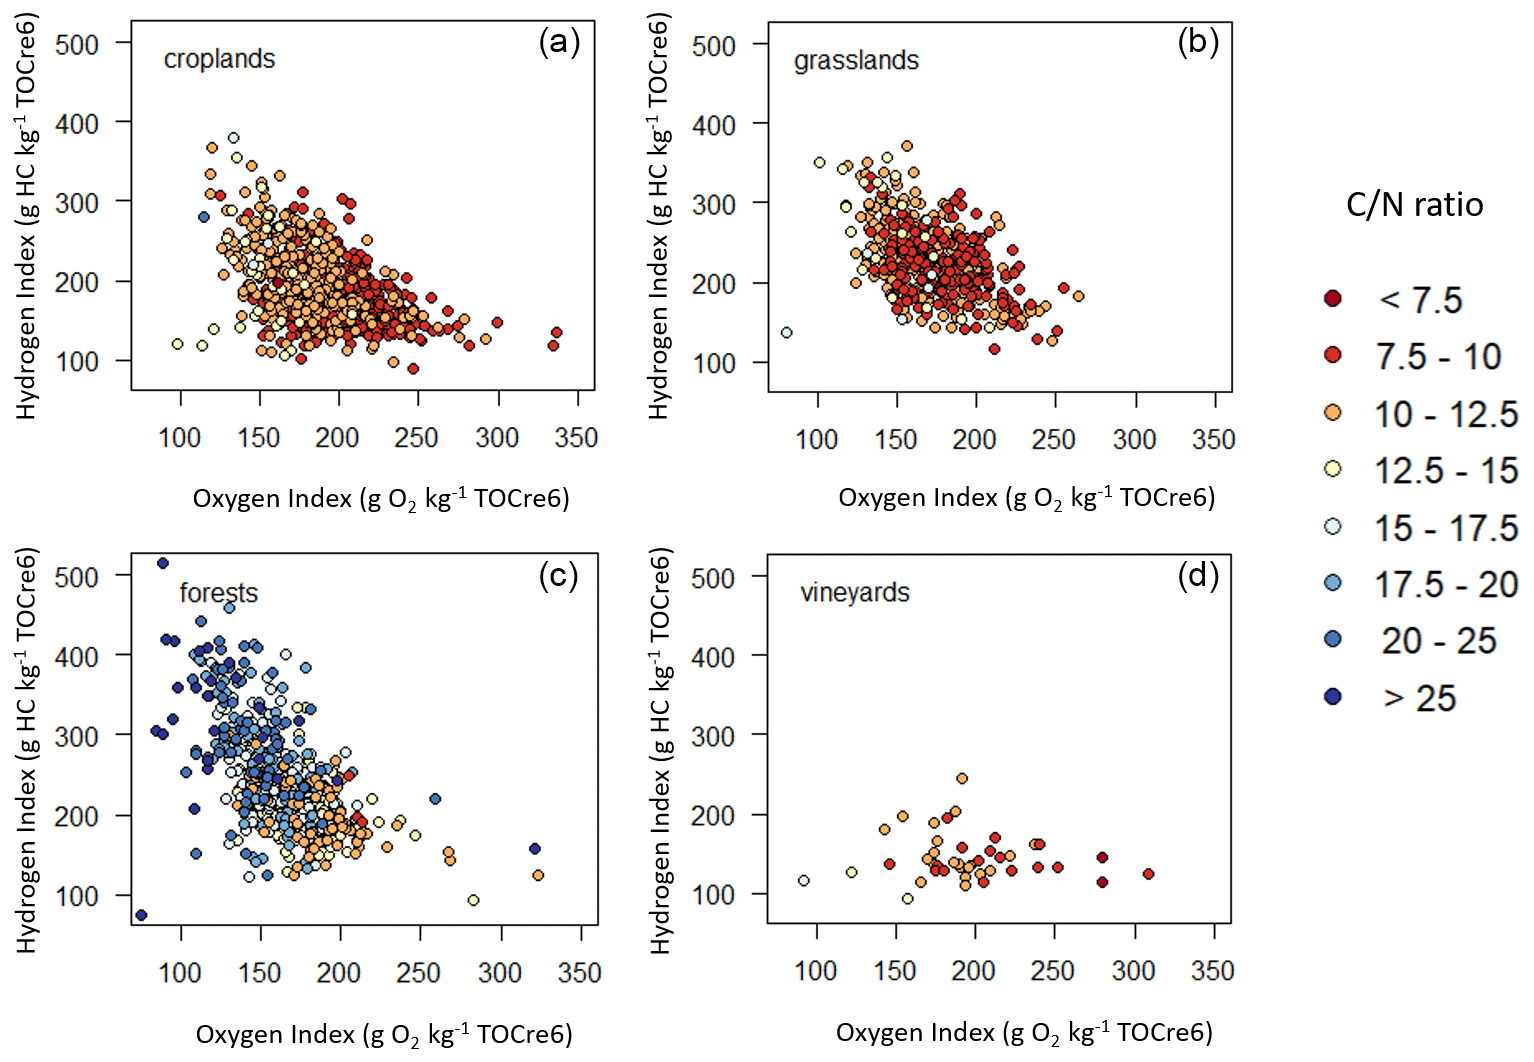
Figure 3Rock-Eval® pseudo van Krevelen diagrams (hydrogen index = f(oxygen index)) for the RMQS topsoil (0–30 cm) samples in (a) croplands, (b) grasslands, (c) forests, and (d) vineyards and orchards. Colours indicate the values of the ratio. Samples are limited to those with Rock-Eval® organic carbon yields ranging from 0.7 to 1.3.
3.4 Correlations between Rock-Eval® indicators of SOM thermal stability and elemental stoichiometry and pedoclimate
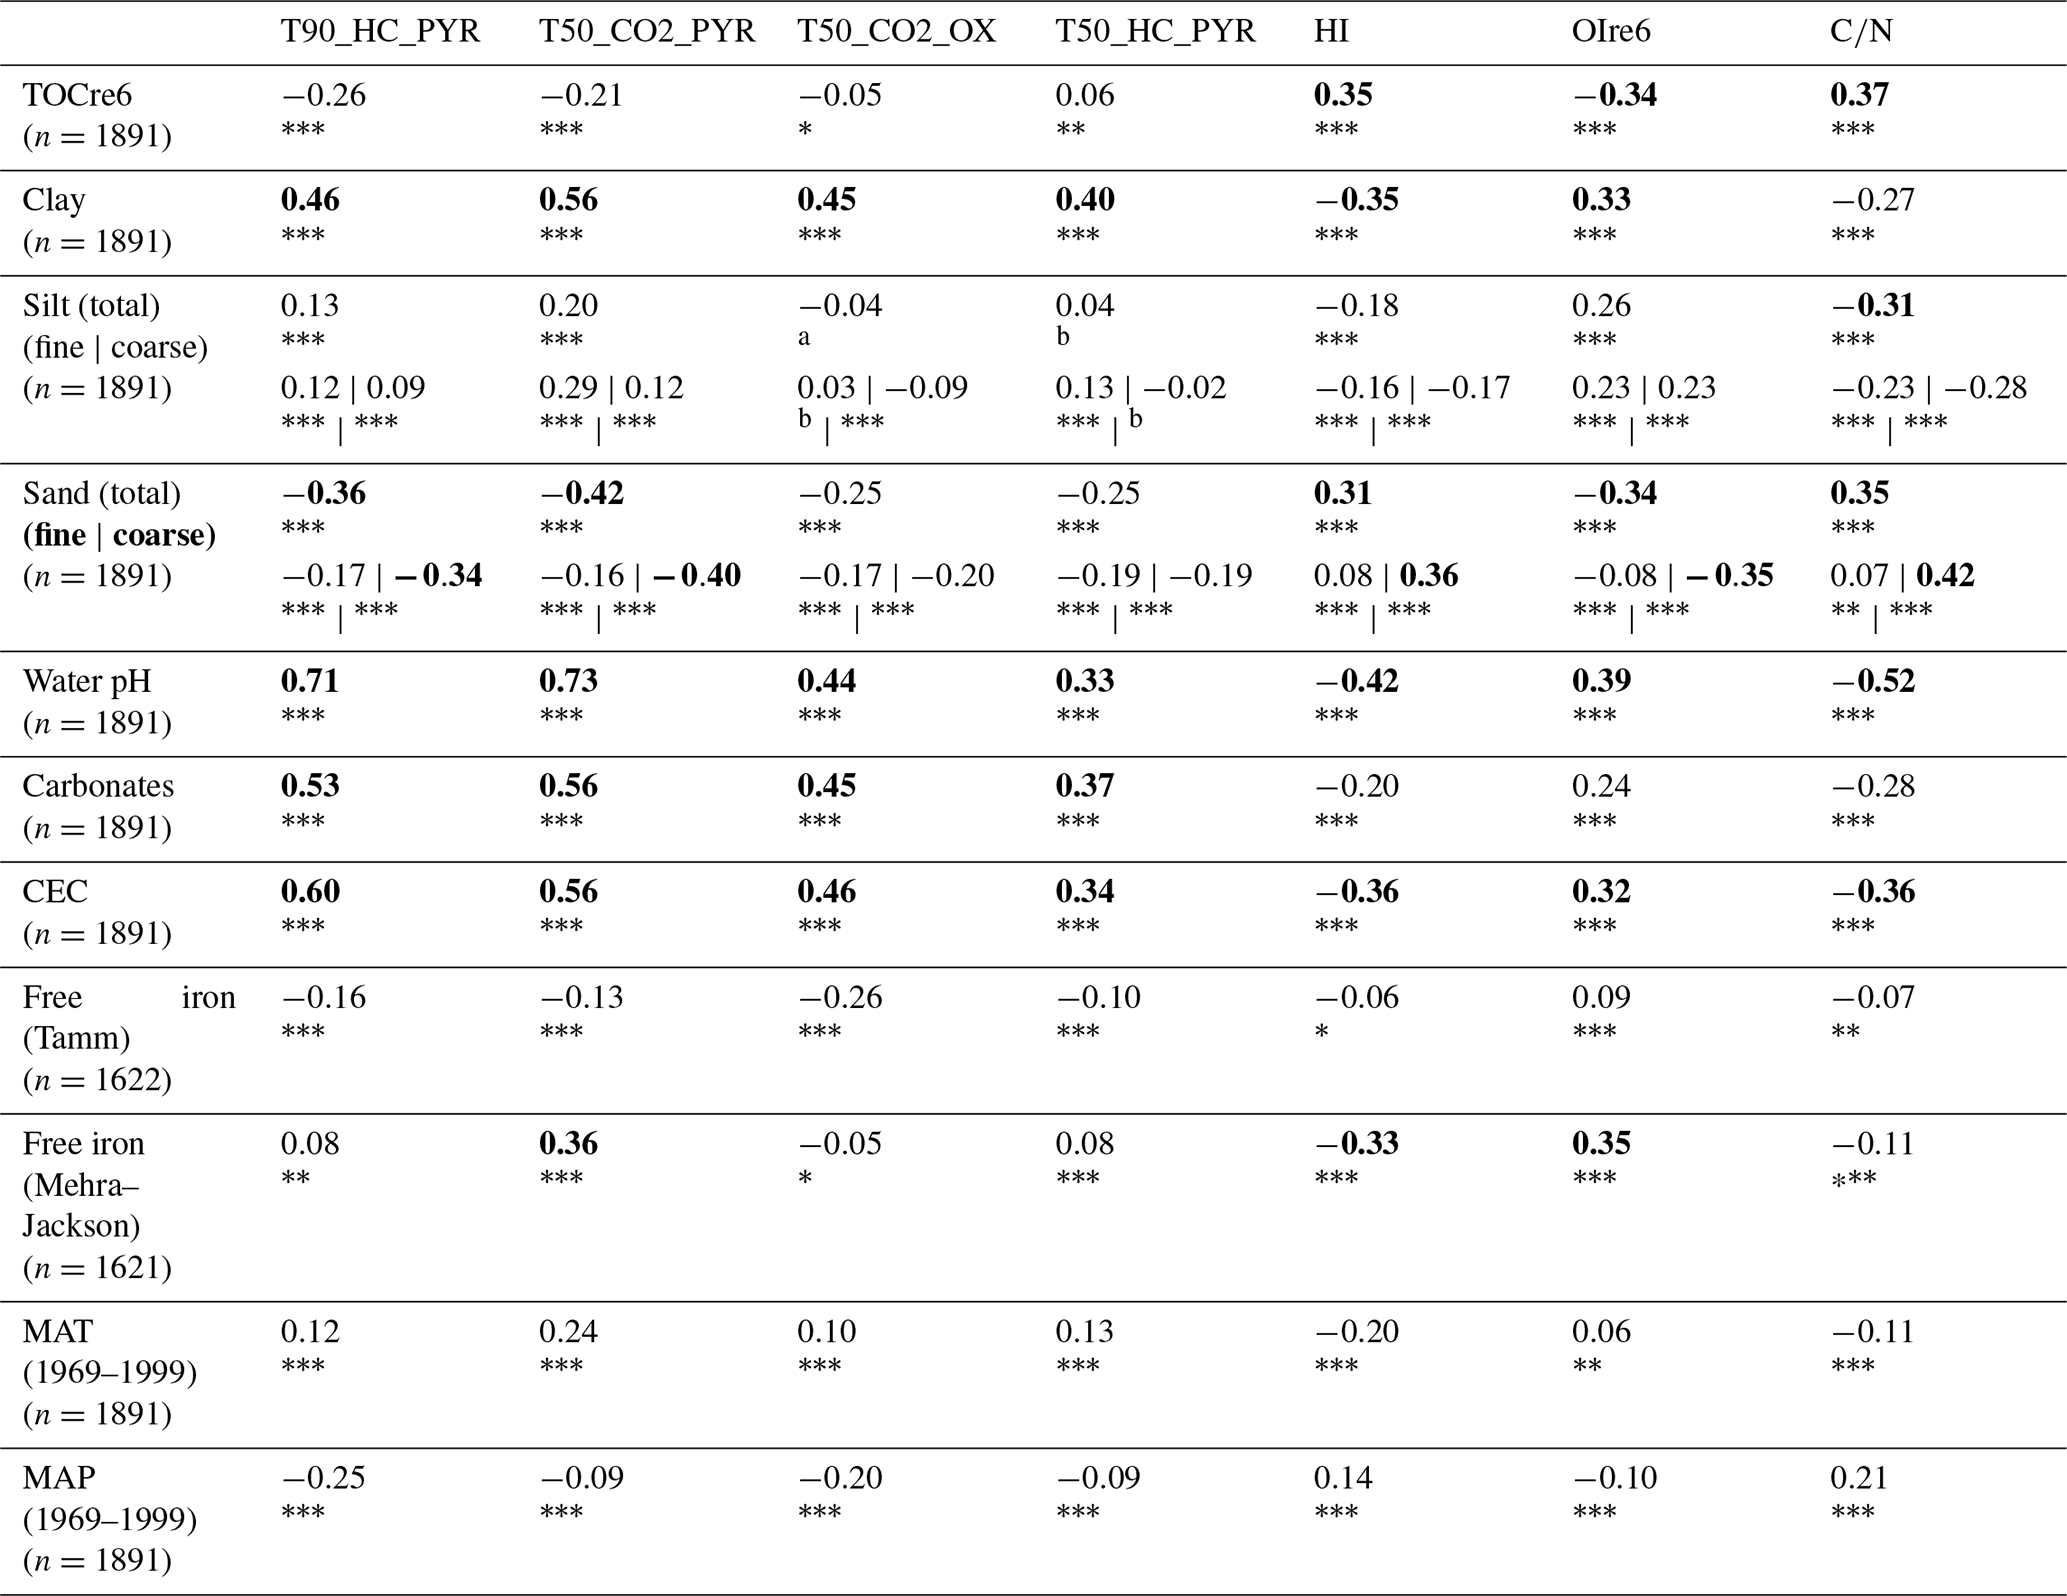
Table 1 presents the Spearman correlation coefficient values of the Rock-Eval® temperature and stoichiometric parameters with the selected pedoclimatic variables. The three selected temperature parameters (T90_HC_PYR, T50_CO2_PYR, and T50_CO2_OX) correlated significantly and positively with the clay content and negatively with the sand content. T90_HC_PYR and T50_CO2_PYR also correlated positively with silt content, although with smaller correlation coefficient values. They strongly and positively (correlation coefficient >0.3) correlated with the water pH, the carbonate content, and the cation exchange capacity, whereas the relationships with the iron oxyhydroxide content were much lower. The three selected temperature parameters were all significantly positively correlated with the mean annual temperature (MAT), and they were negatively correlated with the mean annual precipitation (MAP), although the correlations were weak.
Regarding the indicators of SOM stoichiometry, HI and correlated negatively with the clay and silt contents, whereas OIre6 correlated positively with these parameters. HI and also correlated negatively with the pH, the cation exchange capacity, and (to a lesser extent) with the carbonate content. They showed a slight negative correlation with the iron oxyhydroxide content measured using the Mehra–Jackson method. As for the thermal parameters, correlations with the climatic variables were smaller on average.
Additionally, the correlation coefficients of TOCre6 with HI, OIre6, , T90_HC_PYR, T50_CO2_PYR, and T50_CO2_OX were 0.35, −0.34, 0.37, −0.26, −0.21, and −0.05, respectively.
Table 1Spearman correlation coefficients of the Rock-Eval® temperature and stoichiometric parameters with the following pedoclimatic variables for the RMQS topsoil (0–30 cm) samples: TOCre6, particle size distribution, pH in water, carbonate content, cation exchange capacity (CEC), iron oxyhydroxides, mean annual temperature (MAT) averaged over 1969–1999, and mean annual precipitation (MAP) averaged over 1969–1999. The analysis was limited to samples with Rock-Eval® organic carbon yields ranging from 0.7 to 1.3. Absolute values ≥ 0.3 are in bold. The asterisks and superscript letters indicate the p value: between 0 and 0.001, between 0.001 and 0.01, * between 0.01 and 0.05, a between 0.05 and 0.1, and b >0.1.
3.5 Distribution of some Rock-Eval® indicators of SOM thermal stability and elemental stoichiometry over the French mainland territory
Figure 4 shows the point maps of the HI and T50_CO2_PYR values over the French mainland territory. The missing topsoil samples (133 not included in the initial sample set and 146 rejected due to poor C yields) are distributed over the whole territory with some clusters in the north of the French Alps, the north-east, Corsica, the south-east, and in Landes. The first three clusters come from the 133 samples not included in the initial set. The Landes and south-east clusters are from both the absent samples and the rejected samples: in particular, the soils in Landes contain more sand on average, which is characteristic – as stated above – of the rejected samples. Visually, we noticed an autocorrelation of the values, with HI and T50_CO2_PYR presenting opposite trends on average (the Spearman correlation coefficient between HI and T50_CO2_PYR is −0.69). Mountainous regions (notably the French Alps, the Pyrenees, and the Massif Central) exhibit higher HI values and lower SOC thermal stability. Conversely, plain areas usually presented higher SOC thermal stability and lower HI values, such as in the Paris Basin and in the south-western and south-eastern parts of the country. Brittany, Normandy, and Landes are somewhat exceptions to this rule, as they show high HI values and a relatively low SOC thermal stability. Figure 5 shows the land cover at each sampling site.
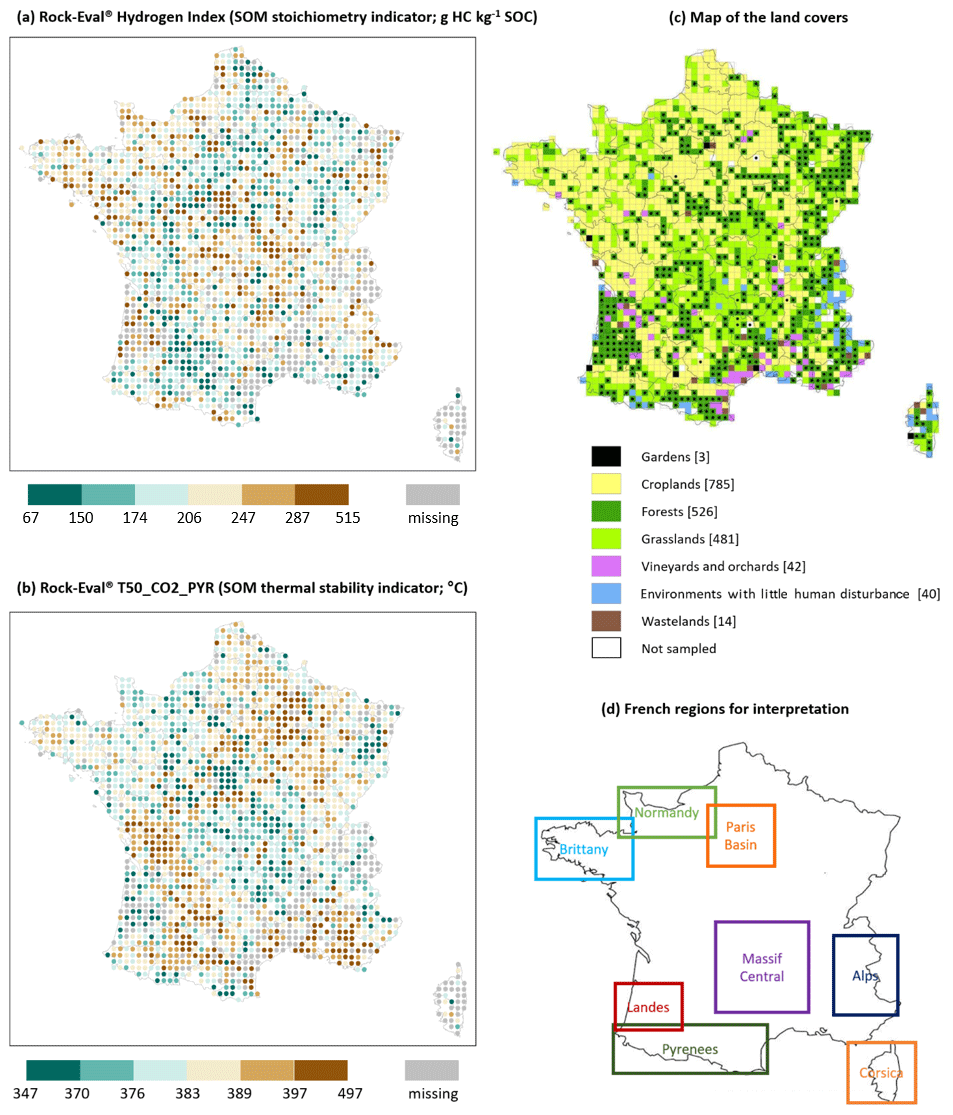
Figure 4Point maps of two Rock-Eval® parameters – (a) hydrogen index values and (b) T50_CO2_PYR values – on the French mainland territory for the RMQS topsoil (0–30 cm) samples; (c) a map of the land cover at each sampling site (the numbers in square brackets correspond to the number of sites for each land cover in our final dataset; n=1891), modified from Jolivet (2011); and (d) a map of the main regions used for the interpretation.
4.1 Carbon yields of Rock-Eval® thermal analysis
Our average, the organic carbon yield (0.86; Fig. 1a) was in line with previous studies. Indeed, Disnar et al. (2003) (0.91) and Cécillon et al. (2018, 2021) (organic carbon yield from 0.90 to 0.96 depending on the sites) obtained slightly higher yields, whereas Saenger et al. (2013) reported lower yields (0.77). However, some samples presented high discrepancies between their TOCea and TOCre6 values. Samples with a TOCre6 value strongly differing from its corresponding TOCea value were systematically reanalysed using Rock-Eval®, which confirmed their first TOCre6 measurement. The outliers with respect to the organic carbon yield were, thus, not related to a problem in their Rock-Eval® measurement. These very different values, which concern a few dozen samples, could have different origins, such as error in sample labelling, the division into aliquots, grinding, or storage conditions. Indeed, for the same sample, the powders used for the elemental analysis and the Rock-Eval® thermal analysis did not come from the same aliquot. In addition, the elemental analyses were performed shortly after sampling, whereas the samples analysed in Rock-Eval® were stored for about 15 years. Therefore, we can expect slightly better yields when elementary and Rock-Eval® analysis are performed with less time between both as well as when they are performed on the exact same powders. This is what we plan for the samples of the second RMQS sampling campaign. The very different TOCea and TOCre6 values could also be due, for some samples, to a mismeasurement of the total carbonate content, leading to a miscalculation of the inorganic and organic carbon contents. This hypothesis could be plausible, as the median value of the carbonate content was significantly higher in the rejected samples. The last hypothesis originates from the high content of sand in the rejected samples: sandy samples are more heterogeneous; thus, the material used to determine the TOCea is more likely to differ from that used to determine the TOCre6, compared with when the sand content is lower. Moreover, the physical state of organic matter in sandy soils can be different from other soils. Disnar et al. (2003) encountered “pellets” of SOM in sandy soils, which can strongly influence the TOCea and TOCre6 results.
The samples presenting a high discrepancy between TOCea and TOCre6 were not considered further in the analysis. As stated above, we restricted our study to the samples with an organic carbon yield ranging from 0.7 to 1.3. This subjective threshold is a quality threshold to ensure that the samples analysed using Rock-Eval® were the same as the samples analysed using elemental analysis, on which all studies conducted on the first campaign of RMQS rely. This selection only marginally improved the average organic carbon yield (0.87; Fig. 1b), and organic carbon was still underestimated by Rock-Eval®. Conversely, the inorganic carbon yield was slightly overestimated (1.07; Fig. 1c). As a result, the yield of total carbon (organic + inorganic carbon) was close to 1.00 (Fig. 1d). This suggests that almost all sample carbon is detected by the Rock-Eval® machine in the five thermograms but that a small part of the organic carbon is erroneously attributed to inorganic carbon. This may be due to a slight misplacement of the boundary between organic and inorganic carbon, probably in the S3 and S3CO signals. Also, the S3′CO signal is attributed half to organic carbon and half to inorganic carbon due to potential Boudouard reactions, which are not always verified (Baudin et al., 2015; see also e.g. Behar et al., 2001, for a definition of the Rock-Eval® peaks). It is of note that, as MinC and TOCre6 are very well correlated with Cinorg and TOCea (R2>0.98), it should be possible to draw a correction formula to assess TOCea and Cinorg using Rock-Eval® with high accuracy. This would allow for the simultaneous determination of organic C and inorganic C in less than 1 h with no risk of error due to erroneous decarbonation.
4.2 Thermal stability of soil organic carbon in French topsoils
We have observed that the thermal stability defined according to different Rock-Eval® parameters varies in French topsoils. We can investigate whether these variations are consistent with our knowledge of SOC biogeochemical stability. SOC biogeochemical stability is on average higher in croplands and vineyards than in forest or grassland soils (Poeplau and Don, 2013). Indeed, fresh organic carbon inputs to soil are usually higher in forest and grassland compared with croplands, where human exportation of biomass is higher (Murty et al., 2002). As a result, SOC fractions with a lower mean residence time in soils and a lower thermal stability can be more abundant in forests and grasslands than in croplands. For instance, several studies have reported that carbon in particulate organic matter (a relatively more labile form of SOC) contributes more to total SOC in forest and grassland compared with croplands (e.g. Guo and Gifford, 2002; Poeplau et al., 2011; Poeplau and Don, 2013; Lugato et al. have 2021). Moreover, agricultural practices may also speed up SOC mineralization, thereby further limiting the accumulation of labile SOC fractions. For instance, Balesdent et al. (1990) observed that the tillage practices lead to a significantly higher mineralization than no tillage. Combining the effects of lower carbon inputs and mineralization-enhancing practices, croplands contain less biogeochemically labile SOC on average than forests and grasslands.
Thermal stability, as assessed using T90_HC_PYR, T50_ CO2_ PYR and T50_CO2_OX, was the highest in vineyards and orchards and in croplands compared with forest and grassland soils (Fig. 2). These results suggest that, overall, SOC thermal stability, as assessed using these Rock-Eval® parameters, is related to SOC biogeochemical stability. This is in good agreement with previous results obtained on smaller datasets (Barré et al., 2016; Poeplau et al., 2019; Cécillon et al., 2021). On the contrary, there was no consistent relationship between thermal stability and expected biogeochemical stability when the thermal stability was measured using T50_HC_PYR, the R index, and the I index (Fig. 2). For soils with highly contrasted biogeochemical stability, Cécillon et al. (2021) reported that the relationship between thermal stability and biogeochemical stability was weaker for T50_HC_PYR, the R index, and the I index. Our results showed that this relationship even disappears when considering datasets with more heterogeneous topsoil samples. The use of the Rock-Eval® temperature parameters T90_HC_PYR, T50_CO2_PYR, and T50_CO2_OX should, therefore, be preferred when seeking to measure thermal stability indicators directly related to biogeochemical stability.
T90_HC_PYR, T50_CO2_PYR, and T50_CO2_OX were all strongly and positively correlated with the clay content and negatively correlated with the sand content (Table 1). In a previous study, Soucémarianadin et al. (2018) did not observe any correlation between T50_CO2_OX and clay or sand content; however, their study was conducted on forest soils only and on a greatly reduced number of study sites. Soil clay fractions interact with microbial compounds, resulting in the formation of organo-mineral complexes in which SOC has a high biogeochemical stability (e.g. Lehmann and Kleber, 2015). Therefore, we can hypothesize that clay-rich soils are also richer in biogeochemically stable carbon. The positive correlation between clay content and SOC thermal stability as well as the good correlations between the CEC, which depends on the first order of the clay content, and SOC thermal stability would then be another illustration of the link between SOC thermal and biogeochemical stabilities. Iron oxides are mineral compounds that are also supposed to protect SOC from decomposition. In this respect, the inconsistent (Mehra–Jackson iron) or even negative correlations (Tamm iron) between T90_HC_PYR, T50_CO2_PYR, and T50_CO2_OX and iron oxides were not expected. These weak correlations could be attributed to the fact that the range of iron oxide contents is relatively small in our set of topsoils.
T90_HC_PYR, T50_CO2_PYR, and T50_CO2_OX were all positively correlated with pH. Such a correlation between T50_CO2_OX and pH has already been observed by Soucémarianadin et al. (2018) for a set of French forest soils. Acidity may protect SOM from degradation by microorganisms (Clivot et al., 2021), by reducing their activity, which is actually observed in low-pH bogs. Therefore, we can hypothesize that acidity slows down SOM mineralization which can favour the accumulation of labile SOC components. As these labile SOC fractions would appear thermally unstable, it would explain the positive relationship between pH and Rock-Eval® indicators of SOC thermal stability.
T90_HC_PYR, T50_CO2_PYR, and T50_CO2_OX showed weak but significant positive correlations with MAT averaged over 1969–1999 (Table 1). Such a correlation has also been observed in Soucémarianadin et al. (2018) for French forest soils. As soil microbial activity and, thus, SOC mineralization increase with temperature (Rey and Jarvis, 2006), we can expect the SOC labile fractions to be more rapidly processed at higher temperature. This would be in line with the observed positive correlations between MAT and the three selected thermal stability indicators. The relatively weak (Spearman ρ value below 0.2) correlations could be due to the fact that MAT also plays a role in carbon inputs to the soil. Indeed, if higher SOC mineralization was balanced by increased biomass inputs, it would dampen the relation between MAT and the SOC biogeochemical stability. In a similar way, the weak negative correlation between MAP and thermal stability may be explained by the complex effect of MAP on SOC biogeochemical stability: increased soil moisture stimulates SOC processing up to a certain point (Moyano et al., 2013) and also influences net primary production and, therefore, soil carbon inputs. In any case, the relationships between SOC and MAP or MAT are hard to disentangle (Chen et al., 2019). Another explanation for the weak values is that the climatic data were obtained on an 8 km × 8 km grid and do not have the same precision that they would have had if a weather station had been deployed at each site. This probably adds noise to the correlation.
The point map representing SOC thermal stability over mainland France (Fig. 4b) illustrates the relationships between SOC thermal stability, land cover, climate, and pedological variables. Mountainous regions (e.g. the Massif Central, Alps, and Pyrenees) dominated by forest and grassland with a low MAT and relatively high SOC contents (the latter according to Martin et al., 2011) had a lower SOC thermal stability. Plains dominated by croplands with intensive agricultural practices and with relatively low SOC contents, such as the Paris Basin, showed high SOC thermal stability. The southern part of France, which has a warmer MAT, dominant vineyard and cropland land cover, and relatively low SOC contents, also presented high SOC thermal stability. The lower SOC thermal stabilities observed in Brittany and Normandy (which are agricultural regions) could be explained by the higher proportion of livestock. Therefore, in addition to the presence of grasslands in these regions, the cultivated soils in Brittany and Normandy are more likely to receive the repeated application of exogenous organic matter.
4.3 Elemental stoichiometry of soil organic matter in French topsoils
Higher HI and lower OIre6 values were observed in forests and grasslands compared with croplands and vineyards. This trend has also been observed in previous studies (Disnar et al., 2003; Saenger et al., 2013; Sebag et al., 2016). This confirms that HI and OIre6 can be good proxies for SOC biogeochemical stability. Indeed, as previously observed, biogeochemically stable SOC is more oxidized and H depleted (Barré et al., 2016; Poeplau et al., 2019; Cécillon et al., 2021).
The pseudo van Krevelen diagrams (Fig. 3) show a high variability in the ratio between land cover classes: the ratio is higher in forest topsoils than in grasslands, croplands, or vineyards. This is classically explained by the fact that SOC is on average less processed in forests and grasslands compared with croplands and vineyards (Cotrufo et al., 2019) as well as by the higher ratio of the biomass inputs to soil in forests. Indeed, the biotransformation of organic matter tends to lower its ratio and oxidize it (Cleveland and Liptzin, 2007). This is in good agreement with the observed trends of decreasing HI and increasing OIre6 with decreasing (Fig. 3).
SOM elemental stoichiometry presented correlation patterns with land cover, climate, and pedological variables that were similar to those observed for SOM thermal stability. As shown in Table 1, HI and OIre6 are negatively and positively correlated with pH, respectively, as previously observed by Soucémarianadin et al. (2018) in French forest soils. This would be in line with acidity slowing down the mineralization of H-enriched labile SOC fractions (Clivot et al., 2019). The negative correlation between clay content and HI could be explained by the fact that the presence of clays can promote the protection of microbially processed H-depleted SOM. Similar to what was observed for SOM thermal stability, relationships between elemental stoichiometry and climate variables are weak, probably because climate plays a role in both soil carbon inputs and outputs in opposite ways (climate conditions enhancing SOC mineralization usually also enhance fresh SOM inputs).
The point map of HI in mainland France (Fig. 4a) illustrates the effect of land cover, climate, and pedological variables on SOM elemental stoichiometry. Regions dominated by grassland and forest (Fig. 4d), such as mountainous regions, the Landes forest, or the forest-dominated eastern part of France, are characterized by a relatively H-enriched SOM. Conversely, regions with a high MAT and dominant cropland, vineyard, and orchard land covers are characterized by a relatively H-depleted SOM. Both point maps of thermal stability and HI (Fig. 4) also illustrate the relationships previously observed between these Rock-Eval® parameters (Barré et al., 2016; Cécillon et al., 2021).
This study is an unprecedented effort to carry out widespread thermal analysis measurements on a national soil quality monitoring network. It demonstrated that Rock-Eval® may be used as a rapid and cost-effective method to assess the thermal stability and elemental stoichiometry of SOM on national soil monitoring networks. The very satisfying organic and inorganic carbon yields could make Rock-Eval® thermal analysis a very suitable tool for research work in carbonate soils or even for routine soil analysis if commercial laboratories take advantage of the method. Our results highlighted the influence of land cover and pedoclimatic variables on SOM thermal stability and elemental stoichiometry. They suggested that some Rock-Eval® temperature parameters describing SOC thermal stability (T90_HC_PYR, T50_CO2_PYR, and T50_ CO2_OX) could be used as reliable proxies for SOC biogeochemical stability, whereas other parameters (T50_HC_PYR, the R index, and the I index) could not. Our study also opened wide perspectives for future research. In the short term, these Rock-Eval® results on French topsoils can be used as input to the PARTYSOC machine learning model (Cécillon et al., 2021) to infer the size of the centennially stable SOC fraction. They can also be compared to other proxies for SOC biogeochemical stability, such as SOM physical fractionation results. In the medium term, it will be interesting to test whether this analytical information can be used to improve the accuracy of SOC stock evolution simulations at the scale of a national soil monitoring network, as was observed for the Andriulo–Mary–Guérif (AMG) model of SOC dynamics in several French long-term agronomic experiments (Kanari et al., 2022).
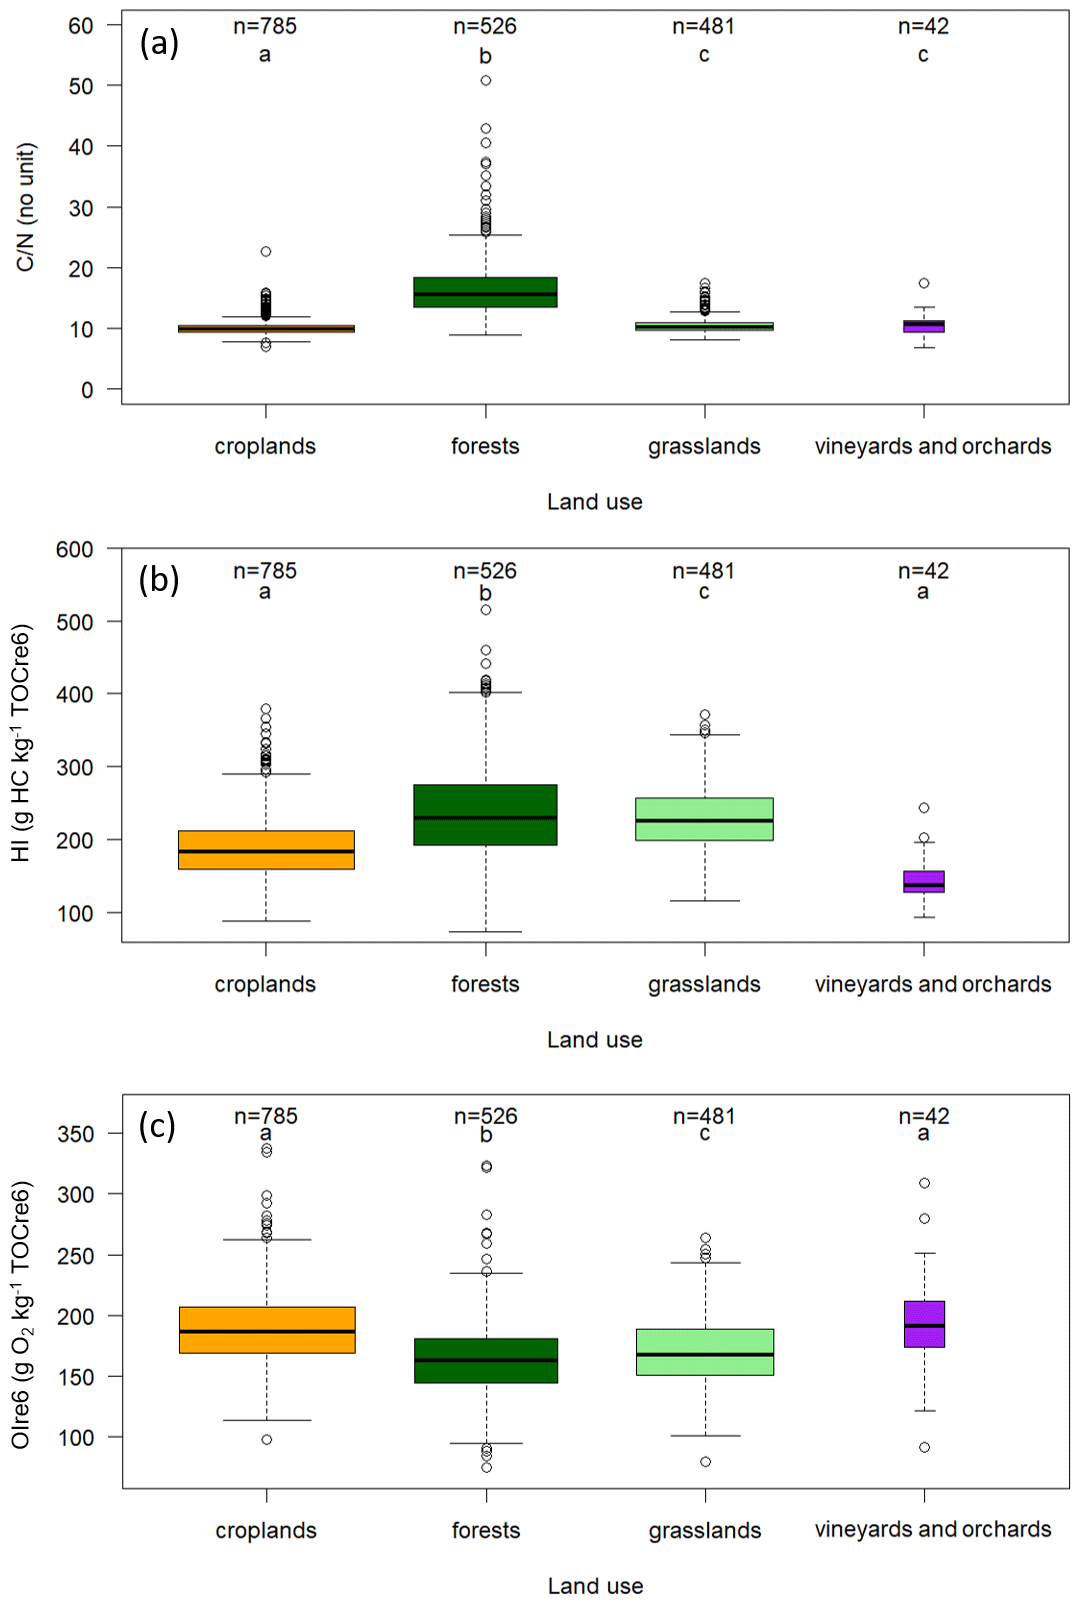
Figure A1Effect of land cover on topsoil organic carbon stoichiometry for the RMQS topsoil (0–30 cm) samples under the four major land covers in France: croplands, forests, grasslands, and vineyards and orchards. The individual panels show the (a) distribution, (b) HI distribution, and (c) OIre6 distribution. Samples are limited to those with Rock-Eval® organic carbon yields ranging from 0.7 to 1.3. For the box plots, the solid black midline of each box is the median, the lower and upper edges are the respective first (Q1) and third (Q3) quartiles, and the lower and upper whiskers are the maximum between the minimum value or the first quartile minus 1.5 times the interquartile range (max [min; (Q3–Q1)]) and the minimum between the maximum or the third quartile plus 1.5 times the interquartile range (min [max; (Q3–Q1)]), respectively. Different letters indicate significant differences in the distribution of the values for the land uses according to a Kruskal–Wallis test (p<0.05) and a pairwise Wilcoxon rank sum test (p<0.05). The box width is proportional to the square root of n.
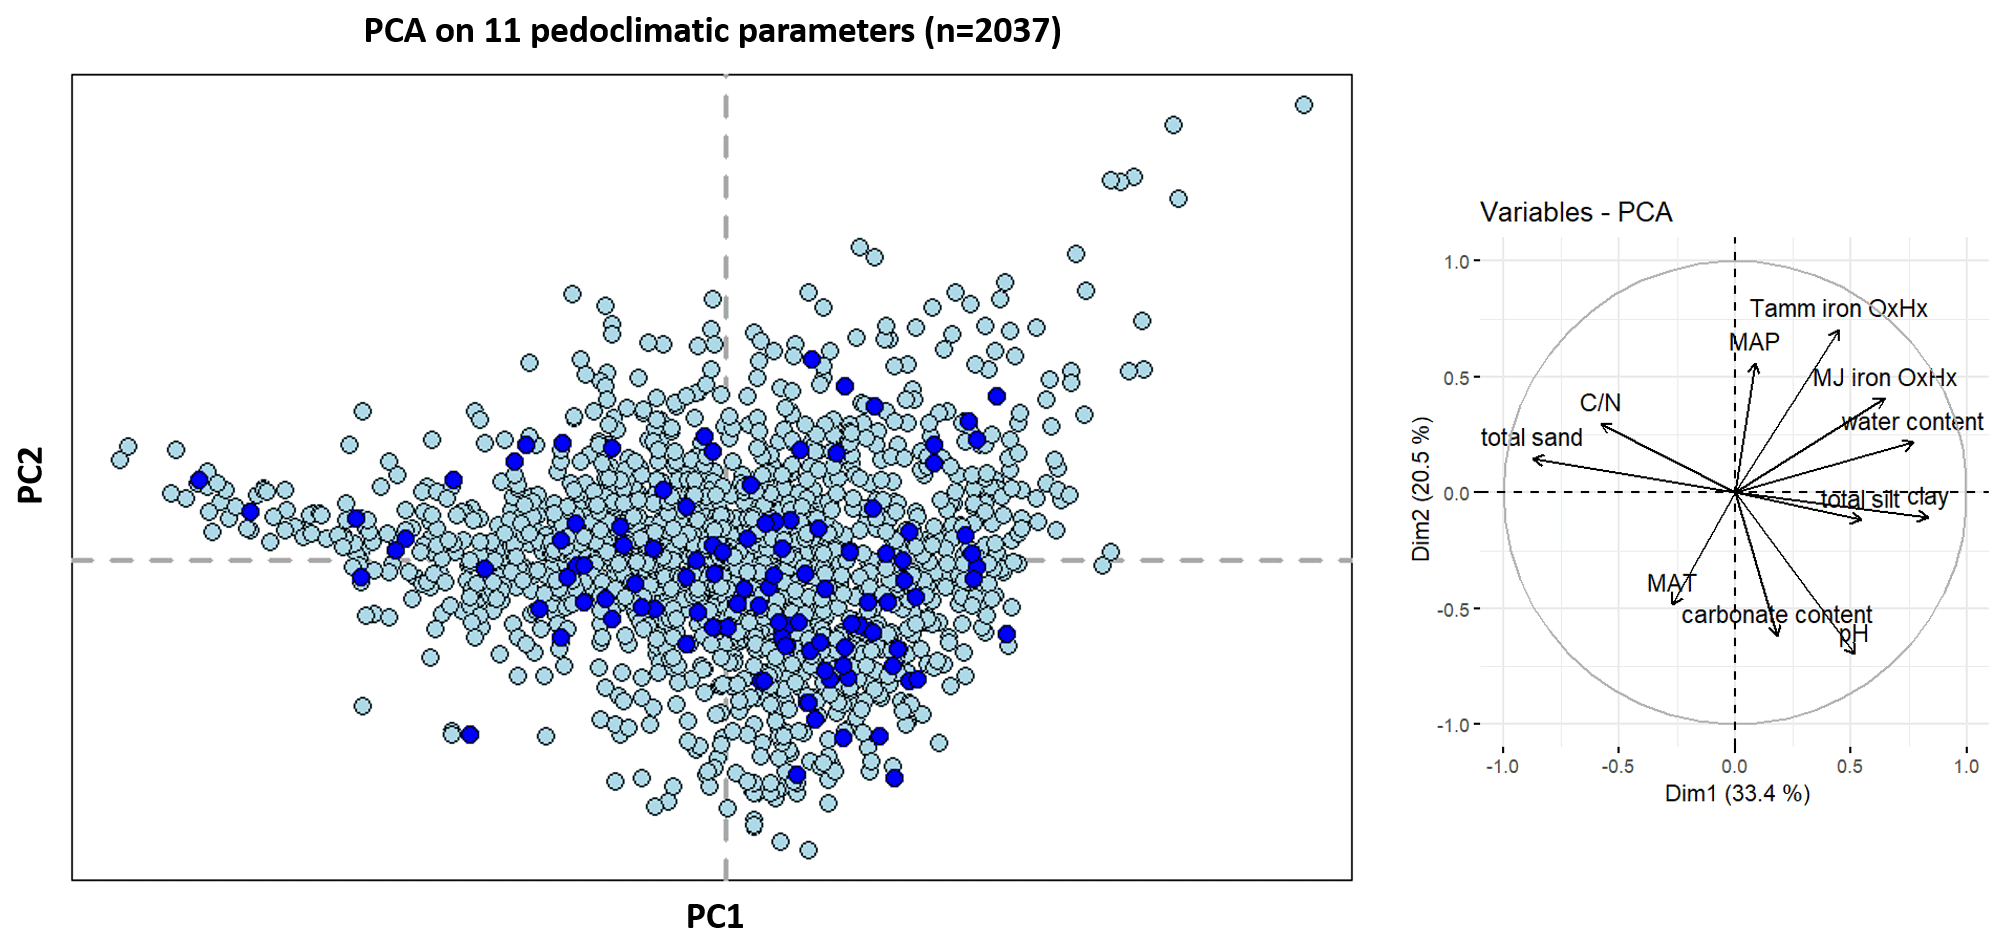
Figure A2Score of the 2037 samples on axes 1 and 2 of the principal component analysis on 11 pedoclimatic parameters: clay, total silt and total sand contents, pH in water, water content, carbonate content, mean annual temperature, mean annual precipitation, Tamm and Mehra–Jackson iron oxyhydroxide contents, and the ratio for the RMQS topsoil (0–30 cm) samples. Samples with an organic carbon yield between 0.7 and 1.3 are plotted in light blue, whereas samples with an organic carbon yield < 0.7 or > 1.3 are plotted in dark blue.

Table A2Minimum, maximum, mean, first quartile, third quartile, median, and standard deviation values of the Rock-Eval® parameters for the RMQS topsoil (0–30 cm) samples limited to those with Rock-Eval® organic carbon yields ranging from 0.7 to 1.3 (n=1891, “total”) and by land cover.
Data on basic soil properties are freely available from the GisSol Dataverse website: https://doi.org/10.15454/BNCXYB (Saby et al., 2019). Climate data were extracted from the French SAFRAN database (https://publitheque.meteo.fr/okapi/accueil/okapiWebPubli/index.jsp, last access: 21 March 2022).
AAD, LC, and PB carried out the sample collection and ensured that samples were properly ground. FS and FB produced the Rock-Eval® thermal analyses. DA, AB, LB, CJ, MPM, CR, and NPAS provided the detailed pedoclimatic data. NPAS produced the point maps. AAD processed and interpreted the data with contributions from all co-authors. AAD, PB, and LC wrote the manuscript with contributions from all co-authors.
The contact author has declared that none of the authors has any competing interests.
Publisher's note: Copernicus Publications remains neutral with regard to jurisdictional claims in published maps and institutional affiliations.
The École Normale Supérieure of Paris is gratefully acknowledged for financially supporting Amicie Delahaie's PhD thesis.
This research has been supported by ADEME (grant no. 2003C0017).
This paper was edited by Jocelyn Lavallee and reviewed by two anonymous referees.
Amundson, R.: The carbon budget in soils, Annu. Rev. Earth Pl. Sc., 29, 535–562, https://doi.org/10.1146/annurev.earth.29.1.535, 2001.
Baldock, J. A. and Skjemstad, J. O.: Role of soil matrix and minerals in protecting natural organic materials against biological attack, Org. Geochem., 31, 697–710, https://doi.org/10.1016/S0146-6380(00)00049-8, 2000.
Balesdent, J. and Guillet, B.: Les datations par le 14C des matières organiques des sols, Contribution à l'étude de l'humification et du renouvellement des substances humiques, Science du Sol, 20, 93–112, 1982.
Balesdent, J., Mariotti, A., and Boisgontier, D.: Effect of tillage on soil organic carbon mineralization estimated from 13C abundance in maize fields, J. Soil Sci., 41, 587–596, https://doi.org/10.1111/j.1365-2389.1990.tb00228.x, 1990.
Barré, P., Plante, A. F., Cécillon, L., Lutfalla, S., Baudin, F., Christensen, B. T., Eglin, T., Fernandez, J.-M., Houot, S., Kätterer, T., Le Guillou, C., Macdonald, A., van Oort, F., and Chenu, C.: The energetic and chemical signatures of persistent soil organic matter, Biogeochemistry, 130, 1–12, https://doi.org/10.1007/s10533-016-0246-0, 2016.
Baudin, F., Disnar, J.-R., Aboussou, A., and Savignac, F.: Guidelines for Rock-Eval analysis of recent marine sediments, Org. Geochem., 86, 71–80, https://doi.org/10.1016/j.orggeochem.2015.06.009, 2015.
Behar, F., Beaumont, V., and De Barros Penteado, H. L.: Rock-Eval 6 Technology: Performances and Developments, Oil Gas Sci. Technol., 56, 111–134, https://doi.org/10.2516/ogst:2001013, 2001.
Bispo, A., Andersen, L., Angers, D. A., Bernoux, M., Brossard, M., Cécillon, L., Comans, R. N. J., Harmsen, J., Jonassen, K., Lamé, F., Lhuillery, C., Maly, S., Martin, E., Mcelnea, A. E., Sakai, H., Watabe, Y., and Eglin, T. K.: Accounting for carbon stocks in soils and measuring GHGs emission fluxes from soils: do we have the necessary standards?, Front. Environ. Sci., 5, 41, https://doi.org/10.3389/fenvs.2017.00041, 2017.
Cécillon, L., Baudin, F., Chenu, C., Houot, S., Jolivet, R., Kätterer, T., Lutfalla, S., Macdonald, A., van Oort, F., Plante, A. F., Savignac, F., Soucémarianadin, L., and Barré, P.: A model based on RockEval thermal analysis to quantify the size of the centennially persistent organic carbon pool in temperate soils, Biogeosciences, 15, 2835–2849, https://doi.org/10.5194/bg-15-2835-2018, 2018.
Cécillon, L., Baudin, F., Chenu, C., Christensen, B. T., Franko, U., Houot, S., Kanari, E., Kätterer, T., Merbach, I., van Oort, F., Poeplau, C., Quezada, J.-C., Savignac, F., Soucémarianadin, L. N., and Barré, P.: Partitioning soil organic carbon into its centennially stable and active fractions with machine-learning models based on Rock-Eval® thermal analysis (PARTYSOCv2.0 and PARTYSOCv2.0EU), Geosci. Model Dev., 14, 3879–3898, https://doi.org/10.5194/gmd-14-3879-2021, 2021.
Chassé, M., Lutfalla, S., Cécillon, L., Baudin, F., Abiven, S., Chenu, C., and Barré, P.: Long-term bare-fallow soil fractions reveal thermo-chemical properties controlling soil organic carbon dynamics, Biogeosciences, 18, 1703–1718, https://doi.org/10.5194/bg-18-1703-2021, 2021.
Chen, S., Arrouays, D., Angers, D. A., Chenu, C., Barré, P., Martin, M. P., Saby, N. P. A., and Walter, C.: National estimation of soil organic carbon storage potential for arable soils: A data-driven approach coupled with carbon-landscape zones, Sci. Total Environ., 666, 355–367, https://doi.org/10.1016/j.scitotenv.2019.02.249, 2019.
Chenu, C., Rumpel, C., and Lehmann, J.: Methods for Studying Soil Organic Matter: Nature, Dynamics, Spatial Accessibility, and Interactions with Minerals, in: Soil Microbiology, Ecology and Biochemistry, Academic Press, Elsevier, 383–419, https://doi.org/10.1016/B978-0-12-415955-6.00013-X, 2015.
Cleveland, C. C. and Liptzin, D.: C:N:P stoichiometry in soil: is there a “Redfield ratio” for the microbial biomass?, Biogeochemistry, 85, 235–252, https://doi-org.insu.bib.cnrs.fr/10.1007/s10533-007-9132-0, 2007.
Clivot, H., Mouny, J. C., Duparque, A., Dinh, J. L., Denoroy, P., Houot, S., Vertès, F., Trochard, R., Bouthier, A., Sagot, S., and Mary, B.: Modeling soil organic carbon evolution in long-term arable experiments with AMG model, Environ. Modell. Softw., 118, 99–113, https://doi.org/10.1016/j.envsoft.2019.04.004, 2019.
Clivot, H., Misslin, R., Constantin, J., Tribouillois, H., Levavasseur, F., Houot, S., Villerd, J., and Therond, O.: AqYield-NC model documentation: Extension of the AqYield soil-crop model for simulating microbial processes involved in soil nitrogen and carbon fluxes in the MAELIA platform, HAL, https://doi.org/10.15454/P0D3I5, 2021.
Collins, H. P., Bundy, L. G., Dick, W. A., Huggins, D. R., Smucker, A. J. M., and Paul E. A.: Soil carbon pools and fluxes in long-term Corn Belt agroecosystems, Soil Biol. Biochem., 32, 157–168, https://doi.org/10.1016/S0038-0717(99)00136-4, 2000.
Cotrufo, M. F., Ranalli, M. G., Haddix, M. L., Six, J., and Lugato, E.: Soil carbon storage informed by particulate and mineral-associated organic matter, Nat. Geosci., 12, 989–994, https://doi.org/10.1038/s41561-019-0484-6, 2019.
Dignac, M.-F., Derrien, D., Barré, P., Barot, S., Cécillon, L., Chenu, C., Chevallier, T., Freschet, G. T., Garnier, P., Guenet, B., Hedde, M., Klumpp, K., Lashermes, G., Maron, P.-A., Nunan, N., Roumet, C., and Basile-Doelsch I.: Increasing soil carbon storage: mechanisms, effects of agricultural practices and proxies. A review, Agron. Sustain. Dev., 37, 14, https://doi-org.insu.bib.cnrs.fr/10.1007/s13593-017-0421-2, 2017.
Disnar, J.-R., Guillet, B., Keravis, D., Di-Giovanni, C., and Sebag, D.: Soil organic matter (SOM) characterization by Rock-Eval pyrolysis: scope and limitations, Org. Geochem., 34, 327–343, https://doi.org/10.1016/S0146-6380(02)00239-5, 2003.
Eglin, T., Ciais, P., Piao, S. L., Barré, P., Bellassen, V., Cadule, P., Chenu, C., Gasser, T., Koven, C., Reichstein, M., and Smith, P.: Historical and future perspectives of global soil carbon response to climate and land-use changes, Tellus B, 62, 700–718, https://doi.org/10.1111/j.1600-0889.2010.00499.x, 2010.
Espitalié, J., Laporte, J. L., Madec, M., Marquis, F., Leplat, P., Paulet, J., and Boutefeu, A.: Méthode rapide de caractérisation des roches mères, de leur potentiel pétrolier et de leur degré d'évolution, Oil Gas Sci. Technol., 32, 23–42, https://doi.org/10.2516/ogst:1977002, 1977.
Fox, J. and Weisberg, S.: Package “car”, An {R} Companion to Applied Regression, Third Edition, Thousand Oaks CA, https://socialsciences.mcmaster.ca/jfox/Books/Companion/, last access: 19 June 2019.
Gregorich, E. G., Gillespie, A. W., Beare, M. H., Curtin, D., Sanei, H., and Yanni, S. F.: Evaluating biodegradability of soil organic matter by its thermal stability and chemical composition, Soil Biol. Biochem., 91, 182–191, https://doi.org/10.1016/j.soilbio.2015.08.032, 2015.
Guo, L. B. and Gifford, R. M.: Soil carbon stocks and land use change: a meta-analysis, Glob. Change Biol., 8, 345–360, https://doi.org/10.1046/j.1354-1013.2002.00486.x, 2002.
Jolivet, C., Boulonne, L., and Ratié, C.: Manuel du Réseau de Mesures de la Qualité des Sols, édition 2006, Unité InfoSol, INRA Orléans, France, 190 pp., ISBN: 2-73-80-1235-3, 2006.
Jolivet, C. C.: Le Réseau de Mesures de la Qualité des Sols (RMQS), Visite du Ministère de l'Agriculture, de l'Alimentation, de la Pêche, de la Ruralité et de l'Aménagement du Territoire, Orléans, France, https://hal.inrae.fr/hal-02803226 S (last access: 5 June 2022), 2011.
Kanari, E., Cécillon, L., Baudin, F., Clivot, H., Ferchaud, F., Houot, S., Levavasseur, F., Mary, B., Soucémarianadin, L. N., Chenu, C., and Barré P.: A robust initialization method for accurate soil organic carbon simulations, Biogeosciences, 19, 375–387, https://doi.org/10.5194/bg-19-375-2022, 2022.
Kassambara, A.: ggpubr: “ggplot2” Based Publication Ready Plots, R package version 0.4.0, https://CRAN.R-project.org/package=ggpubr (last access: 5 June 2022), 2020.
Kassambara, A.: rstatix: Pipe-Friendly Framework for Basic Statistical Tests, R package version 0.7.0, https://CRAN.R-project.org/package=rstatix (last access: 5 June 2022), 2021.
Kassambara, A. and Mundt, F.: factoextra: Extract and Visualize the Results of Multivariate Data Analyses, R package version 1.0.7, https://CRAN.R-project.org/package=factoextra (last access: 5 June 2022), 2020.
Khedim, N., Cécillon, L., Poulenard, J., Barré, P., Baudin, F., Marta, S., Rabatel, A., Dentant, C., Cauvy-Fraunie, S., Anthelme, F., Gielly, L., Ambrosini, R., Franzetti, A., Azzoni, R. S., Caccianiga, M. S., Compostella, C., Clague, J., Tielidze, L., Messager, E., Choler, P., and Ficetola, G. F.: Topsoil organic matter build-up in glacier forelands around the world, Glob. Change Biol., 27, 1662–1677, https://doi.org/10.1111/gcb.15496, 2021.
Lê, S., Josse, J., and Husson, F.: FactoMineR: A Package for Multivariate Analysis, J. Stat. Softw., 25, 1–18, 2008.
Lehmann, J. and Kleber, M.: The contentious nature of soil organic matter, Nature, 528, 60–68, https://doi.org/10.1038/nature16069, 2015.
Lugato, E., Lavallee, J. M., Haddix, M. L., Panagos, P., and Cotrufo, M. F.: Different climate sensitivity of particulate and mineral-associated soil organic matter, Nat. Geosci., 14, 295–300, https://doi.org/10.1038/s41561-021-00744-x, 2021.
Martin, M. P., Wattenbach, M., Smith, P., Meersmans, J., Jolivet, C., Boulonne, L., and Arrouays, D.: Spatial distribution of soil organic carbon stocks in France, Biogeosciences, 8, 1053–1065, https://doi.org/10.5194/bg-8-1053-2011, 2011.
Matteodo, M., Grand, S., Sebag, D., Rowley, M. C., Vittoz, P., and Verrecchia, E. P.: Decoupling of topsoil and subsoil controls on organic matter dynamics in the Swiss Alps, Geoderma, 330, 41–51, https://doi.org/10.1016/j.geoderma.2018.05.011, 2018.
Moyano, F. E., Manzoni, S., and Chenu, C.: Responses of soil heterotrophic respiration to moisture availability: An exploration of processes and models, Soil Biol. Biochem., 59, 72–85, https://doi.org/10.1016/j.soilbio.2013.01.002, 2013.
Murty, D., Kirschbaum, M. U., Mcmurtrie, R. E., and Mcgilvray, H.: Does conversion of forest to agricultural land change soil carbon and nitrogen? A review of the literature, Glob. Change Biol., 8, 105–123, https://doi.org/10.1046/j.1354-1013.2001.00459.x, 2002.
Pebesma, E.: sf: Simple Features for R: Standardized Support for Spatial Vector Data, R Journal, 10, 439–446, https://doi.org/10.32614/RJ-2018-009, 2018.
Plante, A. F., Fernández, J. M., and Leifeld, J.: Application of thermal analysis techniques in soil science, Geoderma, 153, 1–10, https://doi.org/10.1016/j.geoderma.2009.08.016, 2009.
Poeplau, C., Don, A., Vesterdal, L., Leifeld, J., Van Wesemael, B. A. S., Schumacher, J., and Gensior, A.: Temporal dynamics of soil organic carbon after land-use change in the temperate zone–carbon response functions as a model approach, Glob. Change Biol., 17, 2415–2427, https://doi.org/10.1111/j.1365-2486.2011.02408.x, 2011.
Poeplau, C. and Don, A.: Sensitivity of soil organic carbon stocks and fractions to different land-use changes across Europe, Geoderma, 192, 189–201, https://doi.org/10.1016/j.geoderma.2012.08.003, 2013.
Poeplau, C., Don, A., Six, J., Kaiser, M., Benbi, D., Chenu, C., Cotrufo, M. F., Derrien, D., Gioacchini, P., Grand, S., Gregorich, E., Griepentrog, M., Gunina, A., Haddix, M., Kuzyakov, Y., Kuhnel, A., Macdonald, L. M., Soong, J., Trigalet, S., Vermeire, M.,L., Rovira, P., Van Wesemael, B., Wiesmeier, M., Yeasmin, S., Yevdokimov, I., and Nieder R.: Isolating organic carbon fractions with varying turnover rates in temperate agricultural soils – A comprehensive method comparison, Soil Biol. Biochem., 125, 10–26, https://doi.org/10.1016/j.soilbio.2018.06.025, 2018.
Poeplau, C., Barré, P., Cécillon, L., Baudin, F., and Sigurdsson, B. D.: Changes in the Rock-Eval signature of soil organic carbon upon extreme soil warming and chemical oxidation – A comparison, Geoderma, 337, 181–190, https://doi.org/10.1016/j.geoderma.2018.09.025, 2019.
R Core Team: R: A language and environment for statistical computing, R Foundation for Statistical Computing, Vienna, Austria, https://www.R-project.org/ (last access: 19 June 2022), 2021.
Rawls, W. J., Pachepsky, Y. A., Ritchie, J. C., Sobecki, T. M., and Bloodworth, H.: Effect of soil organic carbon on soil water retention, Geoderma, 116, 61–76, https://doi.org/10.1016/S0016-7061(03)00094-6, 2003.
Rey, A. N. A. and Jarvis, P.: Modelling the effect of temperature on carbon mineralization rates across a network of European forest sites (FORCAST), Glob. Change Biol., 12, 1894–1908, https://doi.org/10.1111/j.1365-2486.2006.01230.x, 2006.
Rumpel, C., Amiraslani, F., Koutika, L.-S., Smith, P., Whitehead, D., and Wollenberg, E.: Put more carbon in soils to meet Paris climate pledges, Nature, 564, 32–34, https://doi.org/10.1038/d41586-018-07587-4, 2018.
Saby, N., Bertouy, B., Boulonne, L., Bispo, A., Ratié, C., and Jolivet, C.: Statistiques sommaires issues du RMQS sur les données agronomiques et en éléments traces des sols français de 0 à 50 cm, Recherche Data Gouv [data set], V5, https://doi.org/10.15454/BNCXYB, 2019.
Saenger, A., Cécillon, L., Sebag, D., and Brun, J.-J.: Soil organic carbon quantity, chemistry and thermal stability in a mountainous landscape: A Rock–Eval pyrolysis survey, Org. Geochem., 54, 101–114, https://doi.org/10.1016/j.orggeochem.2012.10.008, 2013.
Saenger, A., Cécillon, L., Poulenard, J., Bureau, F., De Daniéli, S., Gonzalez, J., and Brun, J.: Surveying the carbon pools of mountain soils: a comparison of physical fractionation and Rock-Eval pyrolysis, Geoderma, 241/242, 279–288, https://doi.org/10.1016/j.geoderma.2014.12.001, 2015.
Sanderman, J. and Grandy, A. S.: Ramped thermal analysis for isolating biologically meaningful soil organic matter fractions with distinct residence times, SOIL, 6, 131–144, https://doi.org/10.5194/soil-6-131-2020, 2020.
Sanderman, J., Baldock, J. A., Dangal, S. R. S., Ludwig, S., Potter, S., Rivard, C., and Savage, K.: Soil organic carbon fractions in the Great Plains of the United States: an application of mid-infrared spectroscopy, Biogeochemistry, 156, 97–114, https://doi-org.insu.bib.cnrs.fr/10.1007/s10533-021-00755-1, 2021.
Schmidt, M. W., Torn, M. S., Abiven, S., Dittmar, T., Guggenberger, G., Janssens, I. A., Kleber, M., Kögel-Knabner, I., Lehmann, J., Manning, D. A. C., Nannipieri, P., Rasse, D. P., Weiner, S., and Trumbore, S. E.: Persistence of soil organic matter as an ecosystem property, Nature, 478, 49–56, https://doi.org/10.1038/nature10386, 2011.
Sebag, D., Verrecchia, E. P., Cécillon, L., Adatte, T., Albrecht, R., Aubert, M., Bureau, F., Cailleau, G., Copard, Y., Decaens, T., Disnar, J.-R., Hetényi, M., Nyilas, T., and Trombino, L.: Dynamics of soil organic matter based on new Rock-Eval indices, Geoderma, 284, 185–203, https://doi.org/10.1016/j.geoderma.2016.08.025, 2016.
Soetaert, K.: plot3D: Plotting Multi-Dimensional Data, R package version 1.4, https://CRAN.R-project.org/package=plot3D (last access: 19 June 2022), 2021.
Soucémarianadin, L. N., Cécillon, L., Guenet, B., Chenu, C., Baudin, F., Nicolas, M., Girardin, C., and Barré, P.: Environmental factors controlling soil organic carbon stability in French forest soils, Plant Soil, 426, 267–286, https://doi-org.insu.bib.cnrs.fr/10.1007/s11104-018-3613-x, 2018.
Tennekes, M.: tmap: Thematic Maps in R, J.f Stat. Softw., 84, 1–39, https://doi.org/10.18637/jss.v084.i06, 2018.
Vinci Technologies (Nanterre, France): Geoworks V1.6R2, https://www.vinci-technologies.com/rocks-and-fluids/geology/organic-geochemistry/geoworks-geochemical-software/113335/ (last access: 3 August 2022), 2021.
Viscarra Rossel, R. A., Lee, J., Behrens, T., Luo, Z., Baldock, J., and Richards, A.: Continental-scale soil carbon composition and vulnerability modulated by regional environmental controls, Nat. Geosci., 12, 547–552, https://doi.org/10.1038/s41561-019-0373-z, 2019.
Von Lützow, M., Kögel-Knabner, I., Ekschmitt, K., Matzner, E., Guggenberger, G., Marschner, B., and Flessa H.: Stabilization of soil organic matter in temperate soils: mechanisms and their relevance under different soil conditions – a review, Eur. J. Soil Sci., 57, 426–445, https://doi.org/10.1111/j.1365-2389.2006.00809.x, 2006.
Von Lützow, M., Kögel-Knabner, I., Ekschmitt, K., Flessa, H., Guggenberger, G., Matzner, E., and Marschner B.: SOM fractionation methods: relevance to functional pools and to stabilization mechanisms, Soil Biol. Biochem., 39, 2183–2207, https://doi.org/10.1016/j.soilbio.2007.03.007, 2007.
Vos, C., Jaconi, A., Jacobs, A., and Don, A.: Hot regions of labile and stable soil organic carbon in Germany – Spatial variability and driving factors, SOIL, 4, 153–167, https://doi.org/10.5194/soil-4-153-2018, 2018.
Wei, T. and Simko, V.: R package “corrplot”: Visualization of a Correlation Matrix (Version 0.92), https://github.com/taiyun/corrplot (last access: 19 June 2022), 2021.
Wickham, H.: ggplot2: Elegant Graphics for Data Analysis, Springer-Verlag New York, https://doi.org/10.1007/978-0-387-98141-3, 2016.