the Creative Commons Attribution 4.0 License.
the Creative Commons Attribution 4.0 License.
 | 24 Feb 2022
Content of soil organic carbon and labile fractions depend on local combinations of mineral-phase characteristics
Malte Ortner
Michael Seidel
Sebastian Semella
Thomas Udelhoven
Michael Vohland
Soil organic matter (SOM) is an indispensable component of terrestrial ecosystems. Soil organic carbon (SOC) dynamics are influenced by a number of well-known abiotic factors such as clay content, soil pH, or pedogenic oxides. These parameters interact with each other and vary in their influence on SOC depending on local conditions. To investigate the latter, the dependence of SOC accumulation on parameters and parameter combinations was statistically assessed that vary on a local scale depending on parent material, soil texture class, and land use. To this end, topsoils were sampled from arable and grassland sites in south-western Germany in four regions with different soil parent material. Principal component analysis (PCA) revealed a distinct clustering of data according to parent material and soil texture that varied largely between the local sampling regions, while land use explained PCA results only to a small extent. The PCA clusters were differentiated into total clusters that contain the entire dataset or major proportions of it and local clusters representing only a smaller part of the dataset. All clusters were analysed for the relationships between SOC concentrations (SOC %) and mineral-phase parameters in order to assess specific parameter combinations explaining SOC and its labile fractions hot water-extractable C (HWEC) and microbial biomass C (MBC). Analyses were focused on soil parameters that are known as possible predictors for the occurrence and stabilization of SOC (e.g. fine silt plus clay and pedogenic oxides). Regarding the total clusters, we found significant relationships, by bivariate models, between SOC, its labile fractions HWEC and MBC, and the applied predictors. However, partly low explained variances indicated the limited suitability of bivariate models. Hence, mixed-effect models were used to identify specific parameter combinations that significantly explain SOC and its labile fractions of the different clusters. Comparing measured and mixed-effect-model-predicted SOC values revealed acceptable to very good regression coefficients (R2=0.41–0.91) and low to acceptable root mean square error (RMSE = 0.20 %–0.42 %). Thereby, the predictors and predictor combinations clearly differed between models obtained for the whole dataset and the different cluster groups. At a local scale, site-specific combinations of parameters explained the variability of organic carbon notably better, while the application of total models to local clusters resulted in less explained variance and a higher RMSE. Independently of that, the explained variance by marginal fixed effects decreased in the order SOC > HWEC > MBC, showing that labile fractions depend less on soil properties but presumably more on processes such as organic carbon input and turnover in soil.
- Article
(6906 KB) - Full-text XML
-
Supplement
(444 KB) - BibTeX
- EndNote


Soil as an inherent part of terrestrial ecosystems acts as a major regulator of the organic carbon (OC) cycle, especially through the function of OC storage (Heimann and Reichstein, 2008; Scharlemann et al., 2014). Hence, it is of utmost relevance and a focus of ongoing research to define models and parameter sets that best describe and predict soil organic carbon (SOC) contents of soils. Furthermore, it is required to identify the drivers of SOC storage at different scales and sites to adapt the management of soils. Overall, the relevance of parameters for quantification of SOC is often described by bivariate relationships (Hassink et al., 1993; Barré et al., 2017). However, SOC and its potential sequestration by formation of organo-mineral associations depend on combinations and interactions of several environmental factors or soil properties, so that the number of multivariate applications to estimate the accumulation of SOC is increasing (Hobley et al., 2015; Heinze et al., 2018).
In addition to total SOC, its labile subfractions such as hot water extractable carbon (HWEC) or microbial biomass carbon (MBC) are more and more recognized as fast-reacting SOC pools in order to analyse carbon dynamics in soils (Weigel et al., 2011; Lal, 2016). Both fractions were selected because they are methodically clearly defined compared with other fractions, e.g. particulate organic carbon that is not uniformly defined, either by size or by density (Christensen, 2001; Lützow et al., 2007). Furthermore, one hypothesized and aimed to show that HWEC and MBC are not closely correlated with each other and thus deliver different information. The HWEC is known as a measure of the bioavailable and mineralizable fraction of SOC (Spohn and Giani, 2011; Heller and Zeitz, 2012). The MBC is a quantitative measure of the microbial community that plays an indispensable role in the turnover of SOC. Additionally, labile carbon fractions such as MBC quantitatively dominate in short-term turnover processes, while changes in SOC will only become significant over periods of decades. Therefore, MBC is expedient for explaining SOC dynamics (Liang et al., 2017). Determination of HWEC and MBC allows us to get a representative measure of the labile SOC pool. Labile carbon fractions were recently simulated (Wieder et al., 2015; Zhang et al., 2021), but compared with SOC, they were less considered in the past (Liddle et al., 2020).
It is well known that factors such as climate, topography, vegetation, parent material, and time are major factors influencing contents and storage of SOC (Jenny, 1941). Accordingly, large-scale (often national or continental) surveys often include geographical properties, vegetation types, general forms of land use, as well as climatic site conditions to explain the variability of SOC (Wiesmeier et al., 2014; Gray et al., 2015). Consequently, vegetation and anthropogenic influence by land use and land use changes are essential factors for modelling SOC accumulation and dynamics (Poeplau and Don, 2013; Dignac et al., 2017). The relevance of the parent material for SOC sequestration and stocks was discussed for sites and small landscapes of a few square kilometres (Barré et al., 2017; Angst et al., 2018) as well as for large areas on the scale of regions or countries (Wiesmeier et al., 2013; Vos et al., 2019). The potential influence of parent material on SOC is mostly considered by parameters of soil mineralogy and texture (Herold et al., 2014). Factors such as climate, topography, parent material, vegetation, or land use are well suited for explaining the variability of SOC at larger scales or at landscapes with a high variability concerning these factors. In contrast, for smaller, local study areas or rather uniform areas with a low factor variability, an inclusion of these factors as variables is less suitable (Wiesmeier et al., 2019).
In addition to these general factors, further parameters describing the soil composition in a more specific way become relevant at regional- or local-scale setting boundaries for SOC accumulation, e.g. by the formation of organo-mineral associations. For an identification of SOC variations due to site-specific characteristics, selected parameters are used which are mostly known as indicators for stabilization of SOC such as content of fine silt, clay, and pedogenic oxides or microbial parameters such as microbial biomass and amino sugars (Angst et al., 2018; Quesada et al., 2020). There are indications that for the explanation of SOC variability on local to regional scales soil parameters (e.g. pedogenic oxides, texture fractions) instead of factors (e.g. parent material or climate) are especially suitable. Models based on soil parameters also allow us to identify possible drivers of SOC stabilization while using the above-mentioned general factors would not deliver a satisfying result (Wiesmeier et al., 2019; Adhikari et al., 2020).
Organo-mineral associations are highly relevant for stabilization and accumulation of SOC and its labile fractions (Lützow et al., 2006). It is well known that the different mineral particle size classes vary in their ability to interact with SOC, forming organo-mineral associations (Arrouays et al., 2006; Lützow et al., 2007). On the one hand coarse particle size fractions such as sand, coarse silt (cSilt), and medium silt (mSilt) contribute less to interactions between SOC and the mineral phase, while on the other hand fine silt (fSilt) and clay dominate such interactions (Ludwig et al., 2003). In addition, the mineral composition of the fine fraction, i.e. types of clay minerals and pedogenic oxides, is relevant for the interactions of SOC with the mineral phase (Kleber et al., 2015; Porras et al., 2017). Especially iron and aluminium oxides interact with SOC, leading to its sequestration (Mikutta et al., 2006). Stabilization of SOC is further enhanced by multivalent cations such as Ca2+ and Mg2+ going along with higher soil pH (Kaiser et al., 2012; O'Brien et al., 2015). Covering on the one hand all quantitative relevant cations and on the other hand an overall measure of soil sorptive properties, the effective cation exchange capacity (ECEC) provides an overall measure to model cation impact on SOC storage (Kaiser et al., 2012; O'Brien et al., 2015). Rock fragments (soil skeleton) contribute only little to SOC storage (Poeplau et al., 2017). Anyhow, the fraction of rock fragments is considered as a relevant parameter to assess SOC accumulation due to a potential saturation effect in soils with a high rock fragment content in consequence of a disproportionately high input of organic matter in the fine soil fraction (Bornemann et al., 2011).
Consequently, understanding SOC as a dynamic equilibrium of heterogeneous compounds with distinct relationships with various components of the soil mineral phase (Lehmann and Kleber, 2015) implements that SOC accumulation is best described and predicted by a variety of soil mineral-phase parameters instead of a single predictor. Thereby combinations of parameters or factors can differ according to the considered scale. Consequently, multivariate approaches better explain the SOC variability (Heinze et al., 2018; Liddle et al., 2020) compared with bivariate linear regression models that are often unsuited at the level of local and regional soilscapes (Jian-Bing et al., 2006). The latter especially applies for studies that are limited to a single specific location or only contain a limited number of categorical variables or estimated soil parameters (Liddle et al., 2020). On the other hand, predictions based on total models, based on the largest part of the dataset, are often less site-specific and thus can possibly lead to a weaker quantification of SOC at certain sites.
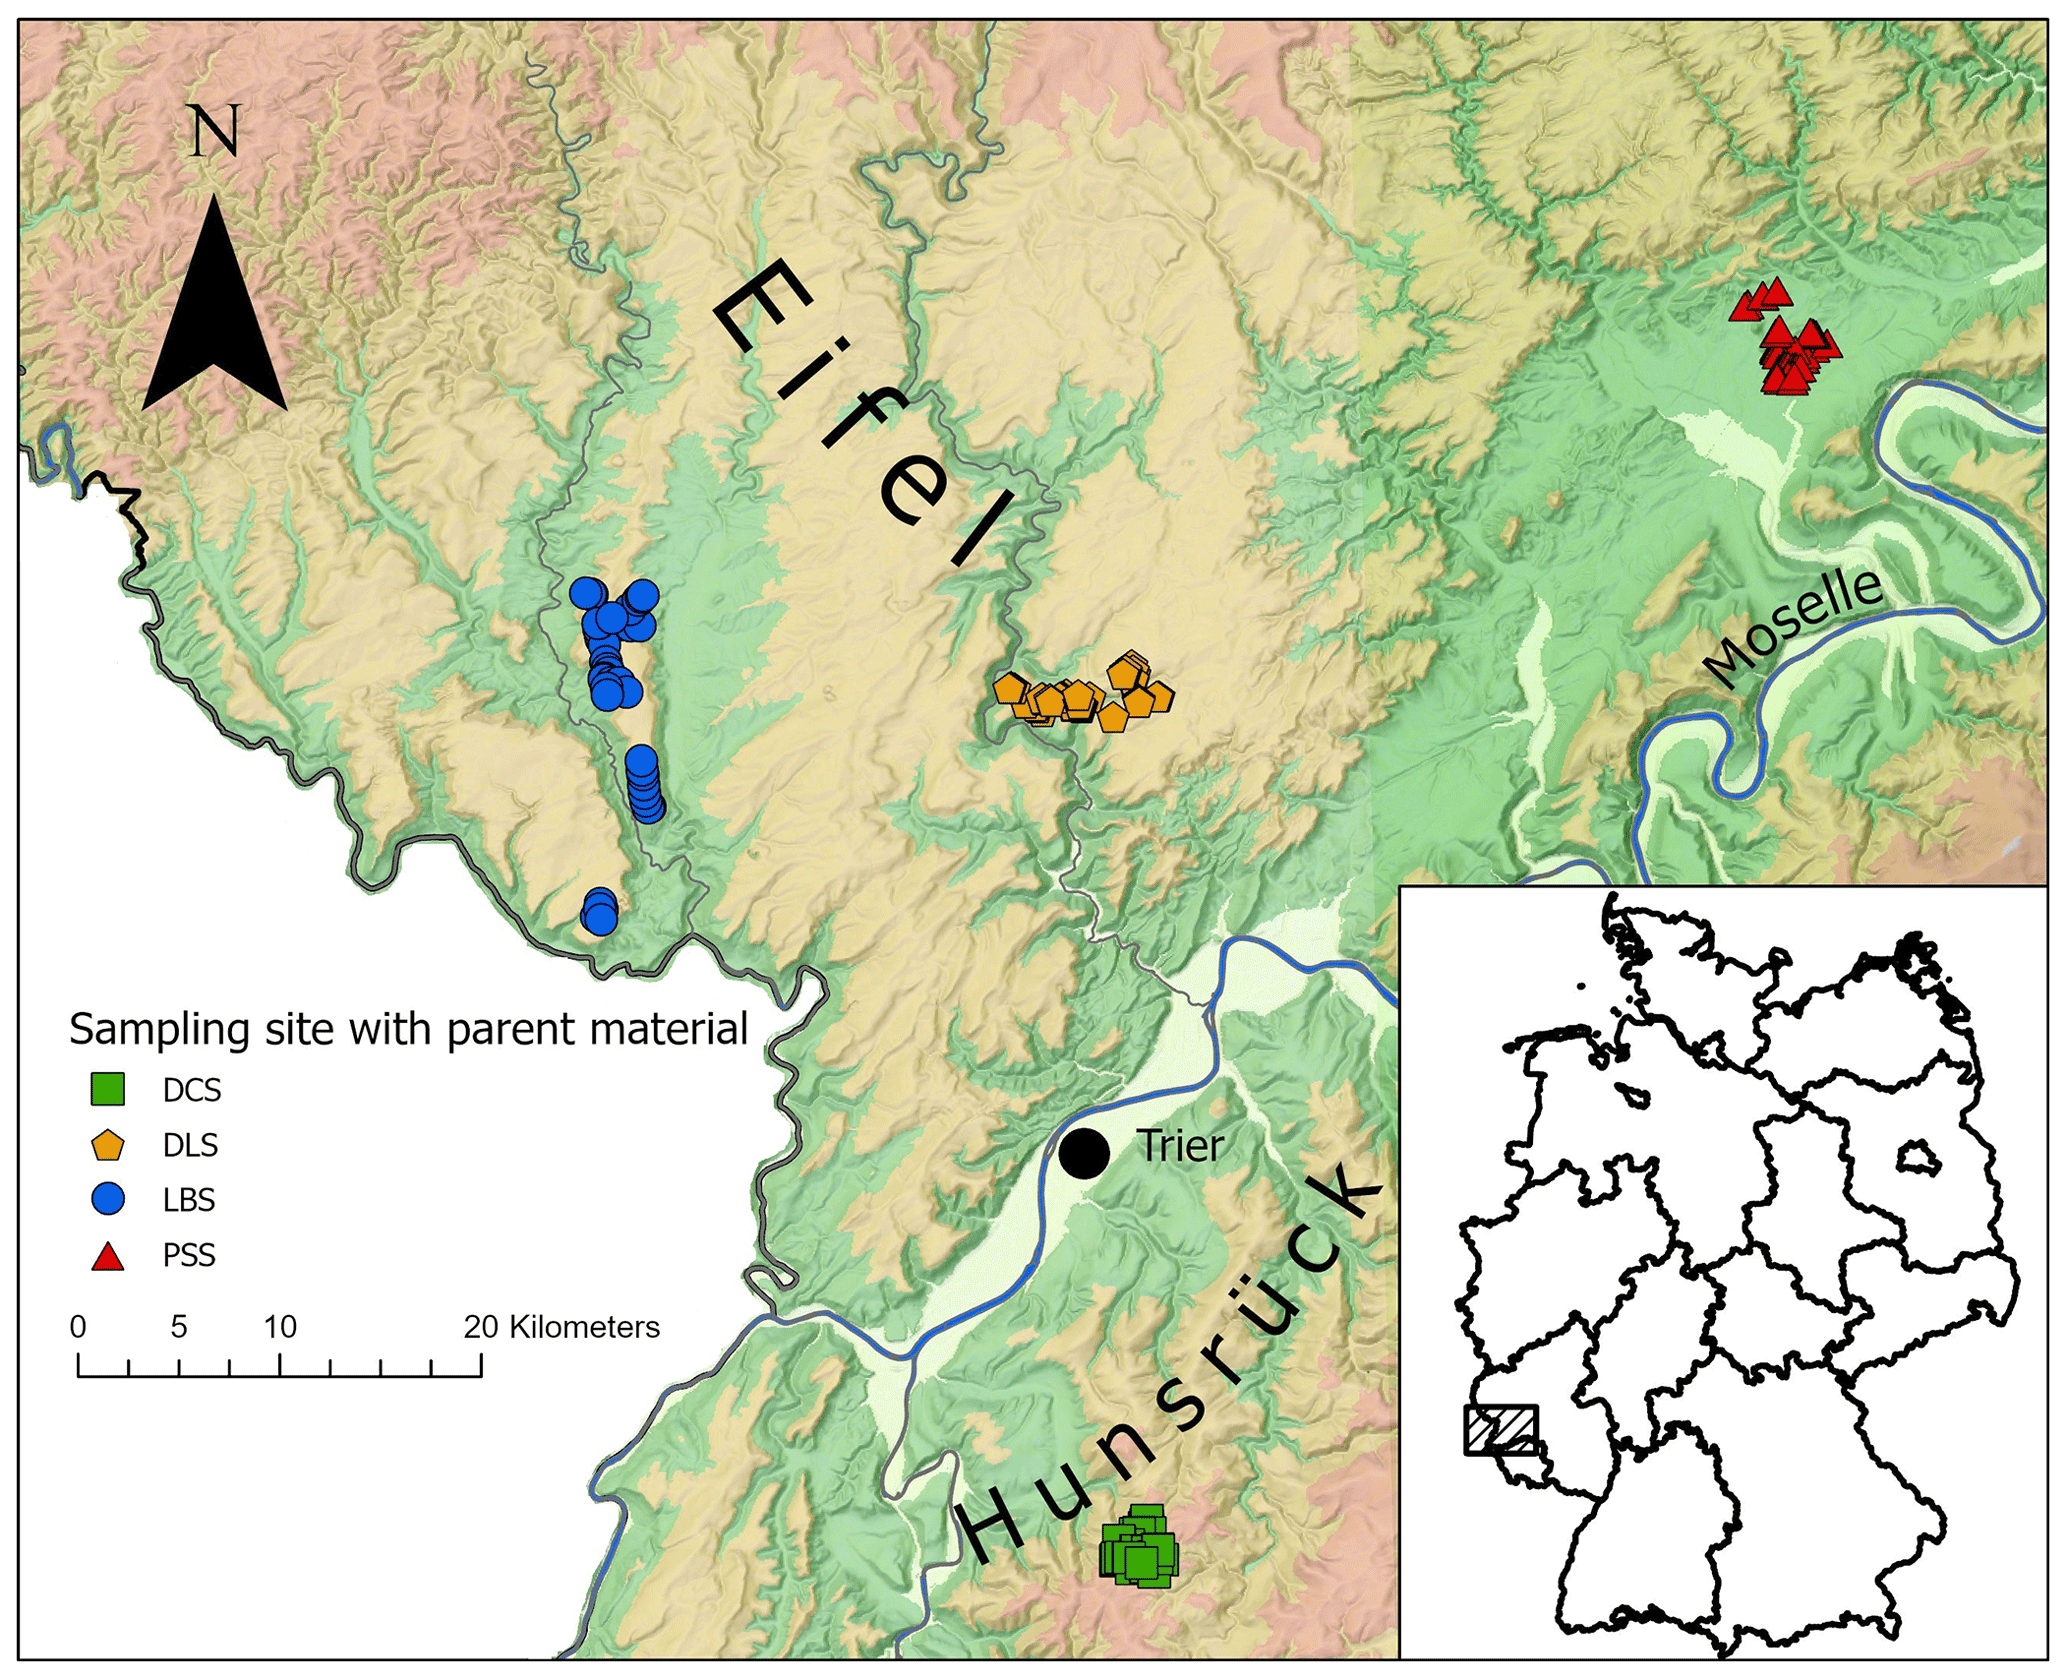
Figure 1Study area in the greater Trier region; sampling sites in the four regions with different parent material are indicated, i.e. Devonian clay schist (DCS), sandy dolomitic limestone (DLS) from the Muschelkalk, Luxembourg sandstone (LBS), and Permian siltstone and fine sandstone (PSS) from the Rotliegend (© GeoBasis-DE).
Consequently, it is required to determine parameter sets to estimate SOC and its labile fractions HWEC and MBC at a regional or landscape scale. It is necessary to identify predictor parameters and categorical environmental factors that are able to predict SOC as well as its labile fractions by using models based on local and total datasets. Differences regarding the relevance of a predictor in local vs. total models have to be identified to boost model performance and to fit adequate datasets using the best set of parameters for the prediction of SOC at the investigated location. This overall aim was investigated in this study using a dataset from four local agricultural areas in the greater region of Trier (each with a size of 5–10 km2), thus with similarity in the global factors but distinct local properties such as parent material, soil texture, and land use. Regarding the composition of the soil mineral phase, the four local areas differ among each other, but as a total dataset they represent a broad range of soil properties typical for soils in temperate regions. Therefore, the dataset enables us to verify whether the total dataset is able to cover the local variability of SOC and its labile fractions. The objectives of this study were (i) to determine best-fitting factors and parameter combinations based on identified differences in soil properties that explain the variability in SOC and its labile fractions HWEC and MBC. (ii) It was aimed to determine the suitability of local models in comparison to total models to achieve an improved quantification of SOC, HWEC, and MBC for local landscapes with distinct properties. To this end, bivariate linear regression, principal component analysis (PCA), and mixed-effect models were used in order to find out whether total models or local models are better fitting. (iii) One assessed whether local datasets show a distinct combination of significantly contributing predictor parameters compared with other local datasets and the entire dataset.
2.1 Study area
The study was conducted in the greater area of Trier in south-western Germany (Fig. 1). Bulk samples from topsoil horizons, i.e. 0–25 cm for arable and 0–15 cm for grassland soils, were taken in spring 2017 and 2018 from 199 agricultural sites used as arable land (150) and grassland (49). Similar numbers of samples were taken from four regional areas with different parent materials. Parent materials were Devonian clay schist (DCS, n=50), Luxembourg sandstone (LBS, n=50), sandy dolomitic limestone (DLS, n=50) from the Muschelkalk, and Permian siltstone and fine sandstone (PSS, n=49) from the Rotliegend (Wagner et al., 2011). Across the different parent materials, a similar proportion of samples was taken at sites under arable or grassland management. Climatic conditions in the greater area of Trier are classified as warm–temperate or fully humid with warm summer temperate (Cfb) (Kottek et al., 2006). According to the German Weather Service (DWD), mean annual precipitation is 784 mm and mean annual temperature is 9.8 ∘C. Investigated sites were dominated by the soil groups Regosol and Cambisol. The main cultivated crop plants are wheat, barley, triticale, maize, and rapeseed.
2.2 Analysis of soil properties
Samples were sieved <2 mm and the stone content (>2 mm) was determined gravimetrically. Each sample was split and stored at −20 ∘C on the one hand and air-dried on the other hand for subsequent biological and chemical soil analysis, respectively. Soil pH was measured in 0.01 M CaCl2 solution using a pH/Con 340i glass electrode (WTW GmbH, Weilheim). Particle size distribution was determined by a combination of wet sieving and the pipette method according to Blume et al. (2011). Dithionite–citrate extractable Fe (Fed) was measured according to Mehra and Jackson (1958). To this end, 2 g air-dried soil was extracted with a mixture of 1 g sodium dithionite, 40 mL sodium citrate, and 10 mL NaHCO3. Oxalate-extractable Fe and Al (Feo, Alo) were determined according to Schwertmann (1964). For extraction, 1 g air-dried soil was shaken for 2 h in the dark in 50 mL NH-oxalate (pH 3) and filtered afterwards. Extraction for the determination of the effective cation exchange capacity (ECEC) was conducted using 1 M NH4Cl. Elemental analyses for pedogenic oxides and ECEC (Na, K, Fe, Mn, Al, Ca, Mg) were done using atomic absorption spectrometry (Varian AA240 FS Fast Sequential Atomic Absorption Spectrometer; Darmstadt, Germany).
For estimation of total carbon (TC) and nitrogen, soil was dried at 105 ∘C, ground, and measured by an Elemental Analyser EA3000 Series (HEKAtech GmbH, Wegberg). For carbonate-containing soils the inorganic carbon (IC) was determined following carbonate destruction using phosphoric acid at a temperature of 100 ∘C (IC Kit combined with Elemental Analyser EA3000 Series, HEKAtech GmbH, Wegberg). SOC content was calculated as the difference of TC and IC. HWEC and hot water extractable nitrogen (HWEN) were determined following Körschens et al. (1990) using a Gerhardt Turbotherm TT 125 (Gerhardt, Bonn, Germany) for extraction of 10 g soil with distilled water (50 mL) at 100 ∘C for 1 h. After extracts cooled down, 1 mL of 0.2 M MgSO4 was added and samples were centrifuged at 1476 g for 10 min. Microbial biomass was estimated by using chloroform fumigation extraction according to Joergensen (1995) with 0.01 M CaCl2. Extracts of HWEC, HWEN, microbial biomass carbon (MBC), and nitrogen (MBN) were analysed with a TOC-VCPN analyser (Shimadzu, Duisburg, Germany). For MBC and MBN, correction factors kEC = 0.45 and kEN = 0.4, respectively, were used (Joergensen, 1996; Joergensen and Mueller, 1996). Soils were stored frozen prior to analysis for MBC and MBN because freezing does not affect the microflora (Stenberg et al., 1998). Soil respiration was measured according to Heinemeyer et al. (1989). Following a week of incubation at room temperature (20 ∘C), 25 g dry matter equivalent of sieved field moist soil was weighted in a tube that was flushed with 200 mL min−1 of CO2-free, humid air for 24 h. Evolved CO2 was determined in 1 h intervals after the soil passage using an infrared gas analyser (ADC 225 MK3, Analytical Development, Hoddesdon, England).
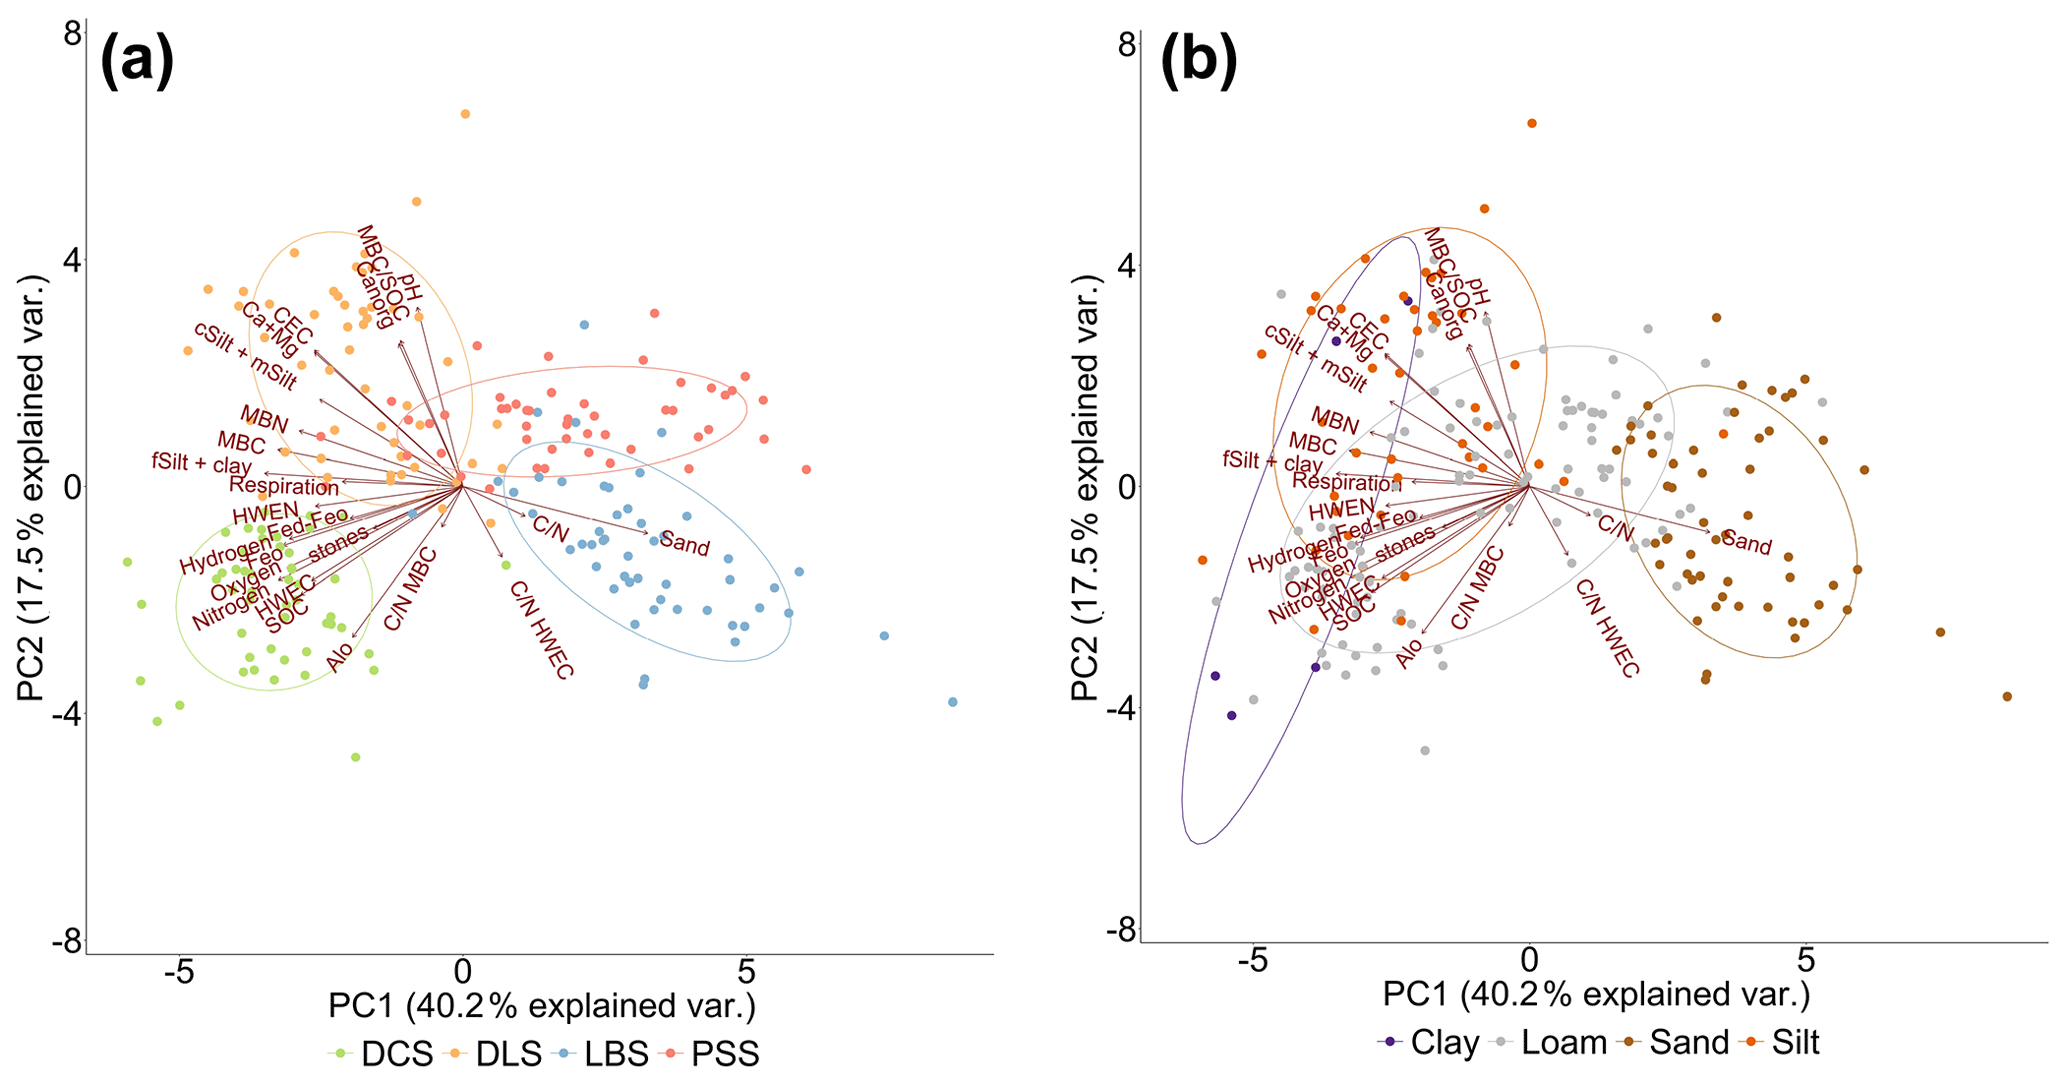
Figure 2Principal components 1 and 2 with loadings of the variables indicating the clustering of the dataset according to parent material (a) and soil texture (b). Parent materials are Devonian clay schist (DCS), sandy dolomitic limestone (DLS), Luxembourg sandstone (LBS), and Permian siltstone and fine sandstone (PSS).
2.3 Data analysis
Principal component analysis (PCA) was carried out to identify clusters within the dataset. For that purpose, 24 parameters describing the mineral phase as well as SOM were included (Table 1). To conduct the PCA, applied variables were log transformed, centred, and scaled to achieve standardized and comparable variables. Ellipses were defined by 95 % of the confidence interval according to Fox and Weisberg (2019). The cluster of clayey soils was not included in the analysis due to a small number of samples (n=5). Using single predictors, linear regressions were performed to identify significant impacts of mineral-phase parameters (e.g. Feo (g kg−1) or fSilt plus clay – %) on SOC, HWEC, and MBC for the entire dataset as well as for the identified clusters. Residues of the bivariate linear regressions were checked for normality. Mixed-effect models were determined for the entire dataset and for identified clusters. To this end, selected soil properties of the mineral phase (Fed−o (g kg−1), Feo (g kg−1), Alo (g kg−1), sand (%), cSilt plus mSilt (%), fSilt plus clay (%), (Ca + Mg)ECEC (mmolc kg−1), stones (%), and pH) were used as a fixed effect, while “parent material”, “soil texture group”, or “land use” were used as random effects. In general, as random effects only categorical variables were selected, while for the fixed effects variable mineral-phase parameters were selected. Parent material as a random effect includes the four different soil parent materials that dominate at the four sampling sites. For the soil texture group as a random effect, four levels were applied (sandy, silty, clayey, and loamy soils). The additional implementation of the soil texture groups was done to consider the potential different intercepts of the specific groups. Land use as a random effect comprised the two management practices arable and grassland. Restricted maximum likelihood was applied as an estimation procedure for the mixed-effect models. At the beginning, all selected soil properties were included in each model. Stepwise removal of the least significant parameters was conducted until all properties included in the models significantly contributed to SOC, HWEC, or MBC. Additionally, the relevance of variables was visualized by the mean values of the clusters multiplied by their coefficient received from the mixed-effect models. All parameters involved as fixed parameters in the mixed-effect models were checked for collinearity. To avoid collinear behaviour of the soil-texture-related parameters, either “sand” or “coarse silt plus medium silt” (cSilt plus mSilt) was used for model development. The two models received were compared by their Akaike information criterion (AIC) using ANOVA to identify the best model. Furthermore, ECEC was excluded from mixed-effect models to avoid overfitting due to collinearity with (Ca + Mg)ECEC. Residuals of models were examined for homoscedasticity and normality. In case these criteria were not fulfilled, the response variable was square root transformed to achieve variance homogeneity and normality. For the mixed-effect models marginal R2 ( and conditional R2 ( coefficients were estimated according to Nakagawa and Schielzeth (2013). Thereby examines the explained variance of the fixed effects, while tests the variance, including the effect of the random effects. The root mean square error (RMSE) was estimated as a measure of the model performance. Both R2 and RMSE were used for a comparative assessment of different models rather than for an absolute valuation. For the mixed-effect models, RMSE was estimated based on the comparison of predicted and measured values. To transfer the mixed-effect models of a total dataset to a local dataset, predictions were conducted by applying total models to local datasets. The predicted values of SOC, HWEC, and MBC received from the different mixed-effect models were compared with the measured values using bivariate linear regressions. This yielded R2 and RMSE as measures of goodness. All data are shown as means (± SE) if not indicated otherwise. Statistical significance is indicated with , , and . Statistical analyses were carried out using the R statistical package version 4.1.1 (R Core Team, 2021).
Table 1Soil properties in agricultural topsoils for the complete dataset and defined group levels according to parent material, land use, and soil texture class.
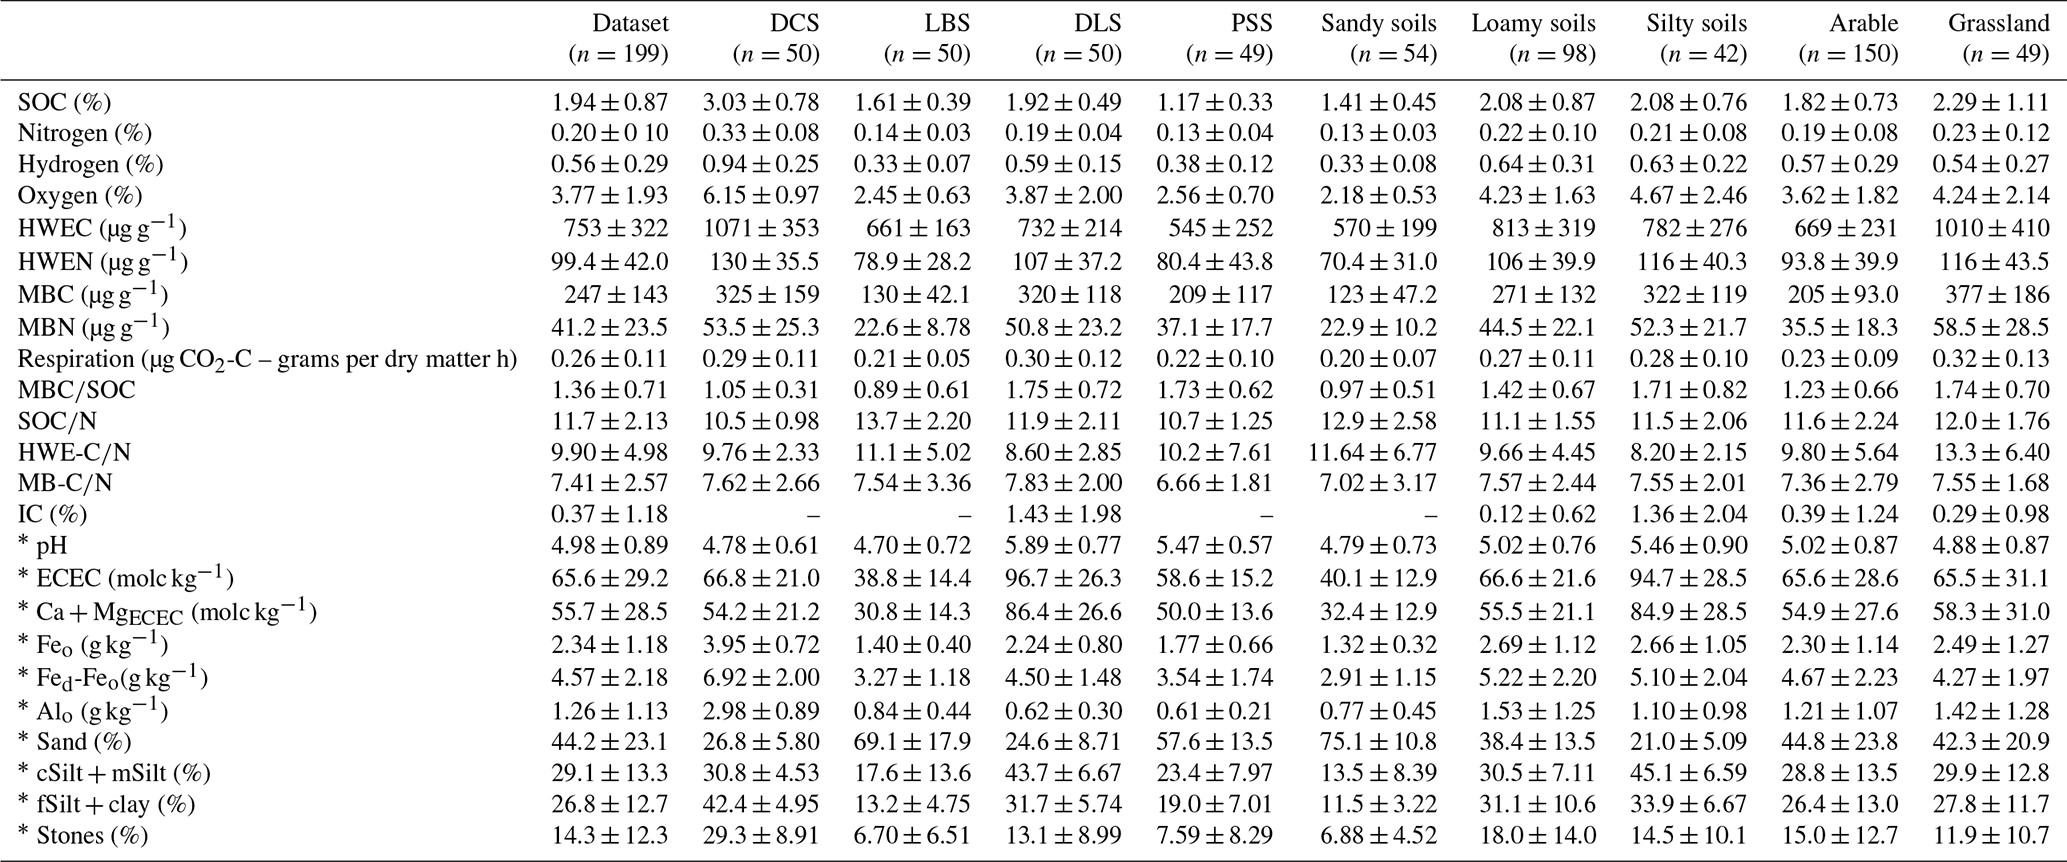
Values are means ± SD. ∗ indicates mineral-phase-related parameters which were applied in bivariate models.
3.1 Soil properties and cluster identification
The dataset covers soils with broad ranges of 24 parameters and parameter ratios of SOM, soil mineral phase, and microbial biomass (Table 1). For example, soil pH ranged from very strongly acidic (pH 3.8) to slightly alkaline (pH 7.4); soil texture varied from sandy to clayey texture. Parent materials essentially influenced characteristics of the mineral-phase-related parameters such as texture. For example, soils developed from sandy parent material such as LBS had a sandy texture with a sand content of up to 91.9 %. Soils developed from DCS and DLS parent material had elevated contents of fine silt plus clay (33.4 %–53.3 % and 16.7 %–44.8 %, respectively). Additionally, high contents of pedogenic oxides were found in soils from DCS, while ECEC and especially the contents of the polyvalent cations (Ca + Mg)ECEC were high in soils developed from DLS (Table 1). Higher contents of SOC, HWEC, and MBC were found for all parent material substrates in grassland soils compared with arable soils (Tables 1 and S1). For the entire dataset, SOC ranged from 0.38 % to 5.32 %, while ranges from 237 to 1889 µg g−1 and 52.4 to 810 µg g−1 were determined for HWEC and MBC, respectively. SOC was strongly correlated with HWEC (R2 = 0.75), while the regression with MBC was substantially lower (R2 = 0.40). The dissimilar regressions of SOC with the two labile fractions indicate differences between HWEC and MBC, which was further confirmed by the mediocre regression between HWEC and MBC (R2 = 0.55).
Table 2Loadings of the variables on the first three principal components.

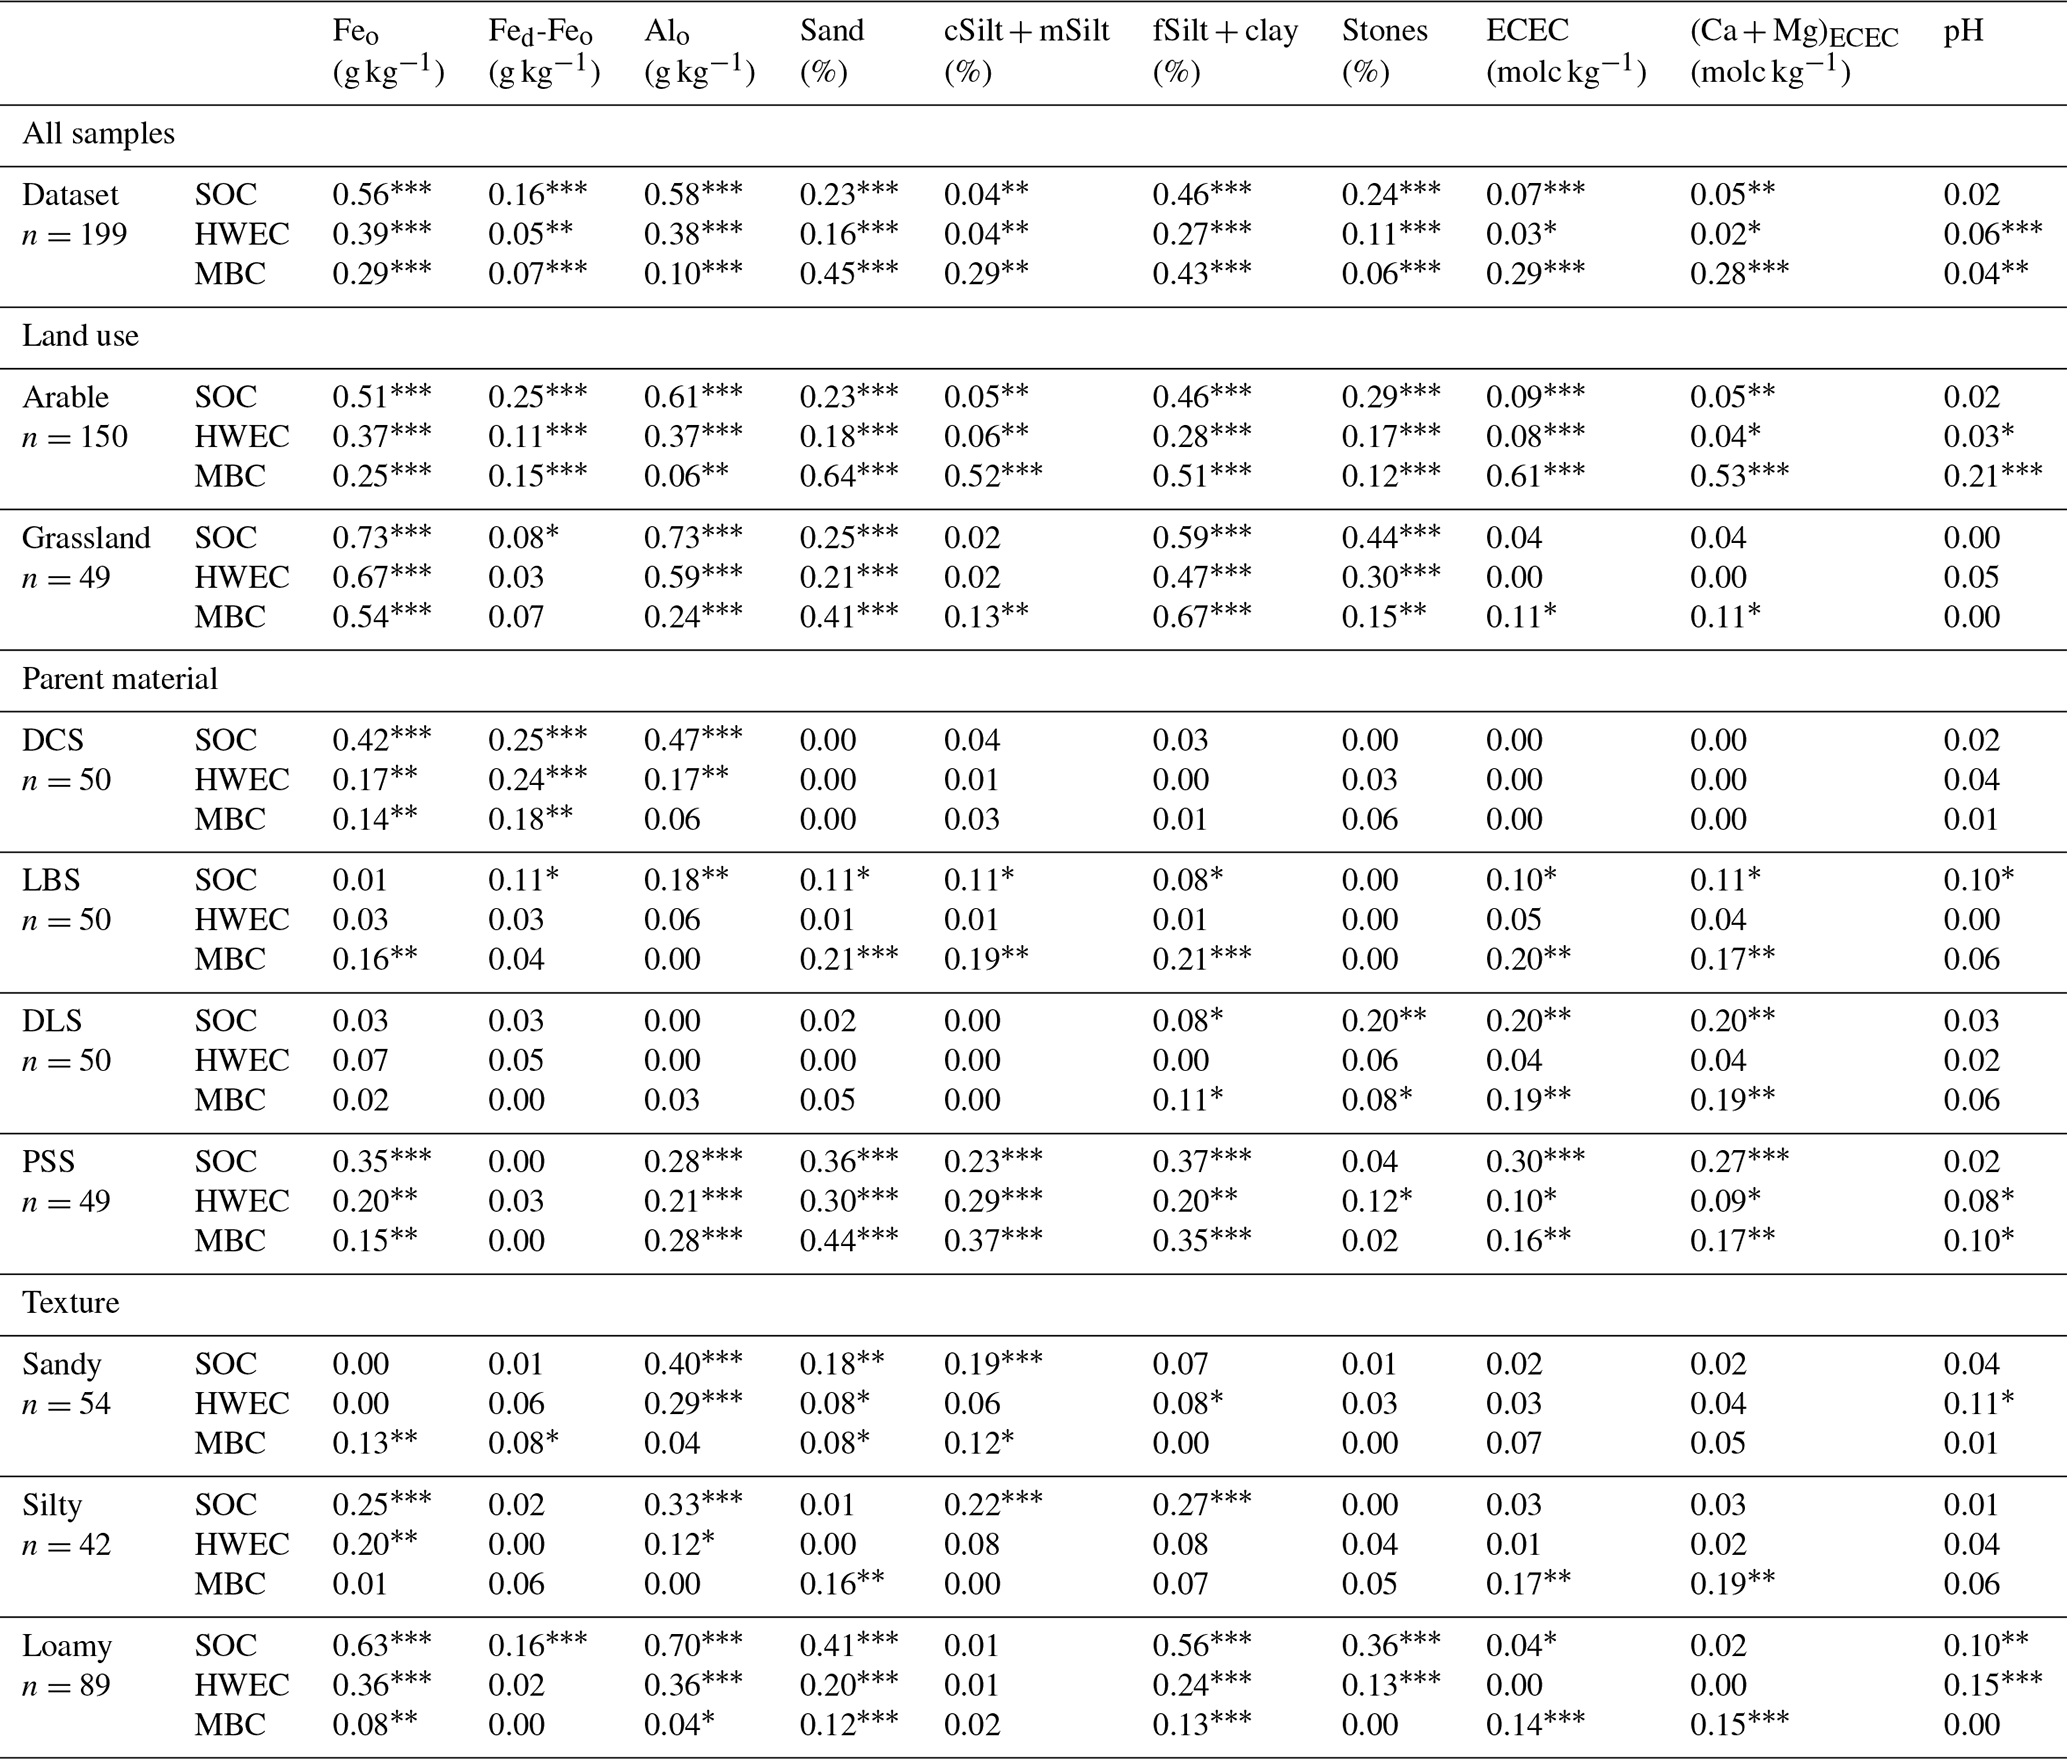
Table 3Bivariate linear regression coefficient R2 for parameters explaining the variance of SOC (%), HWEC and MBC (µg kg−1), respectively, for soils groups of different parent material, major textural class and land use.
To identify possible local clusters due to different sampling sites, parent material, or land use systems within the dataset, PCA was conducted including all 24 soil parameters and parameter ratios (Fig. 2). Principal components (PCs) 1 to 3 explained 65 % of the variance and had eigenvalues >1 (Table 2). Parameters related to the soil mineral phase loaded on all three PCs. Additionally, the highest loadings on PC 1 were found for parameters describing the composition of SOM such as content of SOC, nitrogen, hydrogen, or oxygen as well as HWEC or MBC. For PC 2 high loadings were further found for parameters related to soil acidity (pH, IC, ECEC, (Ca + Mg)ECEC) as well as for SOC and the microbial ratio . HWEC and respiration further loaded on PC 3 (Table 2). A plot of the first two PCs shows clear clusters that were strongly related to the parent materials according to the different sampling sites (Fig. 2a). In addition, samples clustered differently when assigned to different soil texture classes (Fig. 2b). Land use, however, was insufficient to explain separation into different local clusters (Fig. S1). Instead, the land use clusters covered soils from all sampling regions and property combinations and thus represented total clusters. Compared with the entire dataset or the land use clusters, the identified clusters based on parent material and soil texture covered distinct property ranges of SOC and the mineral phase (Table 1). In contrast to the local clusters, the total cluster according to land use classes mostly showed properties quite similar to the entire dataset. Overall, identified clusters strongly depended on the composition of SOM as well as on specific properties of the soil mineral phase, e.g. texture- or soil-pH-related properties. With a smaller relevance, parameters regarding the characteristics of soil microorganisms separated the dataset into clusters (Table 2).
3.2 Bivariate relationships of mineral phase and SOC and its labile fractions
In order to test whether single parameters are suitable predictors of SOC, HWEC, and MBC, 10 out of 23 parameters describing the properties of the soil mineral phase were selected from the dataset (Tables 1 and 3). Bivariate linear regressions were calculated based on the total dataset (n=199), for further total clusters (e.g. arable or grassland soils) and the local clusters that were identified in PCA, i.e. subgroups based on the four parent materials and major texture classes (Table 3). Using the complete dataset, highly significant regressions of SOC, HWEC, and MBC to most soil mineral-phase parameters were found, yet predominantly at a low level of explained variance (Table 3). Compared with the complete dataset, substantially different soil parameters explained SOC, HWEC, and MBC, especially for smaller clusters such as soils from the parent materials DCS or LBS. However, clusters comprising large sample numbers, where soil parameters cover broad ranges such as the clusters of loamy, arable, or grassland soils, showed significantly contributing parameters that were largely in line with those found to be significant for the complete dataset. All clusters differed in their pattern of significant parameters. However, for the complete dataset as well as for the clusters, the explained variance decreased from SOC to the labile fractions HWEC and MBC (Fig. 3 and Table 3). Only some properties such as sand, ECEC, or (Ca + Mg)ECEC showed for MBC a higher explained variance compared with SOC and HWEC (Table 3). For the entire dataset the content of SOC was best explained by Alo and Feo as a predictor parameter (R2=0.58 and 0.56, respectively), while soil-texture-related properties such as sand or fSilt plus clay explained SOC on a lower level (Table 3). Other determined mineral-phase parameters such as cSilt plus mSilt or ECEC explained variance to a negligible extent (Table 3). With lower values for R2, HWEC was explained by similar soil mineral-phase parameters, as was the case for SOC. With a R2 of 0.39 and a variance of 0.38, HWEC was best explained by pedogenic oxides (Feo and Alo, Table 3). In contrast, the predictors for MBC were quite distinct. Especially parameters related to soil texture such as fSilt plus clay (R2=0.43) or sand (R2=0.45) better explained the variance of MBC compared with HWEC (R2=0.27 and 0.16, respectively). Nevertheless, none of the applied parameters could explain in all cases the complete variance of SOC, HWEC, or MBC to a higher extent (R2>0.75). Explained variance of SOC and its labile fractions varied strongly between the parent material clusters. In general, the variance in these clusters was explained to a substantially lower extent compared with the whole dataset (Table 3). In most cases, parameters of soil texture and pedogenic oxides correlated significantly with SOC, HWEC, and MBC. In addition to these parameters, (Ca + Mg)ECEC was useful for predicting SOC and MBC for some parent material clusters (Table 3). The highest values of R2 were reached for the regression between SOC and Alo and Feo (0.47, 0.42) in the cluster DCS and fSilt plus clay (0.37) in the cluster PSS. R2 was even lower in the clusters LBS and DLS, with maximum values of 0.21 and 0.20, respectively. Furthermore, the cluster of loamy soils was also best described by parameters representing pedogenic oxides and texture. Much lower R2 were found for the sandy and silty soil clusters with Alo and texture parameters (sandy) and additionally Feo (silty) as the best descriptors. While for SOC, HWEC, and MBC mostly the same descriptors were found (yet on a different level of R2), they were partially different for MBC of the clusters silty and loamy soils.
Comprising soils from all identified clusters, the sets of descriptor parameters of the land use clusters were comparable to those of the total dataset (Table 3). However, the variance of SOC and its labile fractions were explained by bivariate linear regressions to a much higher extent for the total dataset and the clusters of arable soils and especially grassland soils compared with the clusters based on parent material and texture (Table 3). The clusters of both land use types largely overlapped and contained a similar proportion of samples from each parent material. Therefore, they can act as total clusters. While SOC was explained by interactions of numerous different parameters (up to eight) for the distinct factors, fewer variables showed a significant contribution to explain the variability of HWEC and MBC (Table 3).
3.3 Estimation of SOC and its labile fractions by mixed-effect models
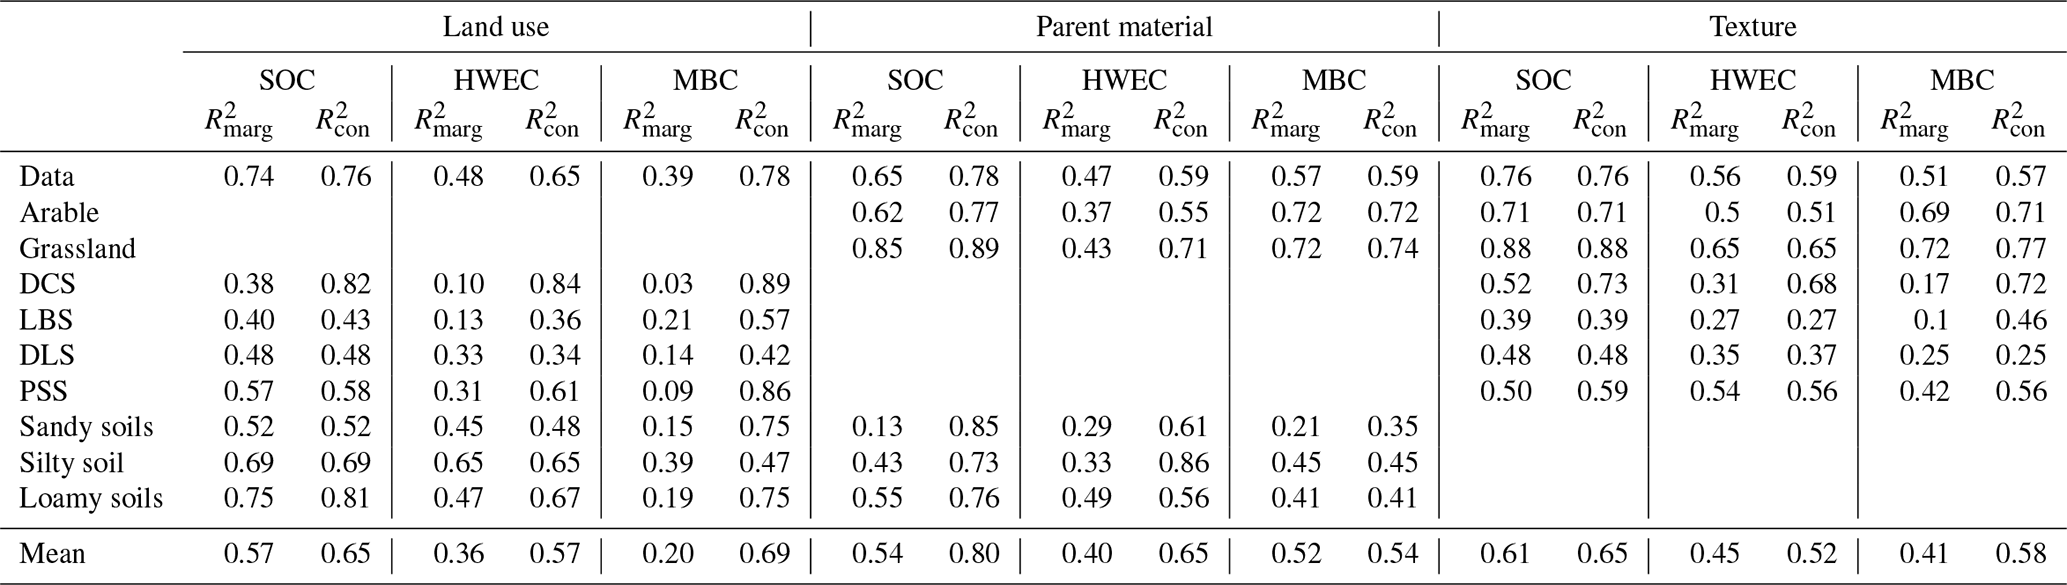
Since bivariate linear models mostly explained SOC, HWEC, and MBC only to a small extent (R2<0.5), mixed-effect models were developed. In these models, mineral-phase parameters were applied as fixed effects, and land use, parent material, and texture were used as random effects (Table 4, Figs. 4 and 5). Variability of SOC, HWEC, and MBC was much better explained than by linear regressions, indicating that organic matter depends on complex interactions of several components of the mineral phase. Based on marginal effects, the mixed-effect models explained the variance in most cases in the order SOC > HWEC > MBC (Fig. 3, Tables 4 and 5). The mixed-effect models reached a higher explained variance and mostly lower RMSE for SOC (–0.89, RMSE = 0.21 %–0.42 %) compared with the bivariate regressions (R2=0.00–0.73, RMSE = 0.27 %–1.12 %). Data for RMSE are listed in Table S2. Accordingly, the mixed-effect models yielded a higher explained variance for HWEC and MBC. Representing the explained variance of the fixed effects, the revealed for the majority of the clusters a large explained variance, but even in the cases of low several of those clusters had a high . This highlights the relevance of the random effects (Table 4). Applying different random effects resulted in large differences in for some clusters (e.g. “sandy soils”). In particular, modelling the labile fractions was more affected by the different random effects, showing mostly the highest values if land use was applied as a random effect.
Independent of the applied random effect, explained variance increased with sample number and width of the data range of parameters. Consequently, the best model performance was achieved for the complete dataset as well as for the total clusters. Similar model performance was only found for some local clusters (e.g. DCS), while models for other local clusters such as LBS, DLS, or sandy soils revealed the poorest yet still better (Rcond≥0.39, RMSE≤0.40 %) estimates of SOC compared with bivariate regression models (Tables 3 and 4). In general, applying random effects such as parent material, land use, or texture for mixed-effect models led to distinct results for the prediction of SOC, HWEC, or MBC (Table 4). For clusters according to land use, variance was explained to a high extent (mean of 0.66 and 0.77 for clusters of arable soils and grassland, respectively). Models using parent material or texture as random effects mostly showed minor differences for predictions of SOC, HWEC, or MBC. Anyhow, for some local clusters (e.g. DCS, LBS, and DLS) distinct results were found. Models using land use as a random effect were partly distinct, though, indicating the different influence of land use on SOC and its labile fractions (Table 4).
Table 4 and of the models for SOC, HWEC, and MBC based on the results of mixed-effect models.
The different mixed-effect models particularly comprised variables (Figs. 4 and 5) that also proved significant in the bivariate linear regressions (Table 3). Mineral-phase parameters contributed with different significance to the models for SOC, HWEC, and MBC. The SOC and HWEC were primarily explained by pedogenic oxides followed by soil-texture-related parameters. Not least, soil acidity specified by pH and (Ca + Mg)ECEC was also relevant. MBC, compared with SOC or HWEC, was better explained by parameters linked to soil texture. Contribution of the variables on SOC and its labile fraction was visualized using the mean values multiplied by their coefficients (Figs. 4 and 5). Distinct significant parameter combinations explaining SOC, HWEC, and MBC were also found between the total dataset and local clusters (Tables 3 and S3, Figs. 4 and 5). For example, within the soil-texture-related clusters, pedogenic oxides, (Ca + Mg)ECEC, pH, and texture parameters were relevant to estimate SOC, HWEC, and MBC (Table 3, Figs. 4 and 5). Regarding the random effects, applied mixed-effect models using the parent material as a random effect explained the variability of SOC best (Table 4). For MBC and HWEC, however, the highest explained variance was mostly obtained with land use as a random effect (Table 4). Only estimates of HWEC for the texture clusters were better when the parent material was used as a random effect.
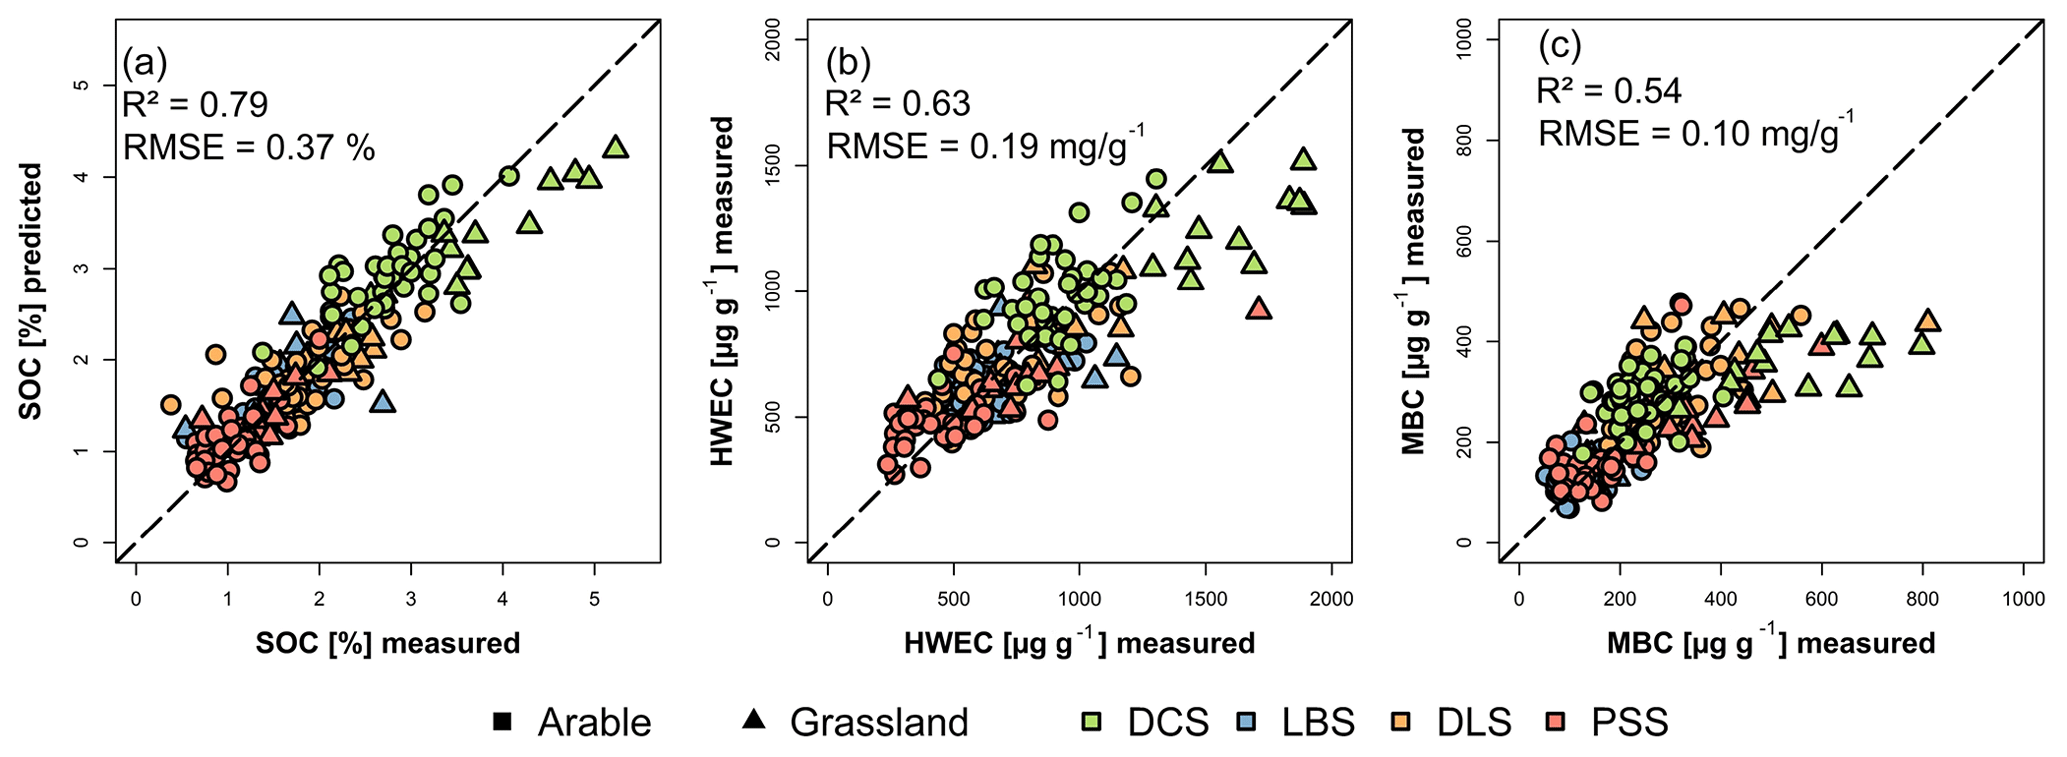
Figure 3Predicted vs. measured content of SOC (a), HWEC (b), and MBC (c) for the global (complete) dataset based on mixed-effect models. Parent materials are Devonian clay schist (DCS), sandy dolomitic limestone (DLS), Luxembourg sandstone (LBS), and Permian siltstone and fine sandstone (PSS). RMSE is given in % for SOC and in mg g−1 for HWEC and MBC.
3.4 Comparison of total and local explained variability
Predictions for SOC, HWEC, and MBC were conducted based on the mixed-effect models. Subsequent linear regression between measured and predicted data showed a close relationship along the 1:1 prediction line leading to a high explained variance (Fig. 3, Table 5). For these regressions the explained variance was mostly similar to . Especially for the total clusters, i.e. the total dataset and data clustered according to arable or grassland land use, the best results were obtained. However, this was at least partly due to a larger sample size and a broader range of parameter values compared with the various local clusters. Applying a total model for SOC estimation to a smaller local cluster dataset clearly revealed an inferior explained variance of the total compared with the local model (Fig. 6). Alongside decreasing explained variance, RMSE values were mostly increasing if a total model was applied to a local dataset. The higher explained variance of specific local models and parameter combinations was also found for other local clusters (Tables 6 and S4). By transferring a total model to local clusters, the explained variance differed for SOC by up to 20 %, while RMSE differed by up to 0.25 %. Also, in case a total model was transferred to a local dataset to estimate HWEC or MBC, the explained variance decreased by up to 17 % for HWEC and MBC. The RMSE increased by up to 0.07 and 0.06 mg g−1 for HWEC and MBC, respectively.
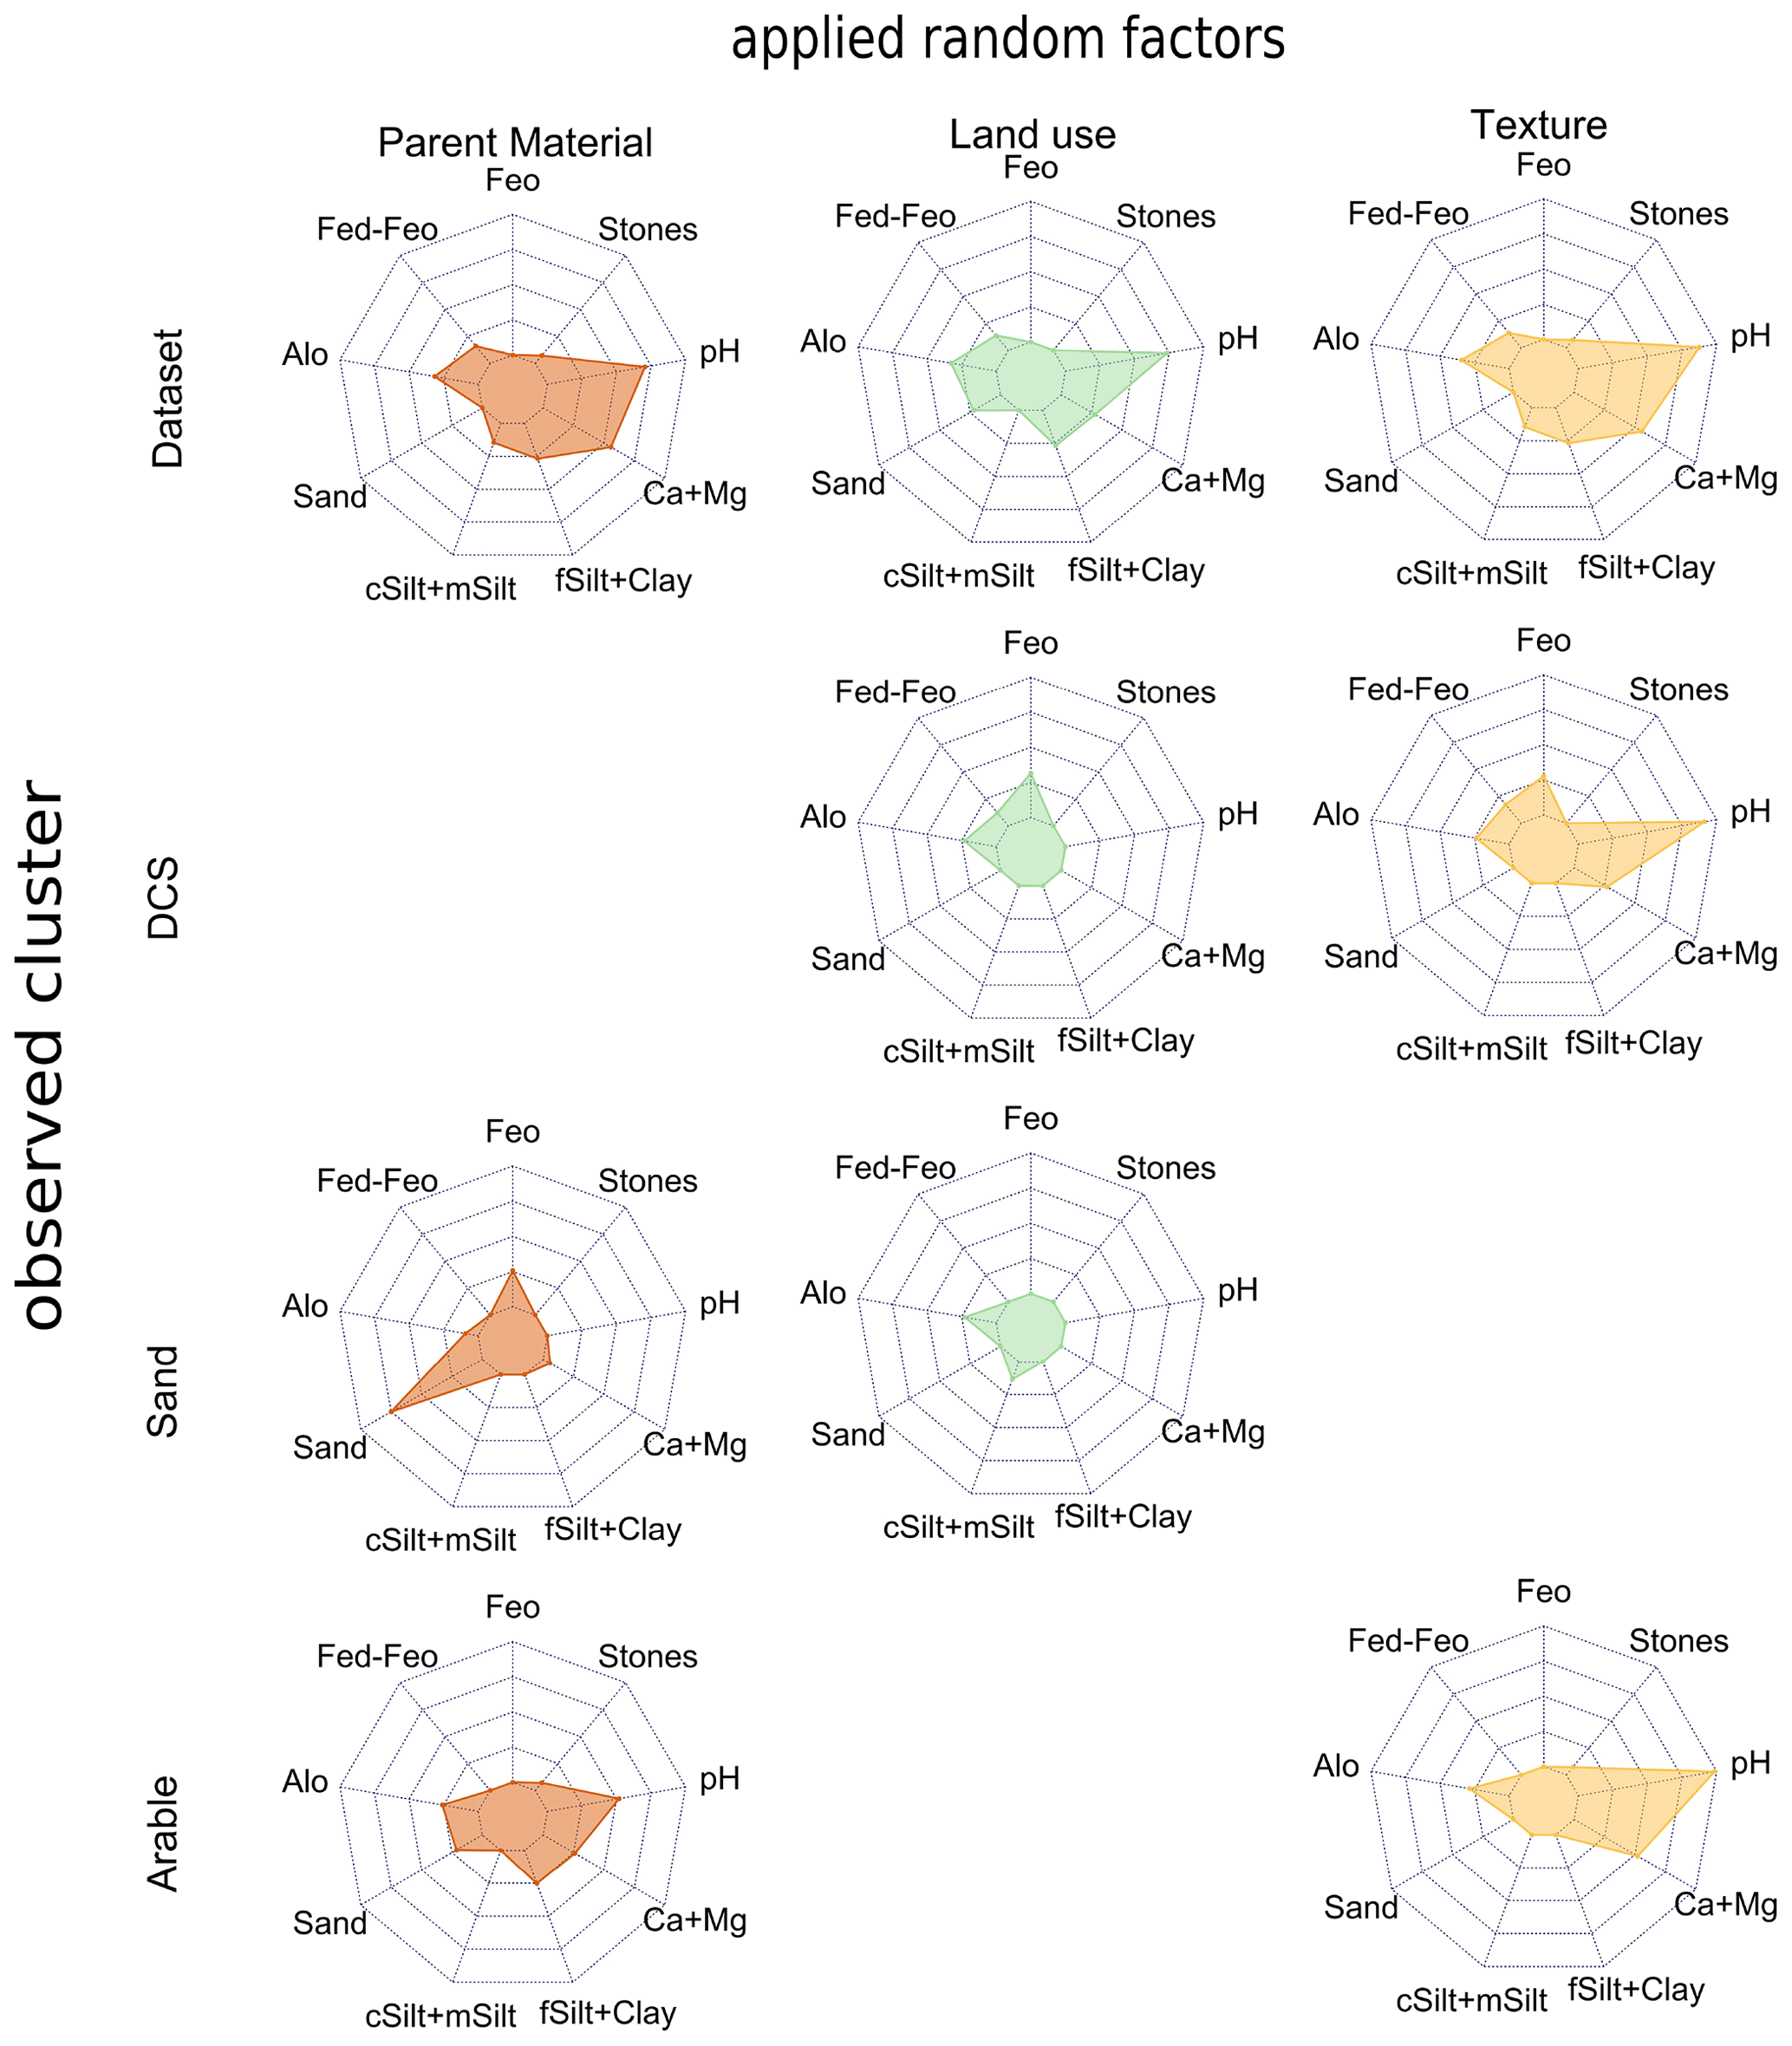
Figure 4Coefficients of the mixed-effect models to predict SOC multiplied by the mean values of the specific cluster indicating the impact of the applied variables. Differentiation into clusters and used random factors. Variables are scaled from 0 to 1.
Table 5R2 and RMSE of the models for prediction of SOC, HWEC, and MBC based on the results of mixed-effect models. RMSE is given in % for SOC and in mg g−1 for HWEC and MBC.
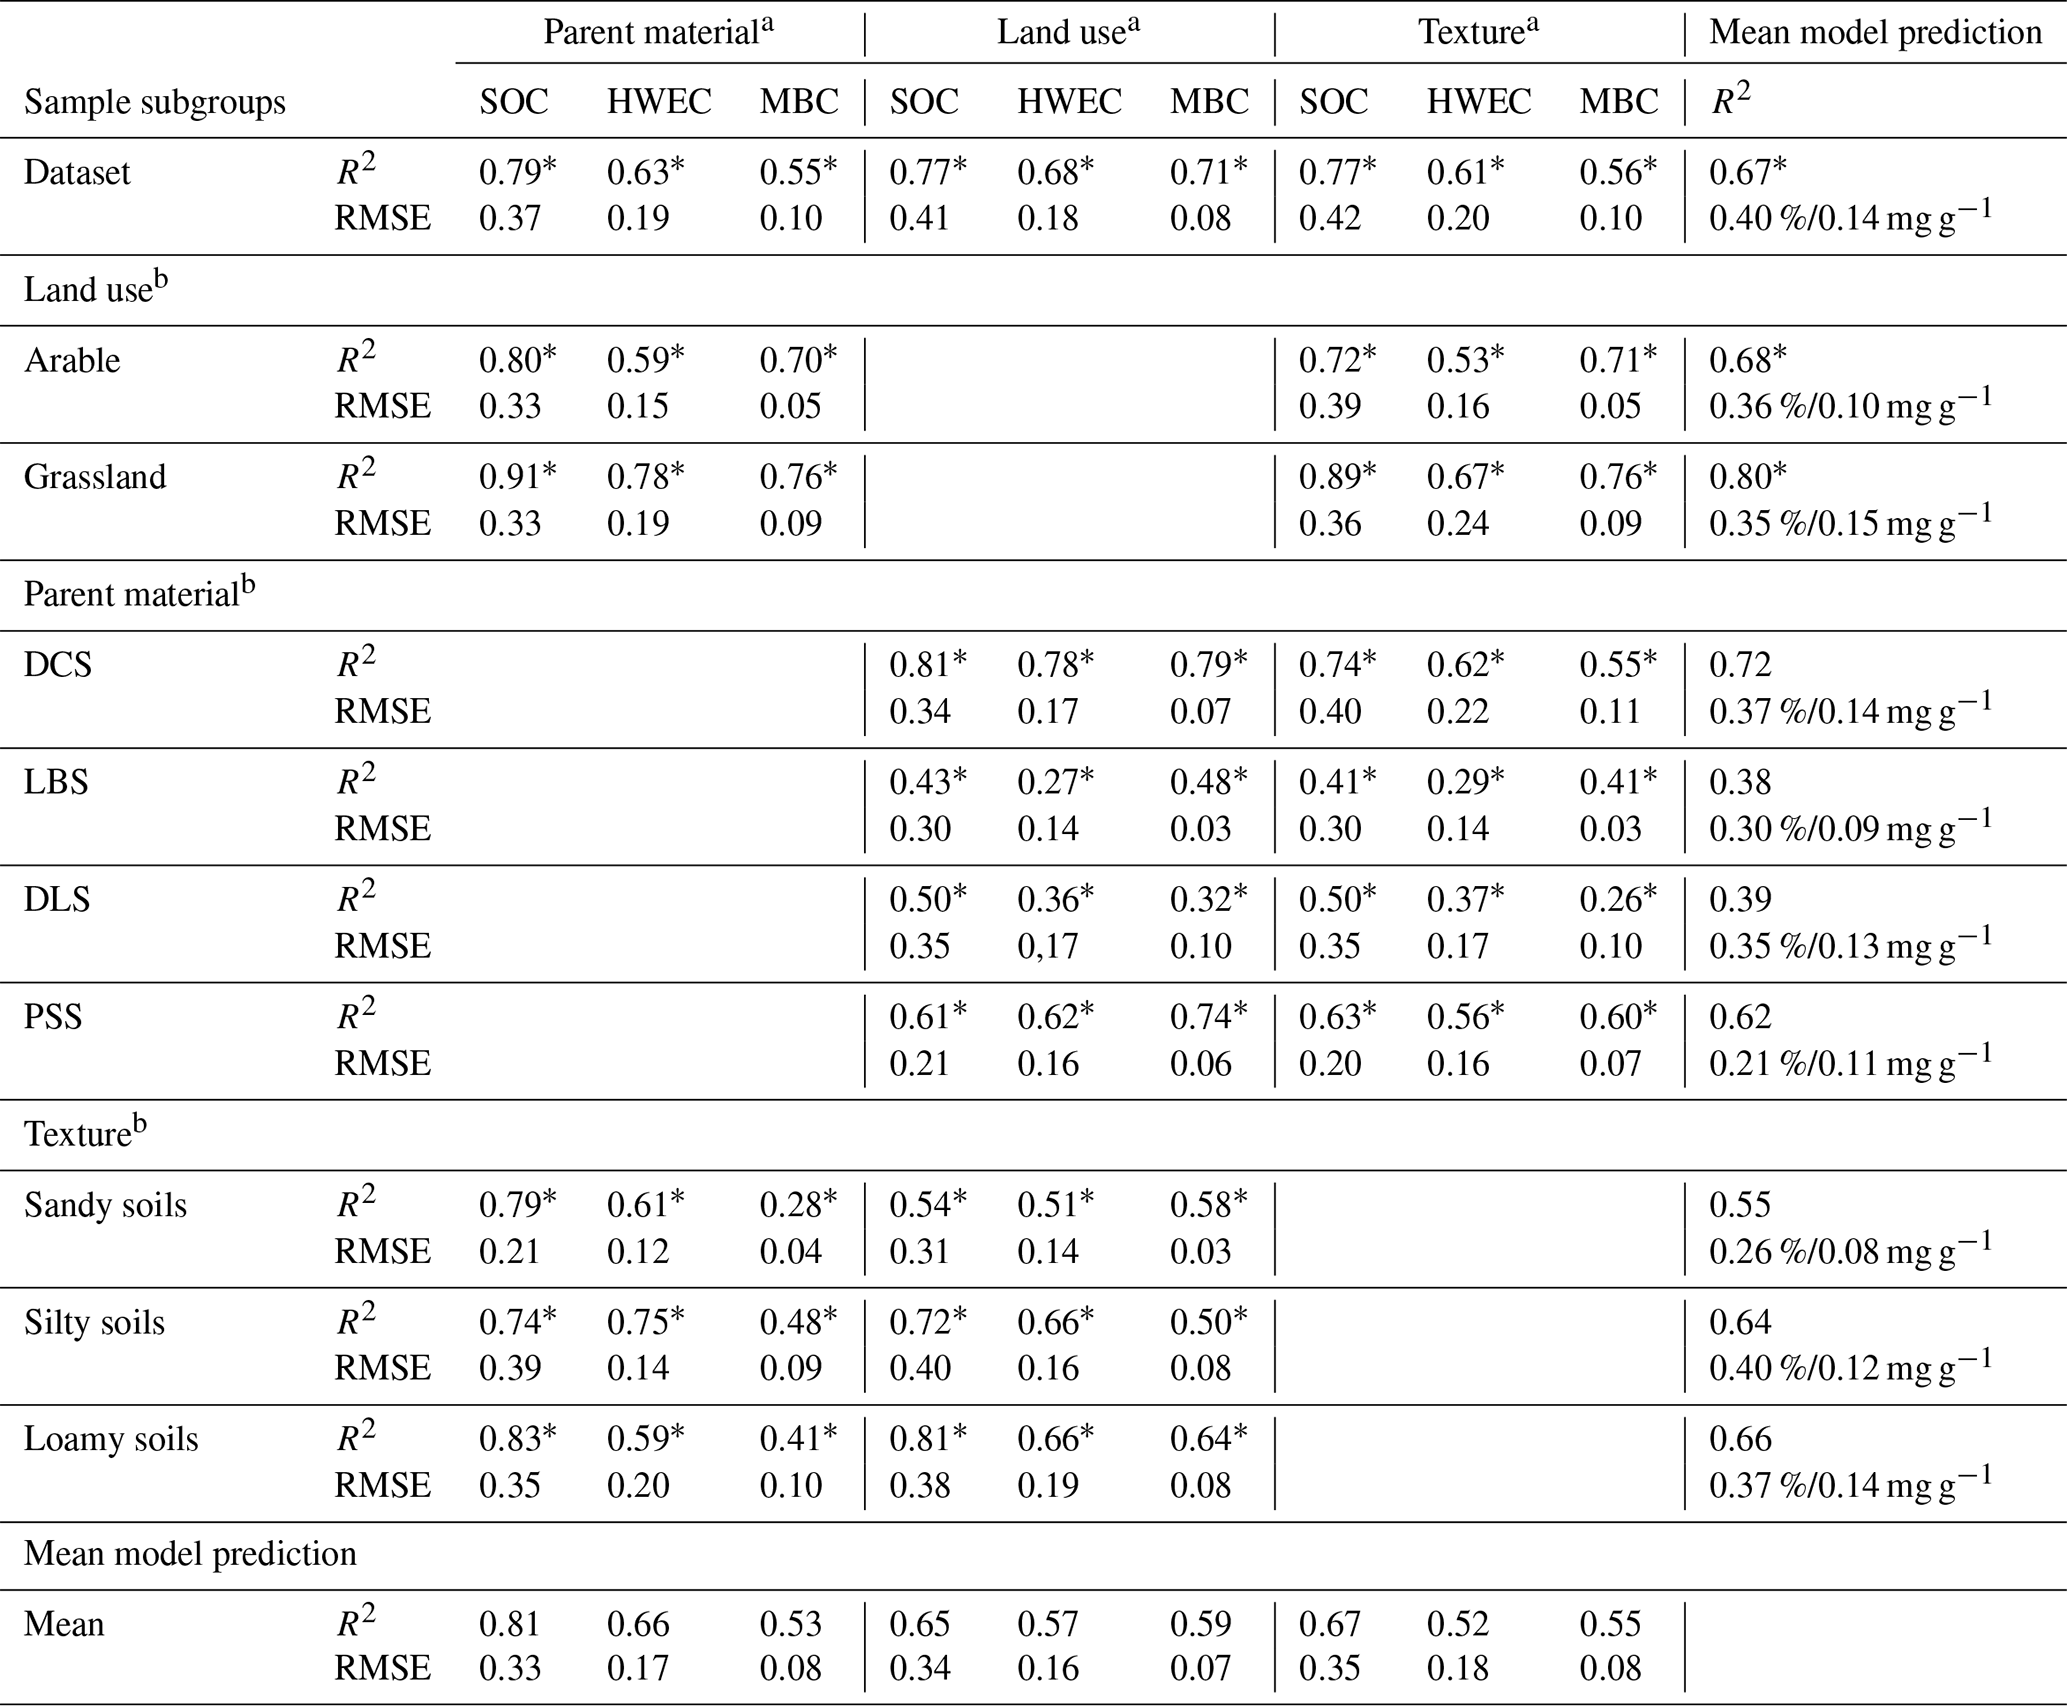
a Applied random effect; b Not all random effects could be applied to this group of clusters because of missing factor levels. ∗ Significant at a level of <0.05.
4.1 Bivariate relation of soil mineral-phase characteristics to SOC and its labile fractions
Our study showed that interactions of SOC with the mineral phase are highly relevant for the content of SOC as well as of its labile fractions HWEC and MBC in soils. High regression coefficients of SOC to fSilt plus clay (Table 3) agree with reports on the relevance of organo-mineral associations for the stabilization of SOC and, related to this, the accumulation of the labile fraction HWEC and MBC (Lützow et al., 2006). Furthermore, sandy soils contained the lowest content of SOC, while loamy and silty soils had an equally higher content of SOC (Table 1). This is typically expected and confirms numerous previous reports, e.g. Ludwig et al. (2003) and Vos et al. (2018). In contrast, for the LBS cluster with its very sandy soils, a slightly positive effect of sand on SOC was found. This, however, is most likely a consequence of agricultural practice, with high manure application to the LBS soils in the sampled area. This was further confirmed by factor of 1.2 higher ratios of and as well as by a lower oxygen content of SOM compared with soils of the other parent material clusters (factor of 0.6; Table 1). Besides parameters directly related to soil texture, pedogenic Al and Fe oxides were found to be strong predictors of SOC in soils. For example, Kaiser and Guggenberger (2000) and Lützow et al. (2006) showed that Al and Fe oxides have a relevant influence on the accumulation and stabilization of SOC as well as a high affinity for retaining components of the labile SOC fractions (Kaiser and Zech, 1998; Kaiser et al., 2002). Although soil acidity strongly affects soil processes such as microbial activity and turnover that are relevant for SOC accumulation (Kemmitt et al., 2006), no clear relation between pH and SOC or its labile fractions was found by bivariate linear regression. However, soil parameters that are strongly related to soil acidity, i.e. ECEC as well as the content of exchangeable polyvalent cations such as Ca2+ and Mg2+, were suitable predictors for SOC and its labile fractions in this and previous studies (O'Brien et al., 2015; Rasmussen et al., 2018). This is causally explained by the stabilization of SOC in organo-mineral associations and the contribution of multivalent cation bridges (Ca2+ and Mg2+) to it (Kaiser et al., 2012). The even higher ability of the content of pedogenic oxides to explain variance of SOC and its labile fractions was indicated in this study for several clusters (total and local) by bivariate regressions (Table 3). This corresponds to findings of Rasmussen et al. (2018). They found a prevalence of pedogenic oxides in humid areas with moderately acidic soils, while exchangeable Ca and clay prevailed in soils of dry climates with circumneutral to alkaline pH. Such a case-specific prevalence of parameters to predict SOC, HWEC, or MBC demonstrates that it is preferred to use specific parameter sets when it is aimed to focus on local areas. In this study, ECEC and (Ca + Mg)ECEC were not generally applicable as predictors, but it strongly depended on the parent material and texture cluster. For example, ECEC and (Ca + Mg)ECEC were found to be relevant for the clusters of DLS and PSS, while for DCS they were of minor importance. The bivariate models revealed that the stone content had only a small impact on SOC, HWEC, and MBC. Hence, a funnel effect of the stone content, by funneling more SOC into the remaining fine-textured soil (Bornemann et al., 2011), was irrelevant.
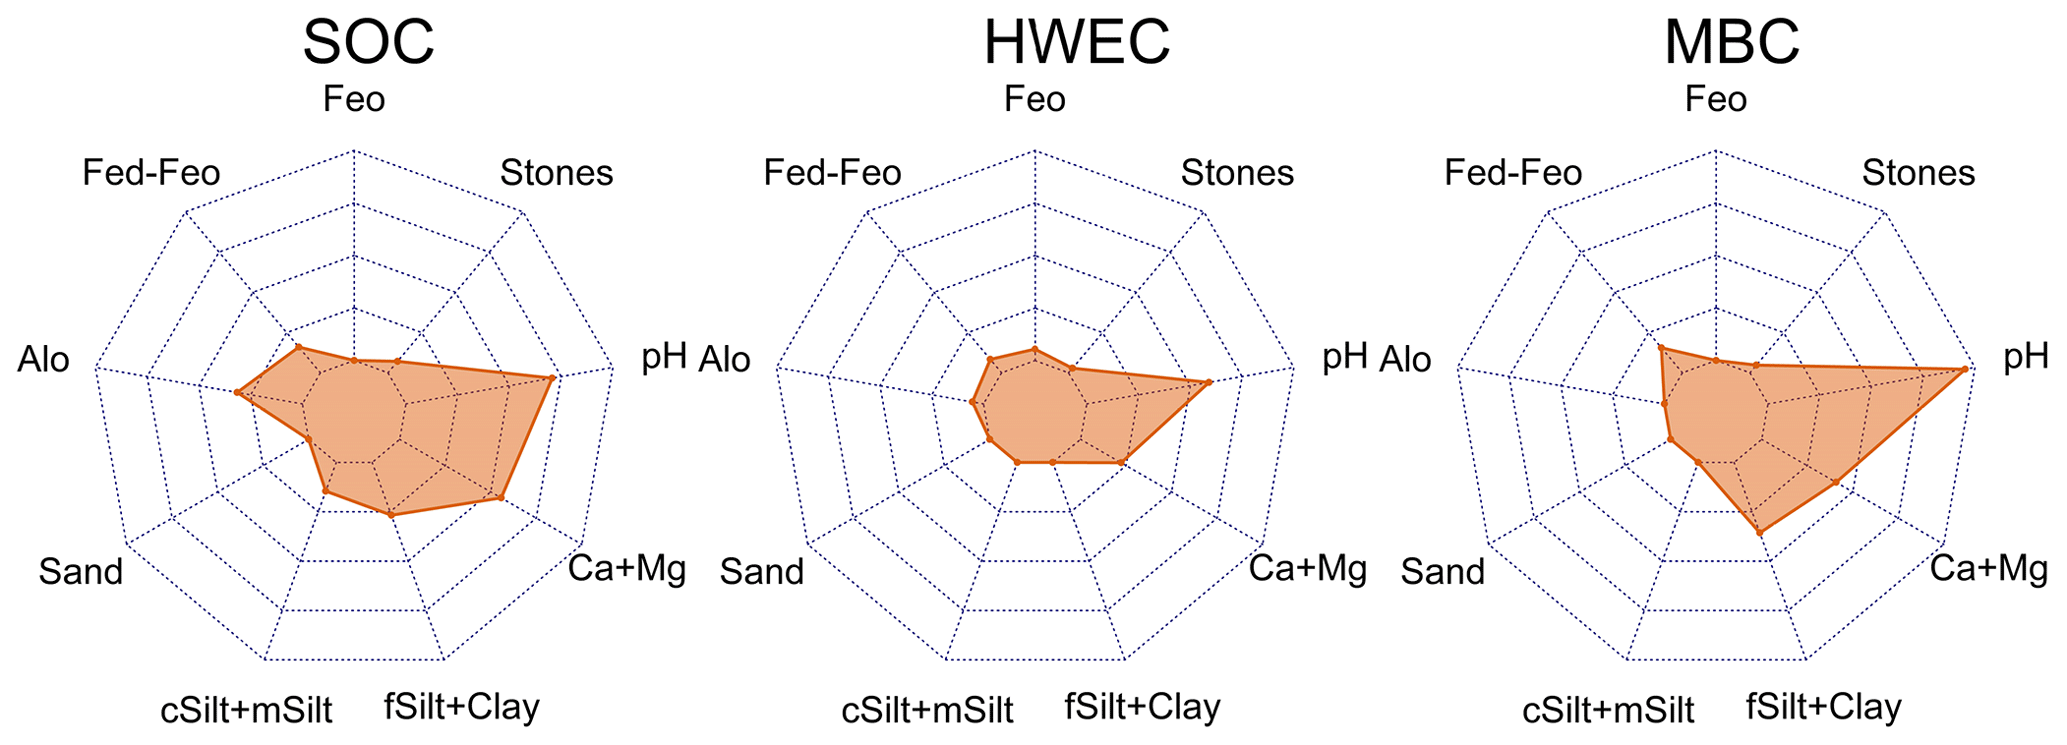
Figure 5Comparison of the coefficient impact for mixed-effect models to predict SOC, HWEC and MBC for the entire dataset by using parent material as a random factor. Variables are scaled from 0 to 1.
4.2 Explanation of variance by multivariate parameter combinations for local and total datasets
The combinations of factors and soil properties affecting SOC and SOC fractions, respectively, were dissimilar between the different local areas investigated in this study. The PCA revealed that differences according to parent material and soil texture were most relevant to separate the dataset into various local clusters based on different factors (Fig. 2a, b; Table 2). At the same time, this illustrates the importance of the mineral composition (parent material) and grain size (soil texture) for the accumulation of SOC as well as its labile fractions HWEC and MBC. In contrast, land use was not useful for a separation into clusters. This was unexpected because typically topsoils under grassland have higher SOC contents compared with arable soils (Poeplau et al., 2020), which was largely confirmed for the samples investigated in this study (Table 1). This went along with differences in the composition of SOM (Tables 1 and S1). However, data ranges of SOC, HWEC, and MBC contents were largely overlapping, and similarities even increased in PCA when further soil properties were included. In comparison, mineral-phase soil properties clearly separated the dataset. Consequently, a broad scatter of the land use clusters was obtained by PCA, suggesting treating the land use clusters as total datasets as well.
Several studies with large datasets covering national or continental scales, e.g. soil inventories, pointed out the relevance of combinations of multiple factors and parameters instead of using single predictors to estimate SOC or its labile fractions (Wieder et al., 2015; Vos et al., 2018; Gray et al., 2019). Furthermore, local studies covering small areas with narrow ranges of soil properties often show weak bivariate relationships between SOC and components of the mineral-phase or environmental factors (Jian-Bing et al., 2006; Liddle et al., 2020). Accordingly, models focused on specific local clusters and, combined with multiple parameter sets, were superior compared with the total model that was developed for the total (entire) dataset to estimate SOC, HWEC, or MBC (Fig. 6). The different parameter combinations indicate that distinct properties of the mineral phase control SOC, HWEC, and MBC in the soils of the different clusters. Understanding SOC as a continuum (Lehmann and Kleber, 2015) implies that accumulation of SOC is a multidimensional process where SOC is simultaneously affected by several soil properties and factors. Hence, SOC accumulation and variability depend on various interacting factors and soil properties, respectively. The substantially lower ability of bivariate models to estimate SOC compared with multiple parameter models is in line with this assumption. Accordingly, it was superior to use multiparameter mixed-effect models to estimate SOC and the two labile fractions. Especially parameter combinations within the land use clusters gained a high explained variance (Tables 3 and 4). A comparison with studies on a regional or national scale (Vos et al., 2018; Mayer et al., 2019) suggests that the importance of factors such as land use, soil texture, or parent material varies with the observed scale. Wiesmeier et al. (2019) reported that soil texture, land use, and land management are relevant for explaining SOC variability at all scales. On regional or larger scales, environmental factors such as climate, geology, soil use, or topography are also relevant for SOC. However, at local or smaller scales, factors such as climate become less important, while parameters representing small-scale soil physico-chemical properties gain importance for explaining the variability of SOC. Thereby, different factor and parameter combinations were identified for the different local clusters by mixed-effect modelling. The prevalence of a parameter for quantification of SOC can differ depending on environmental factors (Rasmussen et al., 2018).
Consequently, the quality of the multiparameter models was further improved by the implementation of local specific random effects such as parent material or land use. Dependent on the random factors parent material, soil texture class, and land use, different parameter combinations explained SOC, HWEC, or MBC (Figs. 4 and 5). For the total dataset, nearly all predictor parameters showed a significant contribution to the explanation of SOC. Most of these soil mineral-phase parameters were also significant in linear regression. In contrast to the bivariate models, most mixed-effect models revealed parameters related to soil acidity to be significantly important for estimating SOC, HWEC, and MBC. This highlights the importance of soil acidity for SOC dynamics due to its effects on the reactivity of the mineral phase and the activity of microorganisms (Hillel, 2004). In order to explain the variability of HWEC and MBC for the various local clusters, different combinations of mineral-phase parameters were required that also clearly differed from the parameter combinations used in the models for SOC (Figs. 4 and 5). Such differences concerning significantly contributing parameters were also found by other studies for specific clusters or local sampling sites (Heinze et al., 2018; Quesada et al., 2020). This emphasizes that local models are required and superior when it is the aim to estimate SOC and SOC fractions on a local scale. The total models used for the total datasets in this study reached the best predictions for SOC, HWEC, and MBC. However, this was largely biased by the large sample size; applying the same total models to local samples sets produced clearly poorer estimates compared with the more specific local models, as indicated by the explained variance and the RMSE (Fig. 6; Tables 5 and 6). Consequently, aggregation of smaller datasets, e.g. from a local scale, to a larger dataset enables us to predict SOC and its labile fractions to a higher extent. In contrast, a model that was derived from a total dataset and that is applied to a local dataset with smaller ranges of properties is less suitable, resulting in a variance explained on a lower level. Depending on the properties of the soil mineral phase, each specific cluster was controlled by other properties which best explain the accumulation of SOC and its labile fractions. This implies the importance for analysis of local clusters to avoid a subordination by models of total datasets.
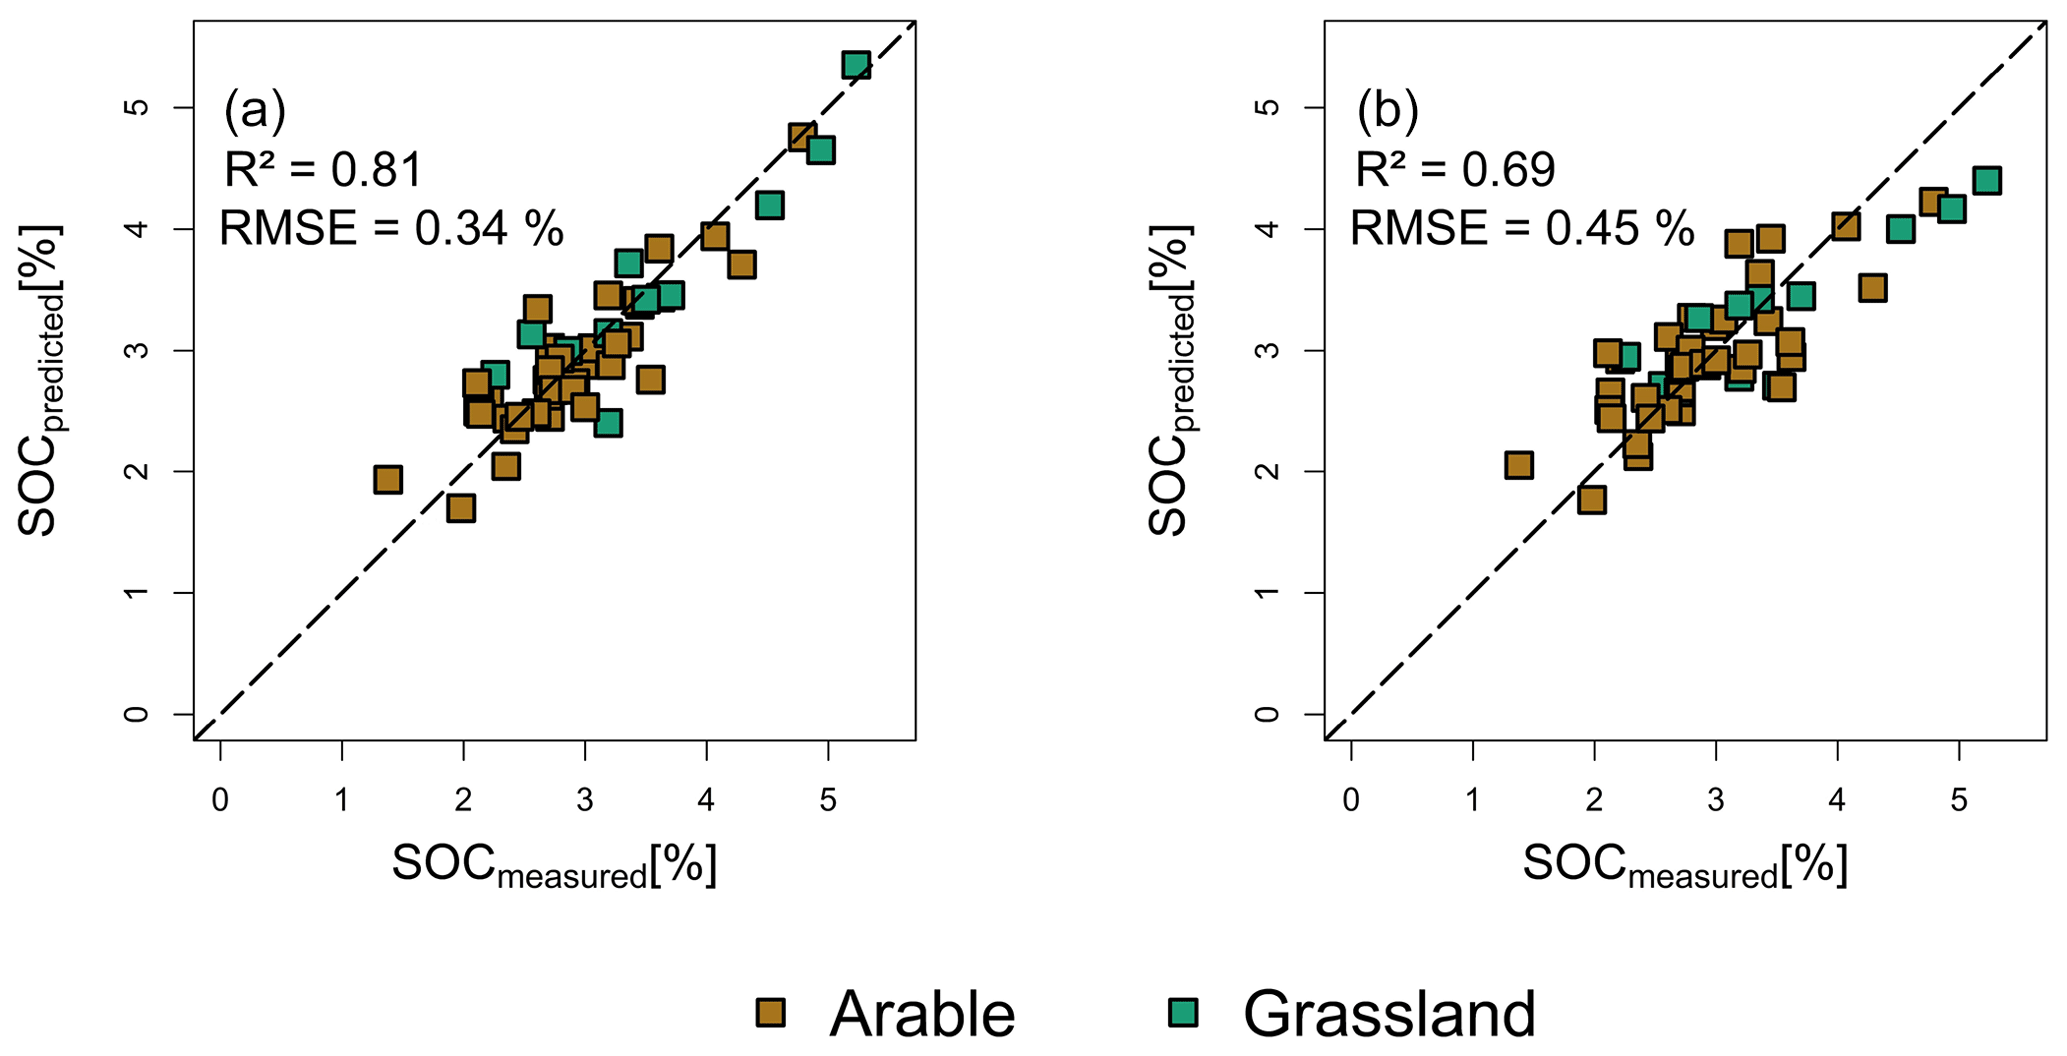
Figure 6Predicted vs. measured content of SOC of soil samples from the DCS cluster; predictions based on the local model (a) and the global model (b).
Table 6R2 and RMSE for implementation of the model for the total dataset in local clusters to estimate SOC.

4.3 Distinct model parameters for the estimation of SOC, HWEC, and MBC
Comparing the results of mixed-effect models using the different random effects (parent material, soil texture, land use), the models using parent material yielded the highest explained variance for the estimation of SOC. For HWEC and MBC the best predictions at a high level of explained variance were obtained by models using land use as a random effect (Table 4). High explained variance mostly went along with smaller RMSE values. The parent material predefines the boundaries for accumulation and stabilization of organic matter (Gray et al., 2015). The importance of land use as a random effect, especially for the labile fractions, results from the fact that these are especially influenced by soil management (Cardoso et al., 2013; Lal, 2016). In general, the variance explained by the mixed-effect models was not similar but varied between SOC and its labile fractions HWEC and MBC. It became clear that SOC and the labile fractions HWEC and MBC are not fully correlated but are quantitatively quite distinct SOM pools with different dynamics (Wander, 2004; Tokarski et al., 2020). Not least, it is suggested that the faster turnover of the labile fractions is one of the reasons for the lower explained variability by the different models. HWEC is a measure of bioavailable and degradable organic carbon (Weigel et al., 1998). Although it is closely correlated with SOC (R2=0.75), it is best estimated by distinct parameter combinations compared with SOC, which is explained by the substantially higher variability of HWEC (Tables 3 and 4). Changes in HWEC are mostly assigned to inputs of organic fertilizer substrates (Weigel et al., 1998) and the soil management (Ghani et al., 2003). For MBC especially soil management and factors such as C-input, climate, soil texture, and soil pH are relevant (Wardle, 1992). Accordingly, the effect of land use but also of soil texture was most relevant for MBC accumulation. Similar to findings of Ludwig et al. (2015), MBC increased with the content of silt and clay but declined with sand, which is explained amongst others by the contribution of MBC to aggregate formation, the habitable surface, and accessibility of SOC (Totsche et al., 2018). Additionally, management practices such as tillage and the application of organic fertilizer directly influence MBC (Liang et al., 1997). Lower explained variances of HWEC and MBC compared with SOC were based on a smaller relevance of the mineral-phase parameters for their accumulation. Labile fractions such as HWEC and MBC, containing larger proportions of bioavailable and easily degradable organic compounds, are subject to faster turnover (Landgraf et al., 2006; Lorenz et al., 2021).
The reliable estimation of SOC and of its labile fractions HWEC and MBC is a task of growing importance in order to manage soil properties and functioning. That task will most often focus on local soilscapes with minor variation range in soil properties. This study showed that local models are superior to total models. Mixed-effect models combined with random effects yielded the best estimates and the highest explained variance for SOC and even its labile and quite dynamic fractions HWEC and MBC. For this purpose, the application of multivariate approaches to estimate SOC, HWEC, and MBC clearly resulted in a higher explained variance compared with models based on bivariate linear regressions. Even a reduced dataset representing parameters of the soil mineral phase is suited for estimating contents of SOC as well as HWEC and MBC. The inclusion of overall factors such as parent material, soil texture class, and land use as random effects further improves the models. Total or even global models, developed from large-scale studies across countries or continents, often reach best estimates; however, they are subordinate for the above-mentioned small-scale areas and low sample numbers. Application of total models to local datasets leads to a smaller explained variance and higher RMSE. From a practical perspective, the selected set of soil mineral-phase parameters can be easily determined by using well-established methods, and the parameters are rather stable over a longer term. Thus, using such parameters for the estimation of SOC, HWEC, and MBC is expedient. The presented research will be further enlarged by studying larger datasets containing more clusters in order to better identify local drivers of SOC and of its labile fractions. Our research shows that local models, considering site-specific parameter combinations, are superior to total models, although they are based on much smaller datasets. If such local datasets and models are available, they should be preferred. For further research we suggest assessing even larger datasets in order to find out whether local subclusters can be identified and to examine whether these clusters are best explained by total or local models. Furthermore, research is needed to determine the most relevant parameters for a site-adapted estimation of SOC and its labile fractions on different landscapes.
The raw data are available upon request to the authors.
The supplement related to this article is available online at: https://doi.org/10.5194/soil-8-113-2022-supplement.
MO, TU, MV, and STB conceived and designed the study. MO, MS, and SS performed the sampling and analysis. MO wrote the first draft. All the authors (MO, MS, SS, UT, MV, and STB) contributed to generating and reviewing the subsequent versions of the manuscript.
The contact author has declared that neither they nor their co-authors have any competing interests.
Publisher’s note: Copernicus Publications remains neutral with regard to jurisdictional claims in published maps and institutional affiliations.
The authors thank Marc Marx for collegial cooperation. We are grateful to the colleagues of the Soil Science Department of Trier University, Petra Ziegler and Elvira Sieberger, and the students Arne Forens, Marc Heinrich, Kerstin Struwe, and Alexander Hergert for assistance during field and laboratory work. Not least, we thank two anonymous reviewers for their valuable comments.
This study was funded by the German Environment Agency in the framework of the ScreeSOM project (“Screening methods for a cost effective detection of supply with SOM in arable and grassland soils”, project no. 3716732080).
This paper was edited by Boris Jansen and reviewed by two anonymous referees.
Adhikari, K., Mishra, U., Owens, P. R., Libohova, Z., Wills, S. A., Riley, W. J., Hoffman, F. M., and Smith, D. R.: Importance and strength of environmental controllers of soil organic carbon changes with scale, Geoderma, 375, 114472, https://doi.org/10.1016/j.geoderma.2020.114472, 2020.
Angst, G., Messinger, J., Greiner, M., Häusler, W., Hertel, D., Kirfel, K., Kögel-Knabner, I., Leuschner, C., Rethemeyer, J., and Mueller, C. W.: Soil organic carbon stocks in topsoil and subsoil controlled by parent material, carbon input in the rhizosphere, and microbial-derived compounds, Soil Biol. Biochem., 122, 19–30, https://doi.org/10.1016/j.soilbio.2018.03.026, 2018.
Arrouays, D., Saby, N., Walter, C., Lemercier, B., and Schvartz, C.: Relationships between particle-size distribution and organic carbon in French arable topsoils, Soil Use Manage., 22, 48–51, https://doi.org/10.1111/j.1475-2743.2006.00020.x, 2006.
Barré, P., Durand, H., Chenu, C., Meunier, P., Montagne, D., Castel, G., Billiou, D., Soucémarianadin, L., and Cécillon, L.: Geological control of soil organic carbon and nitrogen stocks at the landscape scale, Geoderma, 285, 50–56, https://doi.org/10.1016/j.geoderma.2016.09.029, 2017.
Blume, H.-P., Stahr, K., and Leinweber, P.: Bodenkundliches Praktikum: Eine Einführung in pedologisches Arbeiten für Ökologen, insbesondere Land- und Forstwirte, und für Geowissenschaftler, 3. neubearb. Aufl., Spektrum Akademischer Verlag, Heidelberg, 255 pp., 2011.
Bornemann, L., Herbst, M., Welp, G., Vereecken, H., and Amelung, W.: Rock Fragments Control Size and Saturation of Organic Carbon Pools in Agricultural Topsoil, Soil Sci. Soc. Am. J., 75, 1898–1907, https://doi.org/10.2136/sssaj2010.0454, 2011.
Cardoso, E., Vasconcellos, R., Bini, D., Miyauchi, M., dos Santos, C., Alves, P., de Paula, A., Nakatani, A., Pereira, J., and Nogueira, M.: Soil health: looking for suitable indicators. What should be considered to assess the effects of use and management on soil health?, Sci. Agr., 70, 274–289, https://doi.org/10.1590/S0103-90162013000400009, 2013.
Christensen, B. T.: Physical fractionation of soil and structural and functional complexity in organic matter turnover, Europ. J. Soil Sci., 52, 345–353, https://doi.org/10.1046/j.1365-2389.2001.00417.x, 2001.
Dignac, M.-F., Derrien, D., Barré, P., Barot, S., Cécillon, L., Chenu, C., Chevallier, T., Freschet, G. T., Garnier, P., Guenet, B., Hedde, M., Klumpp, K., Lashermes, G., Maron, P.-A., Nunan, N., Roumet, C., and Basile-Doelsch, I.: Increasing soil carbon storage: mechanisms, effects of agricultural practices and proxies, A review, Agron. Sustain. Dev., 37, 351, https://doi.org/10.1007/s13593-017-0421-2, 2017.
Fox, J. and Weisberg, S.: An R companion to applied regression, Third edition, SAGE, Los Angeles, 577 pp., 2019.
Ghani, A., Dexter, M., and Perrott, K.: Hot-water extractable carbon in soils: a sensitive measurement for determining impacts of fertilisation, grazing and cultivation, Soil Biol. Biochem., 35, 1231–1243, https://doi.org/10.1016/S0038-0717(03)00186-X, 2003.
Gray, J., Karunaratne, S., Bishop, T., Wilson, B., and Veeragathipillai, M.: Driving factors of soil organic carbon fractions over New South Wales, Australia, Geoderma, 353, 213–226, https://doi.org/10.1016/j.geoderma.2019.06.032, 2019.
Gray, J. M., Bishop, T. F., and Wilson, B. R.: Factors Controlling Soil Organic Carbon Stocks with Depth in Eastern Australia, Soil Sci. Soc. Am. J., 79, 1741–1751, https://doi.org/10.2136/sssaj2015.06.0224, 2015.
Hassink, J., Bouwman, L. A., Zwart, K. B., Bloem, J., and Brussaard, L.: Relationships between soil texture, physical protection of organic matter, soil bioata, and C and N mineralization in grassland soils, Geoderma, 57, 105–128, https://doi.org/10.1016/0016-7061(93)90150-J, 1993.
Heimann, M. and Reichstein, M.: Terrestrial ecosystem carbon dynamics and climate feedbacks, Nature, 451, 289–292, https://doi.org/10.1038/nature06591, 2008.
Heinemeyer, O., Insam, H., Kaiser, E. A., and Walenzik, G.: Soil microbial biomass and respiration measurements: An automated technique based on infra-red gas analysis, Plant Soil, 116, 191–195, https://doi.org/10.1007/BF02214547, 1989.
Heinze, S., Ludwig, B., Piepho, H.-P., Mikutta, R., Don, A., Wordell-Dietrich, P., Helfrich, M., Hertel, D., Leuschner, C., Kirfel, K., Kandeler, E., Preusser, S., Guggenberger, G., Leinemann, T., and Marschner, B.: Factors controlling the variability of organic matter in the top- and subsoil of a sandy Dystric Cambisol under beech forest, Geoderma, 311, 37–44, https://doi.org/10.1016/j.geoderma.2017.09.028, 2018.
Heller, C. and Zeitz, J.: Stability of soil organic matter in two northeastern German fen soils: the influence of site and soil development, J. Soil. Sed., 12, 1231–1240, https://doi.org/10.1007/s11368-012-0500-6, 2012.
Herold, N., Schöning, I., Michalzik, B., Trumbore, S., and Schrumpf, M.: Controls on soil carbon storage and turnover in German landscapes, Biogeochemistry, 119, 435–451, https://doi.org/10.1007/s10533-014-9978-x, 2014.
Hillel, D.: Encyclopedia of soils in the environment, Elsevier/Academic Press, Oxford UK, Boston, 375 pp., 2004.
Hobley, E., Wilson, B., Wilkie, A., Gray, J., and Koen, T.: Drivers of soil organic carbon storage and vertical distribution in Eastern Australia, Plant Soil, 390, 111–127, https://doi.org/10.1007/s11104-015-2380-1, 2015.
Jenny, H.: Factors of soil formation: A system of quantitative pedology, McGraw-Hill, New York, ISBN: 978-0-486-68128-3, 1941.
Jian-Bing, W., Du-Ning, X., Xing-Yi, Z., Xiu-Zhen, L., and Xiao-Yu, L.: Spatial Variability of Soil Organic Carbon in Relation to Environmental Factors of a Typical Small Watershed in the Black Soil Region, Northeast China, Environ. Monit. Assess., 121, 597–613, https://doi.org/10.1007/s10661-005-9158-5, 2006.
Joergensen, R. G.: The fumigation-extraction method to estimate soil microbial biomass: calibration of the kEC value, Soil Biol. Biochem., 28, 25–31, https://doi.org/10.1016/0038-0717(95)00102-6, 1996.
Joergensen, R. G.: The Fumigation-Extraction Method to Estimate Soil Microbial Biomass: Extraction with 0.01 M CaCl2, Agribiol. Res., 48, 319–324, 1995.
Joergensen, R. G. and Mueller, T.: The fumigation-extraction method to estimate soil microbial biomass: calibration of the kEN value, Soil Biol. Biochem., 28, 33–37, https://doi.org/10.1016/0038-0717(95)00101-8, 1996.
Kaiser, K. and Guggenberger, G.: The role of DOM sorption to mineral surfaces in the preservation of organic matter in soils, Org. Geochem., 31, 711–725, https://doi.org/10.1016/S0146-6380(00)00046-2, 2000.
Kaiser, K. and Zech, W.: Soil Dissolved Organic Matter Sorption as Influenced by Organic and Sesquioxide Coatings and Sorbed Sulfate, Soil Sci. Soc. Am. J., 62, 129–136, https://doi.org/10.2136/sssaj1998.03615995006200010017x, 1998.
Kaiser, K., Eusterhues, K., Rumpel, C., Guggenberger, G., and Kögel-Knabner, I.: Stabilization of organic matter by soil minerals – investigations of density and particle-size fractions from two acid forest soils, J. Plant Nutr. Soil Sci., 165, 451–459, https://doi.org/10.1002/1522-2624(200208)165:4<451:AID-JPLN451>3.0.CO;2-B, 2002.
Kaiser, M., Ellerbrock, R. H., Wulf, M., Dultz, S., Hierath, C., and Sommer, M.: The influence of mineral characteristics on organic matter content, composition, and stability of topsoils under long-term arable and forest land use, J. Geophys. Res., 117, G02018, https://doi.org/10.1029/2011JG001712, 2012.
Kemmitt, S., Wright, D., Goulding, K., and Jones, D.: pH regulation of carbon and nitrogen dynamics in two agricultural soils, Soil Biol. Biochem., 38, 898–911, https://doi.org/10.1016/j.soilbio.2005.08.006, 2006.
Kleber, M., Eusterhues, K., Keiluweit, M., Mikutta, C., Mikutta, R., and Nico, P. S.: Mineral–Organic Associations: Formation, Properties, and Relevance in Soil Environments, in: Advances in Agronomy, edited by: Donald L. Sparks, Elsevier, 1–140, https://doi.org/10.1016/bs.agron.2014.10.005, 2015.
Körschens, M., Schulz, E., and Behm, R.: Heißwasserlöslicher C und N im boden als kriterium für das N-Nachlieferungsvermögen, Zentralblatt für Mikrobiologie, 145, 305–311, https://doi.org/10.1016/S0232-4393(11)80045-4, 1990.
Kottek, M., Grieser, J., Beck, C., Rudolf, B., and Rubel, F.: World Map of the Köppen-Geiger climate classification updated, Meteorologische Z., 15, 259–263, https://doi.org/10.1127/0941-2948/2006/0130, 2006.
Lal, R.: Soil health and carbon management, Food Energy Sec., 5, 212–222, https://doi.org/10.1002/fes3.96, 2016.
Landgraf, D., Leinweber, P., and Makeschin, F.: Cold and hot water–extractable organic matter as indicators of litter decomposition in forest soils, J. Plant Nutr. Soil Sci., 169, 76–82, https://doi.org/10.1002/jpln.200521711, 2006.
Lehmann, J. and Kleber, M.: The contentious nature of soil organic matter, Nature, 528, 60–68, https://doi.org/10.1038/nature16069, 2015.
Liang, B. C., MacKenzie, A. F., Schnitzer, M., Monreal, C. M., Voroney, P. R., and Beyaert, R. P.: Management-induced change in labile soil organic matter under continuous corn in eastern Canadian soils, Biol. Fertil. Soils, 26, 88–94, https://doi.org/10.1007/s003740050348, 1997.
Liang, C., Schimel, J. P., and Jastrow, J. D.: The importance of anabolism in microbial control over soil carbon storage, Nat. Microbiol., 2, 17105, https://doi.org/10.1038/nmicrobiol.2017.105, 2017.
Liddle, K., McGonigle, T., and Koiter, A.: Microbe Biomass in Relation to Organic Carbon and Clay in Soil, Soil Syst., 4, 41, https://doi.org/10.3390/soilsystems4030041, 2020.
Lorenz, M., Hofmann, D., Steffen, B., Fischer, K., and Thiele-Bruhn, S.: The molecular composition of extractable soil microbial compounds and their contribution to soil organic matter vary with soil depth and tree species, Sci. Total Environ., 781, 146732, https://doi.org/10.1016/j.scitotenv.2021.146732, 2021.
Ludwig, B., John, B., Ellerbrock, R., Kaiser, M., and Flessa, H.: Stabilization of carbon from maize in a sandy soil in a long-term experiment, Eur. J. Soil Sci., 54, 117–126, https://doi.org/10.1046/j.1365-2389.2003.00496.x, 2003.
Ludwig, M., Achtenhagen, J., Miltner, A., Eckhardt, K.-U., Leinweber, P., Emmerling, C., and Thiele-Bruhn, S.: Microbial contribution to SOM quantity and quality in density fractions of temperate arable soils, Soil Biol. Biochem., 81, 311–322, https://doi.org/10.1016/j.soilbio.2014.12.002, 2015.
Lützow, M. V., Kogel-Knabner, I., Ekschmitt, K., Matzner, E., Guggenberger, G., Marschner, B., and Flessa, H.: Stabilization of organic matter in temperate soils: mechanisms and their relevance under different soil conditions – a review, Eur. J. Soil Sci., 57, 426–445, https://doi.org/10.1111/j.1365-2389.2006.00809.x, 2006.
Lützow, M. von, Kögel-Knabner, I., Ekschmitt, K., Flessa, H., Guggenberger, G., Matzner, E., and Marschner, B.: SOM fractionation methods: Relevance to functional pools and to stabilization mechanisms, Soil Biol. Biochem., 39, 2183–2207, https://doi.org/10.1016/j.soilbio.2007.03.007, 2007.
Mayer, S., Kühnel, A., Burmeister, J., Kögel-Knabner, I., and Wiesmeier, M.: Controlling factors of organic carbon stocks in agricultural topsoils and subsoils of Bavaria, Soil Till. Res., 192, 22–32, https://doi.org/10.1016/j.still.2019.04.021, 2019.
Mehra, O. P. and Jackson, M. L.: Iron oxide removal from soils and clays by a dithionite citrate system buffered with sodium bicarbonate, Clay. Clay Miner., 7, 317–327, https://doi.org/10.1346/CCMN.1958.0070122, 1958.
Mikutta, R., Kleber, M., Torn, M. S., and Jahn, R.: Stabilization of Soil Organic Matter: Association with Minerals or Chemical Recalcitrance?, Biogeochemistry, 77, 25–56, https://doi.org/10.1007/s10533-005-0712-6, 2006.
Nakagawa, S. and Schielzeth, H.: A general and simple method for obtaining R2 from generalized linear mixed-effects models, Methods Ecol. Evol., 4, 133–142, https://doi.org/10.1111/j.2041-210x.2012.00261.x, 2013.
O'Brien, S. L., Jastrow, J. D., Grimley, D. A., and Gonzalez-Meler, M. A.: Edaphic controls on soil organic carbon stocks in restored grasslands, Geoderma, 251, 117–123, https://doi.org/10.1016/j.geoderma.2015.03.023, 2015.
Poeplau, C. and Don, A.: Sensitivity of soil organic carbon stocks and fractions to different land-use changes across Europe, Geoderma, 192, 189–201, https://doi.org/10.1016/j.geoderma.2012.08.003, 2013.
Poeplau, C., Jacobs, A., Don, A., Vos, C., Schneider, F., Wittnebel, M., Tieymeyer, B., Heidkamp, A., Prietz, R., and Flessa, H.: Stocks of organic carbon in German agricultural soils -Key results of the first comprehensive inventory, 183, 665–681, https://doi.org/10.1002/jpln.202000113, 2020.
Poeplau, C., Vos, C., and Don, A.: Soil organic carbon stocks are systematically overestimated by misuse of the parameters bulk density and rock fragment content, SOIL, 3, 61–66, https://doi.org/10.5194/soil-3-61-2017, 2017.
Porras, R. C., Hicks Pries, C. E., McFarlane, K. J., Hanson, P. J., and Torn, M. S.: Association with pedogenic iron and aluminum: effects on soil organic carbon storage and stability in four temperate forest soils, Biogeochemistry, 133, 333–345, https://doi.org/10.1007/s10533-017-0337-6, 2017.
Quesada, C. A., Paz, C., Oblitas Mendoza, E., Phillips, O. L., Saiz, G., and Lloyd, J.: Variations in soil chemical and physical properties explain basin-wide Amazon forest soil carbon concentrations, SOIL, 6, 53–88, https://doi.org/10.5194/soil-6-53-2020, 2020.
R Core Team: R: A Language and Environment for Statistical Computing, R Foundation for Statistical Computing, Vienna, 2021.
Rasmussen, C., Heckman, K., Wieder, W. R., Keiluweit, M., Lawrence, C. R., Berhe, A. A., Blankinship, J. C., Crow, S. E., Druhan, J. L., Hicks Pries, C. E., Marin-Spiotta, E., Plante, A. F., Schädel, C., Schimel, J. P., Sierra, C. A., Thompson, A., and Wagai, R.: Beyond clay: towards an improved set of variables for predicting soil organic matter content, Biogeochemistry, 137, 297–306, https://doi.org/10.1007/s10533-018-0424-3, 2018.
Scharlemann, J. P. W., Tanner, E. V. J., Hiederer, R., and Kapos, V.: Global soil carbon: understanding and managing the largest terrestrial carbon pool, Carbon Manage., 5, 81–91, https://doi.org/10.4155/cmt.13.77, 2014.
Schwertmann: Differenzierung der Eisenoxide des Bodens durch Extraktion mit Ammoniumoxalat-Lösung, J. Plant Nutr. Soil Sc., 105, 194–202, https://doi.org/10.1002/jpln.3591050303, 1964.
Spohn, M. and Giani, L.: Total, hot water extractable, and oxidation-resistant carbon in sandy hydromorphic soils-analysis of a 220-year chronosequence, Plant Soil, 338, 183–192, https://doi.org/10.1007/s11104-010-0322-5, 2011.
Stenberg, B., Johansson, M., Pell, M., Sjödahl-Svensson, K., Stenström, J., and Torstensson, L.: Microbial biomass and activities in soil as affected by frozen and cold storage, Soil Biol. Biochem., 30, 393–402, https://doi.org/10.1016/S0038-0717(97)00125-9, 1998.
Tokarski, D., Wiesmeier, M., Doležalová Weissmannová, H., Kalbitz, K., Scott Demyan, M., Kučerík, J., and Siewert, C.: Linking thermogravimetric data with soil organic carbon fractions, Geoderma, 362, 114124, https://doi.org/10.1016/j.geoderma.2019.114124, 2020.
Totsche, K. U., Amelung, W., Gerzabek, M. H., Guggenberger, G., Klumpp, E., Knief, C., Lehndorff, E., Mikutta, R., Peth, S., Prechtel, A., Ray, N., and Kögel-Knabner, I.: Microaggregates in soils, J. Plant Nutr. Soil Sci., 181, 104–136, https://doi.org/10.1002/jpln.201600451, 2018.
Vos, C., Don, A., Hobley, E. U., Prietz, R., Heidkamp, A., and Freibauer, A.: Factors controlling the variation in organic carbon stocks in agricultural soils of Germany, Eur. J. Soil Sci., 70, 550–564, https://doi.org/10.1111/ejss.12787, 2019.
Vos, C., Jaconi, A., Jacobs, A., and Don, A.: Hot regions of labile and stable soil organic carbon in Germany – Spatial variability and driving factors, SOIL, 4, 153–167, https://doi.org/10.5194/soil-4-153-2018, 2018.
Wagner, W. H., Kremb-Wagner, F., Koziol, M., and Negendank, J. F. W. (Eds.): Trier und Umgebung, Schweizerbart Science Publishers, Stuttgart, Germany, ISBN: 978-3-443-15094-5, 2011.
Wander, M.: Soil Organic Matter Fractions and Their Relevance to Soil Function, in: Soil Organic Matter in Sustainable Agriculture, edited by: Magdoff, F. and Weil, R., CRC Press, https://doi.org/10.1201/9780203496374.ch3, 2004.
Wardle, D. A.: A comparative assessment of factors which influence microbial biomass carbon and nitrogen levels in soil, Biol. Rev., 67, 321–358, https://doi.org/10.1111/j.1469-185X.1992.tb00728.x, 1992.
Weigel, A., Eustice, T., van Antwerpen, R., Naidoo, G., and Schulz, E.: Soil Organic Carbon (SOC) changes indicated by Hot Water Extractable Carbon (HWEC), Proc. S. Afr. Sug. Technol. Ass., 84, 210–222, 2011.
Weigel, A., Kubat, J., Körschens, M., Powlson, D. S., and Mercik, S.: Determination of the decomposable part of soil organic matter in arable soils, Arch. Agron. Soil Sci., 43, 123–143, https://doi.org/10.1080/03650349809366031, 1998.
Wieder, W. R., Grandy, A. S., Kallenbach, C. M., Taylor, P. G., and Bonan, G. B.: Representing life in the Earth system with soil microbial functional traits in the MIMICS model, Geosci. Model Dev., 8, 1789–1808, https://doi.org/10.5194/gmd-8-1789-2015, 2015.
Wiesmeier, M., Urbanski, L., Hobley, E., Lang, B., Lützow, M. von, Marin-Spiotta, E., van Wesemael, B., Rabot, E., Ließ, M., Garcia-Franco, N., Wollschläger, U., Vogel, H.-J., and Kögel-Knabner, I.: Soil organic carbon storage as a key function of soils – A review of drivers and indicators at various scales, Geoderma, 333, 149–162, https://doi.org/10.1016/j.geoderma.2018.07.026, 2019.
Wiesmeier, M., Barthold, F., Spörlein, P., Geuß, U., Hangen, E., Reischl, A., Schilling, B., Angst, G., von Lützow, M., and Kögel-Knabner, I.: Estimation of total organic carbon storage and its driving factors in soils of Bavaria (southeast Germany), Geoderma, 1, 67–78, https://doi.org/10.1016/j.geodrs.2014.09.001, 2014.
Wiesmeier, M., Hübner, R., Barthold, F., Spörlein, P., Geuß, U., Hangen, E., Reischl, A., Schilling, B., von Lützow, M., and Kögel-Knabner, I.: Amount, distribution and driving factors of soil organic carbon and nitrogen in cropland and grassland soils of southeast Germany (Bavaria), Agr. Ecosys. Environ., 176, 39–52, https://doi.org/10.1016/j.agee.2013.05.012, 2013.
Zhang, Y., Lavallee, J. M., Robertson, A. D., Even, R., Ogle, S. M., Paustian, K., and Cotrufo, M. F.: Simulating measurable ecosystem carbon and nitrogen dynamics with the mechanistically defined MEMS 2.0 model, Biogeosciences, 18, 3147–3171, https://doi.org/10.5194/bg-18-3147-2021, 2021.