the Creative Commons Attribution 4.0 License.
the Creative Commons Attribution 4.0 License.
 | 30 Mar 2021
Stable isotope signatures of soil nitrogen on an environmental–geomorphic gradient within the Congo Basin
Simon Baumgartner
Marijn Bauters
Matti Barthel
Travis W. Drake
Landry C. Ntaboba
Basile M. Bazirake
Johan Six
Pascal Boeckx
Kristof Van Oost
Nitrogen (N) availability can be highly variable in tropical forests on regional and local scales. While environmental gradients influence N cycling on a regional scale, topography is known to affect N availability on a local scale. We compared natural abundance of 15N isotopes of soil profiles in tropical lowland forest, tropical montane forest, and subtropical Miombo woodland within the Congo Basin as a proxy to assess ecosystem-level differences in N cycling. Soil δ15N profiles indicated that N cycling in the montane forest is relatively more closed and dominated by organic N turnover, whereas the lowland forest and Miombo woodland experienced a more open N cycle dominated by inorganic N. Furthermore, we examined the effect of slope gradient on soil δ15N within forest types to quantify local differences induced by topography. Our results show that slope gradient only affects the soil δ15N in the Miombo forest, which is prone to erosion due to a lower vegetation cover and intense rainfall at the onset of the wet season. Lowland forest, on the other hand, with a flat topography and protective vegetation cover, showed no influence of topography on soil δ15N in our study site. Despite the steep topography, slope angles do not affect soil δ15N in the montane forest, although stable isotope signatures exhibited higher variability within this ecosystem. A pan-tropical analysis of soil δ15N values (i.e., from our study and literature) reveals that soil δ15N in tropical forests is best explained by factors controlling erosion, namely mean annual precipitation, leaf area index, and slope gradient. Erosive forces vary immensely between different tropical forest ecosystems, and our results highlight the need for more spatial coverage of N cycling studies in tropical forests, to further elucidate the local impact of topography on N cycling in this biome.
- Article
(863 KB) - Full-text XML
-
Supplement
(270 KB) - BibTeX
- EndNote


The nutrient status of forests is an important determinant for the allocation of sequestered carbon (C) to biomass (Vicca et al., 2012), with nitrogen (N) and/or phosphorus (P) limitation potentially constraining net primary productivity (NPP) (Alvarez-Clare et al., 2013; Fernández-Martínez et al., 2014; Townsend et al., 2011; Vitousek et al., 2010). In addition, models show that the increase of primary production due to CO2 fertilization will be constrained by nutrient limitations (Wieder et al., 2015). Therefore, understanding nutrient cycling in forests globally is key to assess present and future forest productivity (Townsend et al., 2011; Wieder et al., 2011). Given their major role in the global C cycle (Lewis, 2006; Malhi and Grace, 2000), quantifying nutrient supply and availability is especially important for tropical forests.
To date, research has revealed a high diversity of nutrient cycles with substantial variation from regional to local scales throughout the tropics. Old and highly weathered soils in tropical lowland forests are typically considered to be rich in N and poor in rock-derived P (e.g., Vitousek, 1984). In contrast, tropical montane forests that lie on steep terrain are subjected to geomorphic processes that rejuvenate soils with bedrock nutrients through uplift and erosion. In regions with a moderate uplift, P depletion is unlikely to occur due to this rejuvenation (Porder et al., 2007). As a result of reduced N supply in higher altitudes, due to slower N mineralization processes at lower temperatures, it is more likely that plant growth is limited by N availability in tropical montane forests (Bauters et al., 2017; Soethe et al., 2008; Tanner et al., 1998). Thus it is important that nutrient availability in tropical forests is not generalized across these different ecosystems. Therefore, analyses of N cycling within ecological gradients are necessary. The “openness of the N cycle” is a good metric to describe cycling differences across ecosystems with contrasting N availabilities. While in N-limited ecosystems (i.e., closed N cycle) the internal cycling and recycling rates of N are relatively more important than the absolute inputs and outputs (inputs: N2 fixation and N deposition; outputs: gaseous and leaching losses), the opposite is true for ecosystems that are rich in N (i.e., open N cycle) (Boeckx et al., 2005).
Furthermore, at a local scale, topography has been identified as a main determinant for both biogeochemical and ecological variability in tropical forests (Asner et al., 2015; Hofhansl et al., 2020) in part through its effect on geomorphic processes. In an intact forest, slope gradient is the main control on physical erosion intensity at the hillslope scale (Roering et al., 2001). Accumulated topsoil N has shown to be affected by physical erosion (Amundson et al., 2003; Hilton et al., 2013; Perakis et al., 2015; Weintraub et al., 2015), resulting in a close relation between nutrient availability and geomorphic process rates. Therefore, while at regional scales mainly climatic and environmental gradients are responsible for differences in nutrient availabilities (Prescott, 2002; Read, 1991), hydro-geomorphic gradients seem to be a main determinant of N cycling at the local scale (Amundson et al., 2003). Some studies from geomorphic active regions of the tropics (e.g., Taiwan and Costa Rica) found lower N availability in steeper sloping positions suggesting that erosion substantially affects local N balances (Hilton et al., 2013; Weintraub et al., 2015). However, the magnitude of this effect in more stable landscapes is unknown and calls for a consistent study across geomorphic gradients in the tropics.
The natural abundance of the stable 15N isotopes (δ15N) of plant and soil pools is a useful proxy to assess N cycling (Amundson et al., 2003; Martinelli et al., 1999). Craine et al. (2015a) synthesized global soil δ15N data to understand patterns of N cycling and showed how soil δ15N values give insight into input and output pathways of N in the system (Högberg, 1990; Högberg and Johannisson, 1993). The isotopic composition of soil N is influenced by a multitude of processes, and therefore interpretation of soil δ15N values is challenging. The main processes controlling soil δ15N values are nitrification, denitrification N mineralization, N2 fixation, and N leaching. Nitrification has a large isotope fractionation effect, with fractionation factors ranging from 15 ‰ to 35 ‰ (Blackmer and Bremner, 1977; Högberg, 1997). On the other hand, fractionation during denitrification is variable with fractionation factors reported ranging from 0 ‰ to 33 ‰ (Högberg 1997). Nitrification and denitrification result in a gradual enrichment of soil δ15N. The process of N mineralization is believed to fractionate only marginally; however, in a system with high N mineralization rates, isotopic fractionation due to mineralization can be important (Nadelhoffer and Fry 1994). N2 fixation depletes soil δ15N values, as it imports atmospheric N that has an isotopic value of 0 ‰ by default (Högberg, 1997). Aside from these processes, site- and soil-specific characteristics can control soil δ15N. In addition, climatic conditions such as rainfall (Austin and Vitousek, 1998; Boeckx et al., 2005), mean annual temperature (Boeckx et al., 2005), and soil moisture (Handley et al., 1999) all influence soil δ15N. Generally, soil δ15N signals the openness of the N cycle, with more enriched values in an open system that is more prone to N losses, compared to a more closed system (with the assumption that input δ15N are similar in both systems) (Boeckx et al., 2005). On a local scale, soil erosion alters the soil δ15N and leads to more depleted values (Hilton et al., 2013; Weintraub et al., 2015). Because soil erosion is a non-fractionating process, the combined fractionation of a system decreases when soil erosion becomes more important relative to fractionating N losses, such as denitrification. In this case, the δ15N of the remaining N in the system more closely resembles the signature of the N inputs compared to systems with less erosion.
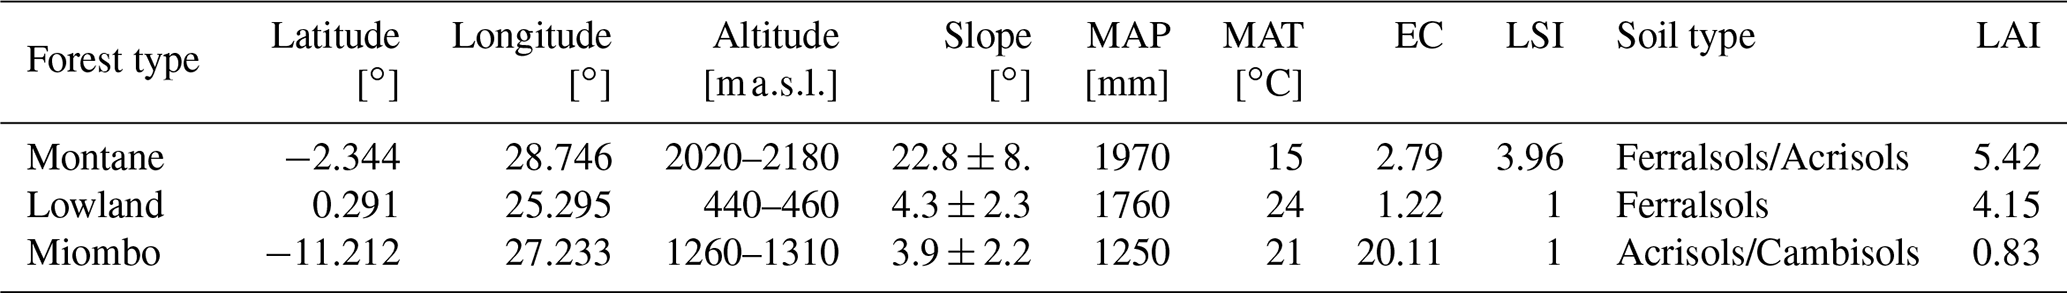
Table 1Site characteristics of the three forest types. The range of altitudes of the sampled profiles and topsoil samples is shown. The slope indicates the average slope ± standard deviation from all the samples taken at the respective forest site. MAP is the mean annual precipitation, and MAT is the mean annual temperature extracted from the WorldClim database (average MAP for the years 2010–2018). EC represents the mean erosion coefficient values calculated from Eq. (1). LSI is the landslide hazard risk for each site extracted from the Global Landslide Hazard Map (Worldbank). LAI is the mean annual leaf area index, extracted from the Copernicus LAI 300m database (European Environment Agency).
The objectives of this study were (1) to assess the differences in N availability and N openness in three different forest types along an environmental–geomorphic gradient in the Congo Basin, (2) to evaluate the extent, and (3) to evaluate the drivers of physical erosion and its effects on N availability in these forests. To achieve these objectives, soil N content and the stable N isotope compositions were measured in soil profiles taken from different topographical positions in three different forest ecotypes. We used soil δ15N as a proxy that integrates N transformations for differences in N availability and the openness of a system. We hypothesized that soil δ15N values are the highest in lowland tropical forest, which would be an indication for a higher N availability and openness of N cycle. Furthermore, we hypothesized that δ15N of topsoil N would be lower on steeper slopes compared to δ15N of topsoil N on less steep slopes and more enriched compared to deeper soil layers of the same profile and that this effect would be more pronounced in the montane and Miombo forests, where the erosional forces are higher compared to the lowland forest.
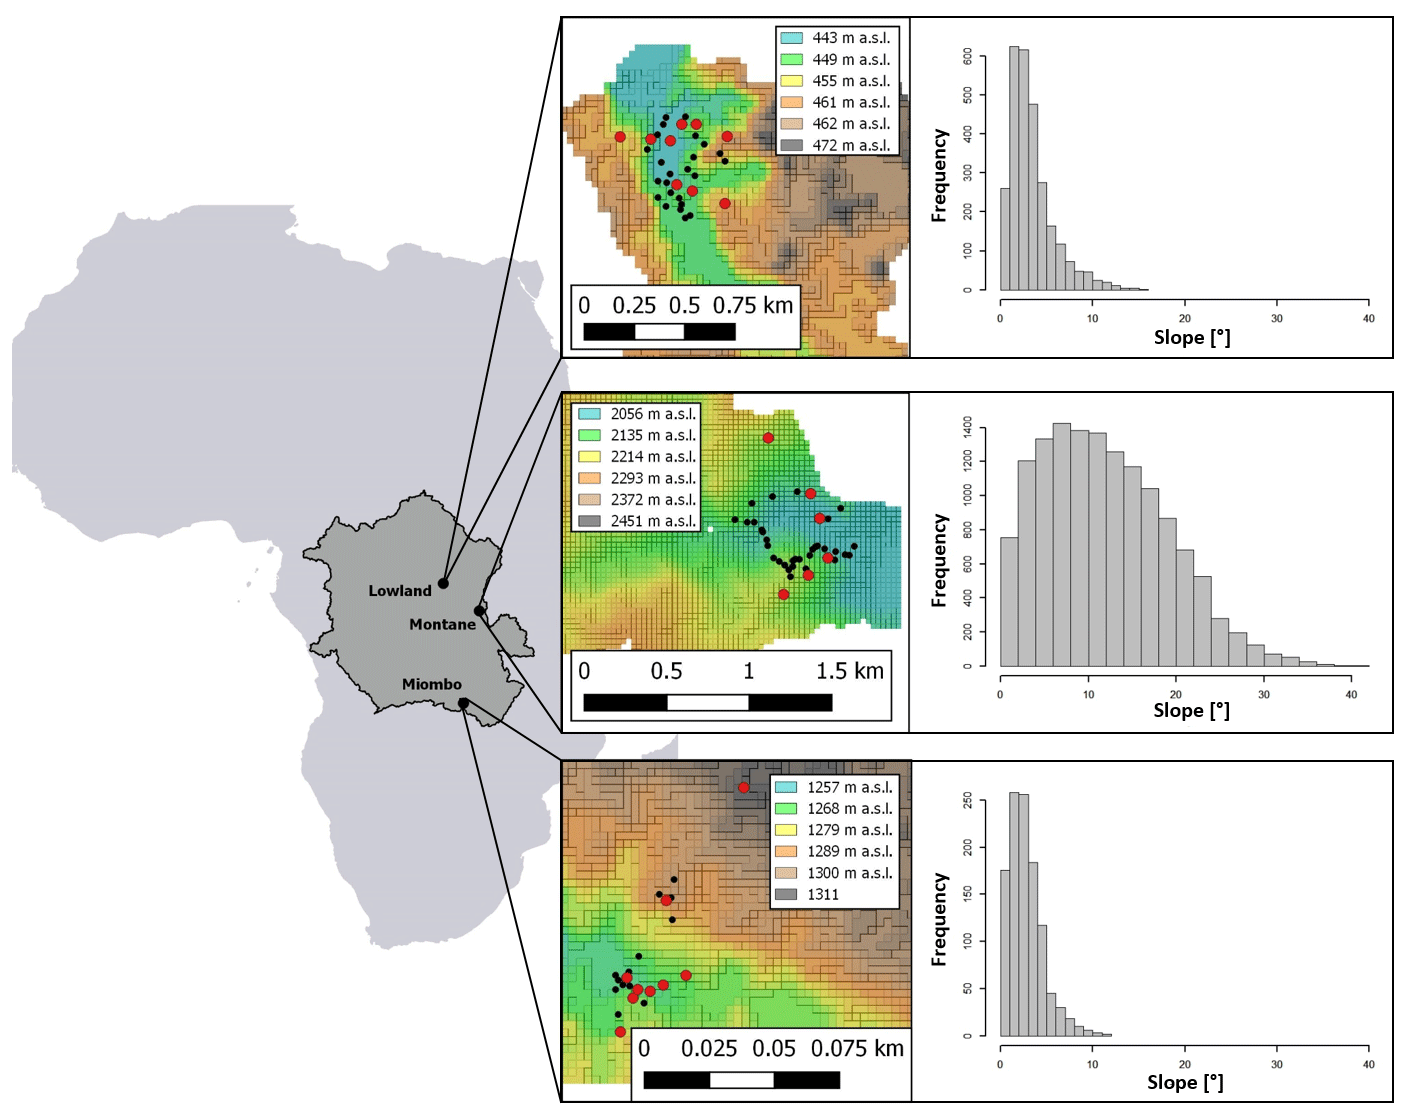
Figure 1Location of the sampling sites; from left to right: dark grey area indicates the Congo Basin within Africa with forest site locations, red dots indicate locations of 1 m soil profiles within each forest site, black dots indicate locations of topsoil sampling positions (0–20 cm). Colors from the 30 m DEMs represent elevation (in ). Histograms on the right show the slope distribution of the respective sampling site.
2.1 Site description
We selected representative sites for the Congo Basin's major forest ecotypes (tropical montane forest, tropical lowland forest, and the semi-dry Miombo woodland). The montane forest site is situated in the Kahuzi-Biéga National Park (2.344∘ S, 28.746∘ E), northwest of the city of Bukavu in the eastern part of Democratic Republic of the Congo (DRC). Two forest subtypes are present in the park: montane mixed forest and monodominant bamboo forest. Soil samples were taken in the mixed forests. Soils are classified as Ferralsols/Acrisols (Bauters et al., 2019) (Table 1) and were formed on basalt rock (Van Engelen et al., 2006). The topography of the sampled forest is characterized by steep slopes (Fig. 1). Mean annual temperature is ∼ 15 ∘C, and mean annual rainfall is ∼ 1970 mm (Fick and Hijmans, 2017). Rainfall is seasonal with two peaks in April and October and a dry season that lasts from June to September.
Samples from the tropical lowland forest were taken in the Yoko Forest Reserve (0.291∘ N, 25.295∘ E), south of the city of Kisangani. The Yoko Forest Reserve consists of two forest subtypes: a mixed lowland tropical forest and a monodominant forest, where the Gilbertiodendron dewevrei species comprises more than 60 % of the basal area. Soil samples in the lowland forest were taken from random points within the catchment, where both forest types are present. Soils in this area are classified as deeply weathered Ferralsols (Van Ranst et al., 2010) on fluvio-eolian deposits (Van Engelen et al., 2006). The sampling site exhibited low variation in elevation and contained mainly gentle slopes (Fig. 1). Samples were taken between altitudes of 440–460 Mean annual temperature is ∼ 24 ∘C, and mean annual rainfall is ∼ 1760 mm (Fick and Hijmans, 2017) (Table 1). Yoko experiences a short wet season from March to May and a longer one from August to November.
For the Miombo woodland, a site 50 km north of the city of Lubumbashi was selected (11.212∘ S, 27.233∘ E). A pristine Miombo is characterized by deciduous woodland dominated by trees of the Brachystegia, Julbernardia and Isoberlinia genera (Campbell, 1996). As charcoal production and seasonal fires are a common occurrence, soil sampling in areas with recent charcoal production activities was avoided. We classified the soils as Acrisols and Cambisols, and the parent material was identified as shales (Van Engelen et al., 2006). The topography is mostly flat, and the elevation ranges between 1260 and 1310 (Fig. 1). This region experiences a wet season from October to April, with a peak rainfall in December. Mean annual rainfall is ∼ 1250 mm, and mean temperature is ∼ 21 ∘C (Fick and Hijmans, 2017) (Table 1).
2.2 Sampling
To analyze differences in soil N cycling between forest sites, soil samples were taken from soil profiles at different slope positions in the catchments (slope, shoulder, and ridge) in order to better represent the catchment as a whole. Nine soil profiles were dug and sampled in both the lowland and Miombo forests. Due to difficult terrain within the montane forest, only six soil profiles were sampled (Fig. 1). For each 1 m profile, soil samples from nine different depths were taken (0–2, 2–4, 4–6, 6–10, 10–15, 15–20, 20–30, 30–50, and 50–100 cm). To calculate N stocks, bulk density of the soil was determined at five depths of each soil profile using a 100 cm3 bulk density ring. The bulk density samples were dried at 105 ∘C for 48 h and then weighed. To analyze the effect of surface slope angles on stable isotopic signature of soil δ15N, additional topsoil samples (bulk sample from the top 0–20 cm) were taken from throughout the catchments at locations with varying slopes (montane: n=27; lowland: n=24; Miombo: n=21) (Fig. 1). Profile positions and topsoil sample positions were recorded with a GPS (GPSMAP 60CSx; Garmin; accuracy < 5 m), and slope angles were estimated using 30 m SRTM-derived digital elevation models (DEMs) (NASA JPL), which were smoothed with a low-pass filter. In addition, leaf samples from different trees were randomly collected at the lowland and montane forest site, and a composite sample for each site was used to analyze foliar δ15N.
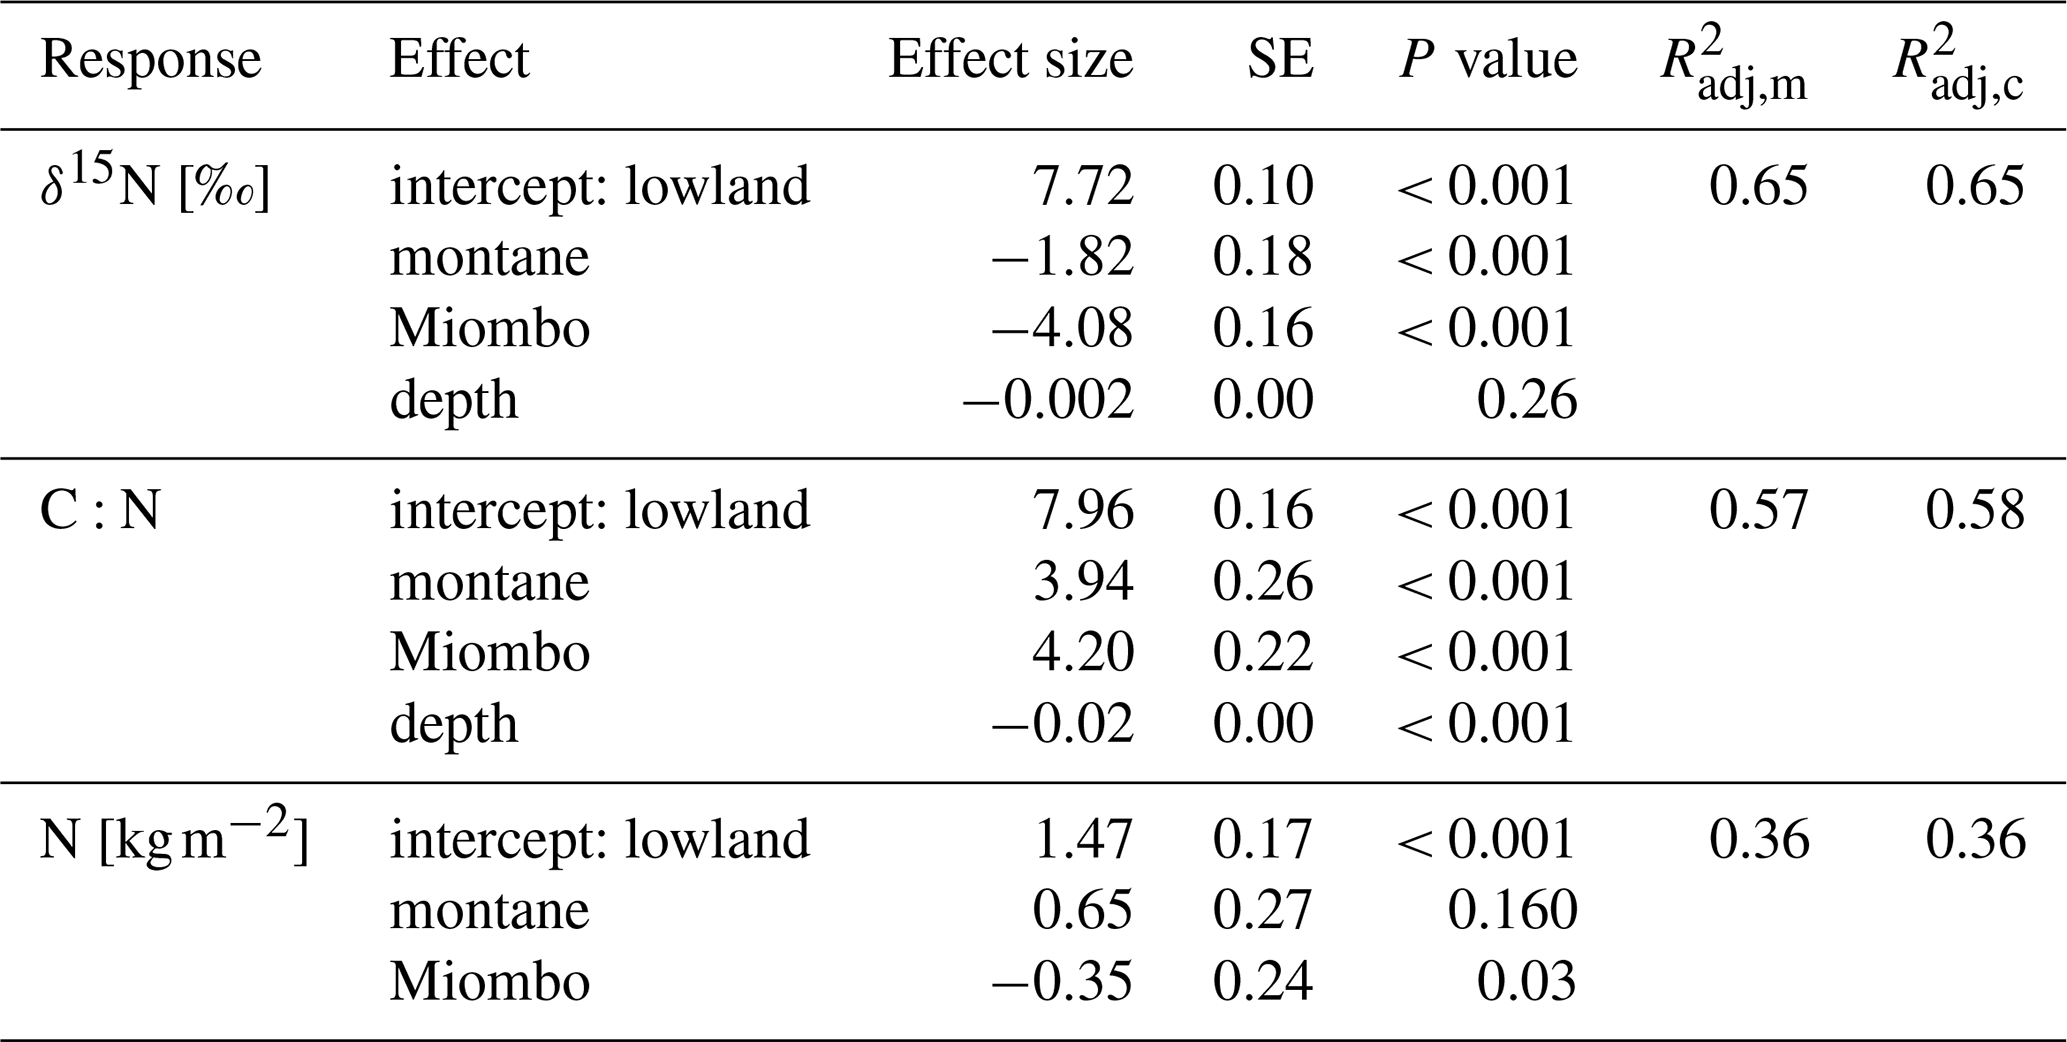
Table 2Fixed-effect estimates for δ15N, N stocks, and C:N ratios. Fixed effects include forest type (lowland, montane, and Miombo) and soil depth in centimeters (for δ15N and C:N). N stocks are for top 100 cm of the soils. For each effect, estimated standard error and estimated P values are given, along with the estimated marginal (m) and conditional (c) (Nakagawa and Schielzeth, 2013).
2.3 Sample analysis
Soil samples were air dried and subsequently sieved through a 2 mm sieve to remove roots and organic residues. To homogenize, soil samples were milled and analyzed for C and N content and 15N isotopes using an elemental analyzer (Automated Nitrogen Carbon Analyzer; SerCon; Crewe, UK) interfaced with an isotope ratio mass spectrometer (IRMS; 20-20, SerCon). δ15N laboratory standards used had a certified value of 7.81 ‰ with an uncertainty across runs of 0.07 ‰. Stable isotope ratios are reported in delta notation:
with RSMP denoting the ratio of the sample and RSTD that of the international reference standard AIR-N2. N stocks were calculated using mass-based N content, multiplied by the bulk density of the respective depth and integrated over the whole profile depth.
2.4 Inter-site comparison
For a better inter-site comparison of the erosional effect we estimated a soil loss coefficient. In addition to slope, soil erosion is controlled by vegetation cover and rainfall characteristics. To incorporate these additional factors, we calculated an erosion coefficient (EC) for each surface soil sample. To calculate the EC, we used the empirical model for sediment detachment () from Pelletier (2012):
where S is the tangent of the mean hillslope gradient of all samples, Ra the mean annual precipitation (MAP), and La the mean annual leaf area index (LAI). Numerical values for LAI were extracted from the Copernicus LAI 300m satellite images produced by the Earth Observation program of the European Commission (European Environment Agency) for the year 2019. MAP data were extracted from the WorldClim database and averaged for the years 2010–2018 (Fick and Hijmans, 2017).
For a pan-tropical comparison, data points from Costa Rica (Weintraub et al., 2015) and Taiwan (Hilton et al., 2013) were extracted from the supporting material of the representative studies. Only these two studies were selected for a pan-tropical comparison, as other datasets containing soil δ15N from tropical forests do not contain information on slope angles and LAI. Furthermore, in other studies, the reported coordinates are not sufficiently precise to extract slope values from global DEMs, resulting in a neglection of within-site variability of slope effects.
2.5 Statistical analysis
To assess the effect of forest type and soil depth on δ15N and mass-based C:N ratio, linear mixed effects models were fitted, controlling for topographic position via a random intercept. A third model was fitted for N stocks. Since stocks are integrated over the whole soil profile, soil depth was omitted as an explanatory variable in the third model, including only the effect of forest type as a fixed effect, while controlling for topographic position via a random intercept. All models were fitted using maximum likelihood methods via the lmerTest package (Kuznetsova et al., 2017). To assess the relation between slope angle and δ15N of the spatial surface samples, linear regressions were applied.
Furthermore, a structural equation model (SEM) was applied to examine the relative direct and indirect importance of different variables on the soil δ15N values of the five tropical forests. A SEM was chosen because it allows one to include dependencies between variables. In soil sciences, SEMs have been used for different applications, for example by implementing different pedological process information in soil mapping approaches (Angelini et al., 2017). The variables considered to explain δ15N were MAP, MAT, LAI, slope, and soil C content. The SEM model was generated using the lavaan package version 0.6 (Rosseel, 2012) for R. All statistical analyses were conducted using the R software (R Development Core Team, 2019).
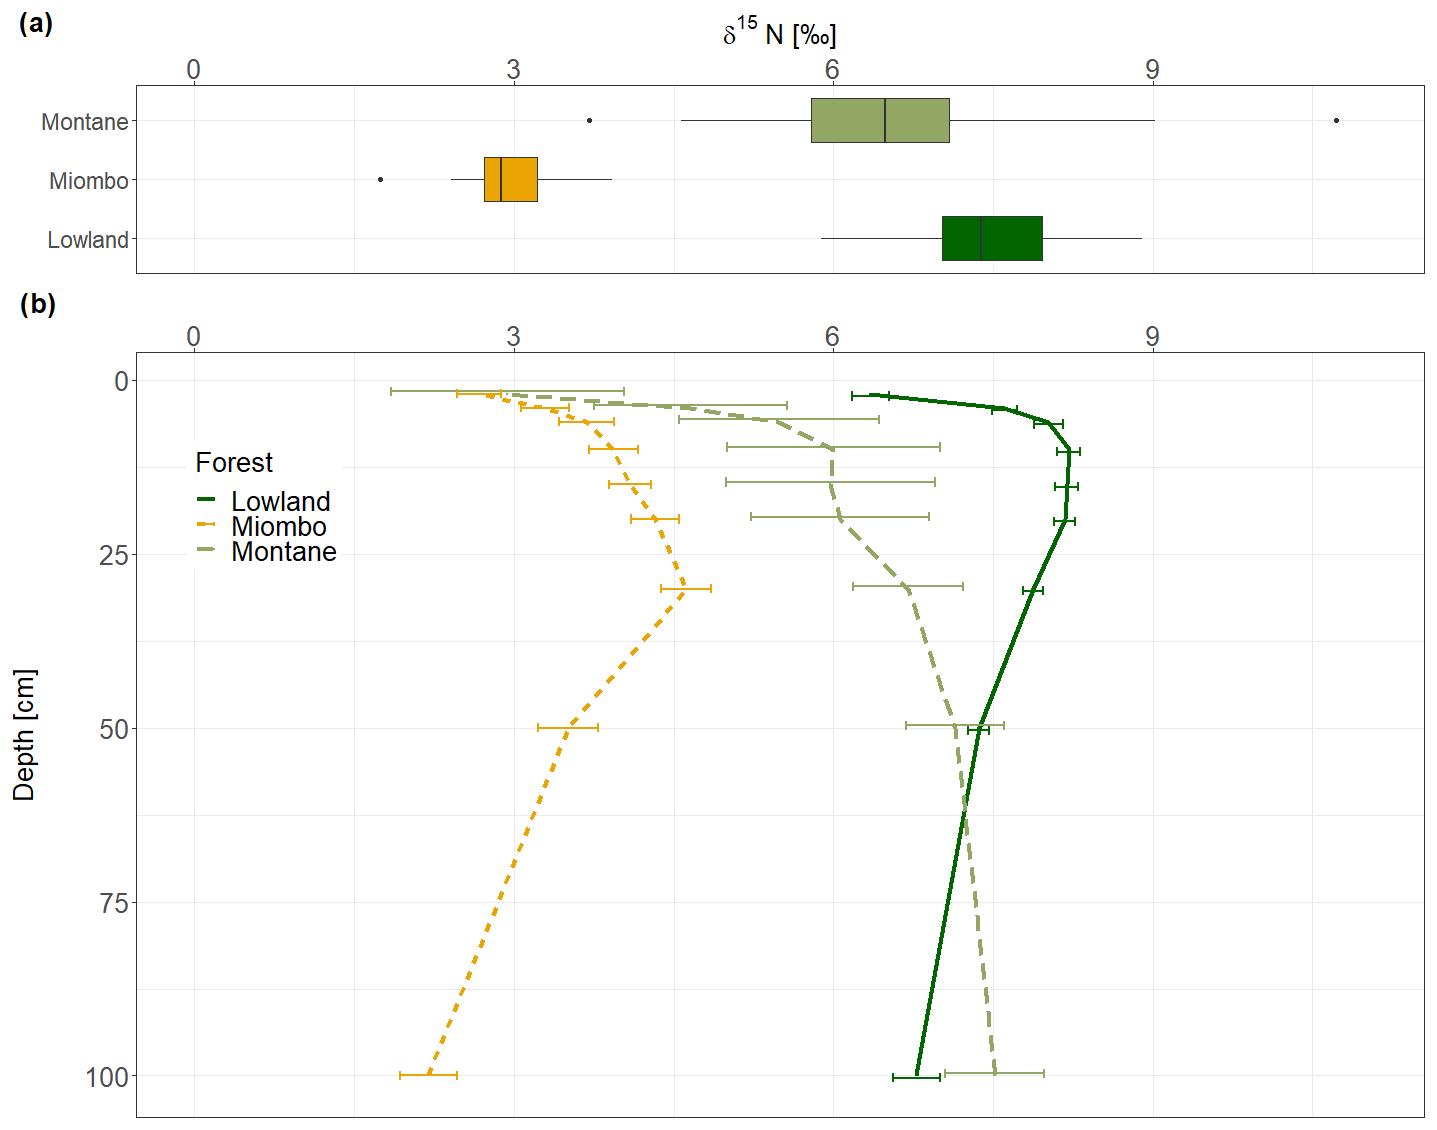
Figure 2(a) Boxplots of the δ15N of the topsoil (0–20 cm) samples from the montane, lowland, and Miombo forest sites. (b) δ15N profiles from the different forest types. Lines showing the means of the replicates from one sampling site. Error bars indicating standard errors.
The montane forest showed the highest N stock with mean value (mean ± standard deviation, SD) of 1.47 ± 0.61 t N ha−1. N stocks were lower in the lowland forest and Miombo woodland, with 0.87 ± 0.11 and 0.73 ± 0.30 t N ha−1, respectively (Table 2). The montane forest and Miombo woodland soils exhibited similar C:N ratios with 11.4 ± 1.1 in the montane and 11.2 ± 1.8 in the Miombo, while the C:N ratio in the lowland forest was lower with a mean value of 7.4 ± 0.5 (Table 2). Average bulk N and C:N values over the whole profile are reported in Fig. S2 in the Supplement. In general, soil profiles of the Miombo woodlands showed the lowest δ15N values (3.59 ± 0.73 ‰, average for 0–100 cm) compared to the montane forest (5.83 ± 1.30 ‰) and the lowland forest (7.62 ± 0.63 ‰), while the lowland forest displayed higher δ15N values, especially in topsoils (Fig. 2). Lowland values increased steadily until a depth of 10 cm and decreased from there again until 100 cm depth. δ15N in the Miombo woodlands showed the highest enrichment at a depth of 30 cm. δ15N values of the montane forest varied considerably (large confidence intervals, Fig. 2) but showed a general steady enrichment with increasing depth (Fig. 2). Spatial topsoil samples from each catchment (0–20 cm) reflected those of the soil profiles, showing the highest δ15N values in the lowland forest (mean ± SD; 7.55 ± 0.69 ‰), while the montane forest displayed slightly lower values (6.48 ± 1.42 ‰); the Miombo woodland was most depleted in δ15N (2.93 ± 0.46 ‰) (Fig. 2b). The topsoil samples from the montane forest showed the highest variability in δ15N values, ranging from 3.71–10.72 ‰ with a coefficient of variation (CV) of 22 %, whereas the Miombo showed a CV of 16 % and the lowland forest a CV of 9 %. Slope angle did not have a significant effect on topsoil δ15N in the lowland and montane forests (p=0.8 for lowland and p=0.57 for montane forest, respectively; Fig. 3). In contrast, topsoil δ15N significantly decreased with increasing sloping angles in the Miombo (r2=0.30, Fig. 3). The Miombo woodland displayed the highest average EC (20.11), whereas the montane (2.77) and lowland (1.22) forests showed clearly lower values (Table 1).
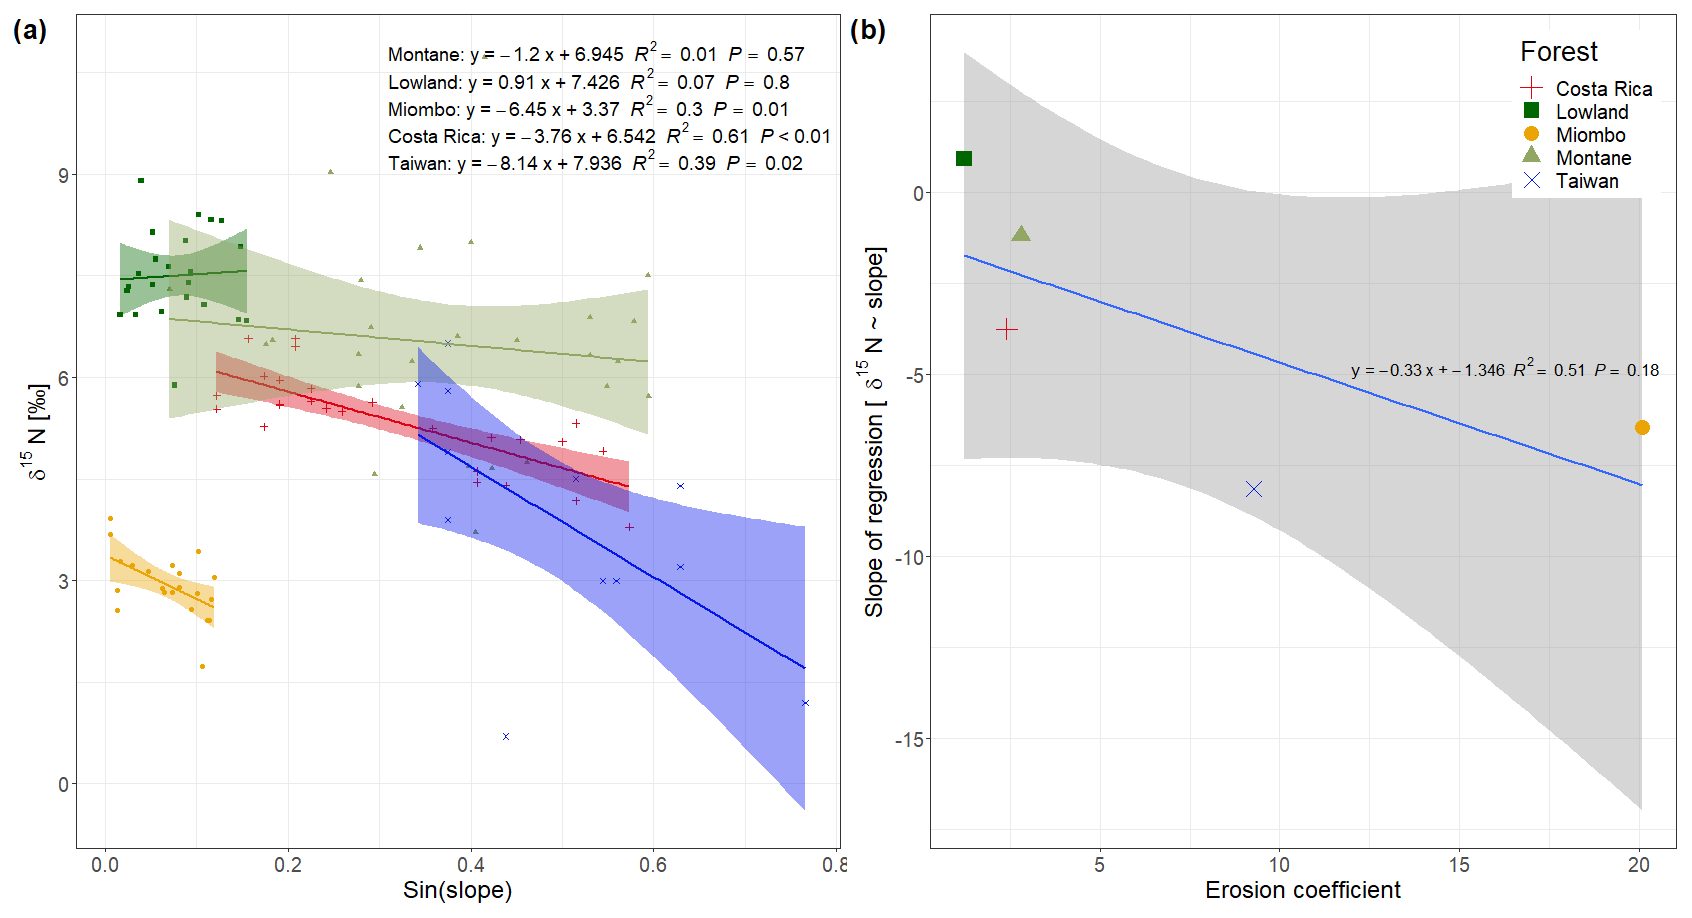
Figure 3(a) Soil δ15N values vs. sinus of the slope from the spatial sampling of topsoil (0–20 cm) in DRC, including data from Costa Rica (Weintraub et al., 2015) and Taiwan (Hilton et al., 2013); (b) slope of the regressions from (a) plotted against the mean erosion coefficient (Eq. 2) of each study site.
4.1 Using soil δ15N to assess differences in ecosystem N turnover
At present, relatively little information on δ15N data for soils in tropical forests is available. This holds especially for central Africa, where almost no data are reported. The study of Rütting et al. (2015) is one of the few studies that reported on δ15N from montane tropical forests in Rwanda. Their values for topsoil (0–5 cm) range between 3.6 ‰ and 4.6 ‰ and are similar to the values reported in this study for the montane forest (mean of 4.4 ‰ for 0–6 cm depth in this study) and are also in the same range reported from topsoil in Rwanda by Bauters et al. (2017). Lower values were found in an old-growth montane forest topsoil (0–10 cm) in Ethiopia (−3 ‰ to 1 ‰, Eshetu and Högberg, 2000) and in semi-natural montane forests in Tanzania (0 ‰–4 ‰, Gerschlauer et al., 2019). δ15N values from tropical mountain forests of Taiwan are also in the same range, with a mean value of 4 ‰ for the upper 10 cm of the soil profile (Hilton et al., 2013). Jamaican soils from tropical montane forests are much more depleted in 15N, with values from −1.6 ‰ to 1.5 ‰ for depths down to 20 cm (Brearley, 2013). Topsoils from an altitudinal gradient in Borneo were also more depleted, with a mean value of 1.6 ‰ (Kitayama and Iwamoto, 2001). δ15N values reported for tropical lowland forests are available for soils in Costa Rica where topsoils (0–10 cm) showed values of 4.7 ‰ (Osborne et al., 2017) and a mean value of 5.9 ‰ for soils from 0–20 cm depth (Weintraub et al., 2015). Higher erosion, due to high rainfall and uplift rates (1.7–8.5 mm yr−1), may explain why these values of lowland forest in Costa Rica are more depleted in the heavier N isotope compared to the lowland forest in Yoko from this study (7.55 ± 0.69 ‰ for 0–20 cm soil samples) because the residence time of soil N decreases with erosion and hence soil rejuvenation (Amundson et al., 2003). The δ15N reported here for the Miombo woodland (2.68 ‰–4.32 ‰ between 0–20 cm, Fig. 2) falls within the same range as values reported by Wang et al. (2013) from a moist woodland savanna in Zambia (2.6 ‰–4.8 ‰) and a mature Miombo woodland in Tanzania (3.5 ‰–3.8 ‰, Mayes et al., 2019), but they are lower compared to values reported from a dry forest in the Cerrado Savanna of Brazil (6.3 ‰–10.8 ‰, Bustamante et al., 2004).
Table 3Foliar plant δ15N [‰] values, N deposition rates [], aquatic TDN, and DON losses [] for the three study sites. Aquatic TDN losses and DON losses are preliminary results from measurements by the authors of this study at the respective study sites (for methods see the Supplement).

References: a Mayes et al. (2019; Miombo woodland Tanzania). b Bauters et al. (2019; lowland forest in Yoko, DRC; montane forest in Kahuzi-Biéga, DRC). c Barthel et al. (2020). d Rees et al. (2006; Miombo Woodland Tanzania).
Soil δ15N is related to the residence time of ecosystem N. Higher rates of mineralization, nitrification, and denitrification leave enriched N in the remaining soil organic matter (SOM), while the more depleted mineral N is removed via plant uptake or denitrification and transported down into deeper soil layers by leaching (Handley et al., 1999; Hobbie and Ouimette, 2009). Over the whole profile, the Miombo woodland showed the highest depletion of 15N (Fig. 2), which would indicate a slower N turnover and a more closed N cycle compared to the lowland and montane forest. However, as the δ15N signatures are also influenced by soil N inputs, the Miombo woodland, dominated by the legume tree Brachystegia, likely receives relatively more depleted 15N through biological N2 fixation. Previous studies have shown that N2 fixation is a more important process in tropical woodlands than in tropical forests (Hogberg and Alexander, 1995), where fewer trees of the Fabaceae family are present (Malmer and Nyberg, 2008). Furthermore, it is reported that symbiotic N2 fixation is downregulated in old-growth tropical lowland forest (Bauters et al., 2016). Thus δ15N of topsoil in these forests is less likely to be affected by N2 fixation, which is clearly indicated by more enriched topsoil δ15N values. Beside N2 fixation, topsoil δ15N is also influenced by the isotopic signature of incoming litterfall, inputs through roots, and N deposition (Craine et al., 2015b), while downward transport processes and transformation of SOM influence the δ15N in deeper soil layers (Baisden et al., 2002). In this study, the Miombo woodland showed slightly lower δ15N values for the topsoil (0–2 cm, 2.66 ‰) than the montane forest (2.94 ‰), while the lowland forest showed a more enriched signature (6.35 ‰). The foliar δ15N presented in Table 3 shows that the values in the Miombo and montane forest are substantially lower than in the lowland forest and that δ15N inputs from plants lower the soil δ15N values in these forests more compared to the lowland forest. Whereas the strong depletion of the Miombo woodland can be related to atmospheric N2 fixation, the shift of plant and topsoil δ15N to more depleted values in the montane forest could also be an altitudinal effect. Depletion of δ15N with increasing elevation in tropical forests has been observed in the Neotropical and Afrotropical forests and was linked to a more conservative N cycle at high altitudes (Bauters et al., 2017).
Soil δ15N profiles of the lowland forest and the Miombo woodland showed a δ15N enrichment peak at 10 and 30 cm depths (Fig. 2b), respectively, indicating the highest microbial activity and/or leaching of soil N in this layer. Montane forest showed a similar peak at the same depth, indicating high turnover or leaching in this soil layer as well. However, from 20 cm onwards δ15N enrichment increased even further to the highest values at 100 cm depth (Fig. 2b). Hobbie and Ouimette (2009) presented a conceptual model for processes that influence δ15N values in a profile. According to this model, a profile with higher δ15N values in the root layers and decreasing δ15N in subsequent depths (similar to the lowland and Miombo profiles) is more likely to occur in an open system with lower N limitation and more inorganic N cycling (Hobbie and Ouimette, 2009). Denitrification and associated gaseous N losses cause the increase of soil δ15N at intermediate depth. Leaching and subsequent microbial assimilation of depleted NO3 at lower depths result in the more depleted δ15N signature of lower soil layers compared to the intermediate depth (Hobbie and Ouimette, 2009). This is also in line with the higher N2O fluxes that were observed in the lowland forests of Yoko and in Miombo woodlands in Tanzania compared to montane forests in Kahuzi-Biéga (Table 3), indicating generally a higher N turnover (especially nitrification and denitrification) occurring at these sites. Moreover, Bauters et al. (2019) showed indication of mineral N excess in the Yoko lowland forest, which is also due to high atmospheric N depositions in the central African lowlands (Table 3). Overall, the soil δ15N profiles of the lowland forest and the Miombo woodland seem to have a more open N cycle due to excess N availability, which is most likely due to high N depositions in the lowland and high N2 fixation in the Miombo.
On the other hand, a soil profile where 15N continuously increases with depth (i.e., the case of the montane forest) is indicative of an N-limited ecosystem or dominated by organic N cycling. In these systems, assimilation of leachate (depleted in δ15N) in deeper soil layers is less common; thus the δ15N steadily increases with depth. Although we found the highest N stocks in the montane forest, higher foliar C:N ratios of tropical forests with increasing altitude (Bauters et al., 2017) indicate that this ecosystem experiences lower N availability and is dominated by organic N cycling. In Rwandan and Ecuadorian forests, Bauters et al. (2017) concluded from leaf δ15N altitudinal gradients that N cycling becomes more closed with increasing elevation and hypothesized that organic N sources for plants become more important in ecosystems with lower temperatures. Furthermore, very high mineralization rates have been measured in the montane forests of Kahuzi-Biéga, which indicates a high organic matter turnover in these forests (Bauters et al., 2019), which is supported by the high aquatic total dissolved nitrogen (TDN) and dissolved organic nitrogen (DON) exports from this forest (Table 3).
4.2 Influence of topography on soil δ15N
A possible effect of topography on soil δ15N is most likely due to higher erosion of steeper slopes compared to flat landscapes, because we assume that within a site other factors controlling soil δ15N (such as temperature, precipitation, and vegetation cover) do not vary with topography. In contrast to the Costa Rican tropical lowland forests (Weintraub et al., 2015), slope angle was found to have no effect on δ15N in the lowland forest of this study (Fig. 3a). In contrast to the Costa Rican site, there are no steep slopes in the lowland forest of this study (max. slope sampled 9∘), and thus there is a low potential for physical erosion. This is also indicated by a lower EC (1.22) in the lowlands compared to Costa Rica (2.39) (Table 1). Although the Miombo woodland is located in an area with similar topography to the lowland forest (Fig. 1), the EC from this area is much higher (20.11). This can be explained by the fact that the forest cover in the Miombo is less dense than the tropical forests, and this increases the exposure of the soil surface to the energetic input of rainfall. Furthermore, the loss of understory vegetation from fire, which occurs frequently during the dry season (Campbell, 1996), leaves the soil unprotected from erosion at the onset of the rainy season. The spatial topsoil samples of the Miombo woodland clearly indicate a significant effect of slope angles on δ15N (Fig. 3a). The δ15N values in the montane forest, situated on steep terrain, tend to decrease with increasing slope angle; however, the visible trend is not statistically significant (P value of 0.57, Fig. 3a). Furthermore, we found a higher variability in δ15N values of the soil samples in the montane forest (CV of 22 %) compared to the Miombo (CV of 15 %) and lowland forest (CV of 9 %). While slope angle is a commonly used predictor of soil erosion potential, the curvature of the land surface (i.e., convex or concave) has also been shown to affect soil erosion at a local scale (Stefano et al., 2000). The specific hydrology seems to control the erosive mechanism, as slope gradients have been found to influence the rate of soil erosion through overland flow, while curvatures affect diffusive processes, such as splash erosion (Stefano et al., 2000). However, while a trend of lower δ15N on more convex landscapes in the montane forest is visible (Fig. S1 in the Supplement), no statistical significance was found either, as samples were not equally distributed over the range of curvatures. In addition, because our sampling strategy was focused on the slopes, sample sites were biased towards concave curvatures.
Comparing the effect of slope angles on topsoil δ15N of the study sites from the Congo Basin with the effect observed in tropical forests of Costa Rica (Weintraub et al., 2015) and Taiwan (Hilton et al., 2013) shows that the magnitude of the effect is related to the mean erosion coefficient in these ecosystems (Fig. 3b). Sites with a high erosion coefficient show a higher slope of the regression δ15N∼ slope angles compared to sites with a low erosion coefficient, implying a bigger effect on soil δ15N in more geomorphic active sites. As the dense tropical lowland forests of the Congo Basin do not represent high EC values, the local effect of erosion on soil δ15N seems negligible. Although the montane forest shows a moderate EC, due to the steep topography, the high variability in soil N likely masks the potential effect of topography on δ15N in our dataset. The estimation of EC based on Eq. (1) assumes that splash and overland flow are the dominant erosion processes, but this may underestimate erosional forces at higher hillslope angles (Pelletier, 2012). At higher hillslope angles, landslides will be more important erosional processes than overland flow. This might indicate that sites with high risks of landslides (as shown in the landslide hazard index (LSI) in Table 1) are even more prone to physical soil loss than the EC would indicate. In this case especially the forest in Taiwan (LSI of 4), and the montane forest (LSI of 3.96) and the forest in Costa Rica (LSI of 3.65) experience a high risk of landslides, and total soil loss in this forest might even be higher than predicted by the EC.
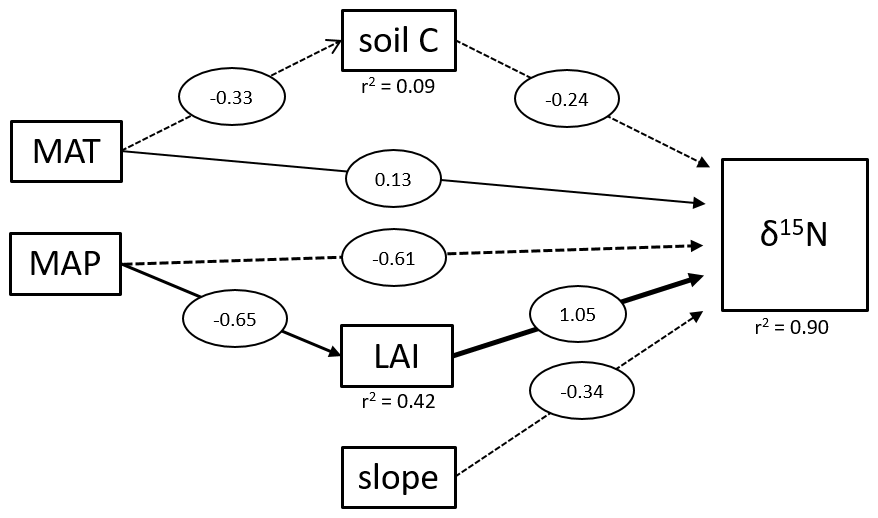
Figure 4Structural equation model of direct and indirect effects on tropical soil δ15N values. The diagram shows all significant relationships. MAT represents the mean annual temperature in degrees Celsius, MAP the mean annual precipitation in millimeters and LAI the leaf area index. Soil C is the carbon content of the soil samples and slope the slope angles of the sampling site. Numbers represent the strength of each effect.
We applied a SEM to assess the driving factors of the topsoil δ15N variability between different tropical forest sites (Fig. 4). On a global scale, soil δ15N is reported to be mainly influenced by climatic factors (MAT and MAP) and soil properties, such as soil C and clay content (Craine et al., 2015a). Our results showed that soil C had only a marginal influence (lower coefficient compared to slope, MAP, and LAI) on tropical soil δ15N and is only significantly influenced by MAT and not MAP. Soil δ15N in these tropical forests seems to be primarily influenced by factors controlling erosion (MAP, LAI, and slope). Beside the direct effect of MAP on soil δ15N, there is also a significant indirect effect visible, where sites with higher MAP experience also higher LAI values (Fig. 4). It was not possible to analyze the effect of clay content on δ15N because the data were not available for all the sites. Although our data showed only for the Miombo a significant effect of topography on the soil δ15N values, our pantropical analysis suggests that especially in geomorphic active regions, erosion needs to be taken into account to explain local differences in soil δ15N values. However, it is important to state that the SEM with only 112 samples from 5 different ecosystems represents an overly simple model, and more data are needed for a more precise outcome. Unfortunately, additional δ15N data that include topographical variability are not available, to the best of our knowledge.
The three tropical forest ecosystems in the Congo Basin each showed a distinct δ15N soil profile. The δ15N soil profiles in the montane forest indicate a closed N cycle, which supports the common theory of decreasing N availability at higher altitudes. In contrast, the δ15N soil profiles indicated that the lowland forest and Miombo woodland tended to have more open N cycles, which were mostly dominated by inorganic N cycling. The Miombo woodland showed the lowest δ15N values, which is most plausibly explained by enhanced N2 fixation due to the tree species composition dominated by the legume Brachystegia. Furthermore, topsoil δ15N signatures across our and literature sites of the tropics suggest that a significant amount of the observed variability can be explained by erosional processes. Rainfall, vegetation cover, and topography are the main factors to explain δ15N variability between five different tropical forest sites. Within the Congo Basin, only the Miombo woodland showed an influence of slope on soil δ15N, whereas in the lowland forest, the comparably low MAP, dense vegetation, and flat topography likely limit erosion and resulted in the lack of a correlation between the δ15N of soil N and slope angle. In general, this study highlights the possible importance of soil erosion on N budget in tropical forests. However, not all sites are similarly impacted. Therefore, soil erosion has to be taken into account while interpreting of soil δ15N values as a proxy for N cycling. It underlines the importance of further spatial field studies in the tropics given the observed high variabilities between different tropical forest types.
All data used in this study were published at Zenodo and are available under https://doi.org/10.5281/zenodo.4113895 (Baumgartner et al., 2020).
The supplement related to this article is available online at: https://doi.org/10.5194/soil-7-83-2021-supplement.
SB, MaBau, PB, and KvO designed the research project. SB and MaBau carried out fieldwork and laboratory work. Data analysis and interpretation was performed by SB, MaBau, KvO, TWD, MaBar, JS, and PB. SB wrote the manuscript with contributions from all coauthors.
The authors declare that they have no conflict of interest.
This article is part of the special issue “Tropical biogeochemistry of soils in the Congo Basin and the African Great Lakes region”. It is not associated with a conference.
We thank the authorities and park rangers of the Institut Congolais pour la Conservation de la Nature (ICCN) for the help in accessing the field site in the Kahuzi-Biéga National Park. We are grateful for Serge Alebadwa, Nadine Bahizire, Claudino Sumaili, Degra Ngoy, Christ Ibrahimu, and Rosine Bakengere for assistance during the fieldwork. We are also thankful for Katja Van Nieuland and Samuel Bodé for the help with sample analysis.
This research has been supported by the Fonds De La Recherche Scientifique – FNRS (grant nos. T.0059.18 and J.0167.19).
This paper was edited by Peter Finke and reviewed by two anonymous referees.
Alvarez-Clare, S., Mack, M. C., and Brooks, M.: A direct test of nitrogen and phosphorus limitation to net primary productivity in a lowland tropical wet forest, Ecology, 94, 1540–1551, https://doi.org/10.1890/12-2128.1, 2013.
Amundson, R., Austin, A. T., Schuur, E. A. G., Yoo, K., Matzek, V., Kendall, C., Uebersax, A., Brenner, D., and Baisden, W. T.: Global patterns of the isotopic composition of soil and plant nitrogen, Global Biogeochem. Cy., 17, 1, https://doi.org/10.1029/2002GB001903, 2003.
Angelini, M. E., Heuvelink, B. M., and Kempen, B.: Multivariate mapping of soil with structural equation modelling, Eur. J. Soil Sci., 68, 575–591, https://doi.org/10.1111/ejss.12446, 2017.
Asner, G. P., Anderson, C. B., Martin, R. E., Tupayachi, R., Knapp, D. E., and Sinca, F.: Landscape biogeochemistry reflected in shifting distributions of chemical traits in the Amazon forest canopy, Nat. Geosci., 8, 567–575, https://doi.org/10.1038/ngeo2443, 2015.
Austin, A. T. and Vitousek, P. M.: Nutrient dynamics on a precipitation gradient in Hawai'i, Oecologia, 113, 519–529, https://doi.org/10.1007/978-3-642-78568-9_6, 1998.
Baisden, W. T., Amundson, R., Brenner, D. L., Cook, A. C., Kendall, C., and Harden, J. W.: A multiisotope C and N modeling analysis of soil organic matter turnover and transport as a function of soil depth in a California annual grassland soil chronosequence, Global Biogeochem. Cy., 16, 82-1–82-26, https://doi.org/10.1029/2001gb001823, 2002.
Barthel, M., Bauters, M., Baumgartner, S., Drake, T. W., Bush, G., Boeckx, P., Botefa, C., Dériaz, N., Gallarotti, N., Mbayu, F. M., Mugula, K. J., Makelele, I. A., Mohn, J., Ntaboba, L. C., Rukeza, M. B., Spencer, R. G. M., Summerauer, L., Vanlauwe, B., Van Oost. K., Wolf, B., and Six, J.: Congo Basin's tropical forests are a strong sink for CH4 and a weak source of N2O, Nat. Commun., submitted, 2020.
Baumgartner, S., Bauters, M., Barthel, M., Drake, T. W., Ntaboba, L. C., Bazirake, B. M., Six, J., Boeckx, P., and Van Oost, Kristof: Stable isotope signatures of soil nitrogen on an environmental-geomorphic gradient within the Congo Basin [Data set], Zenodo, https://doi.org/10.5281/zenodo.4113895, 2020.
Bauters, M., Mapenzi, N., Kearsley, E., Vanlauwe, B., and Boeckx, P.: Facultative nitrogen fixation by legumes in the central Congo basin is downregulated during late successional stages, Biotropica, 48, 281–284, https://doi.org/10.1111/btp.12312, 2016.
Bauters, M., Verbeeck, H., Demol, M., Bruneel, S., Taveirne, C., Van der Heyden, D., Cizungu, L., and Boeckx, P.: Parallel functional and stoichiometric trait shifts in South American and African forest communities with elevation, Biogeosciences, 14, 5313–5321, https://doi.org/10.5194/bg-14-5313-2017, 2017.
Bauters, M., Verbeeck, H., Rütting, T., Barthel, M., Bazirake Mujinya, B., Bamba, F., Bodé, S., Boyemba, F., Bulonza, E., Carlsson, E., Eriksson, L., Makelele, I., Six, J., Cizungu Ntaboba, L., and Boeckx, P.: Contrasting nitrogen fluxes in African tropical forests of the Congo Basin, Ecol. Monogr., 89, e01342, https://doi.org/10.1002/ecm.1342, 2019.
Blackmer, A. M. and Bremner, J. M.: Nitrogen isotope discrimination in denitrification of nitrate in soils, Soil Biol. Biochem., 9, 73–77, https://doi.org/10.1016/0038-0717(77)90040-2, 1977.
Boeckx, P., Paulino, L., Oyarzún, C., Cleemput, O. V. A. N., and Godoy, R.: Soil δ15N patterns in old-growth forests of southern Chile as integrator for N-cycling, Isot. Environ. Healt. S., 41, 249–259, 2005.
Brearley, F. Q.: Nitrogen stable isotopes indicate differences in nitrogen cycling between two contrasting Jamaican montane forests, Plant Soil, 367, 465–476, https://doi.org/10.1007/s11104-012-1469-z, 2013.
Bustamante, M. M. C., Martinelli, L. A., Silva, D. A., Camargo, P. B., Klink, C. A., Domingues, T. F., and Santos, R. V.: 15N natural abundance in woody plants and soils of Central brazilian savannas (cerrado), Ecol. Appl., 14, 200–213, https://doi.org/10.1890/01-6013, 2004.
Campbell, B.: The Miombo in Transition: Woodlands and Welfare in Africa, Center for International Forestry Research (CIFOR), Bogor, Indonesia, 1996.
Craine, J. M., Elmore, A. J., Wang, L., Augusto, L., Baisden, W. T., Brookshire, E. N. J., Cramer, M. D., Hasselquist, N. J., Hobbie, E. A., Kahmen, A., Koba, K., Kranabetter, J. M., Mack, M. C., Marin-Spiotta, E., Mayor, J. R., McLauchlan, K. K., Michelsen, A., Nardoto, G. B., Oliveira, R. S., Perakis, S. S., Peri, P. L., Quesada, C. A., Richter, A., Schipper, L. A., Stevenson, B. A., Turner, B. L., Viani, R. A. G., Wanek, W., and Zeller, B.: Convergence of soil nitrogen isotopes across global climate gradients, Sci. Rep.-UK, 5, 1–8, https://doi.org/10.1038/srep08280, 2015a.
Craine, J. M., Brookshire, E. N. J., Cramer, M. D., Hasselquist, N. J., Koba, K., Marin-Spiotta, E., and Wang, L.: Ecological interpretations of nitrogen isotope ratios of terrestrial plants and soils, Plant Soil, 396, 1–26, https://doi.org/10.1007/s11104-015-2542-1, 2015b.
Di Stefano, C., Ferro, V., Porto, P., and Tusa, G.: Slope curvature influence on soil erosion and deposition processes, Water Resour. Res., 36, 607–617, 2000.
Eshetu, Z. and Högber, P.: Effects of land use on 15N natural abundance of soils in Ethiopian highlands, Plant and Soil, 222, 109–117, https://doi.org/10.1023/A:1004777301260, 2000.
Fernández-Martínez, M., Vicca, S., Janssens, I. A., Sardans, J., Luyssaert, S., Campioli, M., Chapin, F. S., Ciais, P., Malhi, Y., Obersteiner, M., Papale, D., Piao, S. L., Reichstein, M., Rodà, F., and Peñuelas, J.: Nutrient availability as the key regulator of global forest carbon balance, Nat. Clim. Change, 4, 471–476, https://doi.org/10.1038/nclimate2177, 2014.
Fick, S. E. and Hijmans, R. J.: WorldClim 2: new 1-km spatial resolution climate surfaces for global land areas, Int. J. Climatol., 37, 4302–4315, https://doi.org/10.1002/joc.5086, 2017.
Gerschlauer, F., Saiz, G., Schellenberger Costa, D., Kleyer, M., Dannenmann, M., and Kiese, R.: Stable carbon and nitrogen isotopic composition of leaves, litter, and soils of various ecosystems along an elevational and land-use gradient at Mount Kilimanjaro, Tanzania, Biogeosciences, 16, 409–424, https://doi.org/10.5194/bg-16-409-2019, 2019.
Handley, L. L., Austin, A. T., Robinson, D., Scrimgeour, C. M., Raven, J. A., Heaton, T. H. E., Schmidt, S., and Stewart, G. R.: The 15N natural abundance (δ15N) of ecosystem samples reflects measures of water availability, Aust. J. Plant Physiol., 26, 185–199, https://doi.org/10.1071/PP98146, 1999.
Hilton, R. G., Galy, A., West, A. J., Hovius, N., and Roberts, G. G.: Geomorphic control on the δ15N of mountain forests, Biogeosciences, 10, 1693–1705, https://doi.org/10.5194/bg-10-1693-2013, 2013.
Hobbie, E. A. and Ouimette, A. P.: Controls of nitrogen isotope patterns in soil profiles, Biogeochemistry, 95, 355–371, https://doi.org/10.1007/s10533-009-9328-6, 2009.
Hofhansl, F., Chacón-Madrigal, E., Fuchslueger, L., Jenking, D., Morera-Beita, A., Plutzar, C., Silla, F., Andersen, K. M., Buchs, D. M., Dullinger, S., Fiedler, K., Franklin, O., Hietz, P., Huber, W., Quesada, C. A., Rammig, A., Schrodt, F., Vincent, A. G., Weissenhofer, A., and Wanek, W.: Climatic and edaphic controls over tropical forest diversity and vegetation carbon storage, Sci. Rep.-UK, 10, 1–11, https://doi.org/10.1038/s41598-020-61868-5, 2020.
Högberg, P.: Forests losing large quantities of nitrogen have elevated 15N:14N ratios, Oecologia, 84, 229–231, https://doi.org/10.1007/BF00318276, 1990.
Högberg, P.: Tansley Review No. 95 15N natural abundance in soil-plant systems, New. Phytol., 137, 179–203, https://doi.org/10.1046/j.1469-8137.1997.00808.x, 1997.
Högberg, P. and Alexander, I. J.: Roles of Root Symbioses in African Woodland and Forest: Evidence from 15N abundance and foliar analysis, J. Ecol., 83, 217–224, 1995.
Högberg, P. and Johannisson, C.: 15N Abundance of forests is correlated with losses of nitrogen, Plant Soil, 157, 147–150, 1993.
Kitayama, K. and Iwamoto, K.: Patterns of natural 15N abundance in the leaf-to-soil continuum of tropical rain forests differing in N availability on Mount Kinabalu, Borneo, Plant Soil, 229, 203–212, https://doi.org/10.1023/A:1004853915544, 2001.
Kuznetsova, A., Brockhoff, P. B., and Christensen, R. H. B.: lmerTest Package: Tests in Linear Mixed Effects Models, J. Stat. Softw., 82, 1–26, https://doi.org/10.18637/jss.v082.i13, 2017.
Lewis, S. L.: Tropical forests and the changing earth system, Philos. T. Roy. Soc. B, 361, 195–210, https://doi.org/10.1098/rstb.2005.1711, 2006.
Malhi, Y. and Grace, J.: Tropical forests and atmospheric carbon dioxide, Trends Ecol. Evol., 15, 332–337, https://doi.org/10.1016/S0169-5347(00)01906-6, 2000.
Malmer, A. and Nyberg, G.: Forest and water relations in miombo woodlands: need for understanding of complex stand management, Working Papers of the Finnish Forest Research Institute, 98, 70–86, 2008.
Martinelli, L. A., Piccolo, M. C., Townsend, A. R., Vitousek, P. M., Cuevas, E., McDowell, W., Robertson, G. P., Santos, O. C., and Treseder, K.: Nitrogen stable isotopic composition of leaves and soil: Tropical versus temperate forests, Biogeochemistry, 46, 45–65, 1999.
Mayes, M., Melillo, J., Neill, C., Palm, C., Mustard, J., and Nyadzi, G.: Nitrogen Cycle Patterns During Forest Regrowth in an African Miombo woodland Landscape, J. Geophys. Res.-Biogeo., 124, 1591–1603, https://doi.org/10.1029/2018JG004803, 2019.
Nadelhoffer, K. J. and Fry, B.: Nitrogen isotope studies in forest ecosystems, in: Stable Isotopes in Ecology and Environmental Science, edited by: Michener, R. and Lajtha, K., Blackwell Scientific Publications, London, 22–44, 1994.
Nakagawa, S. and Schielzeth, H.: A general and simple method for obtaining R2 from generalized linear mixed-effects models, Methods Ecol. Evol., 4, 133–142, https://doi.org/10.1111/j.2041-210x.2012.00261.x, 2013.
Osborne, B. B., Nasto, M. K., Asner, G. P., Balzotti, C. S., Cleveland, C. C., Sullivan, B. W., Taylor, P. G., Townsend, A. R., and Porder, S.: Climate, Topography, and Canopy Chemistry Exert Hierarchical Control Over Soil N Cycling in a Neotropical Lowland Forest, Ecosystems, 20, 1089–1103, https://doi.org/10.1007/s10021-016-0095-7, 2017.
Pelletier, J. D.: A spatially distributed model for the long-term suspended sediment discharge and delivery ratio of drainage basins, J. Geophys. Res.-Earth, 117, 1–15, https://doi.org/10.1029/2011JF002129, 2012.
Perakis, S. S., Tepley, A. J., and Compton, J. E.: Disturbance and Topography Shape Nitrogen Availability and δ15N over Long-Term Forest Succession, Ecosystems, 18, 573–588, https://doi.org/10.1007/s10021-015-9847-z, 2015.
Porder, S., Vitousek, P. M., Chadwick, O. A., Chamberlain, C. P., and Hilley, G. E.: Uplift, erosion, and phosphorus limitation in terrestrial ecosystems, Ecosystems, 10, 158–170, https://doi.org/10.1007/s10021-006-9011-x, 2007.
Prescott, C. E.: The influence of the forest canopy on nutrient cycling, Tree Physiol., 22, 1193–1200, https://doi.org/10.1093/treephys/22.15-16.1193, 2002.
R Development Core Team: R: A Language and Environment for Statistical Computing, R Foundation for Statistical Computing, Vienna, Austria, available at: http://www.R-project.org (last access: 22 February 2021), 2019.
Read, D. J.: Mycorrhizas in ecosystems, Experientia, 47, 376–391, https://doi.org/10.1016/0006-2952(93)90100-B, 1991.
Rees, R. M., Wuta, M., Furley, P. A., and Li, C.: Nitrous oxide fluxes from savanna (miombo) woodlands in Zimbabwe, J. Biogeogr., 33, 424–437, https://doi.org/10.1111/j.1365-2699.2005.01423.x, 2006.
Roering, J. J., Kirchner, J. W., and Dietrich, W. E.: Hillslope evolution by nonlinear, slope-dependent transport: Steady state morphology and equilibrium adjustment timescales, J. Geophys. Res.-Sol. Ea., 106, 16499–16513, https://doi.org/10.1029/2001jb000323, 2001.
Rosseel, Y.: lavaan: An R Package for Structural Equation Modeling, J. Stat. Softw., 48, 1–36, 2012.
Rütting, T., Ntaboba, L. C., Roobroeck, D., Bauters, M., Huygens, D., and Boeckx, P.: Leaky nitrogen cycle in pristine African montane rainforest soil, Global Biogeochem. Cy., 29, 1754–1762, https://doi.org/10.1111/1462-2920.13280, 2015.
Soethe, N., Lehmann, J., and Engels, C.: Nutrient availability at different altitudes in a tropical montane forest in Ecuador, J. Trop. Ecol., 24, 397–406, https://doi.org/10.1017/S026646740800504X, 2008.
Tanner, E. V. J., Vitousek, P. M., and Cuevas, E.: Experimental investigation of nutrient limitation of forest growth on wet tropical mountains, Ecology, 79, 10–22, 1998.
Townsend, A. R., Cleveland, C. C., Houlton, B. Z., Alden, C. B., and White, J. W. C.: Multi-element regulation of the tropical forest carbon cycle, Front. Ecol. Environ., 9, 9–17, https://doi.org/10.1890/100047, 2011.
Van Engelen, V. W. P., Verdoodt A., Dijkshoorn, J. A., and Van Ranst E.: Soil and Terrain Database of Central Africa (DR of Congo, Burundi and Rwanda), ISRIC – World Soil Information, Wageningen, 2006.
Van Ranst, E., Baert, G., Ngongo, M., and Mfuka, P.: Carte pédologique de Yangambi, planchette 2: Yangambi, échelle 1:50.000, UGent, Hogent, UNILU, UNIKIN, Gent, 2010.
Vicca, S., Luyssaert, S., Peñuelas, J., Campioli, M., Ill Chapin, F. S., Ciais, P., Heinemeyer, A., Högberg, P., Kutsch, W. L., Law, B. E., Malhi, Y., Papale, D., Piao, S. L., Reichstein, M., Schulze, E. D., and Janssens, I. A.: Fertile forests produce biomass more efficiently, Ecol. Lett., 15, 520–526, https://doi.org/10.1111/j.1461-0248.2012.01775.x, 2012.
Vitousek, P. M.: Litterfall, nutrient cycling, and nutrient limitation in tropical forests, Ecology, 65, 285–298, https://doi.org/10.2307/1939481, 1984.
Vitousek, P. M., Porder, S., Houlton, B. Z., and Chadwick, O. A: Terrestrial phosphorus limitation: mechanisms, implications, and nitrogen – phosphorus interactions, Ecol. Appl., 20, 5–15, https://doi.org/10.1890/08-0127.1, 2010.
Wang, L., Okin, G. S., D'Odorico, P., Caylor, K. K., and Macko, S. A.: Ecosystem-scale spatial heterogeneity of stable isotopes of soil nitrogen in African savannas, Landscape Ecology, 28, 685–698, https://doi.org/10.1007/s10980-012-9776-6, 2013.
Weintraub, S. R., Taylor, P. G., Porder, S., Cleveland, C. C., Asner, G. P., and Townsend, A. R.: Topographic controls on soil nitrogen availability in a lowland tropical forest, Ecology, 96, 1561–1574, https://doi.org/10.1890/14-0834.1, 2015.
Wieder, W. R., Cleveland, C. C., and Townsend, A. R.: Throughfall exclusion and leaf litter addition drive higher rates of soil nitrous oxide emissions from a lowland wet tropical forest, Glob. Change Biol., 17, 3195–3207, https://doi.org/10.1111/j.1365-2486.2011.02426.x, 2011.
Wieder, W. R., Cleveland, C. C., Smith, W. K., and Todd-Brown, K.: Future productivity and carbon storage limited by terrestrial nutrient availability, Nat. Geosci., 8, 441–444, https://doi.org/10.1038/NGEO2413, 2015.