the Creative Commons Attribution 4.0 License.
the Creative Commons Attribution 4.0 License.
 | 01 Mar 2021
Quantifying and correcting for pre-assay CO2 loss in short-term carbon mineralization assays
Matthew A. Belanger
G. Philip Robertson
Sarah S. Roley
The active fraction of soil organic carbon is an important component of soil health and often is quickly assessed as the pulse of CO2 released by re-wetting dried soils in short-term (24–72 h) assays. However, soils can lose carbon (C) as they dry and, if soil samples vary in moisture content at sampling, differential C loss during the pre-assay dry-down period may complicate the assay's interpretations. We examined the impact of pre-assay CO2 loss in a long-cultivated agricultural soil at initial moisture contents of 30 %, 50 %, and 70 % water-filled pore space (WFPS). We found that 50 % and 70 % WFPS treatments lost more C during drying than did those in the 30 % WFPS treatment and that dry-down losses led to a 26 %–32 % underestimate of their CO2 pulses. We developed a soil-specific correction factor to account for these initial soil moisture effects. Future C mineralization studies may benefit from similar corrections.
- Article
(542 KB) - Full-text XML
- BibTeX
- EndNote


The short-term pulse of CO2 following the re-wetting of dried soils (Robertson et al., 1999; Franzluebbers et al., 2000) has been widely used as an indicator of soil health because of its strong relationship with soil organic C, particulate organic C, microbial biomass C, and cumulative nitrogen and C mineralization over longer periods (e.g., 24 d; Franzluebbers et al., 2000). This method is derived from the “Birch effect”, whereby re-wetted dry soils release a pulse of CO2 resulting from increased microbial activity (Birch, 1958). Drought stress drives microbial communities to dormancy or death (Borken and Matzner, 2009), and re-wetting stimulates C mineralization (Kim et al., 2012).
Several mechanisms could explain the Birch effect, reviewed by Jarvis et al. (2007), among others. Briefly, these include the following: (1) drying and wetting destroy soil aggregates, thus making previously inaccessible organic substrates available (Denef et al., 2001; Homyak et al., 2018); (2) microbes killed after drying are decomposed upon re-wetting (Blazewicz et al., 2014, 2020); (3) microbes release solutes to avoid bursting in response to osmotic stress caused by re-wetting (Schimel et al., 2007); and (4) microbial populations and their activity rebound in response to re-wetting (e.g., Barnard et al., 2013). Recent studies suggest that both cellular and extracellular C are likely to contribute to the larger CO2 pulse following re-wetting (Slessarev et al., 2020; Warren, 2020), implying that multiple mechanisms could be important.
Although the short-term pulse of CO2 following the re-wetting of dry soils is a widely used method in soil health assessments (e.g., Culman et al., 2013; Ladoni et al., 2016; Morrow et al., 2016; Sprunger and Robertson, 2018), there may be potential bias introduced by assaying soils of different moisture contents at the time of sampling. Soils that differ in moisture will dry down at different rates, potentially losing different amounts of C prior to the start of the assay. If sufficiently large, differential pre-assay losses could complicate soil health comparisons across field treatments, landscape catenas, or different time points within the same soil.
Here we investigate the influence of initial soil moisture levels on pre-assay CO2 release during drying for an Alfisol soil in the upper Midwest, USA. We test the hypothesis that moister soil will have higher pre-assay CO2 loss because a longer dry-down period results in more time for such losses to occur.
2.1 Site description
We collected soil using a shovel from the Ap horizon (0–20 cm) of an arable grass field at the W. K. Kellogg Biological Station (KBS) in Hickory Corners, MI ( N, W). KBS soils are mixed, mesic Typic Hapludalfs of co-mingled Kalamazoo and Oshtemo series (Crum and Collins, 1995) developed on glacial outwash with intermixed loess (Luehmann et al., 2016). Soil collected in September 2019 for this experiment was from the Kalamazoo series, which are well-drained fine loams (43 % sand, 38 % silt, 19 % clay) with ∼ 2 % total C (Grandy and Robertson, 2006) and a pH of 7.2 (Robertson et al., 1993). Average annual precipitation at KBS is 1005 mm, and mean annual temperature is 10.1 ∘C (Robertson and Hamilton, 2015). The site was in various corn–soybean–wheat rotations for the 40 years prior to sampling and, before that, corn–soybean–small grain rotations for at least 60 years.
2.2 Experimental design
To examine the influence of initial soil moisture on the pre-assay loss of CO2 during dry-down, we pre-wet recently collected soil to three different initial water-filled pore space (WFPS) levels: 30 %, 50 %, and 70 %. Then we measured gravimetric soil moisture (GSM) and CO2 loss while soil was air-drying, after which we re-wet them and measured the 24 h CO2 pulse by standard methods (Robertson et al., 1999; Franzluebbers et al., 2000).
2.3 Laboratory analyses
After collection, soil was sieved through a 4 mm mesh and mixed. We measured GSM and calculated the target volumetric water content (VWC, g H2O cm−3 soil) for each treatment following Eq. (1) (Elliott et al., 1999):
where soil bulk density (SBD) is 1.5 g soil cm−3, as previously assessed by Robertson (2016). Then we divided VWC by SBD to obtain a target GSM and thereby determined the amount of water to add to the field-moist soil (11 % WFPS; GSM=0.032 g H2O g−1 dry soil). We then weighed 40 g of soil into each of 75 polyethylene cups. Each cup was randomly assigned to an initial WFPS treatment (30, 50, or 70 %), for a total of 25 replicates per treatment. We added sufficient deionized water to each cup to achieve the target initial WFPS and stirred to evenly distribute water. After soil was wet and stirred in the cups, the contents of each cup were transferred to a labeled paper bag. The soil was spread evenly across the bottom of the bag, and the top portion of the bag was removed to increase air flow. Afterwards, the soil was immediately weighed and set on a laboratory bench to air-dry.
Immediately after wetting, as well as 1, 3, and 8 d later, we assessed GSM and CO2 loss rates for five replicates per initial WFPS treatment. GSM, which was determined after drying the soil at 105 ∘C for 24 h, stabilized at 1.5 % in the air-dried soil (Fig. 1a) but did not reach zero even when soil was completely air-dry. Because soils in all initial WFPS treatments were air-dry by day 3, with CO2 loss rates close to zero, we terminated GSM and CO2 measurements after day 8.
CO2 loss rates at each sampling interval were measured by placing 10 g of soil into a 235 mL mason jar fitted with a gas-sampling septum. Then we sampled 5 mL of headspace from each jar at four intervals (0, 0.5, 1, and 2 h), injected it into an evacuated 3 mL exetainer (Labco Limited, Lampeter, Wales, United Kingdom), and replaced the jar headspace with laboratory air. CO2 samples were analyzed within 24 h using a LI-820 CO2 Gas Analyzer (LI-COR Biosciences, Lincoln, NE, USA).
On day 15 we re-wet the remaining five replicates of air-dried soil from each initial WFPS treatment to 50 % WFPS (Franzluebbers et al., 2000). We then assessed subsequent 24 h CO2 pulses by sampling headspaces at 0, 2, 4, 8, and 24 h.
2.4 Statistical analyses and correction factor
CO2 loss rates and pulses were calculated as the positive slope of the linear regression of CO2 concentrations through time after accounting for headspace dilution and then converted to a standardized rate using the ideal gas law. In 17 of 75 cases, we omitted one of the four data points within a jar, which were clear visual outliers. In two cases, we rejected jars with leaks. CO2 loss rates during the dry-down period were analyzed with a two-way analysis of covariance (ANCOVA), where initial WFPS treatment and days elapsed since wetting (day) were factors and GSM at the time of sampling was a covariate. Additionally, a one-way analysis of variance (ANOVA) was used to determine whether initial WFPS treatment significantly affected the 24 h CO2 pulses upon re-wetting the air-dried soil.
We also calculated a correction factor to account for pre-assay CO2 loss prior to the 24 h CO2 pulse assay. To calculate the total amount of CO2 loss during dry-down for each initial WFPS treatment, we calculated a best-fit exponential decay curve:
where Y= daily CO2–C loss and X= length of dry-down period, until soil was air-dry (i.e., immediately after wetting through day 3). Total C loss was equivalent to calculating the area under the curve, using bootstrapping to estimate error.
Because we used sacrificial sampling, we could not calculate standard deviation or standard error in the usual way. Instead, we used a bootstrapping approach in which we computed predicted values for CO2 losses (Yi) and residuals (). All zeros for CO2 losses were set to 1 for fitting the regression because an exponential decay curve can approach but never attain 0 and because 1 was lower than any value we observed. Then we created a bootstrap sampling of residuals specific to each dry-down interval (0, 1, or 3 d), sampled randomly from each interval with replacement, and added randomly sampled residuals to predicted values () for each dry-down interval (after Hesterberg, 2015). Residuals were bootstrapped 10 000 times to derive multiple estimates of coefficients for the exponential decay curve (α, β, and θ). We also integrated under the curve 10 000 times to get an error estimate (i.e., coefficient of variation) associated with the total amount of pre-assay CO2 loss during dry-down.
Then we divided the total CO2 loss by 3 d to obtain the daily rate used to calculate a correction factor following Eq. (3):
The correction factor for each treatment was then multiplied by each replicate's 24 h CO2 pulse following re-wetting. Finally, we verified that the correction factors worked by conducting a one-way ANOVA to determine whether initial WFPS treatment still had an effect on the corrected pulses. For all analyses, we confirmed that assumptions of normality and homogeneity of variance were not violated.
As expected, soil in the 50 % and 70 % WFPS treatments took longer to dry than did soil in the 30 % WFPS treatment (Fig. 1a). A day after wetting, soil from the 30 % WFPS treatment was completely air-dry, but soil in the 50 % and 70 % WFPS treatments had lost only 79 % and 68 % of their initial moisture, respectively. All soil was air-dry by 3 d after wetting. Pre-assay CO2 losses mirrored soil moisture loss, reaching zero for all WFPS treatments by day 3 (Fig. 1b). Both GSM at the time of sampling and day had effects on pre-assay CO2 loss rates (P<0.0001), but initial WFPS treatment did not (P=0.28), probably because GSM captures more variation in soil moisture than WFPS treatment as the soil dries. However, there was an interaction between treatment and Day (P=0.0005). Soil of even the lowest initial WFPS treatment lost C as CO2 over 3 d of drying (26 µg CO2-C g−1 soil for 30 % WFPS), but losses were disproportionately higher from wetter soil (62 and 71 µg CO2-C g−1 soil for 50 % and 70 % WFPS, respectively).
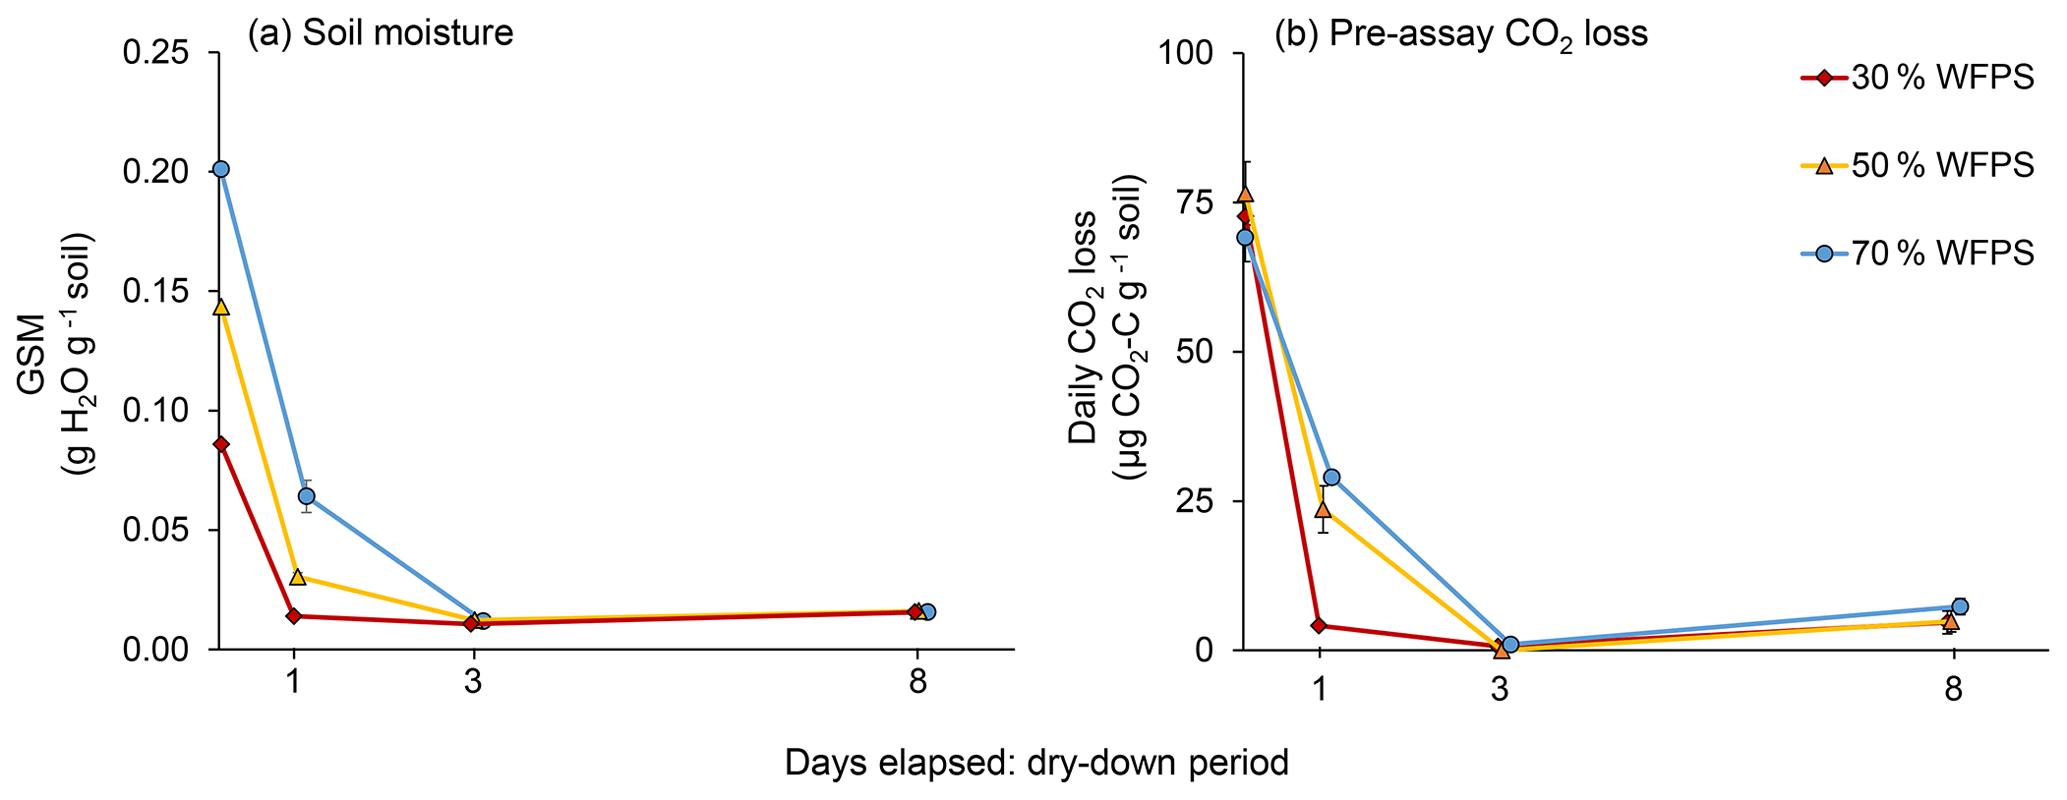
Figure 1(a) Gravimetric soil moisture (GSM) during air-drying and (b) daily CO2 losses from each initial water-filled pore space (WFPS) treatment during the dry-down period. Error bars represent standard errors of the mean.
Initial soil moisture (i.e., WFPS treatment) had a significant effect on 24 h CO2 pulses after re-wetting air-dried soil (P=0.007; Fig. 2). While final CO2 pulses were lower for the 50 % and 70 % WFPS treatments relative to 30 % WFPS (Fig. 2), the 50 % and 70 % WFPS treatments also tended to have greater pre-assay CO2 losses during 3 d of dry-down, which represented 77 % and 95 % of their 24 h CO2 pulses, respectively. After accounting for these losses with correction factors, the 24 h CO2 pulses were similar across initial WFPS treatments (P=0.28; Fig. 3).
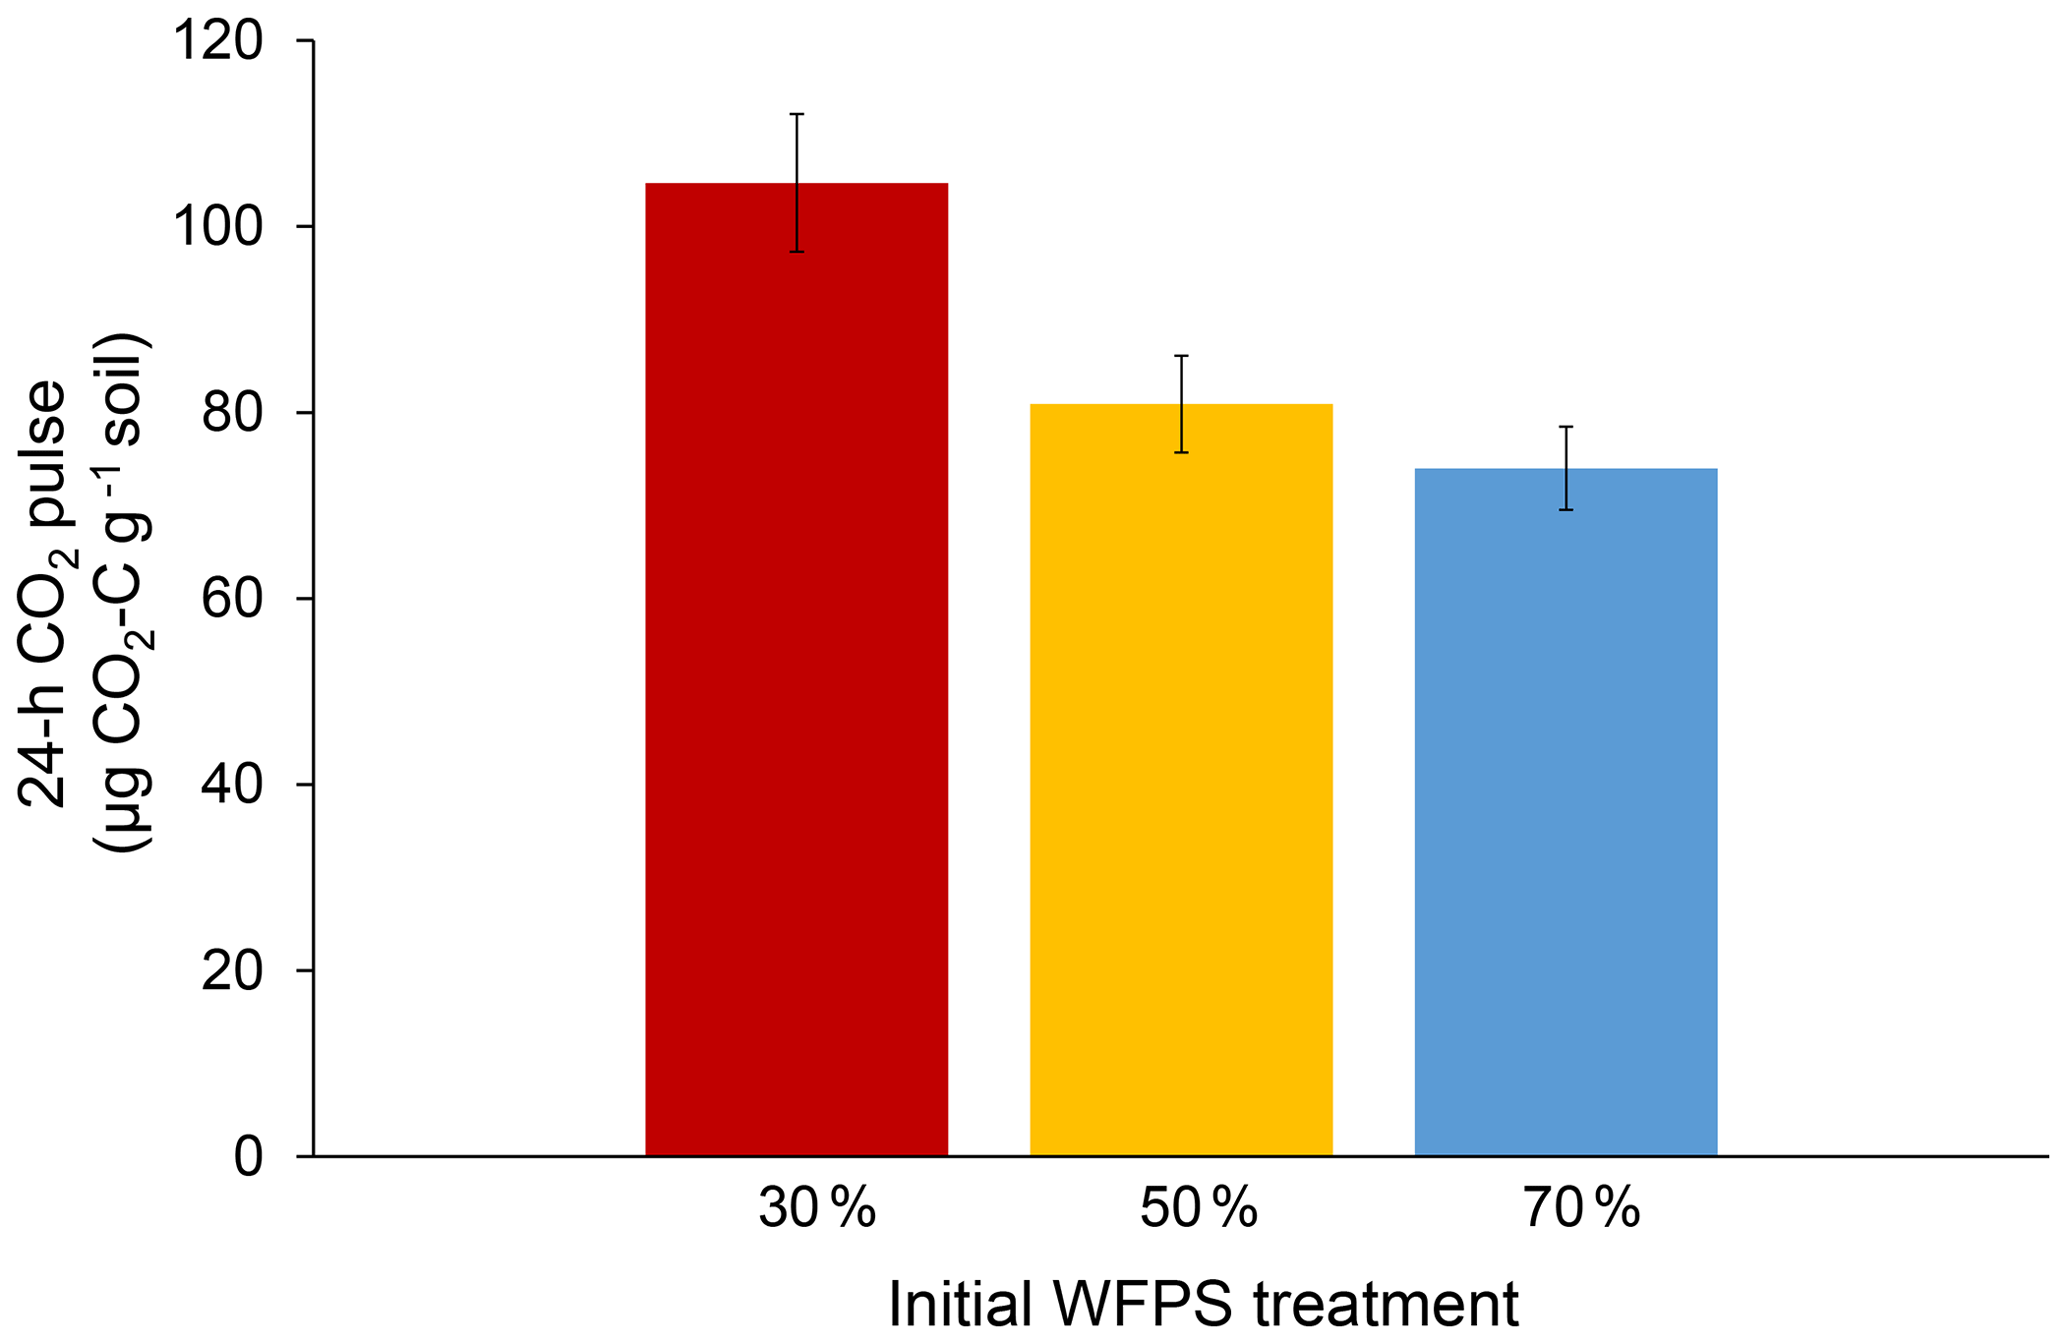
Figure 224 h CO2 pulses after the re-wetting of air-dried soil for each initial WFPS treatment. Error bars represent the standard error of the mean.
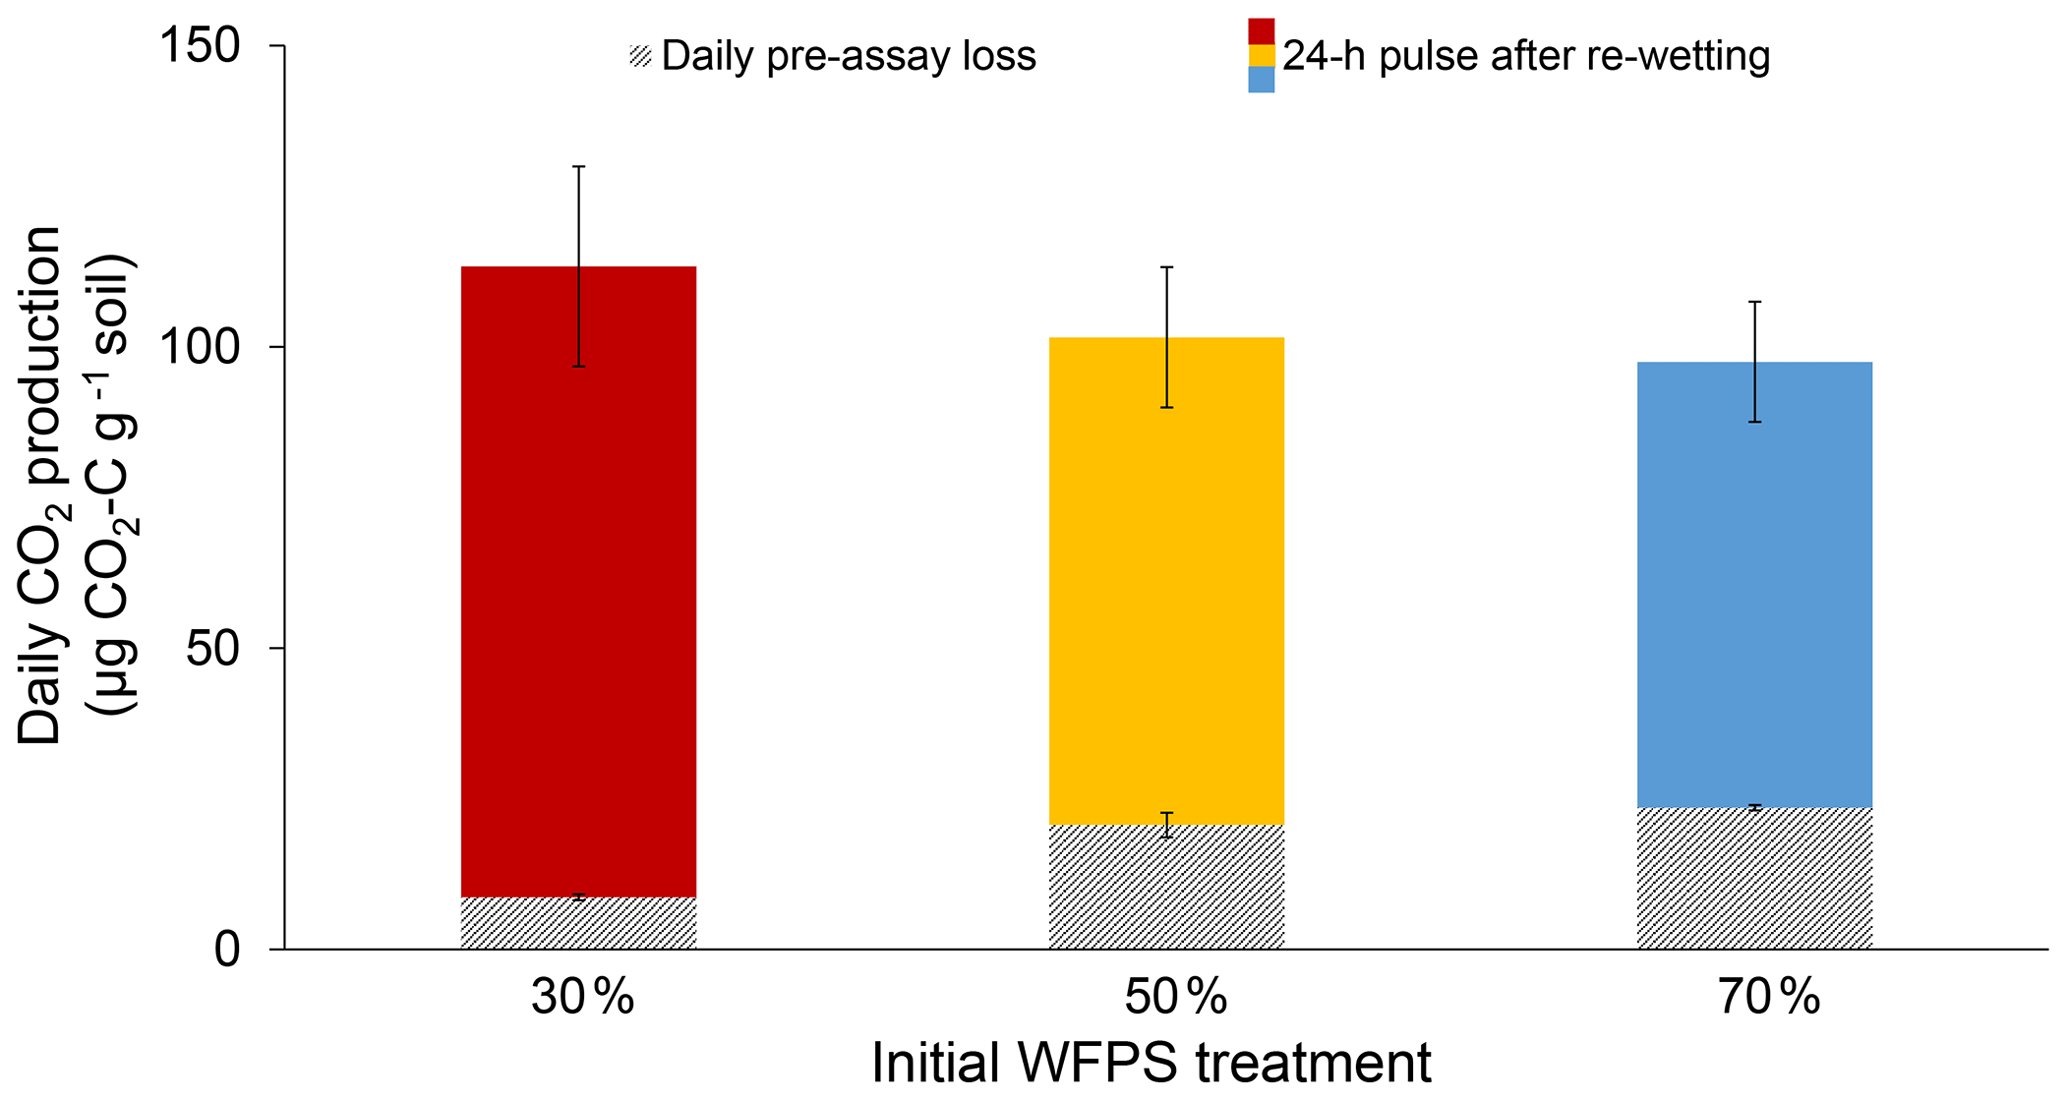
Figure 3Daily CO2 production rates for each initial WFPS treatment. Lined bars represent the average daily rate of pre-assay CO2 loss during a 3 d dry-down period and solid bars represent the 24 h CO2 pulses after re-wetting the air-dried soil. Together both bars represent the 24 h CO2 pulse corrected for pre-assay losses of CO2 during dry-down. Error bars represent standard deviation, which was calculated based on bootstrap error propagation for the daily pre-assay losses.
Initial soil moisture levels significantly affected the results of the conventional 24 h CO2 pulse assay, thus calling into question its reliability as a soil health indicator (Fig. 2). Wetter soil lost more C during dry-down, presumably because soil microbes remained active for a longer period of time. Without knowledge of pre-assay CO2 losses, one might erroneously conclude that soil from the 30 % WFPS treatment had about a 35 % greater CO2 pulse than the others (Fig. 2), but this trend is instead due to higher pre-assay CO2 losses during the dry-down period for wetter soil (Fig. 3). It is striking that even short drying intervals (i.e., 1 versus 3 d) can affect soil health interpretations as deduced from the 24 h CO2 pulse after re-wetting air-dried soil. However, we were able to account for the pre-assay CO2 losses for our soil with a correction factor that made 24 h CO2 pulses approximately equivalent across all initial WFPS treatments. It is unlikely that any mechanism other than dry-down loss in wetter soil is responsible for the treatment differences we observed. First, soil samples were treated identically except for initial water content. Were potential mechanisms behind the Birch effect responsible, wetter soils should have released higher CO2 pulses upon re-wetting due to greater microbial activity (e.g., Linn and Doran, 1984), more microbial biomass (e.g., Franzluebbers, 1999), or a greater release of osmolytes due to the increased risk of lysis. However, the 30 % WFPS treatment had the largest CO2 pulse upon re-wetting (Fig. 2), so dry-down loss in wetter soils is the most plausible explanation (Fig. 1).
These trends suggest that efforts to characterize soil health via short-term CO2 pulses following the re-wetting of dry soil should exercise caution if comparisons involve soils with a range of initial soil moistures. This includes soils compared across seasons; across drought, precipitation, or irrigation gradients; across landscape catenas; across crop, grazing, or forest management practices; and as well in cross-site comparisons and meta-analyses that include soils collected at different initial soil moistures.
A correction factor that accounts for pre-assay CO2 losses may help to normalize such comparisons. In our soil, pre-assay CO2 losses led to a C mineralization bias as high as 32 %, for which we could confidently correct by applying a correction factor based on measured rates of pre-assay CO2 loss (Eq. 3). However, we acknowledge that our use of a correction factor is not intended to imply that there is a fixed, available C pool, but rather to demonstrate the way antecedent moisture conditions can affect soil health tests and to offer a potential solution. Other soils with moisture contents sufficient for microbes to oxidize available C during dry-down will require different correction factors as the C quality and microbial communities could change by soil type as well as within and across seasons (Groffman et al., 1996; Wuest, 2014). A soil-specific correction factor can be calculated by measuring CO2 loss during dry-down on a subset of samples, as we described above (Eq. 3).
An alternate solution is to minimize the dry-down period such that little C is lost prior to the assay. Strategies to minimize pre-assay CO2 loss include exposing soils to temperatures high enough to speed evaporation but low enough to avoid sterilization (Jager, 1968) or otherwise artificially disrupt the microbial community (Evans and Wallenstein, 2012). This could be performed in a closed vented chamber such as a soil incubator. Alternatively, faster and more even drying might be achieved with a steady flow of air (i.e., a fan or vented system) over exposed soil samples.
Overall, our results demonstrate that using the 24 h CO2 pulse following the re-wetting of a dried soil to evaluate soil health can be misleading for soils with different moisture contents at time of sampling. For such soils, rapid drying methods and/or a correction factor based on pre-assay CO2 losses should be considered.
Data are publicly available at Dryad: https://doi.org/10.5061/dryad.fj6q573rf (Vizza et al., 2021).
CV and GPR designed this study, MAB and CV performed the laboratory assays, MAB analyzed the CO2 samples, CV conducted the statistical analyses, SSR and GPR obtained funding, and MAB and CV wrote the paper with contributions from SSR and GPR.
The authors declare that they have no conflict of interest.
We acknowledge the Roley lab group at WSU and the Robertson lab group at KBS for their helpful comments, especially Sven Bohm, whose questions inspired us to undertake this study. We also thank Stuart Jones for his advice about bootstrapping. We thank two anonymous reviewers and editor Jocelyn Lavallee for their valuable feedback on how to improve this paper. Support for this research was provided by the National Science Foundation (NSF) Division of Environmental Biology, by the NSF Long-term Ecological Research Program at KBS, by the Great Lakes Bioenergy Research Center, US Department of Energy Office of Science, Office of Biological and Environmental Research, and by Michigan State University AgBioResearch.
This research has been supported by the National Science Foundation Division of Environmental Biology (grant nos. DEB 1754212 and DEB 1832042) and the US Department of Energy Office of Science, Office of Biological and Environmental Research (grant no. DE-SC0018409).
This paper was edited by Jocelyn Lavallee and reviewed by two anonymous referees.
Barnard, R., Osborne, C., and Firestone, M.: Responses of soil bacterial and fungal communities to extreme desiccation and rewetting, ISME J., 7, 2229–2241, https://doi.org/10.1038/ismej.2013.104, 2013.
Birch, H. F.: The effect of soil drying on humus decomposition and nitrogen availability, Plant Soil, 10, 9–31, https://doi.org/10.1007/BF01343734, 1958.
Blazewicz, S. J., Schwartz, E., and Firestone, M. K.: Growth and death of bacteria and fungi underlie rainfall-induced carbon dioxide pulses from seasonally dried soil, Ecology, 95, 1162–1172, https://doi.org/10.1890/13-1031.1, 2014.
Blazewicz, S. J., Hungate, B. A., Koch, B. J., Nuccio, E. E., Morrissey, E., Brodie, E. L., Schwartz, E., Pett-Ridge, J., and Firestone, M. K: Taxon-specific microbial growth and mortality patterns reveal distinct temporal population responses to rewetting in a California grassland soil, ISME J., 14, 1520–1532, https://doi.org/10.1038/s41396-020-0617-3, 2020.
Borken, W. and Matzner, E.: Reappraisal of drying and wetting effects on C and N mineralization and fluxes in soils, Glob. Change Biol., 15, 808–824, https://doi.org/10.1111/j.1365-2486.2008.01681.x, 2009.
Crum, J. R. and Collins, H. P.: Soils of the Kellogg Biological Station (KBS), Kellogg Biological Station Long-Term Research Publication, Zenodo, https://doi.org/10.5281/zenodo.2581504, 1995.
Culman, S. W., Snapp, S. S., Green, J. M., and Gentry, L. E.: Short- and long-term labile soil carbon and nitrogen dynamics reflect management and predict corn agronomic performance, Agron. J., 105, 493–502, https://doi.org/10.2134/agronj2012.0382, 2013.
Denef, K., Six, J., Bossuyt, H., Frey, S. D., Elliott, E. T., Merckx, R., and Paustian, K.: Influence of dry–wet cycles on the interrelationship between aggregate, particulate organic matter, and microbial community dynamics, Soil Biol. Biochem., 33, 1599–1611, https://doi.org/10.1016/S0038-0717(01)00076-1, 2001.
Elliott, E. T., Heil, J. W., Kelly, E. F., and Monger, H. C.: Soil structure and other physical properties, in: Standard Soil Methods for Long-Term Ecological Research, edited by: Robertson, G. P., Coleman, D., Bledsoe, C., Sollins, P., Oxford University Press, Inc., New York, NY, USA, 77, 1999.
Evans, S. E. and Wallenstein, M. D.: Soil microbial community response to drying and rewetting stress: does historical precipitation regime matter?, Biogeochemistry, 109, 101–116, https://doi.org/10.1007/s10533-011-9638-3, 2012.
Franzluebbers, A. J.: Microbial activity in response to water-filled pore space of variably eroded southern Piedmont soils, Appl. Soil Ecol., 11, 91–101, https://doi.org/10.1016/S0929-1393(98)00128-0, 1999.
Franzluebbers, A. J., Haney, R. L., Honeycutt, C. W., Schomberg, H. H., and Hons, F. M.: Flush of carbon dioxide following rewetting of dried soil relates to active organic pools, Soil Sci. Soc. Am. J., 64, 613–623, https://doi.org/10.2136/sssaj2000.642613x, 2000.
Grandy, A. S. and Robertson, G. P.: Aggregation and organic matter protection following tillage of a previously uncultivated soil, Soil Sci. Soc. Am. J., 70, 1398–1406, https://doi.org/10.2136/sssaj2005.0313, 2006.
Groffman, P. M., Eagan, P., Sullivan, W. M., and Lemunyon, J. L.: Grass species and soil type effects on microbial biomass and activity, Plant Soil, 183, 61–67, https://doi.org/10.1007/BF02185565, 1996.
Hesterberg, T. C.: What teachers should know about the bootstrap: resampling in the undergraduate statistics curriculum, Amer. Statist., 69, 371–386, https://doi.org/10.1080/00031305.2015.1089789, 2015.
Homyak, P. M., Blankinship, J. C., Slessarev, E. W., Schaeffer, S. M., Manzoni, S., and Schimel, J. P.: Effects of altered dry season length and plant inputs on soluble soil carbon, Ecology, 99, 2348–2362, https://doi.org/10.1002/ecy.2473, 2018.
Jarvis, P., Petsikos, C., Wingate, L., Rayment, M., Pereira, J., Banza, J., David, J., Miglietta, F., Borghetti, M., Manca, G., and Valentini, R.: Drying and wetting of Mediterranean soils stimulated decomposition and carbon dioxide emissions: the “Birch effect”, Tree Physiol., 27, 929–940, https://doi.org/10.1093/treephys/27.7.929, 2007.
Jager, G.: The influence of drying and freezing of soil on its organic matter decomposition, Stikstof, 12, 75–88, 1968.
Kim, D.-G., Vargas, R., Bond-Lamberty, B., and Turetsky, M. R.: Effects of soil rewetting and thawing on soil gas fluxes: a review of current literature and suggestions for future research, Biogeosciences, 9, 2459–2483, https://doi.org/10.5194/bg-9-2459-2012, 2012.
Ladoni, M., Basir, A., Robertson, P. G., and Kravchenko, A. N.: Scaling-up: cover crops differentially influence soil carbon in agricultural fields with diverse topography, Agric. Ecosyst. Environ., 225, 93–103, https://doi.org/10.1016/j.agee.2016.03.021, 2016.
Linn, D. M. and Doran, J. W: Effect of water-filled pore space on carbon dioxide and nitrous oxide production in tilled and nontilled soils, Soil Sci. Soc. Am. J., 48, 1267–1272, https://doi.org/10.2136/sssaj1984.03615995004800060013x, 1984.
Luehmann, M. D., Peter, B. G., Connallon, C. B., Schaetzl, R. J., Smidt, S. J., Liu, W., Kincare, K. A., Walkowiak, T. A., Thorlund, E., and Holler, M. S.: Loamy, two-storied soils on the outwash plains of southwestern lower Michigan: pedoturbation of loess with the underlying sand, Ann. Am. Assoc. Geograph., 106, 551–572, https://doi.org/10.1080/00045608.2015.1115388, 2016.
Morrow, J. G., Huggins, D. R., Carpenter-Boggs, L. A., and Reganold, J. P.: Evaluating measures to assess soil health in long-term agroecosystem trials, Soil Sci. Soc. Am. J., 80, 450–462, https://doi.org/10.2136/sssaj2015.08.0308, 2016.
Robertson, G. P.: Soil carbon and nitrogen deep core surveys at the Kellogg Biological Station, Hickory Corners, MI (2001 to 2013) ver. 23, Environmental Data Initiative, https://doi.org/10.6073/pasta/8c9f759d32699902d88c7b5d607fb2f7, 2016.
Robertson, G. P. and Hamilton, S. K.: The ecology of agriculture landscapes: long-term research on the path to sustainability, in: Long-Term Ecological Research at the Kellogg Biological Station LTER Site, edited by: Robertson, G. P., Hamilton, S. K., Oxford University Press, Inc., New York, NY, USA, 1–32, 2015.
Robertson, G. P., Crum, J. R., and Ellis, B. G.: The spatial variability of soil resources following long-term disturbance, Oecologia, 96, 451–456, https://doi.org/10.1007/BF00320501, 1993.
Robertson, G. P., Wedin, D. A., Groffman, P. M., Blair, J. M., and Holland, E. A.: Soil carbon and nitrogen availability: nitrogen mineralization, nitrification, and soil respiration, in: Standard Soil Methods for Long-Term Ecological Research, edited by: Robertson, G. P., Coleman, D., Bledsoe, C., Sollins, P., Oxford University Press, Inc., New York, NY, USA, 258–271, 1999.
Schimel, J., Balser, T. C., and Wallenstein, M.: Microbial stress-response physiology and its implications for ecosystem function, Ecology, 88, 1386–1394, https://doi.org/10.1890/06-0219, 2007.
Slessarev, E.W., Lin, Y., Jiménez, B.Y., Homyak, P.M., Chadwick, O.A., D'Antonio, C.M., and Schimel, J.P.: Cellular and extracellular C contributions to respiration after wetting dry soil, Biogeochemistry, 147, 307–324, https://doi.org/10.1007/s10533-020-00645-y, 2020.
Sprunger, C. D. and Robertson, G. P.: Early accumulation of active fraction soil carbon in newly established cellulosic biofuel systems, Geoderma, 318, 42–51, https://doi.org/10.1016/j.geoderma.2017.11.040, 2018.
Vizza, C., Belanger, M., Robertson, G. P., and Roley, S.: Quantifying and correcting for pre-assay CO2 loss in short-term carbon mineralization assays, Dryad, Dataset, https://doi.org/10.5061/dryad.fj6q573rf, 2021.
Warren, C. R.: Pools and fluxes of osmolytes in moist soil and dry soil that has been re-wet, Soil Biol. Biochem., 150, 108012, https://doi.org/10.1016/j.soilbio.2020.108012, 2020.
Wuest, S.: Seasonal variation in soil organic carbon, Soil Sci. Soc. Am. J., 78, 1442–1447, https://doi.org/10.2136/sssaj2013.10.0447, 2014.