the Creative Commons Attribution 4.0 License.
the Creative Commons Attribution 4.0 License.
 | 18 Jun 2021
Improved calibration of the Green–Ampt infiltration module in the EROSION-2D/3D model using a rainfall-runoff experiment database
Hana Beitlerová
Jonas Lenz
Jan Devátý
Martin Mistr
Jiří Kapička
Arno Buchholz
Ilona Gerndtová
Anne Routschek
Soil infiltration is one of the key factors that has an influence on soil erosion caused by rainfall. Therefore, a well-represented infiltration process is a necessary precondition for successful soil erosion modelling. Complex natural conditions do not allow the full mathematical description of the infiltration process, and additional calibration parameters are required. The Green–Ampt-based infiltration module in the EROSION-2D/3D model introduces a calibration parameter “skinfactor” to adjust saturated hydraulic conductivity. Previous studies provide skinfactor values for several combinations of soil and vegetation conditions. However, their accuracies are questionable, and estimating the skinfactors for other than the measured conditions yields significant uncertainties in the model results. This study brings together an extensive database of rainfall simulation experiments, the state-of-the-art model parametrisation method and linear mixed-effect models to statistically analyse relationships between soil and vegetation conditions and the model calibration parameter skinfactor. New empirically based transfer functions for skinfactor estimation significantly improving the accuracy of the infiltration module and thus the overall EROSION-2D/3D model performance are provided in this study. Soil moisture and bulk density were identified as the most significant predictors explaining 82 % of the skinfactor variability, followed by the soil texture, vegetation cover and impact of previous rainfall events. The median absolute percentage error of the skinfactor prediction was improved from 71 % using the currently available method to 30 %–34 % using the presented transfer functions, which led to significant decrease in error propagation into the model results compared to the present method. The strong logarithmic relationship observed between the calibration parameter and soil moisture however indicates high overestimation of infiltration for dry soils by the algorithms implemented in EROSION-2D/3D and puts the state-of-the-art parametrisation method in question. An alternative parameter optimisation method including calibration of two Green–Ampt parameters' saturated hydraulic conductivity and water potential at the wetting front was tested and compared with the state-of-the-art method, which paves a new direction for future EROSION-2D/3D model parametrisation.
- Article
(1557 KB) - Full-text XML
-
Supplement
(184 KB) - BibTeX
- EndNote


Soil erosion modelling is a common and efficient approach to analyse and understand the soil erosion process and propose solutions to minimise its impact. Therefore, development and improvement of soil erosion modelling tools are of crucial interest among soil scientists, state land offices, or landscape architects. EROSION-2D and EROSION-3D are soil erosion modelling tools based on the same physical descriptions of soil erosion processes on hillslopes (2D) or in catchment areas (3D) for single rainfall events. In this paper EROSION-2D/3D shall refer to both versions, where shared algorithms are discussed. These tools are able to predict erosion patterns, as well as deposition areas, on agricultural fields, infrastructure, and settlement areas (von Werner, 2007). The physically based algorithms allow us to apply EROSION-2D/3D under various circumstances, from long-term simulations, covering catchments of several square kilometres (Routschek et al., 2014), to short-term reconstructive simulations of small catchments (Hänsel et al., 2019).
EROSION-2D/3D includes two submodules. The first submodule is an infiltration module used to calculate infiltration rates over time. The second submodule uses the infiltration rates to calculate excess water, surface runoff, and detachment, as well as the transport and deposition of particles. The infiltration submodule is based on the Green–Ampt approach (Schmidt, 1996). This approach assumes a rigid, homogeneous, and permanent submerged soil column. Such conditions are rarely met in nature, and the model parameters usually require calibration to compensate for this simplification. The infiltration submodule in EROSION-2D/3D requires input parameters that can be measured or predicted with common methods (i.e. bulk density, initial soil moisture, grain size distribution, and organic bound carbon) and the “skinfactor” calibration parameter, which scales saturated hydraulic conductivity. The skinfactor can be determined from rainfall-runoff experiments with the hillslope simulation tool EROSION-2D (Michael et al., 1996). As EROSION-2D can only be parameterised manually in a graphical user interface, this process required extended time to iteratively change skinfactor values, limiting the skinfactor determination to a relatively small number of combinations of soil and vegetation conditions.
Previous studies have focused on estimating skinfactors for those other than measured conditions. The studies are based on 116 rainfall experiments conducted in Saxony (Germany) between 1992 and 1995, which are published in the EROSION-3D Catalogue of Input Parameters (Parameter Catalogue) (Michael et al., 1996). Michael et al. (1996) and von Werner (2009) estimated the skinfactors using information on German KA5 soil textural classes (Ad-hoc-Arbeitsgruppe Boden, 2005), initial soil saturation (dry or wet conditions), plant development stages, management practices, and field conditions. All of the predictors were categorical variables. The resulting matrix of skinfactor values provides guidance for a limited number of vegetation and soil condition combinations, which is available in the Parameter Catalogue for model users. However, the statistical background of the matrix and the selection of the predictors were not published and are not traceable. For other conditions, users must estimate values by themselves from the limited and incomplete matrix. Another approach (Michael, 2000; Schlegel, 2012) was to predict skinfactors from the numeric soil input parameters of the infiltration module (i.e. clay, silt, sand, organic carbon, bulk density, and soil moisture). Both studies used regression models to analyse the strongest predictors for different groups of experiments according to the soil types, management practices, and moisture conditions. The entire dataset shows the strongest correlation between the skinfactor and the bulk density, soil moisture, and silt content but with a low statistical significance and small correlation coefficient. Analysis of specific groups of experiments (e.g. sandy soils and conservational management practices) exhibits better results but is based on an insufficient number of experiments.
For this study, an R package, toolbox.e3d, was developed to enable automatic and batch determination of the skinfactors for multiple rainfall-runoff infiltration experiments. An extensive rainfall-runoff experiment database was processed by the package, creating a sufficient amount of data to statistically analyse the relationships between the skinfactor and other parameters describing the soil and vegetation conditions of the experiments. The aim of this study is to improve the performance of EROSION-2D/3D by providing easy-to-use transfer functions to calibrate the infiltration module of the model.
2.1 Infiltration module
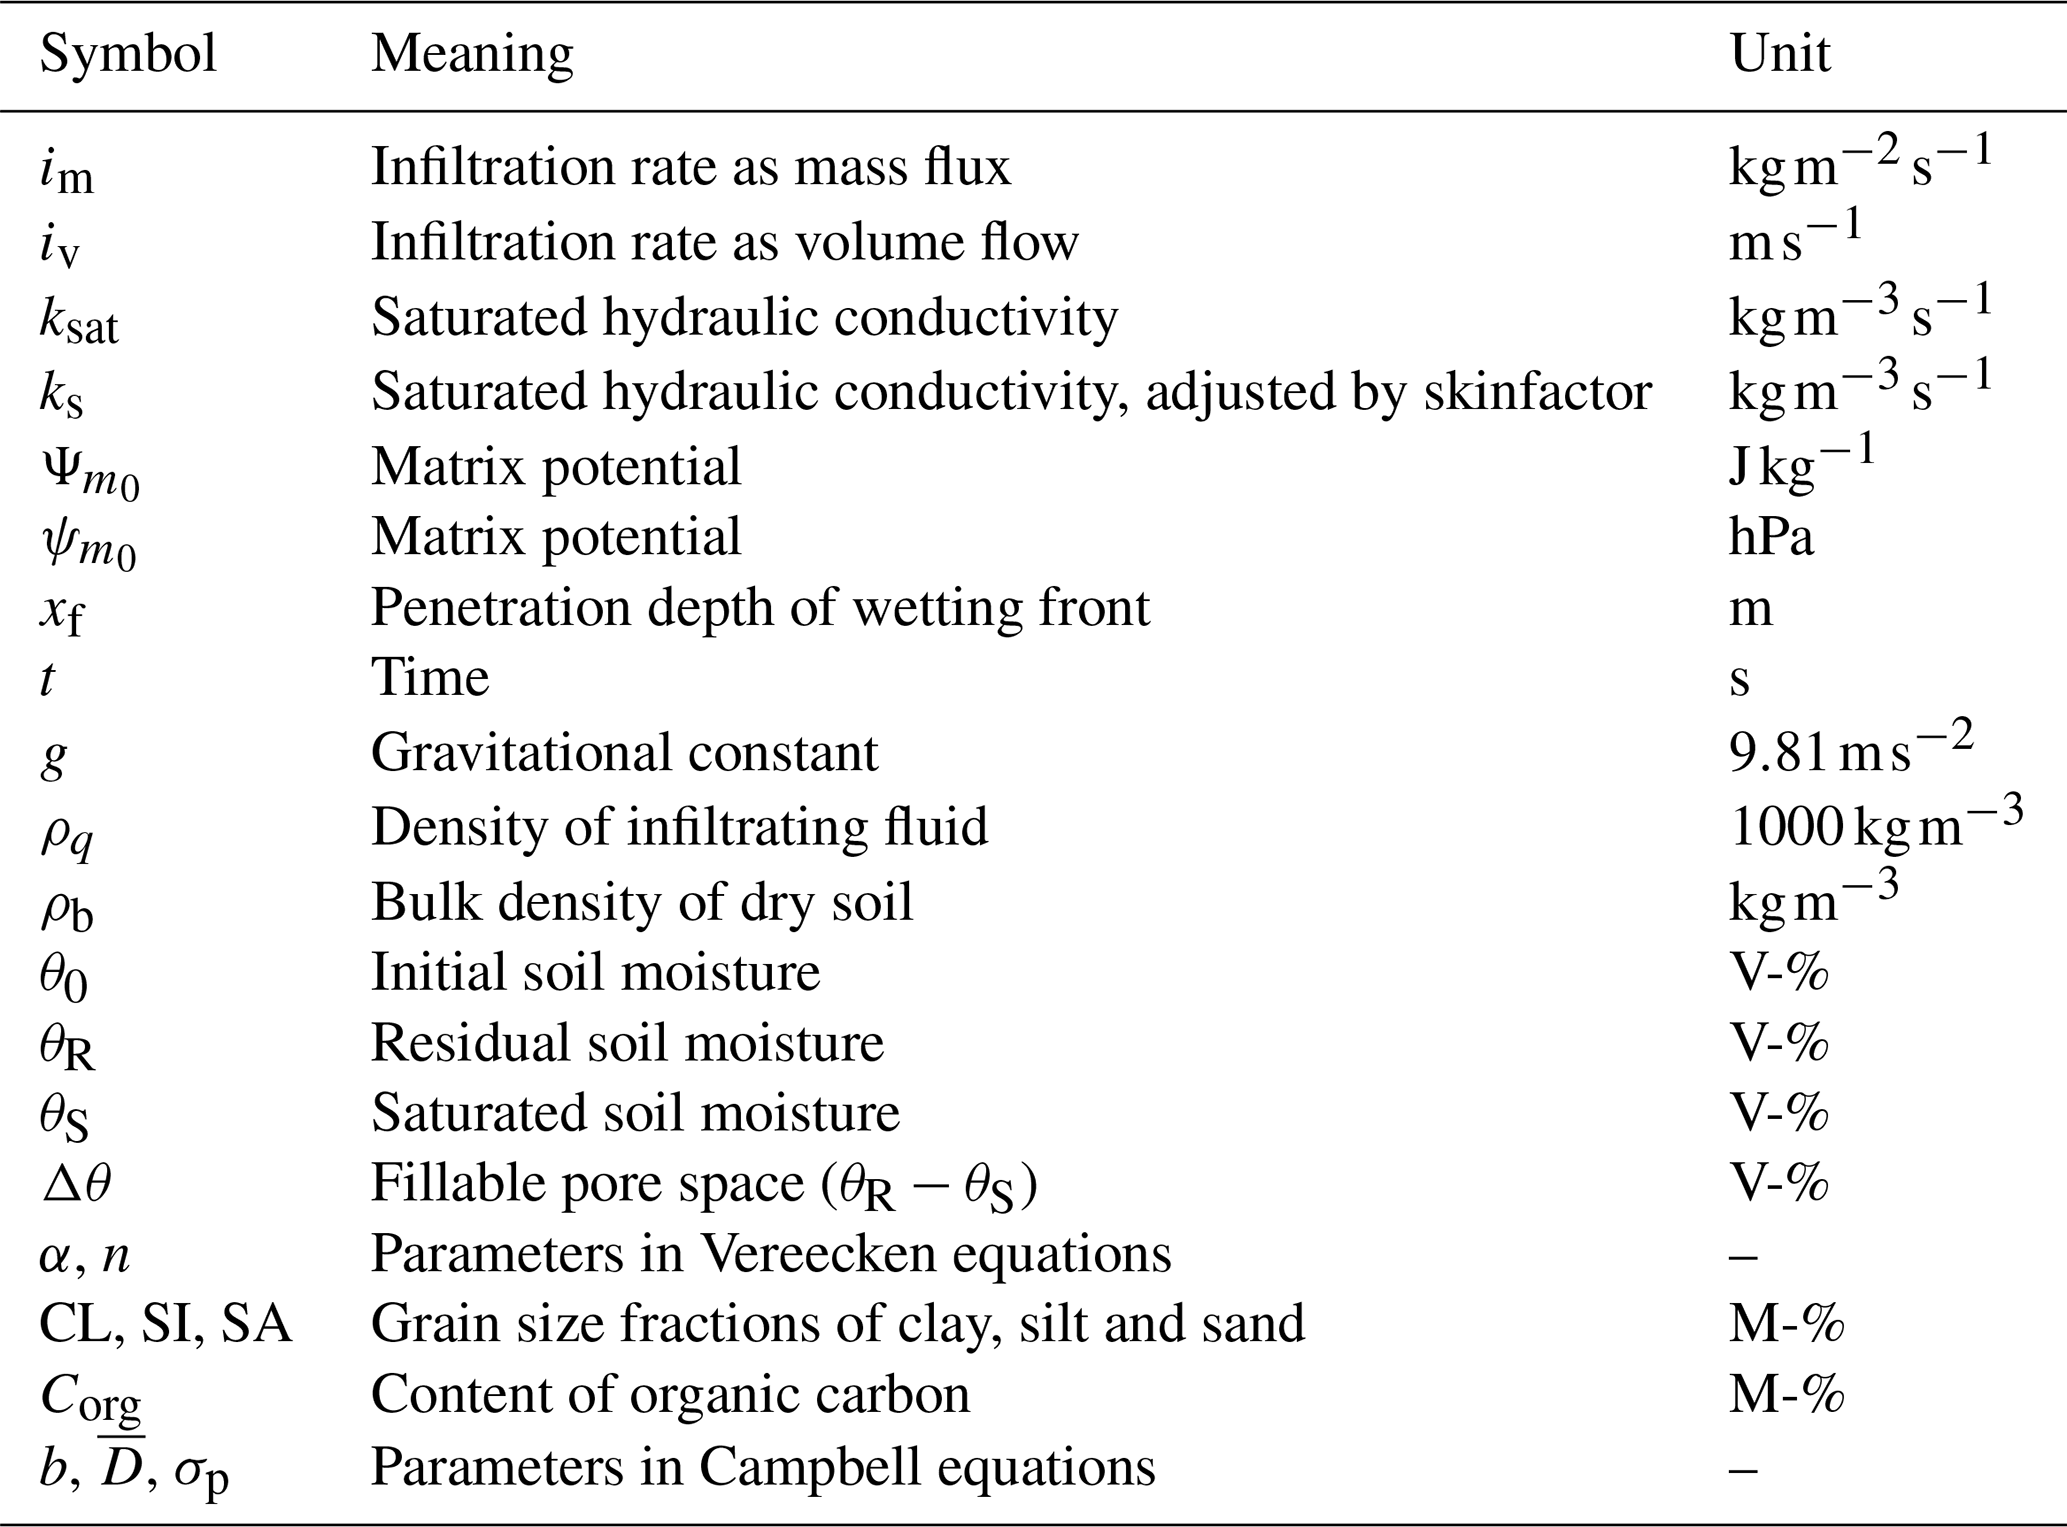
The infiltration model used in EROSION-2D/3D was developed by Schmidt (1996) based on the Green–Ampt infiltration approach (Green and Ampt, 1911). The following equations are all quoted from Schmidt (1996) unless otherwise indicated. Table 1 explains symbols used in these equations.
The infiltration rate is a function of the wetting front penetration depth and is calculated as mass flux by
This value can be divided by the density of infiltrating fluid to obtain infiltration rate as volume flow rate.
The penetration depth of the wetting front is the integral function of the infiltration rate divided by the fillable pore space. An approximation of this integral function is used in EROSION-2D/3D:
Schmidt (1996) divided the wetting front into two independent fractions to derive Eq. (3). A stationary fraction is driven by gravitational forces and is independent of time, whereas an instationary fraction is driven by matrix potential and is reduced with progression of the wetting front over time.
Parameters matrix potential and fillable pore space in Eq. (3) are determined from soil input parameters grain size distribution, bulk density, organic carbon content and initial water content using an estimation model by Van Genuchten (1980) in combination with pedotransfer functions by Vereecken et al. (1989).
Because Eqs. (3) and (4) use different units for matrix potential, a conversion is applied:
According to Schindewolf and Schmidt (2012) the parameters α and n were determined in model versions prior 3.14 of EROSION-2D by
In case the input value of soil moisture θ0 is higher θS or lower θR, this value gets adjusted by EROSION-2D/3D to be slightly higher than θR or slightly lower than θS.
The equations used for estimation of saturated hydraulic conductivity are the following (compare Campbell, 1985).
2.2 Skinfactor
Skinfactor in EROSION-2D/3D is a calibration factor to the saturated hydraulic conductivity calculated by Eq. (13).
Two methods of deriving the skinfactors from rainfall-runoff experiments were established in previous studies, both yielding slightly different values, resulting in different surface runoff rates. The first established method uses the skinfactor to adjust the amount of cumulative runoff from the plot area (skinfactorrunoff) (Michael, 2000). The second established method uses the skinfactor to adjust a certain infiltration rate, usually the final infiltration rate at the end of the experiment (skinfactorinf) (Schindewolf and Schmidt, 2012). We used both methods to derive the skinfactors for the analysis. Transfer functions for the skinfactorinf showed a better fit to the validation datasets and are therefore presented in this study. To derive the skinfactor for each experiment, a surface runoff curve is simulated by the EROSION-3D model. Infiltration module input parameters clay, silt, sand content, bulk density, initial soil moisture and organic carbon content measured during the experiment are entered in the model and skinfactor value is iteratively changed, until the end infiltration in the case of skinfactorinf or cumulative runoff in the case of skinfactorrunoff matches the measured data. Figure 1 shows the infiltration curves calculated with EROSION-2D/3D.

Figure 1Modelled infiltration rates resulting from different methods of skinfactor determination. Calculated infiltration rate is limited by rainfall intensity (0.933 mm min−1).
2.3 Rainfall-runoff data
An open database for storing, maintaining, and sharing protocols from rainfall-runoff experiments is being developed in parallel to this study (Devátý et al., 2020). Currently, the database contains protocols from three working groups: the Technical University of Freiberg, Germany (TUBAF), the Research Institute for Soil and Water Conservation, Czech Republic (RISWC), and the Czech Technical University in Prague, Czech Republic (CTU). The database contains 464 experiments (126 from TUBAF, including the original 116 experiments used in previous studies, 191 from RISWC, and 147 from CTU), mainly from the central Czech Republic and the German state of Saxony. Experiments contained in the database were conducted for different projects and purposes. Not all experiments contain all input parameters required for skinfactor calibration, where the methodology of data acquisition and analysis can differ between working groups. The complete and consolidated dataset for statistical analysis contains 273 RISWC and TUBAF experiments. Parameters included in the statistical analysis and respective data acquisition methods used by the working groups are listed in Table 2.
Table 2Parameters included in statistical analysis for skinfactor prediction.
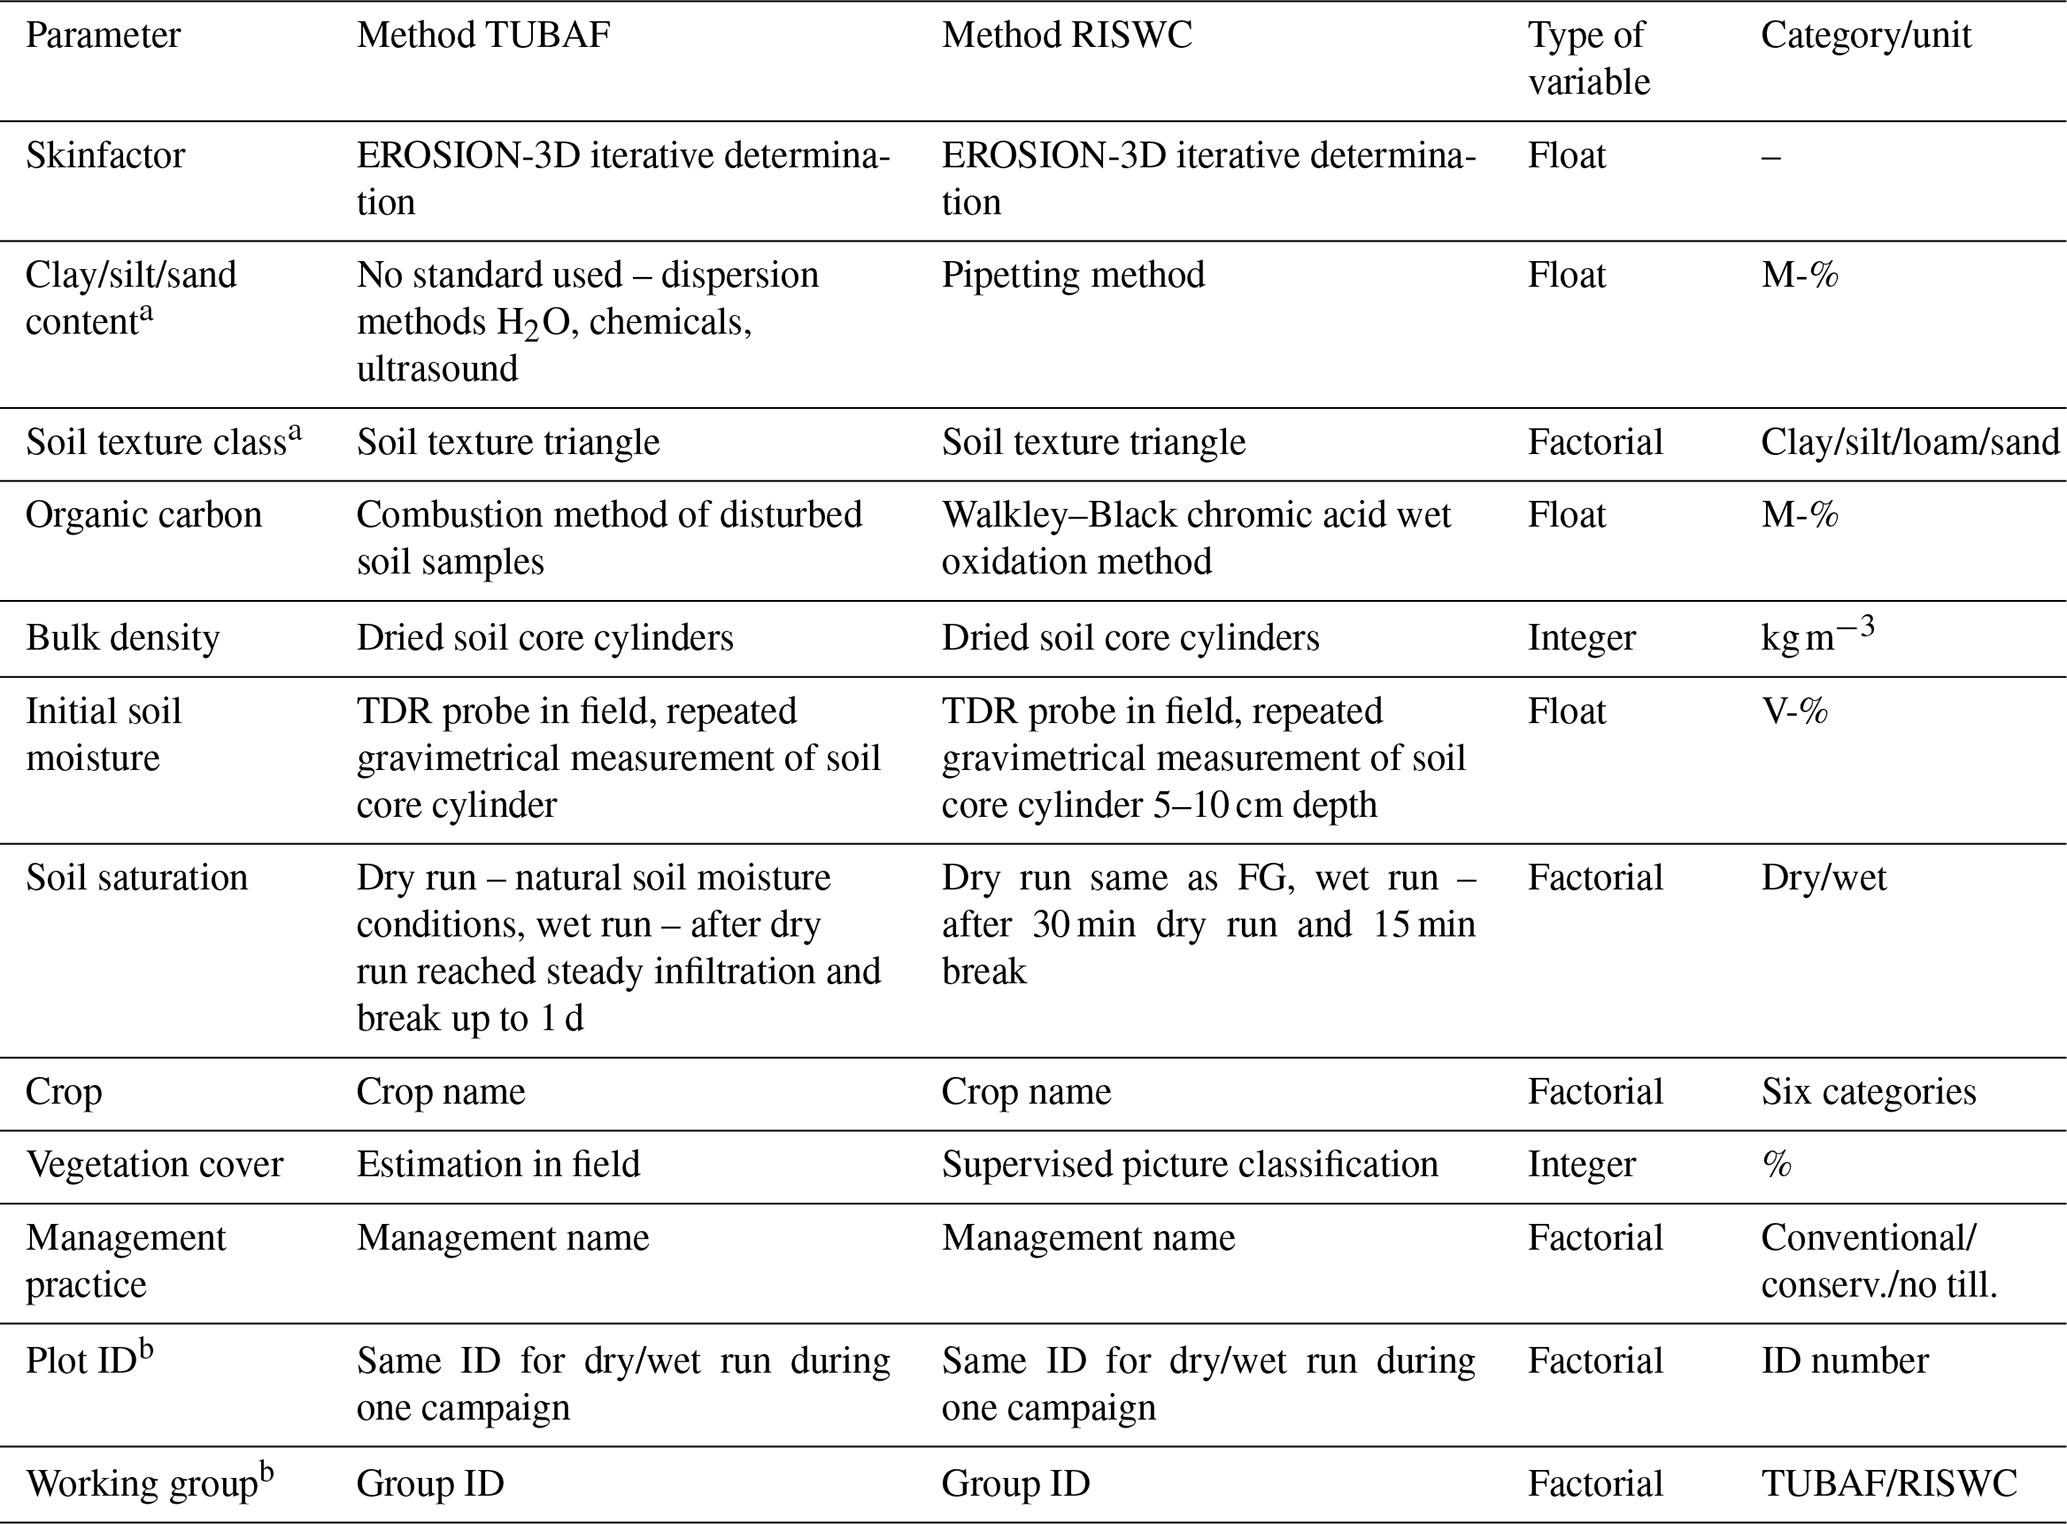
a The German KA5 classification system is used for soil texture (Ad-hoc-Arbeitsgruppe Boden, 2005). b Variables representing random effects in the used linear mixed-effect models.
2.4 Skinfactor prediction
The determined skinfactor values range from 0.001 to 100 in the dataset. The assumption of normally distributed residuals in the linear mixed-effect models used in this study is violated when using untransformed skinfactors. Logarithmic transformation of skinfactors produces a near-normal distribution for the residuals. Therefore, this transformation was used for all skinfactor values in the statistical analysis.
To determine the transfer functions for the skinfactor, linear mixed-effect models (Galecky and Burzykowski, 2013) were applied. All numerical soil input parameters and categorical variables used in previous studies were included in the analysis as fixed effects. Furthermore, two nested random effects were included in the model to account for the interdependency and hierarchy of the data. The first random effect is the working group. Results of the experiments can be affected by the use of a specific rainfall-runoff simulator. The rainfall parameters and methodology for data acquisition differ between the working groups (Table 2). The second random effect is the plot ID, which is nested in the working group. Both working groups usually repeat their measurements twice on an identical plot to obtain data under the dry and wet conditions. Measurements with the same plot ID are thus interdependent.
2.5 Model selection
Various models were fitted using the experimental dataset. Model ORIG, with factorial predictors originally used in the Parameter Catalogue (crop, management practice, dry/wet experiment, soil texture class, plant development), was fitted to statistically evaluate the current skinfactor prediction method available for model users (Michael et al., 1996). The dataset structures used in the Parameter Catalogue and presented in this study are not identical; therefore, the equivalents of the predictors were used to remain as close to the Parameter Catalogue approach as possible (e.g. factorial predictor plant development is not available for RISWC data; therefore, it was substituted by the numerical variable, vegetation cover). STEP1, STEP2 and STRONG represent the models manually selected using the stepwise method from the initial model containing all factorial predictors in the interactions with all numerical predictors. The manually controlled backward elimination approach was followed. Single predictors with the lowest significance were continuously removed from the model while controlling for the significance of the remaining predictors and interactions and the Akaike information criterion (AIC) (Akaike, 1987). STEP1 was the most complex model, whereas STEP2 and STRONG were selected by further elimination of the least significant predictors and interactions from model STEP1 to provide simpler models for EROSION-2D/3D users according to their information on the study area and available predictors. The simplest model, i.e. STRONG, contains only the two most significant predictors.
2.6 Prediction validation
To examine the statistical reliability of the fitted models, a 10-fold cross-validation approach was followed. The experimental dataset was divided into the training subset, containing 90 % of the randomly selected experiments, and the validation subset, containing the remaining 10 % of the experiments. For the training subset coefficients of the functions were determined. The validation subset was then used to predict skinfactors. This procedure was repeated 10 times, ensuring that each experiment was used for validation once. For each repetition model performance was evaluated by commonly used indicators. The overall quality of the transfer functions was calculated as average values of the indicators plus/minus standard deviation. The indicators are coefficient of determination (R2), root mean square error (RMSE), mean and median absolute percent errors (MAPE and MDAPE), and the ratio of the RMSE and the standard deviation of the measured data STDEVobs (RSR). MAPE works best if there are no extremes or zeros in the dataset; MDAPE is independent of those values. According to Moriasi et al. (2007), model performance is satisfactory if RSR < 0.7, good if RSR < 0.6, and very good if RSR < 0.5.
In the second step, an error propagation of the predicted skinfactors for surface runoff and sediment mass was analysed. Soil and vegetation conditions from the experiments were applied on a hypothetical 400 m long and 9 % steep slope. Surface runoff and sediment mass simulated with the experimentally derived skinfactor were compared to those simulated with the skinfactors predicted by the presented models. The results were evaluated by the same indicators as in the first validation step.
The last step of the validation was performed on real data collected on three 40 cm × 50 cm plots equipped with rainfall gauges, runoff trap devices, and soil moisture meters. The experimental site is situated in the central Czech Republic (50∘24.41′ N, 14∘39.31′ E). The plots were placed in a field of oilseed rape, two in the middle of the slope, one in the upper part of the slope. During the 2017 vegetation season, six rainfall events produced runoff. However, runoff was never recorded in all three plots, which shows high variability in the rainfall-runoff processes even within a very small area. The parameters of the events are presented in Table 3. Each rainfall event was modelled by Erosion-3D with the skinfactor predicted by transfer functions STEP1, STEP2 and STRONG; for each function, the skinfactor was corrected by the positive and negative MAPE to account for the uncertainties in the predictions.
Table 3Rainfall events used for the skinfactor validation.
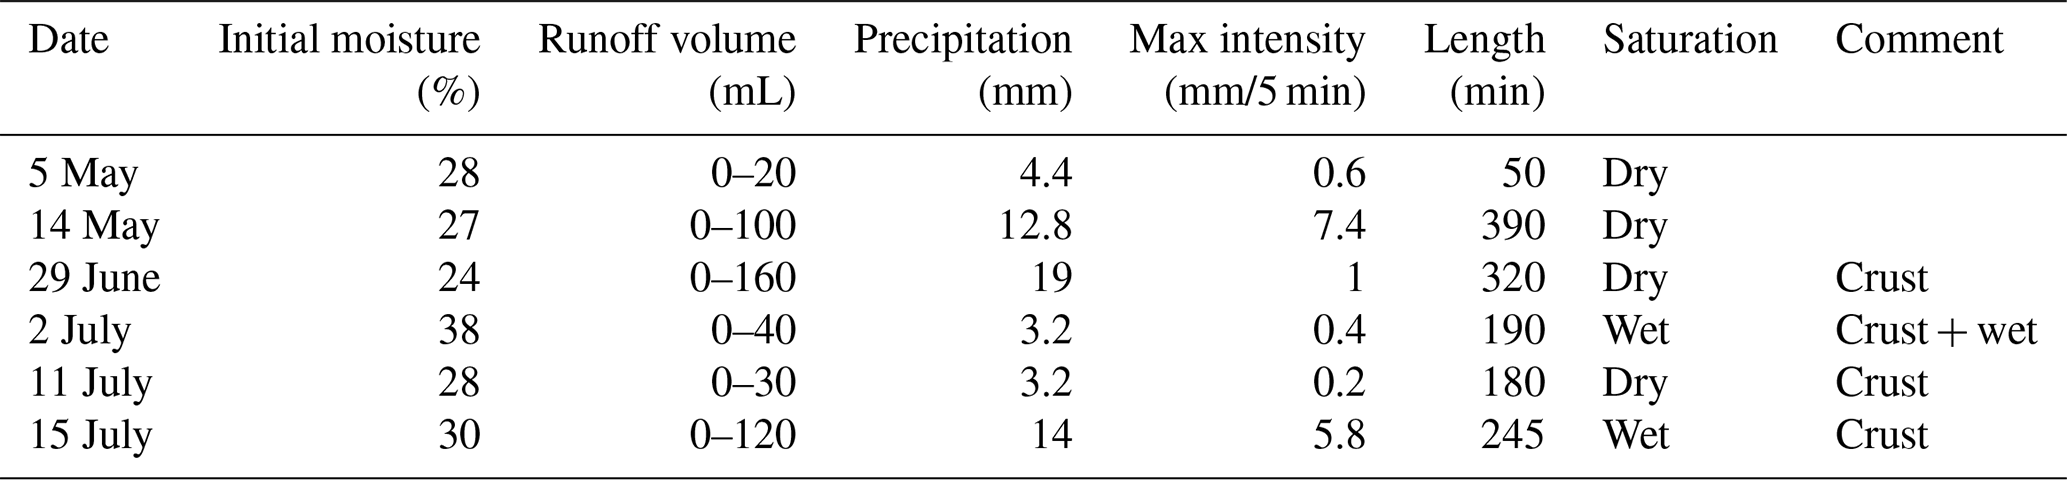
Saturation dry or wet was decided according to antecedent precipitation.
3.1 Skinfactor prediction
Four models were fitted to evaluate the skinfactor estimation method given in the Parameter Catalogue and determine new transfer functions for predicting skinfactors using the most significant predictors (Fig. 2). An overview of the models is presented in Table 4. For each model, predictors and coefficients of the pedotransfer function are provided, together with an evaluation of the model performance based on the validation dataset. The ORIG model, fitted to the predictor equivalents from the Parameter Catalogue, has low explanatory significance (variance explained by fixed effects R2=0.14). Only soil saturation (dry or wet experiment) is a highly significant predictor. The new transfer functions provide significant improvement to the accuracy of skinfactor prediction. Soil moisture and bulk density were determined to be by far the most significant predictors (model STRONG), explaining together 82 % of the skinfactor variability. The skinfactor increased with an increase in both of the predictors (Fig. 3). Other significant predictors, e.g. silt content, vegetation cover, soil texture group, and soil saturation, slightly improved the model fit. The most complex STEP1 model containing all of the significant predictors, including the interactions (see Table 4), explains only an additional 3 % of the skinfactor variability. STEP2 was simplified by removing factorial predictor soil texture class, numerical predictor vegetation cover and all interactions from STEP1. STRONG contains only initial soil moisture and bulk density.
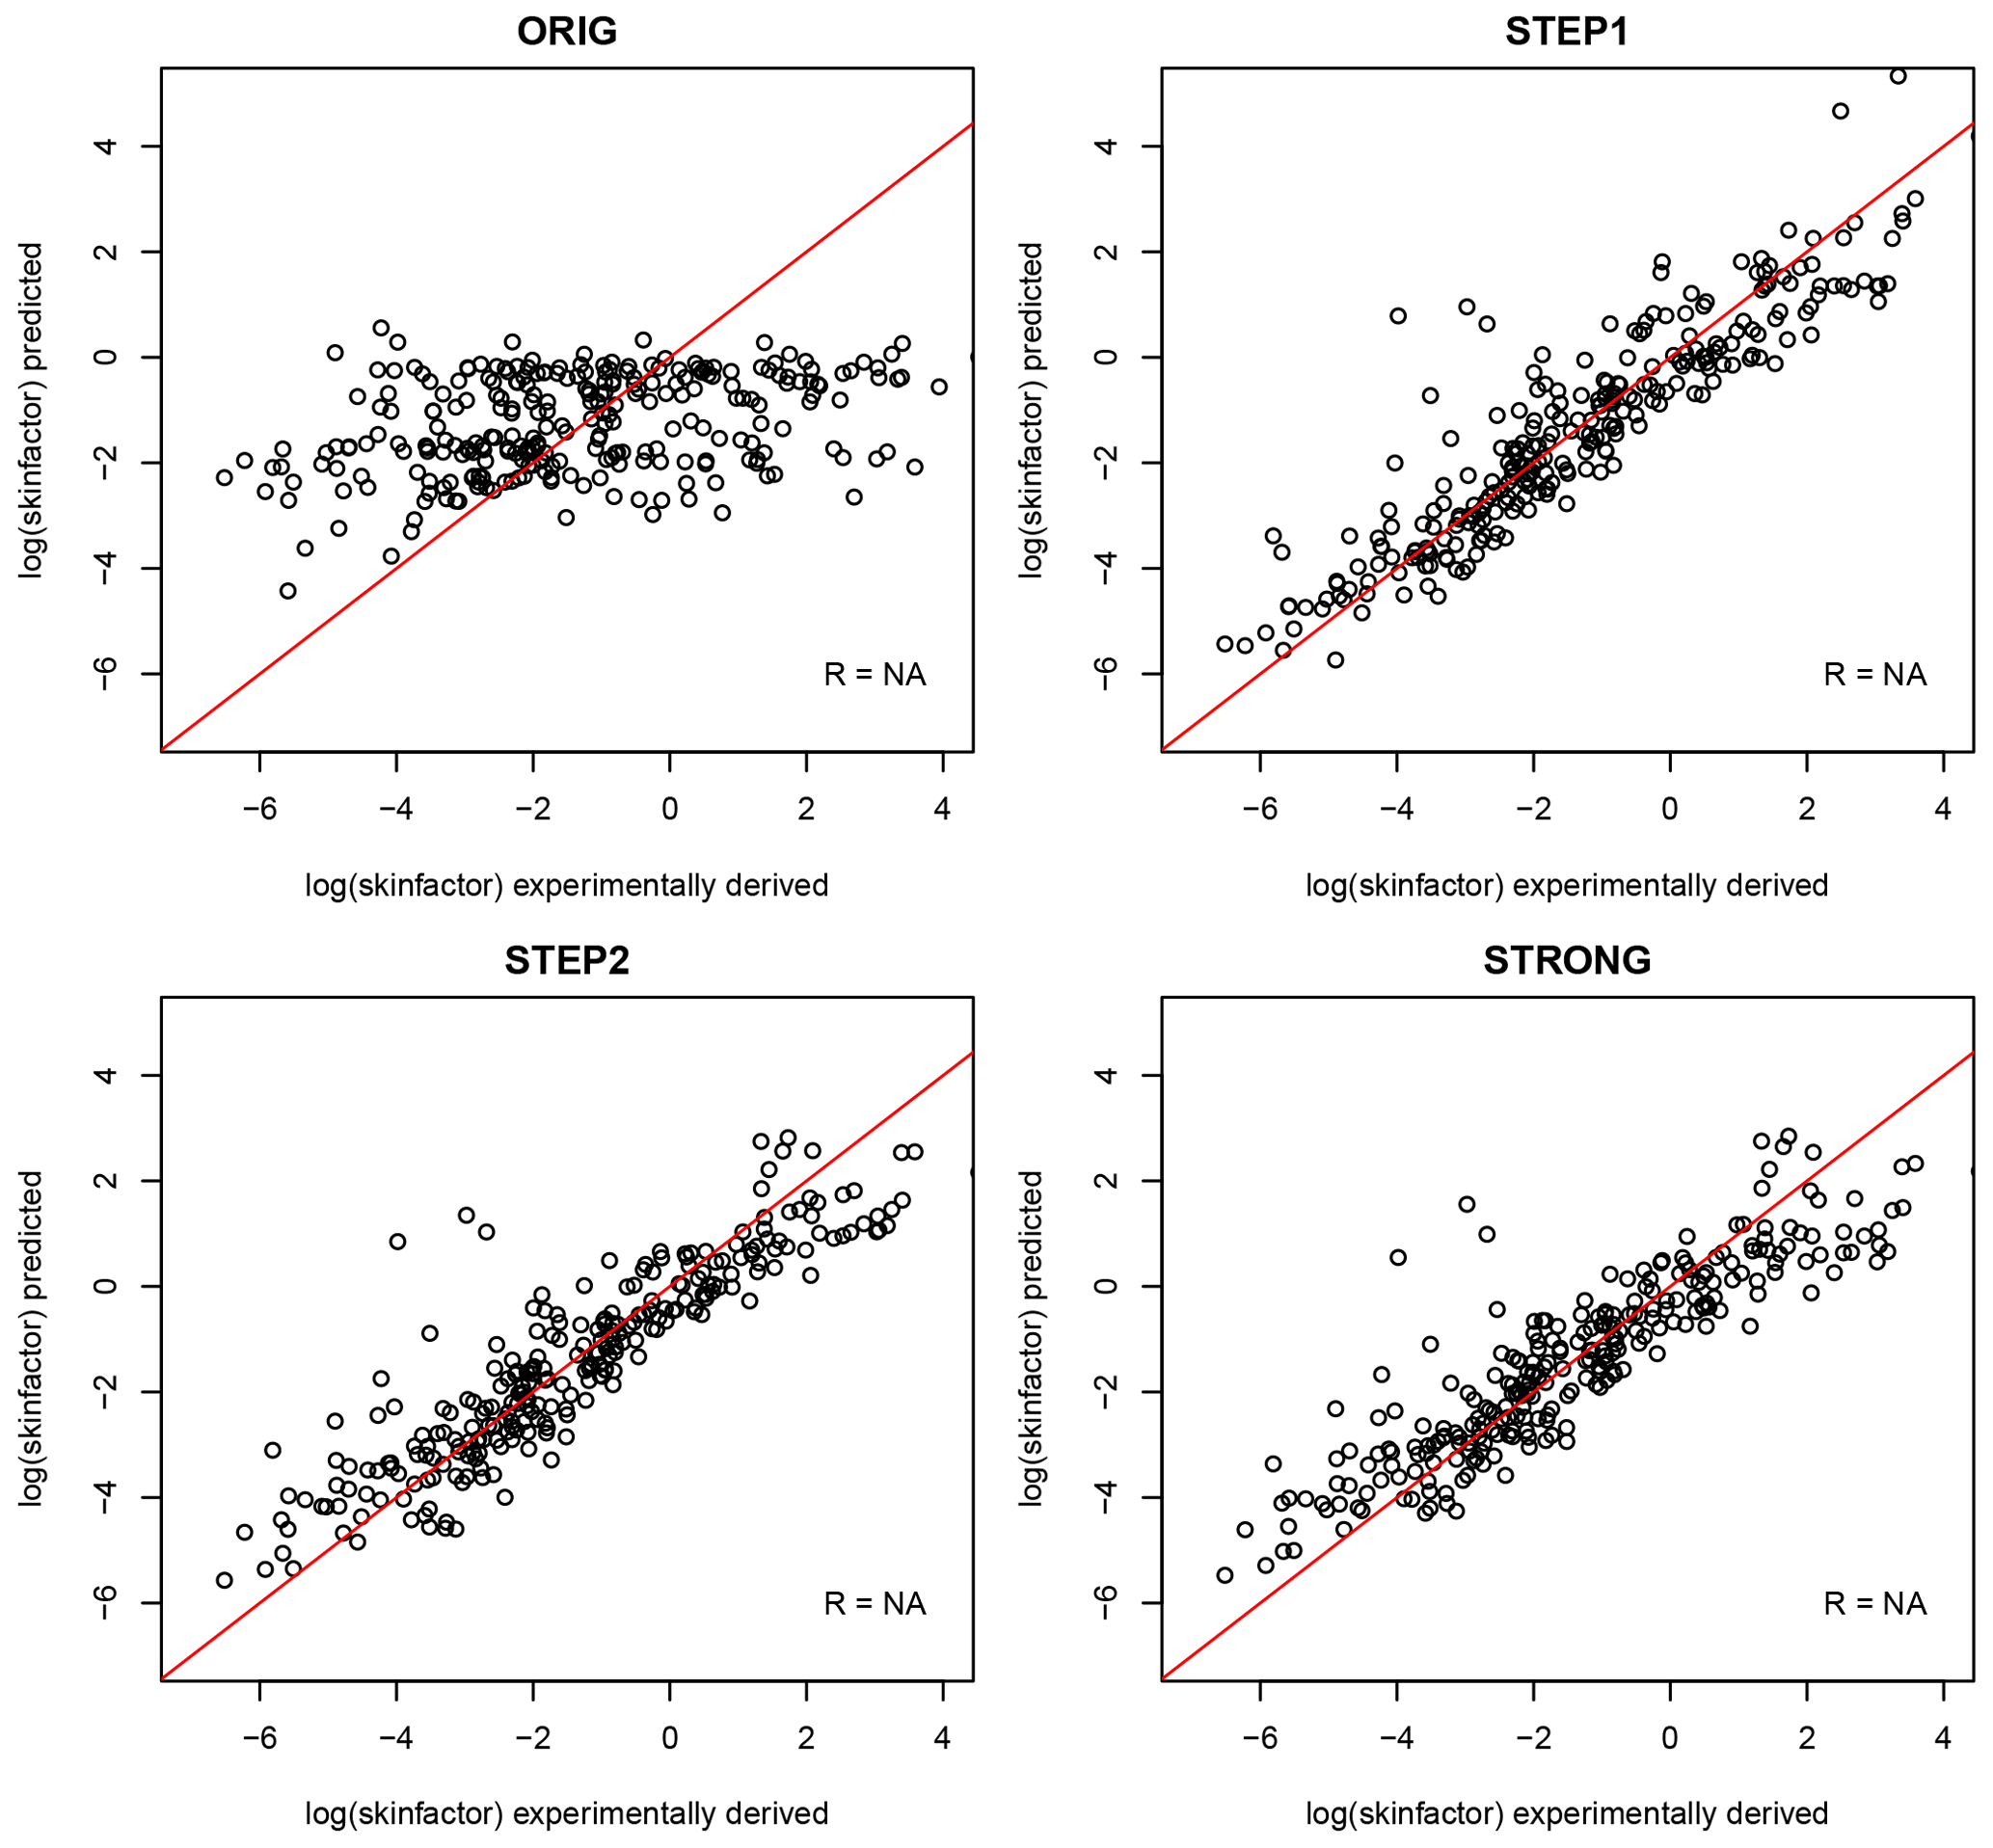
Figure 2Experimentally derived versus predicted skinfactors (log values) for the selected validation dataset.

Figure 3The dependency of the skinfactor on the bulk density and soil moisture. Point data represent the whole dataset with experimentally derived skinfactors. Line data represent skinfactor prediction by STRONG for three different initial soil moisture conditions. ISM: initial soil moisture.
All the new transfer functions performed well according to the interpretation of the RSR indicator by Moriasi et al. (2007). The median absolute percent error was between 30 % and 34 % for the new transfer functions, while it was 71 % for the ORIG function. Except for MAPE, which is highly prone to extremes, all indicators showed the most complex STEP1 model as the best performing, with the simplest STRONG model as the worst performing. The differences are, however, very small.
Table 4Linear mixed-effect models for skinfactor prediction: model evaluation based on the validation dataset using common statistical indicators, model variables, and their coefficients.
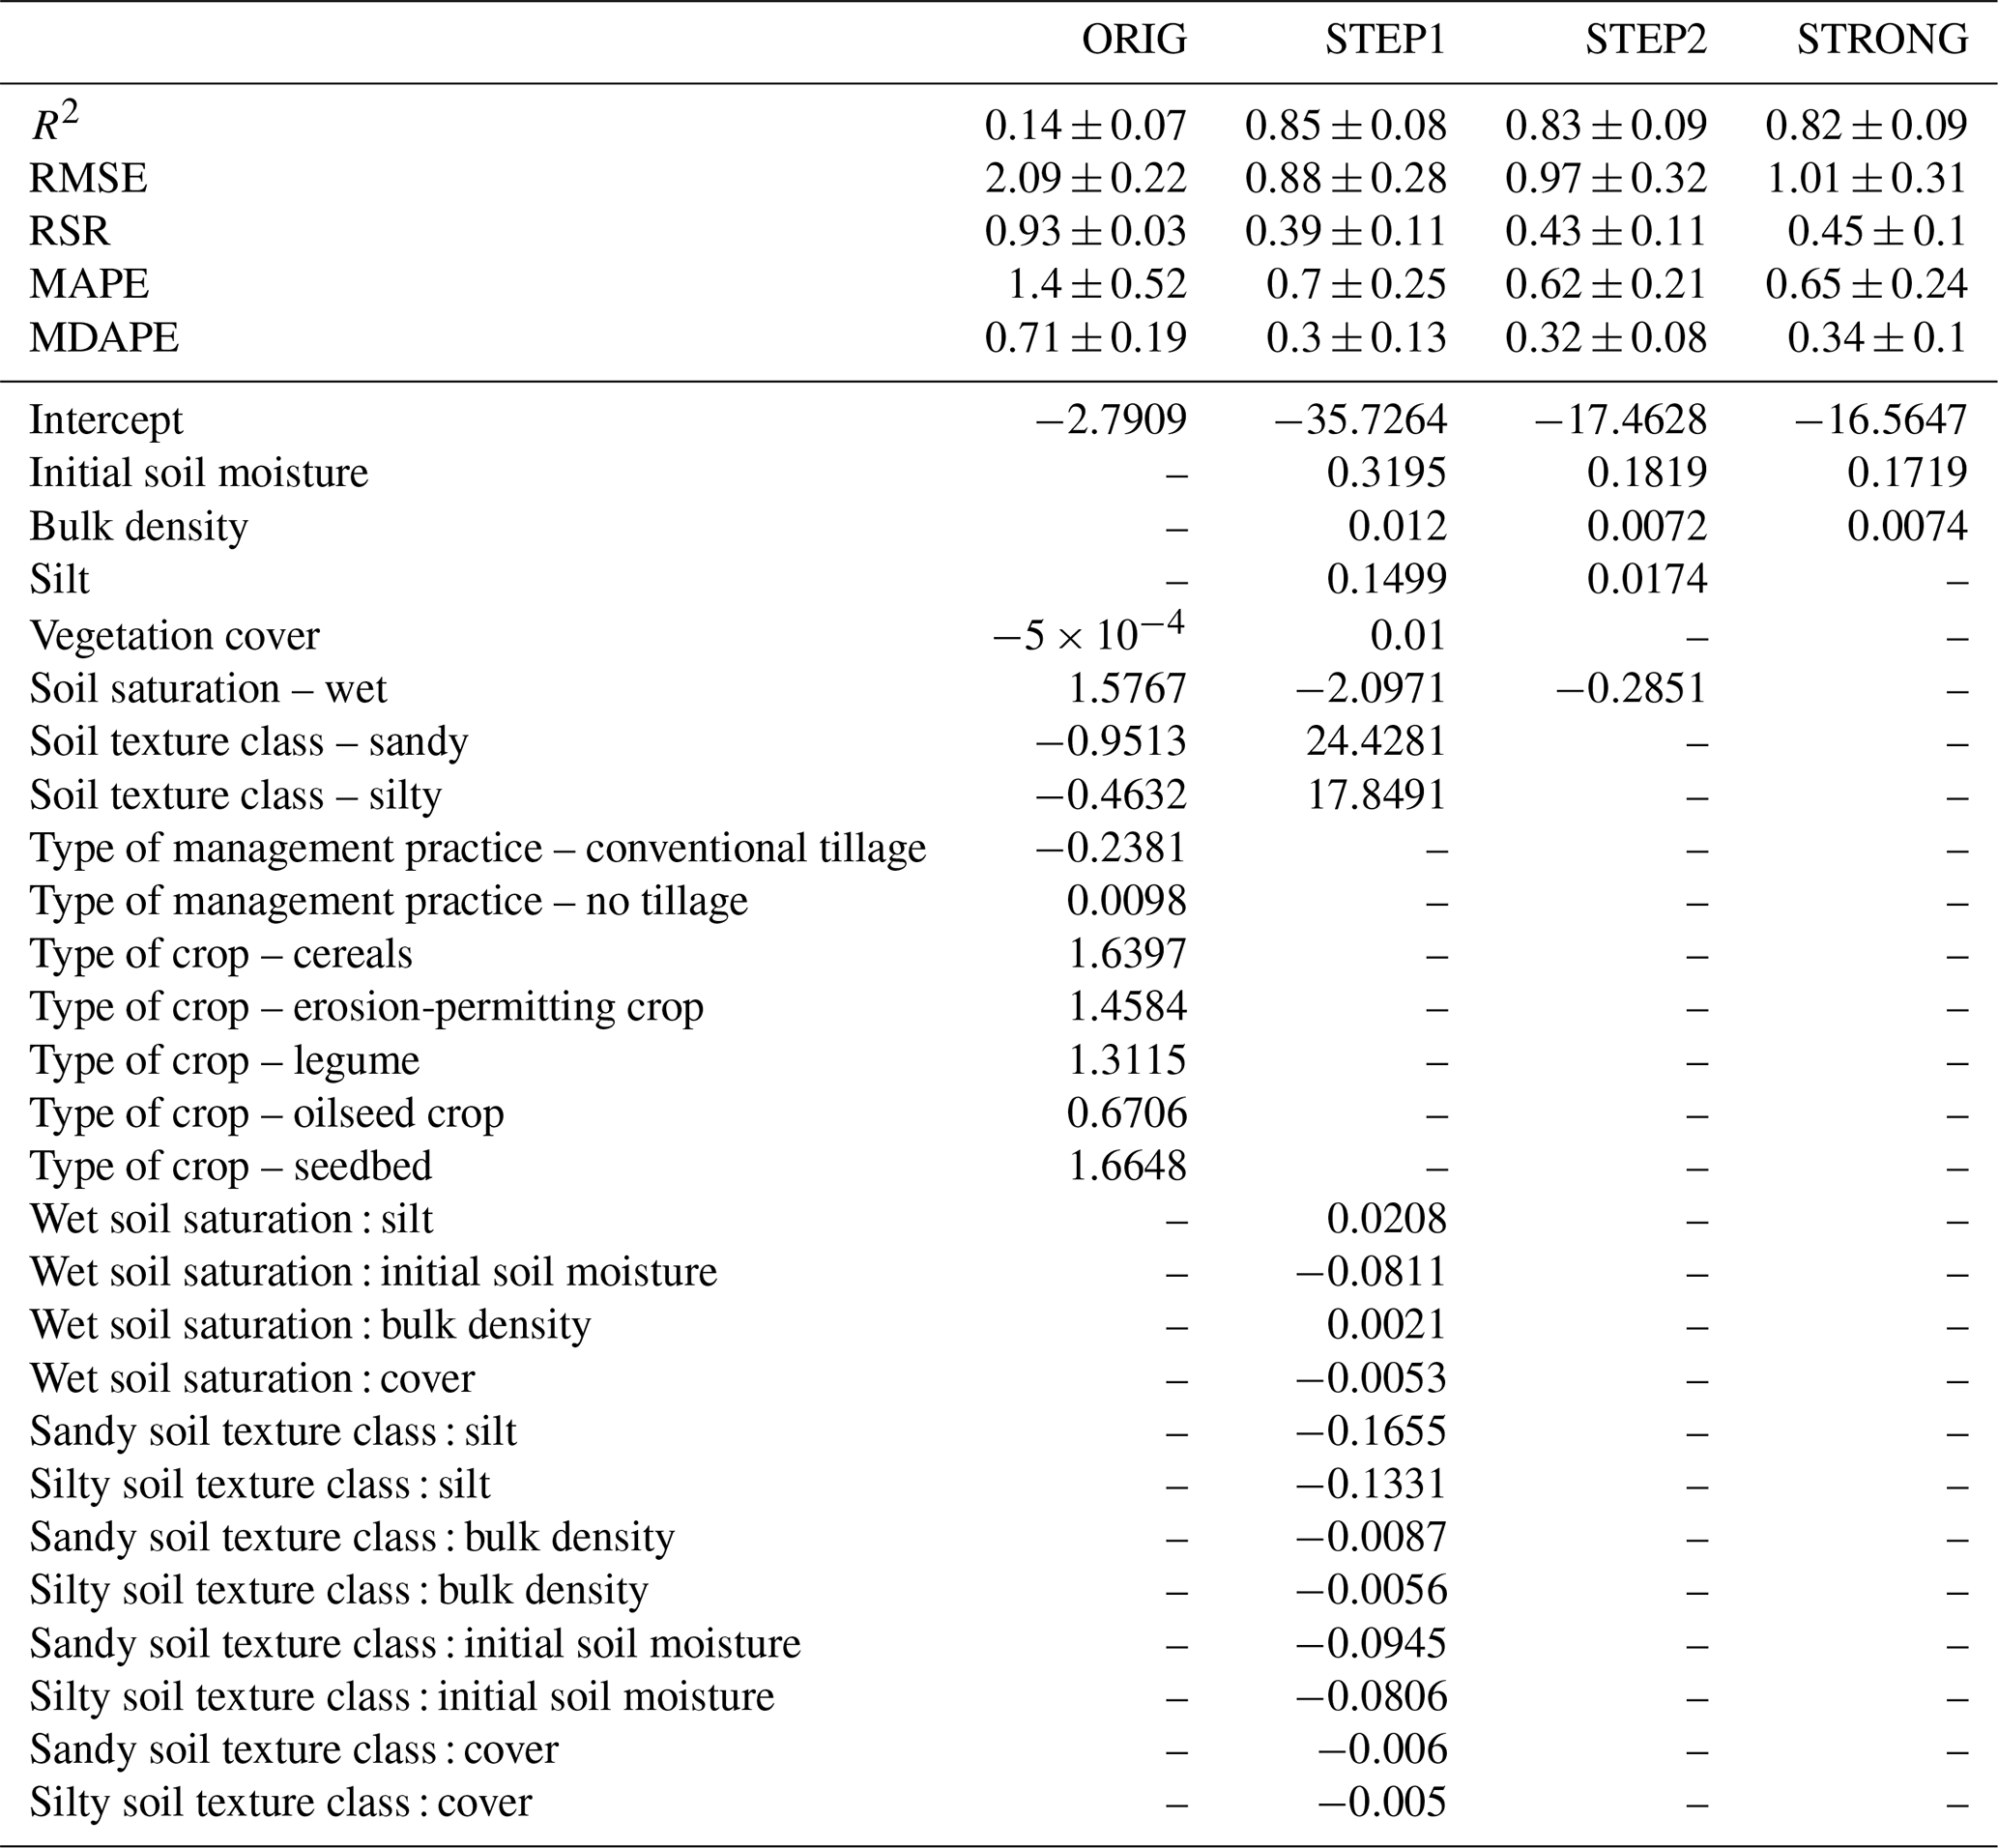
– indicates not included in the model. A : B indicates interaction between factors A and B. An example of transfer function construction (STEP2): skinfactor = .
3.2 Error propagation
Error propagation of the predicted skinfactors to the surface runoff and sediment mass simulated by EROSION-3D was evaluated on the hypothetical 400 m long slope. Table 5 statistically compares the model performance. Simulations with the skinfactors predicted by the ORIG model produced no runoff for 71 out of the 273 datasets, while the new transfer functions produced no runoff only for three to nine datasets. The median error of the surface runoff was 34 %–40 %, while that of the sediment mass was 41 %–49 % (for the ORIG model these were 78 % and 95 %, respectively). Errors below 100 % characterised 86 % of the datasets for surface runoff and 82 % of the datasets for sediment mass, whereas, for the ORIG model, these values were 62 % and 55 %, respectively. STEP1 was the best-performing model for both the surface runoff and sediment mass prediction (as compared with ORIG in Figs. 4 and 5). Error distribution illustrated in Fig. 6 further shows that there is almost no difference between STEP2 and STRONG. The results indicate major impact of the two strongest predictors, i.e. initial soil moisture and bulk density and significant improvement of the model performance when interaction with soil texture and impact of previous rainfall are considered. In general, all of the new transfer functions showed significantly better performance than the original approach, such that they can be used to predict the skinfactor.
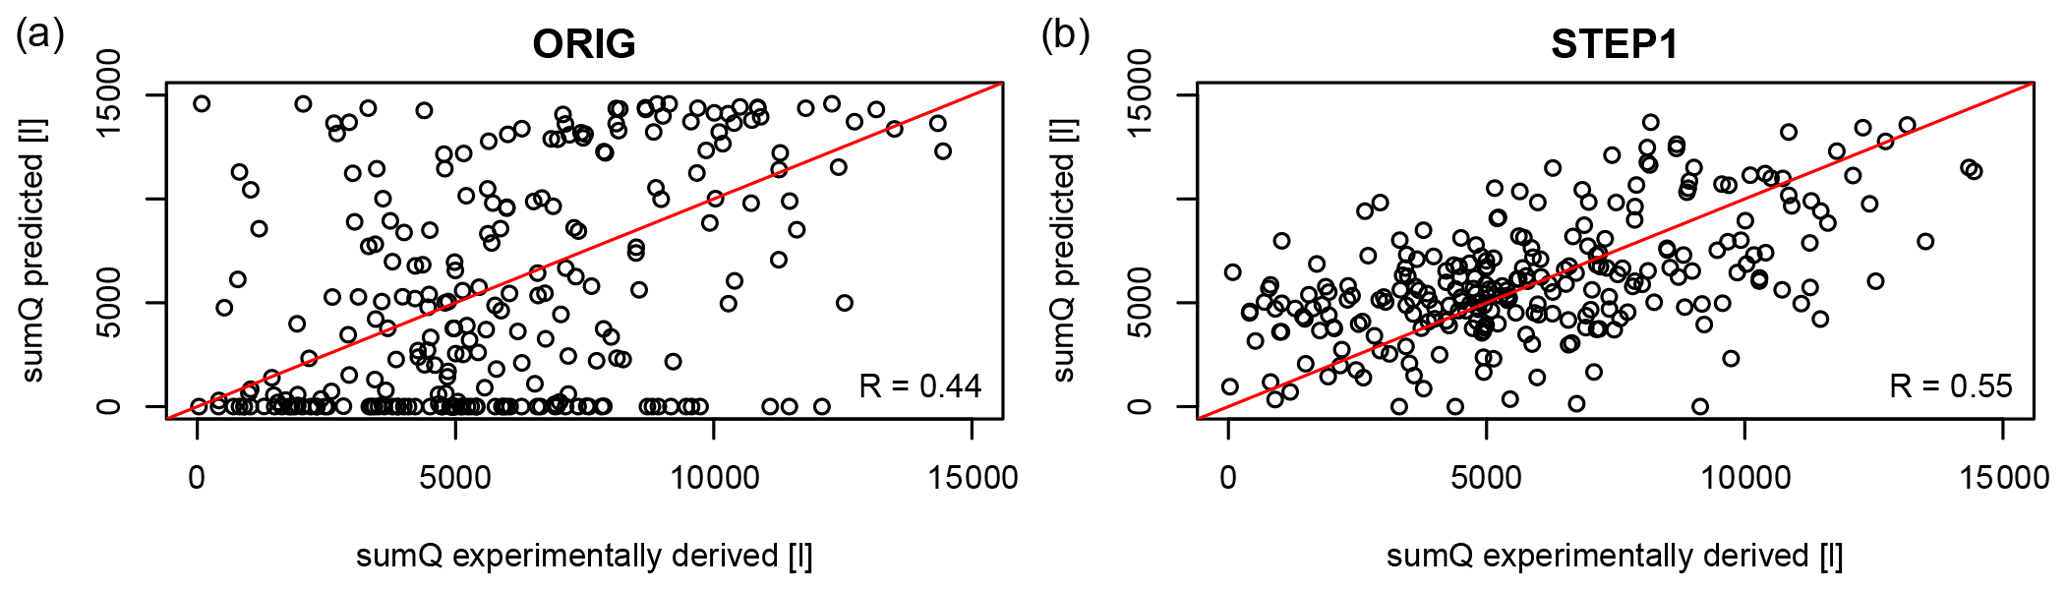
Figure 4Surface runoff simulated with the derived skinfactor versus the ORIG skinfactor (a) and STEP1 skinfactor (b).

Figure 5Sediment mass simulated by EROSION-3D with the experimentally derived skinfactor versus skinfactor predicted by the ORIG model (a) and STEP1 model (b).

Figure 6Error propagation of skinfactor prediction in the surface runoff (a) and sediment mass (b), a density plot of the percent error. Outlying experiments (error > 200 %) create 6 %–9 % of the validation experiments. Experiments with no simulated runoff are evaluated as 100 % error, which explains the significant peak in the ORIG model.
Table 5Error propagation of the skinfactor prediction models for the surface runoff and sediment mass evaluated by commonly used statistical indicators.

* MDAPE: median absolute percent error. The median, instead of the mean, was used because of zero runoffs and outliers.
3.3 Validation with real events
Real rainfall-runoff events were modelled using the new transfer functions. To account for the potential error in the functions, each event was simulated with the predicted skinfactor and the skinfactor corrected by +MAPE and −MAPE. EROSION-3D simulated no runoff for four out of the six events using all of the transfer functions. Simulations with the skinfactor corrected by MAPE to increase the infiltration rate produced no runoff for all events. Only the events on 14 May and 15 July produced runoff (Table 6). For all of the transfer functions, the modelled runoff was within the range or close to the runoff value recorded by the trap devices. The STRONG model simulated less runoff than the other models, and only the simulations with skinfactor decreased by MAPE produced runoff. The recorded runoff values for events on 5 May, 2 July and 11 July are questionable, because the rainfall data had very low volume and intensity, significantly lower than the erosion causing rainfall, as defined by Janeček et al. (2012) (12.5 mm volume or 6 mm/15 min intensity). The event on 29 June had one of the highest volumes but had a relatively long duration and low intensity. While this event produced the largest runoff, as recorded by a trap device, EROSION-3D simulated no runoff. Crust on the topsoil was recorded by field workers for the last four events, which likely initiated runoff from the low-volume and low-intensity rainfall events. The fact that runoff was never recorded in three trap devices during the same event shows the high natural variability of the rainfall-runoff process within a small area. More validation datasets for testing EROSION-3D under variable soil and vegetation conditions are required to properly validate the transfer functions. Validation at the field or the catchment scale is appropriate because the measured runoff data represent average conditions, where site-to-site changes, as recorded using the trap device, are blurred.
Table 6Runoff volume (mL) from real rainfall events, measured versus simulated with the skinfactors predicted by the new transfer functions.
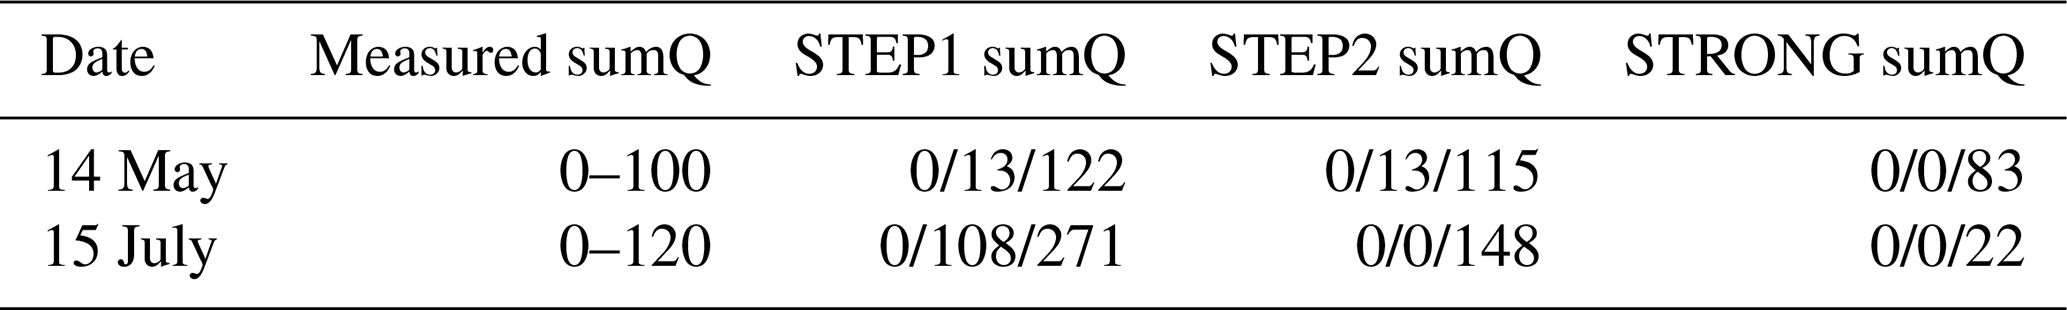
Measured sumQ: min–max value measured in three trap devices. Predicted sumQ: predicted − MAPE, predicted predicted + MAPE.
3.4 Discussion
The joint rainfall simulation dataset of TUBAF and RISWC provides a sufficient amount of data to statistically analyse the relationships between the skinfactor calibration parameter and commonly measured soil and vegetation conditions as well as to derive the transfer functions for the skinfactor. It is however important to consider the spatial limitation of the transfer functions given by the dataset, which consists of data representing soils of the Czech Republic and Saxony (state of Germany). Other open databases of rainfall-runoff experiments covering bigger spatial variability exist (e.g. Seibert et al., 2011; Rahmati et al., 2018); however, all of the experiments except those made by model developers are lacking at least one of the required input parameters.
The current skinfactor prediction method published in the Parameter Catalogue is based on easily and accurately measurable factorial variables, i.e. crop, management practice, soil saturation, development stage of vegetation, and soil texture class. The results of model ORIG show that out of these variables, only soil saturation had a statistically evident influence on the skinfactor. This parameter distinguishes only two categories of soil saturation, dry soils (no antecedent precipitation) and wet soils (shortly after precipitation), indicating rather impact of previous rainfall than the soil moisture itself. The relationship was explained by stability of aggregates (Michael, 2000). Dry aggregates are prone to destruction by enclosed air, which becomes compressed by water infiltrating into the aggregates. The smaller particles from the destroyed aggregates then cause surface sealing and smaller skinfactors.
Further studies using numerical variable initial soil moisture observed a relationship of skinfactor and soil moisture corresponding to our results. It was however again explained by the state of the soil before and after rainfall. Schindewolf and Schmidt (2012) used air trapping on a larger scale as an explanation. Air trapping occurs when the wetting front enters the soil. The enclosed soil air then hinders, to a certain extent, the infiltration. A further theoretical explanation was hydrophobicity, which results from hydrophobic particles (mainly organic matter) in the soil matrix. Once dried, particles are harder to rewet than hydrophilic particles (Hallett, 2007; Seidel, 2008; Kuhnert, 2008; Schindewolf and Schmidt, 2009). All of these effects would decrease the infiltration rates for dry soils. Our study indicates that these theories explain only a smaller part of the skinfactor variability as the categorical soil saturation is only a weak predictor (compare models STEP1 and STRONG), and the relationship with initial soil moisture seems to be independent of dry or wet experiment conditions.
This study followed the state-of-the-art parametrisation method established with EROSION-3D and used linear mixed-effect models to find relationships between the parameter and soil and vegetation conditions. The derived pedotransfer functions showed a strong logarithmic relationship between skinfactor and soil moisture, which indicates drastic overestimation of infiltration of dry soils by EROSION-2D/3D. This raises questions regarding the used method of parametrisation. The established approach fits infiltration curves by scaling only one of the Green–Ampt parameters – saturated hydraulic conductivity. This value is estimated by Eq. (13) and calibrated through a skinfactor. As a consequence, the parametrisation focused only on this single parameter.
The Green–Ampt parameter water potential at the wetting front is assumed to be equal to matrix potential of the soil at antecedent water content in EROSION-2D/3D and is calculated by Eq. (4). The water potential at the wetting front is however only a weak function of the matrix potential when the soil is dry (Dingman, 2015). This leads to an overestimation of the infiltration rate of dry soils, which is in turn compensated for by decreasing saturated hydraulic conductivity to extremely small values.
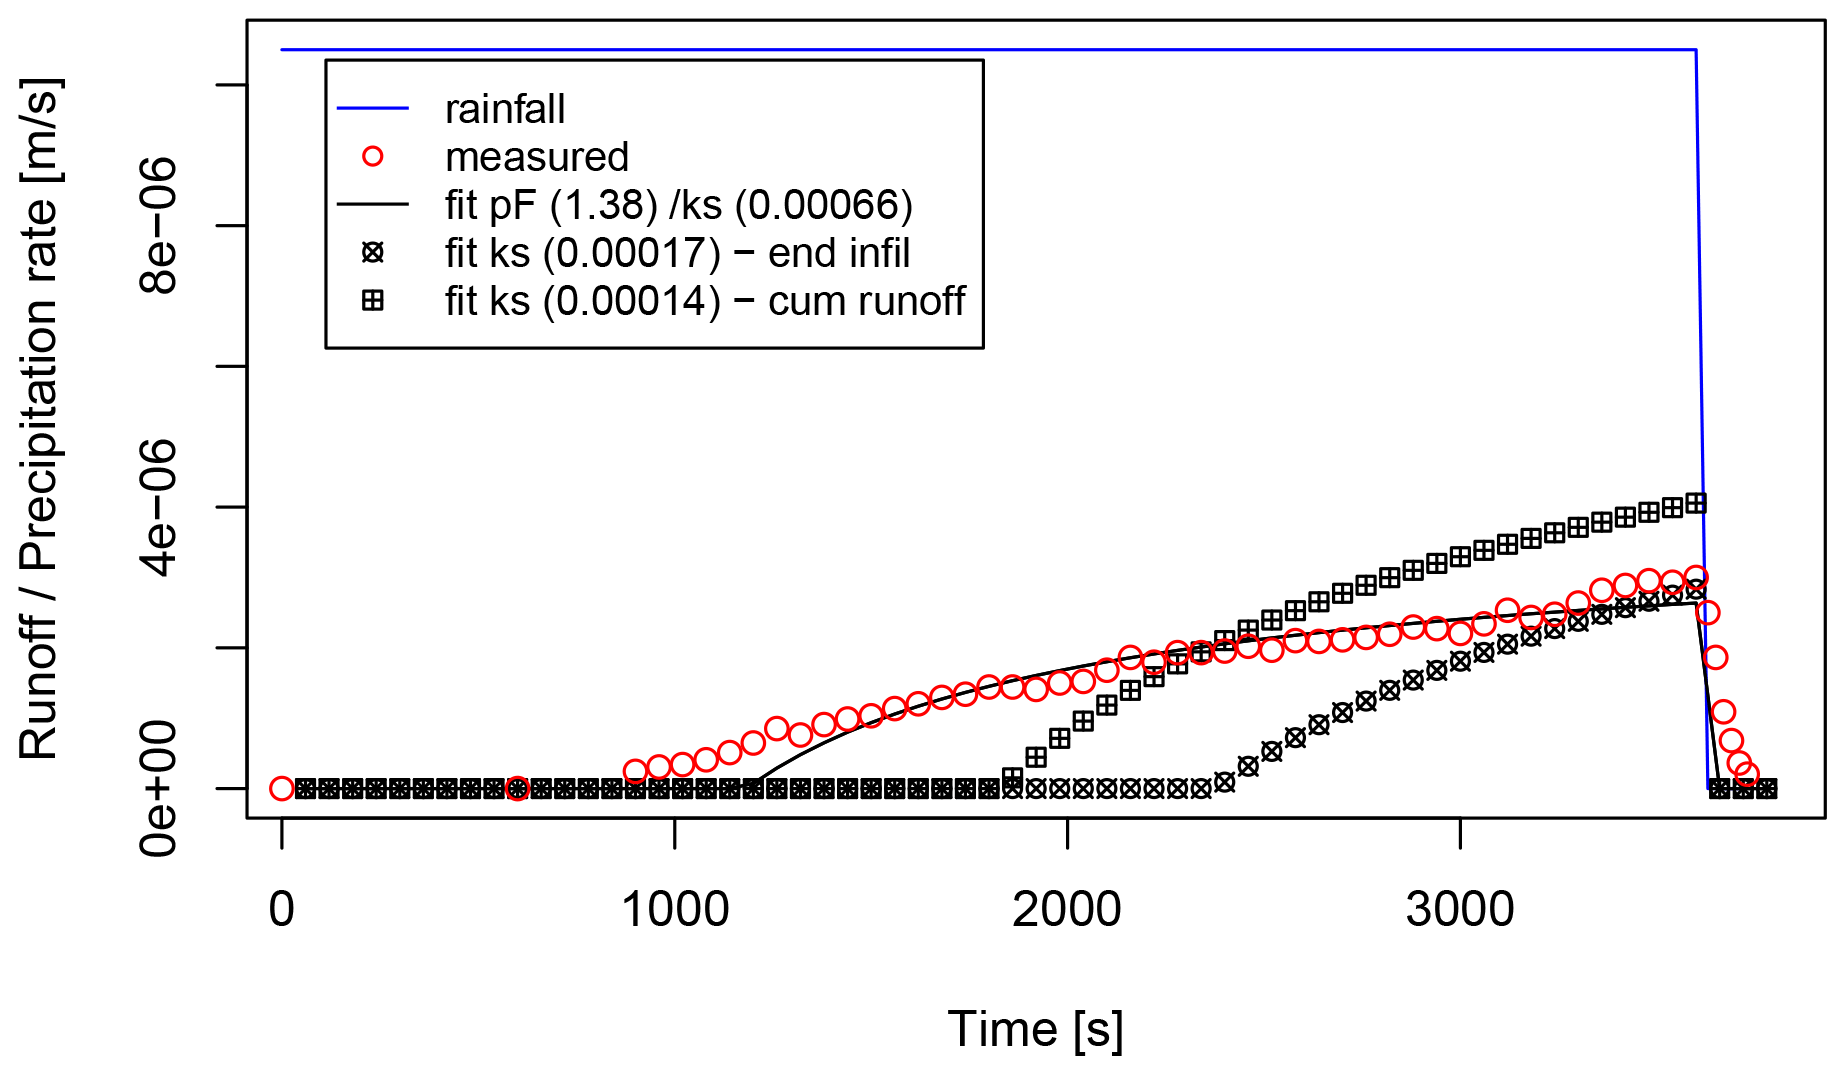
Figure 7Comparison of parameter fitting strategies: ks fit refers to variation of hydraulic conductivity (kg m−3 s−1) only (state of the art in EROSION-3D) with a fixed pF value of 2.13, estimated from initial soil moisture. Fit of refers to the best simulation found by Monte Carlo simulation.
To get better insight into the parameter-fitting strategy, Monte Carlo parameter optimisation (Luengo et al., 2020) was tested, where both Green–Ampt parameters' saturated hydraulic conductivity and water potential at the wetting front were varied and their optimal combination to fit the measured infiltration curve was searched. Runoff measurement of a single experiment on a silty loam with an initial volumetric soil moisture content of 31 % was used as a fitting target. The matrix potential estimated by Eq. (4) for this experiment equals a pF value of 2.13, and the saturated hydraulic conductivity as estimated by Eq. (13) equals kg m−3 s−1. In the state-of-the-art parametrisation method the saturated hydraulic conductivity was adjusted by the skinfactor to kg m−3 s−1 in the case of fitting end infiltration and to kg m−3 s−1 in the case of fitting cumulative runoff. In the Monte Carlo approach 10 000 randomly sampled combinations of the parameters were modelled with EROSION-3D. The parameter combination at which the RMSE of simulated and measured infiltration curve was smallest represents the best found fit (pF = 1.38, ks = kg m−3 s−1). The two methods are compared in Fig. 7. While the parameter optimisation method is able to adequately simulate the infiltration curve in its full extent, the single parameter method shows underestimation of infiltration in the full extent in the case of fitting end infiltration and underestimation at the beginning and overestimation at the end of the experiment in the case of fitting cumulative runoff.
Nevertheless, the parametrisation method behind this study is not optimal: the presented functions to estimate the skinfactor indicate significant improvement in the infiltration module performance in comparison with the values presented in the parameter catalogue (compare results of model ORIG with the new pedotransfer functions). The validation on real data indicates good model performance for rainfalls with higher intensity and volume. Model users should use the functions carefully and with the awareness of an error introduced in the parametrisation phase. At the same time results of the study are opening a way for further EROSION-2D/3D development which can be approached either through the algorithms implemented in the source code of EROSION-3D or through a different method of model parametrisation. The very basic approach to optimise parameters of the Green–Ampt approach in EROSION-3D applied in this study can be seen as a first step towards the use of advanced parameter optimisation algorithms (e.g. the SPOTPY package, Houska et al., 2015).
This study aimed to increase the accuracy of the infiltration module of the EROSION-2D/3D soil erosion simulation tool by introducing new transfer functions to estimate the calibration parameter adjusting saturated hydraulic conductivity called “skinfactor”. The relationship of the skinfactor with soil, vegetation, and farm management parameters was analysed using the linear mixed-effect models based on 273 rainfall-runoff experiments. The initial soil moisture and bulk density were found to be the most important predictors, together explaining 82 % of the skinfactor variability. These parameters are not considered in currently available prediction methods provided in Michael et al. (1996). Other significant predictors such as soil texture (i.e. the silt content and KA5 soil texture group), vegetation cover and the impact of previous rain events slightly improved the skinfactor prediction. Four transfer functions with different complexities and number of predictors to predict skinfactor were presented, such that the users can make a selection according to the available data in their study area. The proposed transfer functions present significant increase in the skinfactor prediction accuracy as compared with currently available methods (decrease in the MDAPE error from 71 % to 30 %–34 %). Error propagation of the estimated skinfactors indicates substantial improvements to surface runoff and soil loss simulations. The strong logarithmic relationship of skinfactor with soil moisture however shows a misinterpretation of the Green–Ampt algorithms in EROSION-2D/3D. A wrong assumption that the water potential at the wetting front is equal to the initial water potential in soil had to be compensated by the skinfactor which is as a consequence highly related to initial soil moisture. A different parameter optimisation method was tested, where the best combination of both parameters, saturated hydraulic conductivity and water potential at the wetting front, is searched. Both parameters can then be predicted from soil parameters based on pedotransfer functions. This finding paves the way for further EROSION-2D/3D model development, promising further improvement in the infiltration model accuracy.
This paper was compiled using the RMD template (Allaire et al., 2020) in RStudio (RStudio Team, 2020). The source file with all calculations performed in R (R Core Team, 2020) and input data not openly accessible are available in the Supplement.
The supplement related to this article is available online at: https://doi.org/10.5194/soil-7-241-2021-supplement.
AR, JD, MM and AB made rainfall experiments, HB, JL and JD processed rainfall experiment data, JL automatised skinfactor determination, HB, JL and JD carried out the statistical analysis, IG provided data for validation of real events, HB and JL wrote the code and prepared the manuscript, and AR and JK consulted the whole process.
The authors declare that they have no conflict of interest.
This study was supported by the Ministry of Agriculture of the Czech Republic (grant nos. QK1810341 and MZE-RO0218) and by the European Social Fund in the Free State of Saxony (Förderbaustein: Promotionen).
This paper was edited by Jan Vanderborght and reviewed by Mehdi Rahmati and one anonymous referee.
Akaike, H.: Factor analysis and AIC, Psychometrika, 52, 317–332, https://doi.org/10.1007/BF02294359, 1987. a
Allaire, J., Xie, Y., R Foundation, Wickham, H., Journal of Statistical Software, RStudio, Vaidyanathan, R., Association for Computing Machinery, Boettiger, C., Elsevier, Broman, K., Mueller, K., Quast, B., Pruim, R., Marwick, B., Wickham, C., Keyes, O., Yu, M., Emaasit, D., Onkelinx, T., Gasparin, A., Desautels, M.-A., Leutnant, D., MDPI, Taylor and Francis, Öğreden, O., Hance, D., Nüst, D., Uvesten, P., Campitelli, E., Muschelli, J., Kamvar, Z. N., Ross, N., Cannoodt, R., Luguern, D., and Kaplan, D. M.: rticles: Article Formats for R Markdown, available at: https://cran.r-project.org/package=rticles (last access: 18 May 2021), 2020. a
Campbell, G. S.: Soil physics with BASIC: transport models for soil-plant systems, 1st Edn., Elsevier, Amsterdam, The Netherlands, New York, USA, 149 pp., 1985. a
Devátý, J., Beitlerová, H., and Lenz, J.: An open rainfall-runoff measurement database, in: EGU General Assembly 2020, Online, 4–8 May 2020, EGU2020-9148, https://doi.org/10.5194/egusphere-egu2020-9148, 2020. a
Dingman, S. L.: Physical hydrology, 3rd Edn., Waveland Press, Inc., Long Groove, Illinois, USA, 2015. a
Galecky, A. and Burzykowski, T.: Linear Mixed-effects Models Using R – A step-by-step Approach, Springer Texts in Statistics, Springer, New York, USA, 542 pp., 2013. a
Green, W. and Ampt, G.: Studies on Soil Physics – Part 1: the Flow of Air and Water through Soils, J. Agr. Sci., 4, 11–24, 1911. a
Hallett, P. D.: An introduction to soil water repellency, in: Proceedings of the 8th International Symposium on Adjuvants for Agrochemicals (ISAA2007), edited by: Gaskin, R., International Society for Agrochemical Adjuvants (ISAA), 6–9 August 2007, Columbus, Ohio, USA, 9, 2007. a
Hänsel, P., Langel, S., Schindewolf, M., Kaiser, A., Buchholz, A., Bottcher, F., and Schmidt, J.: Prediction of Muddy Floods Using High-Resolution Radar Precipitation Forecasts and Physically-Based Erosion Modeling in Agricultural Landscapes, Geosciences, 9, 401, https://doi.org/10.3390/geosciences9090401, 2019. a
Houska, T., Kraft, P., Chamorro-Chavez, A., and Breuer, L.: SPOTting model parameters using a ready-made python package, PLoS ONE, 10, e0145180, https://doi.org/10.1371/journal.pone.0145180, 2015. a
Janeček, M., Dostál, T., Kozlovsky-Dufková, J., Dumbrovský, M., Hůla, J., Kadlec, V., and Konečná, J.: Ochrana zemědělské půdy před erozí, ČZU FŽP, ISBN 978-80-87415-42-9, 1st Edn., ČZU FŽP, Prague, Czech Republic, 2012. a
Kuhnert, M.: Quantifizierung von Oberflächenabfluss und Erosion auf Böden mit hydrophoben Eigenschaften, Ph.d. thesis, Universität Potsdam, Potsdam, Germany, available at: https://publishup.uni-potsdam.de/opus4-ubp/frontdoor/deliver/index/docId/3125/file/kuhnert_diss.pdf (last access: 18 May 2021), 2008. a
Luengo, D., Martino, L., Bugallo, M., Elvira, V., and Särkkä, S.: A survey of Monte Carlo methods for parameter estimation, Eurasip. J. Adv. Sig. Pr., 25, https://doi.org/10.1186/s13634-020-00675-6, 2020. a
Michael, A.: Anwendung des physikalisch begründeten Erosionsprognosemodells EROSION 2D/3D – Empirische Ansätze zur Ableitung der Modellparameter, Disertation, Technische Universität Bergakademie Freiberg, Freiberg, Germany, 147 pp., 2000. a, b, c
Michael, A., Schmidt, J., and Schmidt, W.: EROSION 2D – Ein Computermodell zur Simulation der Bodenerosion durch Wasser, Band II: Parameterkatalog, Technische Universität Bergakademie Freiberg, 150 pp., Freiberg, Germany, 1996. a, b, c, d, e
Moriasi, D. N., Arnold, J. G., Liew, M. W. V., Bingner, R. L., Harmel, R. D., and Veith, T. L.: Model Evaluation Guidelines for Systematic Quantification of Accuracy in Watershed Simulations, T. ASABE, 50, 885–900, 2007. a, b
R Core Team: A Language and Environment for Statistical Computing, available at: https://www.R-project.org (last access: 18 May 2021), 2020. a
Rahmati, M., Weihermüller, L., and Vereecken, H.: Soil Water Infiltration Global (SWIG) Database, https://doi.org/10.1594/PANGAEA.885492, Supplement to: Rahmati, M. et al. (2018): Development and Analysis of Soil Water Infiltration Global Database, Earth System Science Data, PANGAEA [data set], 2018. a
Routschek, A., Schmidt, J., and Kreienkamp, F.: Impact of climate change on soil erosion – A high-resolution projection on catchment scale until 2100 in Saxony/Germany, Catena, 121, 99–109, https://doi.org/10.1016/j.catena.2014.04.019, 2014. a
RStudio Team: RStudio: Integrated Development for R. RStudio, PBC, Boston, MA, available at: http://www.rstudio.com/ (last access: 18 May 2021), 2020. a
Schindewolf, M. and Schmidt, J.: Parameterization of the EROSION 2D/3D soil erosion model using a small-scale rainfall simulator and upstream runoff simulation, Catena, 91, 47–55, https://doi.org/10.1016/j.catena.2011.01.007, 2012. a, b, c
Schindewolf, M. and Schmidt, W.: Validierung EROSION 3D, Schriftenreihe des Landesamtes für Umwelt, Landwirtschaft und Geologie, 15, 1–121, 2009. a
Schlegel, M.: Empirische Ableitung von Bodenparametern zur Verwendung im Modell EROSION 3D, BSc Thesis, Ph.D. thesis, Technische Universität Bergakademie Freiberg, Freiberg, Germany, 2012. a
Schmidt, J.: Entwicklung und Anwendung eines physikalisch begründeten Simulationsmodells für die Erosion geneigter landwirtschaftlicher Nutzflächen, Heft 61, Berliner Geogr. Abh., 148 pp., Instituts für Geographische Wissenschaften, Berlin, Germany, ISBN 3-88009-062-9, 1996. a, b, c, d
Seibert, S. P., Auerswald, K., Fiener, P., Disse, M., Martin, W., Haider, J., Michael, A., and Gerlinger, K.: Surface runoff from arable land – a homogenized data base of 726 rainfall simulation experiments, CRC/TR32 Database (TR32DB), https://doi.org/10.1594/GFZ.TR32.2, 2011. a
Seidel, N.: Untersuchung der Wirkungverschiedener Landnutzungen auf Oberflächenabfluss und Bodenerosion mit einem Simulationsmodell, Ph.d. thesis, Technische Universität Bergakademie Freiberg, Freiberg, Germany, available at: https://tubaf.qucosa.de/api/qucosa%3A22637/attachment/ATT-0/ (last access: 18 May 2021), 2008. a
Ad-hoc-Arbeitsgruppe Boden: Bodenkundliche Kartieranleitung, edited by: Bundesanstalt für Geowissenschaften und Rohstoffe in Zusammenarbeit mit den Staatlichen Geologischen Diensten, Schweizerbart'sche, E., 5th Edn., 438 pp., Hannover, ISBN 978-3-510-95920-4, 2005 a, b
Van Genuchten, M. T.: A closed-form equation for predicting the hydraulic conductivity of unsaturated soils, Soil Sci. Soc. Am. J., 44, 892–898, https://doi.org/10.2136/sssaj1980.03615995004400050002x, 1980. a
Vereecken, H. J., Maes, J., Feyen, J., and Darius, P.: Estimating the Soil Moisture Retention Characteristic From Texture, Bulk Density, and Carbon Content, Soil Sci., 148, 389–403, https://doi.org/10.1097/00010694-198912000-00001, 1989. a
von Werner, M.: EROSION-3D, version 3.15, Benutzerhandbuch, GeoGnostics Software, Berlin, Germany, 2007. a
von Werner, M.: Data base processor mage, version 1.80, User manual, GeoGnostics Software, Berlin, Germany, https://doi.org/10.1145/1013881.802693, 2009. a