the Creative Commons Attribution 4.0 License.
the Creative Commons Attribution 4.0 License.
 | 11 Feb 2020
Variations in soil chemical and physical properties explain basin-wide Amazon forest soil carbon concentrations
Carlos Alberto Quesada
Claudia Paz
Erick Oblitas Mendoza
Oliver Lawrence Phillips
Gustavo Saiz
Jon Lloyd
We investigate the edaphic, mineralogical and climatic controls of soil organic carbon (SOC) concentration utilising data from 147 primary forest soils (0–30 cm depth) sampled in eight different countries across the Amazon Basin. Sampled across 14 different World Reference Base soil groups, our data suggest that stabilisation mechanism varies with pedogenetic level. Specifically, although SOC concentrations in Ferralsols and Acrisols were best explained by simple variations in clay content – this presumably being due to their relatively uniform kaolinitic mineralogy – this was not the case for less weathered soils such as Alisols, Cambisols and Plinthosols for which interactions between Al species, soil pH and litter quality are argued to be much more important. Although for more strongly weathered soils the majority of SOC is located within the aggregate fraction, for the less weathered soils most of the SOC is located within the silt and clay fractions. It thus seems that for highly weathered soils SOC storage is mostly influenced by surface area variations arising from clay content, with physical protection inside aggregates rendering an additional level of protection against decomposition. On the other hand, most of the SOC in less weathered soils is associated with the precipitation of aluminium–carbon complexes within the fine soil fraction, with this mechanism enhanced by the presence of high levels of aromatic, carboxyl-rich organic matter compounds. Also examined as part of this study were a relatively small number of arenic soils (viz. Arenosols and Podzols) for which there was a small but significant influence of clay and silt content variations on SOM storage, with fractionation studies showing that particulate organic matter may account for up to 0.60 of arenic soil SOC. In contrast to what were in all cases strong influences of soil and/or litter quality properties, after accounting for these effects neither wood productivity, above-ground biomass nor precipitation/temperature variations were found to exert any significant influence on SOC stocks. These results have important implications for our understanding of how Amazon forest soils are likely to respond to ongoing and future climate changes.
- Article
(5239 KB) - Full-text XML
- BibTeX
- EndNote


The soil organic carbon (SOC) pool is a function of the amount and quality of organic material entering the soil and its subsequent rate of mineralisation, which can be controlled by the various stabilisation processes that protect SOC from decomposition (Bruun et al., 2010). For example, organic carbon may be stabilised in mineral soils through interactions with oxides and clay minerals (Kahle et al., 2004; Kaiser and Guggenberger, 2003; Mikutta et al., 2007; Saidy et al., 2012; Saiz et al., 2012; Wiseman and Püttmann, 2006), with SOC physically entrapped in soil aggregates (Baldock and Skjemstad, 2000) and/or stabilised by intermolecular interactions between SOC and the surface of clays and Fe and Al hydroxides (Oades, 2018). Thus, chemical adsorption on mineral specific surface area (SSA) has an important role in C stabilisation (Kahle et al., 2003; Saggar et al., 1996, 1999; Saidy et al., 2012).
Specific surface area is itself dependent on clay mineralogy, with low-activity clays (LACs) being 1:1 alumino-silicates such as kaolinite (hereafter simply referred to as 1:1 clays) with low SSA and low cation exchange capacity (IE). This contrasts with high-activity clays (HACs) which are 2:1 alumino-silicates such as smectites and illites (hereafter simply referred to as 2:1 clays) with a much larger IE and SSA (Basile-Doelsch et al., 2005; Lützow et al., 2006). Hydrous Fe and Al oxides also provide reactive surface areas for organic matter binding, with the content of Fe and Al oxides in soils often reported as strongly correlated to C content (Eusterhues et al., 2005; Kleber et al., 2005; Saidy et al., 2012; Wiseman and Püttmann, 2006). Hydrous iron and Al oxides nevertheless show different surface properties to those of clays. Specifically, whilst surface charges of clays are predominantly negative in the tropics (Sanchez, 1976), hydrous oxides generally have positive charges and associated anion exchange capacities, which can further substantially vary in extent in different oxide types and levels of crystallinity (Cornell and Schwertmann, 2003). Thus, the SSA of clay and oxide mixtures, their chemical nature, and the types of charge predominant in organic matter may all play an important role in the C stabilisation process (Saidy et al., 2012).
For acidic soils, SOC stabilisation by Fe and Al oxides is likely to be dominated by ligand exchange (a pH-dependent process) involving carboxyl groups of SOC and simple OH groups on the surface of the oxides (Kaiser and Guggenberger, 2003; Lützow et al., 2006; Wagai and Mayer, 2007): a similar sorption mechanism to that occurring on the edges of 1:1 clay minerals such as kaolinite (Oades, 2018). Iron and Al oxides can also increase the stabilisation of SOC through interactions with clay minerals via a promotion of the formation of aggregates which then serve to preserve SOC (Kitagawa, 1983; Wagai and Mayer, 2007), also forming bridges between kaolinite and charges in organic matter which are mainly conferred by cationic amino (R-NH2) and sulfhydryl (R-SH) groups (Wiseman and Püttmann, 2006). Other factors such as the pH of soil and the organic matter loading present in the system also influence C stabilisation by mineral surfaces (Saidy et al., 2012).
Hydrous oxides themselves also vary in their capacity to stabilise C, with amorphous Fe and Al oxides having comparatively higher capacity to stabilise C than more crystalline oxides (Kleber et al., 2005; Mikutta et al., 2005). For example, on a mass basis, the C sorption capacity of ferrihydrite is 2.5 times higher than that of goethite (Kaiser et al., 2007), while amorphous Al oxides have a greater sorption capacity than ferrihydrite (Kaiser and Zech, 2000). Despite these complexities, because many heavily weathered soils consist primarily of kaolinite (Sanchez, 1976) it is common to find strong relationships between [SOC] and soil clay fraction when only soils dominated by 1:1 clays are considered (Burke et al., 1989; Dick et al., 2005; Feller and Beare, 1997; Telles et al., 2003).
A second process that may also protect organic matter against microbial decay and which should be much more relevant to 2:1 clays soils is the co-precipitation of dissolved organic matter (DOM) with Fe and Al (Baldock and Skjemstad, 2000; Boudot et al., 1989; Nierop et al., 2002; Scheel et al., 2007). DOM can be precipitated in the presence of Al, Fe and their hydroxides, with an efficiency of up to 90 % of all DOM present in the solution of some acidic forest soils (Nierop et al., 2002). The extent to which DOM precipitates is largely influenced by soil pH, with higher pH values leading to an increase in precipitation (Nierop et al., 2002). This is because pH affects both the solubility of DOM (which decreases at low pH) and the speciation of Al. At higher pH levels (> 4.2) the formation of hydroxide species such as Al(OH)3 and tridecameric Al (Al13) controls the solubility of Al, but with Al+3 predominating at lower pH. Moreover, the chemical nature of the carbon inputs into a soil may also potentially influence the nature and extent of any DOM precipitation reactions, with high molecular weight derived from lignin and tannins (e.g. aromatic compounds) with a large number of functional groups likely to be preferentially precipitated from DOM (Scheel et al., 2007, 2008).
The retention of such precipitated DOM in the soil can contribute substantially to total soil C pools and is considered one of the most important processes of SOC stabilisation (Kalbitz and Kaiser, 2008). Indeed, mineralisation rates of such metal–DOM precipitates have been reported to be 28 times lower than that of original DOM, with the resistance of precipitates against microbial decay increasing with aromatic C content and large C : N ratios. This then results in a relatively stable pool that accumulates in the soil (Scheel et al., 2007). Exchangeable Al concentrations are often very high for Amazon Basin forest soils (Quesada et al., 2011), and with Al–OM co-precipitations particularly important in such developing soils (Kleber et al., 2015), stabilisation of DOM by precipitation with Al is likely to be of considerable importance, especially in the western area of the Amazon Basin where actively evolving soils dominate (Quesada et al., 2010).
Given the range of potential mechanisms discussed above, no single soil property should be considered likely to have overriding control of SOC concentrations for Amazon Basin forest soils. And indeed, although there is a current perception that clay content alone exerts strong influence over SOC concentration of Amazon forest soils (Dick et al., 2005; Telles et al., 2003), all of this work has been done with highly weathered soils and with SOC from soil characterised by 2:1 mineralogical assemblages not showing any sort of simple clay content dependency (Quesada and Lloyd, 2016). This suggests that for such soils – as has already been shown to be the case for other regions of the world with similar pedogenetic levels (Bruun et al., 2010; Percival et al., 2000) – variations in clay quality, oxide content and metal–DOM interactions are likely to be just as, if not more, important in influencing the extent of SOC stabilisation.
With the forest soils of the Amazon Basin varying substantially in their chemical and physical properties (Quesada et al., 2010, 2011), it is important to consider how the different soils of the basin may differ in the mechanisms by which they stabilise and store SOC. Specifically, we hypothesised that soil groups with contrasting pedogenetic development should differ in their predominant mechanism of SOC stabilisation, and that soils which share more similar chemical and mineralogical characteristics should also share similar mechanisms of SOC stabilisation. Specifically, we rationalised that strongly weathered soils dominated by 1:1 clays should have their C pools influenced primarily by clay content. On the other hand, given that Al is the main product of weathering in the less weathered soils of western Amazonia (Quesada et al., 2011), and with clay contents already shown to not explain their SOC densities well (Quesada and Lloyd, 2016), we hypothesised that interactions between Al and organic matter were likely to be the main stabilisation mechanism for such soils.
Finally, soil organic matter (SOM) is a complex mixture of carbon compounds and different soil minerals. SOM consists of various functional pools, which are stabilised by different mechanisms, each associated with a given turnover rate. Aiming to simplify this complexity, several soil organic matter partitioning methods have been developed to separate SOM in different operationally defined pools or fractions with contrasting chemical and physical characteristics (Denef et al, 2010). Such fractionation methods provide additional support for understanding soil carbon stabilisation mechanisms and also provide useful constraints for models of soil carbon dynamics (Trumbore and Zheng, 1996; Zimmermann et al., 2007).
Here we explore the climatic, edaphic and mineralogical conditioning of soil carbon pools across the diverse forest soils of the Amazon Basin, focusing on three major questions:
-
What are the major edaphic and climatic factors explaining observed variations in soil organic C across the basin?
-
Are the likely contrasting stabilisation mechanism patterns hypothesised to operate also consistently related to different SOC physicochemical fraction distributions?
-
How should the contrasting SOC retention mechanisms identified above influence our understanding of the likely responses of the Amazon Basin forests to future changes in climate?
2.1 Study sites and sampling
Soils of 147 1 ha primary forest plots, representing 14 soil orders, were sampled across the Amazon Basin as part of this study (Table 1). These include forests in Brazil, Venezuela, Guyana, French Guyana, Ecuador, Colombia, Peru and Bolivia (Fig. 1).
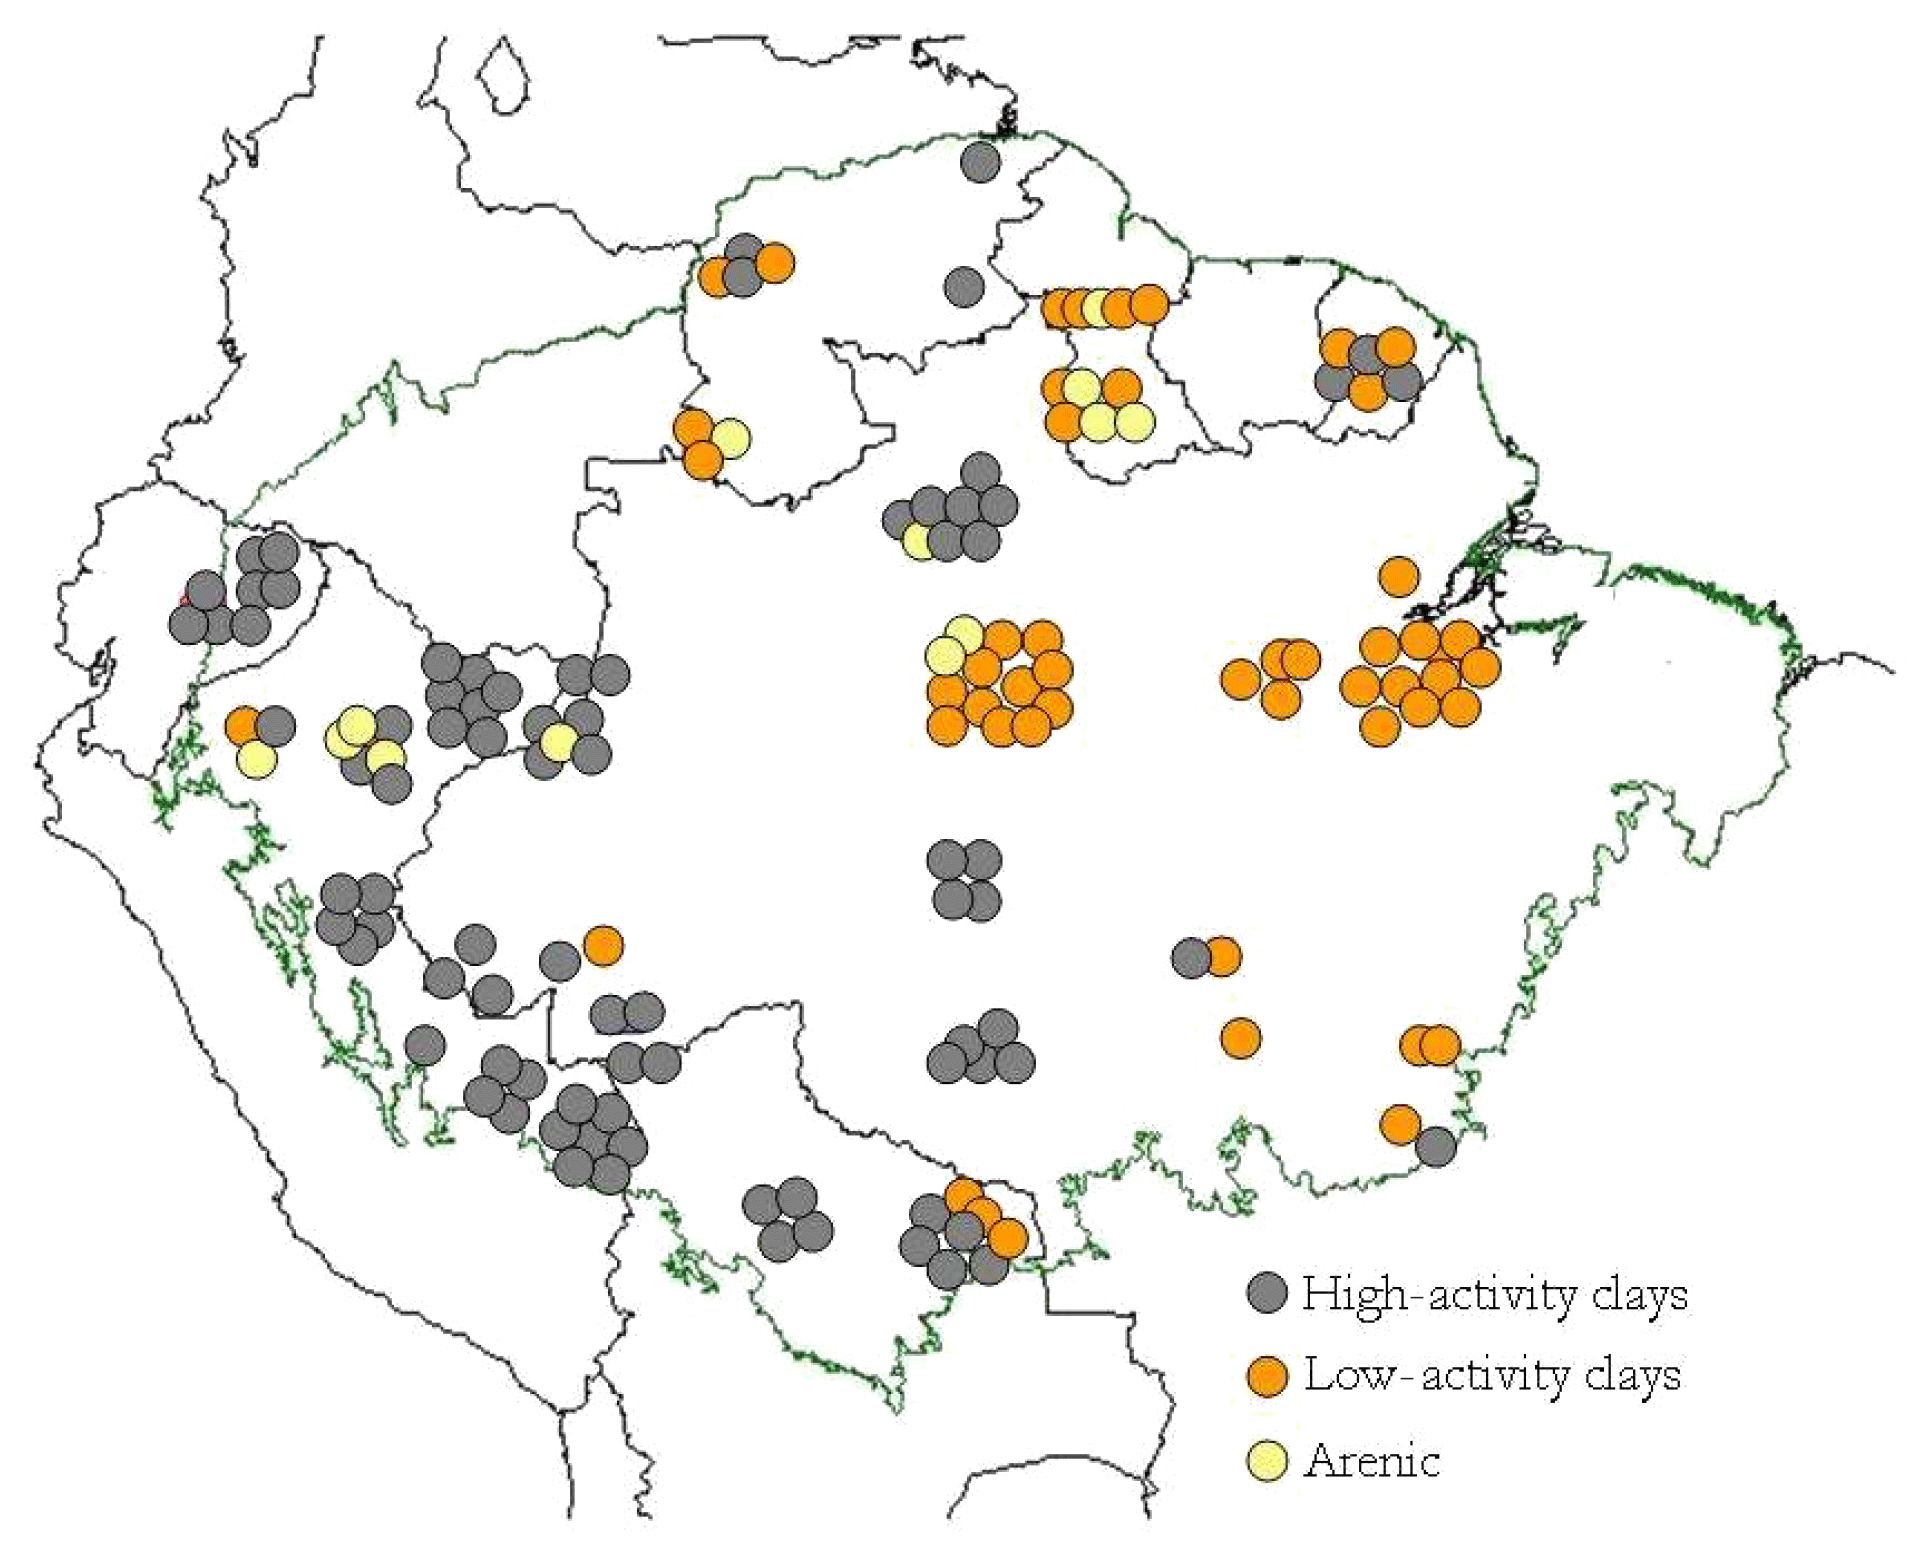
Figure 1Geographic distribution of 147 study sites across the Amazon Basin, according to the different soil groups. Each point is a 1 ha forest inventory permanent plot. Geographical locations have been manipulated in the map to allow visualisation of site clusters at this scale.
Table 1Climate and site details and summary of soil physical and chemical characteristics (0.0–0.3 m). Abbreviations used: TA: mean annual temperature; PA: mean annual precipitation; EV: elevation; ΣB: sum of bases; IE: effective cation exchange capacity; ΣB(R): total reserve bases; Ch: Chlorite; Gi: gibbsite; Go: goethite; He: Haematite; Il: Illite; Ka: kaolinite; Mi: Mica; Mu: Muscovite; Or/K: orthoclase/K-feldspar; Pl: Plagioglase; Sm: Smectite; Albite: Al; Microcline: Mc; ND – not determined. Soils from the arenic group (Arenosols/Podzols) followed by F indicate seasonally flooded white sands. For the mineralogies, blank columns indicate that measurements were not made; *: identification uncertain; 0: none identified. Sites have been numbered and ordered according to their upper-layer (0.0–0.3 m) soil C content as given in Table A1 (Appendix).
Details of soil sampling protocol, laboratory analysis and soil classification can be found in Quesada et al. (2010, 2011), which described a subset of the soils detailed here. For each site at least five soil cores were taken across the 1 ha plot to the depth of 2.0 m, with an additional 2.0 m soil pit also sampled in each plot. Within each soil core, samples were collected over the following standardised depths: 0–0.05, 0.05–0.10, 0.10–0.20, 0.20–0.30, 0.30–0.50, 0.50–1.00, 1.00–1.50 and 1.50–2.00 m. They were collected using an undisturbed soil sampler (Eijkelkamp Agrisearch Equipment BV, Giesbeek, the Netherlands) and/or collected from the pit walls at the same depths. All samples were air dried as soon as possible with roots, detritus, small rocks and particles over 2 mm then removed in the laboratory. Samples, sieved at 2 mm, were used in the laboratory for analysis. Throughout this paper only results for surface soils (0–0.30 m) are reported, which is the layer that hold the bulk of soil C in tropical forest systems (Batjes and Dijkshoorn, 1999).
2.2 Soil classification
Soils were classified according to their Reference Soil Group (RSG), which represents the great order level in the World Reference Base for Soil Resources (IUSS (International Union of Soil Science) Working Group WRB, 2014). Our classification were based on the requisite field and laboratory observations taken following the standard approach from WRB Guidelines for Soil Descriptions (Jahn et al., 2006).
2.3 Laboratory analysis
Soil samples were analysed at different institutions depending on sampling location: Max-Planck Institute für Biogeochemie (MPI), Jena, Germany; Instituto Venezuelano de Investigaciones Cientificas (IVIC), Caracas, Venezuela; or Instituto Nacional de Pesquisas da Amazonia (INPA), Manaus, Brazil. All laboratories were linked through inter-calibration exercises and strictly adhered to the same methodologies and sample standards. For the Venezuelan soils, only cation exchange capacity was measured at IVIC, with all remaining analysis being determined at MPI and INPA. Soil total reserve bases were analysed at INPA and Leeds laboratories (University of Leeds, School of Geography). For samples collected after 2008 (i.e. not included in Quesada et al. 2010) all analyses were performed at INPA.
Chemical analysis
Soil pH was determined in H2O as 1:2.5. Exchangeable cations were determined at soil pH using the silver thiourea method (Ag-TU; Pleysier and Juo, 1980), with the analysis of filtered extracts then done by atomic absorption spectrometry (AAS) at INPA and IVIC or by ICP-OES at MPI. Each sample run was checked and standardised with extracts from the Montana SRM 2710 soil standard reference (National Institute of Standards of Technology, Gaithersburg, MD, USA). Effective cation exchange capacity (IE) was calculated as the sum of [Ca]E + [Mg]E + [K]E + [Na]E + [Al]E, where [X]E represents the exchangeable concentration of each element in mmolc kg−1 soil. Total phosphorus was determined by acid digestion at 360 ∘C using concentrated sulfuric acid followed by H2O2 as described in Tiessen and Moir (1993). In the same acid digestion extract, total concentration for Ca, Mg, K and Na was determined and the weathering index Total Reserve Bases, ΣRB, calculated. This index is based on total cation concentration in the soil and is considered to give a chemical estimation of weatherable minerals (Delvaux et al., 1989; Quesada et al., 2010), with ΣRB equal to [Ca]T+ [Mg]T+ [K] T+ [Na] T, where [X]T represents the total concentration of each element in mmolc kg−1 soil.
Leaf litter lignin estimates were available for 72 of the 147 sites, having been obtained using the acid detergent fibre method (Van Soest, 1963) as part of the studies of Quesada (2008) and Paz (2011).
2.4 Determination of soil organic C and its fractions
Concentrations of total SOC and N were determined in an automated elemental analyser (Nelson and Sommers, 1996; Pella, 1990). All samples were free of carbonates as confirmed by their acidic nature (Table 1). The partitioning of SOC in its different fractions was also performed for a subset of sites (n=30) previously selected by Paz (2011) to account for the large variation in weathering, climate and chemical properties of soils occurring across forest sites in the Amazon Basin. The fractionation was done in compound samples by depth (0–5, 5–10, 10–20 and 20–30 cm) to better represent the soil conditions in the 1 ha sampling plot. The fractionation scheme followed Zimmermann et al. (2007), which yields five different fractions of labile C associated with the clay and silt (C+S), resistant C associated with clay and silt (RC+S), C associated with sand and stable aggregates (S+A), particulate organic matter (POM), and the dissolved organic C (DOC) component. Samples were dispersed using a calibrated ultrasonic probe operating with an output energy of 22 J mL−1. They were subsequently wet sieved to separate < 63 µm particles (C+S) from > 63 µm soil particles (POM and S+A). The entire < 63 µm solution was then centrifuged for 4 min at 1200 rpm. The C+S obtained after centrifugation was oven dried at 40 ∘C for 48 h and subsequently weighed. The RSOC was obtained by incubating 1 g of C+S with 150 mL of sodium hypochlorite 6 % (adjusted to pH 8). After this reaction, the remaining material was washed with distilled water and oven dried at 40 ∘C for 48 h. The labile C+S fraction was determined as the difference of total C associated with clay and silt and the RC+S. The DOC sample was obtained by vacuum filtering a 50 mL aliquot of the total water volume used in the wet sieving (after centrifugation) through a membrane filter of 0.45 µm and C was determined using a TOC analyser. S+A and POM were separated following the procedures described in Wurster et al. (2010) and Saiz et al. (2015). In short, 25 mL of sodium polytungstate solution (1.8 g cm−3, Sometu - Europe™, Berlin, Germany) was added to the > 63 µm dried samples placed in 50 mL centrifuge tubes. Samples were then centrifuged for 15 min at 1800 rpm and left to rest overnight. After this time, samples were left in the freezer for approximately 3 h, after which POM and S+A was separated by washing the frozen supernatant with distilled water. Both fractions were washed with distilled water to remove any residue of polytungstate solution and then dried at 40 ∘C for 48 h. All fractions were analysed in the same way as SOC.
Given that some tropical soils have aggregates that are very strong and resistant to disruption by sonication, the > 63 µm fraction often contains clay aggregates and therefore S+A represents the entire coarse fraction. The recovery of C after fractionation averaged 97.7 %.
2.5 Selective mineral dissolution
Soil samples were extracted for Fe and Al using established standard techniques as described in detail in Van Reeuwijk (2002). In short, replicate samples were shaken for 16 h using dithionite–citrate and Na–pyrophosphate solutions. The extraction with ammonium oxalate–oxalic-acid solution at pH 3 was performed in the dark by shaking for 4 h. All extracts were determined for Fe and Al concentrations in AAS. These methods provide useful quantitative estimates of soil oxide composition (Parfitt and Childs, 1988). The dithionite–citrate solution dissolves all iron oxides, such as goethite, gibbsite, ferrihydrite, halloysite and allophane, but with hematite and goethite only partially dissolved. Although this mineral dissolution method has a broad capacity to estimate Fe and Al in such minerals, it does not differentiate its various crystalline forms or between short-range (amorphous) minerals and crystalline structures. The ammonium oxalate – oxalic acid solution on the other hand, specifically dissolves short-range order minerals such as allophane, imogolite, ferrihydrite, Al–humus complexes, lepidocrocite, Al–vermiculite and Al hydroxy interlayer minerals. Therefore, the difference between the two methods is often used to estimate the amount of crystalline minerals in the soil, viz. (Fed-Feo), while negative values indicate the predominance of short-range minerals. Further interpretation of selective dissolution data according to Parfitt and Childs (1988) is shown in Table 2.
Table 2A guide for interpretation of selective dissolution data following Parfait and Childs (1988).

2.6 Soil physical properties
Soil particle size distribution was determined using the pipette method (Gee and Bauder, 1986) is are reported here as a fraction (ranging from 0 to 1). Soil bulk densities were determined using samples collected inside the soil pits at the same depths of other samples using standard container rings of known volume (Eijkelkamp Agrisearch Equipment BV, Giesbeek, the Netherlands). These were subsequently oven dried at 105 ∘C until constant weight.
2.7 Mineralogy
Bulk soil mineralogical characterisation (less than 2 mm) was attained through X-ray diffractometry (XRD) using a PW1050 unit (Philips Analytical, the Netherlands) attached to an X-ray generator DG2 (Hiltonbrooks Ltd, Crewe, UK). XRD analyses require sample particle size to be very fine in order to obtain adequate statistical representation of the components and their various diffracting crystal planes, as well as to avoid diffraction-related artefacts (Bish and Reynolds, 1989). Therefore, samples were ground with a mortar and pestle using acetone to avoid sample degradation from heat. Powdered samples were then mounted in holders by a back-filling method with the aid of a micro-rugose surface to minimise preferred orientation of the phases present. Samples were continuously scanned from 3 to 70∘ (2θ) Ni-filtered CuKα radiation (λ=1.54185A∘) working at 40 kV and 40 mA. The scanning parameters were 0.020∘ step size and 1.0 s step time. Interpretation and semi-quantitative analysis of the scans were achieved using the Rietveld refinement method built in to the Siroquant software (SIROQUANT; Sietronics Pty Ltd, Canberra, Australia). All samples were analysed at the Facility for Earth and Environmental Analysis at the University of St. Andrews, Scotland, UK.
2.8 Climatic and terrain elevation data
Mean annual temperature (TA) and precipitation (PA) data come from BioClim (https://www.worldclim.org, last access: 13 July 2018) and site elevation (EV) estimates obtained from the Shuttle Radar Topography Mission database (SRTM).
2.9 Statistical analysis
All analyses were carried out using the R statistical platform (R Development Core Team, 2016). In the exploratory data phase, the non-parametric Kendall τ was used to quantify the strength of bivariate associations with the aid of the correlation function available within the agricolae package (de Mendiburu, 2013). Multivariate ordinary least squares (OLS) regression was then performed relating SOC to other soil properties with candidate variables chosen with reference to the Kendall rank correlations matrices, after which there was an exhaustive exploration of regression models taking into account the a priori hypothesis outlined in the Introduction. As a check to ensure that we had not overlooked any of the measured variables as important potential determinants of [C] regression models, we also then checked for the minimum Akaike information criterion (AIC) regression models using the dredge function available within MuMIn (Bartoń, 2013) and used variance inflation factor (VIF) to account for possible collinearity in AIC selected models. Principal coordinates of soil mineralogical compositions were undertaken using the princomp function after first transforming the data using the acomp function available within the compositions package (van den Boogaart and Tolosana-Delgado, 2008). Kruskal–Wallis multiple comparison tests (Siegel and Castellan Jr., 1998) were undertaken using the kruskalmc command available within the pgirmess package (Giraudoux, 2013).
3.1 Clustering of soils types
The distribution of the sampled sites across the Amazon Basin is shown in Figure 1, with the soils sampled divided a priori into three “clusters” according to their World Resource Base RSG classification (IUSS, 2014): (1) the typically more strongly weathered Acrisol and Ferralsol soil types dominated by low-activity clays (LACs); (2) other less weathered soils types (the Alisol, Cambisol Fluvisol, Gleysol, Leptosol, Lixisol, Luvisol, Plinthosol, Regosol and Umbrisol soil groups) typically dominated by high-activity clays (HACs); (3) exceptionally sandy soils (Arenosols and Podzols) which we here refer to as “arenic” soil types. From Fig. 1 the majority of the LAC soils sampled come from the eastern area of the basin, with the majority of the HAC soils found closer to the Andes Cordillera. Arenic soils are less abundant than either LAC or HAC soils and were sampled in both the eastern and western portions of the basin.
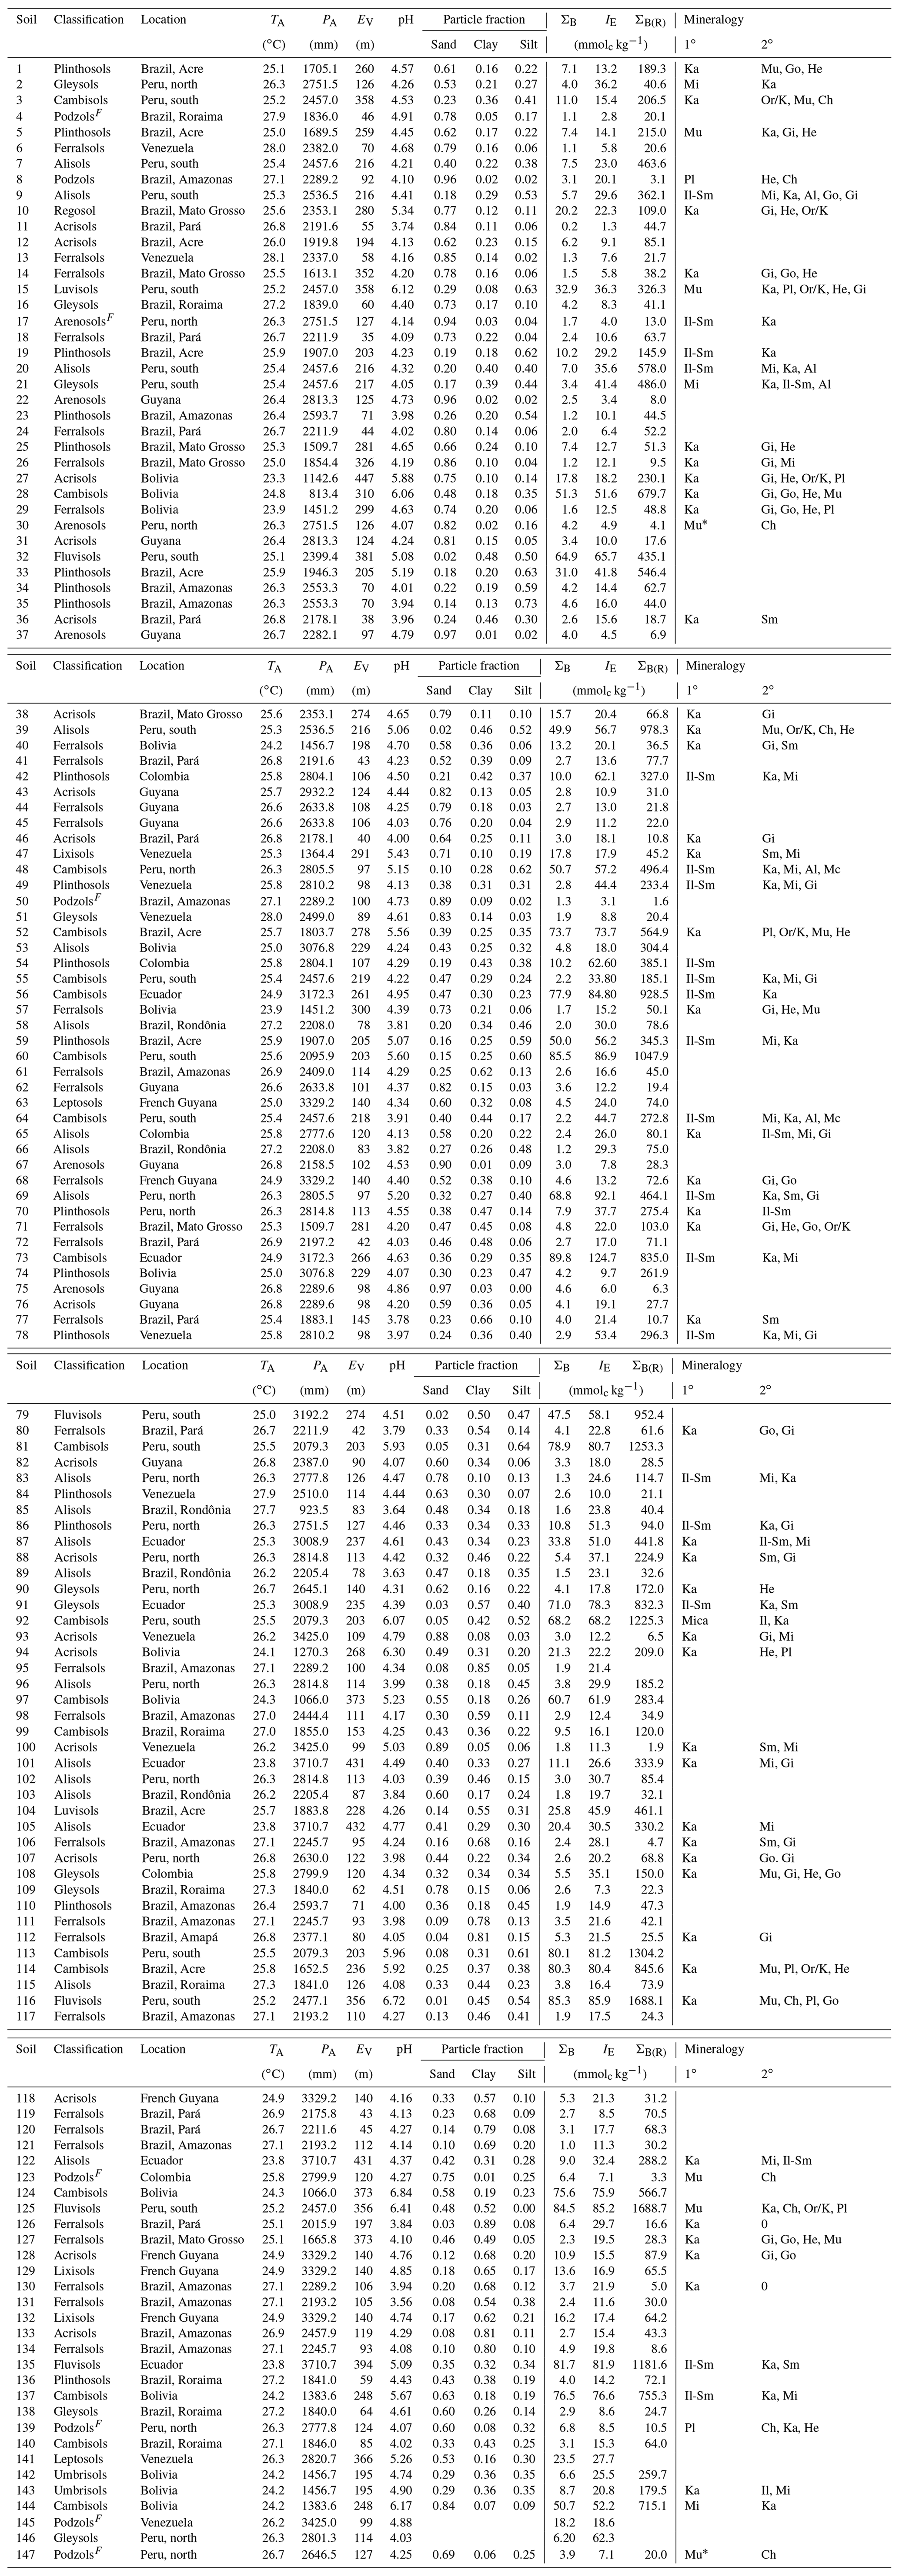
The contrasting chemistry of the three soil groups is shown in Fig. 2, where soil effective cation exchange capacity, IE, is plotted as a function of soil clay fraction, Φclay (0 to 0.3 m depth), with different symbols for each RSG and with the contrasting IE vs. Φclay domains indicated by different background colours. This shows a minimal overlap between the arenic soil types and LAC and HAC soil types, with some of the former having relatively high IE despite their very low clay content. There is some overlap between the LAC and HAC soil clusters at intermediate IE and/or Φclay, though with it also being clear that none of the sampled LAC soils were characterised by a high IE and that none of the HAC soils had a very high or very low clay content.
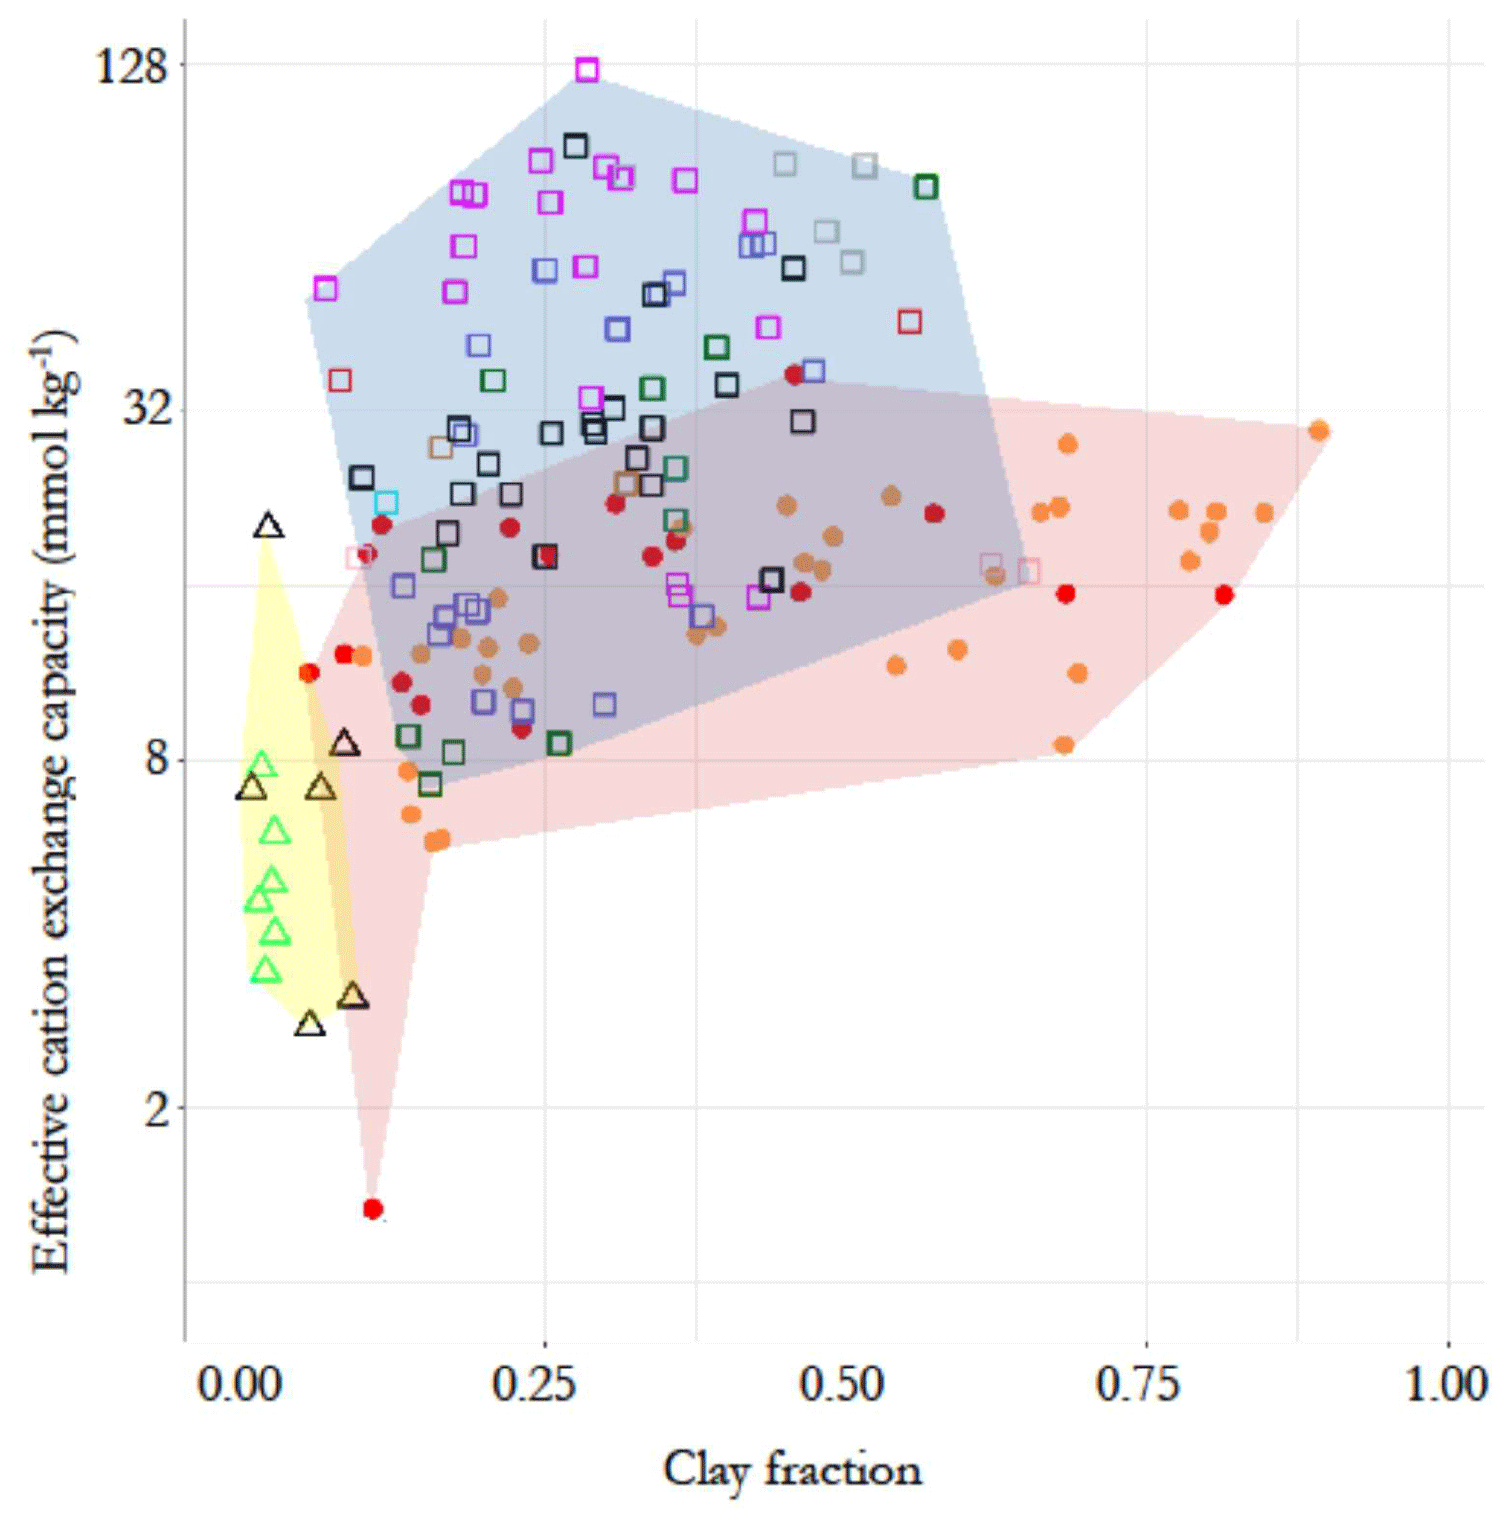
Figure 2Contrasting chemical characteristics of the three soil groups, evidenced by the relationship between top-soil clay fraction and effective cation exchange capacity (0–30 cm). Triangles with yellow background represent the arenic soil group, consisting of Arenosols (green) and Podzols (black). Filled circles with pink background represent the low-activity clay soils (LACs) which consists of Ferralsols (yellow) and Acrisols (red). Soils with high-activity clay (HAC) are shown as open squares with light blue background. They are the Alisol (black), Cambisol (pink), Fluvisol (grey), Gleysol (green), Leptosol (brown), Lixisol (red), Luvisol (purple), Plinthosol (blue), Regosol (cyan) and Umbrisol (light green) soil groups.
3.2 Mineralogical analysis
Distinctions between the LAC and HAC clusters are further illustrated in Fig. 3, where for a subset of the main dataset, mineralogical analysis of the bulk soil had been undertaken using X-ray diffraction (XRD) spectroscopy and for which the results of a principal components analysis (PCA) ordination are shown in Fig. 3a. Here it can be seen that the first PCA axis (PCA1) serves to primarily differentiate the soils according to their clay activity with the 1:1 clay minerals gibbsite, goethite and kaolinite, all with large negative weightings on the PCA1 axis and with the 2:1 potassium feldspar, plagioclase, smectite–illite and chlorite minerals all with positive weightings. Accordingly (although mineralogy is not used in the RSG classification system), almost all sites within our RSG-based LAC cluster are located with negative scores along the PCA1 axis and with almost all HAC soils with positive values. All four arenic soils analysed had high PCA scores.
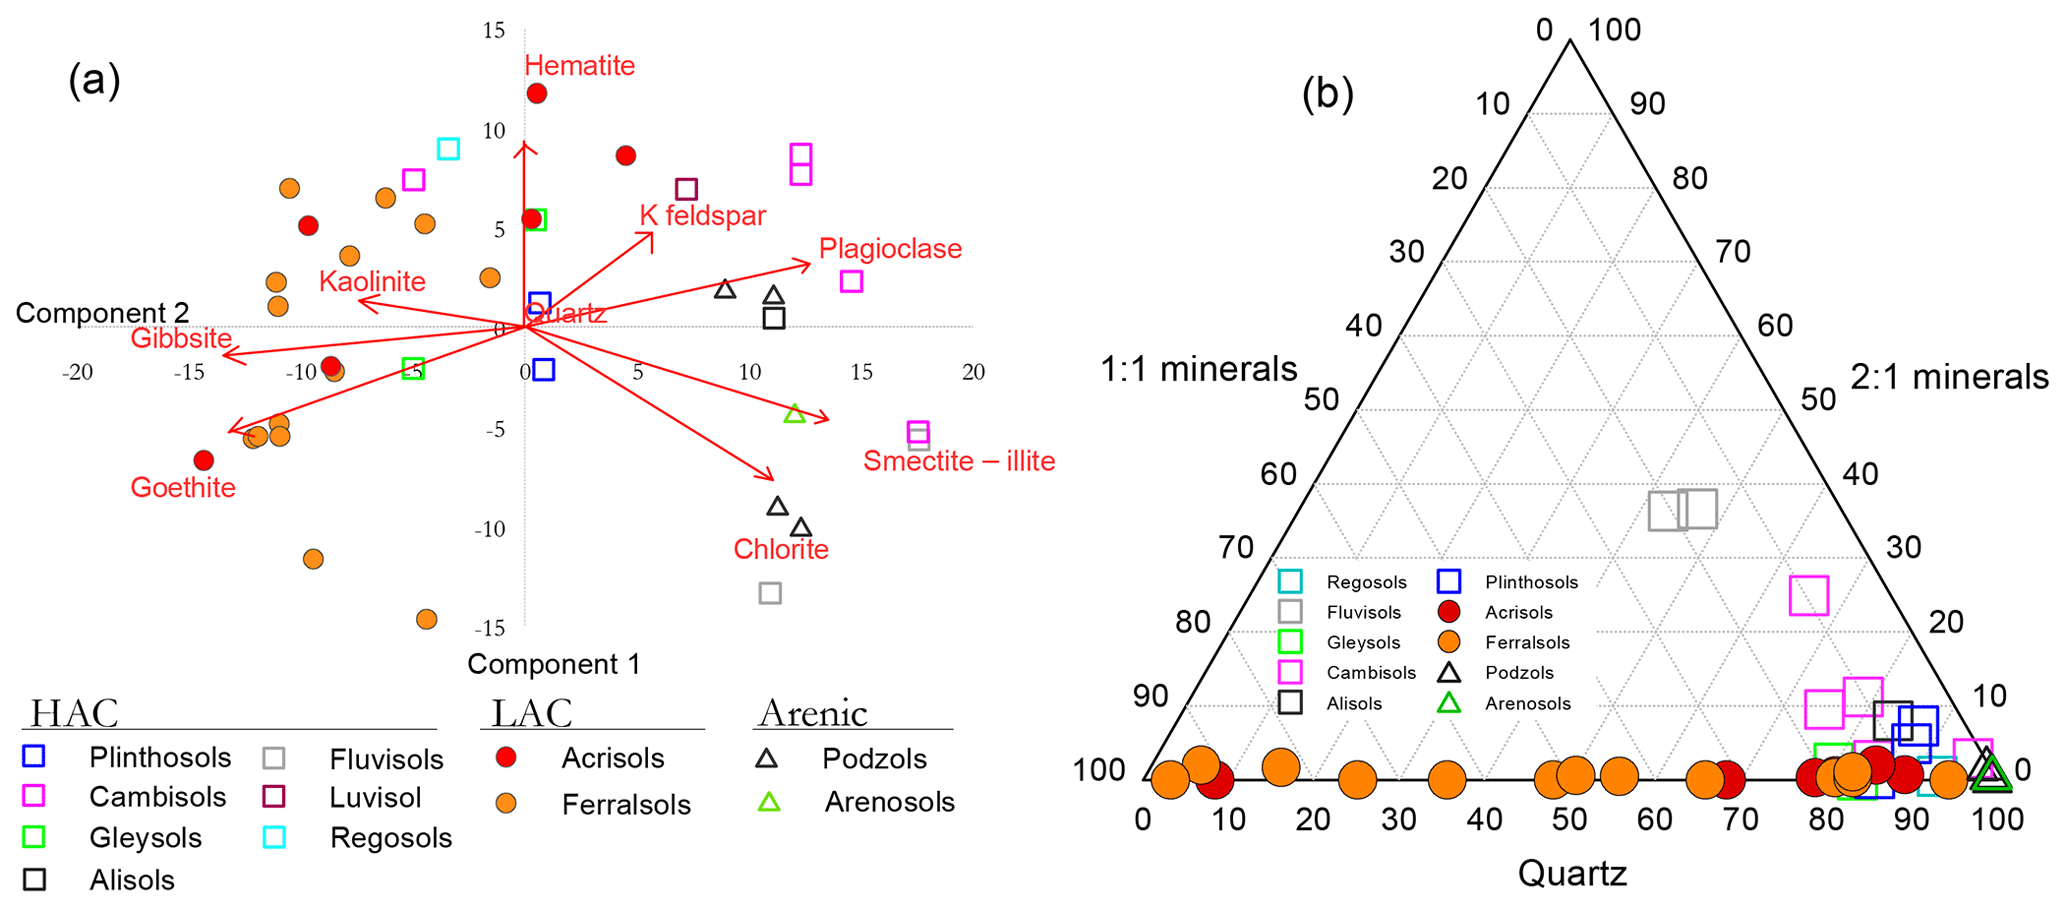
Figure 3Contrasting mineralogical characteristics of the different soils in this study. (a) Principal components analysis (PCA) ordination on semi-quantitative X-ray diffraction (XRD) spectroscopy data. (b) Compositional plot showing contrasting relationships between the 1:1 and 2:1 minerals considered along with variations in quartz content.
The contrast between the three soil groups is further shown in Fig. 3b where, shown as a compositional plot, the contrasting relationships between the 1:1 and 2:1 minerals are considered along with variations in quartz content. This diagram emphasises the almost total lack of 2:1 minerals found with the LAC soil cluster, with these soils essentially being a mixture of 1:1 minerals (primarily kaolinite: see Table 1) and quartz in varying proportions. On the other hand, the HAC soils are all characterised by a high quartz content and with less than 20 % 1:1 minerals present. Also of note, two Cambisols, one Regosol and one Gleysol had 2:1 minerals constituting less than 1 % in their fine-earth fraction. Not unexpectedly, having a quartz content of > 97 %, all four arenic soils are found clustered in the bottom right-hand corner of the compositional triangle.
3.3 Univariate and bivariate comparisons
Using data averaged over the upper 0.3 m of the sampled soil profiles, Fig. 4 shows as boxplots the contrasts between our three a priori soil groups in terms of the following: carbon density [C]; total reserve bases ΣRB; effective cation exchange capacity IE; fractional sand, silt and clay contents (Φsand, Φsilt and Φclay); and concentrations of dithionite and oxalate extractable aluminium and iron, viz. [Al]d, [Al]o, [Fe]d and [Fe]o (original data available in Table 1 and Appendix Table A1). This shows that, although there was no significant difference between the three clusters in [C] (Fig. 4a; Kruskal–Wallis test; p>0.05), there were significant differences in the underlying chemistry at p<0.05 not only between the arenic soil cluster and both the LAC and HAC clusters for ΣRB (Fig. 4b), IE, (Fig. 4c), [Al]d (Fig. 4d), [Al]o (Fig. 4e), [Fe]d (Fig. 4f) and [Fe]o (Fig. 4g) but also with HAC soils with higher ΣRB, IE , [Fe]d and [Fe]o than the soils in the LAC cluster (p<0.05). For pH, the situation was more complicated, with the HAC soils having higher values than the LAC soils (p<0.05) but showing no difference between the arenic soils and either the LAC or HAC soils. Despite there being many differences in soil properties significant at p<0.05 or better (non-parametric Kruskal–Wallis test), considerable overlap existed in LAC and HAC for all seven soil chemical properties presented in Fig. 4.

Figure 4Contrasts between the three soil clusters for selected variables. Statistical differences are given through the non-parametric Kruskal–Wallis test. (a) SOC concentration, (b) total reserve bases, (c) effective cation exchange capacity, (d) soil pH, (e) dithionite–citrate extractable Al, (f) Alo oxalate extractable Al, (g) Fed dithionite–citrate extractable Fe, (h) oxalate extractable Fe, (i) sand fraction, (j) clay fraction and (k) silt fraction.
In terms of soil texture, as would reasonably be expected, Φsand was significantly higher at p<0.05 for the arenic versus LAC and/or HAC clusters (Fig. 4i). As would be expected, we also observed significantly lower Φclay for the arenic soils (p>0.05, Fig. 4j). On the other hand, there was no difference between Φsilt for the arenic vs. LAC soils, both of which, in turn, had a significantly lower Φsilt than the soils of the HAC cluster (p<0.05; Fig. 4k). As is also evident from Fig. 2, there was much more variation in Φclay for the LAC soils compared to the HAC soils, with Φclay ranging from 0.05 to 0.89 and 0.07 to 0.57 for LAC and HAC respectively.
Using Kendall's τ as a non-parametric measure of association, correlations between a wide range of soil and climate properties potentially involved in differences in soil carbon storage are shown in Table 3. This takes the form of four one-sided correlation matrices, viz. one half-triangle for each of the arenic, LAC and HAC clusters as well as for the (combined) dataset as a whole. Here, with n>30 for the LAC and HAC clusters we have indicated in bold all cases where τ>0.30 for these two groupings (as well as the combined dataset) with this associating roughly with the probability of Type-II error being less than 0.05. For the arenic soil cluster with n=13 the equivalent value is τ>0.52 and where one or more of the four groupings has p>0.05, this has been indicated for all four matrices using italicised characters to help cross-referencing across the four diagonal matrices.
Table 3Kendall's τ correlations between a wide range of soil and climate properties potentially involved in differences in soil carbon storage. Four one-sided correlation matrices are shown, one for each of the arenic, LAC and HAC clusters as well as for the (combined) dataset as a whole. Here, with n>30 for the LAC and HAC clusters we have indicated in bold all cases where τ > 0.30 for these two groupings (as well as the combined dataset) with this associating roughly with the probability of Type-II error being less than 0.05. For the arenic soil cluster with n=13 the equivalent value is τ> 0.52, and we have indicated all cases where one or more of the four groupings has p>0.05, using italicised characters to help cross-referencing across the four diagonal matrices.
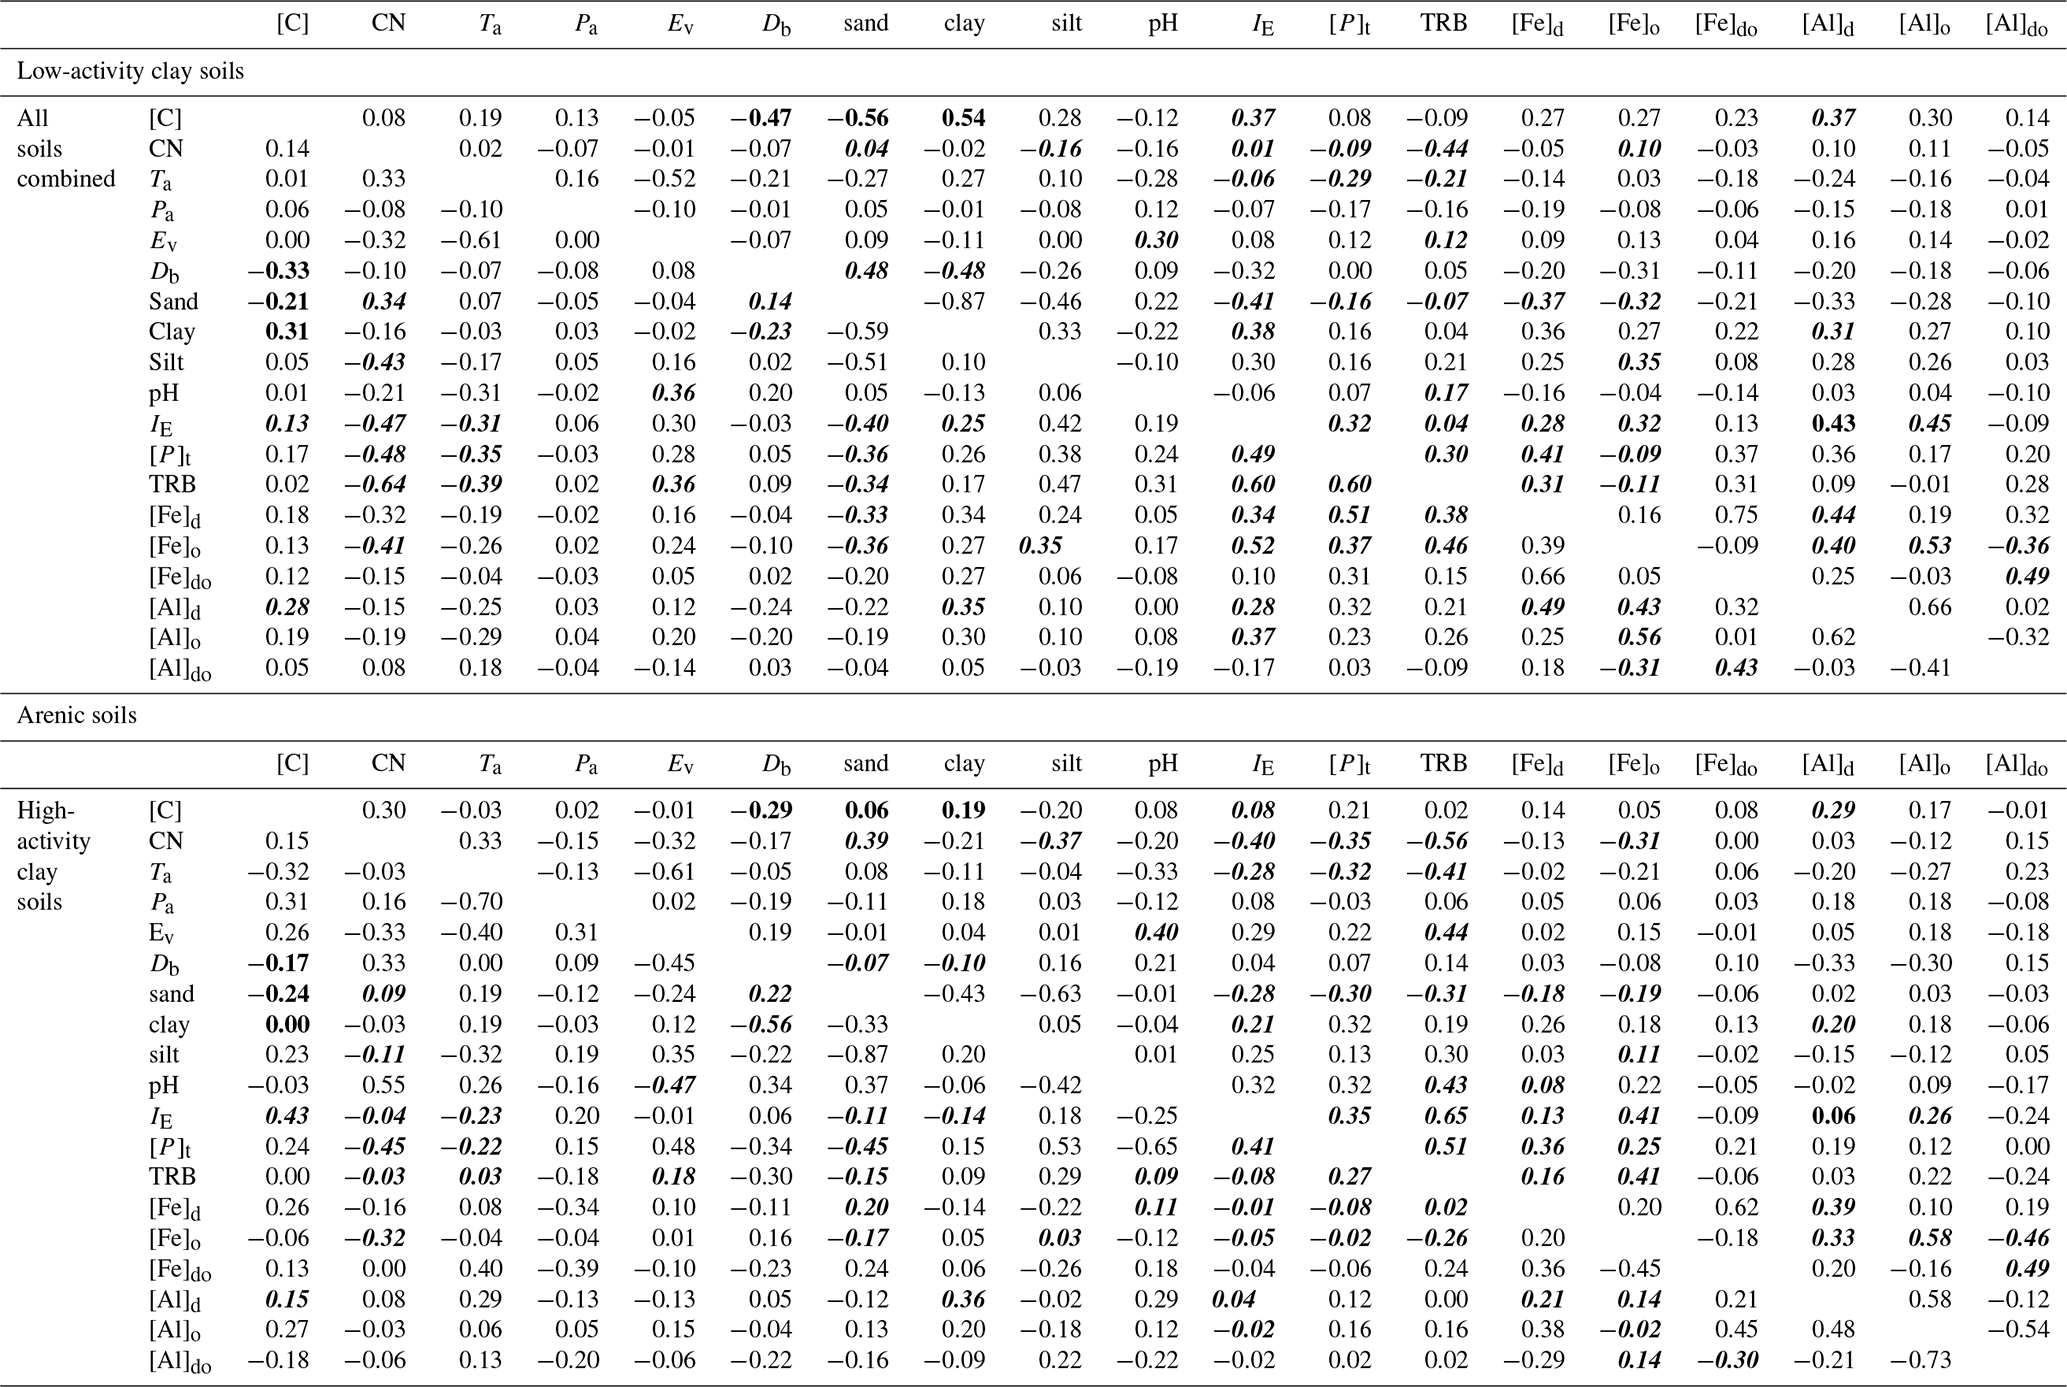
Table 3 shows that, whilst there are many correlations which are significant at p=0.05 or better, in only a few cases were there significant correlations found for the same bivariate combinations in two or more of the three soil clusters and/or when the three clusters are considered together. For example, although there is clear association between soil texture and soil carbon density for the LAC soils ( and τ=0.54 for Φsand and Φclay respectively), this is not the case for the HAC soils (τ=0.06 and τ=0.19), and the association is also much less clear for the arenic grouping ( and ). Consequently, when all three soil clusters are considered together we find τ of only −0.21 and 0.31 for Φsand and Φclay. That is to say, when all soils are considered together there is much weaker association between soil carbon concentration and soil texture than when LAC soils are considered on their own. This is also the case for the relationship between [C] and soil bulk density, Db, for which we find for LAC soils but markedly lower values for the HAC and arenic soils ( and respectively), as well as for the combined dataset ().
In a similar vein, although a high cation exchange capacity (IE) is clearly associated with a high [C] for LAC soils (τ=0.37) and perhaps the arenic soils as well (τ=0.43), for the HAC soils we find a τ of only −0.08 for the [C] vs. IE. Not surprisingly then, for the dataset as a whole τ=0.13 for the IE vs. [C] correlation.
On the other hand (simple physically based bivariate correlations such as Ta vs. Ev aside) there are cases where the strength of the bivariate associations seems to be consistent across all three soil groups. For example, taking the relationship between total phosphorus, [P]t, and mean annual air temperature, Ta, shows , and for the LAC, HAC and arenic soils respectively and with the combined dataset yielding . A second example is the relationship between dithionite extractable aluminium [Al]d and Φclay for which we find τ=0.31 for LAC soils, τ=0.20 for HAC soils and τ= 0.36 for arenic soils, with τ=0.35 for the dataset as a whole. Although we found many correlations between the variation oxalate and dithionite extraction metrics for Fe and Al, it was only [Al]d that, on its own, showed any marked association with [C], with this being for the LAC soils (τ=0.37). However, we do also note that τ=0.29 for the HAC soils and τ=0.28 for the dataset as a whole.
Also of note are the many cases where there are reasonably high τ values found for both the LAC and HAC soils, but not for the arenic ones: for example in the correlations between total reserve bases, ΣB, and organic matter CN (carbon–nitrogen) ratio for which we observe for LAC soils and for HAC soils, but with a value of only for the soils in the arenic cluster.
3.4 Carbon and soil texture associations
With a high τ observed for several [C] vs. soil texture relationships (Sect. 3.3), the correlations between soil carbon content and Φclay are shown in Fig. 5, with a separate panel used for each of the three soil clusters and with each panel having different ranges for both the x and y ordinates. For the LAC soils (Fig. 5a) a strong linear relationship exists (r2=0.58), with there being little apparent difference between the Ferralsol and Acrisol RSGs. But when the LAC OLS regression line is repeated again within the arenic soil group [C] vs. Φclay graph of Fig. 5b (for which we also note that the variability in Φclay is only 1∕10 of that for Fig. 5a, with [C] being 4 times larger) it is clear not only that does soil clay content exert little or any control over [C] for these sandy soils, but also that many of the Podzols have [C] well in excess of even the highest clay content LAC soils. With the LAC OLS regression line again repeated for the HAC soils in Fig. 5c it is similarly clear that many of the HAC soils have [C] appreciably higher than is expected on the basis of the highly significant LAC [C] vs. Φclay relationship, but with no detectable [C] vs. Φclay correlation when considered on their own (r2=0.01).
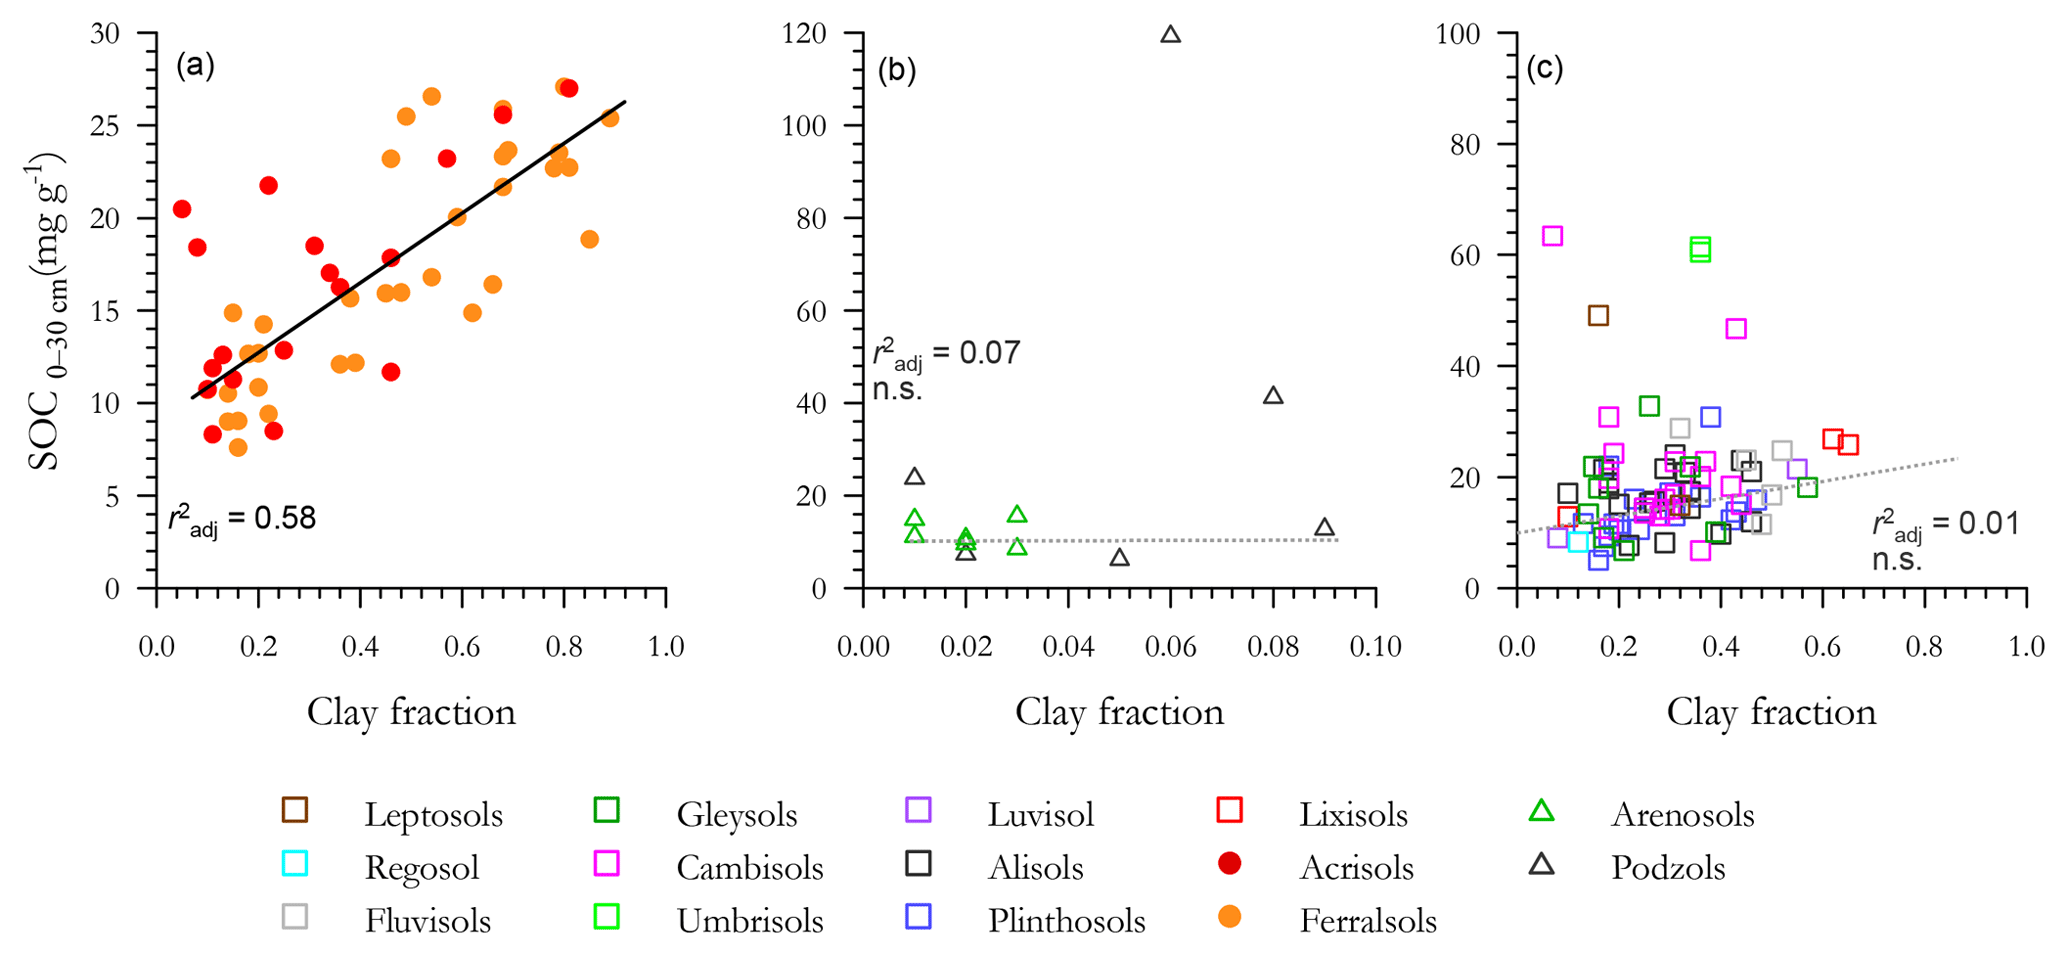
Figure 5Associations between soil organic C and clay fraction for the three soil groups. (a) Low-activity clay (LAC), (b) arenic soils and (c) soils containing high-activity clays (HACs). Only LAC shows a significant regression. Non-significant regressions in arenic and HAC soils are shown as dotted lines.
Table 4Summary of OLS regression coefficients for soil organic carbon and texture associations.
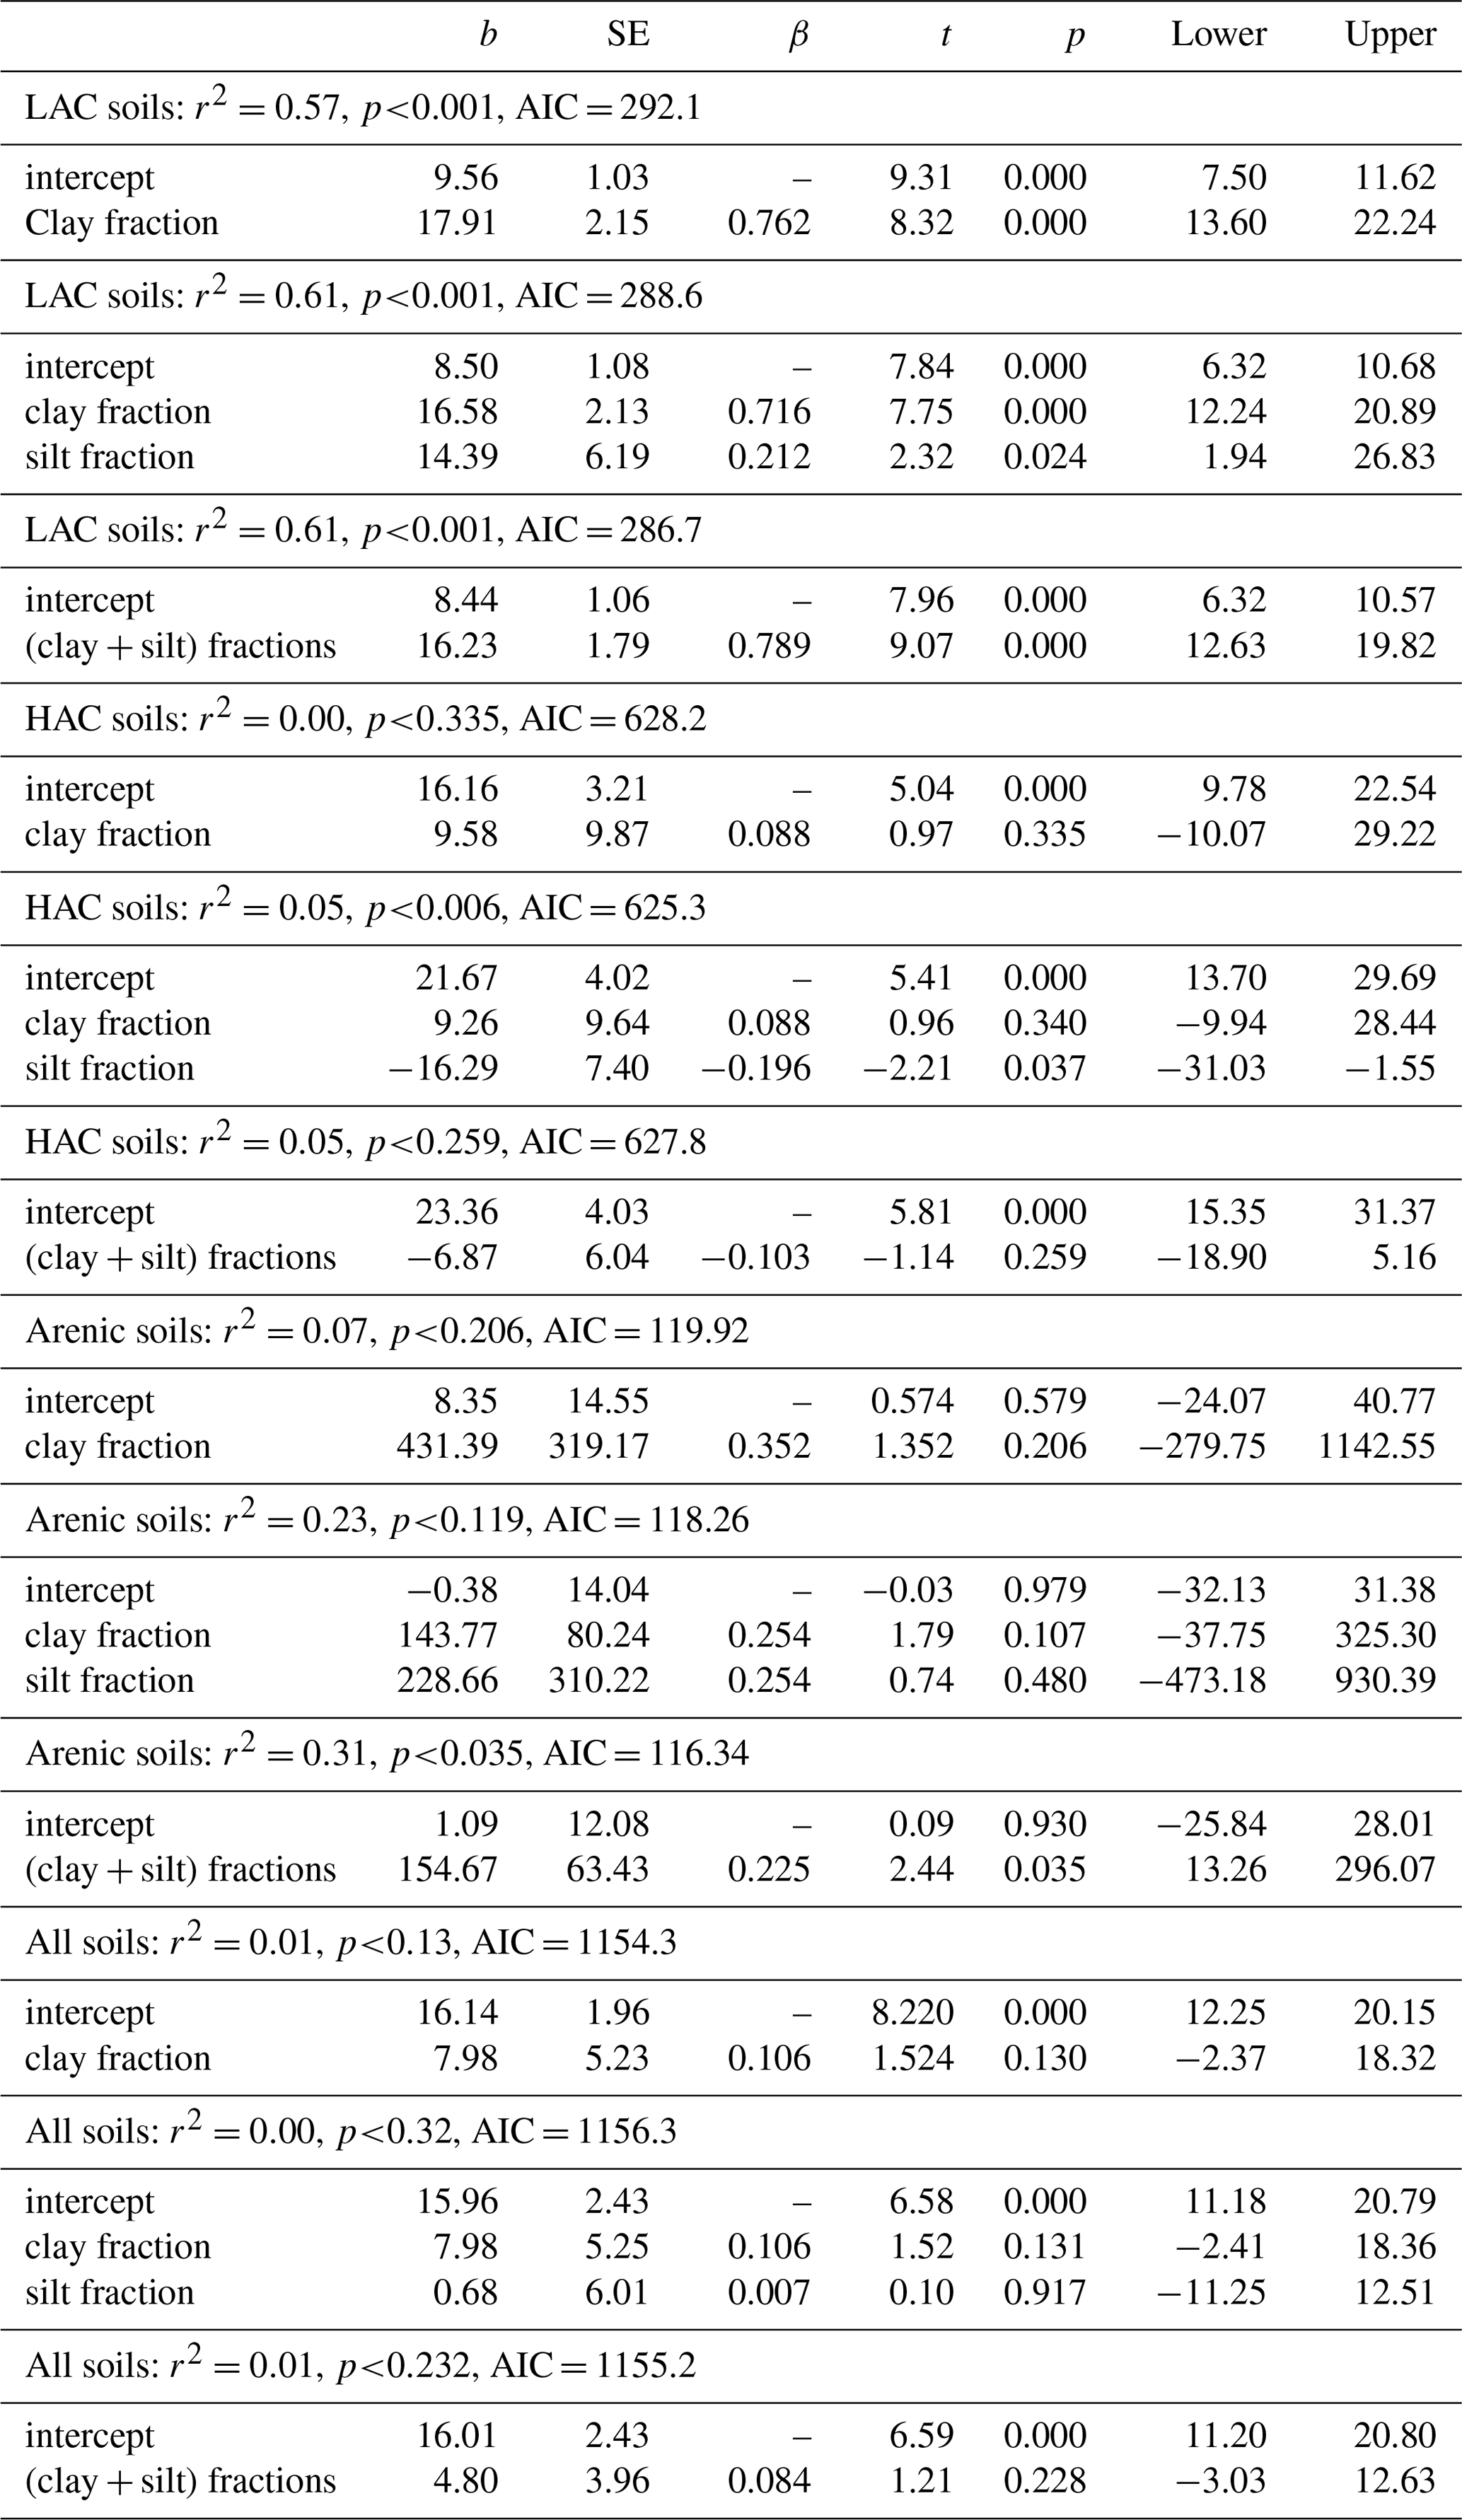
The underlying OLS regressions of Fig. 5 are outlined in more detail in Table 4. Here, as well as providing a [C] vs. Φclay OLS regression summary for the combined dataset as a whole, we also examined the effects of including Φsilt in the [C] vs. Φclay regression models: this being either as an additional term or as part of a single (Φsilt+Φclay) predictor – the latter, of course, also being equal to [1−Φsand]. Comparing the equations for LAC, this analysis shows that the addition of the Φsilt term to the [C] vs. Φclay regression increases the r2 from 0.57 (Table 4a) to 0.61 (Model b) with a change in Akaike's information criterion (ΔAIC) of −3.9 and with the coefficients for both terms having very similar slopes, viz. 16.6±2.1 g C kg−1 clay and 14.4±6.2 g C kg−1 silt. For these LAC soils, taking silt and clay together as the one soil texture metric (Table 4c) yields a similar r2 with an intermediate slope of 16.2±1.8 g C kg−1(clay + silt).
Despite the strong relationships found for the LAC soils for both Φclay and Φsilt, no correlation was evident for the HAC soils and, of the three models tested, none had a r2 greater than 0.05 (Table 4d–f). For the arenic soils, the addition of Φsilt term to a simple [C] vs. Φclay model led to a ΔAIC of only −1.7 (compare equations of Table 4g and h). Nevertheless, where a summation term (Φclay+Φsilt) was tested as a single predictor variable this resulted in a marked improvement over and above the [C] vs. Φclay relationship with a ΔAIC of −3.6 and r2 of 0.31 (Table 4i). It is worth noting that Table 4i shows that the fitted slope for the arenic soils was 155±63 g C kg−1 (clay + silt), a value nearly 10 times that found for the LAC soils (Table 4c). When all three soils groupings were considered together there was no significant relationship between [C] and Φclay, this being the case for either with Φclay considered on its own, or for Φclay considered in conjunction with Φsilt, and with all three models tested having r2≤0.01 and p>0.13 (Table 4j–l).
3.5 Soil carbon chemical and mineralogical associations
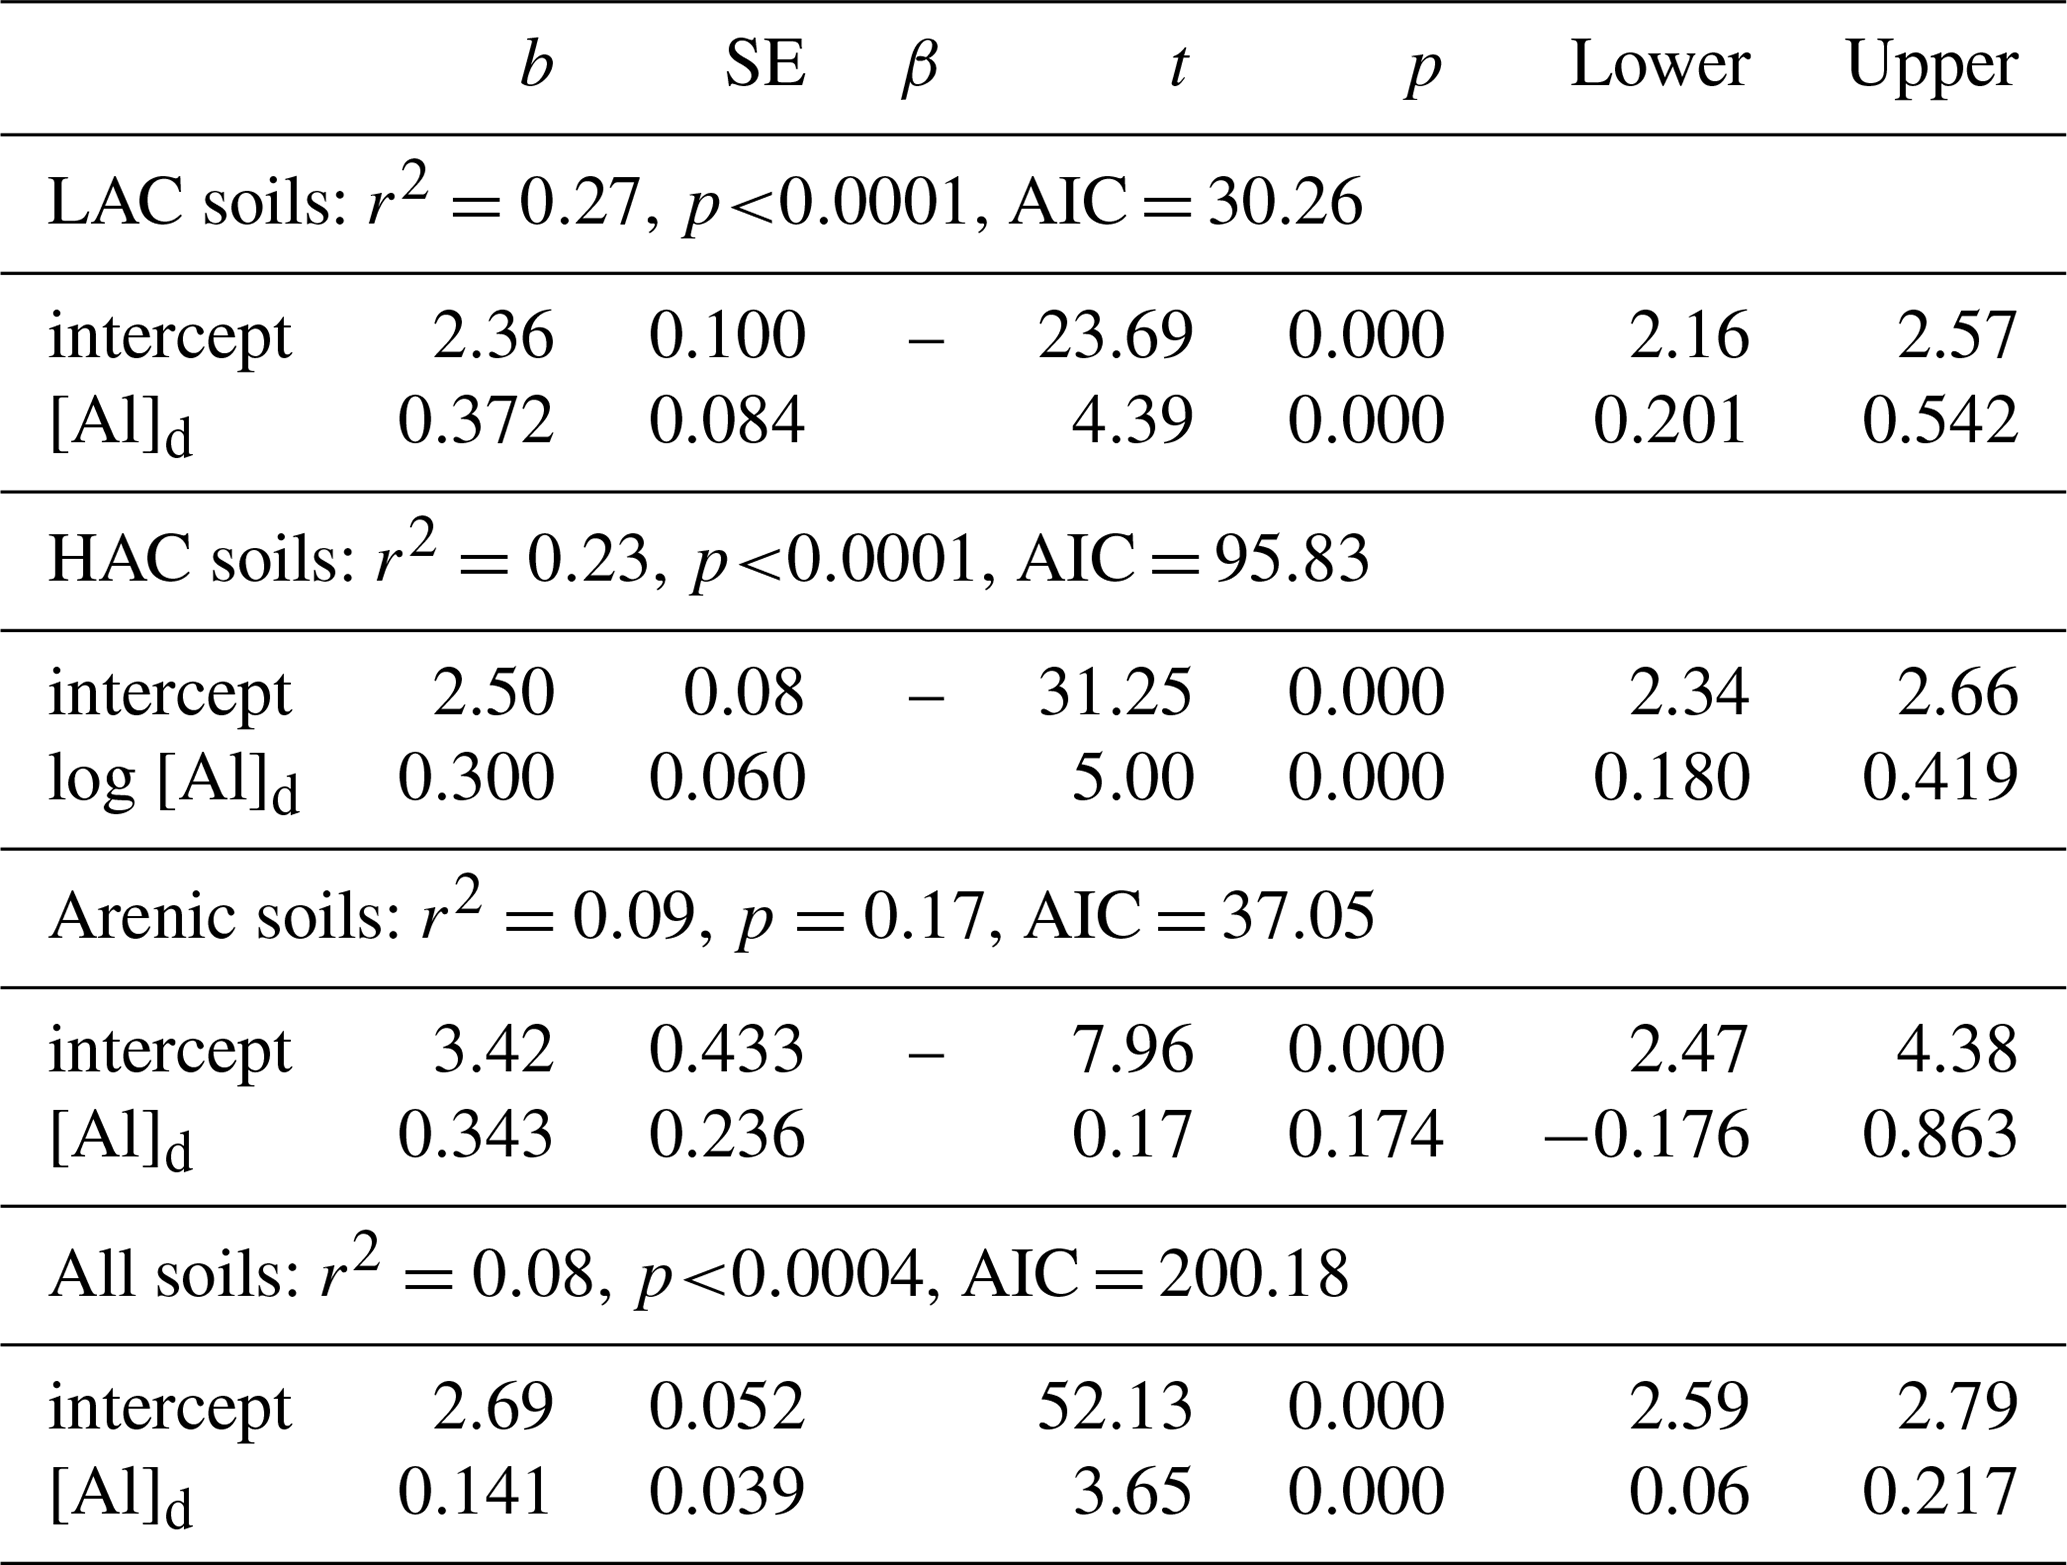
As already noted in Sect. 3.1, of the many strong correlations between the aluminium and iron oxide measured and soil carbon concentration, one of the strongest and the most consistent across the three soil groups was the [C] vs. Ald relationship, and this relationship is shown for all three soil groupings in Fig. 6 (log–log scale) with the appropriate regression coefficients shown in Table 5 (models m to o). Reasonably strong relationships were found between [C] and Ald for both the LAC (Fig. 6; r2=0.27, p<0.0001) and HAC soils (Fig. 6c; r2=0.23, p<0.0001), but not for the arenic grouping (Fig. 6b; r2=0.09 p>0.17). Here direct comparison with the soil texture models of Table 4 according to the AIC values is confounded by slightly different datasets for the HAC soils (due to Ald only having been determined for 77 of the 83 HAC soils), with the relationships examined here being log–log as opposed to linear. Nevertheless, the very different r2 between the two model types (with r2=0.27 much lower for the [C] vs. Ald relationship than for any of the [C] vs. soil texture models for the LAC soils, for which r2>0.57, and with this being the other way around for the HAC soils – r2=0.23 for the [C] vs. Ald relationship but none of the soil texture models have r2>0.05) suggests that for the HAC soils Ald is a much better predictor of [C] than soil texture. In addition, simple soil texture metrics were the better predictors for the LAC soils.
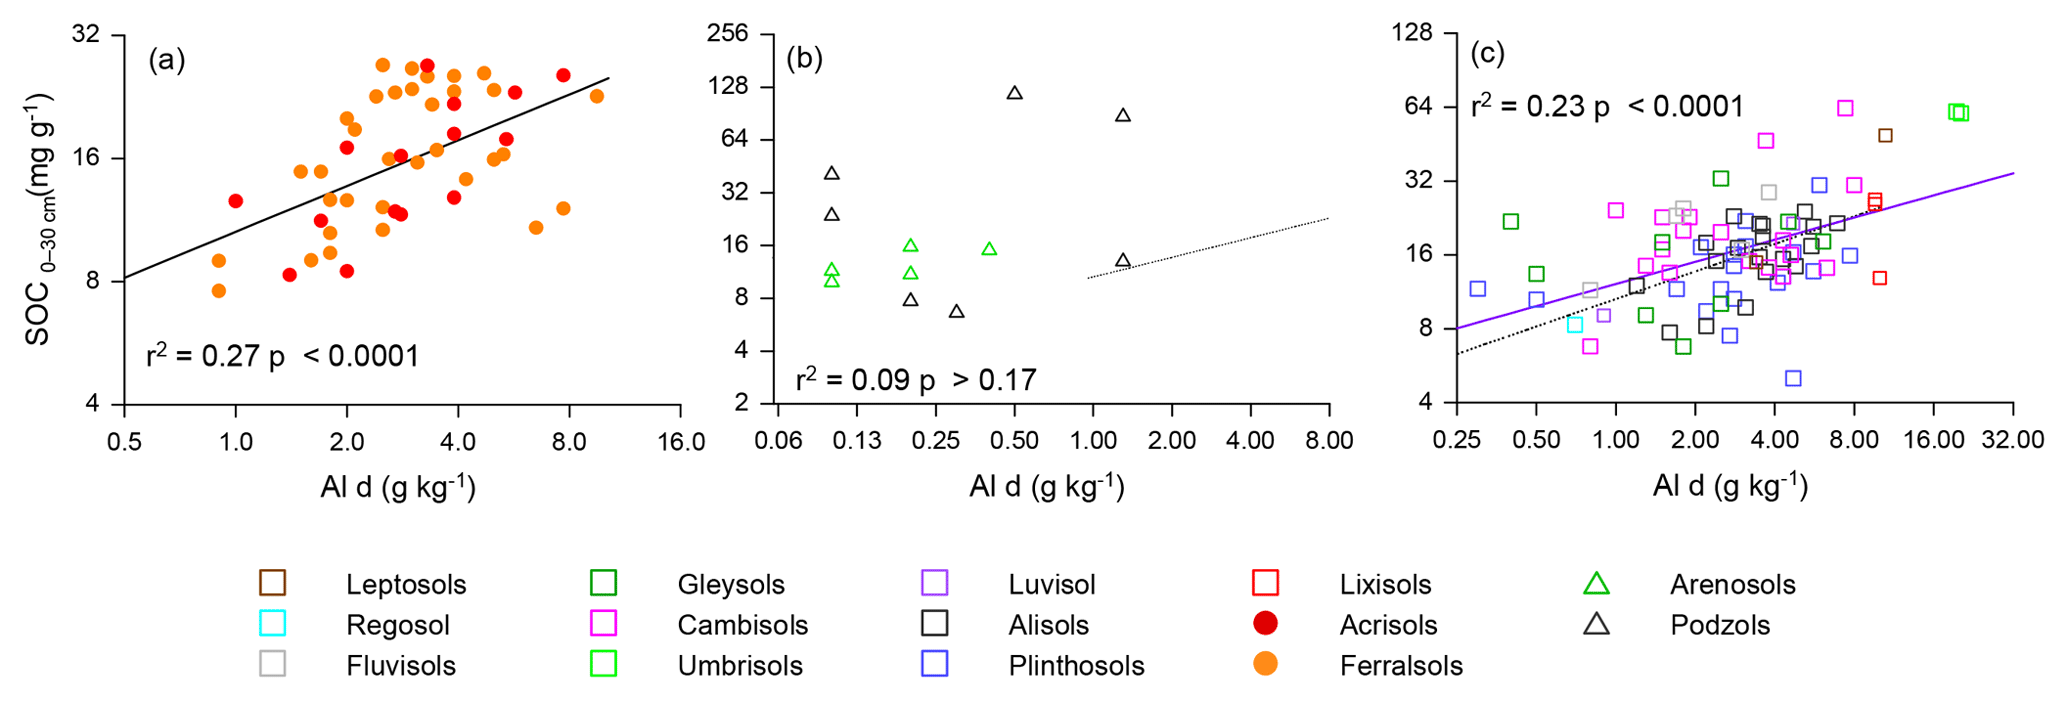
Figure 6The association between soil organic C and dithionite extractable Al (Ald) for the studied soils. The regression line for LAC soils (a) is repeated as a dotted line in (b) (arenic) and (c) (HAC) for comparison.
Table 5Summary of OLS regression coefficients for soil organic carbon and dithionite extractable Al.
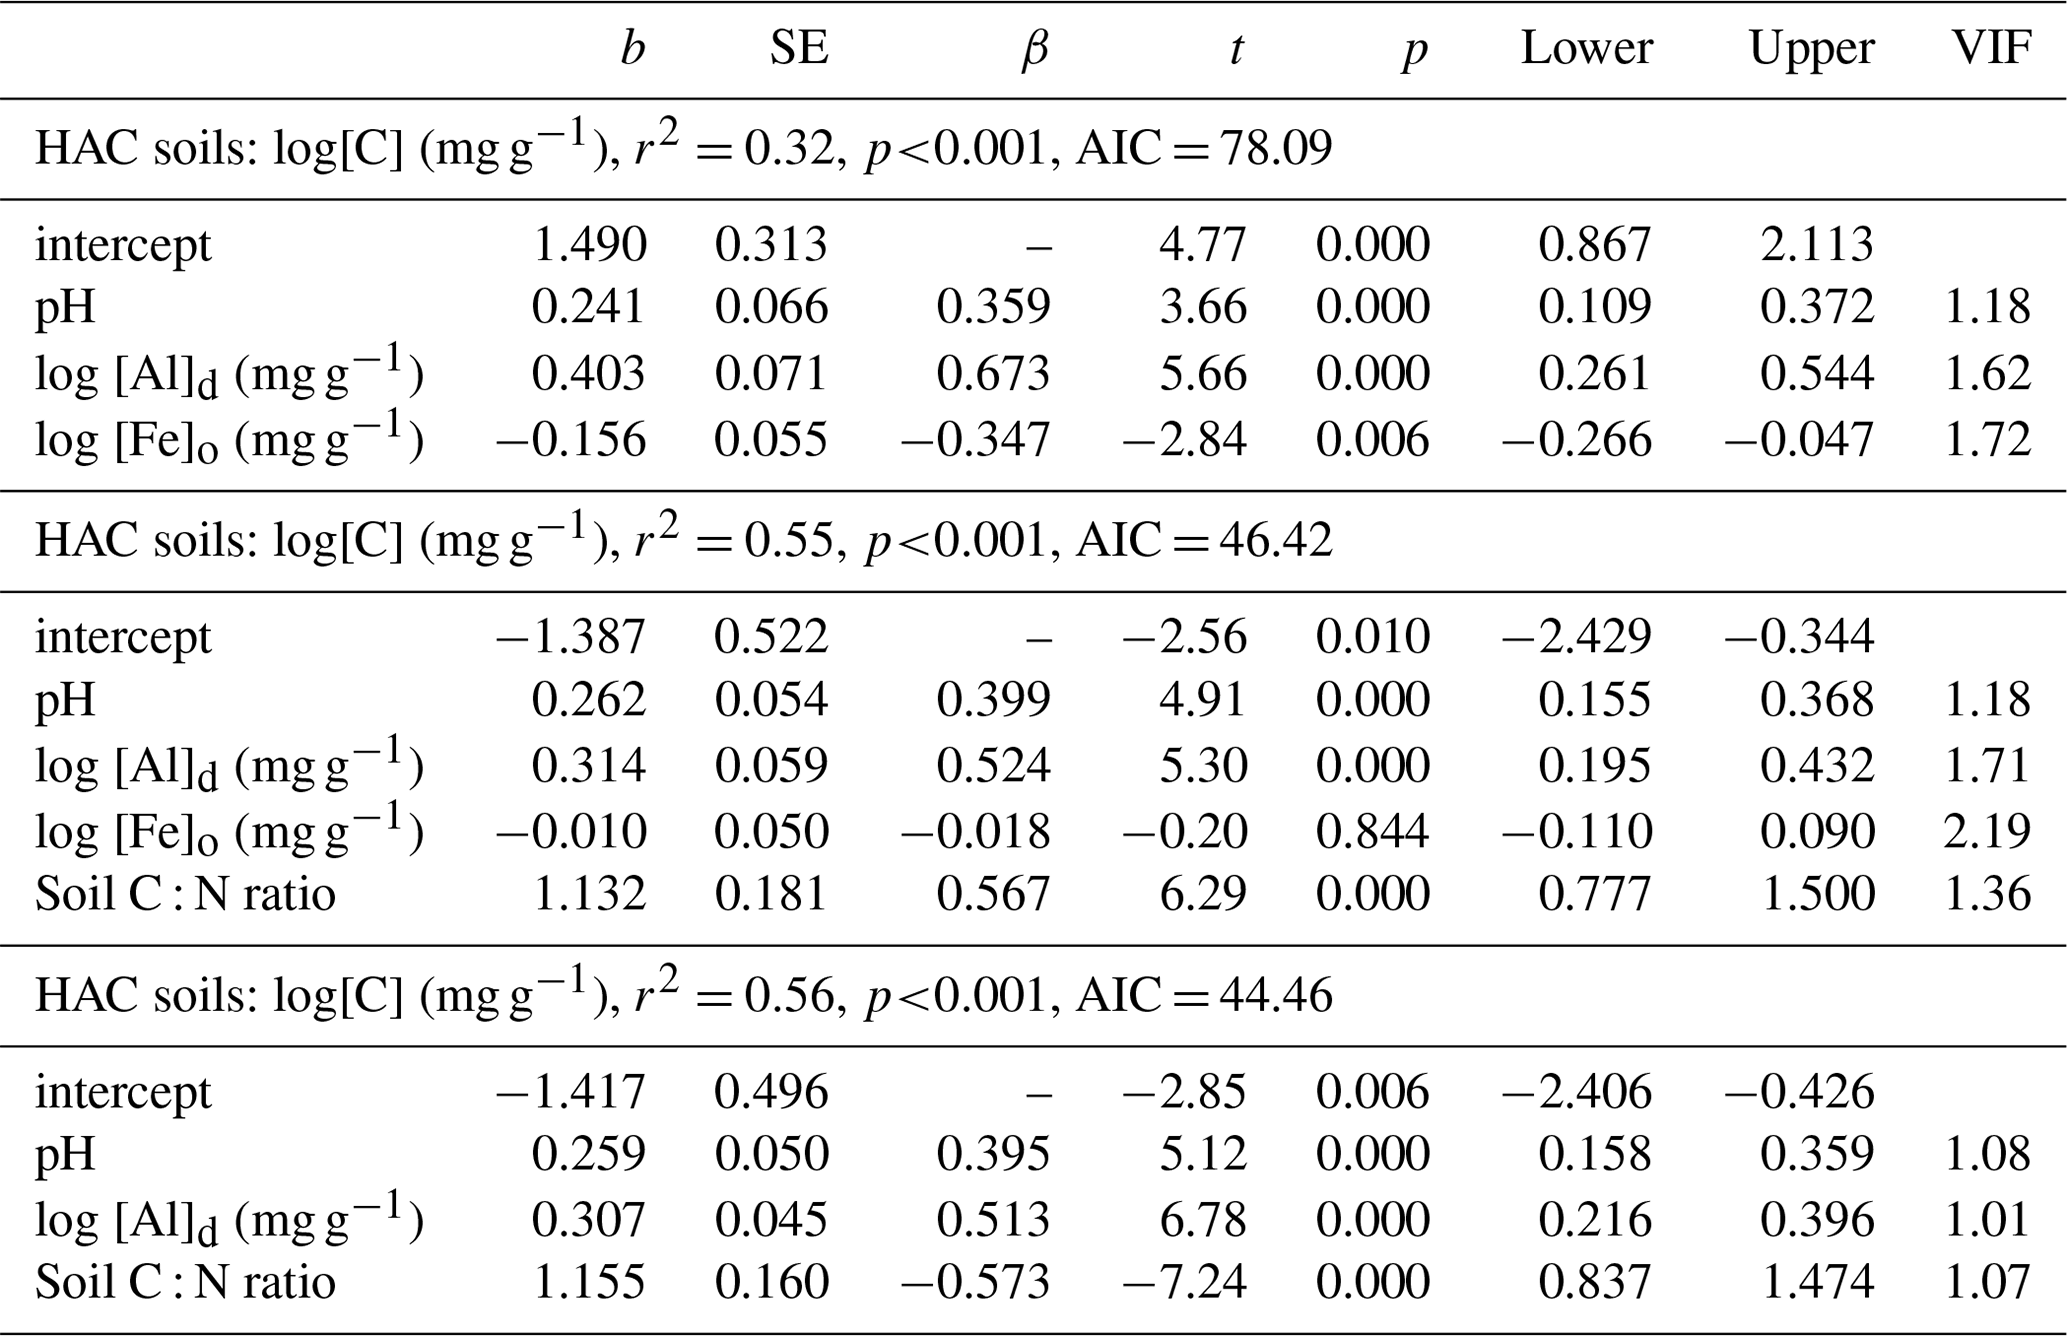
With any role of [Al]d in the modulation of [C] also likely to be dependent on soil pH (see Introduction) we then probed potential interactions of [Al]d and pH, at the same time evaluating the potential role of other measured mineralogical factors. This was done by testing a range of multivariate models and selecting on the basis of AIC, the net result of which is shown in Table 6 (model q). This model, which also involves both pH and [Fe]o, has a ΔAIC of −17.7 as compared to the univariate [Al]d model of Table 5n, suggesting a drastic improvement through the addition of the two additional terms. Nevertheless, using data for 41 of the 77 HAC sites for which we had leaf litter lignin content (Λ) measurements, there was a clear relationship between the model residuals of Eq. (6q) in Table 6 (Fig. 7a), with this relationship also being evident (though to a lesser extent) when a simpler model involving just [Al]d and pH was applied (r2=0.25, AIC = 85.1; Fig. 7b). In both cases residuals increase with increasing Λ, meaning that at high Λ the models tend to underestimate [C] and vice versa at low Λ.
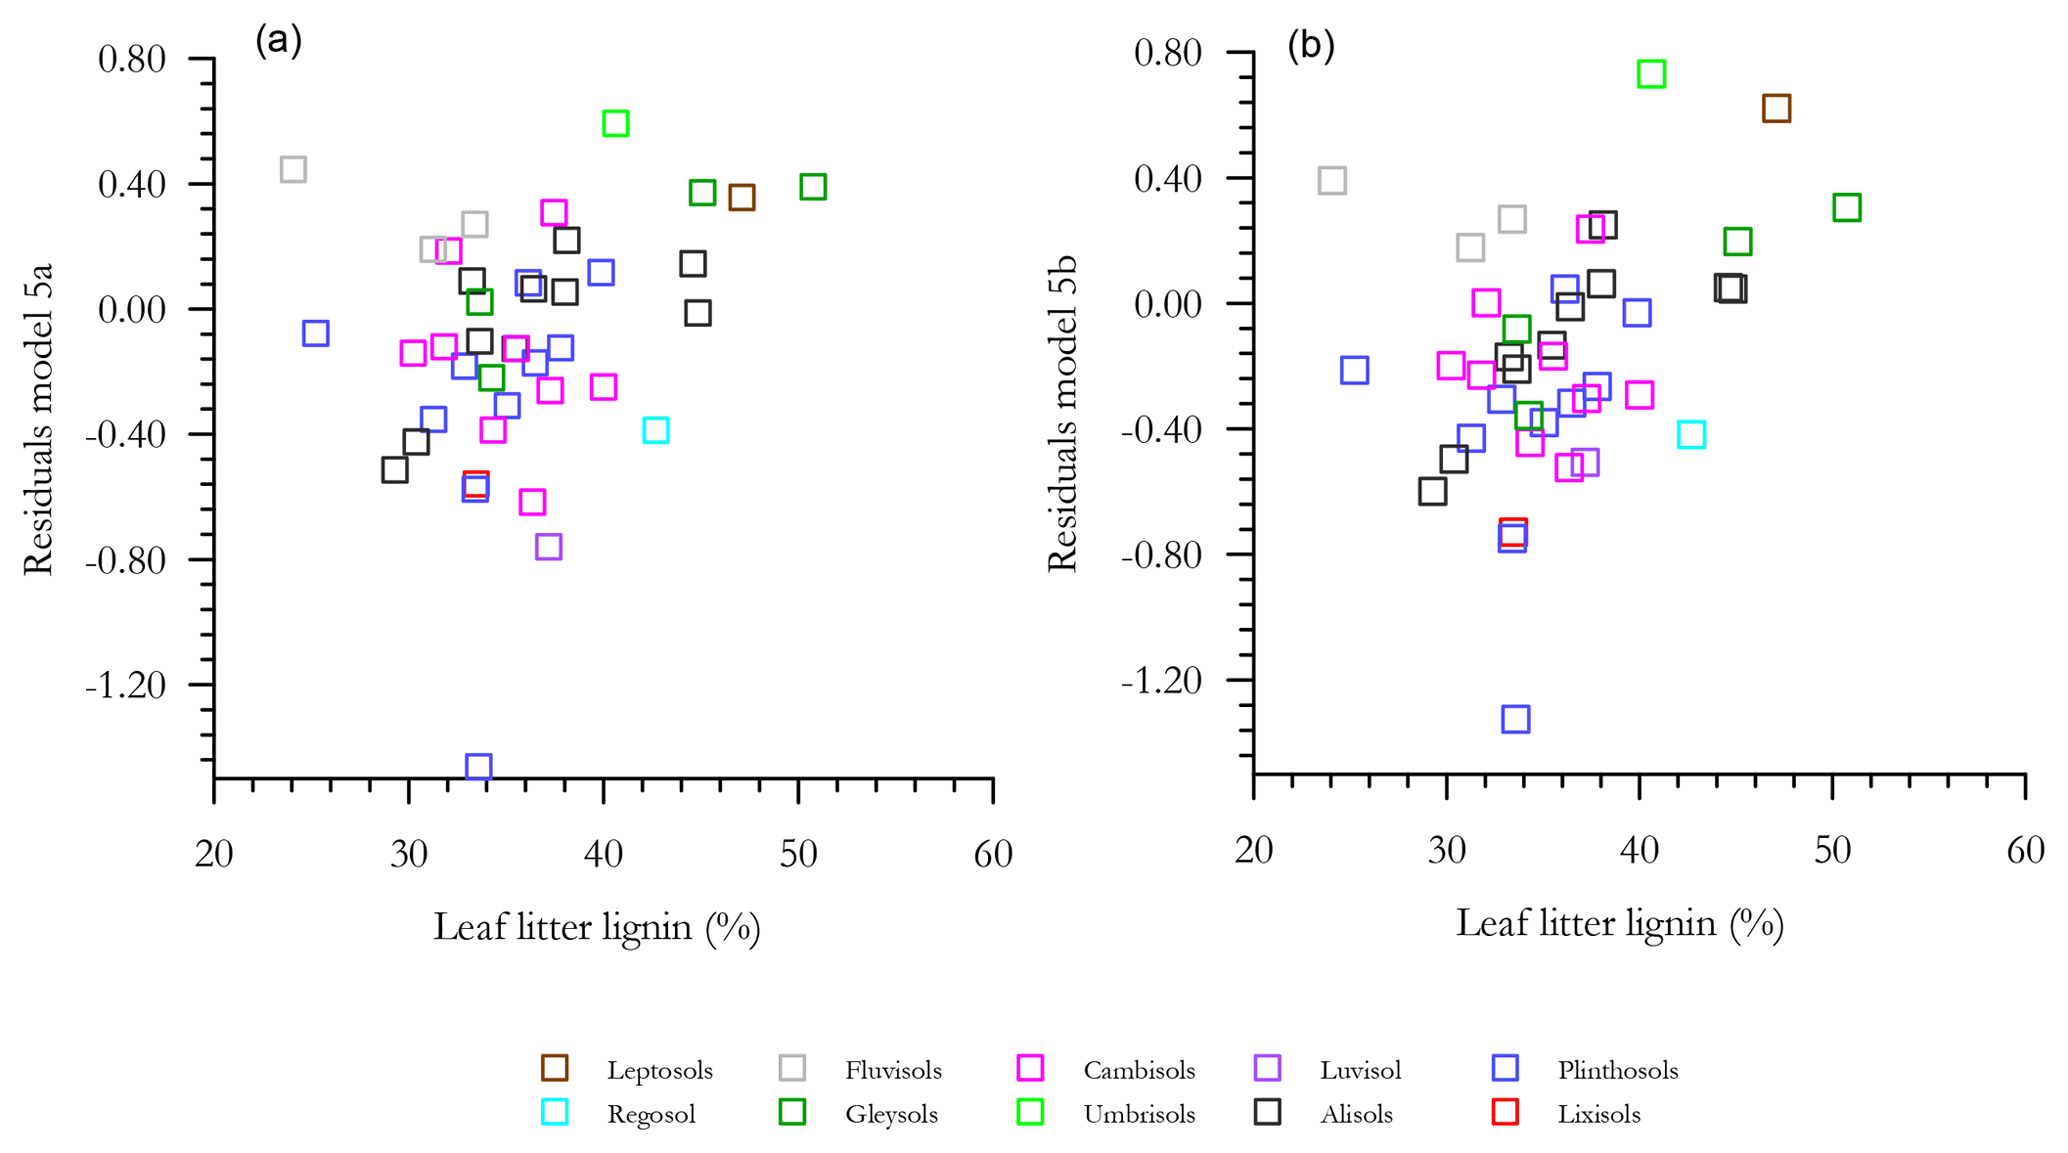
Figure 7The effect of litter lignin content, a surrogate for the abundance of aromatic C compounds, on the residuals of model regressions in Table 6q (a) and a simplified additional model with only pH and Ald included (b).
Table 6Summary of OLS regression coefficients for soil organic carbon in HAC soils.
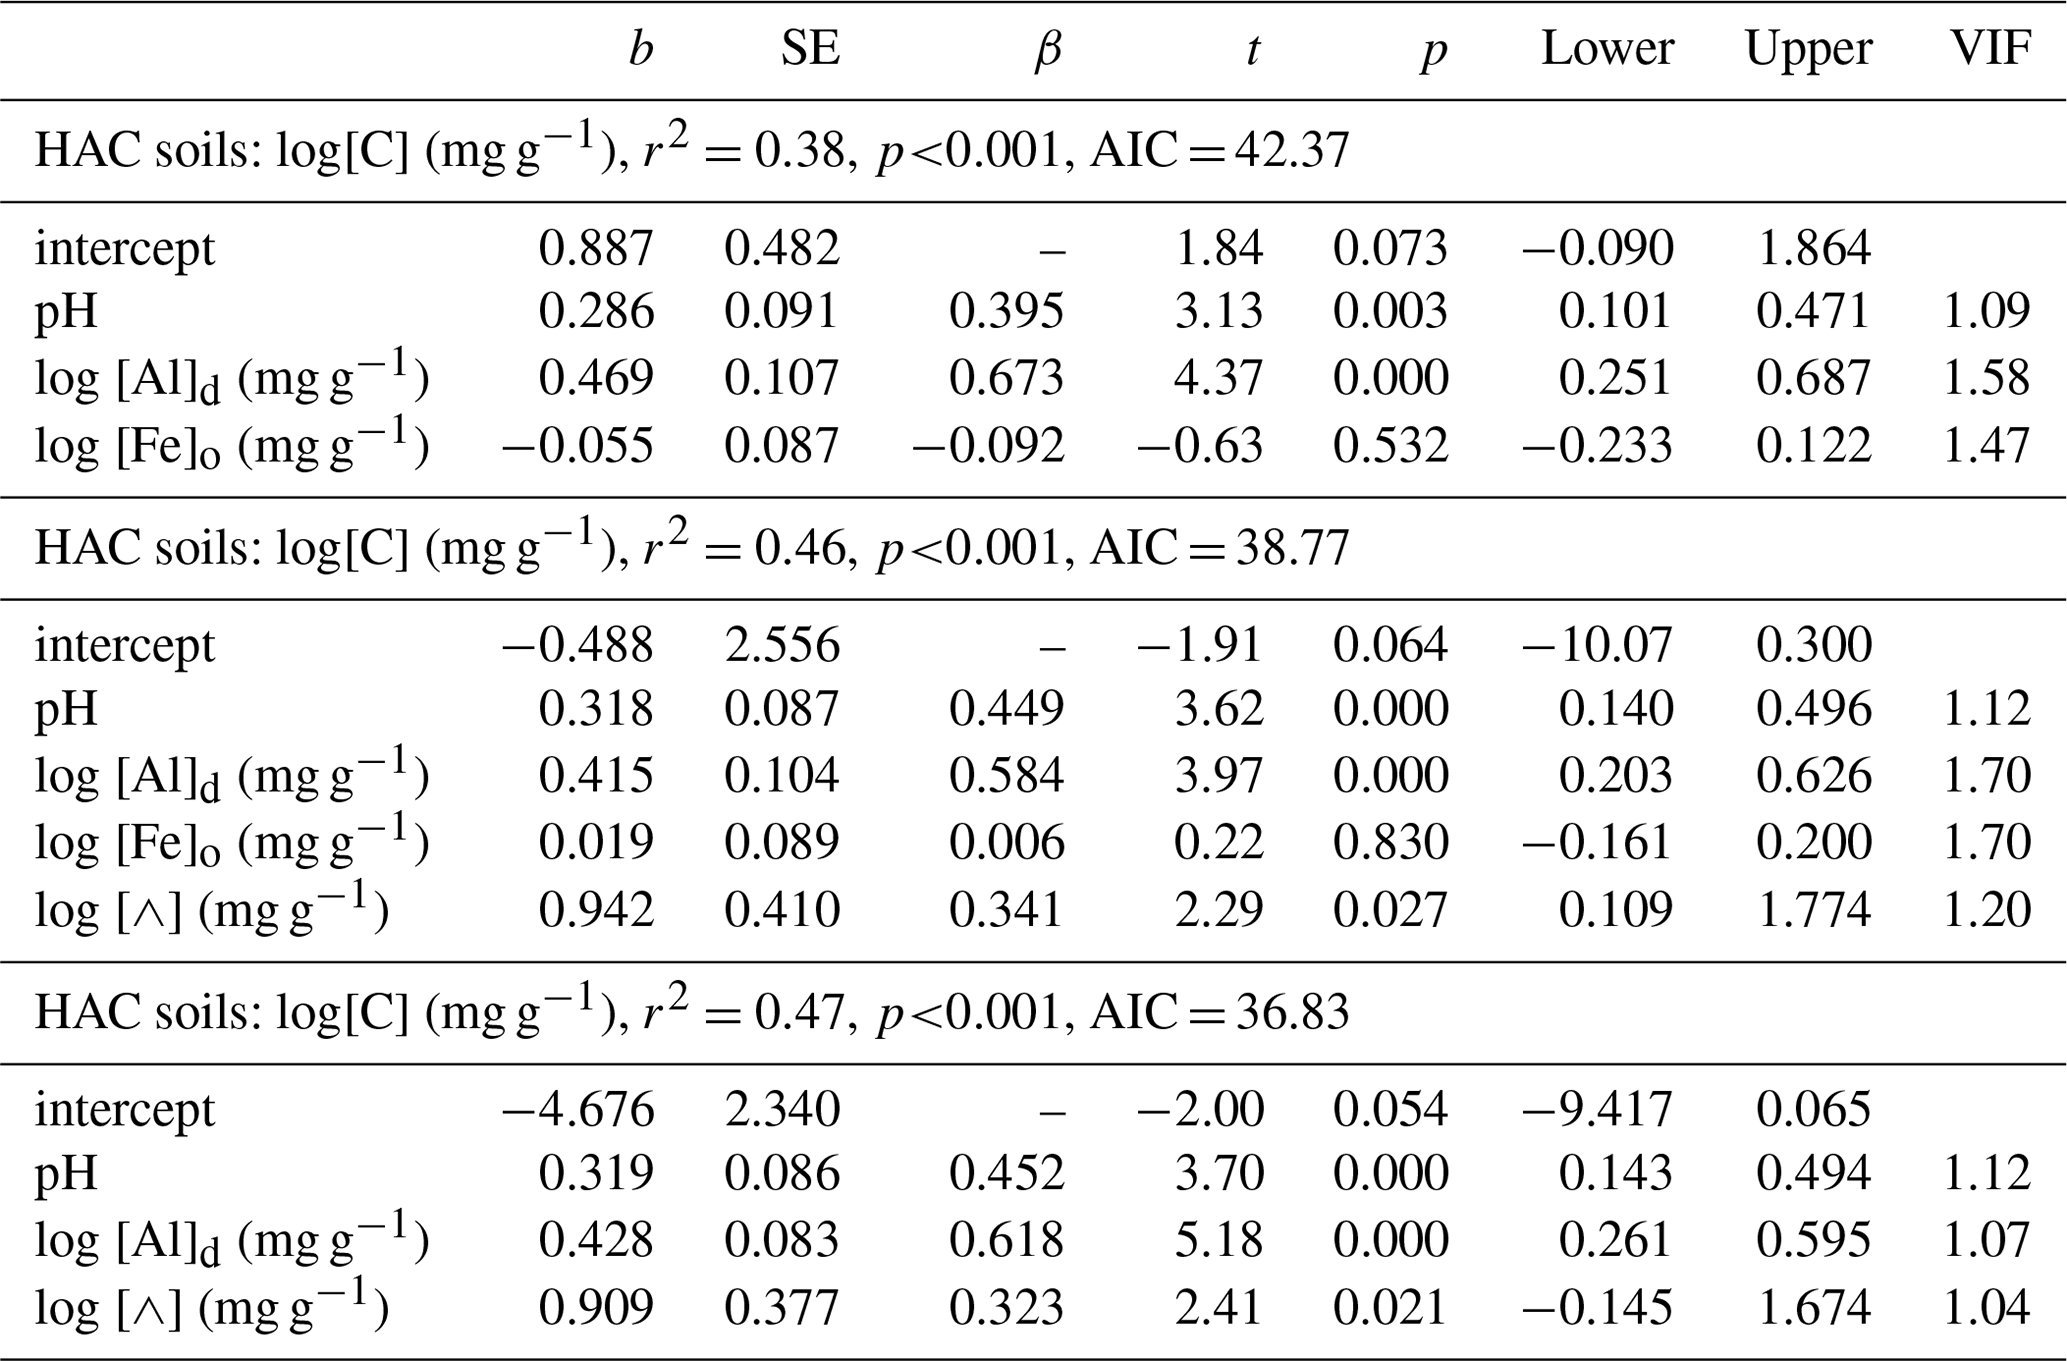
With this lignin effect being consistent with any pH dependent [Al]d precipitation reaction mechanism as originally postulated, we thus probed a possible role of Λ as a factor interacting with both pH and Ald using the more limited dataset of 41 HAC sites for which the requisite data were available. Model comparisons are shown in Table 7. Starting first with a simple model of [C] as a function of [Al]d, [Fe]o and pH (Table 7t, which is the same model as Table 6q but in this case with the reduced “leaf lignin only” dataset), the addition of a Λ term clearly results in a marked improvement in the model fit (Table 7u; r2=0.46, ΔAIC = −3.50). Moreover, for this reduced dataset at least, the [Fe]o term then becomes redundant (Table 7v; r2=0.47, ΔAIC = −2.0).
Table 7Summary of coefficients from OLS regression models for HAC soils. Interactions of soil organic carbon, soil pH, leaf litter lignin content (⋀) and dithionite extractable Al.
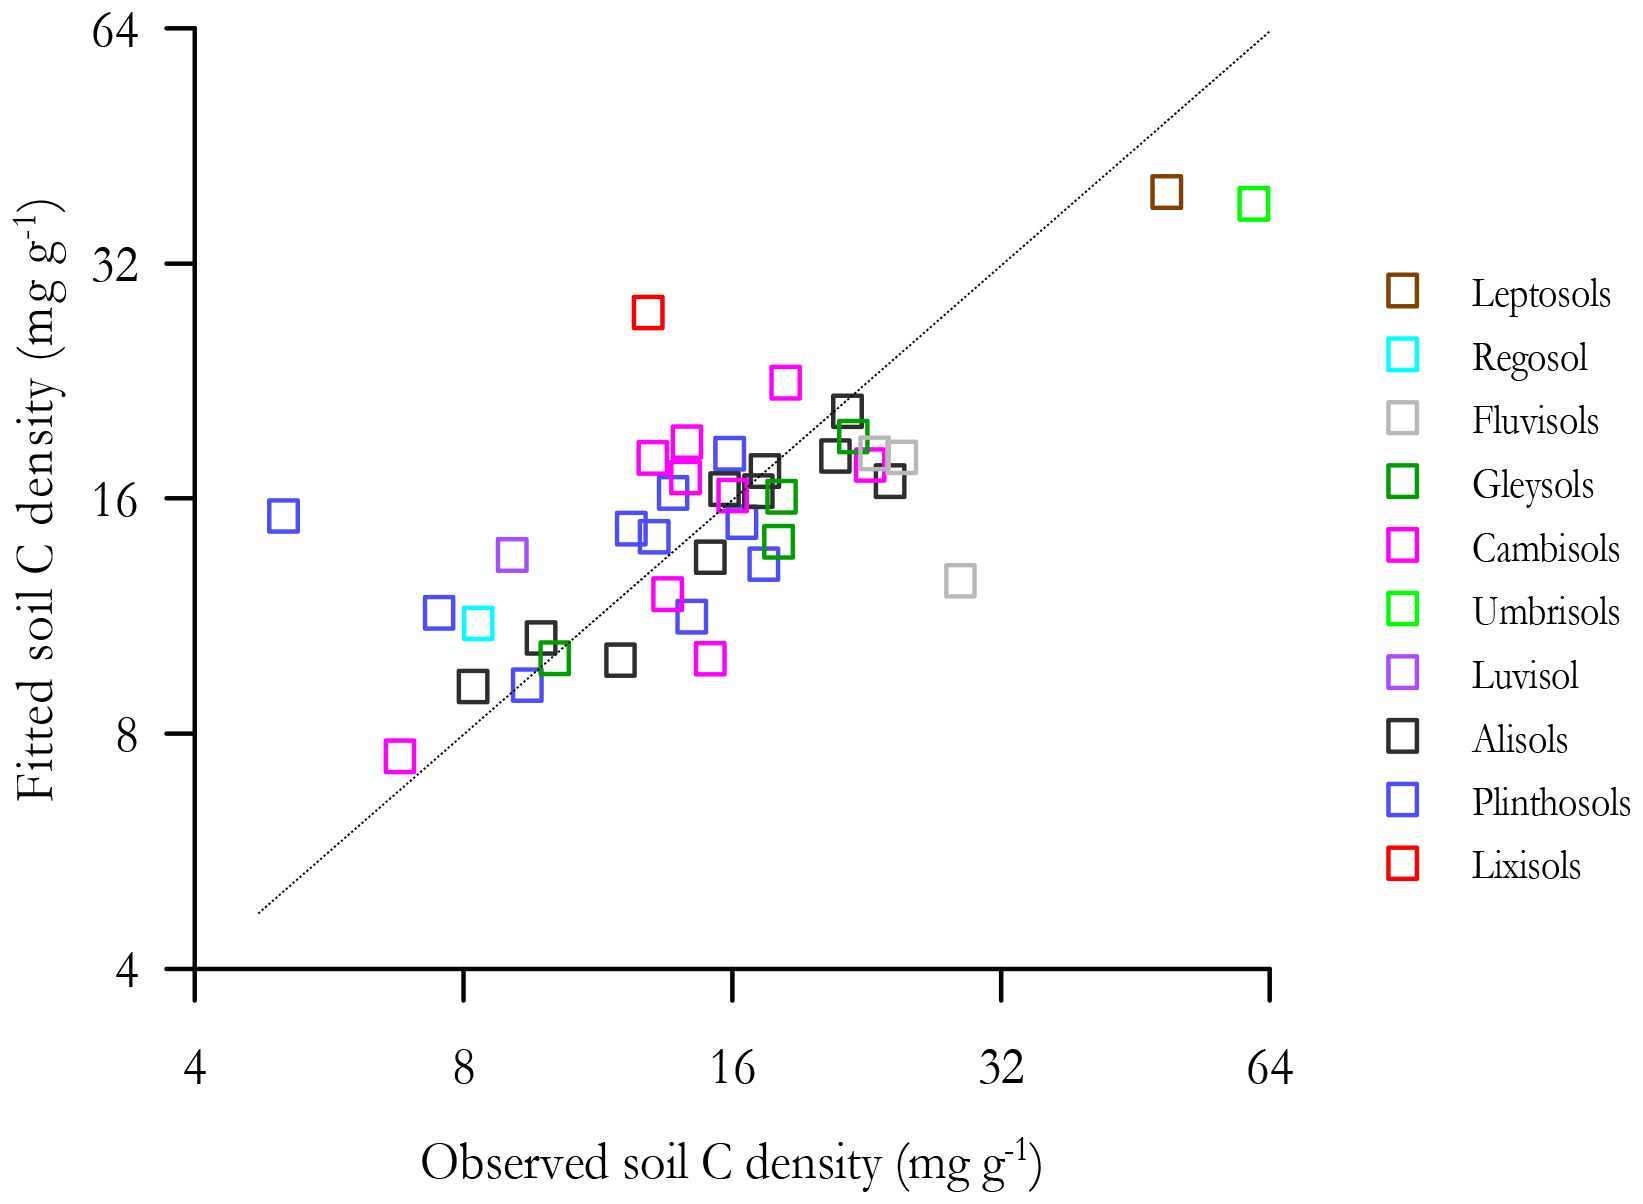
The goodness of fit of Eq. (7v) is shown in Fig. 8 where the fitted soil carbon densities, , are plotted as a function of the actual values (log–log scale). This shows that Eq. (7v) provides a reasonable and unbiased fit across a wide range of [C] for HAC soils, though with two locations (viz. POR-02, a Plinthosol in the west of the basin, and RIO-12, a Lixisol on the basin's northern periphery) being substantially overestimated by the model.
Probing the effect of litter quality on soil C storage further, we examined the relationship of Λ with both leaf litter and soil C : N ratios (denoted and respectively), this exercise being undertaken with a view to see if we could find statistically significant relationships between Λ and one or both of and . This was so as to allow incorporation of litter quality surrogate measures into an analysis using the full HAC soil dataset. As is shown in Fig. 9, there were indeed significant log–log relationships between Λ and both and for both HAC soils (but not for LAC soils and not between and for HAC soils), with the HAC Λ vs. giving a better fit (r2=0.32, p<0.0001; Fig. 9b).
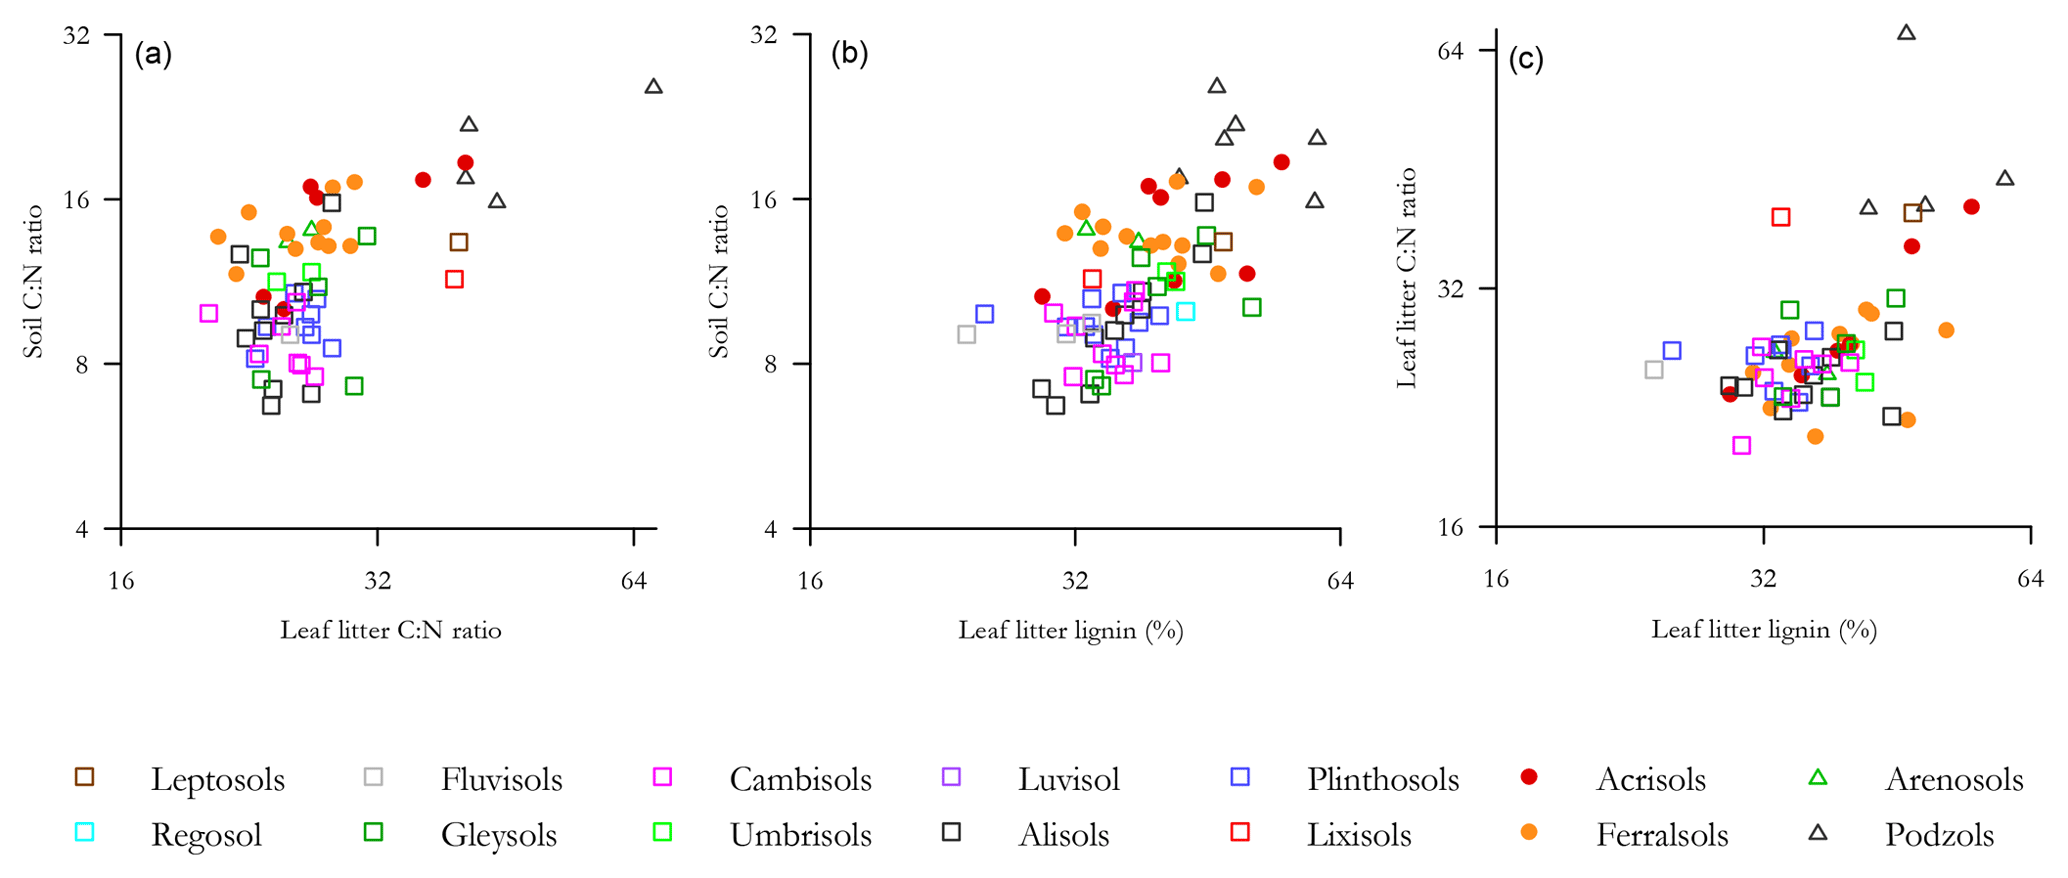
Figure 9The relationship of leaf litter lignin content with both leaf litter and soil C : N ratios. (a) Soil C : N ration as a function of leaf litter C : N ratio, (b) soil C : N ratio as a function of leaf litter lignin concentration and (c) leaf litter C : N ratio as a function of leaf litter lignin.
Considering that the correlation between [C] and the C : N ratio in HAC soils is very low (τ=0.1, Table 3), we then took as our best available surrogate for litter quality and tested the effect of adding this variable to the original HAC model as given in Table 6q, finding that this term provided for a substantial reduction in AIC when added to a model already including pH, [Al]d and [Fe]o. Further, upon the inclusion of the term the negative [Fe]o term became, as for the lignin models of Table 7, redundant (Table 6s).
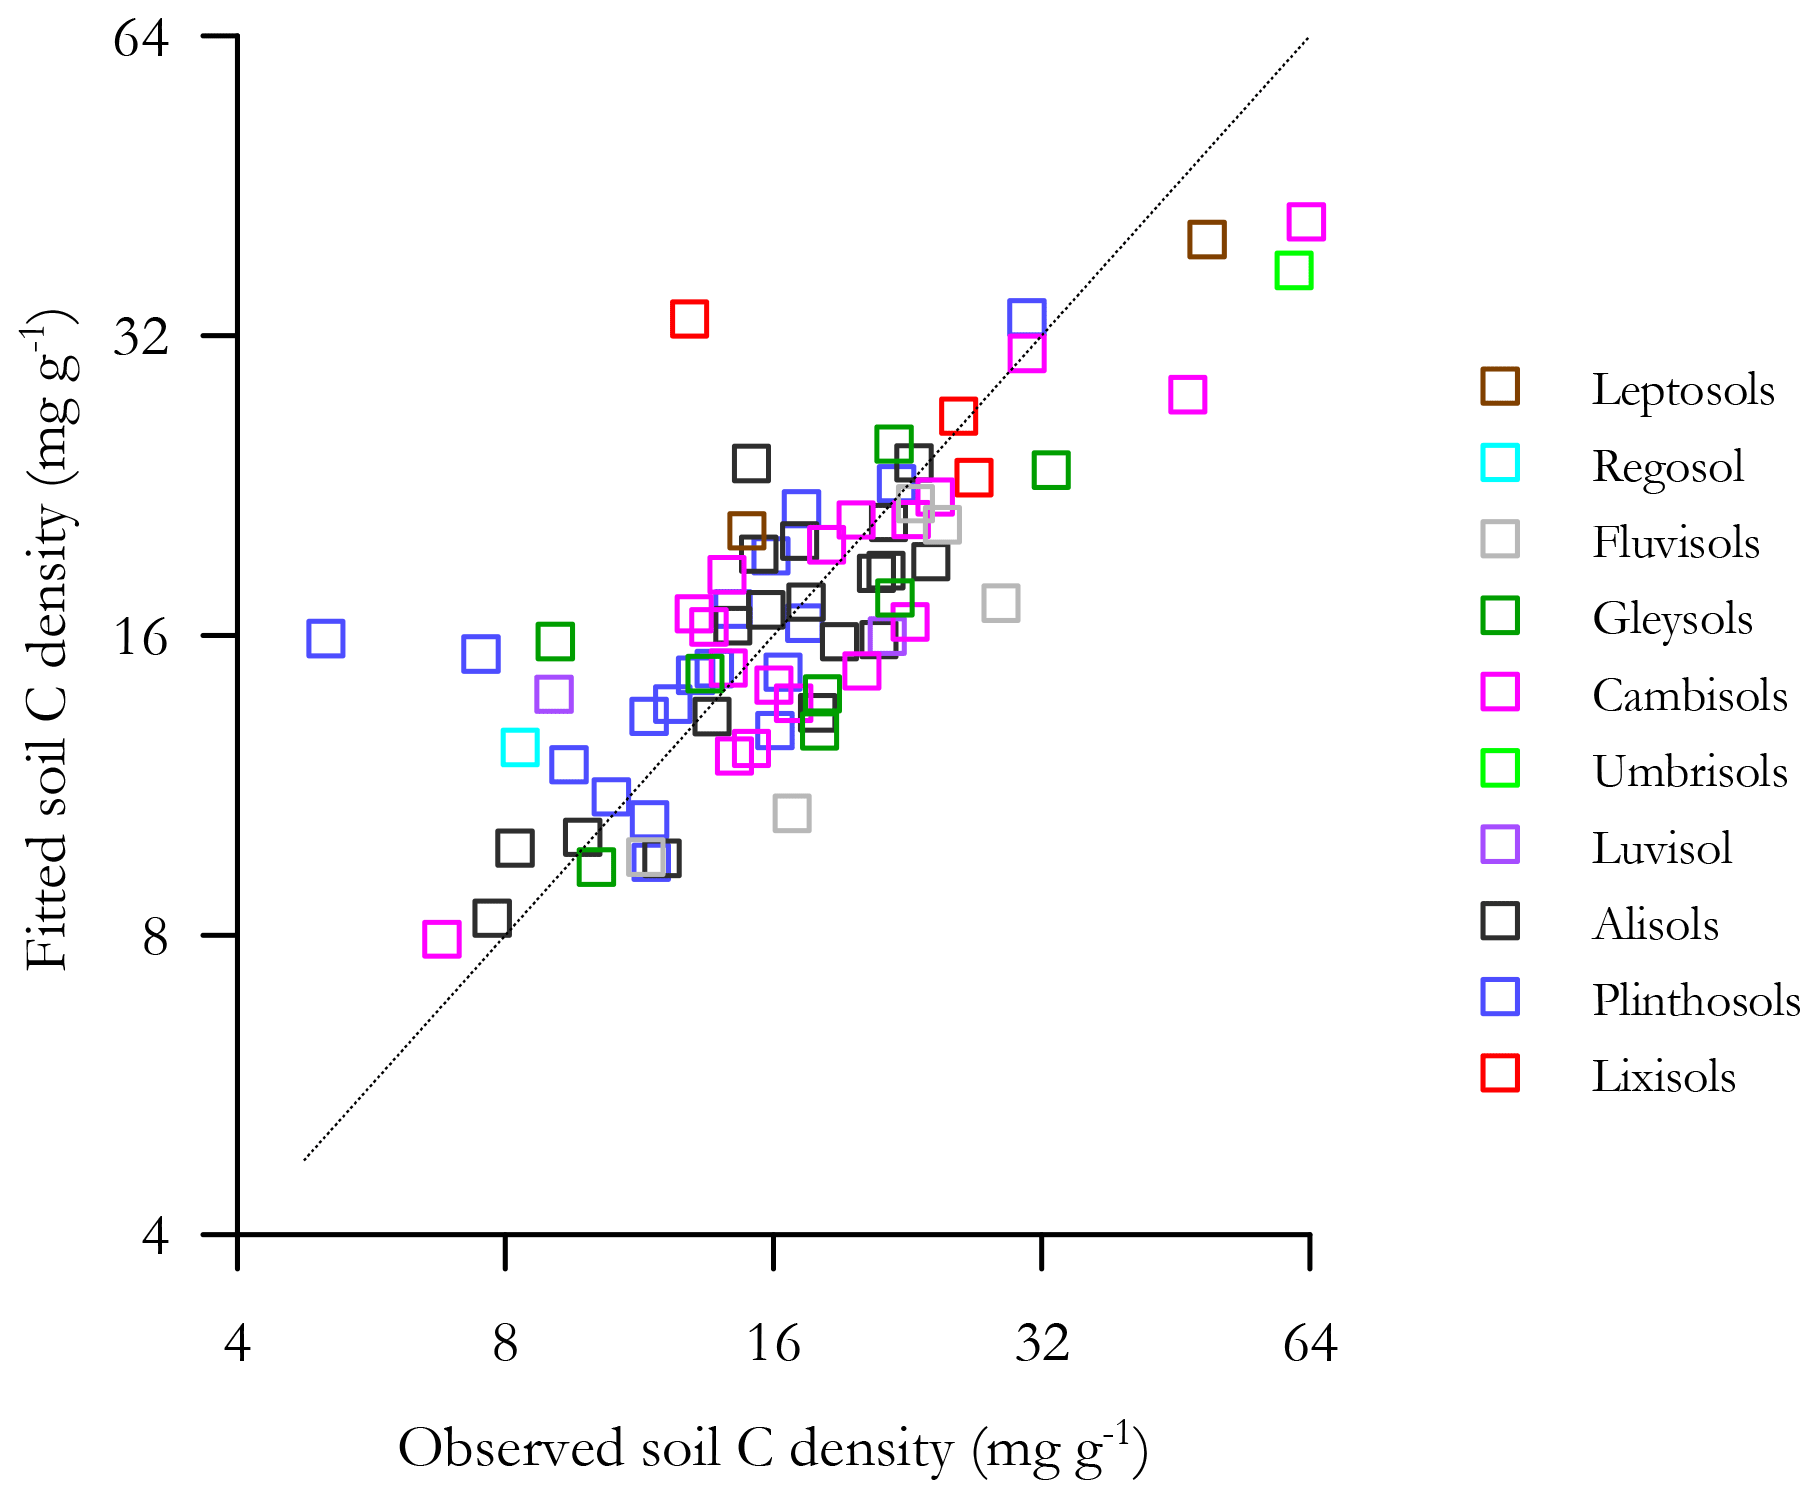
The goodness of fit of the equation of Table 6s is shown in Fig. 10, where the fitted soil carbon densities are plotted as a function of the actual values (log–log scale). This shows that Eq. (6s) provides a reasonable and unbiased fit across a wide range of [C] for HAC soils, though with the same two locations that were overestimated by the lignin model (Fig. 9) being similarly overestimated.
3.6 Alternative models
Although we have used AIC to assist with model selection in Sect. 3.3, 3.4 and 3.5, candidate models had been in all cases guided by the background knowledge and hypothesis as outlined in Sect. 1. It is therefore worth pointing out that if one takes a simple information-criterion-guided model selection approach then it is possible to find models with a lower AIC than those presented in Tables 4 and 6. For example, for LAC soils there is a model involving all of Φsand, Φclay, [Al]d, [Al]o [Fe]d, [Fe]do and which provides a significantly better fit than Eq. (b) of Table 4 (ΔAIC of −19.9). But for this model many of the terms had VIF > 10 and after removal of these terms then the simpler [C] =Φsand +Φclay equation is only 0.2 AIC units higher.
Likewise, if one applies a “blind” information criterion selection criterion to the HAC soils then it is possible to find a log–log model significantly better than that of Table 6s, which retains the [Al]d term but with log ΣRB substituting pH and, moreover, with an additional Φclay term included (r2=0.65, p<0.0001, ΔAIC = −20.5). Further, modifying this “blindly selected” equation, by reinserting our previously rationalised pH term in preference to log ΣRB term (thus effectively adding a Φclay term to the Equation of Table 6s), results in a markedly inferior fit (ΔAIC = +10.3). Nevertheless, the resulting equation, viz. [C] = pH + log[Al]d + log (r2=0.63), is still a marked improvement on the equation of Table 7v (ΔAIC = −10.2).
For the smaller arenic soils dataset (n=10) the lowest AIC linear model is as in Table 4h (i.e. with, combined together, clay and silt only; r2=0.31, p=0.035). However we do note that there does exist a virtually uninterpretable log–log model found through the AIC minimisation procedure which involves all of pH (negative coefficient), Φsand [Al]d, [Fe]d and (positive coefficients) with an impressive sounding r2=0.85 (but due to the low degrees of freedom for which p is only < 0.039).
3.7 Checking for model biases
In order to check if there were any systematic biases in the final models used (the models as presented in Table 4b for LAC soils, Table 4i for arenic soils and Table 6s for HAC soils), standardised model residuals were examined in relation to the soil variables Φsand, Φclay, Φsilt, [Al]d, [Al]o [Fe]d, pH and CN ratio along with mean annual temperature TA and mean annual precipitation PA climate variables and two vegetation-associated characteristics available for over 100 of the study sites, viz. the above-ground wood productivity and above-ground biomass. These data are essentially as in Quesada et al. (2012) but in an updated and expanded form (Brienen et al., 2015). These relationships are shown in the Appendix Fig. A1, which shows that there was little if any evidence of systematic model bias, with the strongest association found for the standardised residuals being with PA (τ=0.09, p=0.18).
3.8 SOC fractions and mineralogy
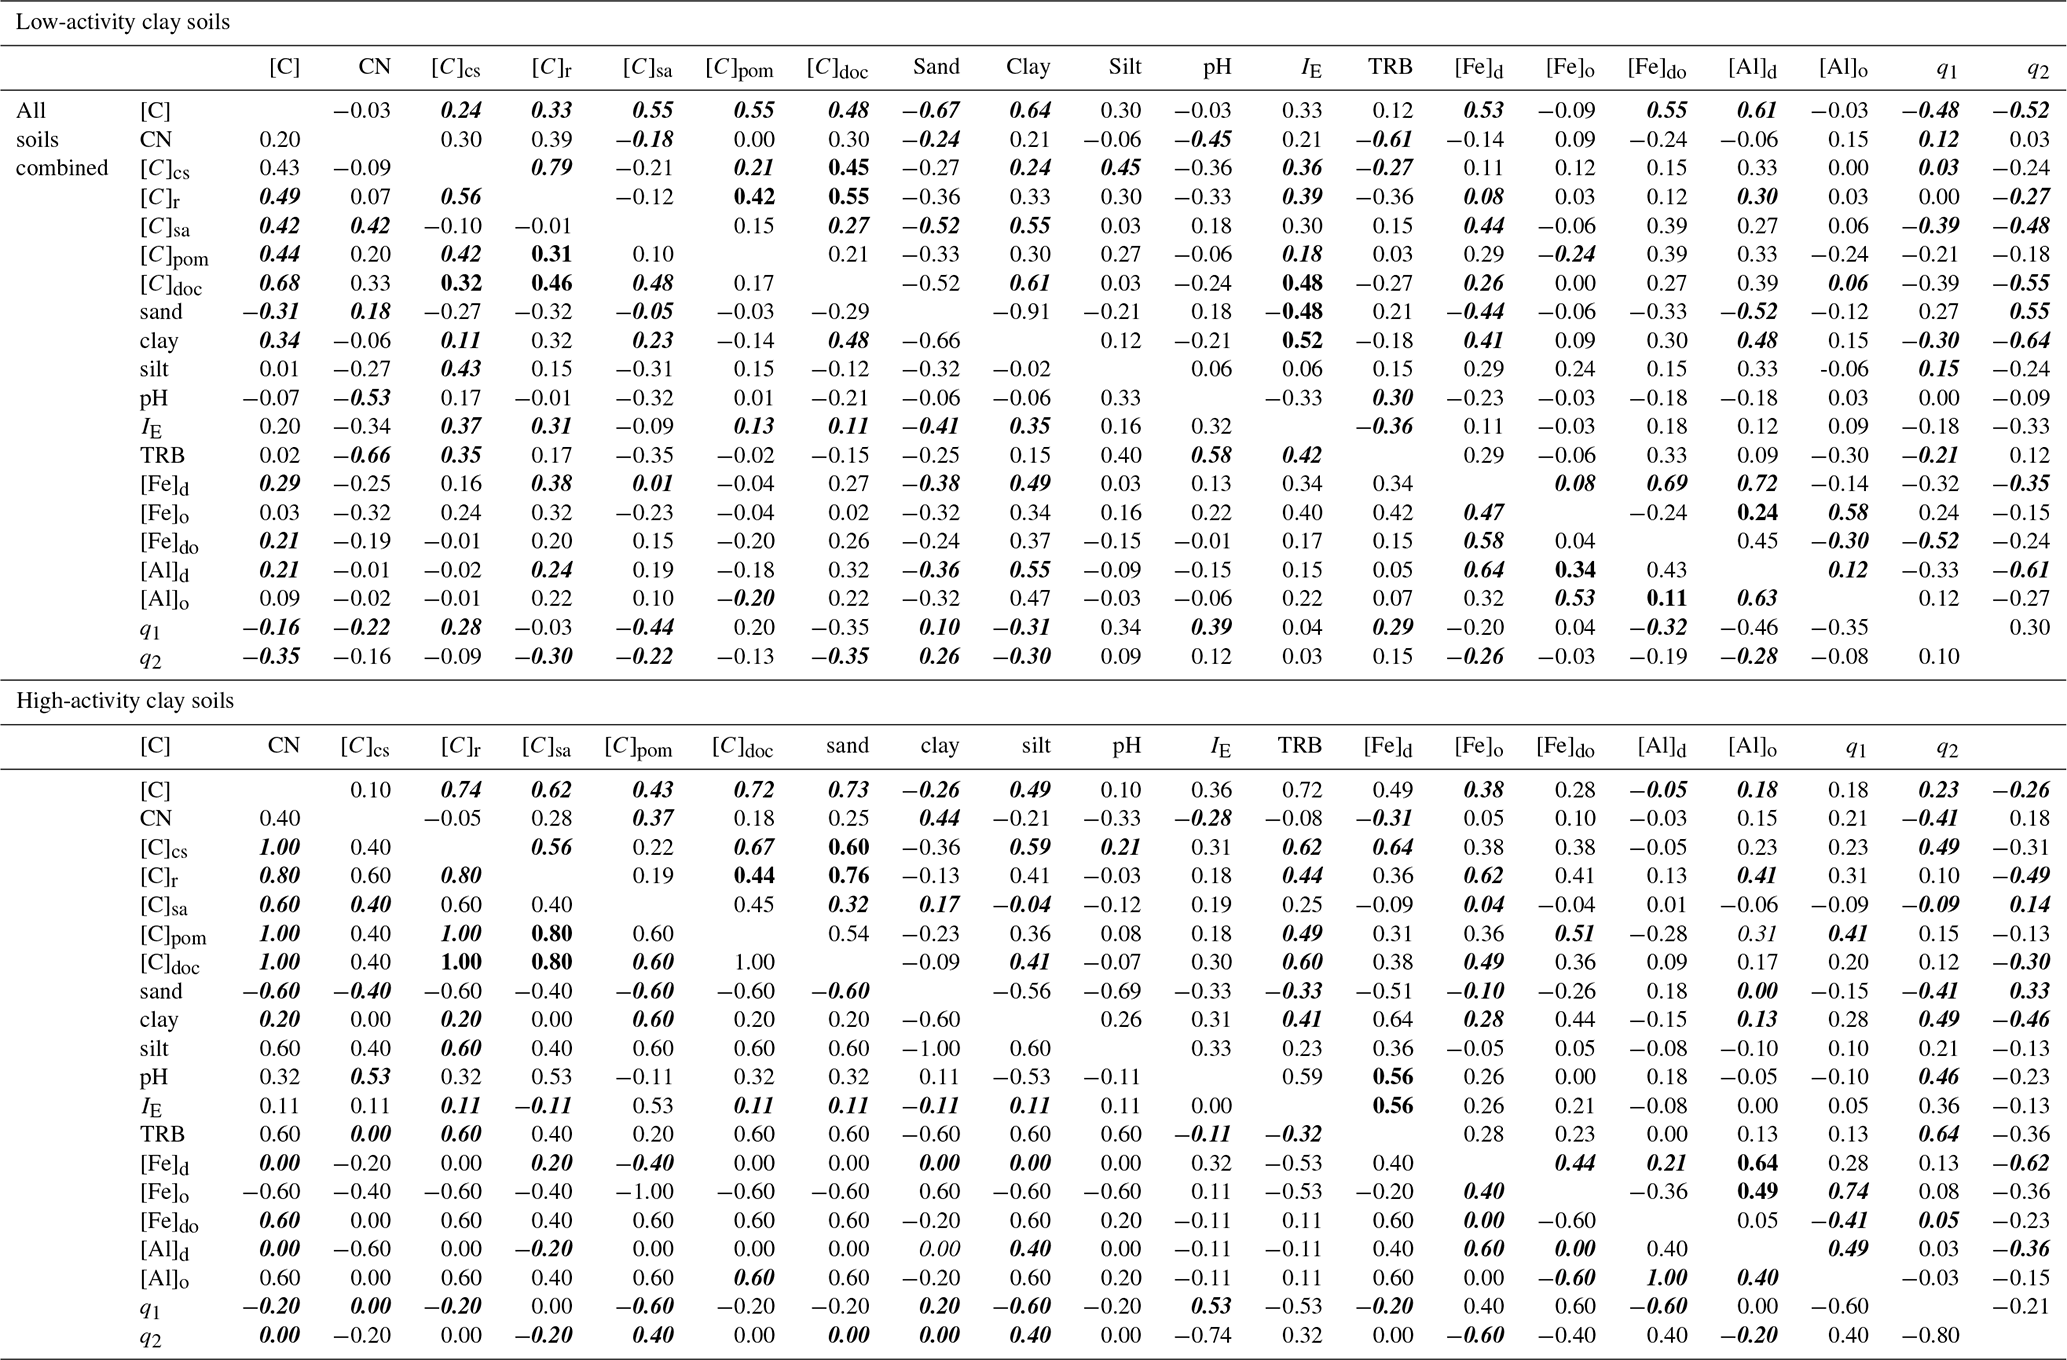
Further adding to our analysis, Table 8 shows results for soil carbon fractions for a subset of our study sites (n=30). The [C] range in this reduced dataset is similar to the main dataset, with LAC soils ranging from 8.8 to 25.3 mg g−1, with the arenic group ranging from 4.2 to 108.6 mg g−1 and with the HAC soils ranging from 5.5 to 24.8 mg g−1. It also shows very similar relationships between the relevant edaphic parameters and [C] as found for the larger dataset and described in Sect. 3.2. Comparing the Kendall τ from Table 8 with results from Table 3, we find very similar correlations for both LAC and for all groups combined, but with [C] in the reduced dataset having stronger correlations with clay content and Ald in LAC soils (τ=0.64, p<0.01 and τ=0.61, p<0.01, respectively). The main difference between datasets occurs in HAC soils, where the reduced dataset used for fractionations shows stronger correlations between [C] and both clay content and IE (τ=0.49, p<0.02 and τ=0.72, p<0.001, respectively) than is the case in the larger dataset (Table 3).
Table 8Kendall's τ correlations for soil organic carbon fractions and a range of soil and mineralogical properties. Four one-sided correlation matrices are shown for each of the arenic, LAC and HAC clusters as well as for the (combined) dataset as a whole. Data shown here are a subset of our entire dataset (n>30). We have indicated in bold all cases where the probability of Type-II error is less than 0.05. For the entire dataset, a τ>0.22 is associated with a probability of p<0.05. For the HAC soil cluster with n=13 the equivalent value is τ>0.36, and for LAC with n=12 the value is τ>0.39. For the arenic soil cluster, with only n=5, the associated probability of p<0.05 requires a τ>0.80. We have indicated all cases where one or more of the four groupings has p>0.05 – using italicised characters to help cross-referencing across the four diagonal matrices.
Soil C fractionations revealed fundamental differences between the three soil groups as shown in detail in Fig. 11. LAC soils (Fig. 11a) had an average fraction of 0.49 (or 49 %) C in clay-rich aggregates (sand and aggregates fraction, S+A), with this increasing with [C] up to 0.74. This increase in S+A fraction in high [C] soils seems to occur at the expense of the labile clay and silt fraction (C+S), which represents a fraction of 0.20 of soil carbon on average, but only 0.09 in the higher [C] soils. The proportion of C in POM and DOC fractions varied little across the range of soil [C], while the resistant carbon associated with clay and silt (RC+S) averaged 0.2±0.07 and showed no clear pattern.
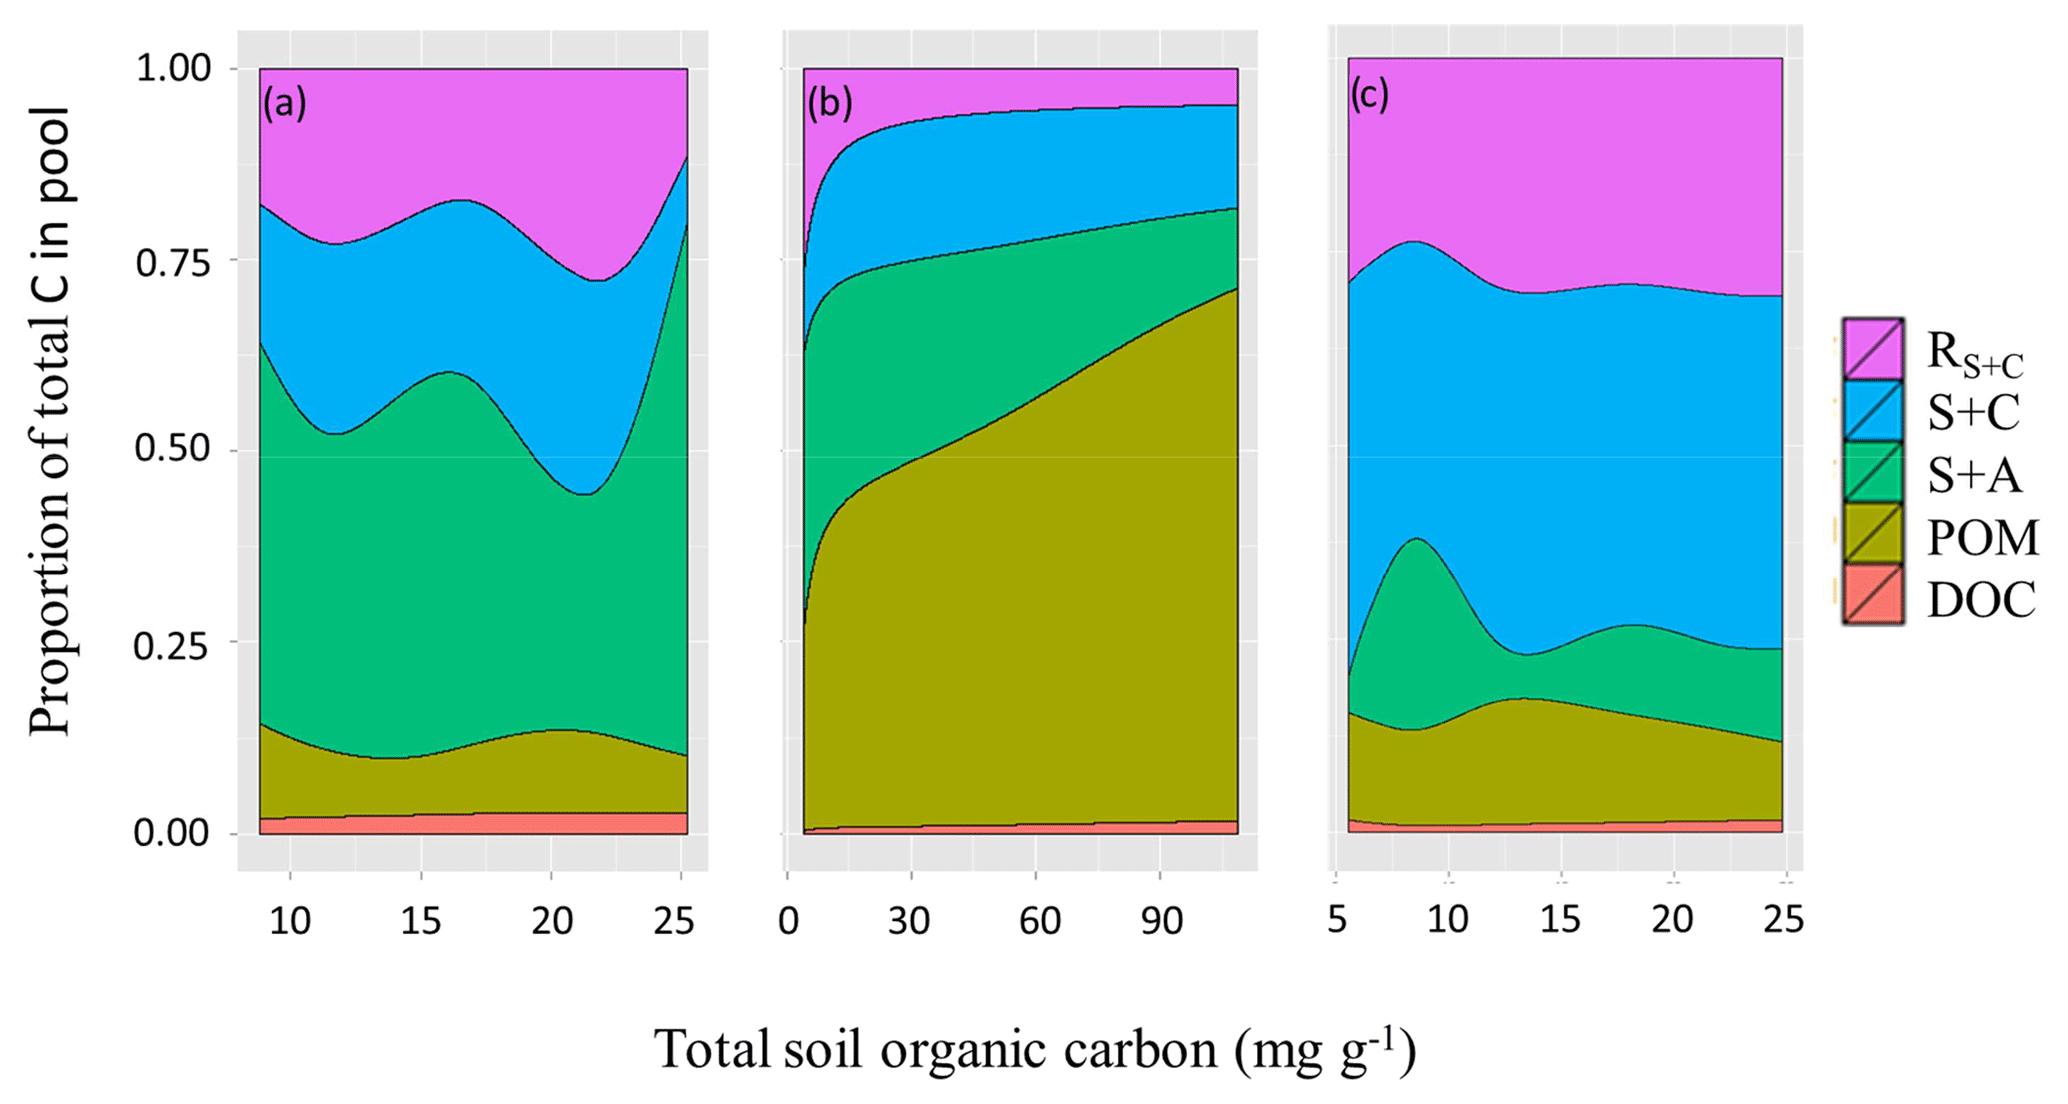
Figure 11Proportion of total soil carbon in the different pools for the three soil groups varying as a function of their SOC content. (a) LAC, (b) arenic and (c) HAC soils. Dissolved organic carbon (DOC), particulate organic matter (POM), sand and aggregates (S+A), silt and clay (S+C), and resistant SOC associated with silt and clay fractions.
On the other hand, the arenic group have most of their carbon associated with POM and S+A fractions (average proportion of 0.47 and 0.25, respectively) (Fig. 11b, Table 8), with the fraction of POM reaching 0.70 in soils with higher overall [C]. Seasonally wet sands (denoted with F following the soil type in Table 1) had the highest POM fractions, averaging 0.6 of total [C], but despite the differences in [C] related to soil drainage, POM and S+A fraction were still the main stores of SOC in well drained sands (0.33 and 0.3 of total [C], respectively).
HAC soils consistently had most of their [C] associated with the clay and silt fraction (0.43) and the resistant carbon (0.28) associated with clay and silt (RC+S). On average 0.72 of [C] was found in these two fine-earth fractions (Fig. 11c). The S+A fractions only had on average 0.13 of HAC soils [C], while POM and DOC had 0.13 and 0.01 respectively. In general, the HAC fractions varied little in proportion to increasing [C].
Soil C fractions in the three groups also differed in the way they relate to other edaphic properties such as texture, the abundance of Fe and Al oxides, and bulk soil mineralogy (Table 8). In LAC, soil carbon associated with both C+S and RC+S fractions did not show any significant correlation with Fe and Al oxides, nor with clay content, but C+S was correlated with soil silt content (Kendall τ=0.45, p<0.025). On the other hand, the S+A fraction, the main pool of SOC, was significantly correlated to clay content (τ=0.55, p<0.01). S+A was also negatively correlated with our PCA axis 1, which indicates a positive relationship with the abundance of 1:1 clay minerals (see Sect. 3.2) as axis 1 (q1 Table 8) represents to a large degree the abundance of kaolinite, Goethite and Gibbsite (Kendall , p<0.05). S+A was also negatively correlated to sand content (Kendall τ = −0.52, p<0.01), S+A was also significantly correlated to Fe oxides (Kendall τ=0.44, p<0.03 and 0.39 p<0.05 for Fed and Fed-o; Table 8). The DOC fraction was significantly correlated to clay (Kendall τ=0.61 p<0.01), IE (Kendall τ=0.48, p<0.02) and Ald (Kendall τ=0.39 p<0.05). DOC was also correlated to q1 (Kendall , p<0.05). The POM fraction was significantly correlated to Fed−o (Kendall τ=0.39, p<0.05).
The small number of arenic soils in this analysis (n=5) makes correlations unreliable and difficult to interpret. At n=5, a Kendall τ=0.8 does not differentiate critical values at p=0.1 and 0.05, and significance can only be attained for Kendall τ=1. Therefore, correlations in Table 8 should be taken just as a guidance for the direction of the relationship and are not considered further here.
HAC fractions showed totally different correlations to edaphic properties when compared to LAC soils. For example, the C+S fraction was significantly correlated to clay content (τ=0.59, p<0.01), IE (τ=0.62, p<0.01) and with the weathering index TRB (τ=0.64, p<0.01). C+S also showed a positive correlation with PCA axis 1, indicating a positive correlation with the abundance of 2:1 clays (τ=0.49, p<0.02). RC+S in HAC soils also showed an effect of both Fed and Ald (Kendall τ=0.62, p<0.01 and 0.41, p<0.04, respectively) and IE (Kendall τ=0.44, p<0.03).
In striking difference to LAC, S+A in HAC soils was an insignificant storage for SOC and showed no significant correlation to the concentration of any oxides, clay content or any other of the measured parameters. DOC on the other hand behaved in a more similar manner to LAC soils, also showing significant associations with IE (τ=0.60 p<0.01) and clay content (τ=0.41, p<0.04) and an iron oxide effect (Fed: τ=0.49, p<0.02). POM on the other hand was correlated to Feo (τ=0.51, p<0.02) and Alo a (τ=0.41, p<0.05) and IE (τ=0.49, p<0.02, respectively).
3.9 Carbon stocks versus carbon concentrations
Although the analysis here has focused on soil carbon concentrations, for carbon inventory purposes the actual carbon stock (i.e. carbon per unit ground area: CS) is usually of more interest, and with the two being related according to
where [C]z and ρz represent the carbon concentrations and bulk density of the soil at depth z below the soil surface respectively and d is the maximum sampling depth. Thus with the actual calculations done layer by layer (viz. 0 to 0.05 m, 0.05 to 0.10 m, 0.10 to 0.20 m and 0.20 to 0.30 m) Fig. 12a–c show the relationship between [C] and ρ for the three soil groups with regressions shown that were significant at p<0.05 or better. This shows a reasonably strong relationship for the LAC soils across the 0 to 0.3 m depth (Fig. 12a, log(ρ) = 0.881–0.298 × log[C]: r2=0.43, p<0.001) and with a similar though somewhat less convincing relationship being observed for the HAC soils (Fig. 12b, log(ρ) = 0.678–0.219 × log[C]: r2=0.25, p<0.001) but no readily discernable relationship evident for the arenic soils (Fig. 12c, log(ρ) = 0.697–0.233 × log[C]: r2=0.20, p<0.08).
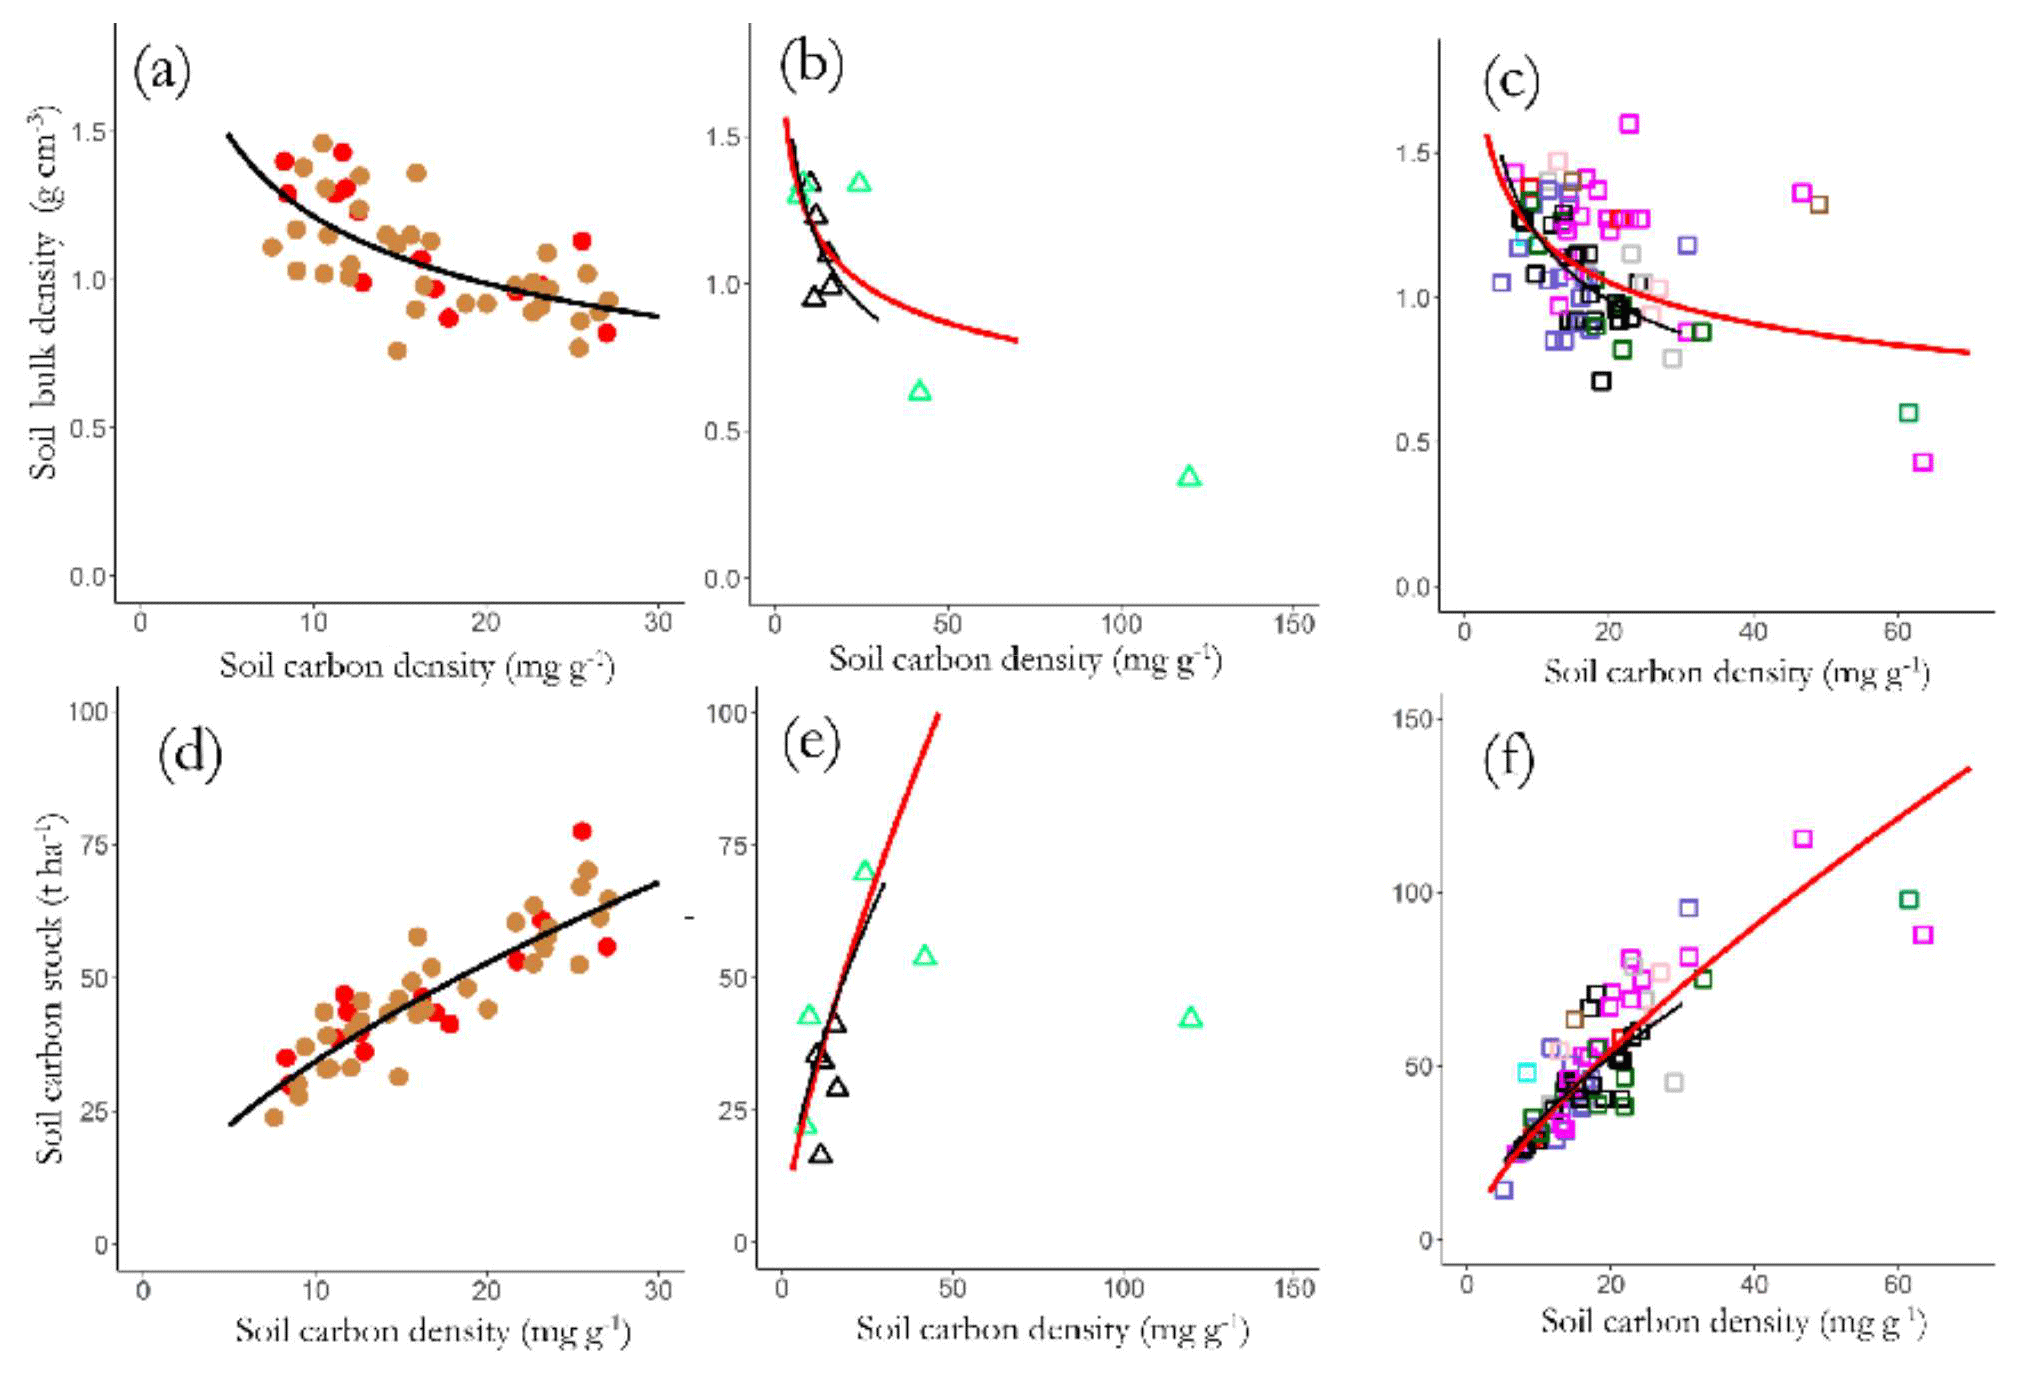
Figure 12Variations in bulk density (a) LAC, (b) HAC and (c) arenic soils, and top-soil SOC stocks, and SOC stocks of (d) LAC, (e) HAC and (f) arenic soils as a function of SOC content. Significant regression lines (see text for details) for each soil group are plotted together for comparison.
These negative [C] vs. ρ associations across all three soil groupings necessitate that CS is a saturating function of [C] as is shown in Fig. 12d–f, with the slopes of the log–log scaling relationships being 0.62±0.05 for LAC soils (Fig. 12d), 0.71±0.05 for the HAC soils (Fig. 12e), 0.23±0.15 for the arenic soils (Fig. 12f) and 0.59±0.04 for the dataset as a whole. This means, for example, that – on average – an increase in [C] of 50 % will result in an increase in CS of only (1.50.59−1) or just 27 %.
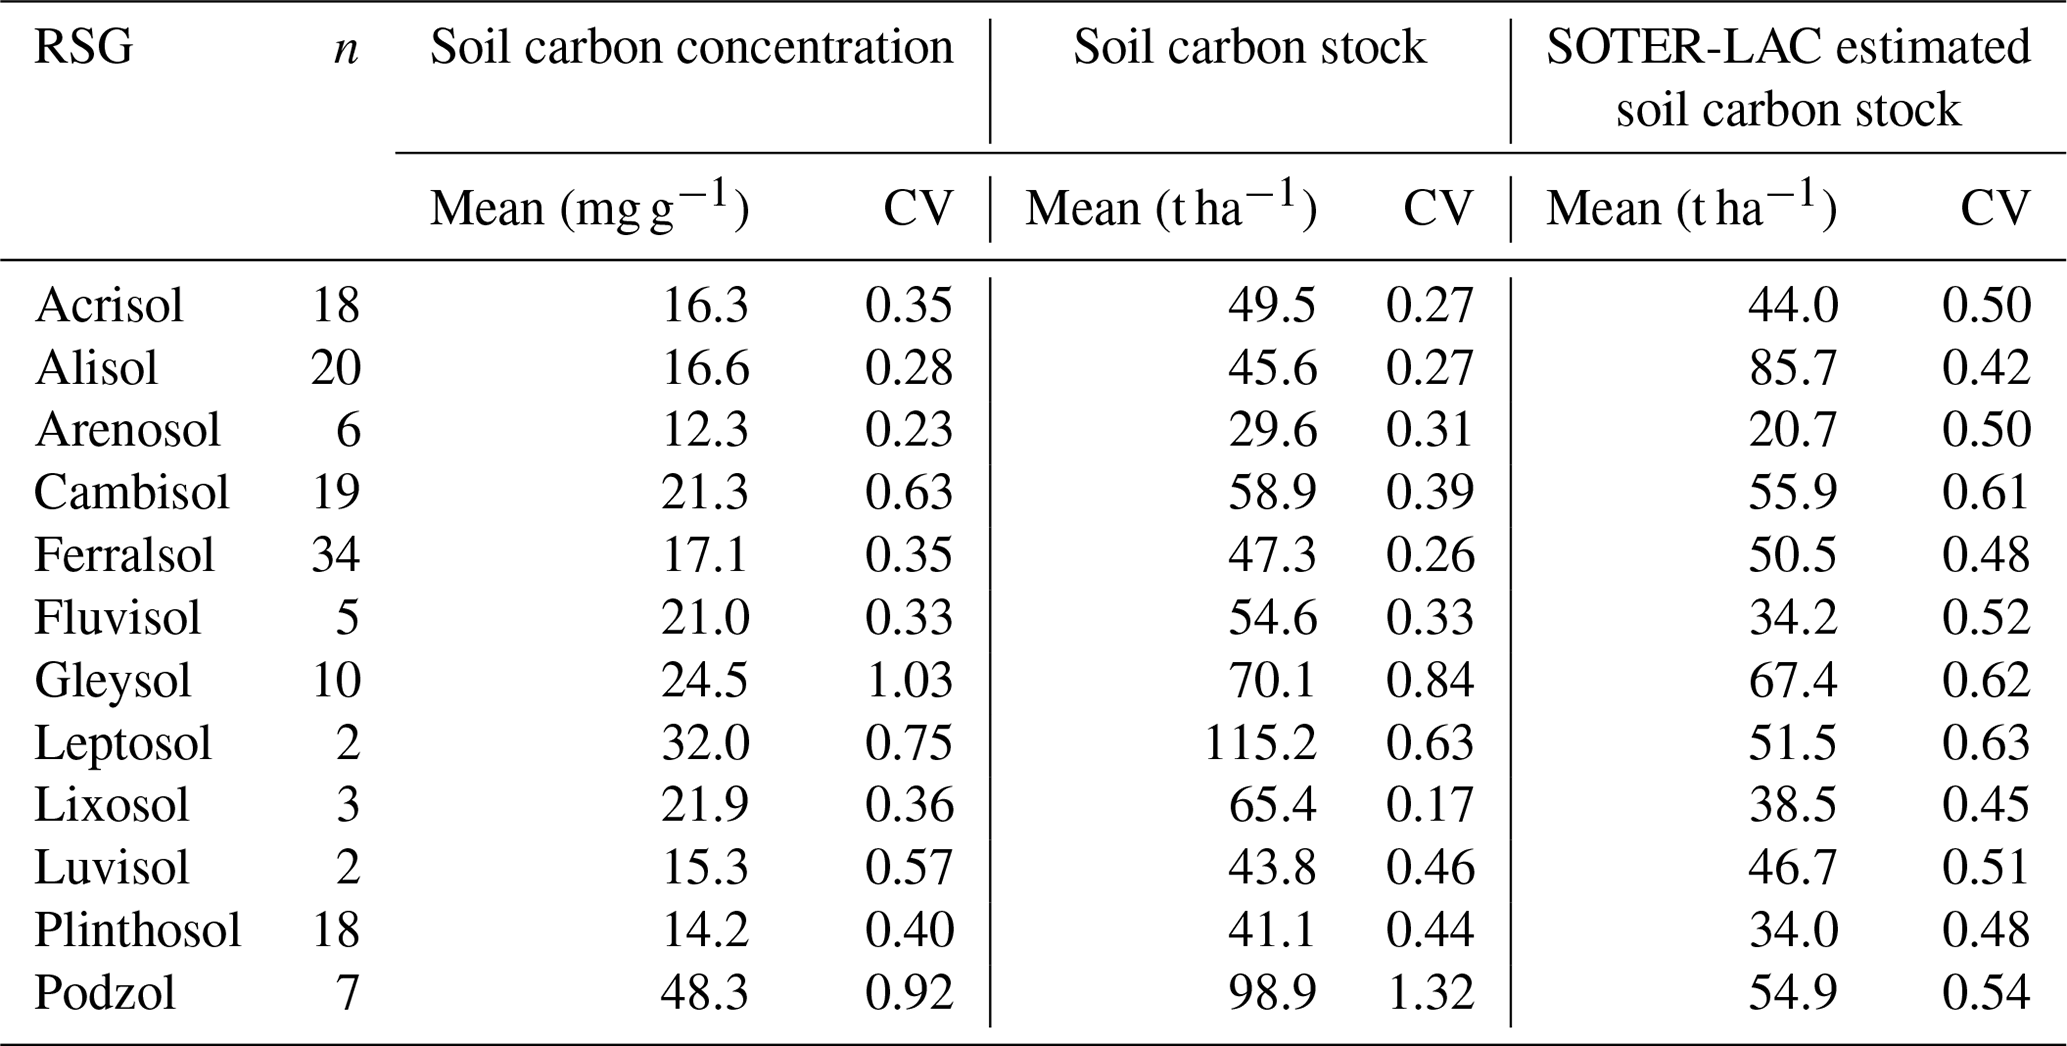
This negative covariance between [C] vs. ρ also means that within a given soil group variation in CS is typically much less than for [C]. For example, as is shown in Table 9, the 12 RSGs examined show a lower coefficient of variation for CS than is the case for [C], with this difference being especially marked for Cambisols (0.63 for [C] vs. 0.39 for CS). Also shown in Table 9 are the mean CS values for the 12 RSGs we have examined as compared to the values given by Batjes (1996), for which we note that in the majority of cases our estimates are surprisingly close, with one exception being the Alisols for which our estimate of around 46 t C ha−1 is only 53 % that of the Batjes (1996) estimate of ca. 86 t C ha−1 to 0.3 m depth. Our Leptosols and Podzol CS estimates are also much higher than those of Batjes (1996).
Table 9Mean soil organic carbon stocks (0–30 cm) for 12 RSGs examined in this study. Stocks from Batjes (1996) are also given for comparison. CV stands for coefficient of variation.
According to our analysis, the three soil groups studied here are characterised by different soil C stabilisation mechanisms. Specifically, highly weathered soils, dominated by low-activity clays such as Ferralsols and Acrisols (our LAC group) have SOC densities that are strongly dependent on their clay and silt contents. However, such simple relationships with fine-earth fractions could not explain SOC variations for the less weathered soils. For the HAC grouping, SOC stabilisation is predominantly related to interactions with Al, and the formation of Al/organic matter co-precipitates. For our arenic soils group, it appears that most of the SOC present is in loose particulate organic matter form and is therefore not stabilised by mineral interactions, though with a surprisingly strong effect of their small clay and silt content variations.
Such differences in the stabilisation mechanisms can arise from the different soils examined being at contrasting pedogenetic development stages and/or differences in parent material. Highly weathered soils such our LAC group have been under constant tropical weathering rates for timescales that range from 100 million to 2 billion years (Hoorn et al., 2010; Quesada et al., 2011), with some of the central and eastern Amazon Basin soils having suffered several cycles of weathering (Herrera et al., 1978; Irion, 1978; Quesada and Lloyd, 2016). This extreme weathering of LAC soils has resulted in a deep uniformity in their mineralogy, which is dominated by kaolinite (Sombroek, 1984), and in the depletion of rock-derived elements. It has also resulted in the development of favourable soil physical properties such as free drainage, low bulk densities and the formation of very deep soil horizons (Quesada et al., 2010).
Nevertheless, it also needs to be remembered that the Amazon Basin has a complex mosaic of soils, with ca. 40 % having young and intermediate pedogenetic development levels (Quesada et al., 2011; Richter and Babbar, 1991; Sanchez, 1976). Most of these less weathered soils occur in the west of the basin and were influenced by the uprising of the Andean Cordillera (Hoorn et al., 2010), thus having much younger geological ages. Much of the soil formation process in this region only came into effect after the Pliocene, with most of the substrate in that region having less than 2 million years (Hoorn and Wesselingh, 2011; Quesada et al., 2011; Quesada and Lloyd, 2016). Soils in that region have a diverse mineralogy, with a high abundance of 2:1 clays and sometimes also some rock-derived easily weatherable minerals (Irion, 1978; Quesada et al., 2010, 2011; Sombroek, 1966, this study). One important characteristic of many HAC soils is the very high amount of Al that is released through the weathering of 2:1 clays (Marques et al., 2002). High active clays are unstable in environments depleted of silica, alkaline and alkaline earth cations, thus releasing soluble aluminium from the octahedral internal layers of the 2:1 clay minerals, with such Al release also increasing with depth (Quesada et al. 2011).
The arenic soil group on the other hand is strongly influenced by its parent material. It comprises the Arenosol and Podzol reference groups, with the latter also being predominantly sandy in Amazonia (Do Nascimento et al., 2004). Both soil types are thought to have evolved from the weathering of aeolian and riverine sediments of siliceous rocks, or in some cases, being locally weathered and deposited in colluvial zones through selective erosion (Buol et al., 2011; Driessen et al., 2000). As quartz usually makes up more than 90 % of their mineral fraction, their surface exchange capacity is very small, resulting in very low nutrient levels as a consequence of a high degree of leaching (Buol et al., 2011; Quesada et al., 2010, 2011). The very low nutrient content of these soils, often associated with high groundwater levels, results in the formation of thick root mats in the soil surface (Herrera et al., 1978) which then strongly influences the amount and vertical distribution of their SOC stocks.
Therefore, our HAC, LAC and arenic soils groups consist of very different soils, with contrasting geological formation and chemical and physical properties. Not surprisingly, such wide variations also resulted in different mechanisms of SOC stabilisation.
4.1 Mechanisms of SOC stabilisation
4.1.1 SOC stabilisation in low-activity clay soils
Since soil C content might reasonably be expected to depend, at least in part, on specific surface area (SSA) because a higher density of exchange sites per unit volume should result in more soil carbon stabilisation through mineral–organic-matter associations (Saidy et al., 2012), the uniform mineralogy of 1:1 soils means that, as shown in Fig. 5 and elsewhere (Burke et al., 1989; Dick et al., 2005; Feller and Beare, 1997; Telles et al., 2003), for LAC soil organic C scales linearly with clay content since the variation in clay content is the main source of variation in SSA.
The observed variation in clay fractions across LAC soils studied here was large, from 0.05 to 0.89. This reflects differences in parent material, with Acrisols tending to have sandier top soils (West et al., 1997). Central and East Amazonia are known for having very clay-rich soils, often having clay content well above 60 % (Chauvel et al., 1987; Sombroek, 1966), with such clays originating from ancient fluvio-lacustrine sediments deposited on the Barreiras and Alter do Chão geological formations locally known as Belterra clays (Sioli, 1984; Sombroek, 1966, 2000). Other regions where Ferralsols dominate, such as the southern fringe of the basin (Quesada et al., 2010), often have much sandier soils.
The uniformity in the clay vs. C relationships shown by our best OLS models indicates an overruling effect of clay content and with some effect from silt (Table 4). The superior predictive power of sand content (−[clay + silt]), compared to clay, as a main determinant of SOC in highly weathered tropical soils has already been shown by Saiz et al. (2012), with these authors concluding that sand content shows less confounding effects than that of clay in these systems. The association of clay with aluminium and iron oxides in highly weathered tropical soils may promote the formation of sesquioxides. Saiz et al. (2012) have shown that these particles confer the soil a coarse-like texture, which exerts a strong influence on soil bulk density and water retention properties. Furthermore, results from Fig. 3a, c also suggest a wide variation of Fe oxides to occur on LAC soils, with Fig. 6 and Tables 3 and 5 indicating that the abundance of Ald is also correlated with SOC. This could be related to increments in SSA resulting from the greater abundance of such minerals (Eusterhues et al., 2005; Kleber et al., 2005; Wiseman and Püttmann, 2006; Saidy et al., 2012) in which an increment in the number of exchange sites may provide additional stabilisation of carbon via direct complexation (Parfitt et al., 1997; Schwertmann et al., 2005) and with direct interactions between SOC, Fe and Al oxides, with clay particles (Wiseman and Püttmann, 2006) also being important. However, Fe and Al hydroxides may also indirectly protect carbon from decomposition through their role in the formation of stable aggregates which make carbon physically inaccessible to decomposers (Kitagawa, 1983; Six et al., 2004; Wagai and Mayer, 2007). This may be of importance for LAC soils since stable clay aggregates were found to store most of the SOC (Sect. 3.5).
Using the Zimmerman et al. (2007) soil carbon fractionations to gain further insights into the stabilisation mechanisms that underlie soil organic matter dynamics (Denef et al., 2010), Fig. 11a shows that the sand and aggregate (S+A) fraction is responsible for holding most of the SOC in LAC soils. This fraction is essentially formed by a mixture of clay, silt, oxides and organic matter, and within this fraction aggregation may promote increased SOC protection as it influences the accessibility of substrate to microorganisms, thus limiting the extent that the diffusion of reactants and products from extracellular synthesis (i.e. soil enzymes) can reach the organic matter (Sollins et al., 1996). For example, pore spaces inside aggregates can be too small to allow access of bacteria (Van Veen and Kuikman, 1990) and efficient enzyme diffusion (Sollins et al., 1996). This then retains SOC in inaccessible micropores inside aggregates (Baldock and Skjemstad, 2000), which ultimately protects SOC from decay, explaining the positive correlation often found between the level of soil aggregation and SOC concentration (Six et al., 2004; Tisdall and Oades, 1982).
Soil aggregation level is also affected by other chemical, microbial, plant, animal and physical processes, many of which seem to be favoured by the tropical climate and thriving biological activity of the tropical moist forest environment. For instance, microbial activity releases polysaccharides that act as binding agents in soil aggregates (Lynch and Bragg, 1985; Oades, 1993) and fungal hyphae are known to bind solid particles together (Sollins et al., 1996). Plant roots also influence soil aggregation by releasing exudates that can directly flocculate colloids and bind or stabilise aggregates (Glinski and Lipiec, 1990). Root exudates may also foster microbial activity which can lead to aggregate formation and stabilisation. Plant roots and associated hyphae can also enmesh soil particles by acting as a “sticky string bag” (Oades, 1993) which binds soil particles. Further, the pressure exerted by roots and soil fauna on soil promotes aggregation (Oades, 1993; Sollins et al., 1996). Soil fauna (including earthworms, termites, collembola, beetles, isopods and millipeds) form fecal pellets and excrete binding agents that form aggregates (Oades, 1993; Sollins et al., 1996). Nevertheless, the presence of Fe and Al oxides in these soils may also favour the formation of soil aggregates (Kitagawa, 1983; Wagai and Mayer, 2007) since they act as binding agents with clays in a process thought to be associated with the large abundance of aggregates in Ferralsols and Acrisols (Paul et al., 2008; Sanchez, 1976; Sollins et al., 1996).
Soil C stabilisation on the surface of Amazonian Ferralsols and Acrisols (1:1 clays) is thus interpreted here as the summation of the effect of variations in kaolinite clay content (varying SSA) and the additional physical protection given by the extensive level of aggregation common to these soils.
4.1.2 Processes of C stabilisation in arenic soils
Since quartz is devoid of significant surface area and exchange sites, the retention of SOC in sand-rich soils is difficult to predict on the basis of soil physiochemical properties as there is no, or very little, mineral–organic-matter interaction. Thus, the bulk SOC variation in our arenic soil group most likely reflects varying edapho-environmental conditions such as groundwater levels and/or moisture regimes, vertical root distribution and/or litter quality. However, small changes in clay and silt content were still found to have large effects on soil [C] (Table 4), with this OLS regression giving a slope 10 times greater than that of LAC soils. This is similar to what Hartemink and Huting (2008) found for 150 Arenosols in southern Africa, where soil carbon content varied from about 0.5 to 12 g kg−1 alongside a change in clay fraction ranging from effectively zero to just 0.12. Similar findings (i.e. 0.8 to 14.5 g kg−1) were also obtained on heavily coarse-textured soils sampled along a 1000 km moisture gradient spanning from southern Botswana into southern Zambia (Bird et al., 2004).
In addition, groundwater fluctuations and the often extremely low nutrient availability of these soils often result in the formation of root mats, covering the top 10 to 50 cm of the soil surface with an impressive mixture of roots and organic matter in different stages of decomposition (Herrera et al., 1978). Such soil mats may reasonably be expected to exert a strong influence on soil SOC concentrations, since they concentrate the inputs of organic matter into a single layer close to the surface. Moreover, because many of these soils are seasonally waterlogged (Quesada et al., 2011) the associated anaerobic conditions should also inhibit decomposition. It is therefore not a surprise that we observed some of the highest [C] in these soils.
Our fractionation results again provided additional information for the understanding of SOC retention, with the bulk of the SOC in arenic soils found as free particulate organic matter, and with this proportion increasing as [C] increases (Fig. 11b). This was particularly the case for seasonally wet sands (up to 60 % of SOC), but with POM also being a significant fraction of the total SOC even in the drier sands (∼30 %). The implication here is that chemical recalcitrance of organic matter may also have a role in these soils: favouring the maintenance of residual, slowly decaying organic particles.
High chemical recalcitrance may be common in such extremely dystrophic arenic soils, with total P levels often as low as 10 mg kg−1. Total P in LAC soils is ca. 10 times greater than in arenic soils, and generally 20–50 times greater in HAC soils (Quesada et al., 2010). Such a low level of nutrient content often results in high levels of plant investment in secondary defense compounds against herbivory (Coley et al., 1985; Fine et al., 2004), and such chemical recalcitrance may affect the decomposition process and thus slightly increase residence time of uncomplexed C in the soil. This may affect POM levels particularly, considering that the most recalcitrant part will have a slower turnover, or be left undecomposed following microbial attack. This is given support by the observations made by Luizão and Schubart (1987), who found that leaf litter decomposition in Amazonian white sands takes twice as long than for Ferralsols and Acrisols during the dry season, and nearly 7 times longer in the wet season when decomposition is more dynamic in the non-white sand soils. Organic acids from residual decomposition from these soils are known to colour the rivers of the region – the Rio Negro, with its head waters within a vast white sand forest region (Quesada et al., 2011), gets its name by virtue of its high humic and fulvic acid content (Fittkau, 1971).
4.1.3 SOC stabilisation in high-activity clay soils
Our results suggest that Al–organic-matter (Al–OM) interaction, or co-precipitation is a fundamental mechanism of SOC stabilisation for the less weathered HAC forest soils of the Amazon Basin, with the OLS models presented here involving complex interactions between Al species (Ald), soil pH and the abundance of aromatic, carboxyl-rich organic matter. The complexity of the models and their high ability to explain SOC densities suggest that this mechanism is fundamental to an understanding of HAC soil C storage.
To our knowledge this is the first time that Al–OM interactions have been suggested as a key factor explaining SOC densities for Amazon forest soils. Nevertheless, with DOC being ubiquitously present in such a highly dynamic system, and with exchangeable Al often abundant as has already been shown to be the case in western Amazon soils (Quesada et al., 2010, 2011; Marques et al., 2002; this study), it is intuitive that Al–OM interactions should encompass a continuum from low-polymeric metal–organic complexes to highly crystalline phases with surface attached organic matter (Kleber et al., 2015). Thus Al–OM interactions forming co-precipitates are likely to be a widespread mechanism that has previously been overlooked because most of the studies in the Amazon Basin have to date only focused on highly weathered soils such as Ferralsols and Acrisols (i.e. Telles et al., 2003). Nevertheless, with less weathered soils occupying circa 40 % of the Amazon Basin (Quesada et al., 2011), it is important to further investigate the role of Al–OM interactions, in particular with regard to their influence over SOC mean residence times (MRTs), since they are likely to be different from what is known for Ferralsols. For example, MRT of SOC in Amazon Ferralsols is about 10 years (Trumbore and Barbosa De Camargo, 2009) as determined by 14C studies, but to our knowledge, no 14C information is available for western Amazon soils, nor is such information is available for MRT of Al–OM co-precipitates. As organic polyelectrolytes reorganise on mineral surfaces over time, they form additional polar covalent bonds, and this ageing process can then lead to a decreased desorbability of OM (Kleber et al., 2015). This means that MRT of Al–OM co-precipitates could well extend to decades or even centuries.
In that respect, it is clear that organic matter becoming co-precipitated with Al results in it becoming more resistant to microbial decay (Kalbitz and Kaiser, 2008; Nierop et al., 2002). At Al–OM concentrations typical of forest soils, up to 80 % of DOC can co-precipitate (Nierop et al., 2002; Scheel et al., 2007), with mineralisation rates of Al–OM co-precipitates formed from DOM much lower than the compounds from which the original, unprecipitated DOM originates (Boudot et al., 1989; Scheel et al., 2007). For instance, using incubations, Scheel et al. (2007) found that the mineralisation extent of Al–OM precipitates ranged from 0.5 % to 7.7 % while the DOM that originated the precipitates had much higher rates (5 % to 49 %). Kalbitz and Kaiser (2008) found that up to 50 % of total SOC in their study site was stabilised from DOM following Al–OM interaction, with the authors suggesting that Al co-precipitation has a stronger capacity to reduce mineralisation than sorption in phyllosilicates.
The formation of Al–OM co-precipitates is influenced by several factors and interacting processes with, according to the extensive review from Kleber et al. (2015), the most important factors being the prevalent metal-to-carbon ratios in the soil solution (M∕C), the presence of aromatic organic compounds, the pH value of soil solution and the metal species present (in which Fe also may have a role). Increasing M∕C ratios increase the probability of reaction with OM while the solution pH controls the solubility and speciation of metals (Al, Fe). With an increasing pH, the efficiency of the process increases, causing larger amounts of precipitates (Scheel et al., 2007). Also, co-precipitation occurs preferentially with aromatic, carboxyl-rich organic structures such as those derived from lignin and tannin decomposition due to their higher affinity for Al complexation sites (Scheel et al., 2007, 2008; Kleber et al., 2015), interactions which were also made clear through the importance of litter lignin content and soil C : N ratio in our OLS results. With regard to metal speciation, our OLS models selected for dithionite extractable Al (Ald) which, having a broad capacity to extract Al bearing minerals, we interpret as a continuum of likely different forms such as free Al (Al+3), Al from Al-interlayer minerals, Al–OM complexes, and both crystalline and amorphous Al hydroxides (particularly at higher pH values).
In interpreting the use of soil C : N ratios as a surrogate for litter quality it needs to be borne in mind, however, that because log(C : N) = log[C] − log[N], this means that embedded in equation 6s is what is known as a “whole-part” correlation (Chayes, 1971) Formula and randomisation techniques exist to estimate the extent to which slopes and correlation coefficients may be biased by the presence of the same terms on both sides for OLS regression equations if their (co-)variances and/or correlations are known (Bartko and Pettigrew, 1968; Lloyd et al., 2013). But unfortunately, due to complex interactions between the fitted terms in such a situation, these cannot be readily applied in a multivariate context (Lloyd et al., 2013). Nevertheless we can say that, even though the observed (bivariate) correlation between log[C] and log(CN) for the HAC soils in our dataset is relatively low (r2=0.23) it is almost certain that the relatively steep log–log slope of 1.16 for the log(CN) effect within Table 6 is inflated. Thus, caution would need to be exercised in applying this equation in any sort of predictive framework. Further insights into carbon stabilisation mechanisms may again be found from the fractionations study. Specifically, Fig. 11c suggests that for HAC the Al–OM precipitates are held together within C+S fractions, this despite there being no simple correlations with clay fraction in the extended dataset. Although this could perhaps be attributed to the use of only a subset of sites used in the fractionation analysis, where the reduced dataset shows stronger associations between [C] and clay content, we suggest that such colloidal sized Al–OM precipitates should be stored alongside the fine-earth fraction. Remarkably 75 % of SOC that occurs is associated with C+S (and its resistant fraction) in these soils, with this fraction being reasonably consistent across a range of soil [C].
4.2 Possible influences of confounding factors
As noted in the Introduction, our approach to modelling the [C] storage potential has been primarily hypothesis based, but also as noted in Sect. 3.6, there were some models that – on the basis of their AIC – are statistically superior to those presented as best models here. For example, in modelling the [C] storage of HAC soils solely on the basis of soil mineralogical properties, then a model also including both Feo and Alo seemed to be the best (equation of Table 6q). Nevertheless, following our rationalisation that plant organic matter quality inputs should also be important, once the surrogate soil CN ratio metric was added to the model, then the difficult-to-explain apparent negative Feo effect became redundant (equations of Tables 6r and 6s). Likewise in Sect. 3.6 we also noted that total reserve bases seemed to be a better predictor than pH in a model of soil C stocks with [Al]d and CN ratio as covariates. We chose pH for our final model on the basis of its known effect on the SOC precipitation process and with the apparent Total Reserve Bases effect rationalised as a simple consequence of its high correlation with pH in HAC soils (τ=0.52, p<0.0001; Table 3).
Also, not included in our final models were the effects of either mean annual temperature or precipitation, which, as well as showing poor associations with SOM storage for all three of our soil groups when considered individually as well as when all soils were pooled together as a whole, also showed no significant association with model residuals (Appendix Fig. 1). Nor – as is suggested by the lack of any systematic bias of model residuals with above-ground wood productivity – was there any suggestion of variations in carbon inputs influencing forest C stocks. This suggests that, across the temperature and precipitation range of our dataset, litter input quality and soil mineral stabilisation mechanisms are the primary determinants of the SOM storage variations: a result which is consistent with microbial decomposition rates acclimating to both temperature (Bradford et al., 2008) and precipitation (Deng et al., 2012).
Our findings do not negate the possibility that future climate changes will have a significant impact on soil carbon stocks in the Amazon Basin. For example, Cotrufo et al. (2013) have postulated that although interactions of organic materials within the soil mineral matrix are the ultimate controllers of SOM stabilisation over long timescales, it is the microbially mediated delivery of organic products to this matrix that provides the critical link between plant litter inputs and what products are available for stabilisation. In this respect a consideration of depths substantially greater than the upper 0.3 m examined here must also be critical for the accurate determination of any future changes in climate stocks, as below 0.3 m Amazon Basin forest soil C are generally quite low, and there is likely existing reactive mineral surfaces yet to be saturated with SOM (Quesada, 2008; Quesada et al., 2010). Moreover, any future inputs into these lower layers, for example as might be mediated though increased litter inputs as a consequence of CO2 fertilisation (Lloyd and Farquhar, 2008), are likely to be microbially derived (Schrumpf et al., 2013). Quite likely the extent of any such additional stabilisation of SOM at these lower depths will differ between HAC, LAC and arenic soils in accordance with the different stabilisation mechanisms as suggested throughout this paper. But in the absence of more detailed information and, indeed, precise confirmations as to the apparent different mechanisms involved in SOM storage as suggested here, then whether or not it is really the case that Amazon forest soil C stocks are currently increasing in response to higher litter inputs with soil developmental stage also influencing that response must remain a matter of simple conjecture.
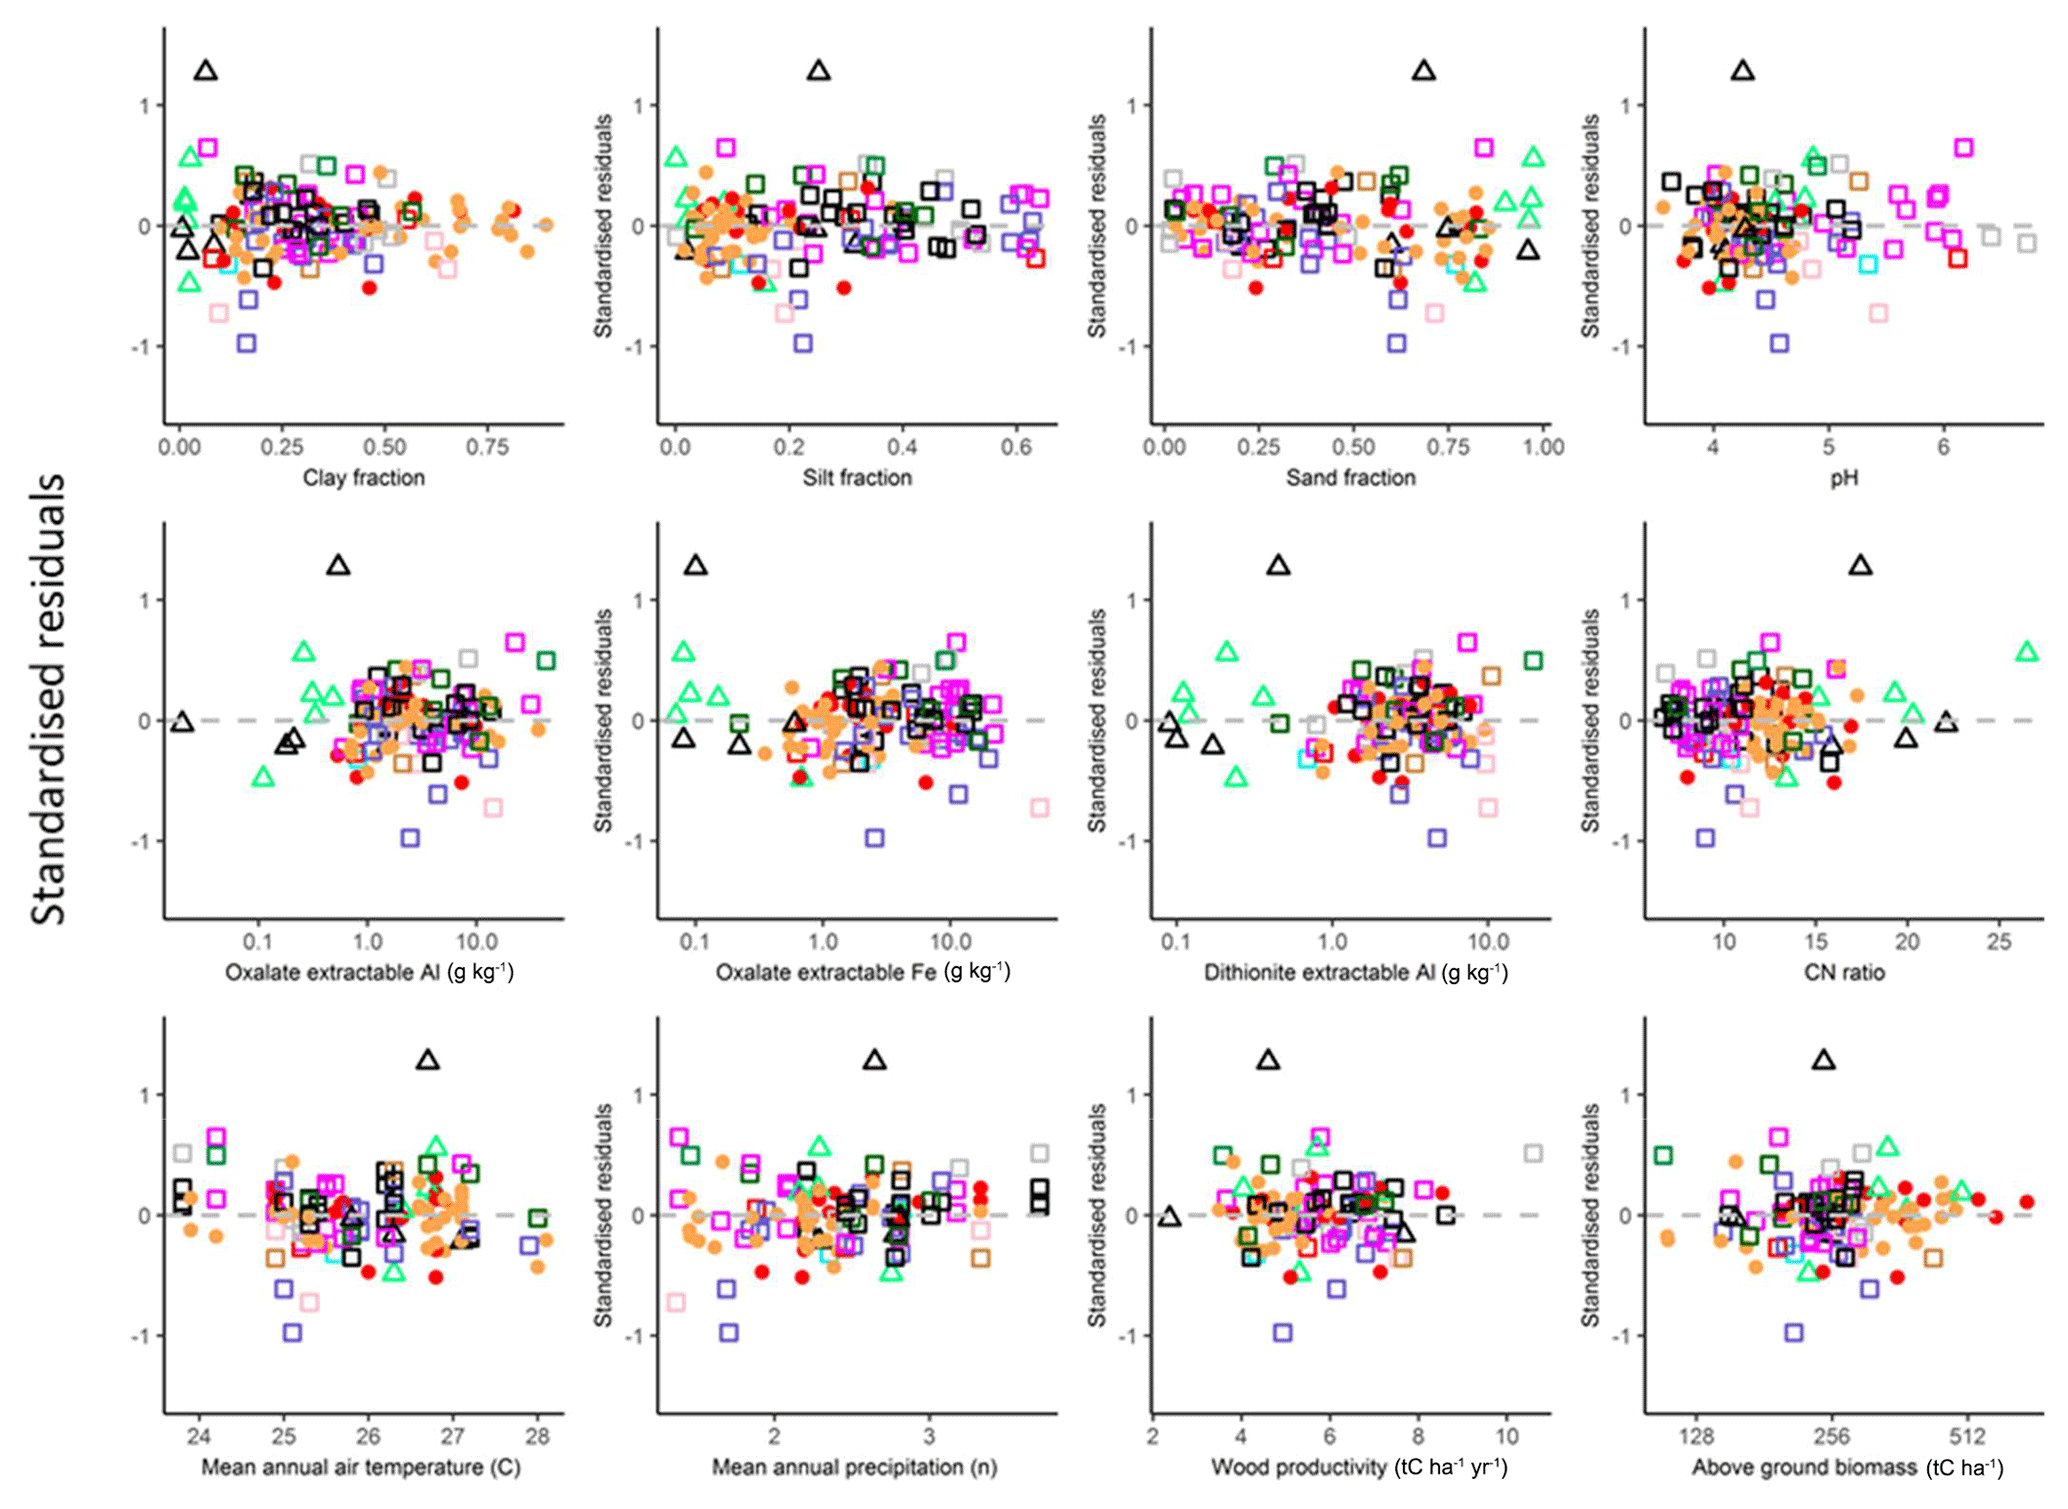
Figure A1Standardised regression model residuals plotted against selected climatic, edaphic and vegetation variables.
Table A1Soil carbon and associated measures of the study soils (0.0–0.3 m). [C]: C concentration; CN: carbon–nitrogen ratio; ρ: bulk density; ∫C: total soil C; Fed: dithionite extractable iron; Feo: oxalate extractable iron; Ald: dithionite extractable aluminium; Alo: oxalate extractable aluminium; Alo: pyrophosphate extractable aluminium.
All data used in the figures and analysis here are made available in the tables, with the exception of the above-ground wood productivity and above-ground biomass data (Appendix Fig. A1), which are available in Brienen et al. (2015).
CAQ and EOM conducted field sampling. CAQ, CP and GS performed laboratory analysis. OLP and JL supported the study and the maintenance of the RAINFOR network. All authors reviewed and commented on the manuscript. CAQ and JL performed data analysis and wrote the manuscript.
The authors declare that they have no conflict of interest.
This paper is a product of the RAINFOR network. It integrates the effort of several researchers, technicians and field assistants across Amazonia. We thank the following individuals in particular: Michael Schwarz, Gabriel Batista de Oliveira Borges, Claudia Czimczk, Jens Schmerler, Alexandre J. B. Santos, Gareth Lloyd, Timothy R. Baker, Sandra Patiño, Yadvinder Malhi, Jonas O. Moraes Filho, Orlando F. C. Junior, José Edivaldo Chaves and Raimundo Nonato de Araújo Filho.
Support for RAINFOR has come principally from the Natural Environment Research Council (grant nos. NE/D005590/1 (“TROBIT”), NE/B503384/1, NE/D01025X/1, NE/I02982X/1, NE/F005806/1 and NE/I028122/1), the Gordon and Betty Moore Foundation (grant no. 1656), the European Research Council (advanced grant no. 291585, “T-FORCES”) and the EU Seventh Framework Programme (grant nos. GEOCARBON283080, AMAZALERT-282664). Jon Lloyd was supported by a Royal Society of London Research Merit Award and a São Paulo Excellence Chair.
This paper was edited by Elizabeth Bach and reviewed by two anonymous referees.
Baldock, J. A. and Skjemstad, J. O.: Role of the soil matrix and minerals in protecting natural organic materials against biological attack, Org. Geochem., 31, 697–710, 2000.
Bartko, J. J. and Pettigrew, K. D.: The Teacher's Corner: A Note on the Correlation of Parts with Wholes, Am. Stat., 22, p. 41, 1968.
Bartoń, K.: MuMIn: Multi-model inference, R package version 1.9. 13, The Comprehensive R Archive Network (CRAN), Vienna, Austria, 1–76, 2013.
Basile-Doelsch, I., Amundson, R., Stone, W. E. E., Masiello, C. A., Bottero, J. Y., Colin, F., Masin, F., Borschneck, D., and Meunier, J. D.: Mineralogical control of organic carbon dynamics in a volcanic ash soil on La Réunion, Eur. J. Soil Sci., 56, 689–703, 2005.
Batjes, N. H.: Total carbon and nitrogen in the soils of the world, Eur. J. Soil Sci., 47, 151–163, 1996.
Batjes, N. H. and Dijkshoorn, J. A.: Carbon and nitrogen stocks in the soils of the Amazon Region, Geoderma, 89, 273–286, 1999.
Bird, M. I., Veenendaal, E. M., and Lloyd, J. J.: Soil carbon inventories and δ13C along a moisture gradient in Botswana, Glob. Change Biol., 10, 342–349, https://doi.org/10.1046/j.1365-2486.2003.00695.x, 2004.
Bish, D. L. and Reynolds, R. C.: Sample preparation for X-ray diffraction, Rev. Mineral. Geochem., 20, 73–99, 1989.
Boudot, J. P., Hadj, A. B., Steiman, R., and Seigle-Murandi, F.: Biodegradation of synthetic organo-metallic complexes of iron and aluminium with selected metal to carbon ratios, Soil Biol. Biochem., 21, 961–966, 1989.
Bradford, M. A., Davies, C. A., Frey, S. D., Maddox, T. R., Melillo, J. M., Mohan, J. E., Reynolds, J. F., Treseder, K. K., and Wallenstein, M. D.: Thermal adaptation of soil microbial respiration to elevated temperature, Ecol. Lett., 11, 1316–1327, 2008.
Brienen, R. J. W., Phillips, O. L., Feldpausch, T. R., Gloor, E., Baker, T. R., Lloyd, J., Lopez-Gonzalez, G., Monteagudo-Mendoza, A., Malhi, Y., Lewis, S. L., Vasquez Martinez, R., Alexiades, M., Alvarez Davila, E., Alvarez-Loayza, P., Andrade, A., Aragao, L. E. O. C., Araujo-Murakami, A., Arets, E. J. M. M., Arroyo, L., Aymard C, G. A., Banki, O. S., Baraloto, C., Barroso, J., Bonal, D., Boot, R. G. A., Camargo, J. L. C., Castilho, C. V., Chama, V., Chao, K. J., Chave, J., Comiskey, J. A., Cornejo Valverde, F., da Costa, L., de Oliveira, E. A., Di Fiore, A., Erwin, T. L., Fauset, S., Forsthofer, M., Galbraith, D. R., Grahame, E. S., Groot, N., Herault, B., Higuchi, N., Honorio Coronado, E. N., Keeling, H., Killeen, T. J., Laurance, W. F., Laurance, S., Licona, J., Magnussen, W. E., Marimon, B. S., Marimon-Junior, B. H., Mendoza, C., Neill, D. A., Nogueira, E. M., Nunez, P., Pallqui Camacho, N. C., Parada, A., Pardo-Molina, G., Peacock, J., Pena-Claros, M., Pickavance, G. C., Pitman, N. C. A., Poorter, L., Prieto, A., Quesada, C. A., Ramirez, F., Ramirez-Angulo, H., Restrepo, Z., Roopsind, A., Rudas, A., Salomao, R. P., Schwarz, M., Silva, N., Silva-Espejo, J. E., Silveira, M., Stropp, J., Talbot, J., ter Steege, H., Teran-Aguilar, J., Terborgh, J., Thomas-Caesar, R., Toledo, M., Torello-Raventos, M., Umetsu, R. K., van der Heijden, G. M. F., van der Hout, P., Guimaraes Vieira, I. C., Vieira, S. A., Vilanova, E., Vos, V. A., and Zagt, R. J.: Long-term decline of the Amazon carbon sink, Nature, 519, 344–348, 2015.
Bruun, T. B., Elberling, B., and Christensen, B. T.: Lability of soil organic carbon in tropical soils with different clay minerals, Soil Biol. Biochem., 42, 888–895, 2010.
Buol, S. W., Southard, R. J., Graham, R. C., and McDaniel, P. A.: Soil genesis and classification, John Wiley & Sons, 543 pp., 2011.
Burke, I. C., Yonker, C. M., Parton, W. J., Cole, C. V., Schimel, D. S., and Flach, K.: Texture, climate, and cultivation effects on soil organic matter content in US grassland soils, Soil Sci. Soc. Am. J., 53, 800–805, 1989.
Chauvel, A., Lucas, Y., and Boulet, R.: On the genesis of the soil mantle of the region of Manaus, Central Amazonia, Brazil, Cell. Mol. Life Sci., 43, 234–241, https://doi.org/10.1007/bf01945546, 1987.
Chayes, F.: Ratio correlation: a manual for students of petrology and geochemistry, University of Chicago Press, 99 pp., 1971.
Coley, P. D., Bryant, J. P., and Chapin, F. S. I.: Resource availability and plant antiherbivore defense, Science, 230, 895–899, https://doi.org/10.1126/science.230.4728.895, 1985.
Cornell, R. M. and Schwertmann, U.: The iron oxides: structure, properties, reactions, occurrences and uses, John Wiley & Sons, 137 pp., 2003.
Cotrufo, M. F., Wallenstein, M. D., Boot, C. M., Denef, K., and Paul, E.: The M icrobial E fficiency-M atrix S tabilization (MEMS) framework integrates plant litter decomposition with soil organic matter stabilization: do labile plant inputs form stable soil organic matter?, Glob. Change Biol., 19, 988–995, 2013.
Delvaux, B., Herbillon, A. J., and Vielvoye, L.: Characterization of a weathering sequence of soils derived from volcanic ash in Cameroon: Taxonomic, mineralogical and agronomic implications, Geoderma, 45, 375–388, https://doi.org/10.1016/0016-7061(89)90017-7, 1989.
de Mendiburu, F.: Statistical procedures for agricultural research. Package “Agricolae”, version 1.4-4, Comprehensive R Archive Network, Institute for Statistics and Mathematics, Vienna, Austria, available at: http://cran.r-project.org/web/packages/agricolae/agricolae.pdf (last access: 15 May 2019), 2013.
Denef, K., Plante, A. F., and Six, J.: Characterization of soil organic matter, in: Soil carbon dynamics: An integrated methodology, Cambridge University Press, 91–126, 2010.
Deng, Q., Hui, D., Zhang, D., Zhou, G., Liu, J., Liu, S., Chu, G., and Li, J.: Effects of precipitation increase on soil respiration: a three-year field experiment in subtropical forests in China, PLoS One, 7, e41493, https://doi.org/10.1371/journal.pone.0041493, 2012.
Dick, D. P., Gonçalves, C. N., Dalmolin, R. S., Knicker, H., Klamt, E., Kögel-Knabner, I., Simões, M. L., and Martin-Neto, L.: Characteristics of soil organic matter of different Brazilian Ferralsols under native vegetation as a function of soil depth, Geoderma, 124, 319–333, 2005.
Do Nascimento, N. R., Bueno, G. T., Fritsch, E., Herbillon, A. J., Allard, T., Melfi, A. J., Astolfo, R., Boucher, H., and Li, Y.: Podzolization as a deferralitization process: a study of an Acrisol–Podzol sequence derived from Palaeozoic sandstones in the northern upper Amazon Basin, Eur. J. Soil Sci., 55, 523–538, 2004.
Driessen, P., Deckers, J., Spaargaren, O., and Nachtergaele, F.: Lecture notes on the major soils of the world, Food and Agriculture Organization (FAO), 334 pp., 2000.
Eusterhues, K., Rumpel, C., and Kögel-Knabner, I.: Stabilization of soil organic matter isolated via oxidative degradation, Org. Geochem., 36, 1567–1575, 2005.
Feller, C. and Beare, M. H.: Physical control of soil organic matter dynamics in the tropics, Geoderma, 79, 69–116, 1997.
Fine, P. V., Mesones, I., and Coley, P. D.: Herbivores promote habitat specialization by trees in Amazonian forests, Science, 305, 663–665, 2004.
Fittkau, E. J.: Esboco de uma divisao ecologica da regiao Amazonica, edited by: Idrobo, I. M., 363–372, 1971.
Gee, G. W. and Bauder, J. W.: Particle-size analysis, in: Methods in Soil Analysis, Part 1, Physical and Mineralogical Methods, edited by: Klute, A., American Society of Agronomy and Soil Science Society of America, Madison, Wisconsin, USA, 383–409, 1986.
Giraudoux, P.: pgirmess: data analysis in ecology, R package version 1.5. 8, R Foundation for Statistical Computing Vienna, Austria, 64 pp., 2013.
Glinski, J. and Lipiec, J.: Soil physical conditions and plant roots. CRC press. Boca Raton, FL, 250 pp., 1990.
Hartemink, A. E. and Huting, J.: Land cover, extent, and properties of Arenosols in Southern Africa, Arid Land Res. Manag., 22, 134–147, 2008.
Herrera, R., Jordan, C. F., Klinge, H., and Medina, E.: Amazon ecosystems: Their structure and functioning with particular emphasis on nutrients, Interciencia, 3, 223–232, 1978.
Hoorn, C. and Wesselingh, F.: Amazonia: landscape and species evolution: a look into the past, John Wiley & Sons, 447 pp., 2011.
Hoorn, C., Wesselingh, F. P., Ter Steege, H., Bermudez, M. A., Mora, A., Sevink, J., Sanmartín, I., Sanchez-Meseguer, A., Anderson, C. L., and Figueiredo, J. P.: Amazonia through time: Andean uplift, climate change, landscape evolution, and biodiversity, Science, 330, 927–931, 2010.
Irion, G.: Soil infertility in the Amazonian rain forest, Naturwissenschaften, 65, 515–519, https://doi.org/10.1007/BF00439791, 1978.
IUSS: (International Union of Soil Science) Working Group WRB: 70 World Reference Base for Soil Resources 2014, International Soil Classification System For Naming Soils And Creating Legends For Soil Maps, Rome, 2014.
Jahn, R., Blume, H.-P., Asio, V. B., Spaargaren, O., and Schad, P.: Guidelines for soil description, FAO, Rome, 97 pp., 2006.
Kahle, M., Kleber, M., Torn, M. S., and Jahn, R.: Carbon storage in coarse and fine clay fractions of illitic soils, Soil Sci. Soc. Am. J., 67, 1732–1739, 2003.
Kahle, M., Kleber, M., and Jahn, R.: Retention of dissolved organic matter by phyllosilicate and soil clay fractions in relation to mineral properties, Org. Geochem., 35, 269–276, 2004.
Kaiser, K. and Guggenberger, G.: Mineral surfaces and soil organic matter, Eur. J. Soil Sci., 54, 219–236, https://doi.org/10.1046/j.1365-2389.2003.00544.x, 2003.
Kaiser, K. and Zech, W.: Sorption of dissolved organic nitrogen by acid subsoil horizons and individual mineral phases, Eur. J. Soil Sci., 51, 403–411, 2000.
Kaiser, K., Mikutta, R., and Guggenberger, G.: Increased stability of organic matter sorbed to ferrihydrite and goethite on aging, Soil Sci. Soc. Am. J., 71, 711–719, 2007.
Kalbitz, K. and Kaiser, K.: Contribution of dissolved organic matter to carbon storage in forest mineral soils, J. Plant Nutr. Soil Sci., 171, 52–60, 2008.
Kitagawa, Y.: Goethite and hematite in some solls from the amazon region, Soil Sci. Plant Nutr., 29, 209–217, 1983.
Kleber, M., Mikutta, R., Torn, M. S., and Jahn, R.: Poorly crystalline mineral phases protect organic matter in acid subsoil horizons, Eur. J. Soil Sci., 56, 717–725, 2005.
Kleber, M., Eusterhues, K., Keiluweit, M., Mikutta, C., Mikutta, R., and Nico, P. S.: Mineral–organic associations: formation, properties, and relevance in soil environments, in Advances in agronomy, Elsevier, 130, 1–140, 2015.
Lloyd, J. and Farquhar, G. D.: Effects of rising temperatures and [CO2] on the physiology of tropical forest trees, Philos. T. R. Soc. B, 363, 1811–1817, https://doi.org/10.1098/rstb.2007.0032, 2008.
Lloyd, J., Bloomfield, K., Domingues, T. F., and Farquhar, G. D.: Photosynthetically relevant foliar traits correlating better on a mass vs. an area basis: of ecophysiological relevance or just a case of mathematical imperatives and statistical quicksand?, New Phytol., 199, 311–321, 2013.
Luizão, F. J. and Schubart, H. O. R.: Litter production and decomposition in a terra-firme forest of Central Amazonia, Experientia, 43, 259–265, 1987.
Lynch, J. M. and Bragg, E.: Microorganisms and soil aggregate stability, in: Advances in soil science, Springer, 133–171, 1985.
Marques, J. J., Teixeira, W. G., Schulze, D. G., and Curi, N.: Mineralogy of soils with unusually high exchangeable Al from the western Amazon Region, Clay Miner., 37, 651–661, 2002.
Mikutta, R., Kleber, M., and Jahn, R.: Poorly crystalline minerals protect organic carbon in clay subfractions from acid subsoil horizons, Geoderma, 128, 106–115, 2005.
Mikutta, R., Mikutta, C., Kalbitz, K., Scheel, T., Kaiser, K., and Jahn, R.: Biodegradation of forest floor organic matter bound to minerals via different binding mechanisms, Geochim. Cosmochim. Ac., 71, 2569–2590, 2007.
Nelson, D. W. and Sommers, L. E.: Total carbon and total nitrogen, in: Methods of Soil Analysis: Part 3 – Chemical Methods, edited by: Sparks, D. L., American Society of Agronomy/Soil Science Society of America, Madison, WI, 961–1010, 1996.
Nierop, K. G., Jansen, B., and Verstraten, J. M.: Dissolved organic matter, aluminium and iron interactions: precipitation induced by metal/carbon ratio, pH and competition, Sci. Total Environ., 300, 201–211, 2002.
Oades, J. M.: The role of biology in the formation, stabilization and degradation of soil structure, in: Soil Structure/Soil Biota Interrelationships, Elsevier, 377–400, 1993.
Oades, J. M.: An Introduction to Organic Matter in Mineral Soils, in: Minerals in Soil Environments, edited by: Dixon, J. B. and Weed, S. B., 89–159, https://doi.org/10.2136/sssabookser1.2ed.c3, 2018.
Parfitt, R. L. and Childs, C. W.: Estimation of forms of Fe and Al-a review, and analysis of contrasting soils by dissolution and Mossbauer methods, Soil Res., 26, 121–144, 1988.
Parfitt, R. L., Theng, B. K. G., Whitton, J. S., and Shepherd, T. G.: Effects of clay minerals and land use on organic matter pools, Geoderma, 75, 1–12, 1997.
Paul, S., Flessa, H., Veldkamp, E., and López-Ulloa, M.: Stabilization of recent soil carbon in the humid tropics following land use changes: evidence from aggregate fractionation and stable isotope analyses, Biogeochemistry, 87, 247–263, 2008.
Paz, C. P.: Distribuição das frações do carbono orgânico nos solos de florestas maduras na bacia Amazônica: o papel das propriedades do solo, da qualidade da liteira e do clima, MSc thesis, Instituto Nacional de Pesquisas da Amazô̂nia, Brazil, 62 pp., 2011.
Pella, E.: Elemental organic analysis, Part 2, State of the art, Am. Lab., 22, 28–32, 1990.
Percival, H. J., Parfitt, R. L., and Scott, N. A.: Factors controlling soil carbon levels in New Zealand grasslands is clay content important?, Soil Sci. Soc. Am. J., 64, 1623–1630, 2000.
Pleysier, J. L. and Juo, A. S. R.: A single-extraction method using silver-thiourea for measuring exchangeable cations and effective CEC in soils with variable charges, Soil Sci., 129, 205–211, 1980.
Quesada, C. A. and Lloyd, J.: Soil–Vegetation Interactions in Amazonia, in: Interactions Between Biosphere, Atmosphere and Human Land Use in the Amazon Basin, edited by: Nagy, L., Forsberg, B. R., and Artaxo, P., Springer Berlin Heidelberg, Berlin, Heidelberg, 267–299, 2016.
Quesada, C. A., Lloyd, J., Schwarz, M., Patiño, S., Baker, T. R., Czimczik, C., Fyllas, N. M., Martinelli, L., Nardoto, G. B., Schmerler, J., Santos, A. J. B., Hodnett, M. G., Herrera, R., Luizão, F. J., Arneth, A., Lloyd, G., Dezzeo, N., Hilke, I., Kuhlmann, I., Raessler, M., Brand, W. A., Geilmann, H., Moraes Filho, J. O., Carvalho, F. P., Araujo Filho, R. N., Chaves, J. E., Cruz Junior, O. F., Pimentel, T. P., and Paiva, R.: Variations in chemical and physical properties of Amazon forest soils in relation to their genesis, Biogeosciences, 7, 1515–1541, https://doi.org/10.5194/bg-7-1515-2010, 2010.
Quesada, C. A., Lloyd, J., Anderson, L. O., Fyllas, N. M., Schwarz, M., and Czimczik, C. I.: Soils of Amazonia with particular reference to the RAINFOR sites, Biogeosciences, 8, 1415–1440, https://doi.org/10.5194/bg-8-1415-2011, 2011.
Quesada, C. A., Phillips, O. L., Schwarz, M., Czimczik, C. I., Baker, T. R., Patiño, S., Fyllas, N. M., Hodnett, M. G., Herrera, R., Almeida, S., Alvarez Dávila, E., Arneth, A., Arroyo, L., Chao, K. J., Dezzeo, N., Erwin, T., di Fiore, A., Higuchi, N., Honorio Coronado, E., Jimenez, E. M., Killeen, T. J., Lezama, A. T., Lloyd, G., López-González, G., Luizão, F. J., Malhi, Y., Monteagudo, A., Neill, D. A., Núñez Vargas, P., Paiva, R., Peacock, J., Peñuela, M. C., Peña Cruz, A., Pitman, N., Priante Filho, N., Prieto, A., Ramírez, H., Rudas, A., Salomão, R., Santos, A. J. B., Schmerler, J., Silva, N., Silveira, M., Vásquez, R., Vieira, I., Terborgh, J., and Lloyd, J.: Basin-wide variations in Amazon forest structure and function are mediated by both soils and climate, Biogeosciences, 9, 2203–2246, https://doi.org/10.5194/bg-9-2203-2012, 2012.
Quesada, C. A. N.: Soil vegetation interactions across Amazonia, University of Leeds (School of Geography), 236 pp., 2008.
R Development Core Team: R: A Language and Environment for Statistical Computing, edited by: Austria, R., Foundation for Statistical Computing Vienna Austria, 0(01/19), ISBN 3-900051-07-0, 2012.
Richter, D. D. and Babbar, L. I.: Soil diversity in the tropics, Elsevier, Adv. Ecol. Res., 21, 315–389, 1991.
Saggar, S., Parshotam, A., Sparling, G. P., Feltham, C. W., and Hart, P. B. S.: 14C-labelled ryegrass turnover and residence times in soils varying in clay content and mineralogy, Soil Biol. Biochem., 28, 1677–1686, 1996.
Saggar, S., Parshotam, A., Hedley, C., and Salt, G.: 14C-labelled glucose turnover in New Zealand soils, Soil Biol. Biochem., 31, 2025–2037, 1999.
Saidy, A. R., Smernik, R. J., Baldock, J. A., Kaiser, K., Sanderman, J., and Macdonald, L. M.: Effects of clay mineralogy and hydrous iron oxides on labile organic carbon stabilisation, Geoderma, 173, 104–110, 2012.
Saiz, G., Bird, M. I., Domingues, T. F., Schrodt, F., Schwarz, M., Feldpausch, T. R., Veenendaal, E. M., Djagbletey, G., Hien, F., Compaore, H., Diallo, A., and Lloyd, J.: Variation in soil carbon stocks and their determinants across a precipitation gradient in West Africa, Glob. Change Biol., 18, 1670–1683, https://doi.org/10.1111/j.1365-2486.2012.02657.x, 2012.
Saiz, G., Bird, M., Wurster, C., Quesada, C. A., Ascough, P., Domingues, T., Schrodt, F., Schwarz, M., Feldpausch, T. R., Veenendaal, E., Djagbletey, G., Jacobsen, G., Hien, F., Compaore, H., Diallo, A., and Lloyd, J.: The influence of C3 and C4 vegetation on soil organic matter dynamics in contrasting semi-natural tropical ecosystems, Biogeosciences, 12, 5041–5059, https://doi.org/10.5194/bg-12-5041-2015, 2015.
Sanchez, P. A.: Properties and Management of Soils in the Tropics, Wiley, New York, 618 pp., 1976.
Scheel, T., Dörfler, C., and Kalbitz, K.: Precipitation of dissolved organic matter by aluminum stabilizes carbon in acidic forest soils, Soil Sci. Soc. Am. J., 71, 64–74, 2007.
Scheel, T., Haumaier, L., Ellerbrock, R. H., Rühlmann, J., and Kalbitz, K.: Properties of organic matter precipitated from acidic forest soil solutions, Org. Geochem., 39, 1439–1453, 2008.
Schrumpf, M., Kaiser, K., Guggenberger, G., Persson, T., Kögel-Knabner, I., and Schulze, E.-D.: Storage and stability of organic carbon in soils as related to depth, occlusion within aggregates, and attachment to minerals, Biogeosciences, 10, 1675–1691, https://doi.org/10.5194/bg-10-1675-2013, 2013.
Schwertmann, U., Wagner, F., and Knicker, H.: Ferrihydrite–humic associations, Soil Sci. Soc. Am. J., 69, 1009–1015, 2005.
Siegel, S. and Castellan Jr., N.: Nonparametric statistics for the behavioural sciences, 2nd Edn., McGraw-Hill, Boston, 399 pp., 1998.
Sioli, H.: The Amazon and its main affluents: hydrography, morphology of the river courses, and river types, in: The Amazon, Springer, 127–165, 1984.
Six, J., Bossuyt, H., Degryze, S., and Denef, K.: A history of research on the link between (micro) aggregates, soil biota, and soil organic matter dynamics, Soil Till. Res., 79, 7–31, 2004.
Sollins, P., Homann, P., and Caldwell, B. A.: Stabilization and destabilization of soil organic matter: mechanisms and controls, Geoderma, 74, 65–105, 1996.
Sombroek, W. G.: A Reconnaissance of the Soils of the Brazilian Amazon Region, Centre for Agricultural Publications and Documentation, Wageningen, 292 pp., 1966.
Sombroek, W. G.: Soils of the Amazon region, in The Amazon, Springer, 521–535, 1984.
Sombroek, W. G.: Amazon landforms and soils in relation to biological diversity, Acta Amazon., 30, 81–100, 2000.
Telles, E. de C. C., de Camargo, P. B., Martinelli, L. A., Trumbore, S. E., da Costa, E. S., Santos, J., Higuchi, N., and Oliveira Jr., R. C.: Influence of soil texture on carbon dynamics and storage potential in tropical forest soils of Amazonia, Global Biogeochem. Cy., 17, 1–12, 2003.
Tiessen, H. and Moir, J. O.: Total and Organic Carbon, in: Soil Sampling and Methods of Analysis, edited by: Carter, M. R., 187–199, Lewis Publishers, Boca Raton, FL, 1993.
Tisdall, J. M. and Oades, J.: Organic matter and water-stable aggregates in soils, J. Soil Sci., 33, 141–163, 1982.
Trumbore, S. and Barbosa De Camargo, P.: Soil carbon dynamics, Amazonia and Global Change, 186, 451–462, 2009.
Trumbore, S. E. and Zheng, S.: Comparison of fractionation methods for soil organic matter 14C analysis, Radiocarbon, 38, 219–229, 1996.
van den Boogaart, K. G. and Tolosana-Delgado, R.: “Compositions”: a unified R package to analyze compositional data, Comput. Geosci., 34, 320–338, 2008.
van Lützow, M., Kögel-Knabner, I., Ekschmitt, K., Matzner, E., Guggenberger, G., Marschner, B., and Flessa, H.: Stabilization of organic matter in temperate soils: mechanisms and their relevance under different soil conditions – a review, Eur. J. Soil Sci., 57, 426–445, 2006.
Van Reeuwijk, L. P.: Procedures for soil analysis, 6th Edn., International Soil Reference Information Centre, ISRIC, Wageningen, The Netherlands, 2002.
Van Soest, P. J.: Use of detergents in the analysis of fibrous feeds, 2. A rapid method for the determination of fiber and lignin, J. Assoc. Off. Agr. Chem., 46, 829–835, 1963.
Van Veen, J. A. and Kuikman, P. J.: Soil structural aspects of decomposition of organic matter by micro-organisms, Biogeochemistry, 11, 213–233, 1990.
Wagai, R. and Mayer, L. M.: Sorptive stabilization of organic matter in soils by hydrous iron oxides, Geochim. Cosmochim. Ac., 71, 25–35, 2007.
West, L. T., Beinroth, F. H., Sumner, M. E., and Kang, B. T.: Ultisols: Characteristics and impacts on society, in: Advances in Agronomy, Vol. 63, Elsevier, 179–236, 1997.
Wiseman, C. L. S. and Püttmann, W.: Interactions between mineral phases in the preservation of soil organic matter, Geoderma, 134, 109–118, 2006.
Wurster, C. M., Saiz, G., Calder, A., and Bird, M. I.: Recovery of organic matter from mineral-rich sediment and soils for stable isotope analyses using static dense media, Rapid Commun. Mass Sp., 24, 165–168, 2010.
Zimmermann, M., Leifeld, J., Schmidt, M. W. I., Smith, P., and Fuhrer, J.: Measured soil organic matter fractions can be related to pools in the RothC model, Eur. J. Soil Sci., 58, 658–667, 2007.