the Creative Commons Attribution 4.0 License.
the Creative Commons Attribution 4.0 License.
Variation of soil organic carbon, stable isotopes, and soil quality indicators across an erosion–deposition catena in a historical Spanish olive orchard
Gema Guzmán
Arsenio Toloza
Christian Resch
Roberto García-Ruíz
Lionel Mabit
This study compares the distribution of bulk soil organic carbon (SOC), its fractions (unprotected and physically, chemically, and biochemically protected), available phosphorus (Pavail), organic nitrogen (Norg), and stable isotope (δ15N and δ13C) signatures at four soil depths (0–10, 10–20, 20–30, and 30–40 cm) between a nearby open forest reference area and a historical olive orchard (established in 1856) located in southern Spain. In addition, these soil properties, as well as water stable aggregates (Wsagg), were contrasted at eroding and deposition areas within the olive orchard, previously determined using 137Cs. SOC stock in the olive orchard (about 40 t C ha−1) was only 25 % of that in the forested area (about 160 t C ha−1) in the upper 40 cm of soil, and the reduction was especially severe in the unprotected organic carbon. The reference and the orchard soils also showed significant differences in the δ13C and δ15N signals, likely due to the different vegetation composition and N dynamics in both areas. Soil properties along a catena, from erosion to deposition areas within the old olive orchard, showed large differences. Soil Corg, Pavail and Norg content, and δ15N at the deposition were significantly higher than those of the erosion area, defining two distinct areas with a different soil quality status. These overall results indicate that the proper understanding of Corg content and soil quality in olive orchards requires the consideration of the spatial variability induced by erosion–deposition processes for a convenient appraisal at the farm scale.
- Article
(7375 KB) - Full-text XML
- BibTeX
- EndNote
Research on soil organic carbon (SOC) sequestration and the potential of agricultural soils to store carbon has increased since the declaration of the 4 per 1000 program (Lal, 2015), which seeks to increase global soil organic carbon stocks by 0.4 % per year as compensation for global anthropogenic C emissions. Under this program, special emphasis is given to combating soil degradation due to its strong impact on the global carbon cycle because of the depletion of SOC stock. For instance, in European agricultural soils, Lugato et al. (2016) reported that erosion-induced SOC fluxes were of the same order as the current gains from improved management, and they must be reduced to maintain soil health and productivity. Lal (2003) estimated the global erosion-induced displacement of SOC at 5.7 Pg C yr−1, approximately 70 % of which is redistributed and redeposited over the landscape, and the remaining 30 % is transported by rivers into aquatic ecosystems. SOC is the most important indicator of soil quality (Rajan et al., 2010), and erosion-induced loss of SOC affects on-site soil fertility and off-site environment quality (Lal, 2019). However, the effects of soil erosion and the fate of the specific SOC fraction transported by erosion in specific agricultural systems such as olive groves remain poorly understood; therefore, agroenvironmental impacts of SOC dynamics and variability require more site- and crop-specific research.
Olive trees, one of the most important crops in the Mediterranean region which account for approximately 9.7 Mha (FAOSTAT, 2019), have been linked to severe environmental impacts including the acceleration of erosion and soil degradation (e.g., Beaufoy, 2001; Scheidel and Krausmann, 2011). In fact, soil degradation is common in olive orchards as they have been traditionally cultivated under rainfed conditions on sloping land, at relatively low tree densities, with limited canopy size due to pruning, and under bare-soil management to optimize water use by the tree under the semiarid conditions which characterize the Mediterranean climate (Gómez et al., 2014). Indeed, there are many studies which have measured high erosion rates in olive orchards on sloping areas (e.g., Gómez et al., 2014), although these high erosion rates are not necessarily a direct consequence of current management. In a study of historical erosion rates in several ancient olive orchards of Montefrío (southern Spain), Vanwalleghem et al. (2011) reported unsustainable erosion rates in the range of 23 to 68 Mg ha−1 yr−1 during the 19th and early 20th centuries, when these orchards were managed under the same slope and rainfall conditions with bare soil, albeit based on animal plowing. Vanwalleghem et al. (2011) also reported a further increase in the erosion rates when bare-soil management started to be implemented in these orchards by mechanization and herbicides, in the late 20th century. In the last 5 decades (Ruíz de Castroviejo, 1969), there has been an attempt to control soil degradation while maintaining a favorable soil–water balance for the tree through the gradual development of temporary cover crops (grown during the rainy season) (Gómez et al., 2014). These high erosion rates have also been linked to the degradation of soil properties observed in olive orchards. For instance, Gómez et al. (2009b) measured in a 5-year experiment and in an olive grove a decrease in SOC, aggregate stability, and infiltration rates with bare soil as compared to temporary cover crops. Such scientific evidence which links changes in soil properties to different erosion rates in olive orchards under controlled conditions is rarely reported in the literature. Indeed, most of the studies aimed to connect soil properties with different types of soil management in olive groves come from surveys of soil properties in orchards with similar soil types but with different soil management. Examples of these studies are those of Álvarez et al. (2010) and Soriano et al. (2014), who found an improvement in soil properties – particularly aggregate stability, SOC, and biological activity – in organic olive orchards with cover crops compared to those with bare soil. In recent years, these studies have started to deepen our understanding of investigating key properties such as SOC. For instance, Vicente-Vicente et al. (2017) evaluated the impact of cover crops in the distribution of unprotected and protected SOC in the top 15 cm of the soil. Typically, field studies take samples in a representative area of the slope, which is a common assumption in many soil quality studies (e.g., Andrews and Carroll, 2001). Although there is a limited number of experiments on the spatial variability of soil properties in olive orchards, they suggest the existence of significant in-field variability (e.g., Gargouri et al., 2013; Huang et al., 2017). Moreover, Gómez et al. (2012) suggested that, regarding organic carbon, part of this on-site variability of soil properties might be related to erosion–deposition processes.
In-field variability associated with erosion–deposition processes is relatively well documented for organic carbon content in field crops (e.g., De Gryze et al., 2008; Mabit and Bernard, 1998, 2010; Van Oost et al., 2005). While the human-induced acceleration of soil erosion has depleted the SOC stock of agroecosystems, the fates of SOC transported across the landscape and that deposited in depressional sites are not fully understood, despite the fact that these transfers might explain a high proportion of the on-site variability of soil properties.
Most of the erosion rates recorded or established in olive orchards come from runoff plots or small catchment experiments (e.g., Gómez et al., 2014). The use of the 137Cs approach has demonstrated its potential in establishing long-term soil erosion rates with this specific land use. An example of these studies is that of Mabit et al. (2012), in which erosion as well as deposition rates since the 1950s was determined in one ancient olive orchard in the municipality of Montefrío, showing an average annual rate in the eroding part of the slope of 12.3 t ha−1 yr−1 and an average deposition rate in the lower section of the hillslope, much shorter than the eroding section, of 13.1 t ha−1 yr−1. This study involved a reference area for establishing precisely the initial 137Cs inventory, a natural undisturbed area located 200 m from the orchard. As reported by Mabit et al. (2012), based on 13 investigated soil profiles, the local reference 137Cs inventory in this undisturbed area was evaluated at 1925±250 Bq m−2 (mean ± 2 standard error) with a coefficient of variation (CV) of 23 %.
To complement and/or to circumvent some limitation associated with the use of this anthropogenic radioisotope (see Mabit et al., 2008) and to maintain the capacity to determine erosion and deposition rates without the need to use direct measurements, other natural radioisotopes such as 210Pb (e.g., Mabit et al., 2014; Matisoff, 2014) or stable isotopes such as δ15N or δ13C (e.g., Meusburger et al., 2013) have been proposed.
In this study, we hypothesized that the contribution of the long-term erosion–deposition processes to the in-field variability of soil properties in olive orchards (or other woody crops) at a medium-steep slope is relevant and should be taken into account when analyzing the effects of specific strategies on SOC sequestration or on other soil properties. In addition, we exploited the advantage provided by the unique location of an ancient olive orchard near an undisturbed reference area and the previous information on this site from studies on historical erosion rates (Vanwalleghem et al., 2011; Mabit et al., 2012) to fulfill the following objectives:
-
to quantify the long-term variability in soil total organic carbon and in their different fractions as well as soil quality indicators in relation to erosion and deposition areas in a historical olive orchard;
-
to evaluate these differences in relation to the reference values found in an undisturbed natural area;
-
to evaluate differences in stable isotope signatures (δ13C and δ15N) and explore their potential for identifying degraded areas within the olive orchard.
2.1 Description of the area
The study area is located in the municipality of Montefrío, southwestern Spain (Fig. 1). The municipality extension is around 220 km2, of which 81 % is cultivated, mostly with olive trees. The climate in the region is continental Mediterranean with a long-term (1960–2018) average annual precipitation of 630 mm, a mean annual evapotranspiration of 750 mm, and a yearly average temperature of 15.2 ∘C. It is a mountainous area, with elevation ranging between 800 and 1600 m a.s.l. at the highest point (Sierra de Parapanda). Soil sampling took place in two areas around the archeological site “Peña de los Gitanos”, where the soil is classified as Calcic Cambisol according to the FAO classification (Deckers et al., 2004). The undisturbed reference area was inside an archeological site (Fig. 1). This undisturbed area is covered by open Mediterranean forest interspersed with shrubs and annual grasses on limestone material (calcarenites). The status of this protected site guarantees that no anthropogenic activities have impacted it for a long period of time, approximately since the end of 16th century. This area is covered by natural vegetation typical of the Mediterranean region, mainly bushes like Pistacia lentiscus and Retama sphaerocarpa and herbaceous species such as Anthemis arvensis, Calendula arvensis, Borago officinalis, Brachypodium spp., Bromus spp., and Medicago spp. The area studied was an olive orchard, established in 1856, located within tens of meters of the reference area (Fig. 1). Both areas were described in detail in previous studies on historical erosion rates in the region (Vanwalleghem et al., 2011; Mabit et al., 2012). This olive orchard is rainfed, and soil management in the decades before the sampling was based on bare soil with pruning residues (trees pruned every 2 years) being chopped and left on the soil surface. Olive trees are fertilized annually with 5 kg of 15 NPK, spread below the tree canopy area.
2.2 Soil sampling
The reference site, adjacent to the olive orchard, belongs to an archeologically protected site and is therefore a noncropped area where neither erosion nor sedimentation processes take place (Fig. 1). This site was sampled at 13 points across a transect, spaced at an average distance of 6 m, with only four of these sampling points used in this study (Fig. 1). We use only four soil samples because not enough soil for the analysis was collected in the other samples. At each sampling point, the excavation method was used. Soil samples were collected at 5 cm depth intervals until bedrock was reached (between 20 and 60 cm). The four samples used in this study reached 40 cm depth or more. Composite soil samples at 10 cm intervals were prepared at the laboratory to perform the chemical analysis of the reference area as described below.
Table 1Location of the sampling points along the transect and associated soil redistribution rates derived from the 137Cs technique (adapted from Mabit et al., 2012). Negative values indicate net erosion and positive values net deposition.

In the olive orchard a hydraulic mechanical core sampler was used. It gently rotates and pushes an 8 cm diameter core to sample eight points along a 452 m long catena (Fig. 1). To minimize soil disturbance, soil sampling was made when soil water content was between 40 % and 80 % of water-holding capacity. Precautions were taken to assure that four ranges of soil depth (0–10, 10–20, 20–30, and 30–40 cm) were collected at each sampling point in the orchard soil.
In a previous study, soil erosion and deposition rates were determined at each sampling point, comparing the 137Cs inventory among these points and that of the undisturbed reference area (Mabit et al., 2012). The positions of all sampling points were recorded by a real-time kinematic global positioning system (RTK-GPS) at submeter resolution (Table 1). Overall, 12 points were sampled: 4 in the reference area and 8 along the catena across the olive orchard, with all of them reaching the bedrock below 40 cm depth.
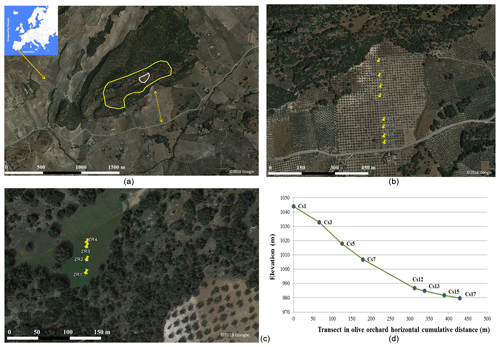
Figure 1Site location and associated sampling scheme. (a, b, c) Location map of the sampling area in Montefrío, southern Spain. Reference site delineated by the white line within a protected archeological site (yellow line). Yellow markers in (b) indicate the sampled transect within the olive orchard. Numbering starts in the points at higher elevation; see (d) for the elevation change in the transect in the orchard. Yellow markers in (c) indicate sampling point in the reference area. The map of Europe was designed by Freepik, and the aerial images are taken from Google Earth (© Google Earth 2018).
2.3 Physicochemical analysis
Soil samples were passed through a 2 mm sieve and homogenized. The fraction under 2 mm was determined and expressed as a percentage of total soil on a dry mass basis. Separation of the four soil organic carbon (Corg) pools was performed by a combination of physical and chemical fractionation techniques through a three-step process developed by Six et al. (2002) and modified by Stewart et al. (2009), summarized here. This three-step process isolates a total of 12 fractions, and it is based on the assumed link between the isolated fractions and the protection mechanisms involved in the stabilization of organic C. First a partial dispersion and physical fractionation of the soil are performed to obtain three size fractions: >250 mm (coarse nonprotected particulate organic matter, POM), 53–250 mm (microaggregate fraction), and <53 mm (easily dispersed silt and clay). This physical fractionation is done on air-dried 2 mm soil sieved through a 250 mm sieve. Material greater than 250 mm remained on the sieve. Microaggregates were collected on a 53 mm sieve that was subsequently wet-sieved to separate the easily dispersed silt- and clay-sized fractions from the water-stable microaggregates. The suspension was centrifuged at 127 g for 7 min to separate the silt-sized fraction. This supernatant was subsequently separated, flocculated, and centrifuged at 1730 g for 15 min to separate the clay-sized fraction. All fractions were dried in a 60 ∘C oven and weighed. Afterwards there was a second step involving a further fractionation of the microaggregate fraction isolated in the first step. A density flotation with sodium polytungstate was used to isolate fine nonprotected POM (LF): after removing the fine nonprotected POM, the heavy fraction was dispersed overnight by shaking and passed through a 53 mm sieve to separate the microaggregate-protected POM (>53 mm in size, iPOM) from the microaggregate-derived silt- and clay-sized fractions. The resulting suspension was centrifuged to separate the microaggregate-derived silt-sized fraction from the clay-sized fraction as described above. A final third step involved the acid hydrolysis of each of the isolated silt- and clay-sized fractions. The silt- and clay-sized fractions from both the density flotation and the initial dispersion and physical fractionation were subjected to acid hydrolysis. The unprotected pool includes the POM and LF fractions, isolated in the first and second fractionation steps, respectively. The physically protected SOC consists of the SOC measured in the microaggregates. It includes not only the iPOM but also the hydrolyzable and nonhydrolyzable SOC of the intermediate fraction (53–250 µm). The chemically and biochemically protected pools correspond to the hydrolyzable and nonhydrolyzable SOC in the fine fraction (<53 µm), respectively. In all cases, SOC fractions, and in the bulk soil, organic carbon concentrations were determined by using the wet oxidation sulfuric acid and potassium dichromate method of Anderson and Ingram (1993).
Inorganic carbon was removed prior to stable isotope analysis by acid fumigation following the method of Harris et al. (2001). Moistened subsamples were exposed to the exhalation of HCl in a desiccator overnight. Afterwards, the samples were dried at 40 ∘C before the stable isotope ratio was measured. The N measurements were done with unacidified samples, and the stable N isotope ratios and the C and N concentrations were measured by isotope ratio mass spectrometry (Isoprime 100 coupled with an Elementar Vario Isotope Select elemental analyzer; both instruments supplied by Elementar, Langenselbold, Germany). The instrumental standard deviation for δ15N is 0.16 % and 0.11 % for δ13C. Stable isotopes are reported as delta values (‰), which are the relative differences between the isotope ratios of the samples and the isotope ratio of a reference standard.
In addition, available phosphorus (Pavail) was determined by the Olsen method (Olsen and Sommers, 1982), and organic nitrogen (Norg) was determined by the Kjeldahl method (Stevenson, 1982). Water-stable aggregates (Wsagg) were measured using the method of Barthes and Roose (2002). Soil particle size distribution was determined using the hydrometer method (Bouyoucos, 1962) for the topsoil (0–10 cm) of the reference area and the olive orchard. Two bulk density values were calculated for the whole profile: (a) one considering the mass of soil finer than 2 mm and (b) one considering the mass of soil finer than 2 mm as well as the stone content, which was determined from the excavation and core sampling described above. Additionally, the bulk density of the topsoil (0–10 cm depth) was measured using a manual soil core sample with a volume of 100 cm3. Soil carbon stocks were calculated for the fine soil fraction after discounting rock or stone fragments larger than 2 mm and considering bulk density. They were then presented on equivalent soil mass as described by Wendt and Hauser (2013). As proposed by Hassink and Whitmore (1997), theoretical values of carbon saturation were calculated from the soil particle analysis. Finally, the soil degradation index developed by Gómez et al. (2009a) was calculated from the Corg, Pavail, and Wsagg.
2.4 Statistical analysis
The overall effect of depth and area (reference site vs. olive orchard or eroded vs. deposition area within the olive orchard) was evaluated using a two-factor analysis of variance (ANOVA) (p<0.05). Additionally, for some comparison at similar soil depths, values of soil properties between two different areas were assessed using a one-way ANOVA test (p<0.05). In both situations, data were log-transformed when necessary to fulfill ANOVA requirements. Exploratory analysis using principal component analysis (PCA) was performed in the olive orchard area using the variables and sampling depths showing significant differences in the ANOVA. This PCA was complemented by determining the linear correlation coefficient variables showing the highest load on the PCA and erosion ∕ deposition rates using the Pearson correlation test. The statistical software package Stata SE14.1 was used for these analyses.
3.1 Organic carbon concentration and distribution among fractions
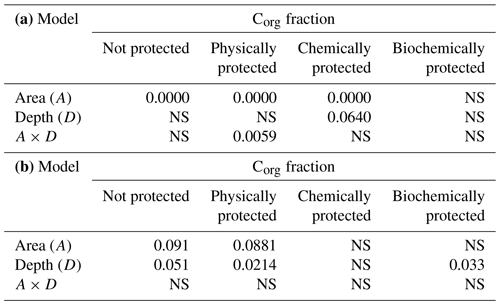
Table 2 shows the significance of the differences in bulk soil Corg and the various Corg fractions between reference and olive orchard plots at different soil depths and due to the interaction between both factors (Table 2a). It also shows the effects of the erosion ∕ deposition ratio (Table 2b). Overall, bulk soil Corg was always significantly higher in the reference area as compared to the olive orchard (, depending on depth) (Table 2a and Fig. 2), and this was independent of the soil sampling depth. Corg values on the reference site were between 2 to 5 times higher than those of the olive orchard for a given depth, with the greater differences in the top 10 cm of the soil. Soil depth has a significant effect on bulk Corg and Corg fractions, with values typically decreasing with depth in both areas. Corg concentrations in the unprotected and physically, chemically, and biochemically protected fractions were significantly higher (p<0.0001) (Table 2a) in the reference site as compared to the olive orchard and across the different depths () (Fig. 3). Corg values were between 2 to 6 times higher for the unprotected and chemically protected fractions and between 2 to 3.5 times higher for the physically and biochemically protected fractions, with differences tending to decrease with the soil depth.
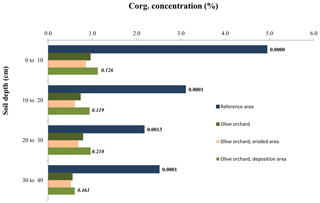
Figure 2Comparison of average soil organic carbon concentration in bulk soil depending on soil depth, distinguishing between the reference site, the whole olive orchard, the eroded area of the olive orchard, and the deposition area in this orchard. The labels of the bars for each depth indicate the p value according to a one-way ANOVA for the reference area (dark blue) vs. the whole olive orchard (dark green) and for the eroding area (beige) vs. the deposition area (light green, lower label, in italics).
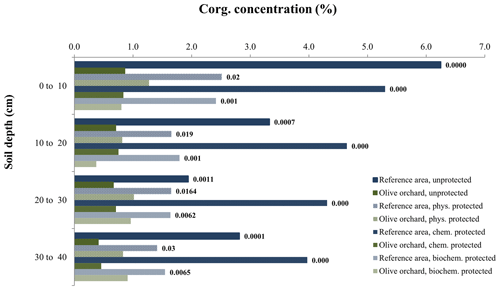
Figure 3Organic carbon concentration in the different soil organic carbon fractions at each depth, comparing the reference site vs. olive orchard. The labels of the bars indicate the p value according to a one-way ANOVA comparing treatments for the same soil depth and carbon fraction between the reference area and olive orchard.
Table 2Results of the two-way ANOVA of soil organic carbon concentration, Corg (%), in different fractions and in bulk soil. In (a) area refers to the reference site vs. the olive orchard, and in (b) area refers to eroded vs. deposition areas in the olive orchard. NS stands for not significant.
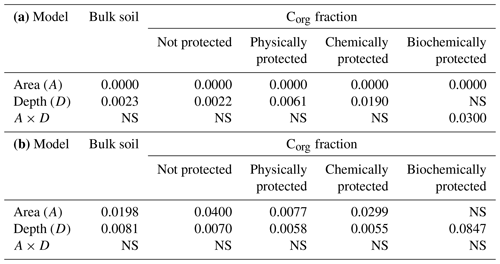
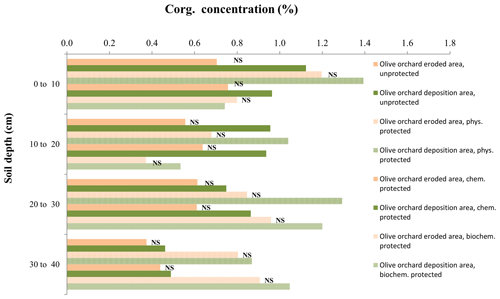
Figure 4Organic carbon concentration in the different soil organic carbon fractions at each depth, comparing the eroded vs. the deposition area within the olive orchard. The labels of the bars indicate the p value according to a one-way ANOVA comparing treatments for the same soil depth and carbon fraction between the reference area and olive orchard.
Within the olive orchard, there were statistically significant differences between the erosion and deposition areas for bulk Corg values (p=0.0198) (Table 2b). Higher Corg values (1.1 % to 0.6 %) were observed in the deposition area located downslope, whereas lower values (0.85 % to 0.55 %) were measured in the areas with net erosion in the upper and mid sections of the catena. It is worth noting that these differences between erosion and deposition areas are detected for the overall analysis using a two-way ANOVA (Table 2b), although an individual analysis at each depth (Fig. 4) does not detect statistically significant differences, probably due to the moderate number of replications. Significant differences between the deposition and eroding area were also found for the unprotected (p=0.04) and the physically (p=0.0077) and chemically protected fractions (p=0.0299) (Table 2b). However, differences for the biochemically protected fractions (Table 2b, Fig. 4) were not significant.
The percentage distribution of SOC among fractions was also significantly different between both areas (reference vs. olive orchard) except for the biochemically protected fraction (p<0.0001) (Table 3a) and depths (p<0.011) (Fig. 5). In the reference area most of the Corg was unprotected (between 50 % and 65 % approximately), with no significant trend with depth (Table 3a, Fig. 5), followed in relative importance by the chemically and physically protected fractions, which contributed between 18 % and 30 % as well as 10 % and 20 % of the bulk soil Corg, respectively. The biochemically protected fraction represents a very low percentage (between 4 % and 6 %). In the olive orchard, Corg is stored predominantly in the physically and chemically protected fractions, which accounted for about 38 % to 27 % and 34 % to 28 %, respectively, followed by the pool of unprotected fractions (between 22 % to 32 %) (Fig. 5). The biochemically protected fraction represents between 4 % and 11 % of the organic carbon stored in the olive orchard. There are no clear differences in the organic carbon distribution among the different fractions between the erosion and deposition areas in the olive orchard, with the exception of the physically protected fractions at 10–20 cm depth (p=0.024) (Fig. 6).
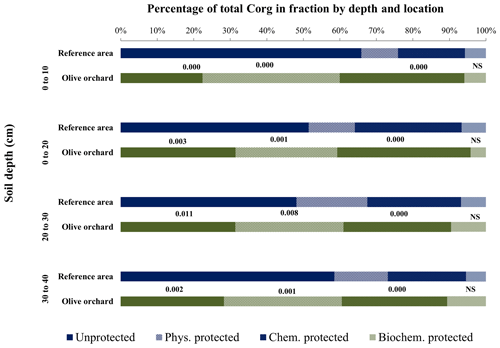
Figure 5Contribution (%) of the different fractions with respect to total soil organic carbon by depth, comparing the reference site vs. the olive orchard. The labels of each fraction and depth are the p value according to a one-way ANOVA comparing the reference area vs. the olive orchard for the same carbon fraction and soil depth.
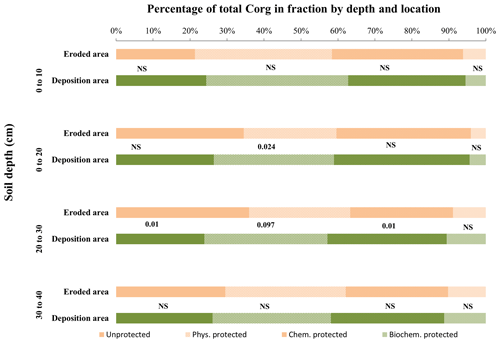
Figure 6Fraction of total organic carbon stored in the different fractions by depth, comparing the reference site vs. the olive orchard. The labels of each fraction and depth are the p value according to a one-way ANOVA comparing the reference area vs. the olive orchard for the same carbon fraction and soil depth.
Table 3Results of the two-way ANOVA of the distribution of the total soil organic carbon content in the soil among the different fractions of soil organic carbon, Corg. In (a) area refers to the reference site vs. the olive orchard, and in (b) area refers to eroded vs. deposition areas in the olive orchard. NS stands for not significant.
3.2 Organic carbon stock
SOC stock in the reference area is approximately 160 t ha−1, making it significantly higher, at p<0.05, for an equivalent mass than that of the olive orchard (Fig. 7), which stores between 38 and 41 t ha−1 in the eroded and deposition areas, respectively. There were no significant differences between these two orchard areas. Similar results were obtained across the top 40 cm soil profile. Clay, silt, and sand contents of the topsoil (0–10 cm) along the catena in the olive orchard averaged 41 %, 37 %, and 22 %, respectively, with similar average values in the eroding and deposition areas. Variability was relatively low (average coefficient of variation of 17 %), and there were no significant changes between the erosion and deposition areas. In the reference area, the soil has an average clay, silt, and sand content of 30 %, 31 %, and 39 %, respectively, also with a homogeneous distribution across the sampling area (coefficient of variation of 10 %). According to the Hassink and Whitmore (1997) model, the percentages of organic carbon of maximum soil stable Corg are 3.24±0.11 % and 3.63±0.19 % in the reference site and olive orchard, respectively. So, protected Corg in the reference and olive orchard areas account for 49.8±11.5 % and 20.49±5.2 % of the maximum soil stable Corg, respectively, in the topsoil.
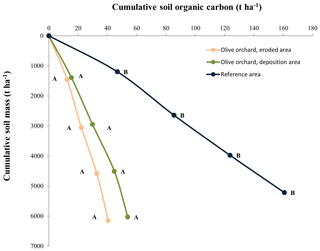
Figure 7Cumulative soil organic carbon (SOC) stock across the soil profile in terms of cumulative soil mass on the vertical axis. Different letters for similar soil mass refer to statistically significant differences (Kruskal–Wallis test at p<0.05). For this analysis cumulative soil organic carbons were interpolated linearly to the average cumulative soil mass corresponding to all the points in the three areas.
3.3 δ15N and δ13C isotopic signal
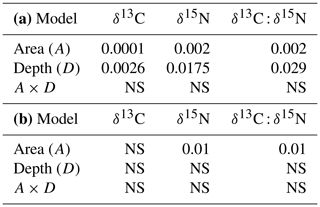
Figure 8 and Table 4a compare stable isotope delta values between the reference site and the overall olive orchard according to depth. There are significant statistical differences in δ15N, δ 13C, and the δ13C : δ15N ratio between the two areas (p<0.002; Table 4a), although in the case of δ 15N the differences at individual depths were not significant. Soil depth also had a significant effect (, Table 4a). When comparing differences between the erosion and deposition areas within the olive orchard, we detected statistically significant differences only in δ15N and the δ13C : δ15N ratio (p=0.01; Table 4b), and they were mostly marked in the upper 20 cm of the soil (Fig. 8).
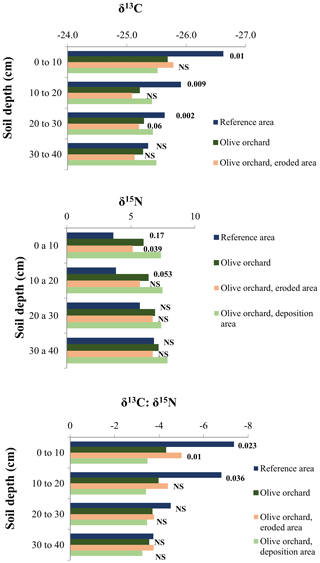
Figure 813C and 15N isotopic signal of soil by depth distinguishing among reference site, the whole olive orchard, the eroded area of the olive orchard, and the deposition area in this orchard. The labels of the bars for each depth indicate the p value according to a one-way ANOVA between the reference area (dark blue) vs. the whole olive orchard (dark green) and the eroding area (beige) vs. the deposition area (light green, lower label, in italics).
3.4 Soil quality of topsoil across the catena: variability between eroded and deposition areas in the orchard
Figure 9 depicts the comparison of the Pavail, Norg, Wsagg, and the soil degradation index (SDI; Gómez et al., 2009a) in the top 10 cm of the soil between the erosion and deposition areas of the olive orchard, and Table 5 shows a similar comparison for Norg, Pavail, and bulk density at the different soil depths. Pavail in the deposition area is significantly higher than that of the erosion area in the topsoil (p=0.005; Fig. 9) and for the whole profile (p=0.01; Table 5), whereas no significant differences in individual soil layers were found for Norg and Wsagg. The SDI, which combines these three variables, was about 3 times higher in the eroded area than in the deposition area.
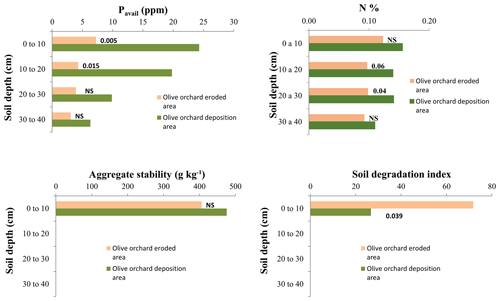
Figure 9Soil available phosphorus (Pavail), organic nitrogen (Norg), aggregate stability (Wsagg), and soil degradation index (SDI) by depth, comparing eroded vs. deposition areas within the olive orchard. The labels of the bars indicate the p value according to a one-way ANOVA comparing areas for the same soil depth.
Table 5Results of the two-way ANOVA of some physical and chemical soil properties, comparing eroded vs. deposition areas in the olive orchard. NS stands for not significant.

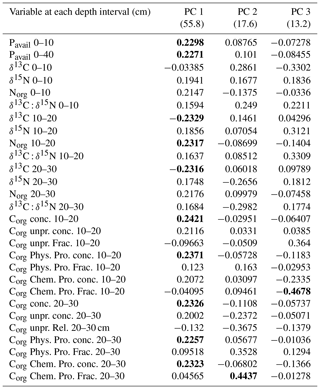
Table 6 shows the loads in the first three principal components (PCs) of the principal component analysis (PCA) for the variables used in this analysis. More than 70 % of the variance was explained by the first two PCs. Soils of the eroded and deposition area were clearly separated in the space defined by the two PCs (Fig. 10). The variables with higher contributions in PC 1 and 2 were related to Pavail concentration in the 0–10 and 0–40 cm soil depths, to δ15N and δ13C in the 10 to 30 cm soil depths, and to Corg concentration and distribution in some fractions also in soil depths between 10 and 30 cm (Table 6). The deposition area tended to show higher values in PC 1 and PC 2, and there was no clear tendency in the erosion area along the catena. The linear correlation coefficient between the variables and the erosion ∕ deposition rate was rather significant () for most of the variables (Table 7). Interestingly, Pavail was highly positively correlated in the whole soil layer. Among the two most robust correlations with erosion ∕ deposition rates were that with Pavail concentration across the 40 cm soil depth, (r2=0.907), and δ13C at 10–20 cm depth, (r2=0.632).
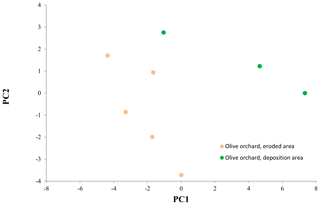
Figure 10Scores on principal components 1 and 2 (PC 1, PC 2) for sampling points in the eroded and deposition areas in the olive orchard.
Table 6Loads of selected variables in the PCA for the first three principal components (PCs). The values in brackets below PC 1, 2, and 3 indicate the percentage of variance explained by this PC. Variables in bold are those with a load higher than 90 % of the variable with the maximum load for this PC. Conc. refers to Corg concentration for this fraction, and Frac. means the relative contribution of this fraction to the total Corg for this soil depth.
4.1 Organic carbon concentration and distribution among fractions
After approximately 175 years of contrasted land use between the undisturbed reference site and the olive orchard, bulk soil organic carbon concentration and its fractions have been dramatically reduced in the olive orchard. Current levels of Corg concentration in the soil profile are approximately 20 % to 25 % of that found in the reference area covered by natural vegetation in the area adjacent to the orchard. This ratio is similar, albeit in the lower range, to the comparison of Corg in topsoil among olive orchards with different types of management and natural areas reported for the region (Milgroom et al., 2007). The increased soil disturbance, the lower annual rate of biomass returned to the soil, and the higher erosion rate in the olive orchard explain this difference. In both areas, the Corg is clearly stratified, indicating that despite the different mechanisms involved, there is a periodic input of biomass from the olive trees (e.g., fall of senescence leaves and tree pruning residues) plus the annual ground vegetation. Vicente-Vicente et al. (2017) estimated this biomass contribution in the range of 1.48 to 0.56 t ha−1 yr−1. It is worth noticing that the decrease in Corg as compared to the natural area is much higher than the reported rates of increase in Corg in olive orchards using conservation agriculture (CA) techniques, such as cover crops and incorporation of organic residues from different sources. In a meta-analysis Vicente-Vicente et al. (2016) found a response ratio (the ratio of Corg under CA management as compared to Corg in orchards with bare-soil management) of 1.1 to 1.9, suggesting that under CA management, which combines cover crops and organic residues, Corg doubled as a maximum.
Combining all Corg data of the olive orchard, the variability was about 35 %, which is similar to what has been reported so far in the few studies found on soil Corg variability in olive orchards. For instance, Gargouri et al. (2013) indicated a 24 % coefficient of variation (CV) in a 34 ha olive orchard in Tunisia, while Huang et al. (2017) reported an average CV of 41 % in a 6.2 ha olive orchard in southern Spain. Neither of these two studies reported clear trends in the distribution of Corg depending on topography. Huang et al. (2017) pointed out the additional difficulties in the determination of Corg due to the topography heterogeneity, although this was compounded by the fact that within the orchards there were two areas with different planting dates for the trees. Gómez et al. (2012) reported a CV of 49 % with higher Corg in areas where there was a change in the slope gradient from the hillslope to a central channel draining into the catchment, although they could not find a simple relationship between the increase in content and the topographic indices. Despite the fact that a lot of work has been done on the correlation between erosion and deposition and the redistribution of soil Corg (e.g., Van Oost et al., 2005), our study is, to our knowledge, the first attempt to quantify this in detail under the agroenvironmental conditions of an olive orchard. The variability induced by the combined effects of water and tillage erosion in this olive orchard was similar to that described in other agroecosystems. For instance, Van Oost et al. (2005) measured a clear correlation between the erosion and deposition rates and the topsoil Corg concentration, which ranged between 0.8 % of the erosion to 1.4 % of the deposition sites in the top 25 cm of the soil, at two field crop sites under a temperate climate. Besides this, Bameri et al. (2015) measured a higher Corg in the lower part of a field crop site under semiarid conditions where deposition of the eroded soil from the upper zones took place. Overall, in such landscapes cultivated for a long time, the cumulative effect of tillage and water erosion on the redistribution of soil across the slope has been observed (Dlugoß et al., 2012). These processes also produce a vertical redistribution of Corg, resulting in a relatively homogeneous profile in the tilled layer (top 15–20 cm) and a gradual decline below this depth, as noted in our study.
4.2 Organic carbon stock
The differences in soil organic carbon stock between the reference site and the olive orchard are similar to those described previously when comparing cropland and forested areas, with the latter presenting a higher concentration of Corg, most of which is in the unprotected fraction, while the cropland presented a higher fraction of the carbon in the physically and chemically protected fractions (e.g., Poeplau and Don, 2013). This is likely due to the fact that under soil degradation processes, such as water erosion, and low annual organic carbon input, as is the case under olive orchard land use, most of the unprotected Corg decomposes relatively quickly, and a great proportion of the remaining low SOC is protected. In addition, the mobilization of the unprotected Corg is expected to be reduced in the protected forested area because of the canopy and the existing vegetation on the ground that protects the soil against runoff and splash erosion processes. In fact, the protected Corg concentration in the topsoil of the olive orchard in the eroded area accounted for 18.6±3.9 % of the upper limit of protected Corg (3.64±0.23 %) according to the model of Hassink and Whitmore (1997). Therefore, the low unprotected SOC concentration found in the olive orchard is an element of concern in the increase in SOC stocks. This is because protected fractions are fueled from recently derived, partially decomposed plant residues together with microbial and micro-, meso-, and macrofaunal debris (unprotected organic carbon) through processes like SOC aggregation into macro- and/or microaggregates (physically protected SOC) and complex SOC associations with clay and silt particles (chemically protected SOC), which are disrupted in the cropland area in comparison with the reference area. The distribution among soil Corg fractions in the orchard of this study was similar to the result obtained by Vicente-Vicente et al. (2017), who measured Corg fraction distribution in olive oil orchards with temporary cover crops, with the exception of the unprotected SOC, which was much higher in soils under cover crops than that of our study under bare soil. Also interesting is the difficulty obtaining statistically significant differences in SOC stock between the eroding and deposition areas (Fig. 7) despite the apparent clear differences between the two areas in some other soil properties, such as Pavail or δ15N and δ 13C isotopic signatures in the subsoil (see below).
4.3 δ15N and δ13C isotopic signal
Changes in vegetation types induced differences in δ13C between the olive orchard and the reference area, but as expected, no differences in δ13C were detected between the erosion and deposition areas in the olive orchard given the same origin of vegetation-derived organic matter, i.e., C3 plants. Interestingly, within the olive orchard, significant differences in δ15N were detected between the erosion and deposition areas, especially for the top 20 cm of soils (Fig. 9). This suggests the potential of using δ15N as a variable for identifying degraded areas in olive growing fields, as has been proposed for other eroding regions in the world (e.g., Meusburger et al., 2013). This might provide an alternative when other conventional or isotopic techniques are not available. Nevertheless, further studies exploring this potential are necessary in order to also consider the influence of the N–P fertilizer modifying the δ15N in relation to the reference area (e.g., Bateman and Kelly, 2007). The source of N in soil is multifarious and subject to a wide range of transformations that affect the δ15N signature; therefore we can only speculate on the reasons for this difference in δ15N in a relatively homogeneous area. Bulk soil δ15N tended to be more positive (e.g., more enriched in δ15N) as the N cycling rate increases soil microbial processes (e.g., N mineralization, nitrification, and denitrification), resulting in products (e.g., nitrate, N2O, N2, and NH3) depleted in 15N, while the substrate from which they were formed becomes slightly enriched (Robison, 2001). The higher δ15N signature of the soil at the deposition location suggests that the rates of processes involved in N cycling are higher than in the erosion area, and that it is in accordance with the higher bulk Corg and Pavail contents and lower SDI of the deposition site. The relatively lower soil δ15N signature at the reference site could be partially due to the input of litter N from the natural legumes and to the closed N cycling, which characterize natural forest ecosystems. The trend in 15N enrichment with soil depth, as found at the reference site, is a common observation at forest and grassland sites and has been related to different mechanisms, including 15N isotope discrimination during microbial N transformations, differential preservation of 15N-enriched soil organic matter components during N decomposition, and more recently, to the build-up of 15N-enriched microbial necromass (Huygens et al., 2008). However, there still remains the need for a careful calibration to an undisturbed reference site and a better understanding of the influence of different vegetation in the reference and the studied area on the change in the δ15N signal for its further use as an additional tool to determine soil degradation.
4.4 Soil quality of topsoil across the catena: variability between eroded and deposition areas in the orchard
This horizontal distribution due to tillage and water erosion also simultaneously affected other soil properties and has been described previously in other cultivated areas. For instance, De Gryze et al. (2008) described how, for a field crop area under conventional tillage in Belgium, Pavail almost doubled (22.9 vs. 12.2 mg kg−1) in the depositional area as compared to the eroding upper part. They also reported that in half of the field under conservation tillage, these differences in Pavail between the upper and lower areas of the field disappeared. We have observed in our sampled orchard a pronounced increase in topsoil Pavail in the deposition area of around 400 % as compared to the eroding part of the orchard, which can be attributed to the deposition of enriched sediment coming from the upslope area. The cumulative effects of the differences in Corg and Pavail and the trend towards higher, although nonsignificant, Wsagg in the deposition area resulted in two areas within the orchard with marked differences in soil quality: the eroded part, which is within the range considered to be degraded in the region (Gómez et al., 2009a), and the depositional area, representing 20 % of the orchard transect length (Table 1), which is within the nondegraded range according to the same index. Topography and sediment redistribution by erosive processes introduce a gradient of spatial variability that questions the concept of representative area when it comes to describing a whole field. In fact, several studies (e.g., Dell and Sharpley, 2006) have suggested that the verification of compliance of environmental programs such as those related to Corg sequestration should be based preferentially, at least partially, on modeling approaches. Our results raise the need for a careful delineation of subareas when analyzing soil quality indicators and/or SOC carbon stock within the same field unit. They also warn about the difficulty of drawing hypotheses for quantifying the differences between these delineated areas in relation to specific soil properties. For instance, in our study case erosion–deposition processes had a major impact on Pavail and soil quality, but the impact on Corg concentration and stock was moderate and extremely difficult to detect statistically using a moderate number of samples.
Our PCA and regression analyses confirmed the relatively high variability of Corg and stock in relation to other soil quality indicators related to erosion–deposition processes, such as Pavail, as discussed in the previous section. While in the catena studied in the current research the P cycle seems to be mostly driven by sediment mobilization, the Corg and N cycles seem to be much more complex. The moderate differences in Corg and the homogeneity in δ15N and δ13C isotopic signals between the eroding and deposition areas may be due to several processes, some of which were discussed above, such as spatial variability of carbon input due to biomass in the plot, surface soil operations in the orchard, and fertilization. We found it both interesting and worth exploring in future studies that significant correlations between erosion and deposition rates and Corg-, δ15N-, and δ 13C-related variables were found for samples from the 10–20 and 20–30 cm layers, indicating that short-term disturbance by surface processes can mask experimental determination of the impact of erosion deposition processes in this olive orchard for these variables.
-
The results indicate that erosion and deposition within the investigated old olive orchard have created a significant difference in soil properties along the catena, which is translated into different soil Corg, Pavail, and Norg content, δ15N, and thus contrasting soil quality status.
-
This variability was lower than that of the natural area, which indicated a severe depletion of SOC as compared to the natural area and a redistribution of available organic carbon among the different SOC fractions.
-
The results suggest that δ15N has the potential for being used as an indicator of soil degradation, although more investigation in different agroecosystems would be required for confirming this statement on a larger scale.
-
This research highlights that proper understanding and management of soil quality and Corg content in olive orchards require consideration of the on-site spatial variability induced by soil erosion–deposition processes.
The basic data used in this paper are freely available from the CSIC digital repository at https://doi.org/10.20350/digitalCSIC/12513 (Gómez Calero et al., 2020).
JAG coordinated and designed the overall study; conducted the field sampling campaigns, analysis of the soil organic carbon results, and the overall analysis of the results; and wrote the manuscript. GG participated in the analysis of soil-quality-related properties, the overall analysis of the results, and the writing of the manuscript. LM participated in the overall analysis of the results and the writing of the manuscript. CR and AT participated in the analysis and interpretation of the stable isotope results. RGR contributed to the design and the statistical analysis of soil organic carbon (stock and fractions) and nitrogen data, the overall analysis of the results, and the writing of the manuscript.
The authors declare that they have no conflict of interest.
The authors would like to thank Manuel González de Molina for providing valuable insight into the management of the olive orchard in the decades before sampling. Furthermore, the authors are grateful to the three anonymous reviewers of the manuscript version in Soil Discussion for their care and attention to the manuscript. All their comments and indications have greatly helped to increase the quality of our work. This study was supported by the projects AGL2015-40128-C03-01 of the Spanish Government, SHui (GA 773903) of the European Commission, and EU-FEDER funds.
This research has been supported by the Spanish Ministry of Economy and Competitiveness (grant no. AGL2015-40128-C03-01) and the European Commission (SHui, grant no. 773903).
This paper was edited by Olivier Evrard and reviewed by three anonymous referees.
Álvarez, S., Soriano, M. A., Landa, B. B., and Gómez, J. A.: Soil properties in organic olive groves compared with that in natural areas in a mountainous landscape in southern Spain, Soil Use Manage., 23, 404–416, https://doi.org/10.1111/j.1475-2743.2007.00104.x, 2010.
Anderson, J. M. and Ingram, J. S. I. (Eds.): Tropical soil biology and fertility: A handbook of methods, CAB International, Wallingford, UK, 1993.
Andrews, S. S. and Carroll, C. R.: Designing a soil quality assessment tool for sustainable agroecosystem management, Ecol. Appl., 11, 1573–1585, https://doi.org/10.1890/1051-0761(2001)011[1573:DASQAT]2.0.CO;2, 2001.
Bameri, A., Khormali, F., Amir, K., and Dehghani, A.: Spatial variability of soil organic carbon in different hillslope positions in Toshan area, Golestan Province, Iran: Geostatistical approaches, J. Mt. Sci., 12, 1422–1433, https://doi.org/10.1007/s11629-014-3213-z, 2015.
Barthes, B. and Roose, E.: Aggregate stability as an indicator of soil susceptibility to runoff and erosion: validation at several levels, Catena, 47, 133–149, https://doi.org/10.1016/S0341-8162(01)00180-1, 2002.
Bateman, A. S. and Kelly, S. D.: Fertilizer nitrogen isotope signatures, Isot. Environ. Healt. S., 43, 237–247, https://doi.org/10.1080/10256010701550732, 2007.
Beaufoy, G.: EU Policies for olive farming-Unsustainable on all Counts, Brussels, WWF & BirdLife Joint Report, 20 pp., 2001.
Bouyoucos, G. J.: Hydrometer method improvement for making particle size analysis of soils, Agron. J., 54, 179–186, https://doi.org/10.2134/agronj1962.00021962005400050028x, 1962.
Deckers, J., Spaargaren, O., and Dondeyne, S.: Soil survey as a basis for land evaluation, in: Land Use, Land Cover and Soil Sciences, Volume II: Land Evaluation, Encyclopedia of Life Support Systems, edited by: Verheyen, W., EOLSS-UNESCO Publ., Oxford, UK, 29–58, 2004.
De Gryze, S., Six, J., Bossuyt, H., Van Oost, K., and Merckx, R.: The relationship between landform and the distribution of soil C, N and P under conventional and minimum tillage, Geoderma, 144, 180–188, https://doi.org/10.1016/j.geoderma.2007.11.013, 2008.
Dell, C. J. and Sharpley, A. N.: Spatial variation of soil organic carbon in a Northeastern U.S. watershed, J. Soil Water Conserv., 61, 129–136, https://doi.org/10.1007/s11676-014-0533-3, 2006.
Dlugoß, V., Fiener, P., Van Oost, K., and Schneider, K.: Model based analysis of lateral and vertical soil carbon fluxes induced by soil redistribution processes in a small agricultural catchment, Earth Surf. Proc. Land., 37, 193–208, https://doi.org/10.1002/esp.2246, 2012.
FAOSTAT: Food and Agriculture Statistics of FAO Publications, available at: http://www.fao.org/faostat/en/#home, last access: January 2019.
Gargouri, K., Rigane, H., Arous, I., and Touil, F.: Evolution of soil organic carbon in an olive orchard under arid climate, Sci. Hortic., 152, 102–108, https://doi.org/10.1016/j.scienta.2012.11.025, 2013.
Gómez, J. A., Álvarez, S., and Soriano, M. A.: Development of a soil degradation assessment tool for organic olive groves in southern Spain, Catena, 79, 9–17, https://doi.org/10.1016/j.catena.2009.05.002, 2009a.
Gómez, J. A., Sobrinho, T. A., Giráldez, J. V., and Fereres, E.: Soil management effects on runoff, erosion and soil properties in an olive grove of Southern Spain, Soil Till. Res., 102, 5–13, https://doi.org/10.1016/j.still.2008.05.005, 2009b.
Gómez, J. A, Burguet, M., Taguas, M. E., Perez, R., Ayuso, J. L., Vanwalleghem, T., Giraldez, J. V., and Vanderlinden, K.: Distribution of soil organic carbon in two small agricultural Mediterranean catchments, Geophys. Res. Abstr., EGU2012-4232, EGU General Assembly 2012, Vienna, Austria, 2012.
Gómez, J. A., Infante-Amate, J., González de Molina, M., Vanwalleghem, T., Taguas, E. V., and Lorite, I.: Review: Olive cultivation, its impact on soil erosion and its progression into yield impacts in Southern Spain in the past as a key to a future of increasing climate uncertainty, Agriculture, 4, 170–200, https://doi.org/10.3390/agriculture4020170, 2014.
Gómez Calero, J. A., Guzmán, G., Toloza, A., Resch, C., García-Ruiz, R., and Mabit, L.: Basic data underlying research in manuscript “Variation of soil organic carbon, stable isotopes, and soil quality indicators across an erosion–deposition catena in a historical Spanish olive orchard”, CSIC digital repository, https://doi.org/10.20350/digitalCSIC/12513, 2020.
Harris, D., Horwath, W., and Kessel, C.: Acid fumigation of soils to remove carbonates prior to total organic carbon or Carbon-13 isotopic analysis, Soil Sci. Soc. Am. J., 65, 1853–1856, https://doi.org/10.2136/sssaj2001.1853, 2001.
Hassink, J. and Whitmore, A. P.: A model of the physical protection of organic matter in soils, Soil Sci. Soc. Am. J., 61, 131–139, https://doi.org/10.2136/sssaj1997.03615995006100010020x, 1997.
Huang, J., Pedrera-Parrilla, A., Vanderlinden, K., Taguas, E. V., Gómez, J. A., and Triantafilis, J.: Potential to map depth-specific soil organic matter content across an olive grove using quasi-2d and quasi-3d inversion of DUALEM-21 data, Catena, 152, 207–217, https://doi.org/10.1016/j.catena.2017.01.017, 2017.
Huygens, D., Denef, K., Vandeweyer, R., Godoy, R., Van Cleemput, O., and Boeckx, P.: Do Nitrogen isotope patterns reflect microbial colonization of soil organic matter fractions?, Biol. Fert. Soils, 44, 955–964, https://doi.org/10.1007/s00374-008-0280-8, 2008.
Lal, R.: Soil erosion and the global carbon budget, Environ. Int., 29, 437–450, https://doi.org/10.1016/S0160-4120(02)00192-7, 2003.
Lal, R.: Cover cropping and the “4 per Thousand” proposal, J. Soil Water Conserv., 70, 141A, https://doi.org/10.2489/jswc.70.6.141A, 2015.
Lal, R.: Accelerated soil erosion as a source of atmospheric CO2, Soil Till. Res., 188, 35–40, https://doi.org/10.1016/j.still.2018.02.001, 2019.
Lugato, E., Paustian, K., Panagos, P., Jones, A., and Borrelli, P.: Quantifying the erosion effect on current carbon budget of European agricultural soils at high spatial resolution, Glob. Change Biol., 22, 1976–1984, https://doi.org/10.1111/gcb.13198, 2016.
Mabit, L. and Bernard, C.: Relationship between soil inventories and chemical properties in a small intensively cropped watershed, CR Acad. Sci. II A, 327, 527–532, https://doi.org/10.1016/S1251-8050(99)80034-2, 1998.
Mabit, L. and Bernard, C.: Spatial distribution and content of soil organic matter in an agricultural field in Eastern Canada, as estimated from geostatistical tools, Earth Surf. Proc. Land., 35, 278–283, https://doi.org/10.1002/esp.1907, 2010.
Mabit, L., Benmansour, M., and Walling, D. E.: Comparative advantages and limitations of Fallout radionuclides (137Cs, 210Pb and 7Be) to assess soil erosion and sedimentation, J. Environ. Radioactiv., 99, 1799–1807, https://doi.org/10.1016/j.jenvrad.2008.08.009, 2008.
Mabit, L., Chhem-Kieth, S., Toloza, A., Vanwalleghem, T., Bernard, C., Infante-Amate, J., González de Molina, M., and Gómez, J. A.: Radioisotopic and physicochemical background indicators to assess soil degradation affecting olive orchards in southern Spain, Agr. Ecosyst. Environ., 159, 70–80, https://doi.org/10.1016/j.agee.2012.06.014, 2012.
Mabit, L., Benmansour, M., Abril, J. M., Walling, D. E., Meusburger, K., Iurian, A. R., Bernard, C., Tarján, S., Owens, P. N., Blake, W. H., and Alewell, C.: Fallout 210Pb as a soil and sediment tracer in catchment sediment budget investigations: A review, Earth-Sci. Rev., 138, 335–351, https://doi.org/10.1016/j.earscirev.2014.06.007, 2014.
Matisoff, G.: 210Pb as a tracer of soil erosion, sediment source area identification and particle transport in the terrestrial environment, J. Environ. Radioactiv., 138, 343–354, https://doi.org/10.1016/j.jenvrad.2014.03.008, 2014.
Meusburger, K., Mabit, L., Park, J.-H., Sandor, T., and Alewell, C.: Combined use of stable isotopes and fallout radionuclides as soil erosion indicators in a forested mountain site, South Korea, Biogeosciences, 10, 5627–5638, https://doi.org/10.5194/bg-10-5627-2013, 2013.
Milgroom, J., Soriano, M. A., Garrido, J. M., Gómez, J. A., and Fereres, E.: The influence of a shift from conventional to organic olive farming on soil management and erosion risk in southern Spain, Renew. Agr. Food Syst., 22, 1–10, https://doi.org/10.1017/S1742170507001500, 2007.
Olsen, S. R. and Sommers, L. E.: Phosphorus, in: Methods of soil analysis, Part 2. Chemical and microbiological properties, edited by: Page, A. L., Miller, R. H., and Keeney, D., ASA & SSSA, 403–430, Madison WI, USA, 1982.
Poeplau, C. and Don, A.: Sensitivity of soil organic carbon stocks and fractions to different land-use changes across Europe, Geoderma, 192, 189–201, https://doi.org/10.1016/j.geoderma.2012.08.003, 2013.
Rajan, K., Natarajan, A., Kumar, K. S. A., Badrinath, M. S., and Gowda, R. C.: Soil organic carbon – the most reliable indicator for monitoring land degradation by soil erosion, Curr. Sci., 99, 823–827, 2010.
Robison, D.: δ15N as an integrator of the nitrogen cycle, Trends Ecol. Evol., 16, 153–162, https://doi.org/10.1016/S0169-5347(00)02098-X, 2001.
Ruíz de Castroviejo, J.: Explotación de olivares en asociación con trébol subterráneo, Agricultura, 443, 135–139, 1969.
Scheidel, A. and Krausmann, F.: Diet, trade and land use: A socio-ecological analysis of the transformation of the olive oil system, Land Use Policy, 28, 47–56, https://doi.org/10.1016/j.landusepol.2010.04.008, 2011.
Six, J., Callewaert, P., Lenders, S., De Gryz, S., Morris, S. J., Gregorich, E. G., and Paustian, K.: Measuring and understanding carbon storage in afforested soils by physical fractionation, Soil Sci. Soc. Am. J., 66, 1981–1987, https://doi.org/10.2136/sssaj2002.1981, 2002.
Soriano, M. A., Álvarez, S., Landa, B. B., and Gómez, J. A.: Soil properties in organic olive orchards following different weed management in a rolling landscape of Andalusia, Spain, Renew. Agr. Food Syst., 29, 83–91, https://doi.org/10.1017/S1742170512000361, 2014.
Stevenson, F. J.: Nitrogen-Organic forms, in: Methods of soil analysis, Part 2. Chemical and microbiological properties, edited by: Page, A. L., Miller, R. H., and Keeney, D., ASA & SSSA, 625–641, Madison WI, USA, 1982.
Stewart, C. E., Paustian, K., Conant, R. T., Plante, A. F., and Six, J.: Soil carbon saturation: Implications for measurable carbon pool dynamics in long-term incubations, Soil Biol. Biochem., 41, 357–366, https://doi.org/10.1016/j.soilbio.2008.11.011, 2009.
Van Oost, K., Govers, G., Quine, T. A., Heckrath, G., Olesen, J. E., De Gryze, S., and Merckx, R.: Landscape-scale modeling of carbon cycling under the impact of soil redistribution: The role of tillage erosion, Global Biogeochem. Cy., 19, GB4014, https://doi.org/10.1029/2005GB002471, 2005.
Vanwalleghem, T., Infante-Amate, J., González de Molina, M., Soto Fernández, D., and Gómez, J.: Quantifying the effect of historical soil management on soil erosion rates in Mediterranean olive Orchards, Agr. Ecosyst. Environ., 142, 341–351, https://doi.org/10.1016/j.agee.2011.06.003, 2011.
Vicente-Vicente, J. L., García-Ruiz, R., Francaviglia, R., Aguilera, E., and Smith, P.: Soil carbon sequestration rates under Mediterranean woody crops using recommended management practices: A meta-analysis, Agr. Ecosyst. Environ., 235, 204–214, https://doi.org/10.1016/j.agee.2016.10.024, 2016.
Vicente-Vicente, J. L., Gómez-Muñoz, B., Hinojosa-Centeno, M. B., Smith, P., and García-Ruiz, R.: Carbon saturation and assessment of soil organic carbon fractions in Mediterranean rainfed olive orchards under plant cover management, Agr. Ecosyst. Environ., 245, 135–146, https://doi.org/10.1016/j.agee.2017.05.020, 2017.
Wendt, J. W. and Hauser, S.: An equivalent soil mass procedure for monitoring soil organic carbon in multiple soil layers, Eur. J. Soil Sci., 64, 58–65, https://doi.org/10.1111/ejss.12002, 2013.


