the Creative Commons Attribution 4.0 License.
the Creative Commons Attribution 4.0 License.
 | 05 Feb 2018
How serious a problem is subsoil compaction in the Netherlands? A survey based on probability sampling
Jan J. H. van den Akker
Although soil compaction is widely recognized as a soil threat to soil resources, reliable estimates of the acreage of overcompacted soil and of the level of soil compaction parameters are not available. In the Netherlands data on subsoil compaction were collected at 128 locations selected by stratified random sampling. A map showing the risk of subsoil compaction in five classes was used for stratification. Measurements of bulk density, porosity, clay content and organic matter content were used to compute the relative bulk density and relative porosity, both expressed as a fraction of a threshold value. A subsoil was classified as overcompacted if either the relative bulk density exceeded 1 or the relative porosity was below 1. The sample data were used to estimate the means of the two subsoil compaction parameters and the overcompacted areal fraction. The estimated global means of relative bulk density and relative porosity were 0.946 and 1.090, respectively. The estimated areal fraction of the Netherlands with overcompacted subsoils was 43 %. The estimates per risk map unit showed two groups of map units: a “low-risk ” group (units 1 and 2, covering only 4.6 % of the total area) and a “high-risk” group (units 3, 4 and 5). The estimated areal fraction of overcompacted subsoil was 0 % in the low-risk unit and 47 % in the high-risk unit. The map contains no information about where overcompacted subsoils occur. This was caused by the poor association of the risk map units 3, 4 and 5 with the subsoil compaction parameters and subsoil overcompaction. This can be explained by the lack of time for recuperation.
- Article
(8477 KB) - Full-text XML
-
Supplement
(64 KB) - BibTeX
- EndNote


Soil compaction is recognized as one of the major soil threats. Van Camp et al. (2004) recognized soil compaction as one of the eight soil threats requiring further attention. In 2006 the Thematic Strategy for Soil Protection was launched by the European Commission (European Commission, 2006). Subsoil compaction is of more concern than topsoil compaction because of its persistency (Alakukku, 2000; Berisso et al., 2012, 2013). Subsoil compaction is defined as compaction of the soil below the cultivated layer. This compacted layer is referred to as the pan layer, hardpan or plow pan. The pan layer is often the bottleneck for the functioning of the subsoil because it is denser and less permeable for roots, water and oxygen than the subsoil below this layer.
Lipiec and Hatano (2003) review indices and methods to quantify the effects of compaction on soil physical properties and crop growth. They concluded, among other things, that yield decrease in overcompacted soil is frequently attributed to excessive mechanical impedance, reduced water infiltration and crop water use efficiency, insufficient aeration, or their combination depending on weather conditions. Etana et al. (2013) stressed the impact of subsoil compaction on preferential flow of water in a sandy clay soil, which can result in a fast transport of nutrients and agrochemicals to deeper soil layers and groundwater. Schjønning et al. (2015) present an overview of results of field experiments on crop yield reduction by subsoil compaction. Alblas et al. (1994) report average yield reductions in silage maize on sandy soils with a compacted subsoil of 15 % with a wheel load of 5 Mg and 4 % with a wheel load of 2.5 Mg. Håkansson and Reeder (1994) report 2.5 % permanent yield reductions in long-term experiments with wheel loads of 5 Mg applied in the first year of the experiment. After this first year wheel loads were limited to 2 Mg to prevent further compaction. The same kind of long-term experiments by Voorhees (2000), however, with wheel loads of 9 Mg resulted in permanent yield reductions of on average 6 %. It should be noted that in practice wheel loads of 5 to 9 Mg or even higher are commonly used in heavy mechanized agriculture during manuring and harvesting.
Håkansson and Reeder (1994) also studied the recuperation of soil compaction in a clay loam soil. In the first 5 years the topsoil recuperated to a great extent. In the first 10 years the upper part of the subsoil to a depth of about 40 cm also recuperated considerably; however, in the third layer below 40 cm depth the recuperation was almost zero and caused a permanent yield reduction of 2.5 %.
Soil compaction is estimated to be responsible for the degradation of an area of about 33 million ha in Europe (Van Ouwerkerk and Soane, 1994). About 32 % of the subsoils in Europe is highly vulnerable and another 18 % is moderately vulnerable to subsoil compaction (Fraters, 1996). However, these are very rough estimates and not the result of a thorough assessment. Jones et al. (2003) present a map of the vulnerability of subsoils to compaction. The authors concluded that at the moment on the basis of the existing information, any attempt to identify the vulnerability to compaction of subsoils in Europe, on a spatial basis, lends itself to fundamental improvement. The assessment of the compaction state of subsoils is also scarce and incomplete and requires improvement (van den Akker et al., 2003).
Previous work by van den Akker and Hoogland (2011) was not conclusive either about how serious the problem is in the Netherlands. Two risk-assessment methods were used to map the vulnerability and susceptibility to soil compaction. These maps were compared to a map showing the probability that the subsoil is already compacted. The agreement of the vulnerability and susceptibility maps with the probability map was poor. The probability of compacted subsoil was mapped using legacy data on bulk density in the Dutch Soil Information System. The value of these data for assessing the current subsoil compaction is restricted because most of the measurements were done more than 20 years ago. Another problem was that the sampling locations were not selected by probability sampling. For that reason the only option was to construct the map and estimate the areal fraction of overcompacted subsoil by a model-based approach, more specifically by space–time kriging. The available data for the calibration of the model were rather scarce, so that the quality of the geostatistical model is questionable. This together with the questionable quality of the legacy data was the motivation for a new, nationwide survey, specifically designed to quantify how serious the problem of current subsoil compaction is in the Netherlands.
The aim of this research was to design a sample for estimating the current means of subsoil compaction parameters and the areal fraction where subsoil compaction has exceeded a critical threshold. These means and areal fraction must be estimated for the Netherlands in their entirety, as well as for the five units of the soil compaction risk map. The estimates must be accompanied with estimates of their accuracies.
The soil compaction risk map for the Netherlands of van den Akker et al. (2013) plays a central role in this study. Therefore, we first describe how van den Akker et al. (2013) constructed this map. In the subsequent section we describe the methodology of this study.
The risk of subsoil compaction is a function of wheel loads of machines, which is related to land use, and soil mechanical strength, which is determined by various soil properties such as soil texture and water content. The map of soil compaction risk was constructed by combining information derived from the land use database of the Netherlands (Hazeu et al., 2010), and from the Soil Map of the Netherlands 1:50 000 and associated database with descriptions of typical soil profiles (de Vries, 1999).
The land use database was used to determine typical agricultural machinery and associated typical wheel loads, tyres and tyre inflation pressures for agricultural areas in the Netherlands. In this, an inventory of Vermeulen et al. (2013) was used, in which typical, commonly used heavy machinery, wheel loads and tyres in 1980 and 2010 are compared. The SOCOMO model (van den Akker, 2004) was used to calculate the soil stresses at several depths for each of these wheel loads.
The calculated soil stresses for 2010 were compared with the soil strengths in the same way as presented in van den Akker (2004) and van den Akker and Hoogland (2011). Also the same soil classification as in van den Akker (2004) and van den Akker and Hoogland (2011) was used. Based on the land use map and the soil map 1:50 000 of the Netherlands for each parcel, the exerted soil stresses on the subsoil by typical wheel loads for that land use were compared with the strength of that subsoil for a wet soil (at about field capacity) and a moist soil (a soil water suction of about −30 kPa). Five risk categories were considered: very high, high, moderate, low and very low. If the exerted soil stresses were higher than the strength of a moist soil, then the risk of subsoil compaction was considered to be “high”. If the exerted soil stresses did not exceed the strength of the moist soil but exceeded the strength of the wet soil, then the subsoil compaction risk was “moderate”. In the case of the exerted soil stresses not exceeding the strength of the wet subsoil, the subsoil compaction risk was “very low”.
In a second step factors that increase or decrease the risk of subsoil compaction in the long term were taken into account. Factors that improve the resilience and natural recuperation of the compacted subsoil and in that way decrease the subsoil compaction risk are the following:
-
The soil is well drained and in general dry, improving the resilience and the natural recuperation.
-
Clay content is >17.5 %: improved natural recuperation by swelling and shrinkage and structure-forming processes.
-
Organic matter content is >4 %: improved rebound after loading and biological structure-forming processes.
-
Coarse sand: hardly any increase in dry bulk density, water infiltration is never a problem.
-
Only a limited part of the parcel can be trafficked and so compacted, e.g. forests or orchards.
Factors that increase the risk of subsoil compaction are as follows:
-
The soil is often wet.
-
The typical wheel loads of the land use will cause compaction at depths >40 cm.
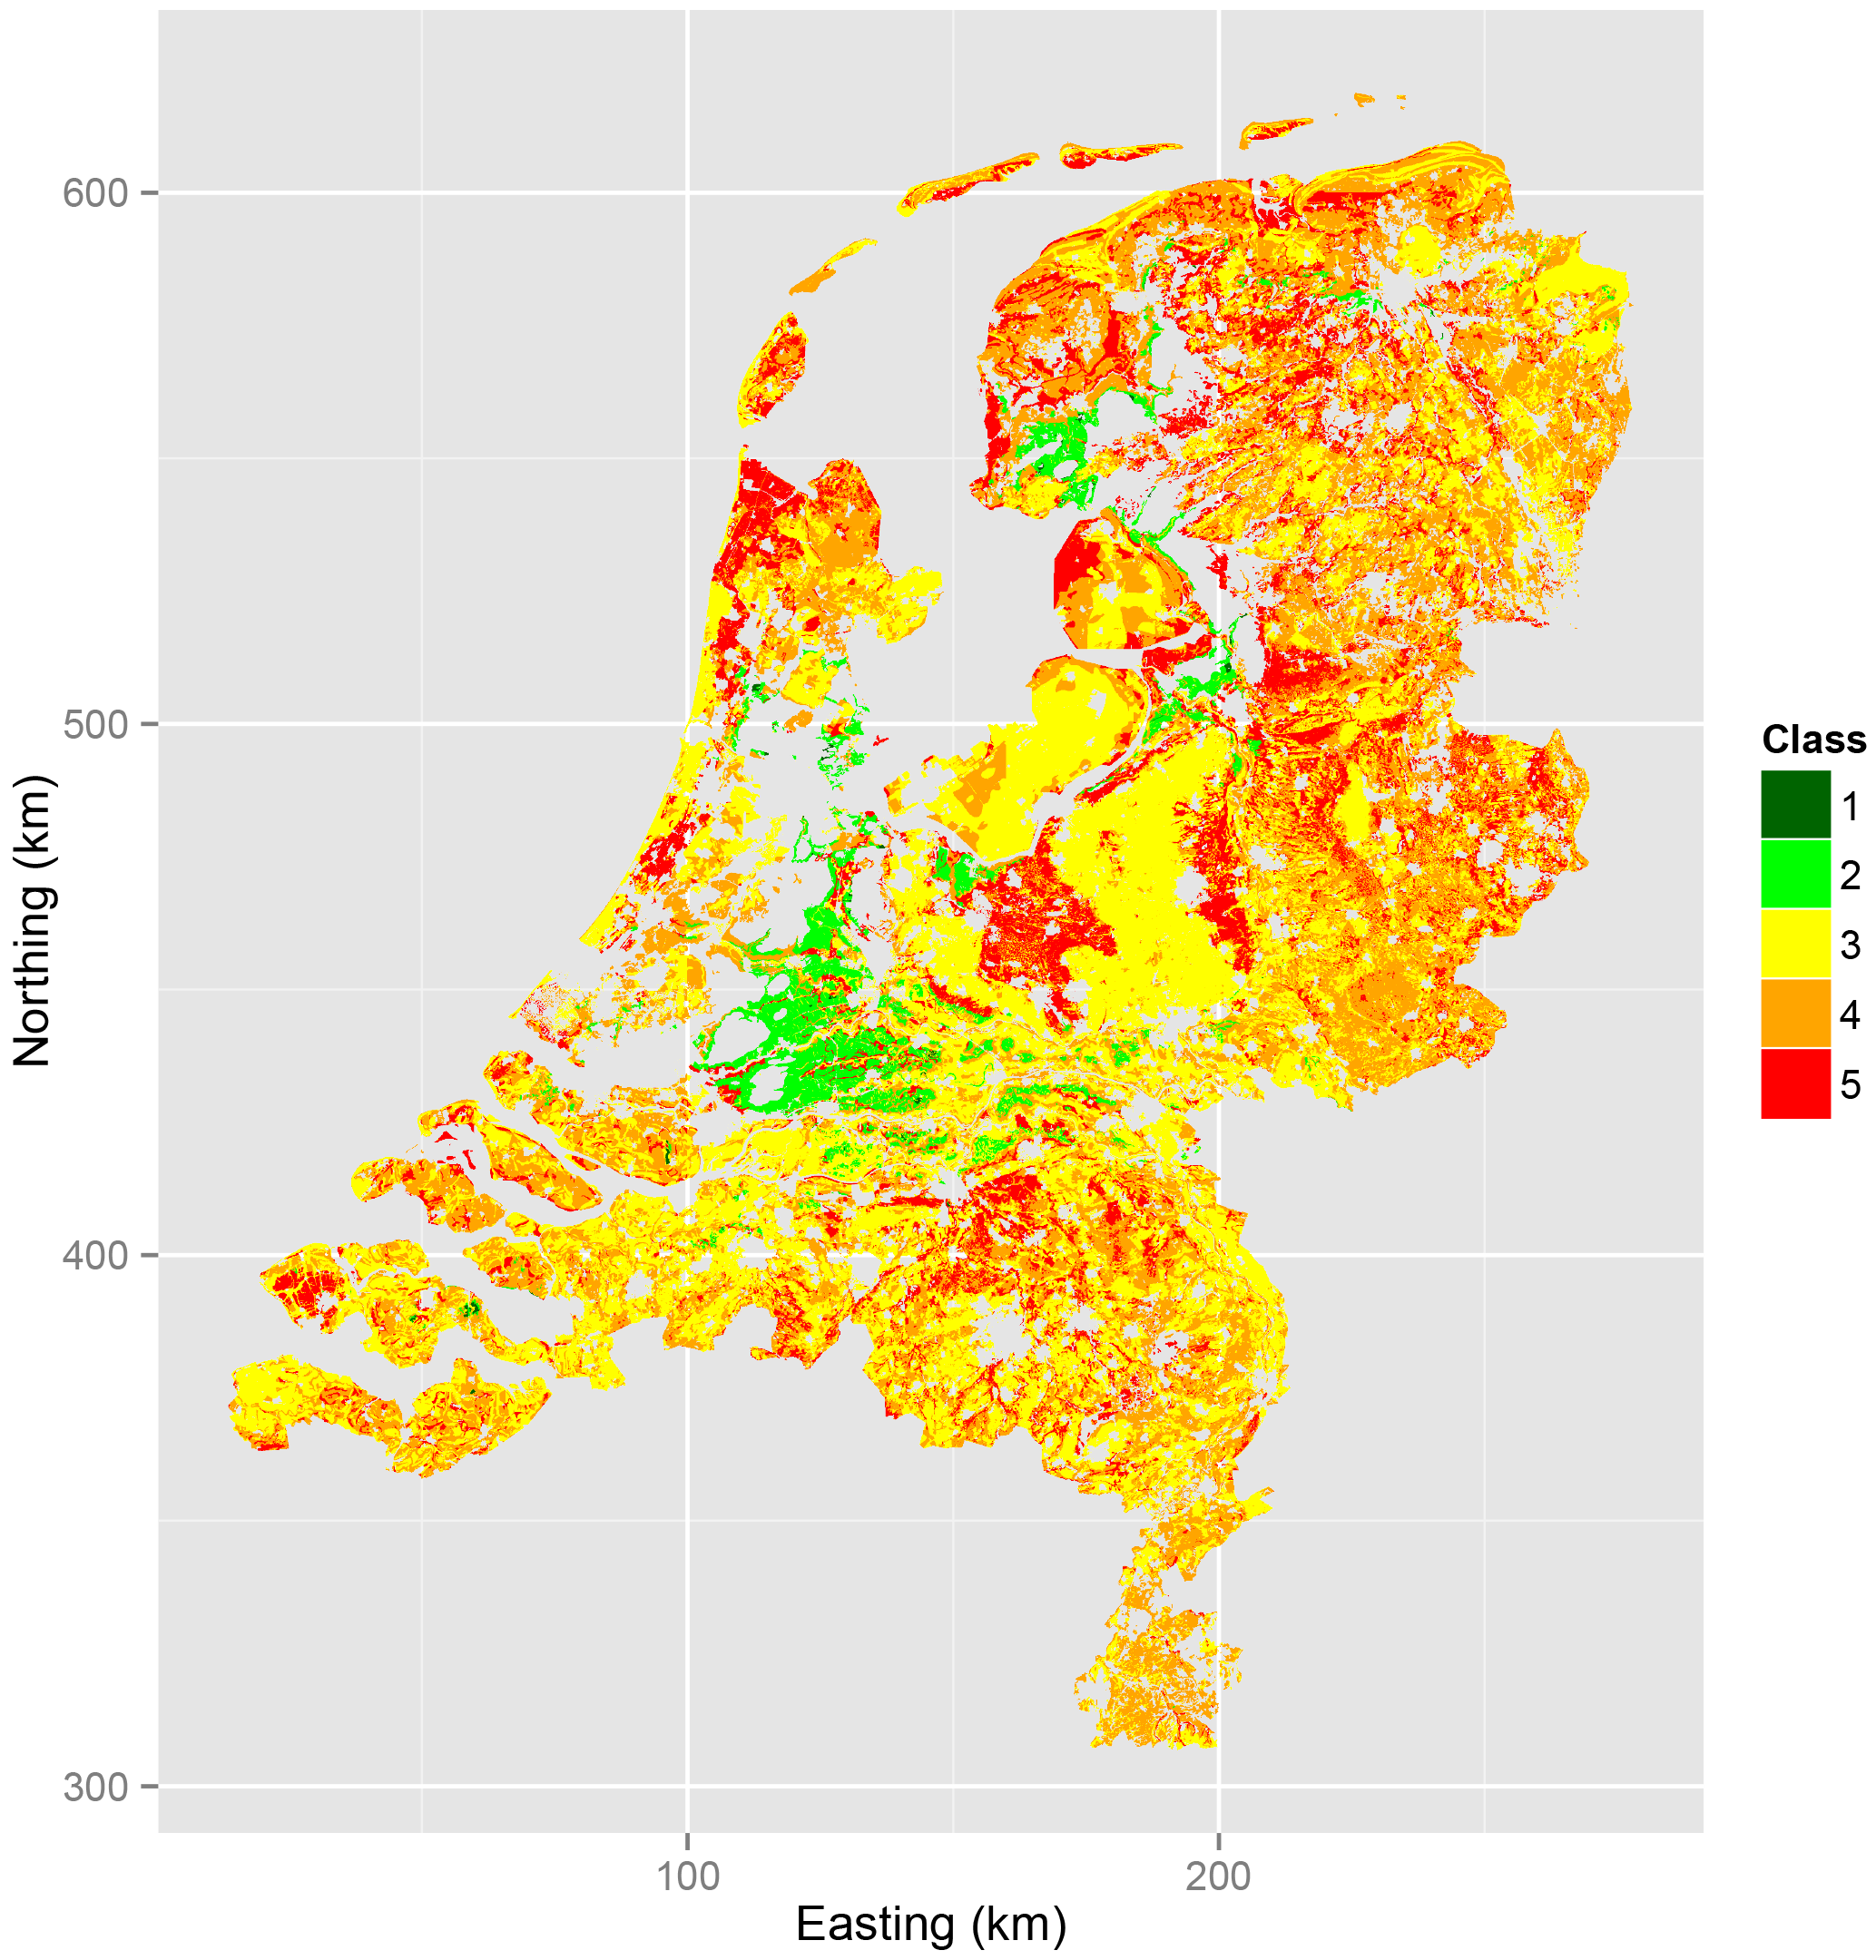
All positive and negative factors are added together and the risk class in the first step is increased or decreased by a maximum of one class. The change in class is limited to one step to account for the fact that overloading and compaction of the subsoil are cumulative in time and recuperation by shrinkage and biological processes is never complete; therefore, the risk classification should be mainly determined as a function of the exerted stresses at a certain depth and the strength of the soil at that depth. Figure 1 shows the soil compaction risk map.
3.1 Sampling design
For estimating means of subsoil compaction parameters, locations were selected by probability sampling, i.e. by random sampling with known inclusion probabilities which are >0 for all locations in the study area (Särndal et al., 1992). With probability sampling, model-free, design-based estimates of spatial means and their variances can be obtained, so that discussions on the validity of the results are avoided (Brus and de Gruijter, 1997; de Gruijter and ter Braak, 1990). Stratified simple random sampling was chosen as a design type (de Gruijter et al., 2006). For stratification we used the map showing the risk of subsoil compaction in five classes (Fig. 1). When the risk map units are related to the subsoil compaction parameters measured in this study (see below), we expect a gain in precision of the estimated nationwide means compared to simple random sampling with the same sample size. In addition, a map showing the provinces of Zeeland, Noord-Brabant, Gelderland and the remaining provinces was used for stratification This map was used to control the sample sizes in these administrative units. The three mentioned provinces contributed additional financial resources, so that these provinces claimed extra sampling locations. The assumption was that in the provinces of Gelderland, Noord-Brabant and Zeeland the problem of subsoil compaction is more serious, due to the intensive use of heavy machines in agriculture. The ultimate strata were obtained by overlaying the two maps. All five risk classes were present in all administrative units, so that the total number of strata became .
The total sample size was 128. The sample sizes in the provinces Gelderland, Noord-Brabant and Zeeland were 20, 39 and 30, respectively, leaving 39 for the remaining provinces. These sample sizes were allocated proportionally to the area of the five risk map units within the provinces. The total sample sizes in the risk map units 1 (“low risk”) to 5 (“high risk”) were 4, 5, 56, 44 and 19. The small sample sizes for the risk map units 1 and 2 reflect the small areas of these two units: the sum of their areas is only 4.6 % of the total area.
The target population consists of all soils in the Netherlands, both cultivated and uncultivated soils, except soils with a low compaction risk due to peat layers, naturally compacted soils (“knipkleigronden”) and soils in glasshouses.
3.2 Field sampling and laboratory measurements
The randomly selected locations were localized by differential GPS. If a randomly selected sampling location was unsuitable for collecting soil samples (no soil present, no permission, not part of the target population), the first point on a reserve list, in the same stratum as the omitted point, was added to the list of points to be visited.
At each sampling location three volumetric subsoil samples were collected using a cylinder with a diameter of 7.6 cm. The length of the soil cores was 5 cm. The soil cores were collected directly below the plough layer (sandy soils below 35 cm, clay soils below 20 to 22 cm). If a plough layer was absent or unclear, the sampling depth was based on the penetration resistance as measured with a penetrometer. The clay content and soil organic matter content was estimated by the soil surveyor in the field. The dry bulk density and the actual moisture content was determined in the laboratory by weighing and drying of the samples. The porosity was calculated from the dry bulk density using a particle density of the mineral parts of 2.65 g cm−3 and a specific weight of the soil organic matter of 1.47 g cm−3.
3.3 Soil compaction parameters
We used the relative bulk density and relative porosity as subsoil compaction parameters. The relative bulk density is defined as the actual bulk density when seen as a fraction of the threshold value of the bulk density (van den Akker and Hoogland, 2011). For sand and loamy soils (clay content <16.7 %), this threshold value is 1.6 g cm−3; for soils with clay content >16.7 %, the threshold value is 1.75–0.009×clay g cm−3. More information about the latter threshold value is presented in the reports I and V of the ENVASSO project (https://esdac.jrc.ec.europa.eu/content/envasso-environmental-assessment-soil-monitoring) (Huber et al., 2008; Jones et al., 2008).
The relative porosity is defined as the actual porosity when seen as a fraction of the threshold value of the porosity, which is 0.4 as determined in the ENVASSO project (Huber et al., 2008). In general this threshold value was only a problem in sandy and loamy soils with some organic matter.
If either the relative bulk density >1 or the relative porosity <1, the subsoil is classified as being overcompacted.
3.4 Estimation of means and areal fractions
The global means of the relative bulk density and relative porosity were estimated by design-based inference, more specifically by the usual estimator for stratified simple random sampling:
with H being the total number of strata (H=20), wh the weight of stratum h quantified by the relative area, the estimated mean of stratum h, nh the number of sampling points in stratum h and yhi the measurement of the target soil property at location i in stratum h. The overcompacted areal fraction can be estimated by the same equations, replacing yhi by an indicator having value 1 if the subsoil at that location is overcompacted and having 0 elsewhere.
These estimators were also used to estimate the means of the two subsoil compaction parameters and the overcompacted areal fraction for the five units of the soil compaction risk map and for the three provinces. These sub-areas are unions of complete strata; i.e. they do not contain one or more strata which only partly belong to the sub-area, so that estimation is straightforward.
3.4.1 Estimation of sampling variances
In all four strata of risk map unit 1 and the three strata of risk map unit 2, only 1 point was selected. This complicates the estimation of the sampling variance of the estimated means. Following the approach of Cochran (1977), we collapsed all four strata of risk map unit 1 and all four strata of risk map unit 2. The total number of sampling points in the two collapsed strata were four (risk map unit 1) and five (risk map unit 2). After collapsing, the total number of strata was . The sampling variance of the estimated means was then estimated by
with C being the total number of strata after collapsing (C=14), wc the weight of the (collapsed) stratum c quantified by the relative area, the estimated sampling variance of the estimated mean of the (collapsed) stratum c, the estimated spatial variance within the (collapsed) stratum c, nc the number of sampling points in the (collapsed) stratum c and the estimated mean in the (collapsed) stratum c (the sample average in the (collapsed) stratum c). Standard errors of the estimated means are computed by the square root of the estimated sampling variances.
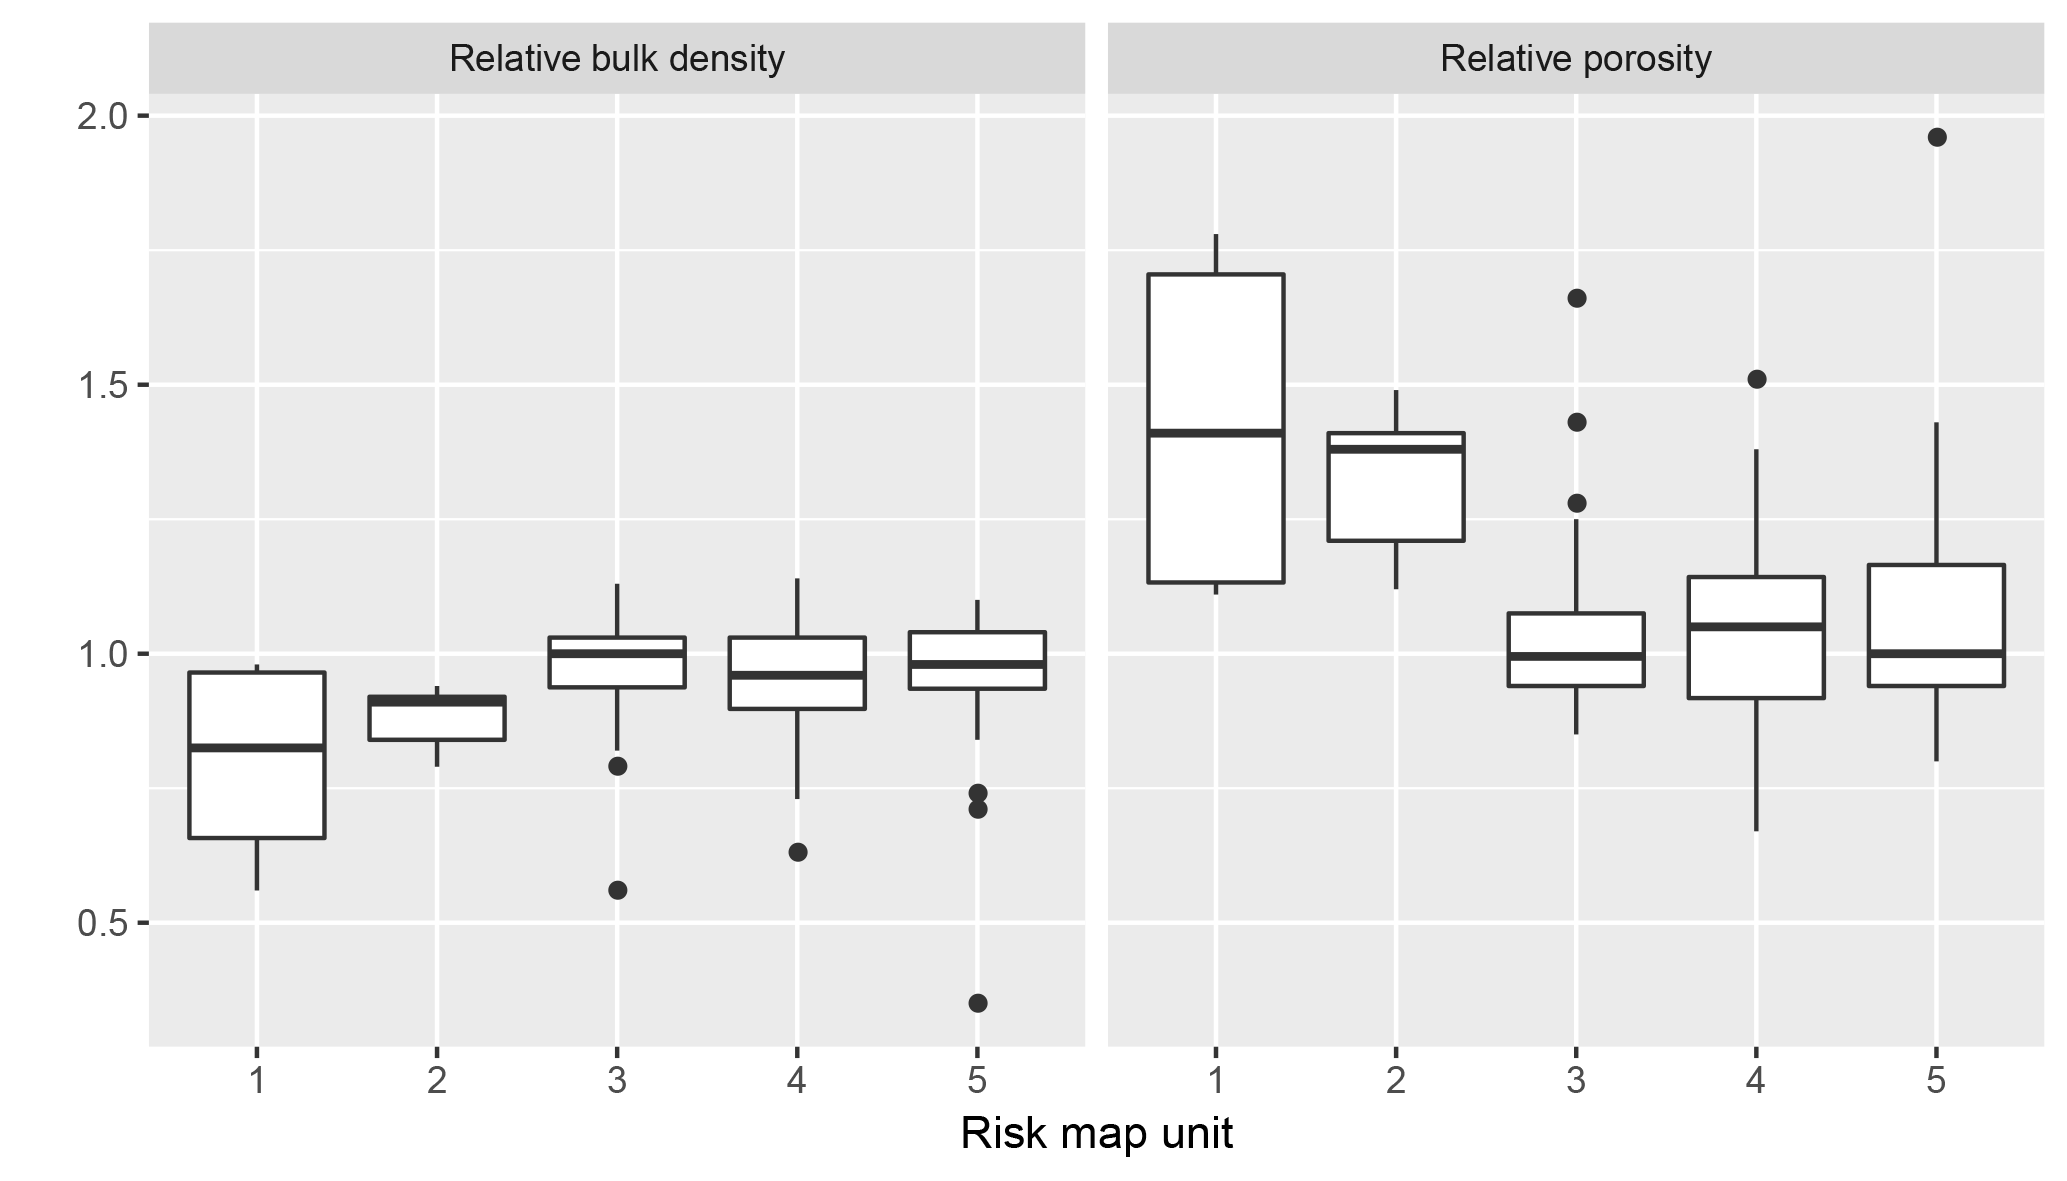
Figure 2Box plots of relative bulk density and relative porosity per risk map unit (1: low risk; 5: high risk)
The sampling variance of the estimated areal fractions was estimated by Cochran (1977):
4.1 Descriptive statistics of data
Figure 2 shows box plots of the relative bulk density and relative porosity for the five risk map units. The lower and upper side of the box represent the first and third quartile, the central line the median. Note that the box plots for risk map unit 1 and 2 are based on 4 and 5 measurements only. For both subsoil compaction parameters, the risk map units can be aggregated into two distinct groups: a group with relatively low subsoil compaction consisting of map units 1 and 2 and a group of relatively high subsoil compaction consisting of map units 3, 4 and 5. Differences between risk map units within the same group were small compared to differences between groups. In all three risk map units 3, 4 and 5 outliers occurred with a relatively small relative bulk density and relatively large relative porosity (dots in Fig. 2).
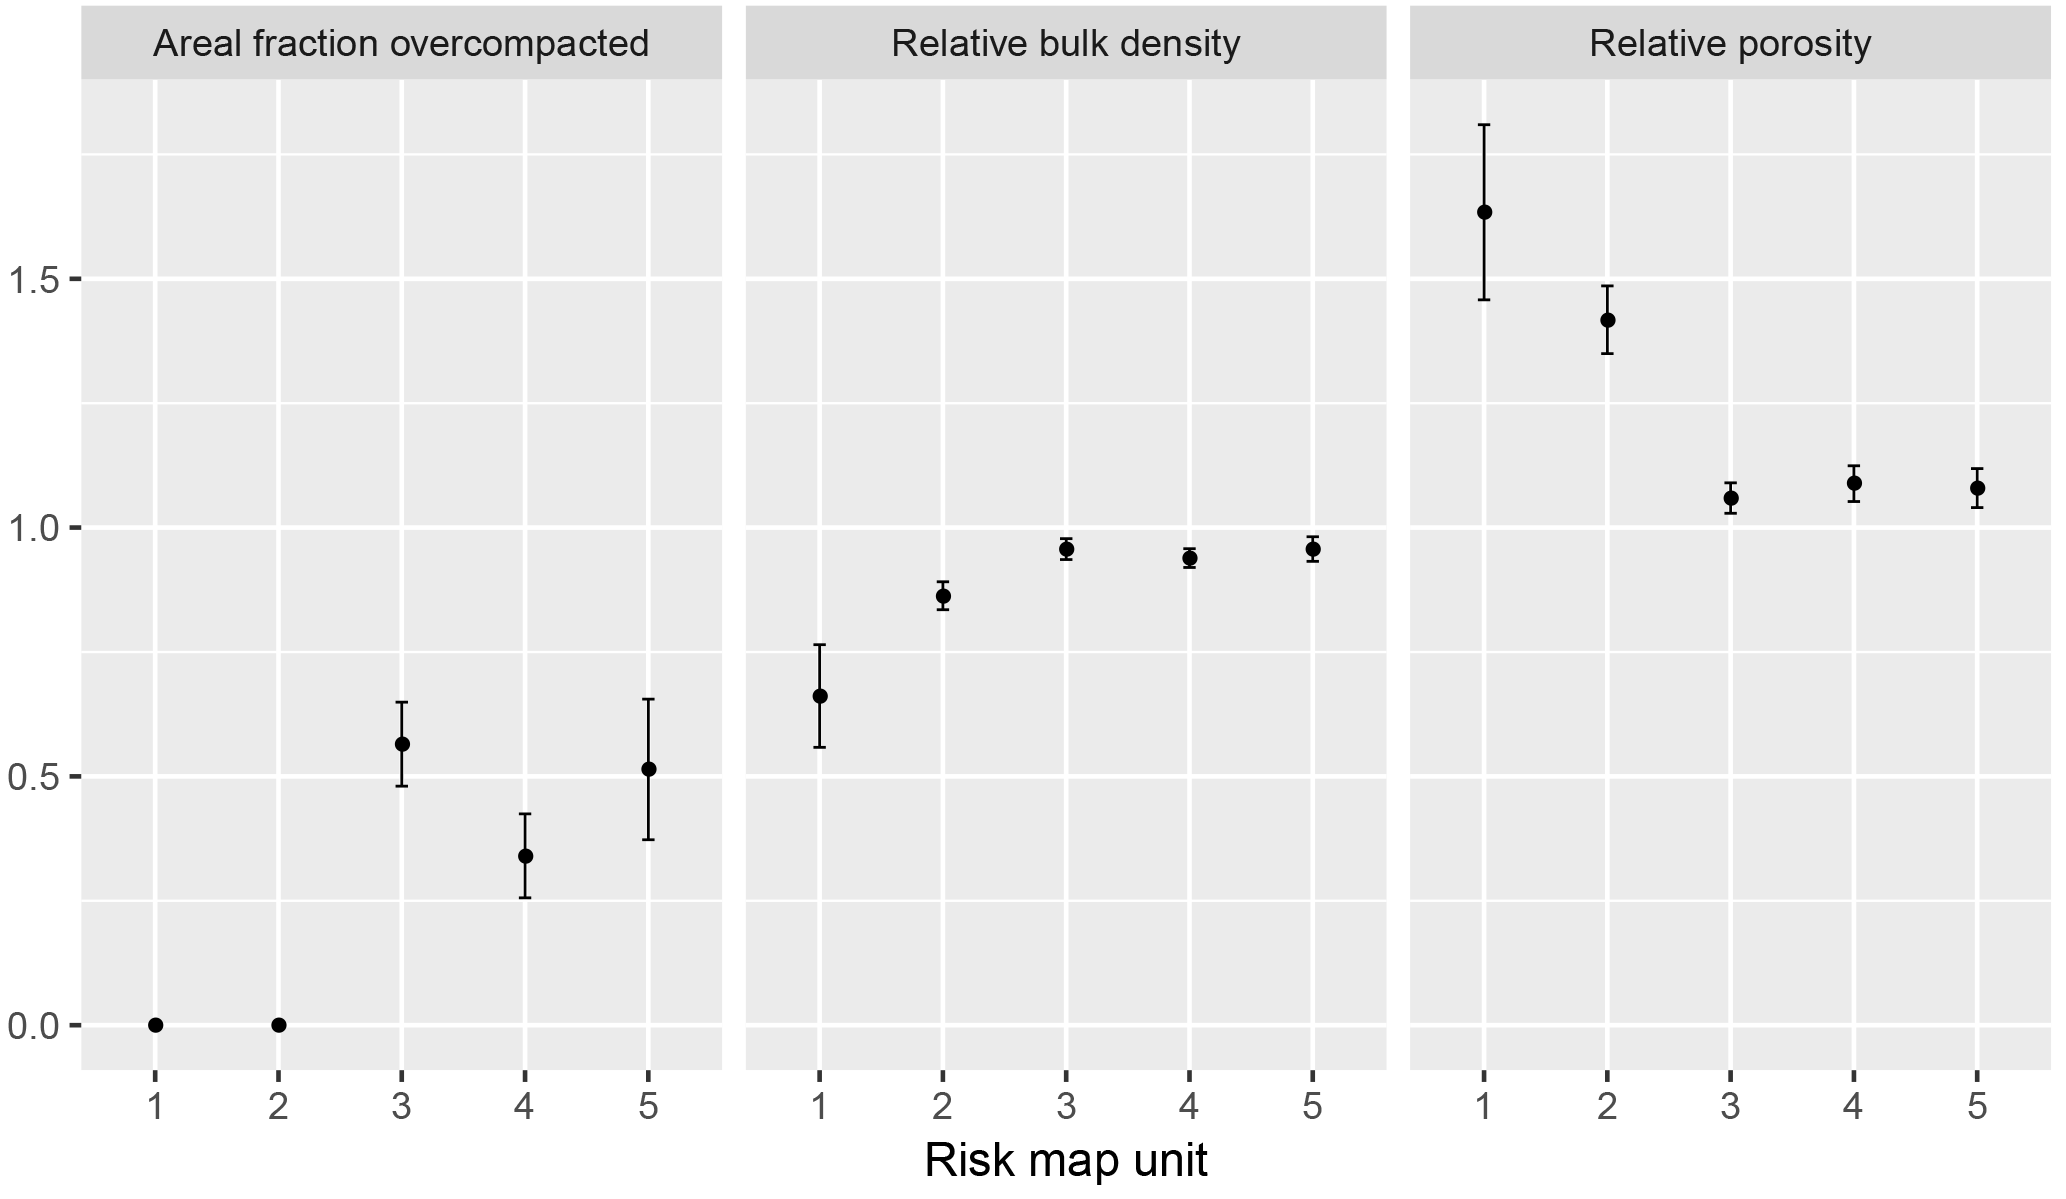
Figure 3Estimated means of subsoil compaction parameters and areal fractions of overcompacted subsoils for the five risk map units. The error bars indicate the standard error of the estimated means or areal fraction
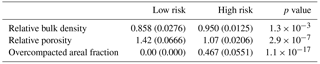
Table 1Design-based estimates of means of two subsoil compaction parameters and of overcompacted areal fraction for the low-risk groups (map units 1 and 2) and high-risk groups (map units 3, 4 and 5). In brackets: standard error.
4.2 Means of subsoil compaction parameters and overcompacted areal fraction
The estimated global mean of relative bulk density was 0.946 with an estimated standard error of 0.012. The estimated global mean of relative porosity was 1.090 with an estimated standard error of 0.020. The estimated areal fraction of the target population with overcompacted subsoils was 0.446 with an estimated standard error of 0.053. Correcting the estimated areal fraction for the peat soils that were excluded from the target population (covering about 4.5 % of the Netherlands) gives an estimated overcompacted areal fraction of about 43 % of the Netherlands
Design-based estimates of the means of the two subsoil compaction parameters and of the overcompacted areal fractions per risk map unit are shown in Fig. 3. The error bars represent the standard error of the mean. So for a 95 % confidence interval the length of the bars must be approximately doubled. The estimated means confirm what we have seen in the raw box plots (Fig. 2). Estimated means of relative bulk density were relatively low in map units 1 and 2 and relatively high in map units 3 to 5, and accordingly estimated means of relative porosity were relatively large in map units 1 and 2 and relatively small in map units 3 to 5. The standard errors of the estimated means for map units 3 to 5 were acceptable; for map units 1 and 2 these were large compared to the estimated means due to the very small sample sizes. The error bars of map units within the above-mentioned groups clearly overlap, so that without statistical testing we can safely conclude that the means of risk map units within a group were not significantly different.
For map units 1 and 2 the estimated areal fractions of overcompacted subsoils were both 0 (in both units no sampling points had a relative bulk density >1 or a relative porosity <1), whereas for map units 3 to 5 these varied from 0.34 (map unit 4) to 0.56 (map unit 3).
As differences between map units 1 and 2 and between the map units 3, 4 and 5 were small, we also estimated means and areal fractions for these two groups (Table 1). The sample sizes in these two groups were 9 (map units 1 and 2) and 119 (map units 3, 4 and 5). The estimated mean relative bulk density in the high-risk group (units 3, 4 and 5) was 9.2 % larger than in the low-risk group. The difference in estimated mean relative porosity between the two groups was larger: 1.07 for the high-risk group of map units vs. 1.42 for the low-risk group. Note that the mean relative porosity for the high-risk group exceeded the value of 1. The overcompacted areal fraction was about 47 % for the high-risk group, whereas it was 0 for the low-risk group. All differences were significant at a significance level of 0.01.
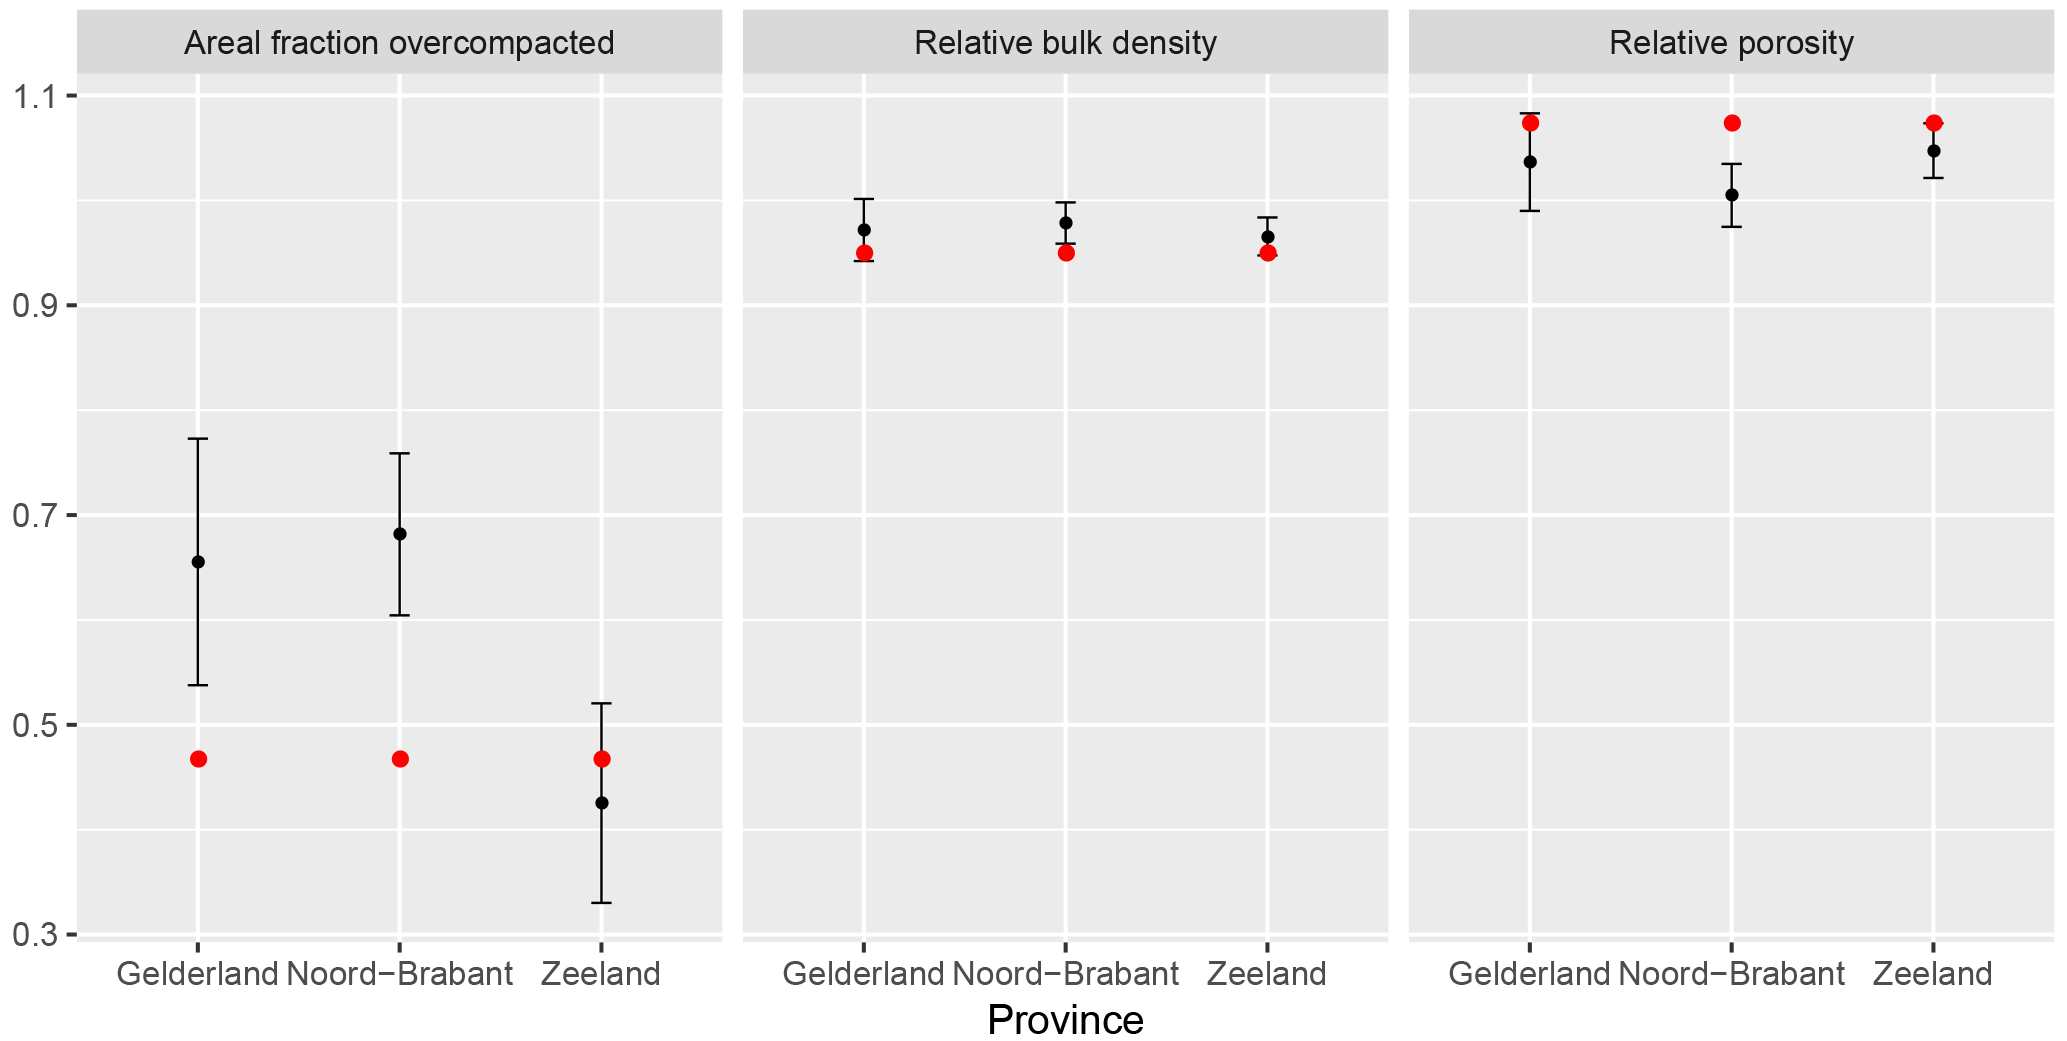
Figure 4Estimated means of subsoil compaction parameters and areal fractions of overcompacted subsoils for high-risk group of map units (units 3, 4 and 5) in the three provinces. The error bars indicate the standard error of the estimated means or areal fraction. The red dots are the estimated means or areal fraction for the Netherlands.
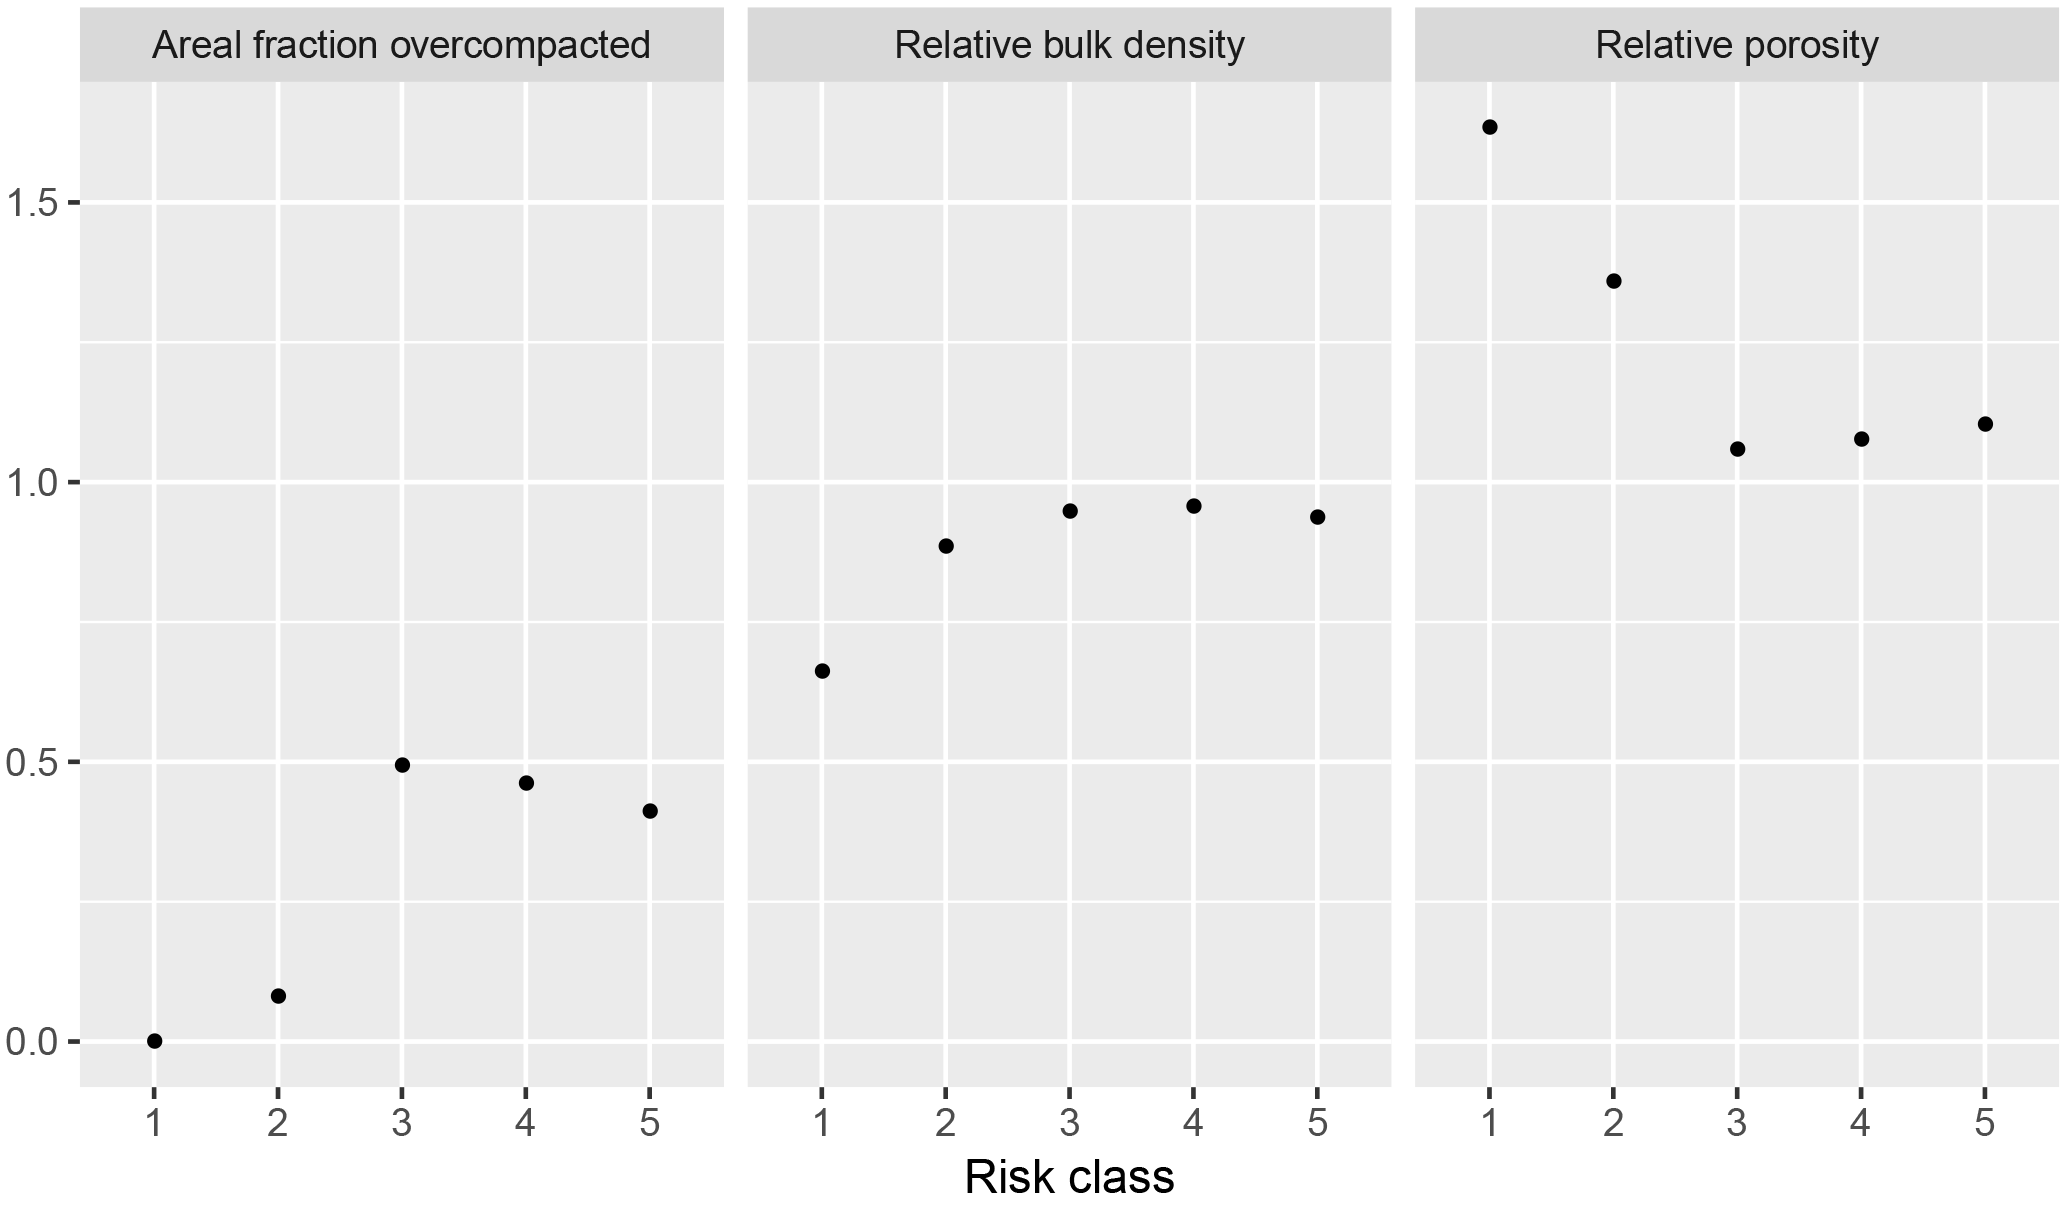
Figure 5Estimated means of subsoil compaction parameters and estimated areal fraction of overcompacted subsoils for the risk classes in the field.
Finally, we estimated means of the two subsoil compaction parameters and overcompacted areal fraction for the high-risk group of map units in the three provinces to check the assumption that in these provinces the problem of subsoil compaction was more serious (Fig. 4). The means of relative bulk density and relative porosity did indeed indicate more serious subsoil compaction problems in these provinces, although the differences to the global means were not significant. The estimated overcompacted areal fraction was larger than the global areal fraction for the provinces of Noord-Brabant and Gelderland but not for Zeeland.
The aggregated map unit high risk covers 95.4 % of the Netherlands. About 47 % of the subsoils within this aggregated map unit are overcompacted, but the map contains no information about where these overcompacted subsoils occur, as the risk map units 3, 4 and 5 are not associated with the subsoil compaction parameters and subsoil overcompaction; i.e. differences between the map units 3, 4 and 5 of the current means of subsoil compaction parameters were small.
A possible explanation is the poor quality of the soil compaction risk map. The soil compaction risk class as depicted on the map will not correspond everywhere with the risk class in the field, i.e. the risk class as based on the soil profile characteristics observed in the field. We estimated the purity of the five map units, i.e. the areal fractions of the map units where the soil compaction risk class as depicted on the map corresponds with the risk class in the field (Brus et al., 2011). For map units 1 and 2 the estimated purity was 1, but these estimates were based on a few sampling points only, and therefore are very inaccurate. For map units 3, 4 and 5 the estimated purities were 0.80, 0.71 and 0.84, respectively. This indicates that the small differences in subsoil compaction parameters between the map units cannot be attributed to low map unit purities. This was confirmed by the estimated means of the subsoil compaction parameters for the risk classes in the field (Fig. 5). The patterns are very similar to those for the risk map units (Fig. 3). Again the differences between the risk classes 3, 4 and 5 in the field were small.
A second explanation could be a poor performance of the SOCOMO model. However, comparisons between modelled and measured stresses showed good agreement (Keller et al., 2014; van den Akker, 2004). It should also be noted that in general the calculated stresses were much higher than the strength of the subsoil (van den Akker et al., 2013) and also much higher than the strength threshold value of 40 kPa for the subsoil determined by Keller et al. (2012).
A third possible explanation is the lack of time for the natural recuperation of subsoil compaction. Due to the intensive agricultural land use, the subsoil is overloaded every second or third year, so considering a recuperation time of about 10 years of the upper subsoil up to a depth of 40 cm (Håkansson and Reeder, 1994), the expected natural recuperation in clay subsoils or sandy subsoils with a soil organic matter content >4 % can only be very limited and temporary.
The 47 % of the area with a high risk of subsoil compaction that does indeed have an overcompacted subsoil is in good agreement with the 50 % overcompacted subsoils predicted for 2010 in van den Akker and Hoogland (2011). This prediction was based on legacy data mainly collected before 1988, whereas the data of this paper were collected by probability sampling in 2013.
About 43 % of the subsoils in the Netherlands are overcompacted.
The map of risk of subsoil compaction of van den Akker et al. (2013) provides only very rough information about where these overcompacted subsoils occur in the Netherlands.
In terms of the subsoil compaction parameters relative bulk density and relative porosity and in terms of the areal fraction of overcompacted subsoil, only two risk classes and risk map units can be distinguished: low risk (risk classes/map units 1 and 2) and high risk (risk classes/map units 3, 4 and 5).
The lack of time for natural recuperation can be an explanation of the fact that, despite the good quality of the risk map in terms of map unit purity and class representation, no differences in subsoil compaction can be distinguished between the map units 3, 4 and 5.
Data are available in the Supplement.
The supplement related to this article is available online at: https://doi.org/10.5194/soil-4-37-2018-supplement.
The authors declare that they have no conflict of interest.
The authors acknowledge the Interprovinciaal Overleg (IPO, Inter-Provincial Consultation) for funding the research in the PRISMA program.
Edited by: Olivier Evrard
Reviewed by: two anonymous referees
Alakukku, L.: Response of annual crops to subsoil compaction in a field experiment on clay soil lasting 17 years, Adv. Geoecol., 32, 205–208, 2000. a
Alblas, J., Wanink, F., Van den Akker, J., and Van der Werf, H. M. G.: Impact of traffic-induced compaction of sandy soils on the yield of silage maize in the Netherlands, Soil Till. Res., 29, 157–165, https://doi.org/10.1016/0167-1987(94)90052-3, 1994. a
Berisso, F. E., Schjønning, P., Keller, T., Lamande, M., Etana, A., de Jonge, L. W., Iversen, B. V., Arvidsson, J., and Forkman, J.: Persistent effects of subsoil compaction on pore size distribution and gas transport in a loamy soil, Soil Till. Res., 122, 42–51, https://doi.org/10.1016/j.still.2012.02.005, 2012. a
Berisso, F. E., Schjønning, P., Keller, T., Lamande, M., Simojoki, A., Iversen, B. V., Alakukku, L., and Forkman, J.: Gas transport and subsoil pore characteristics: Anisotropy and long-term effects of compaction, Geoderma, 195, 184–191, https://doi.org/10.1016/j.geoderma.2012.12.002, 2013. a
Brus, D. J. and de Gruijter, J. J.: Random sampling or geostatistical modelling? Choosing between design-based and model-based sampling strategies for soil (with Discussion), Geoderma, 80, 1–59, 1997. a
Brus, D. J., Kempen, B., and Heuvelink, G. B. M.: Sampling for validation of digital soil maps, Eur. J. Soil Sci., 62, 394–407, https://doi.org/10.1111/j.1365-2389.2011.01364.x, 2011. a
Cochran, W. G.: Sampling Techniques, Wiley, New York, 1977. a, b
de Gruijter, J. J. and ter Braak, C. J. F.: Model-free estimation from spatial samples: a reappraisal of classical sampling theory, Math. Geol., 22, 407–415, 1990. a
de Gruijter, J. J., Brus, D. J., Bierkens, M. F. P., and Knotters, M.: Sampling for Natural Resource Monitoring, Springer, Berlin, 2006. a
de Vries, F.: Karakterisering van Nederlands gronden naar fysisch-chemische kenmerken, Staring Centrum-rapport 654, Alterra, Wageningen University and Research Centre, 1999. a
Etana, A., Larsbo, M., Keller, T., Arvidsson, J., Schjønning, P., Forkman, J., and Jarvis, N.: Persistent subsoil compaction and its effects on preferential flow patterns in a loamy till soil, Geoderma, 192, 430–436, 2013. a
European Commission: Communication from the Commission to the Council, the European Parliament, the European Economic and Social Committee of the regions. Thematic Strategy for Soil Protection, Tech. Rep. COM (2006) 231 final, Commission of the European Communities, Brussels, 2006. a
Fraters, B.: Generalized Soil Map of Europe, Aggregation of the FAO-Unesco soil units based on the characteristics determining the vulnerability to degradation processes, RIVM Report 481505006, National Institute of Public Health and the Environment (RIVM), Bilthoven, the Netherlands, 1996. a
Håkansson, I., and Reeder, R. C.: Subsoil compaction by vehicles with high axle load extent, persistence and crop response, Soil Till. Res., 29, 277–304, 1994. a, b, c
Hazeu, G. W., Schuiling, C., Dorland, G. J., Oldengarm, J., and Gijsbertse, H. A.: Landelijk grondgebruiksbestand Nederland versie 6, Alterra-rapport 2012, Alterra, Wageningen University and Research Centre, 2010. a
Huber, S., Prokop, G., Arrouays, D., Banko, G., Bispo, A., Jones, R. J. A., Kibblewhite, M. G., Lexer, W., Möller, A., Rickson, R. J., Shishkov, T., Stephens, M., Toth, G., Van den Akker, J. J. H., Varallyay, G., Verheijen, F. G. A., and Jones, A. R.: Environmental Assessment of Soil for Monitoring: Volume I Indicators and Criteria, Office for Official Publications of the European Communities, Luxembourg, 2008. a, b
Jones, R., Spoor, G., and Thomasson, A.: Vulnerability of subsoils in Europe to compaction: a preliminary analysis, Soil Till. Res., 73, 131–143, https://doi.org/10.1016/S0167-1987(03)00106-5, 2003. a
Jones, R. J. A., Verheijen, F. G. A., Reueter, H. I., and Jones, A. R.: Environmental Assessment of Soil for Monitoring Volume V: Procedures and Protocols. , Office for Official Publications of the European Communities, Luxembourg, available at: https://esdac.jrc.ec.europa.eu/projects/Envasso/documents/ENV_Vol-V_Final2_web.pdf (last access: February 2018), 2008. a
Keller, T., Arvidsson, J., Schjonning, P., Lamande, M., Stettler, M., and Weisskopf, P.: In Situ Subsoil Stress-Strain Behavior in Relation to Soil Precompression Stress, Soil Science, 177, 490–497, 2012. a
Keller, T., Berli, M., Ruiz, S., Lamande, M., Arvidsson, J., Schjonning, P., and Selvadurai, A.: Transmission of vertical soil stress under agricultural tyres: Comparing measurements with simulations, Soil Till. Res., 140, 106–117, 2014. a
Lipiec, J. and Hatano, R.: Quantification of compaction effects on soil physical properties and crop growth, Geoderma, 116, 107–136, 2003. a
Särndal, C. E., Swensson, B., and Wretman, J.: Model Assisted Survey Sampling, Springer, New York, 1992. a
Schjønning, P., van den Akker, J. J. H., Keller, T., Greve, M. H., Lamande, M., Simojoki, A., Stettler, M., Arvidsson, J., and Breuning-Madsen, H.: Driver-Pressure-State-Impact-Response (DPSIR) analysis and risk assessment for soil compaction – a European perspective, in: Advances in Agronomy, vol. 133, edited by: Sparks, D. L., 183–237, Elsevier, Amsterdam, https://doi.org/10.1016/bs.agron.2015.06.001, 2015. a
Van Camp, L., Bujarrabal, B., Gentile, A. R., Jones, R. J. A., Montanarella, L., Olazabal, C., and Selvaradjou, S. K.: Soil thematic strategy, in: Reports of the Technical Working Groups Established under the Thematic Strategy for Soil Protection, EUR 21319 EN/1, 872 pp. Office for Official Publications of the European Communities, Luxembourg, 2004. a
van den Akker, J. J. H.: SOCOMO: a soil compaction model to calculate soil stresses and the subsoil carrying capacity, Soil Till. Res., 79, 113–127, https://doi.org/10.1016/j.still.2004.03.021, 2004. a, b, c, d
van den Akker, J. J. H., and Hoogland, T.: Comparison of risk assessment methods to determine the subsoil compaction risk of agricultural soils in the Netherlands, Soil Till. Res., 114, 146–154, 2011. a, b, c, d, e
van den Akker, J. J. H., Arvidsson, J., and Horn, R.: Introduction to the special issue on experiences with the impact and prevention of subsoil compaction in the European Union, Soil Till. Res., 73, 1–8, https://doi.org/10.1016/S0167-1987(03)00094-1, 2003. a
van den Akker, J. J. H., de Vries, F., Vermeulen, G. D., Hack-ten Broeke, M. J. D., and Schouten, T.: Risico op ondergrondverdichting in het landelijk gebied in kaart, Alterra-rapport 2409, Alterra, Wageningen University and Research Centre, Wageningen, available at: http://edepot.wur.nl/251636 (last access: February 2018), 2013. a, b, c, d, e
Van Ouwerkerk, C., and Soane, B. D.: Conclusions and recommendations for further research on soil compaction in crop production, in: Soil Compaction in Crop Production. Developments in Agricultural Engineering, vol. 11, edited by: Soane, B. D., and Van Ouwerkerk, C., Elsevier, Amsterdam, 1994. a
Vermeulen, G. D., Verwijs, B. R., and Van den Akker, J. J. H.: Comparison of loads on soils during agricultural field work in 1980 and 2010 (in Dutch with English Summary), Tech. rep., Plant Research International, Wageningen University and Research Centre, 2013. a
Voorhees, W. B.: Long-term effect of subsoil compaction on yield of maize, Adv. Geoecol., 32, 331–338, 2000. a