
the Creative Commons Attribution 4.0 License.
the Creative Commons Attribution 4.0 License.
 | 16 Oct 2026
Two decades of conservation agriculture enhances soil structure, carbon sequestration, and water retention in Mediterranean soils
Jennifer Alvarez-Sagrero

Asmeret Asefaw Berhe
Stephany S. Chacon
Jeffrey P. Mitchell
Teamrat Afewerki Ghezzehei
Conservation agriculture offers a pathway for enhancing soil health with climate co-benefits in Mediterranean agricultural systems. This study examined long-term impacts of combining reduced tillage with cover cropping over 20 years in California's Central Valley, providing insights into soil system response under sustained conservation management. We assessed soil physical, chemical, and structural properties comparing reduced tillage with cover crops (CTCC) to standard tillage without cover crops (STNC), employing density fractionation and spectroscopic analysis to understand carbon protection mechanisms. After two decades, conservation agriculture produced soil conditions consistent with the approach toward a management-induced steady state described for systems managed for 15–20 years (Caruso et al., 2018; West and Post, 2002), characterized by shifts in carbon stabilization pathways. Water-stable aggregate analysis revealed the most pronounced management effects, with CTCC exhibiting 136 % greater stability than STNC, indicating substantial improvements in soil structural integrity. These structural enhancements corresponded with a reorganization of carbon protection mechanisms: CTCC disproportionately enriched the occluded light fraction (44.1 % vs. 35.4 % of total recovered carbon in STNC), indicating that aggregate-mediated physical protection becomes a dominant carbon stabilization pathway under long-term conservation management. Mineral-associated organic carbon saturation analysis revealed that both management systems remained well below theoretical maximum capacity (11.5 % vs. 7.4 % saturation for CTCC and STNC, respectively), indicating that mineral surface availability is not the primary constraint on carbon storage in this Mediterranean system. Physical property improvements under CTCC included 15 % lower bulk density and 13 % greater water retention at field capacity, though benefits were concentrated in the surface horizon. Our findings demonstrate that two decades of conservation agriculture substantially altered soil functioning through aggregate-mediated physical protection, while creating measurable improvements in soil structural integrity and water retention capacity. These mechanism shifts are consistent with a soil system that maintains enhanced functionality and continued carbon sequestration potential in Mediterranean agricultural systems.
- Article
(2349 KB) - Full-text XML
- BibTeX
- EndNote


Modern agricultural systems have significantly contributed to global soil degradation through intensive tillage, continuous cultivation, and management practices that disrupt fundamental soil processes (Sanderman et al., 2017; Mitchell et al., 2025). These practices have resulted in widespread erosion, loss of soil organic matter, and deterioration of soil structure, with most erosion directly attributable to anthropogenic activities such as prolonged soil exposure and excessive mechanical disturbance (Blanco-Canqui and Ruis, 2018). The consequences extend beyond local productivity losses to global biogeochemical cycling, as soils represent the largest terrestrial carbon reservoir, containing approximately 3000 Pg of carbon – more than three times the amount stored in atmosphere and vegetation combined (Friedlingstein et al., 2025). Agricultural activities have created a substantial carbon debt of 116 Pg C (Sanderman et al., 2017), yet this same sector holds significant potential for carbon sequestration, with croplands capable of sequestering over 0.28 Pg of carbon annually (Lessmann et al., 2022). Understanding how management practices can simultaneously restore soil function while maintaining agricultural productivity remains a fundamental challenge, requiring mechanistic insights into how different practices alter soil physical, chemical, and biological processes.
Conservation agriculture addresses soil degradation through three fundamental principles: minimal mechanical soil disturbance, permanent soil cover through crop residues and cover crops, and diversification of crop species through rotations (Francaviglia et al., 2023). These practices work synergistically to enhance soil biological activity, reduce erosion, and improve soil structure (Six et al., 2004). No-till farming eliminates the mechanical disruption that destroys soil aggregates and exposes organic matter to accelerated decomposition (Blanco-Canqui and Ruis, 2018). This reduction in soil disturbance can decrease erosion by more than 70 % while preserving soil pore network architecture (Lee et al., 2021). Cover crops provide continuous carbon inputs throughout the year, contributing organic matter that serves as both an energy source for soil organisms and a binding agent for aggregate formation (Dupla et al., 2022). The integration of these practices fundamentally alters soil development processes, yet our mechanistic understanding of how these changes manifest over extended timeframes remains incomplete. Most conservation agriculture research has focused on short-term responses or single management components, leaving critical knowledge gaps regarding the long-term, integrated impacts on soil functioning.
Central to understanding conservation agriculture impacts is that soil organic matter exists in multiple forms with vastly different stabilities and functions. Modern understanding distinguishes between particulate organic matter (POM) and mineral-associated organic matter (MAOC), representing fundamentally different carbon protection strategies with distinct temporal dynamics (Lavallee et al., 2020). MAOC, or the heavy fraction (HV), forms through sorption and complexation processes with clay and silt particles, creating relatively stable but potentially saturable carbon pools that develop rapidly following management changes (Stewart et al., 2009). POM comprises two carbon pools: free light fraction (FLF) and occluded light fraction (OLF). FLF consists predominantly of vegetative litter with high C:N ratios that is relatively unprotected (Leuthold et al., 2024). OLF occurs when organic matter becomes occluded within soil aggregates, where reduced oxygen diffusion and limited substrate accessibility slow decomposition rates (Christensen, 2001). Recent evidence demonstrates that row crops under conservation management in semi-arid climates can fundamentally shift carbon distribution from chemically-protected to physically-protected forms over multi-decade periods, following predictable temporal stages: initial rapid formation of MAOC during years 0–5, continued MAOC accumulation with enhanced microbial processing during years 5–15, and a mature phase beyond 15 years where MAOC approaches saturation limits and physical protection within aggregates becomes the dominant pathway for continued carbon sequestration (Tian et al., 2024). This temporal evolution reflects the finite capacity of mineral surfaces to bind organic matter, necessitating alternative protection mechanisms as soils mature under conservation management. The concept of carbon saturation, particularly for MAOC, suggests that soils may reach maximum storage capacity through certain pathways, potentially requiring shifts toward alternative protection mechanisms for continued sequestration (Georgiou et al., 2022).
Mediterranean agricultural systems provide an ideal environment for investigating conservation agriculture impacts due to their unique environmental constraints and management challenges. The Mediterranean climate, characterized by hot, dry summers and mild, wet winters, creates pronounced seasonal patterns of soil wetting and drying that intensify aggregate formation and destruction cycles (Bronick and Lal, 2005). These climatic conditions, combined with typically high clay content soils, create systems where aggregate stability becomes particularly critical for maintaining soil function. Water limitation places additional constraints on soil biological activity, potentially altering the relative importance of different carbon protection mechanisms compared to more mesic environments. The seasonal nature of precipitation and temperature patterns also influences the timing and magnitude of organic matter inputs, creating distinct pulses of substrate availability that may favor particular microbial communities and decomposition pathways. These environmental characteristics make Mediterranean systems particularly sensitive to management-induced changes in soil structure and organic matter dynamics, while simultaneously testing the resilience of conservation practices under climatic stress. California's Central Valley exemplifies these conditions while supporting intensive agricultural production, providing a representative system for understanding how conservation practices perform under real-world constraints.
Resolving these shifts in carbon protection requires methods that go beyond total soil organic carbon, which integrates pools of widely differing stability and turnover (Paustian et al., 2019). Density fractionation physically separates soil organic matter into functionally distinct FLF, OLF, and heavy-fraction (MAOC) pools (Christensen, 2001; Poeplau et al., 2018). Fourier-transform infrared (FTIR) spectroscopy complements fractionation by characterizing the molecular composition of soil organic matter (Margenot et al., 2023). Together with physical and hydraulic measurements, these methods provide a framework for evaluating conservation management impacts on soil functioning.
Building on this foundation, our study addresses long-term impacts of integrated conservation practices on soil carbon protection mechanisms in Mediterranean agricultural systems. We examine how combining reduced tillage (transitioning to true zero-tillage in 2012; see Sect. 2.2) with cover cropping over 20 years alters soil carbon distribution among protection pathways, with particular focus on the partitioning between mineral-sorptive (MAOC) and aggregate-mediated (OLF) protection. Recent research suggests that soil carbon systems under conservation agriculture approach a management-induced steady state on the order of 15–20 years (Caruso et al., 2018; West and Post, 2002). We hypothesized that long-term conservation management enhances aggregate-mediated physical protection of soil organic matter. We further assessed the degree of mineral-associated carbon saturation to evaluate whether mineral surface availability represents a primary constraint on carbon storage in this system. We employ density fractionation, spectroscopic analysis, and comprehensive soil physical characterization to test whether conservation agriculture shifts carbon stabilization mechanisms and whether these shifts correspond with measurable improvements in soil structural and hydraulic properties.
2.1 Research Location and Experimental Framework
This research was conducted at the Conservation Agriculture Systems Innovation (CASI) facility in Five Points, California (36.34° N, 120.12° W). The site features Panoche clay loam soil (fine-loamy, mixed, superactive, thermic Typic Haplocambids) with a textural gradient from clay loam to sandy clay loam. The Mediterranean climate averages 178 mm annual precipitation and temperatures ranging from 7.8–23.9 °C. Complete site characterization is available in Veenstra et al. (2007). The experiment employs a randomized complete block design with four treatments (combining standard or reduced tillage with presence or absence of winter cover crops) replicated eight times in 10 m × 100 m plots. The treatments are reduced tillage (transitioning to true zero-tillage in 2012; see Sect. 2.2) with cover cropping (CTCC), reduced tillage with winter fallowing (CTNC), standard tillage with cover crops (STCC), and standard tillage with winter fallowing (STNC) (Mitchell et al., 2015).
2.2 Management History
2.2.1 Tillage Practices
The standard tillage (ST) system represented conventional San Joaquin Valley operations, involving intensive soil disturbance through residue shredding, multiple disk passes to incorporate residues to 200 mm depth, subsoiling to 300–460 mm before tomato and cotton crops, additional disking to break up compacted layers, bed listing, and surface residue incorporation using a cultimulcher that created a fine, powdery seedbed (Mitchell et al., 2015; Veenstra et al., 2007). These operations completely broke down and re-established planting beds following each harvest, representing typical regional tillage intensity. In contrast, the no-tillage (NT) system emphasized soil disturbance reduction and permanent bed management (Mitchell et al., 2015). Controlled traffic farming restricted tractor movement to designated furrows, while planting beds remained undisturbed throughout the study period. The NT system evolved significantly: from 1999–2011, shallow cultivation was permitted for tomato crops with cotton management limited to root pulling or shallow root severing to 100 mm depth. By 2012, the system achieved true zero-tillage status with soil disturbance restricted exclusively to seeding and transplanting operations, reducing tillage passes by 40 % or more compared to standard practices (Mitchell et al., 2017).
2.2.2 Cover Crop Species and Management
Cover crop implementation followed a systematic approach to enhance soil health through increased plant diversity and year-round soil coverage (Mitchell et al., 2015). The initial cover crop mixture (1999–2009) consisted of Juan triticale (30 %), Merced cereal rye (30 %), and common vetch (40 %) by seed weight, seeded at 9 g m−2 using no-tillage disc openers. From 2010–2014, species diversity was enhanced to include pea (40 %), fava bean (40 %), radish (10 %), and Phacelia (10 %), reflecting evolving understanding of multi-species cover crop benefits (Mitchell et al., 2015). Cover crops were typically seeded in late October to mid-November at 25 mm depth with 190 mm row spacing, preceding winter rainfall patterns. Legume species received Rhizobium leguminosarum biovar viciae inoculation to enhance nitrogen fixation. The approximately 120 d growth period concluded with mid-March termination using contrasting methods: standard tillage plots received stalk chopping followed by disk incorporation, while no-tillage plots were terminated with 2 % glyphosate solution after chopping, leaving residues on the surface as protective mulch. This differential termination created distinct surface residue environments, with NT cover crop plots achieving > 90 % residue cover compared to < 20 % in ST systems.
2.2.3 Crop Rotation and Species
The experimental design incorporated three distinct cropping phases to evaluate conservation practices across diverse crop types (Mitchell et al., 2017). Phase 1 (1999–2014) featured a cotton-tomato rotation with the field divided into two halves to ensure both crops were grown annually on separate sections (Veenstra et al., 2007). Processing tomatoes (variety “8892”) were transplanted in early April at approximately 2.15 plants m−2 (1 ft [30 cm] in-row spacing on 60 in. [152 cm] beds) using modified commercial transplanters equipped with coulters for residue management. Cotton production utilized RoundUp Ready transgenic upland cotton “Riata” (2000–2007) and experimental Pima variety “Phy-8212 RF” (2008–2009), established with John Deere no-till planters at approximately 148 000 plants ha−1 (Mitchell et al., 2017). Phase 2 (2015–2018) transitioned to garbanzo-sorghum rotation to achieve greater crop diversity consistent with conservation agriculture principles (Gomes et al., 2023). This rotation change allowed evaluation of conservation practices under different rooting systems and residue characteristics. Phase 3 (2019) returned to tomato production, providing comparative data across the study timeline (Araya et al., 2022). This rotation diversity ensured that management impacts could be assessed across crops with varying growth habits, nutrient requirements, and soil interaction patterns.
2.2.4 Irrigation Methods and Equipment
Irrigation management evolved significantly, reflecting regional trends toward water use efficiency (Mitchell et al., 2017). From 2000–2012, furrow irrigation supplied water to tomato and cotton crops using evapotranspiration-based scheduling (ET), where crop coefficients were adjusted for growth stage and canopy development. Applied water averaged 71 cm ha−1 for tomatoes and 61 cm ha−1 for cotton, with scheduling based on reference evapotranspiration data from an on-site California Irrigation Management Information System (CIMIS) weather station (Mitchell et al., 2017). In 2013, the entire experimental site converted to subsurface drip irrigation, requiring a one-time tillage operation across all treatments for installation (Araya et al., 2022). The system utilized 1.34 in. diameter drip tape buried 12 in. deep in the center of each 5 ft-wide planting bed. This transition aligned with regional adoption trends and reduced surface water application. Cover crop irrigation remained minimal throughout the study, totaling only 10 in. over 20 years (4 in. in 1999, 2 in. each in 2012, 2017, and 2018), with cover crops primarily dependent on the 3.23 m of natural precipitation received during the study period (Araya et al., 2022).
2.2.5 Additional Relevant Management Information
Fertilizer management maintained consistency across treatments to isolate tillage and cover crop effects (Mitchell et al., 2017). Tomato crops received pre-plant applications of 11-52-0 fertilizer at 89.2 kg ha−1 applied via shanks 15 cm below transplants, followed by side-dressed urea (111.5 kg ha−1) four weeks post-transplanting, providing total nitrogen inputs of 51.3 kg N ha−1 (Veenstra et al., 2007). Cotton received pre-plant 11-52-0 fertilizer at 224 kg ha−1 applied at 20 cm depth, with application methods varying by tillage system (mixed through beds in ST, shanked in NT) (Mitchell et al., 2017). Pesticide applications remained similar across treatments. Surface residue management created dramatically different soil surface environments, with residue cover measurements showing stark contrasts: STNC plots maintained < 5 % cover, STCC achieved 10 %–20 %, CTNC reached 40 %–70 %, and CTCC exceeded 90 % surface residue cover (Mitchell et al., 2017). These differences resulted from the interaction between tillage intensity and cover crop residue inputs, creating distinct microclimates for soil biological activity, water infiltration, and thermal regulation (Baker et al., 2005). The 20-year duration of consistent management makes this site particularly valuable for assessing long-term conservation agriculture impacts on soil physical, chemical, and hydrological properties in Mediterranean climate conditions (Araya et al., 2022).
2.3 Sampling Strategy and Protocols
Soil collection occurred in October 2019, with sampling strategies designed based on previous findings by Araya et al. (2022), which showed significant management effects on soil hydro-physical properties (porosity, pore size distribution, field capacity) in the 0–5 cm layer but not at 20–25 cm depth. Consequently, sampling focused on 0–5 and 5–10 cm depths.
Seven undisturbed cores were collected from each of the two treatments (CTCC and STNC) at both depths using standardized METER HYPROP cylinders (250 cm3). Treatment selection emphasized the extreme management contrasts, as prior HYPROP measurements (Araya et al., 2022) showed no significant differences in intermediate treatments (tillage-only or cover crop-only modifications). Core locations were randomly selected on the bed tops within each plot, offset from the bed centerline to avoid the buried subsurface drip irrigation line and crop row.
Complementary bulk samples (0–10 cm) were collected from randomly selected bed-top locations across all four treatments, also offset from the bed centerline, for aggregate stability and density fractionation analyses. A spade shovel was used to dig to approximately 10 cm deep. Then a representative sample of soil was transferred to a rigid plastic container. Upon arrival to the lab, sample containers were left open for 2 weeks to air dry and stored at room temperature.
2.4 Aggregate Stability Analysis
Wet aggregate stability was determined using a wet sieving apparatus (Eijkelkamp North America Inc.) on air-dried bulk soil samples (Nimmo and Perkins, 2002). Samples were separated through a stack of sieves (8, 4, and 2 mm), yielding four size fractions: > 8, 4–8, 2–4, and < 2 mm. Analysis focused exclusively on macro-aggregates (4–8 and 2–4 mm) because these size classes are most responsive to management-induced changes in soil structure through root and fungal hyphal binding, whereas micro-aggregate formation depends primarily on inherent soil properties (Tisdall and Oades, 1982). Additionally, micro-aggregates comprised 40 %–70 % more material by volume but were concentrated at depths where treatment effects were minimal, making macro-aggregates more sensitive indicators of surface management impacts. Preliminary testing confirmed that air-dried samples provided optimal discrimination between treatments, as pre-saturated aggregates remained nearly 100 % stable after wet-sieving regardless of treatment.
Two 4 g subsamples were collected from each size fraction, with one subsample used for analysis and the other for moisture content determination. Aggregates from the 4–8 mm fraction were placed in 2 mm mesh sieve cups, while the 2–4 mm fraction was placed in 1 mm mesh sieve cups. Samples underwent wet-sieving in tap water for 3 min, with the stable fraction manually dispersed through the sieve into a separate collection container. All fractions were oven-dried at 100 °C for 48 h before final mass determination.
Wet aggregate stability (WAS) was calculated as the percentage of stable aggregates relative to total aggregate mass, corrected for moisture content and rock fragments:
where mstable is the oven-dry mass of the stable fraction and munstable is the oven-dry mass of the unstable fraction.
2.5 Soil Physical Properties
Physical property characterization was conducted on intact soil cores through sequential analysis measuring hydraulic conductivity, water retention, and porosity.
-
Experimental Timeline and Setup: Cores underwent sequential analysis over approximately 14 d: (1) initial saturation (24 h), (2) saturated hydraulic conductivity measurement, (3) continuous drying with water retention measurement (≈12 d), and (4) final moisture determination (24 h). Cores were processed in batches of six containing samples from both treatments and depths to minimize batch effect. Additional methodological details are provided in Alvarez‐Sagrero et al. (2026a).
-
Saturated Hydraulic Conductivity: Saturated hydraulic conductivity (Ksat) was measured using a METER KSAT automated measurement system. Intact soil cores were prepared by carefully trimming ends to ensure flat surfaces perpendicular to core walls. Cores were gradually saturated from bottom up over 24 h using 0.01 M CaCl2 solution to minimize clay dispersion and maintain soil structure.
Measurements employed the falling head method, with the METER KSAT instrument automatically recording water level changes using a pressure transducer and temperature sensors. Measurement concluded when three consecutive Ksat values were within 5 % of each other, indicating stable flow conditions. Ksat values were calculated using Darcy's law:
where L is sample length (cm), t is time (s), and h1 and h2 are hydraulic heads (cm) at the start and end of the measurement period, respectively.
-
Soil Water Retention and Total Porosity: Water retention characteristics were measured using the HYPROP system (METER Group, Inc.) employing the extended evaporation method. Cores were instrumented with precision tensiometers at 1.25 and 3.75 cm depths, recording soil water potential and mass loss at 10 min intervals during drying from saturation (ψ=0 kPa) to approximately −80 kPa.
To extend the measurement range, subsamples (5 g) from each core were analyzed with a WP4C dewpoint potentiameter (METER Group, Inc.) at lower water contents. Complete datasets were fitted with a bimodal van Genuchten-PID model (Peters et al., 2021):
where Φ represents total porosity, θr the maximum adsorbed or residual water content, and ψ0=105.8 kPa water potential at oven dryness. The saturation function Γ(ψ) uses a bimodal version representing textural and structural pore spaces:
with each pore-size class following van Genuchten (Van Genuchten, 1980):
Total porosity (Φ) was determined directly from model fitting, representing maximum volumetric water content at saturation. Field capacity was derived as volumetric water content at −33 kPa soil water potential.
-
Bulk Density: Following hydraulic measurements, soil cores were oven-dried at 105 °C for 24 h to determine final oven-dry mass. Bulk density (ρb, g cm−3) was calculated as , where mdry is oven-dry mass (g) and Vcore is core volume (cm−3).
2.6 Carbon and Nitrogen Analysis
Following physical measurements, soil cores were oven-dried at 105 °C (24 h), gently disaggregated, and passed through a 2 mm sieve. A 5 g subsample from each core was finely ground with an agate mortar and pestle to pass a 150 µm mesh for elemental analysis. Acid reaction testing confirmed negligible inorganic carbonate content, indicating total carbon measurements effectively represented total organic carbon.
Total carbon (TC) and total nitrogen (TN) were determined using dry combustion in an Elemental Analyzer coupled with a Delta V Plus Continuous Flow Isotope Ratio Mass Spectrometer (Costech 4010). Samples (15 ± 0.1 mg) were weighed into tin capsules using a microbalance (Mettler Toledo XP6, precision ± 0.001 mg). Calibration employed certified reference materials USGS 40 and 41a with mean TC values of 40.30 ± 2.10 % (n=7) and 41.59 ± 1.13 % (n=4), and mean TN values of 9.40 ± 0.52 % (n=7) and 9.71 ± 0.26 % (n=4), respectively. Quality control standards were analyzed every 10 samples.
TC and TN stocks were quantified using analytical measurements, soil physical properties, and sample dimensions:
where Si represents elemental stock (kg m−2) for element i (TC or TN), Ci is measured elemental concentration (kg kg−1), ρb denotes soil bulk density (kg m−3), d is sampling interval thickness (m), and fc represents volumetric coarse fraction (>2 mm). The coarse fraction was consistently minimal (<5 %) across all analyzed samples.
2.7 Organic Matter Composition Analysis
Fourier-transform infrared spectroscopy (FTIR) analysis was conducted on surface soil samples (0–5 cm depth) to characterize functional group composition of soil organic matter and assess management-induced changes in organic matter quality.
FTIR spectra were collected using a FTIR spectrometer (Bruker Vertex 70) equipped with a Praying Mantis DRIFTS accessory. Pure potassium bromide (KBr) served as background reference material. Spectra were recorded in absorbance mode from 4000 to 400 cm−1 at 4 cm−1 resolution, with each spectrum representing an average of 300 scans and atmospheric compensation enabled to minimize interference from water vapor and CO2. Data collection occurred at room temperature under ambient conditions.
Spectral processing was performed using OPUS software (Bruker Cor.). This included baseline correction and smoothing to minimize noise while preserving spectral features. Peak assignments for soil organic matter functional groups were based on established literature values (Mainka et al., 2022; Margenot et al., 2023). Key functional groups identified included: aliphatic C-H stretching of methyl groups (2976–2898 cm−1) and methylene groups (2870–2839 cm−1) associated with simple plant materials; aromatic C=C stretching representing complex plant compounds such as lignin (1550–1500 cm−1); and C=O stretching of carbonyl groups in the 1660–1580 cm−1 region, which also includes contributions from amide I bands and aromatic C=C vibrations and is therefore interpreted here as processed (microbially-associated) organic matter rather than as an unambiguous marker of microbial-derived material (Margenot et al., 2023). These spectral regions exhibit minimal interference from the mineral component, allowing interpretation of organic matter composition.
2.8 Density Fractionation and Carbon Protection Mechanisms
Density fractionation was performed on air-dried bulk soil samples (0-10 cm depth) to separate soil organic matter into three functionally distinct fractions: free light fraction (FLF), occluded light fraction (OLF), and heavy fraction (HV) closely following Golchin et al. (1994), Swanston et al. (2005), and Berhe et al. (2012). Samples were passed through an 8 mm sieve and homogenized by hand mixing. Approximately 25 g of soil was weighed for fractionation, with a separate 10 g subsample collected for moisture correction (dried at 105 °C for 48 h).
For FLF separation, soil samples were placed in Nalgene conical tubes with 90 mL of sodium polytungstate solution (SPT, density = 1.85 g cm−3). Tubes were inverted by hand 10 times and shaken at 150 rpm for 1 h, followed by centrifugation at 3470 rpm for 1 h. The floating FLF was collected by aspiration, filtered through 0.8 µm polycarbonate filter paper, and rinsed five times with 100 mL Milli-Q water before drying at 50 °C for 48 h.
The remaining soil was mixed at 170 rpm for 1 min using a stand mixer, then sonicated in an ice bath to achieve approximately 22 400 J of energy input. After centrifugation at 3470 rpm for 1 h, the OLF was aspirated and purified through 4 repeated washing cycles with 150 mL Milli-Q water, including vortexing (1 min), centrifugation (30–60 min at 3470 rpm), and decanting through 0.8 µm polycarbonate filter paper. The OLF palet formed at the bottom of the conical tube was collected and oven dried at 50 °C for 48 h. The final fraction, HV, underwent identical washing procedures before collection and drying at 105 °C for 48 h.
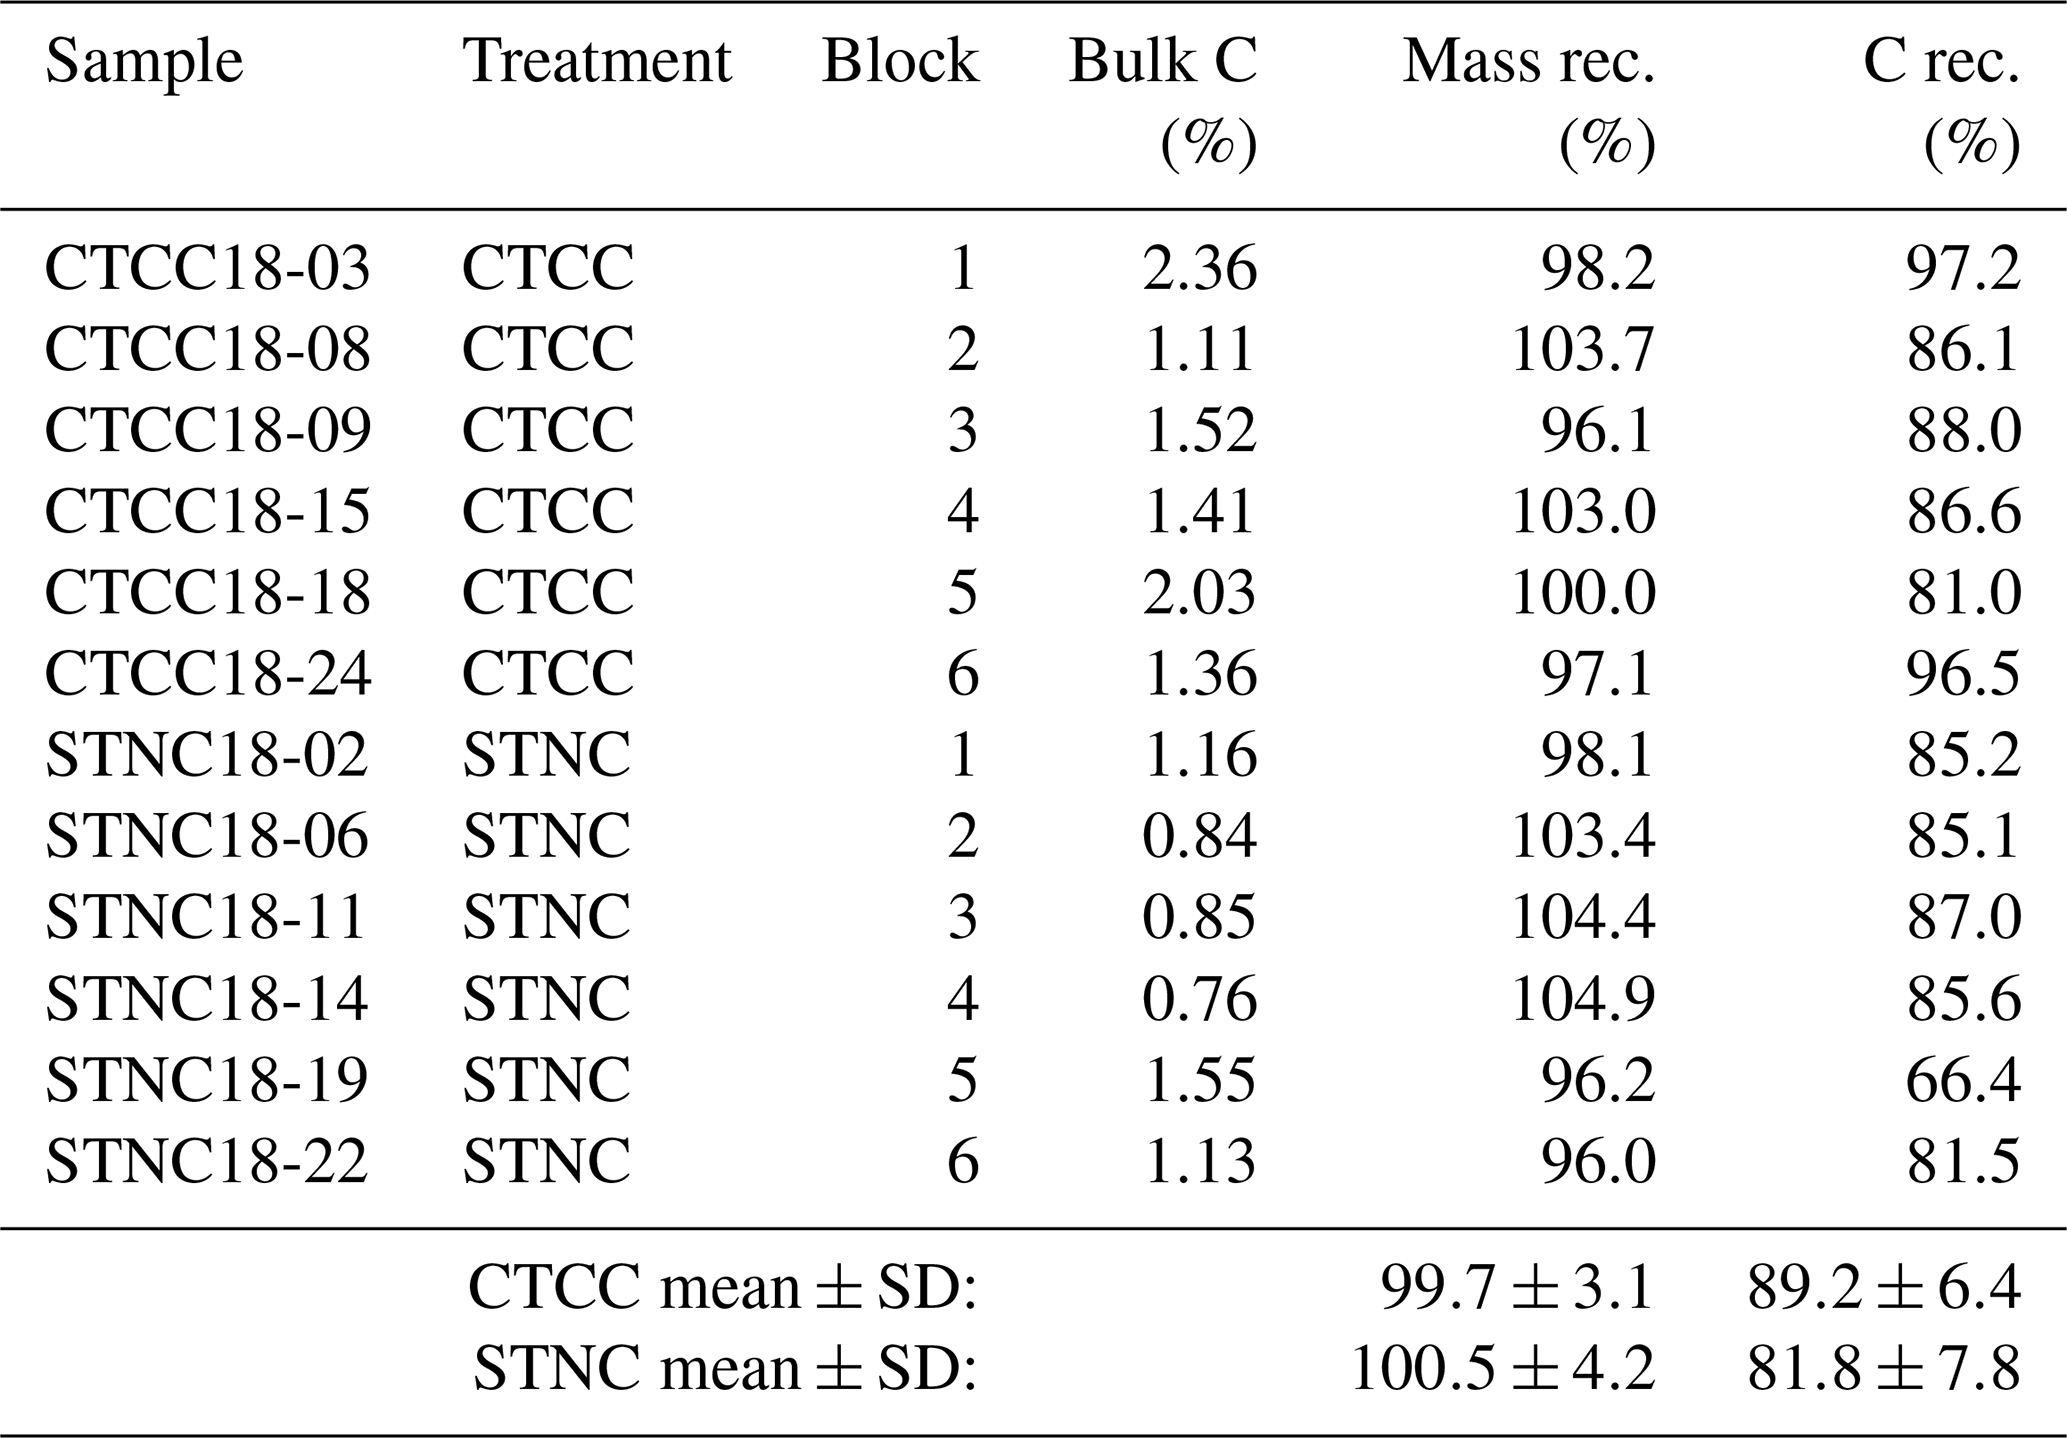
All fractions were weighed and manually ground for subsequent carbon and nitrogen analysis using the same protocols described for soil cores. Mass recovery and apparent carbon recovery were calculated as the sum of fraction masses (and fraction-weighted carbon) relative to the bulk values. Mass recoveries were consistently within ±4 % (CTCC: 99.7±3.1 %; STNC: 100.5±4.2 %). Apparent carbon recoveries were 89.2±6.4 % (CTCC) and 81.8±7.8 % (STNC); the lowest recovery within STNC (66.4 %, sample STNC18-19, Block 5) coincided with the highest bulk carbon concentration in that treatment, consistent with elevated dissolved organic carbon losses during SPT washing in carbon-rich samples. Sample-level recoveries are reported in Table A1.
2.9 Mineral-Associated Organic Carbon Saturation
Mineral-associated organic carbon (MAOC) saturation was assessed using the heavy fraction obtained from density fractionation. The analysis employed the clay-silt model and maximum organic carbon estimates established by Georgiou et al. (2022), which proposes theoretical carbon saturation values of 86 ± 9 mg C g−1 mineral for high-activity minerals and 48 ± 6 mg C g−1 mineral for low-activity minerals.
Soil classification previously conducted at the site identified the soil series as Panoche clay loam (Typic Haplocambids, Aridisol order). Based on USDA soil survey data for this series (, ), the surface horizon (0–18 cm) contains 28 % clay with a cation exchange capacity of 22.2 cmol(+) kg−1, confirming classification as high-activity minerals under the Georgiou et al. (2022) framework (CEC >15 cmol(+) kg−1). Site-specific textural analysis determined clay content ranging from 23 %–32 % and similar proportions for silt (23 %–32 %) (Baker et al., 2005), consistent with the soil survey range of 25 %–28 % clay for this series.
MAOC saturation percentage was calculated as:
where Cmax represents theoretical maximum carbon storage capacity (mg C g−1 soil) calculated as the product of mineral (clay+silt) content and the appropriate mineral-specific maximum carbon storage value, and Cmeasured is measured carbon concentration in the MAOC fraction (mg C g−1 soil).
2.10 Data Validation and Quality Control
Assessment of data integrity followed a systematic three-phase protocol. Initially, all measurements underwent screening for instrument-specific artifacts according to established validation parameters for each analytical device. Subsequently, mass recovery criteria retained only data exhibiting recovery rates within ±10 % of initial mass values, particularly relevant for density fractionation and aggregate stability determinations.
In the final phase, anomaly detection utilized an adjusted boxplot methodology calibrated for log-normal distribution characteristics of measured variables. Data points falling beyond 1.5× interquartile range (IQR) thresholds were flagged for individual evaluation, with elimination from the final dataset only when definitive instrumental malfunctions or procedural inconsistencies could be identified (Yang et al., 2019).
Sample sizes vary by analysis. Aggregate stability (Fig. 1) used bulk samples from all eight replicate blocks (n = 8 per treatment per size class). Soil-core analyses (Figs. 2–6) yielded n=7 paired blocks after one replicate was excluded for sampling or processing issues. Density fractionation analyses (Figs. 7–9) were performed on bulk samples from six of the eight blocks (n=6 paired blocks; blocks 7 and 8 were not sampled for this analysis); all six samples passed the ±10 % mass-recovery criterion described above.
2.11 Statistical Analysis
The CASI experiment is a randomized complete block design with eight blocks arranged along a clay-content gradient. Prior to analysis, all datasets were tested for normality of paired differences using the Shapiro–Wilk test (α=0.05). For two-treatment comparisons (CTCC vs. STNC), paired tests honoring block pairing were used: paired t-tests where the Shapiro–Wilk test on the paired differences indicated normality, and paired Wilcoxon signed-rank tests otherwise. For the four-treatment aggregate-stability comparison (Fig. 1), a randomized-block ANOVA was followed by Games–Howell post-hoc tests, which accommodate unequal variances among treatment groups. Boxplots with individual data points (jitter overlay) are used throughout because, at our sample sizes (n=6–7), they convey distributional information that bar plots obscure; statistical inference is based on the paired tests described above, with the specific test reported in each figure caption. The mineral-associated organic carbon saturation analysis additionally propagates the ±9 mg C g−1 mineral uncertainty from the Georgiou et al. (2022) framework through the per-sample saturation calculation using the delta method, with treatment means and 95 % confidence intervals reported. Statistical significance is denoted at p<0.05 (*), p<0.01 (), and p<0.001 (). All analyses were performed in R version 4.5.2 (R Core Team, 2025); analysis code and complete dataset are available in the public repository listed in the Data Availability statement.
Extended application of conservation agriculture methods resulted in substantial alterations to soil physical characteristics, carbon and nitrogen content, and carbon protection mechanisms. These changes were most pronounced in the uppermost soil layer (0–5 cm), with notable trends extending to deeper depths (5–10 cm).
3.1 Aggregate Stability Response to Conservation Management
Aggregate stability (Fig. 1) is reported for all four treatments because it provides the empirical motivation for focusing the remaining analyses on the management endmembers (CTCC and STNC). The intermediate treatments (CTNC and STCC) show limited differentiation from STNC, consistent with prior hydro-physical measurements at this site (Araya et al., 2022), justifying the endmember focus adopted throughout Sect. 3.2–3.6.
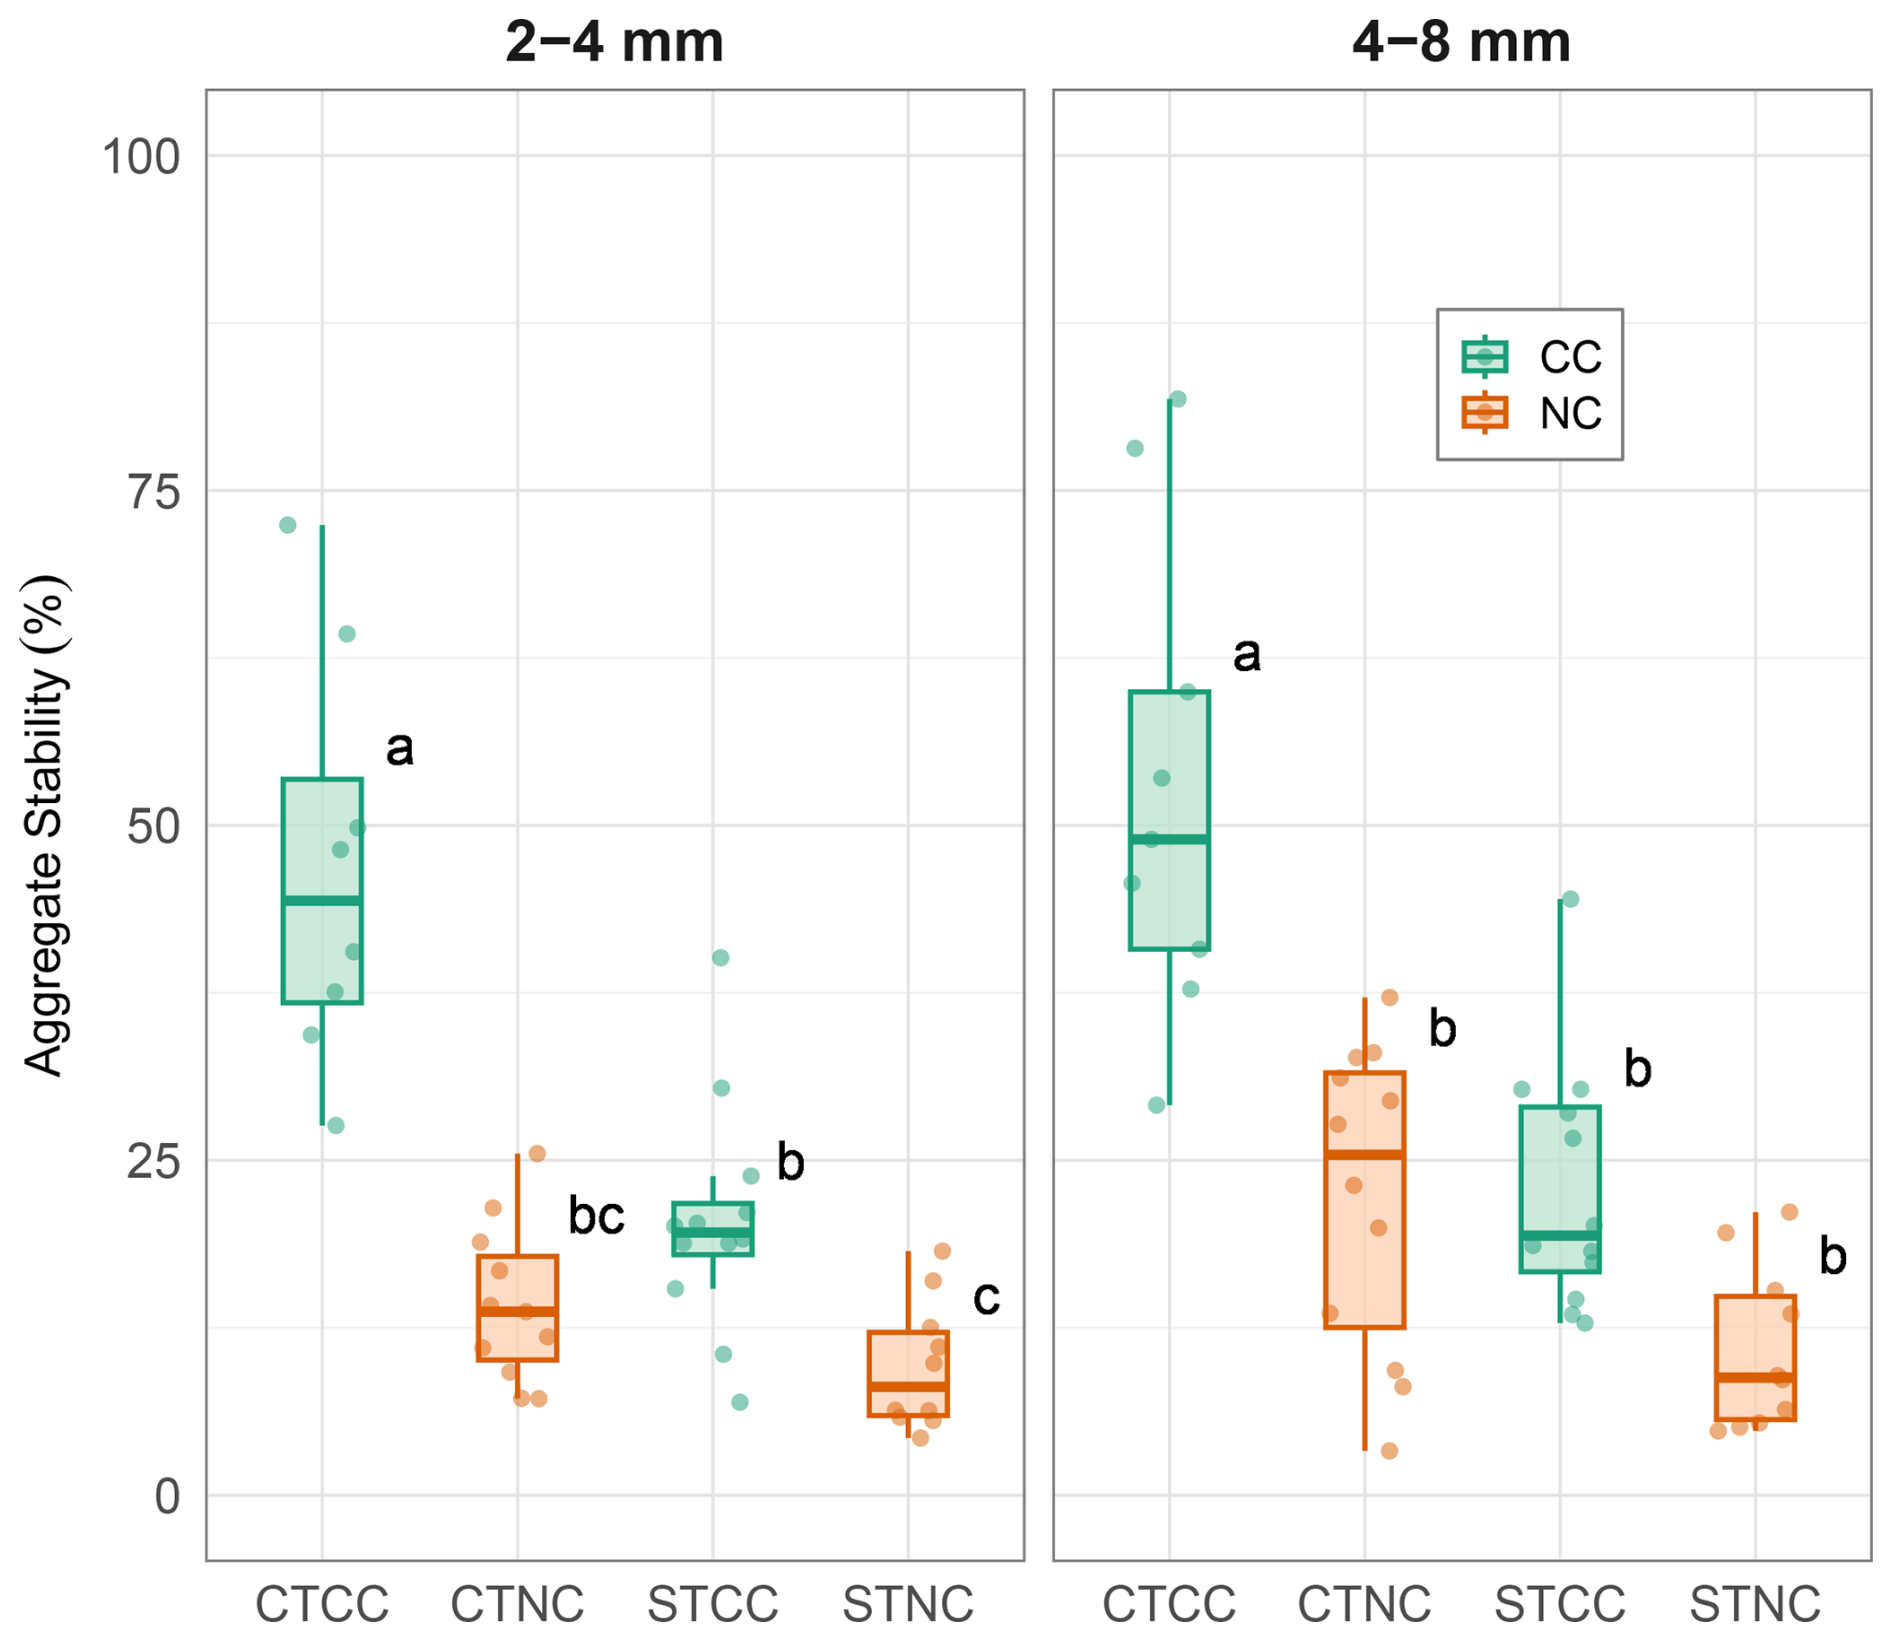
Figure 1Water-stable aggregates under combinations of conservation tillage (CT) or standard tillage (ST) and fallowing (NC) or cover cropping (CC) at 0–10 cm depth for two macro-aggregate size classes (2–4 and 4–8 mm), n=8 per treatment per size class. CTCC is significantly more stable than all other treatments in both size classes. Boxes span the interquartile range with the median marked; whiskers extend to the most extreme observations; individual data points are overlaid. Statistical significance between treatments within size classes is indicated by different lower-case letters (randomized-block ANOVA followed by Games–Howell post-hoc test).
Conservation management (CTCC) significantly enhanced wet aggregate stability compared to all other treatments across both analyzed size fractions (Fig. 1). In the 2–4 mm aggregate fraction, CTCC exhibited 136 % greater stability (46.9±15.2 %) than STNC (9.6±4.8 %; Games–Howell after RB-ANOVA, p<0.001). Similarly, in the 4–8 mm size fraction, CTCC maintained 52.9±17.8 % stability compared to STNC at 10.9±6.1 % (p<0.001).
Standard tillage with cover crops (STCC) showed significantly higher stability than STNC in both size fractions (2–4 mm: 113 % increase, 20.5±8.6 % vs. 9.6±4.8 %, p=0.008; 4–8 mm: p=0.009). Reduced tillage without cover crops (CTNC) showed intermediate values but did not differ significantly from STNC in the 2–4 mm class (p=0.224), with a significant difference only in the 4–8 mm class (p=0.034). STNC consistently exhibited the lowest aggregate stability values across all measured size classes.
3.2 Soil Physical Properties Under Conservation Management
Physical-property measurements on intact soil cores revealed significant differences between reduced tillage with cover crops (CTCC) and standard tillage without cover crops (STNC), concentrated in but not confined to the surface horizon.
-
Bulk Density: Bulk density under CTCC was significantly lower in the 0–5 cm layer (0.99±0.05 g cm−3) than under STNC (1.16±0.02 g cm−3; paired t, p=0.024), representing a 15 % reduction (Fig. 2). In the 5–10 cm layer, bulk density did not differ significantly between treatments (1.24±0.03 vs. 1.17±0.04 g cm−3; p=0.114).
-
Porosity: Total porosity under CTCC was significantly higher than under STNC in the 0–5 cm layer (50.6±1.1 % vs. 47.7±0.3 %; p=0.022). At 5–10 cm, porosity was significantly lower under CTCC than under STNC (46.2±1.0 % vs. 48.4±1.3 %; p=0.016), inverting the surface pattern; the depth-dependent direction reversal is discussed in Sect. 4.3.
-
Hydraulic Conductivity: Saturated hydraulic conductivity did not differ significantly between treatments at either depth (paired t-test: 0–5 cm, p=0.74; 5–10 cm, p=0.95; Fig. 3). Mean values were nominally higher under CTCC at both depths (0–5 cm: 768±197 vs. 628±306 cm d−1; 5–10 cm: 956±538 vs. 912±284 cm d−1), but the high spatial variability characteristic of saturated conductivity in heterogeneous Mediterranean soils prevents firm conclusions.
-
Field Capacity: Volumetric water content at −33 kPa was significantly greater under CTCC in the 0–5 cm layer (26.1±0.7 %) than under STNC (23.3±0.3 %; p=0.002), a 12 % enhancement (Fig. 4). At 5–10 cm, field capacity did not differ significantly between treatments (25.6±0.8 % vs. 24.8±0.6 %; p=0.46).
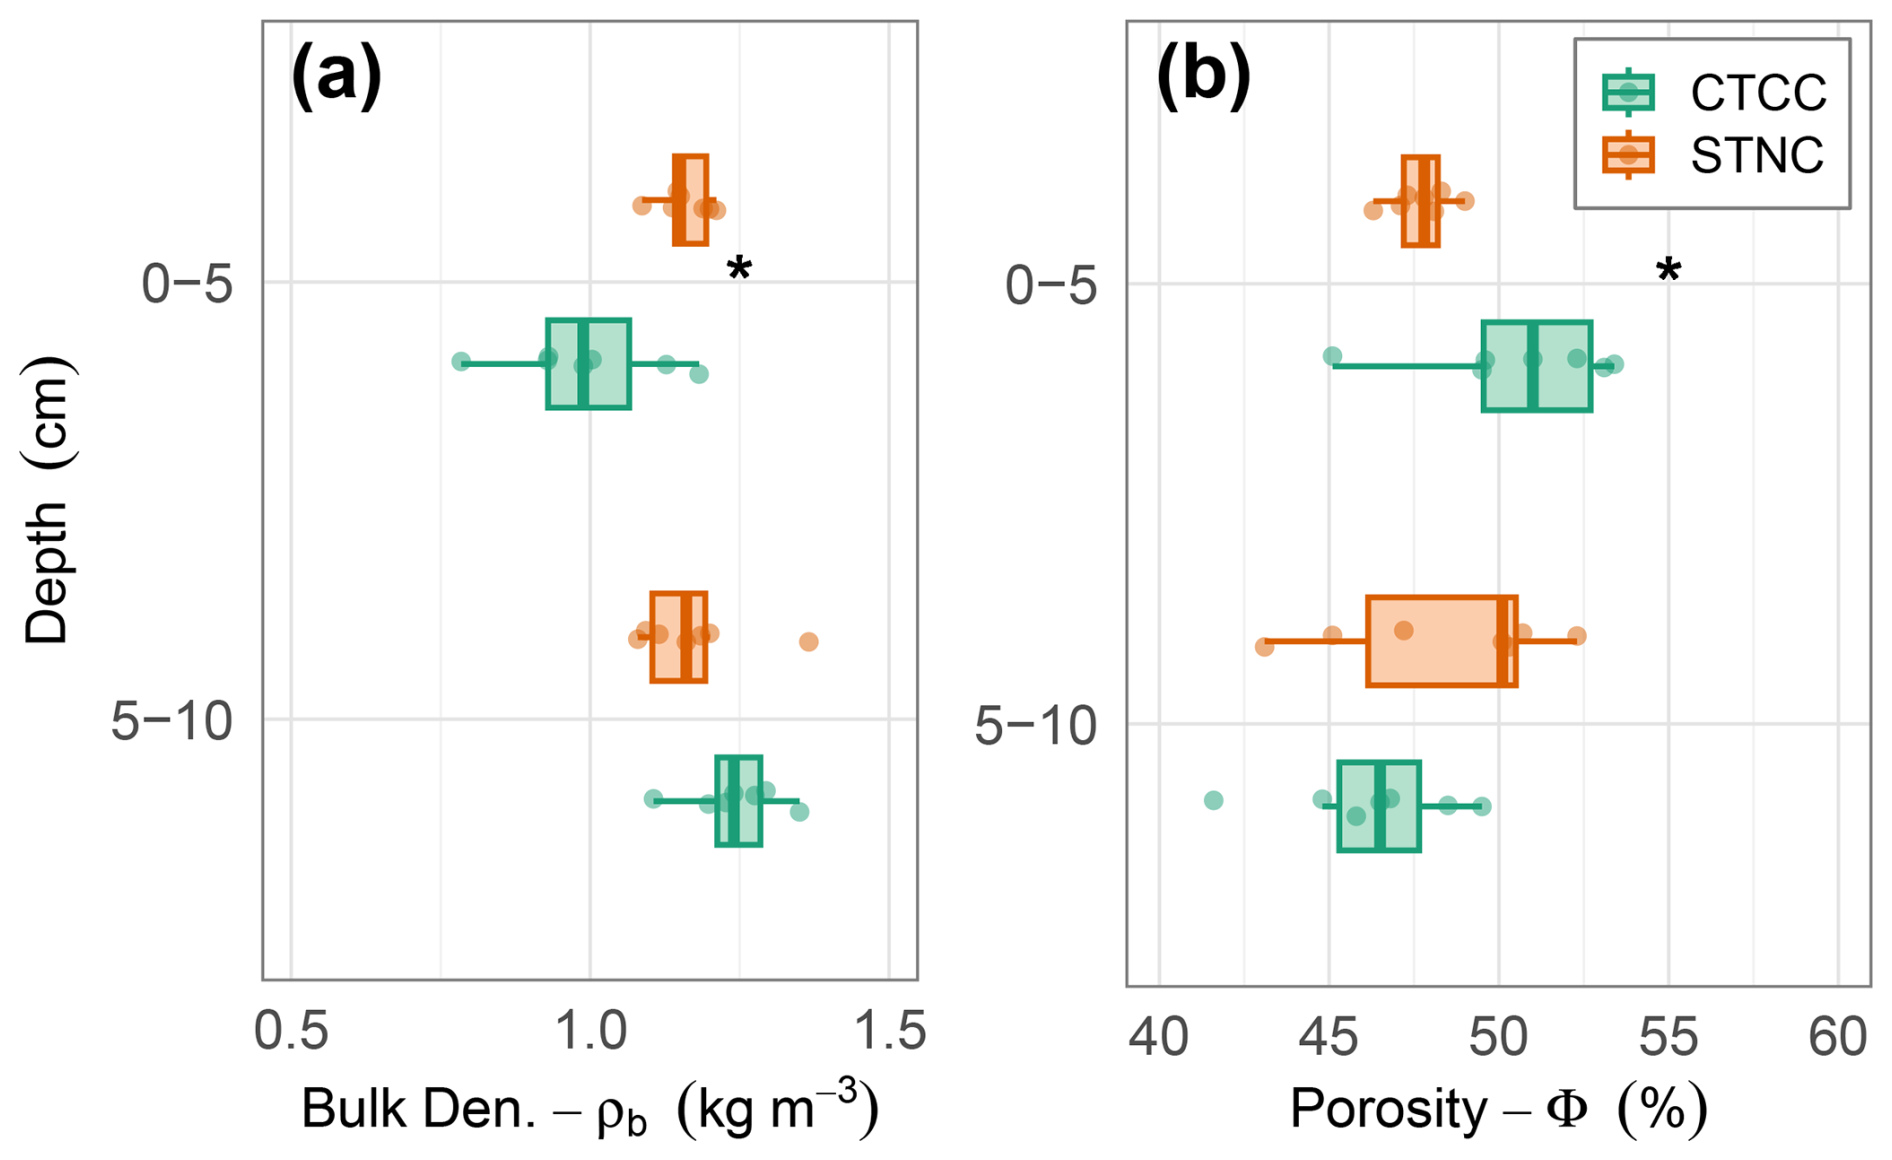
Figure 2Physical properties in soils under conservation (CTCC, green, n=7) and standard (STNC, orange, n=7) management, measured on undisturbed cores from 0–5 and 5–10 cm depths. (a) Bulk density and (b) total porosity estimated from fitted water-retention curves (Eq. 3). Bulk density was significantly lower under CTCC in the 0–5 cm layer; porosity differed significantly between treatments at both depths, with the direction reversing between layers (see Sect. 3.2). Boxes span the interquartile range with the median marked; whiskers extend to the most extreme observations; individual data points are overlaid. Statistical significance between treatments is indicated by symbols: for p<0.001, for p<0.01, * for p<0.05 (paired t-test).
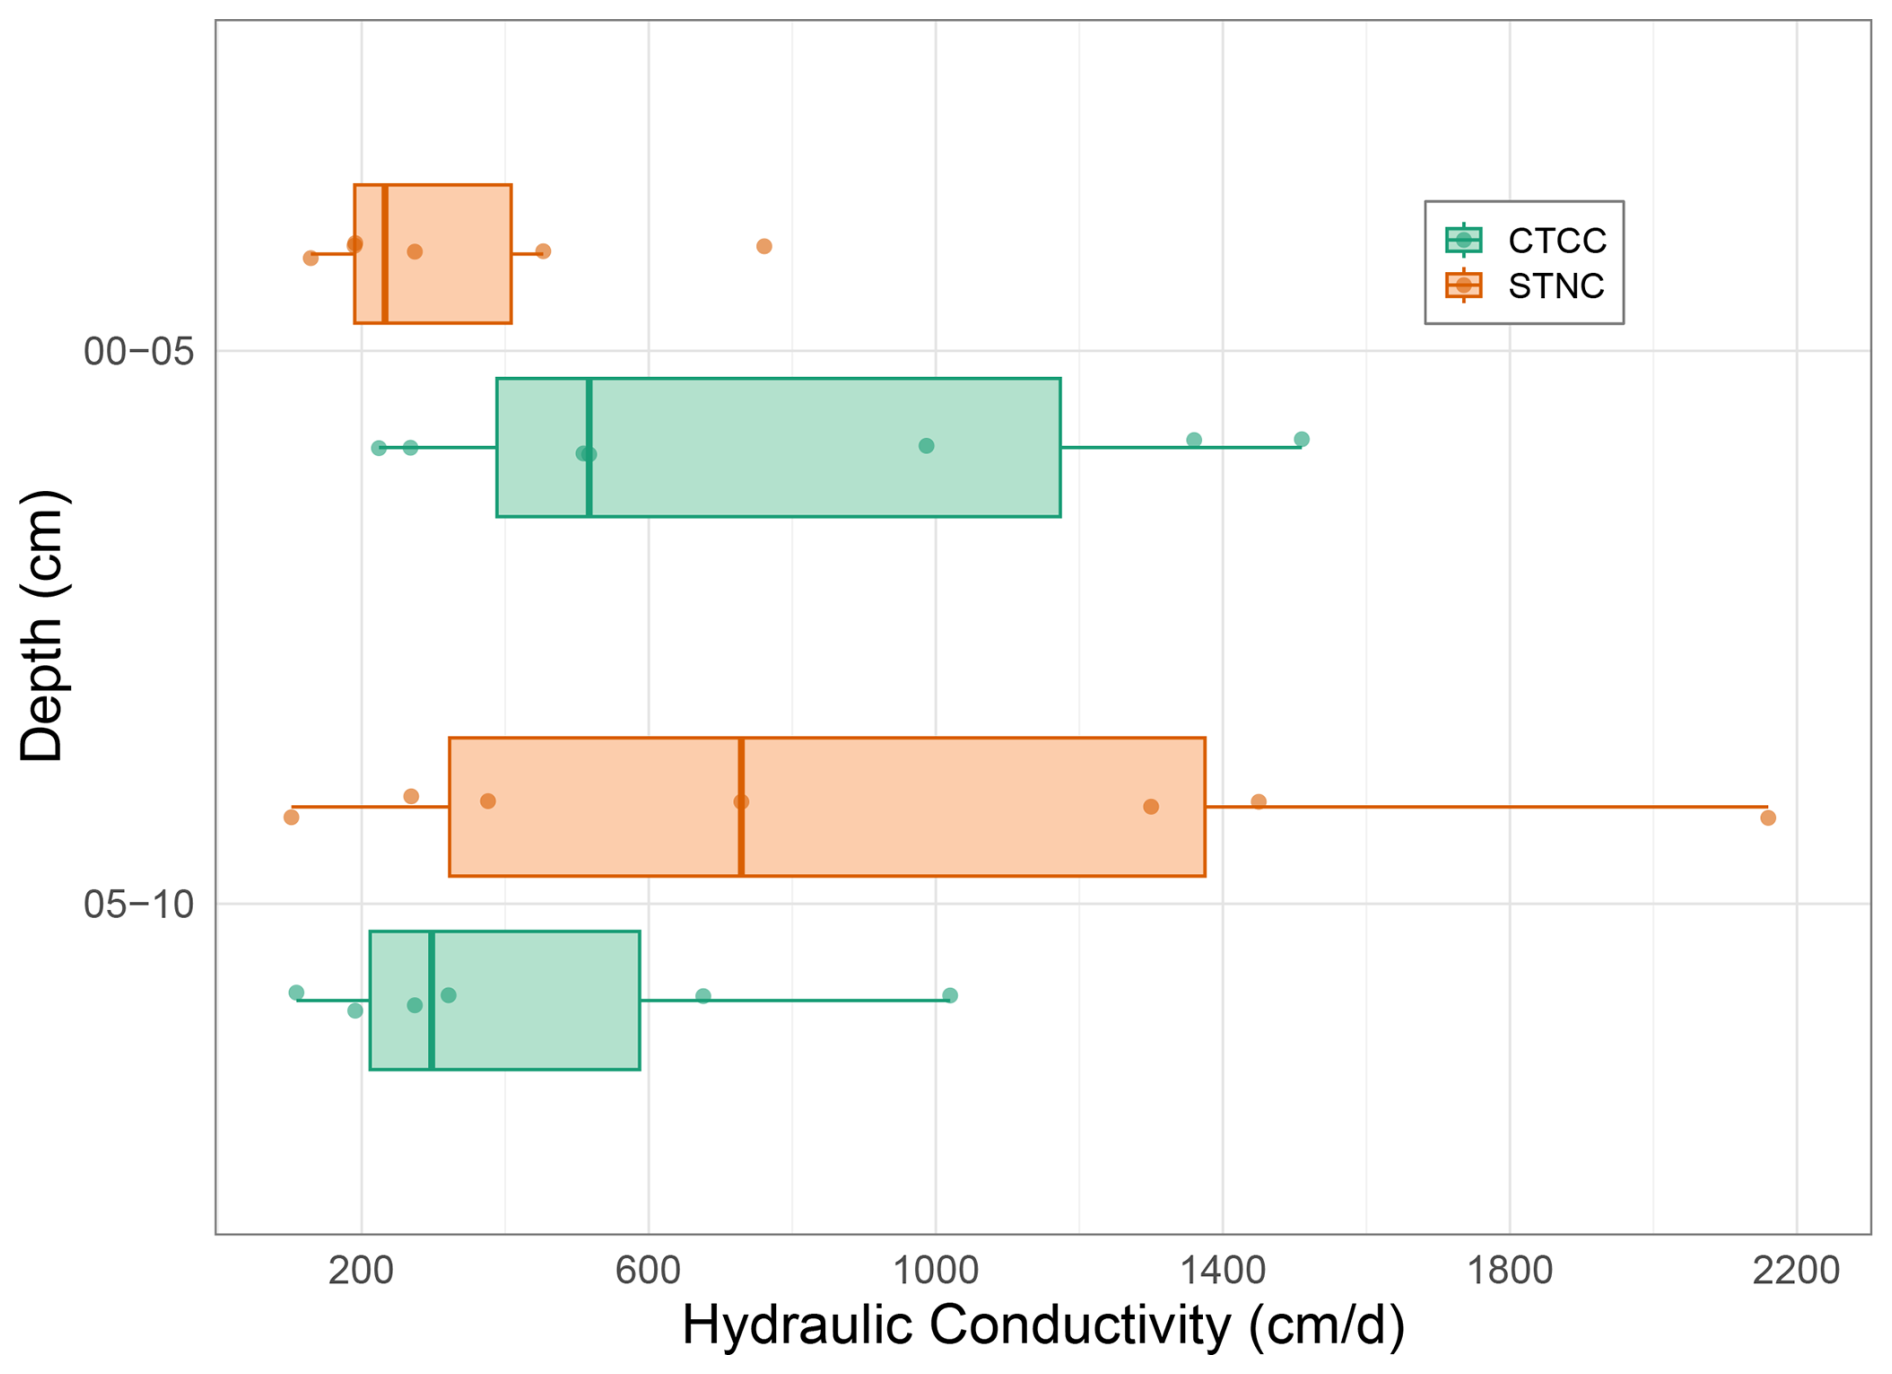
Figure 3Hydraulic conductivity under conservation (CTCC, green, n=7) and standard (STNC, orange, n=7) management at 0–5 and 5–10 cm depths. Measurements were conducted on the same undisturbed cores used for physical-property characterization. Hydraulic conductivity did not differ significantly between treatments at either depth. Boxes span the interquartile range with the median marked; whiskers extend to the most extreme observations; individual data points are overlaid. Statistical significance between treatments is indicated by symbols: for p<0.001, for p<0.01, * for p<0.05 (paired t-test).
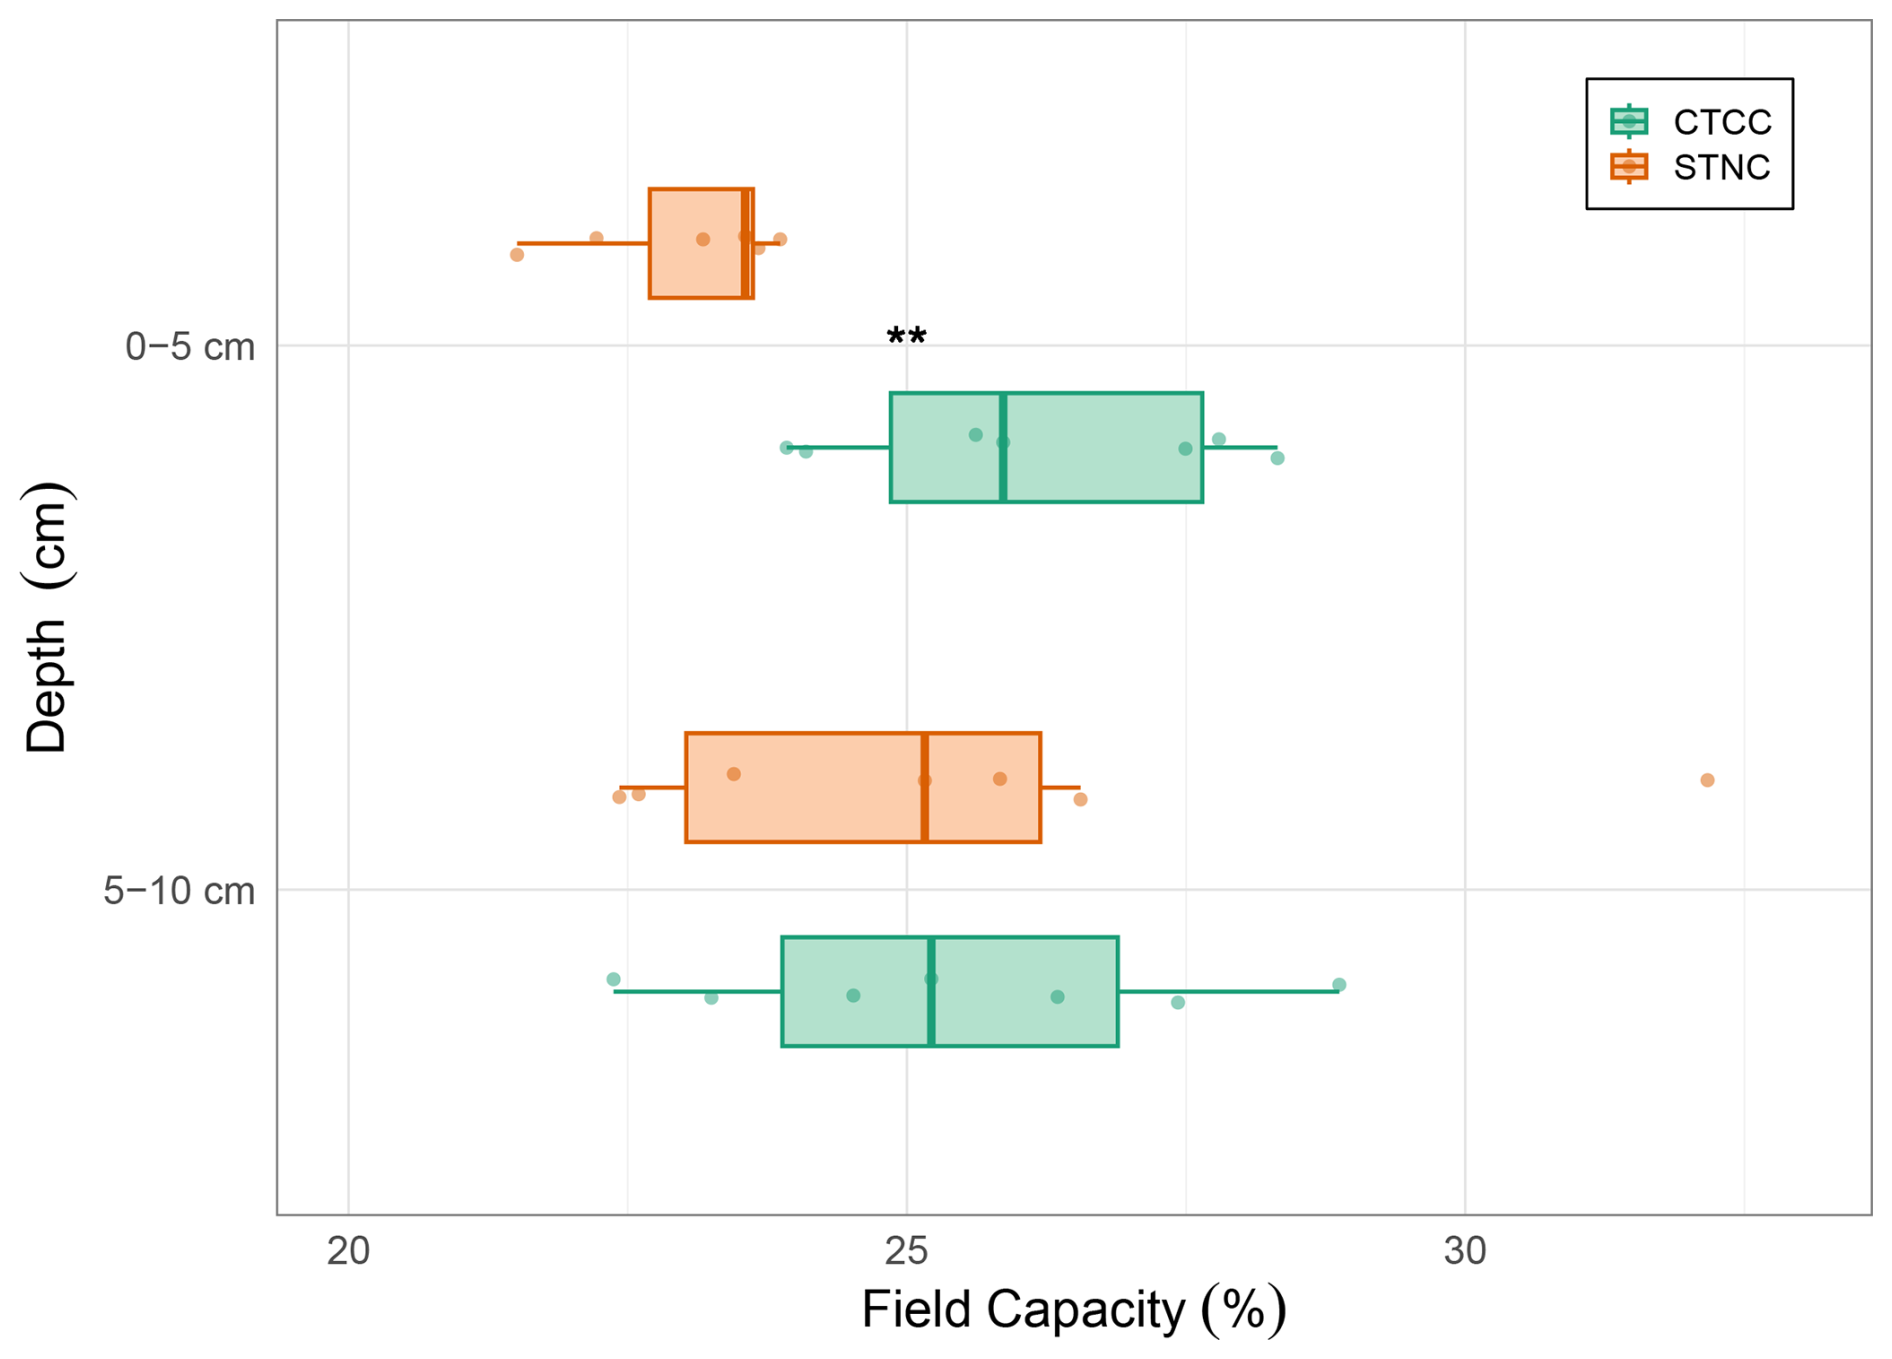
Figure 4Field capacity at −33 kPa under conservation (CTCC, green, n=7) and standard (STNC, orange, n=7) management at 0–5 and 5–10 cm depths, derived from the bimodal van Genuchten-PID fits to each core's water-retention curve. Field capacity is significantly greater under CTCC at 0–5 cm; the depths do not differ at 5–10 cm. Boxes span the interquartile range with the median marked; whiskers extend to the most extreme observations; individual data points are overlaid. Statistical significance between treatments is indicated by symbols: for p<0.001, for p<0.01, * for p<0.05 (paired t-test).
3.3 Carbon and Nitrogen Stocks and Composition
Carbon and nitrogen accumulation patterns varied substantially between management systems and soil depths, with pronounced effects concentrated in the surface horizon.
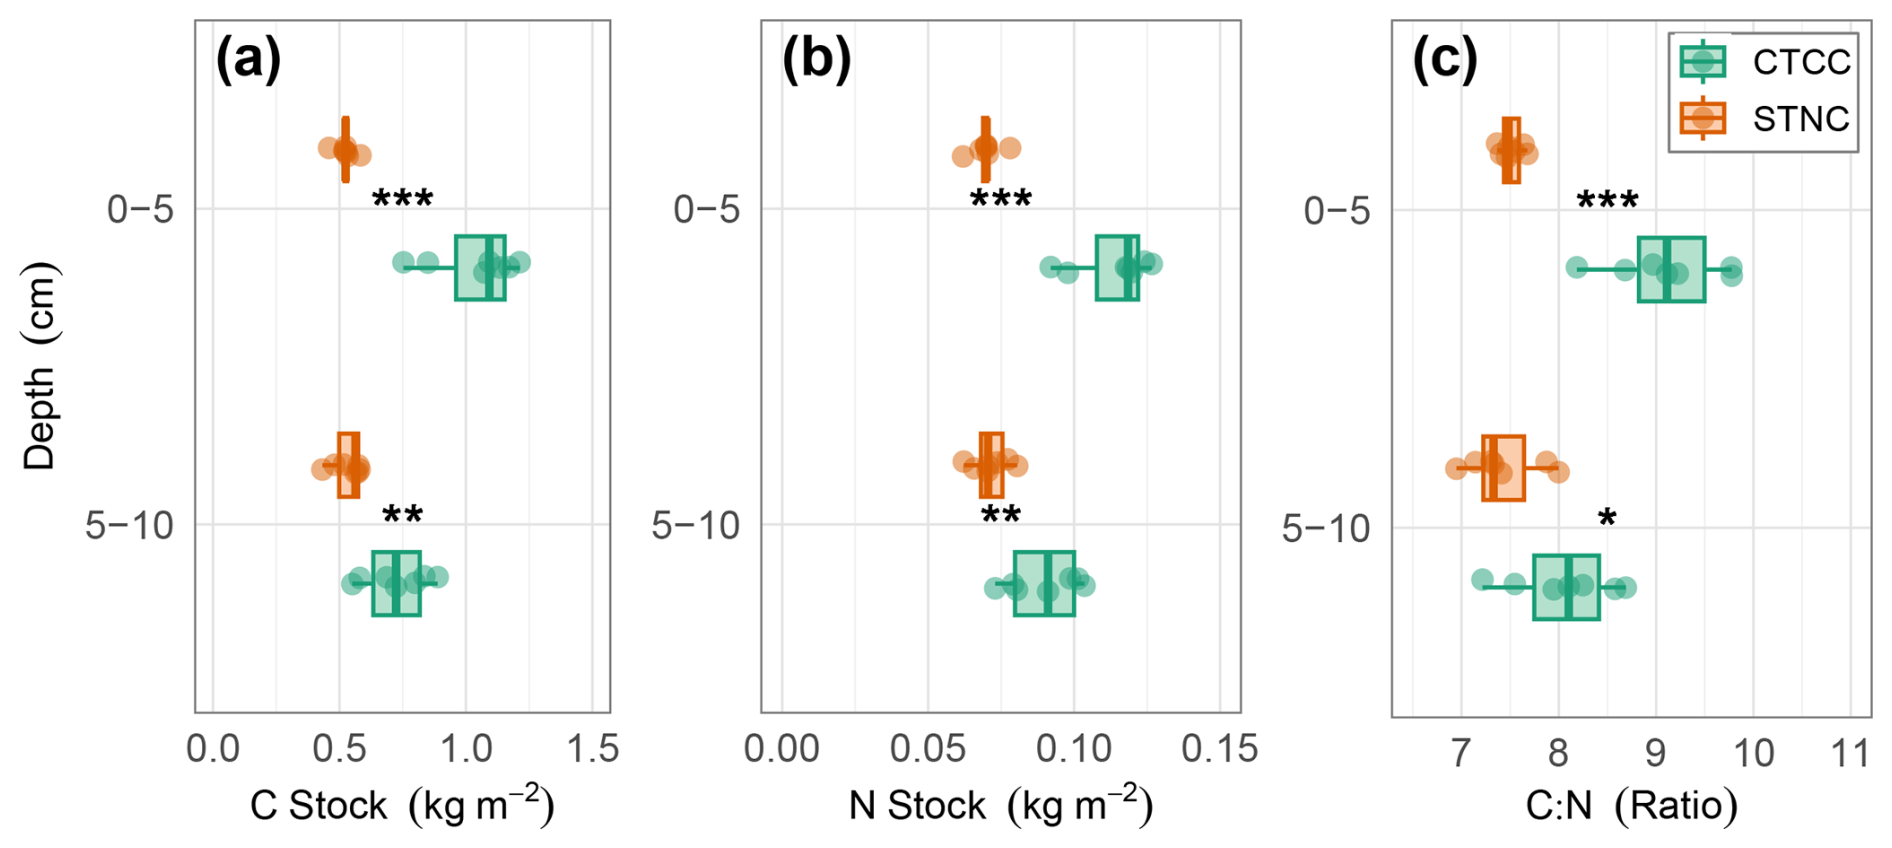
Figure 5Carbon and nitrogen stocks under conservation (CTCC, green, n=7) and standard (STNC, orange, n=7) management at 0–5 and 5–10 cm depths, computed from per-core C and N concentrations and bulk density. (a) Total carbon stocks, (b) total nitrogen stocks (both determined via elemental combustion), and (c) C:N ratios. CTCC significantly increased C and N stocks and C:N ratios at both depths, with the largest effects in the 0–5 cm horizon. Boxes span the interquartile range with the median marked; whiskers extend to the most extreme observations; individual data points are overlaid. Statistical significance between treatments is indicated by symbols: for p<0.001, for p<0.01, * for p<0.05 (paired t-test).
-
Carbon Stocks: Total carbon stocks in the 0–5 cm layer under CTCC (1.04±0.07 kg m−2) were approximately double those under STNC (0.52±0.01 kg m−2; paired t, p<0.001; Fig. 5). In the 5–10 cm layer, CTCC (0.72±0.05 kg m−2) increased carbon stocks by 36 % compared to STNC (0.53±0.02 kg m−2; p=0.002).
-
Nitrogen Stocks: Nitrogen stocks in the 0–5 cm layer were 63 % greater under CTCC (0.114±0.005 kg m−2) than under STNC (0.070±0.002 kg m−2; p<0.001; Fig. 5). The 5–10 cm layer showed a 25 % increase in nitrogen stocks under CTCC (0.090±0.005 kg m−2 vs. 0.071±0.002 kg m−2; p=0.002).
-
Carbon to Nitrogen Ratios: C:N ratios in the 0–5 cm layer were significantly higher under CTCC (9.1±0.2) than under STNC (7.5±0.04; p<0.001; Fig. 5). The 5–10 cm layer maintained elevated C:N ratios under CTCC (8.0±0.2) compared to STNC (7.4±0.1; p=0.008).
-
Bulk Soil Analysis: Analysis of bulk soil samples (0–10 cm depth) showed that CTCC carried significantly greater C concentration (1.63±0.19 % vs. 1.05±0.12 %; paired t, p=0.010) and N concentration (0.18±0.02 % vs. 0.12±0.01 %; p=0.010) than STNC; C:N ratios did not differ significantly between treatments (9.19±0.19 vs. 8.67±0.37; paired Wilcoxon, p=0.40; Fig. A2). The bulk-soil signal is smaller in magnitude than the surface-stratified signal, consistent with management effects concentrated in the surface horizon.
3.4 Organic Matter Composition Analysis
Fourier-transform infrared spectroscopy analysis of surface soil samples (0–5 cm) revealed compositional differences in soil organic matter between management systems.
Simple plant-derived organic matter did not differ significantly between CTCC and STNC (26.8±0.8 % vs. 24.7±0.7 %; paired t, p=0.056; Fig. 6). The proportion of processed (microbially-associated) organic matter was significantly lower under CTCC than under STNC (48.2±0.2 % vs. 50.4±0.3 %; p<0.001). Complex plant-derived organic matter showed similar proportions between CTCC and STNC (25.0±0.6 % vs. 24.9±0.8 %; p=0.88).
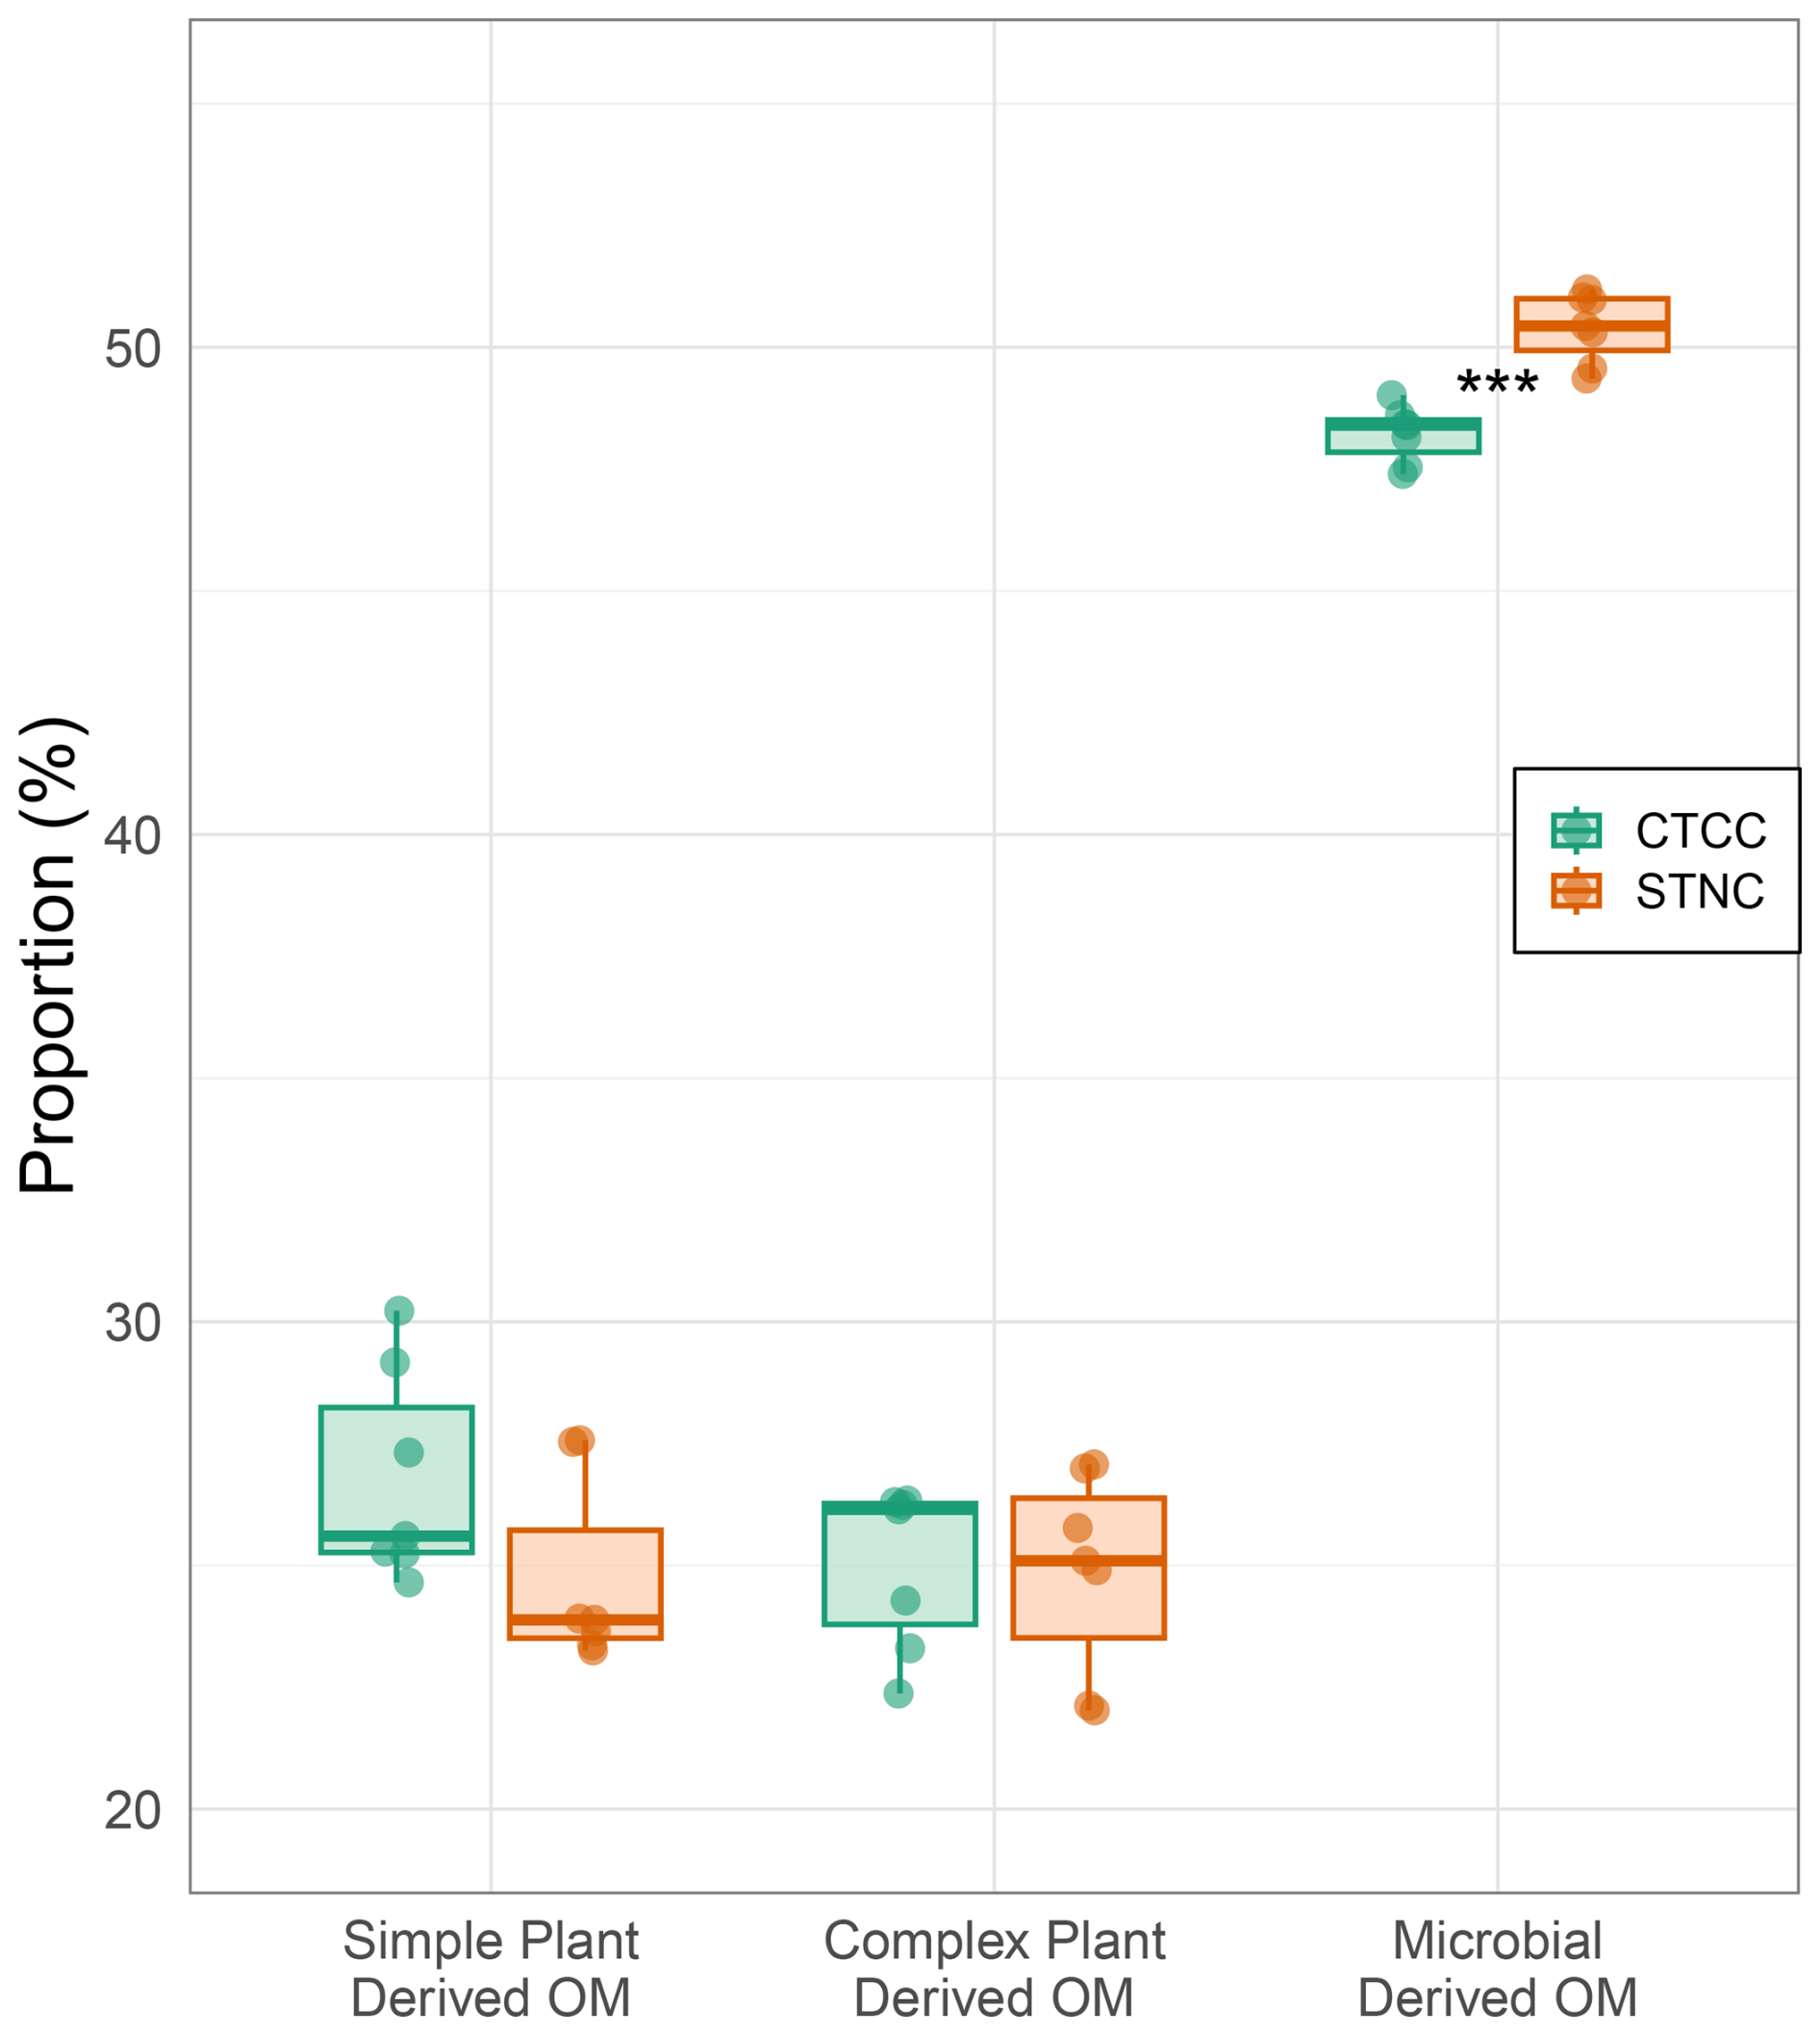
Figure 6Proportions of soil organic-matter composition under conservation (CTCC, green, n=7) and standard (STNC, orange, n=7) management at 0–5 cm depth. Simple plant-derived, complex plant-derived, and processed (microbially-associated) OM proportions were calculated via integration under their corresponding FTIR spectral peaks. CTCC carried a significantly lower proportion of processed organic matter than STNC, consistent with reduced microbial processing of organic inputs under conservation management. Boxes span the interquartile range with the median marked; whiskers extend to the most extreme observations; individual data points are overlaid. Statistical significance between treatments is indicated by symbols: for p<0.001, for p<0.01, * for p<0.05 (paired t-test).
3.5 Carbon Protection Mechanisms
Density fractionation analysis of bulk soil samples (0–10 cm depth) revealed distinct patterns of carbon and nitrogen distribution among functionally different soil organic matter pools.
3.5.1 Carbon Distribution Among Density Fractions
Free light fraction (FLF) carbon per unit soil did not differ significantly between CTCC and STNC (paired t, p=0.41; Fig. 7). Occluded light fraction (OLF) carbon was substantially higher under CTCC (6.4±0.7 g C kg−1 soil) than under STNC (3.0±0.2 g C kg−1 soil; p=0.001). Heavy fraction (HV) carbon under CTCC (5.6±0.5 g C kg−1 soil) also exceeded STNC values (3.7±0.2 g C kg−1 soil; p=0.004).
3.5.2 Nitrogen Distribution Among Density Fractions
FLF nitrogen did not differ significantly between treatments (paired t, p=0.36). OLF nitrogen was significantly greater under CTCC (0.051±0.006 %) than under STNC (0.023±0.002 %; paired t, p=0.002). HV nitrogen was significantly greater under CTCC (0.091±0.006 %) than under STNC (0.071±0.002 %; paired t, p=0.007).
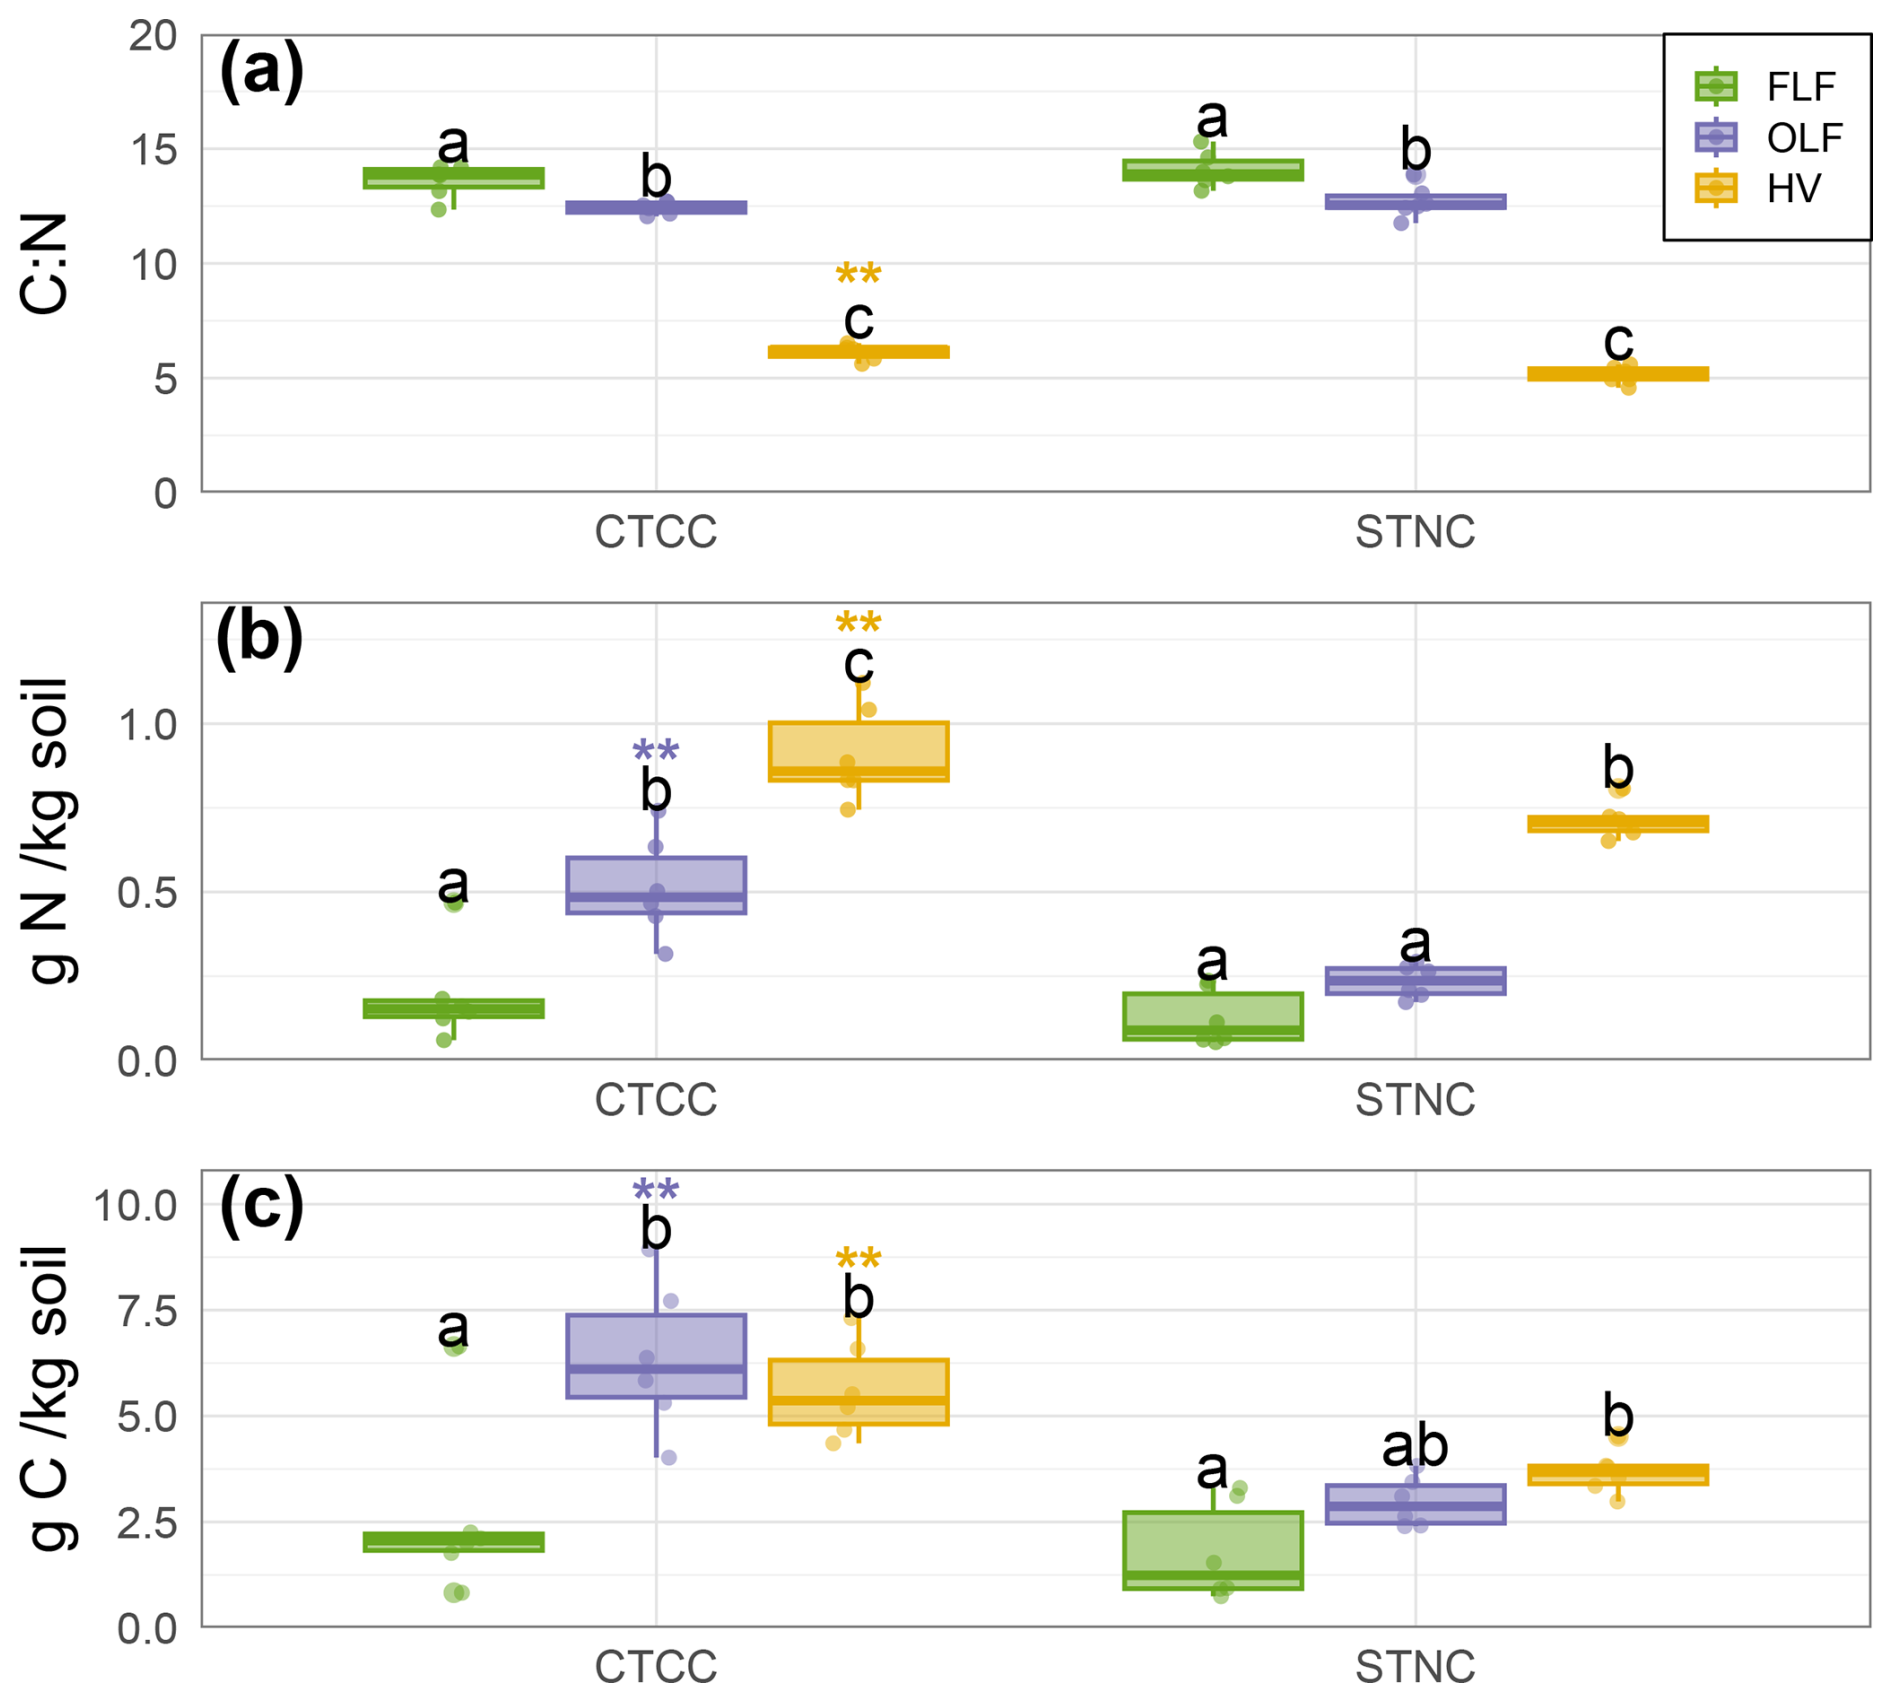
Figure 7Carbon and nitrogen partitioned among density fractions in CTCC and STNC at 0–10 cm depth (n=6 paired blocks). The three pools are free-light (FLF, green), occluded light (OLF, purple), and heavy (HV, yellow) fractions. CTCC carried significantly more C and N in the occluded fraction than STNC, with the HV fraction also enriched in CTCC. Boxes span the interquartile range with the median marked; whiskers extend to the most extreme observations; individual data points are overlaid. Between-treatment comparisons within each fraction were tested with paired t or paired Wilcoxon tests and are marked by asterisks above the CTCC boxes, coloured by fraction; within-treatment comparisons among fractions used Games–Howell post-hoc tests. Letters indicate significantly different fractions within a treatment at p<0.05.
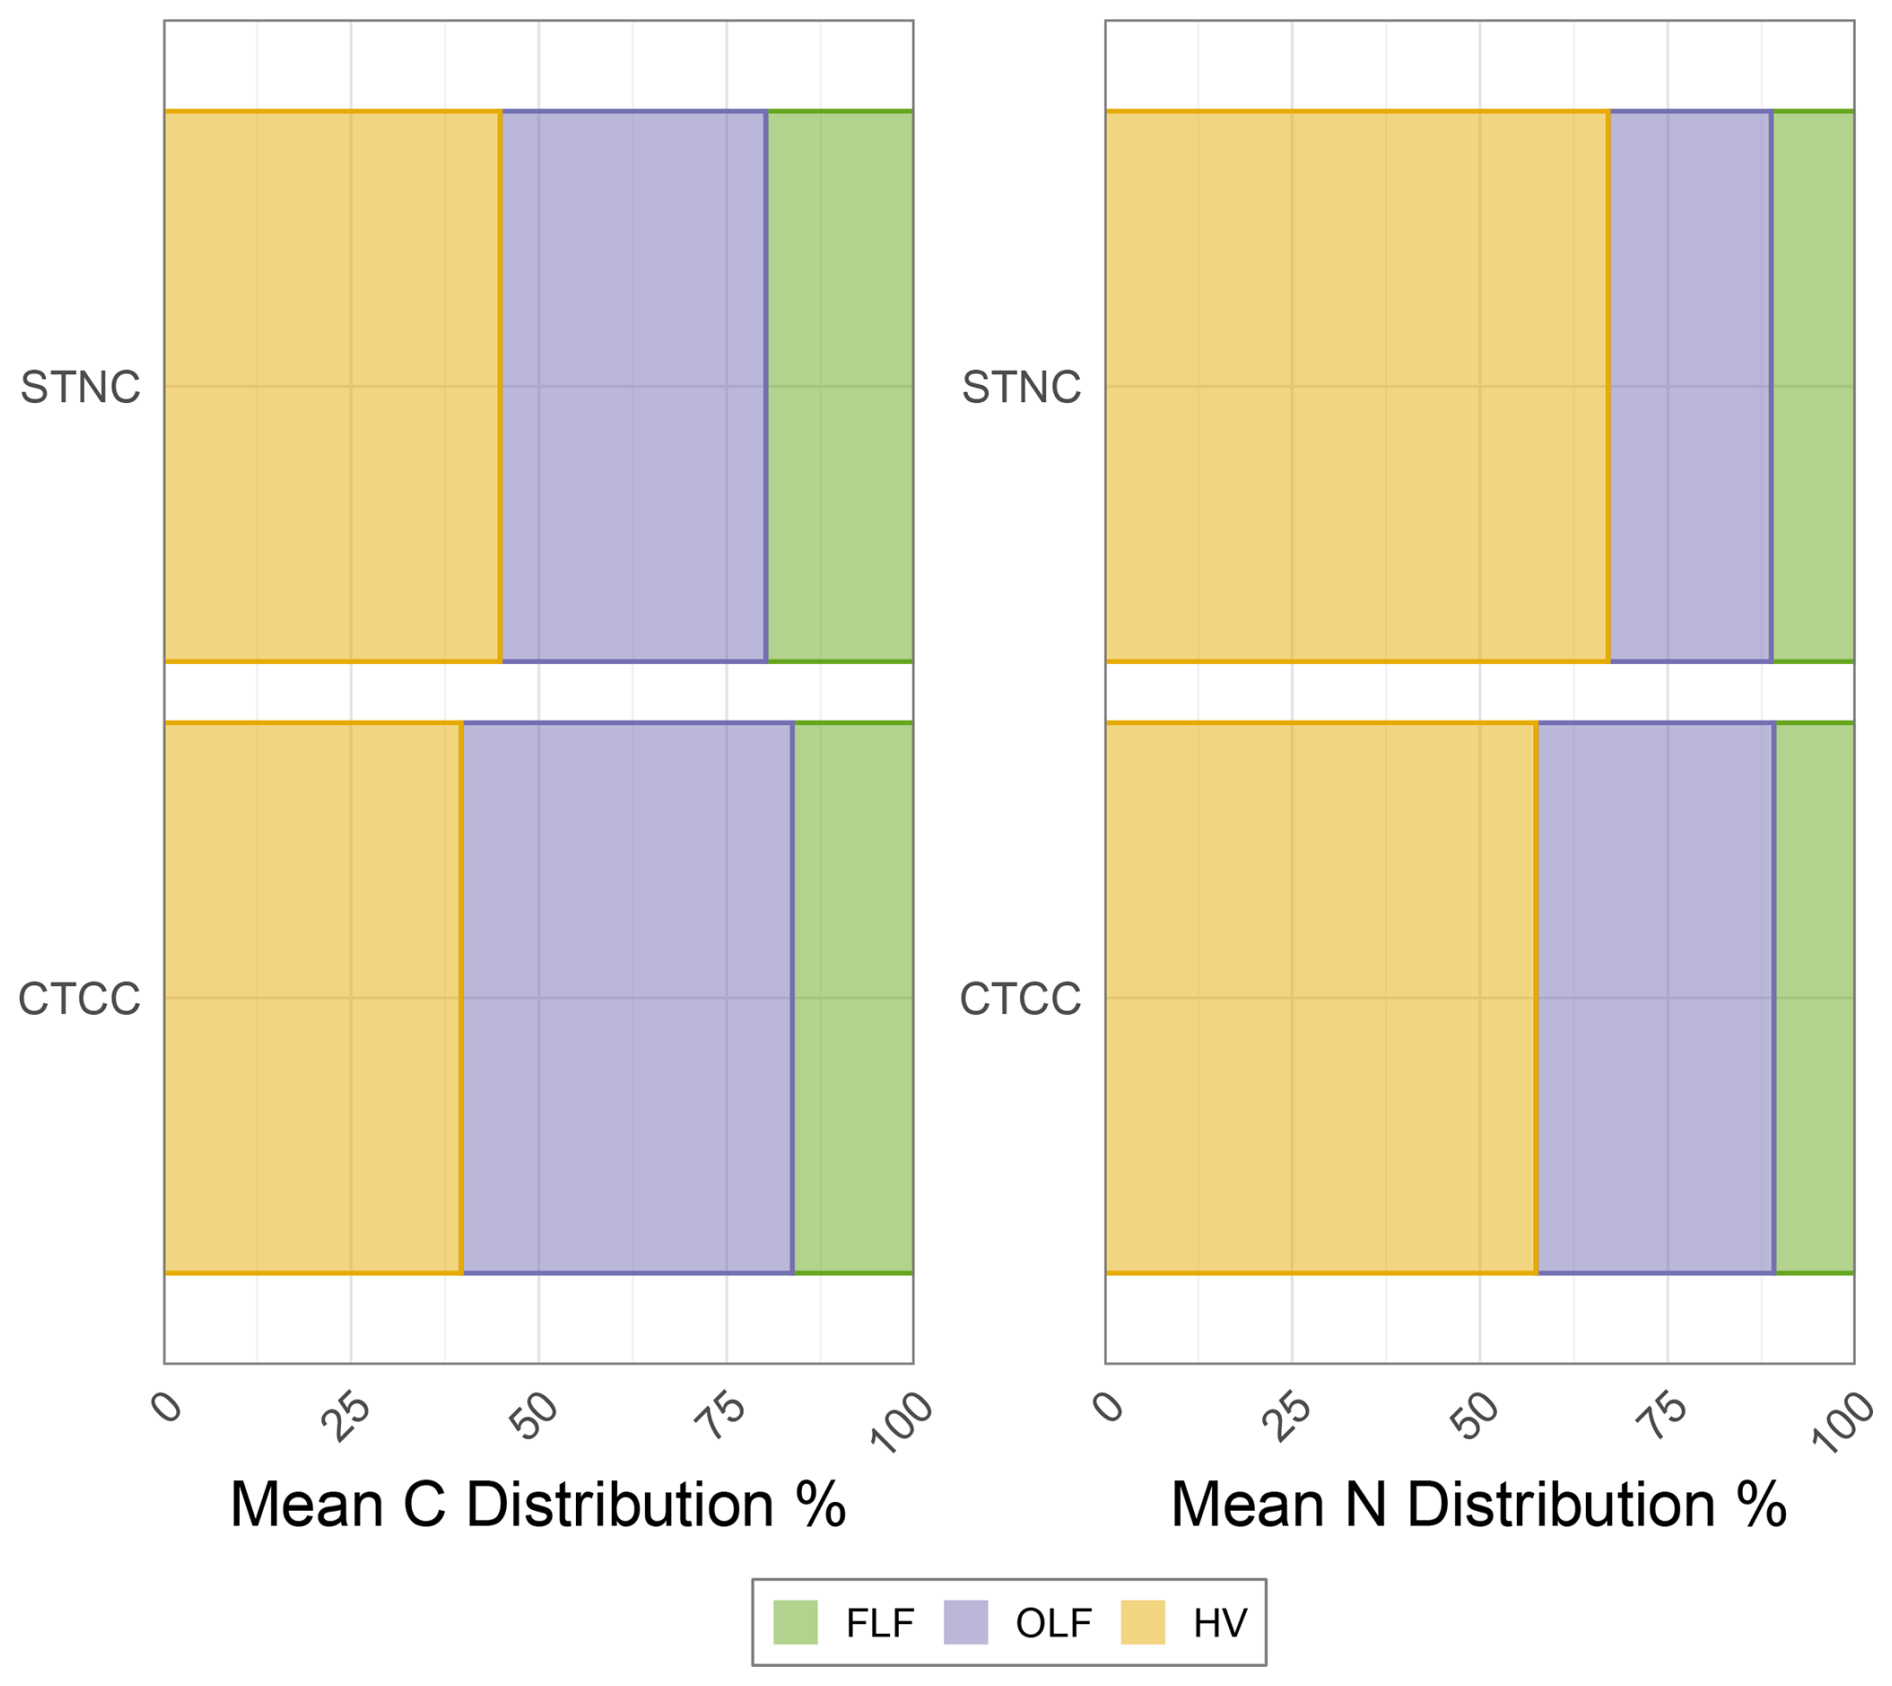
Figure 8Relative distribution of carbon and nitrogen within functional SOM pools under CTCC and STNC at 0–10 cm depth (n=6 paired blocks), shown as stacked treatment means. The three pools are free-light (FLF), occluded light (OLF), and heavy (HV) fractions. CTCC carried a significantly greater proportion of recovered C in the OLF and a significantly greater proportion of recovered N in the OLF, indicating reorganization of carbon and nitrogen toward aggregate-mediated physical protection under conservation management. Paired t-tests were used for between-treatment comparisons within fractions.
3.5.3 Relative Carbon and Nitrogen Distribution
Expressed as proportions of total recovered carbon, CTCC showed the greatest percentage in the OLF (44.1±1.6 %), followed by HV (39.7±2.4 %) and FLF (16.3±2.8 %) (Fig. 8). STNC exhibited the highest proportion in the HV (44.9±3.8 %), followed by OLF (35.4±0.9 %) and FLF (19.8±4.2 %). Between treatments, CTCC carried a significantly higher OLF proportion (paired t, p=0.006); the HV and FLF proportions did not differ significantly between treatments (p=0.29 and p=0.52, respectively).
For nitrogen distribution relative to total recovered nitrogen, CTCC showed elevated OLF fractions relative to STNC (paired t, p<0.001 for OLF). The HV fraction held the largest share of recovered N in both treatments, while the FLF N proportion did not differ significantly between treatments.
3.5.4 Carbon to Nitrogen Ratios in Density Fractions
C:N ratios in FLF and OLF fractions ranged from 12 to 14 for both treatments and did not differ significantly between management systems (FLF: p=0.23; OLF: p=0.38; Fig. 7). The HV fraction showed significantly higher C:N ratios under CTCC (6.1±0.1) than under STNC (5.1±0.2; paired t, p=0.005).
3.6 Mineral-Associated Organic Carbon Saturation
Mineral-associated organic carbon saturation revealed significant differences between management practices. CTCC exhibited substantially higher carbon saturation than STNC (11.5±1.6 % vs. 7.4±0.8 %; paired t, p=0.007; Fig. 9), representing a 55 % relative increase. Saturation was calculated relative to the theoretical maximum carbon storage capacity of 86±9 mg C g−1 mineral for high-activity minerals (Georgiou et al., 2022); the reported standard errors and 95 % confidence intervals incorporate the ±9 mg C g−1 mineralogical uncertainty propagated through the per-sample saturation calculation using the delta method (CTCC 95 % CI: 7.3 %–15.6 %; STNC 95 % CI: 5.2 %–9.6 %). Both treatments remained well below the theoretical maximum capacity; the implications of this saturation gap are discussed in Sect. 4.2.
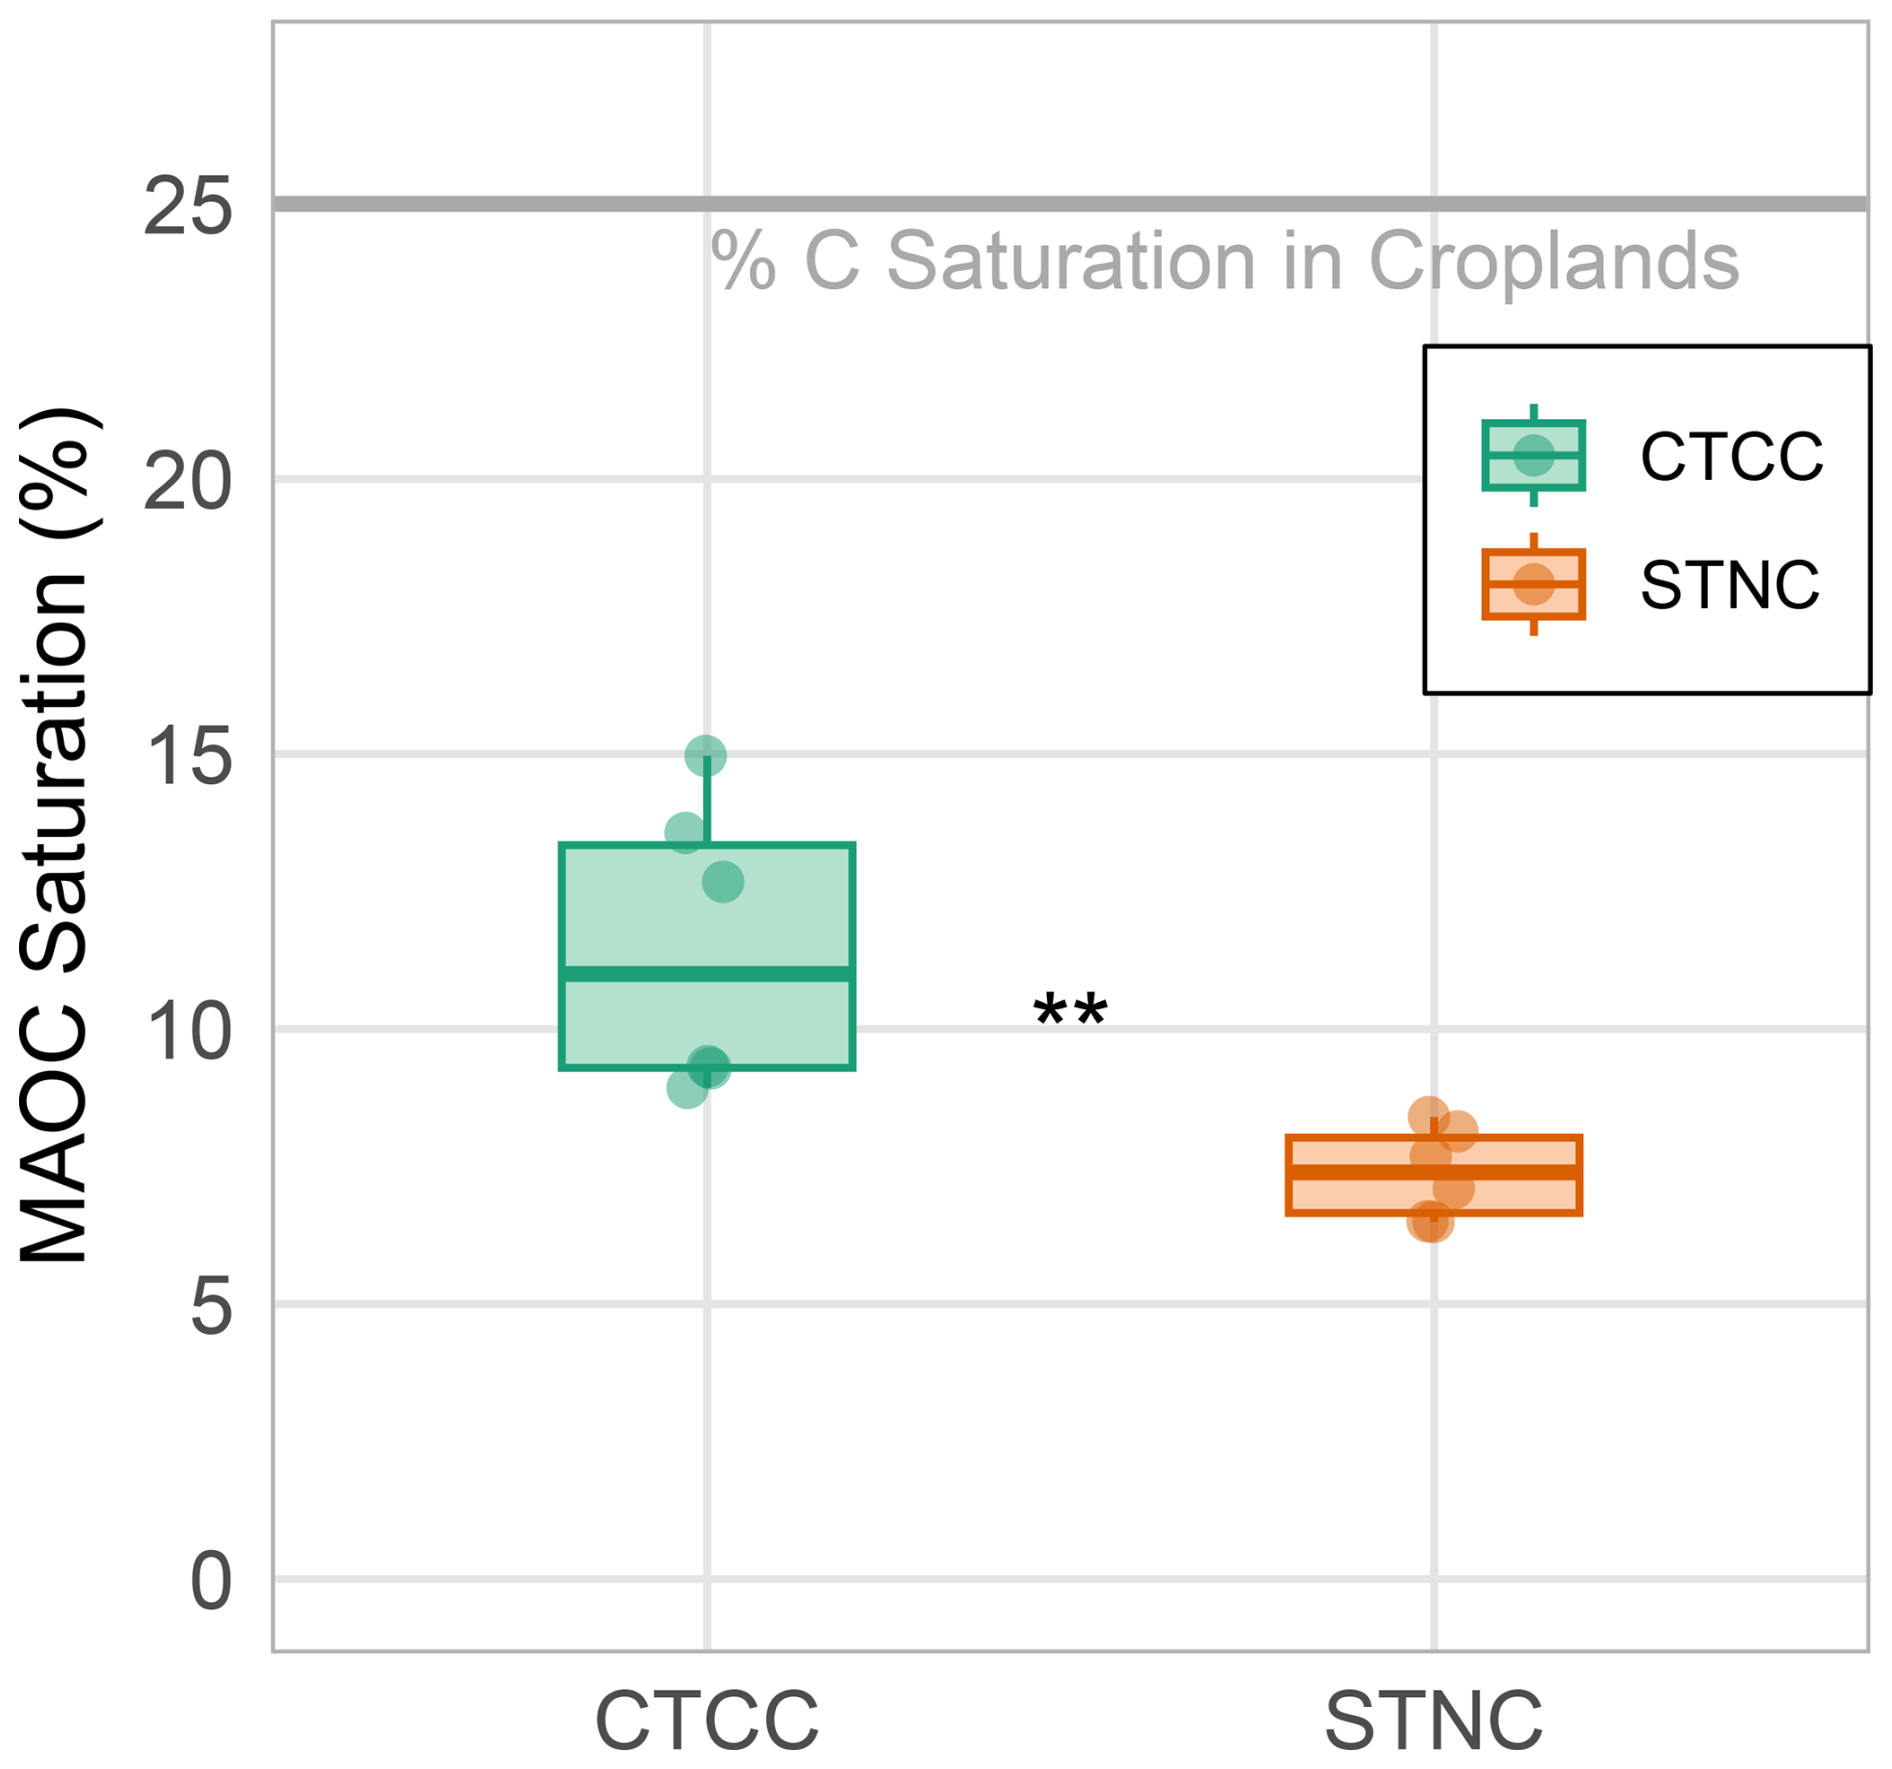
Figure 9Carbon saturation of the mineral fraction under conservation (CTCC, green) and standard (STNC, orange) management at 0–10 cm depth (n=6 paired blocks). CTCC carries significantly higher MAOC saturation than STNC, while both management types remain well below the theoretical maximum capacity of Georgiou et al. (2022). Boxes span the interquartile range with the median marked; whiskers extend to the most extreme observations; individual data points are overlaid. Propagated standard errors combining sample-level variability with the ±9 mg C g−1 uncertainty in the theoretical maximum (delta method) are reported in Sect. 3.6. Statistical significance between treatments is indicated by symbols: for p<0.001, for p<0.01, * for p<0.05 (paired t-test).
Our findings indicate that two decades of conservation agriculture substantially altered soil functioning in this Mediterranean agricultural system, with changes extending beyond simple carbon accumulation to a reorganization of soil physical structure and carbon protection mechanisms. The magnitude and consistency of improvements across multiple soil health indicators are consistent with conservation agriculture supporting the development of stable, self-reinforcing soil systems.
4.1 Aggregate Stability as the Foundation of Soil System Transformation
The dramatic improvement in aggregate stability under reduced tillage with cover crops (CTCC) – exhibiting 136 % greater stability than standard tillage without cover crops (STNC) – represents the cornerstone of soil system transformation and aligns with global patterns from long-term conservation studies. Global meta-analyses consistently demonstrate enhanced aggregate stability as a characteristic response to conservation agriculture, with improvements driven by reduced soil disturbance and enhanced organic matter inputs (Liu et al., 2021). The pronounced differences in structural properties between treatments reflect underlying changes in soil biological activity and organic matter dynamics that serve as the foundation for understanding all subsequent improvements.
The substantial improvement in aggregate stability is consistent with synergistic effects of carbon inputs from cover crop residues and reduced physical disturbance through reduced-tillage practices (Six et al., 2004; Bronick and Lal, 2005). The four-treatment comparison in Fig. 1 is consistent with synergistic rather than purely additive effects of combining reduced tillage with cover cropping; this interpretation cannot be extended to variables for which intermediate treatments were not analyzed. Modern understanding of aggregate formation emphasizes the role of fungal networks in creating stable soil structure, with mycorrhizal associations showing enhanced development under integrated conservation management (Schmidt et al., 2019). The enhanced stability observed under CTCC likely reflects development of fungal–bacterial networks that create robust binding agents while simultaneously providing pathways for carbon protection within aggregate structures. Our observation that standard tillage with cover crops (STCC) exhibited greater aggregate stability than reduced tillage without cover crops (CTNC) provides important insights into the relative importance of biological versus physical drivers of soil structure. This pattern aligns with global analyses showing that biological carbon inputs consistently outweigh tillage effects in determining long-term structural improvements (Liu et al., 2025). This finding supports the hypothesis that biological processes associated with continuous root activity and residue inputs are primary drivers of aggregate formation and stabilization (Liu et al., 2005; Tisdall and Oades, 1982).
The improved aggregate stability under CTCC creates the physical foundation for all subsequent improvements in soil functioning. Stable aggregates provide protected micro-sites for organic matter accumulation, create favorable conditions for microbial activity, and establish the pore network architecture governing water movement and retention.
4.2 Carbon Protection Mechanism Evolution: From Mineral-Sorptive to Aggregate-Mediated Protection
Our density fractionation analysis is consistent with a reorganization of carbon protection mechanisms under long-term conservation agriculture. The enrichment of the occluded light fraction under CTCC (44.1 % vs. 35.4 % of total recovered carbon in STNC) indicates that aggregate-mediated physical protection becomes a substantial pathway for carbon storage in this system. We note that the boundary between “chemical” and “physical” protection is not sharp: the OLF carbon resides on organo-mineral surfaces within aggregates, so the shift is more precisely described as a transition from primarily mineral-sorptive protection (HV/MAOC) toward aggregate-mediated protection (OLF), with both mechanisms involving mineral surfaces.
This mechanism shift is broadly consistent with recent global analyses of carbon protection under conservation management. Global cropland analysis from 2000–2022 showed that particulate organic carbon increased 21.8 % while MAOC remained stable across agricultural systems, with North American croplands under conservation policies for more than 20 years showing increases in both POC and MAOC (Liu et al., 2025). Our Mediterranean site results are consistent with these global trends, indicating that physically- and chemically-protected carbon coexist as the dominant protection mechanisms when conservation practices are sustained over multi-decade periods.
We interpret the observed mechanism distribution within the temporal-phase framework proposed by Tian et al. (2024), which described initial rapid MAOC formation in years 0–5, continued MAOC accumulation with enhanced microbial processing in years 5–15, and a mature phase beyond 15 years where physical protection becomes increasingly important. We treat this phase progression as a working framework rather than an established trajectory: Tian et al. (2024) was a 10-year experiment and did not directly observe the > 15-year phase invoked here, and the climate, soil type, and cropping system differ from ours. Longer-term studies in other systems (Caruso et al., 2018; West and Post, 2002) document declining carbon sequestration rates approaching equilibrium within 15–20 years across diverse climates, providing additional support for the trajectory.
The shift toward aggregate-mediated protection has implications for carbon persistence. While MAOC is often considered more stable due to strong organo-mineral bonds, physically-protected carbon within stable aggregates can achieve similar longevity through reduced exposure to decomposer organisms and limited oxygen availability (Six et al., 2002). Protection mechanism diversity enhances overall carbon stability, with aggregate-mediated protection providing resilience against environmental perturbations that might destabilize MAOC (Lavallee et al., 2020).
FLF carbon concentration did not differ significantly between treatments despite the additional organic-matter inputs under CTCC. This observation is consistent with rapid integration of fresh residues into more stable soil fractions under conservation management, or with elevated decomposition of fresh inputs; the present data do not distinguish between these possibilities, and direct measurement of microbial carbon use efficiency would be required to do so.
The MAOC saturation analysis carries important interpretive caveats for future sequestration potential. CTCC exhibited 55 % higher mineral saturation than STNC (11.5±1.6 % vs. 7.4±0.8 %), with the propagated uncertainty in the Georgiou et al. (2022) theoretical maximum incorporated into the reported standard errors. Both treatments remained well below the theoretical maximum. This saturation gap should not, however, be interpreted as untapped potential under current management. Mediterranean agricultural soils typically show MAOC saturation well below theoretical maxima not because mineral surfaces are unsaturated for chemical reasons but because environmental constraints – low annual precipitation, seasonal aridity, and limited carbon inputs during dry months – set the realized ceiling for organic matter accumulation (Caruso et al., 2018). If management-related carbon accumulation has approached a quasi-steady state after two decades while substantial mineralogical capacity remains, then mineral surface availability is not the bottleneck. Closing the remaining gap to mineralogical capacity would require fundamentally different interventions (organic amendments, irrigation changes, or deeper-rooted perennial systems) rather than continued application of current conservation practices.
4.3 Physical Property Transformation and Hydrological Implications
Physical-property changes under CTCC are concentrated in but not confined to the surface horizon. At 0–5 cm, bulk density was 15 % lower and field capacity 12 % greater under CTCC than under STNC, and total porosity was significantly elevated – changes that are consistent with a more developed surface pore network supporting both water storage and movement. These changes are agronomically meaningful in Mediterranean systems where water availability often constrains productivity. Water-retention improvements of 10 %–15 % are typical in Mediterranean climates after 15–20 years of conservation management (Caruso et al., 2018), and may reduce irrigation requirements and improve drought resilience (Gomes et al., 2023; Araya et al., 2022).
The improved surface pore structure under CTCC is consistent with hierarchical pore networks described for mature conservation systems, in which larger inter-aggregate pores facilitate rapid infiltration during precipitation events while smaller intra-aggregate pores retain water under stress conditions (Tian et al., 2024). The depth pattern in porosity is more nuanced than a simple surface-only effect: at 5–10 cm, porosity was significantly lower under CTCC than under STNC, inverting the surface direction. This subsurface contrast is plausibly attributable to the absence under CTCC of the transient deep-tillage loosening that ST achieves during subsoiling operations (Mitchell et al., 2017), leaving the CTCC subsoil less loosened than the ST subsoil immediately after a tillage pass but functionally undisturbed. The vertical stratification – surface accumulation under CTCC, subsurface consolidation under no-till relative to seasonal ST disturbance – is consistent with mature conservation systems where the surface horizon hosts most of the management signal (Bienes et al., 2021).
Saturated hydraulic conductivity did not differ significantly between treatments at either depth, consistent with the high spatial variability characteristic of Ksat in heterogeneous soils (Poeplau et al., 2018). Mean values were nominally higher under CTCC than STNC at both depths, but the variability among cores is large enough that we do not infer treatment effects on Ksat from these data. Future work employing X-ray computed tomography or other high-resolution imaging could resolve the pore-network architecture that governs water movement in these systems (Poeplau et al., 2018).
4.4 Carbon and Nitrogen Dynamics: Approach to Equilibrium and Quality Transformation
The substantial carbon accumulation under CTCC – with surface soil stocks approximately double those in STNC and bulk-soil C concentrations 55 % greater – indicates a meaningful sequestration response to two decades of conservation management. A first-order calculation suggests a retention efficiency of approximately 19 % of cumulative added cover-crop carbon, with the remainder either mineralized or transported below our sampling depth. This estimate uses cumulative cover-crop biomass inputs extrapolated from periodic on-site measurements across the 20-year period and is subject to substantial uncertainty arising from year-to-year variation in cover-crop productivity, composition, and decomposition rate; the value should be read as an order-of-magnitude estimate rather than a precise retention coefficient.
Our carbon accumulation patterns are consistent with the trajectory toward dynamic equilibrium described for conservation agriculture systems managed for 15–20 years (Caruso et al., 2018; West and Post, 2002). However, our cross-sectional design does not permit direct confirmation of equilibrium status. An important caveat is the evolving management trajectory at this site: as described in Sect. 2.2, the CT system permitted shallow cultivation for tomato crops from 1999 to 2011, with true zero-tillage achieved only in 2012. The system therefore experienced approximately 13 years of reduced tillage followed by 7 years of true no-till before sampling. Two implications follow. First, the system may still be responding to the more recent intensification of disturbance reduction, providing an additional reason to interpret the equilibrium framing as a plausible trajectory rather than a confirmed outcome. Second, this progressive adoption pathway is representative of how conservation agriculture adoption typically occurs in practice – through incremental intensification rather than abrupt transitions – so our results capture a realistic adoption scenario. Additional temporal data, including future measurements at this site or analysis of archived soil samples, would be needed to confirm equilibrium status.
Wider C:N ratios under CTCC (9.1 vs. 7.5 at the surface) combined with FTIR evidence of a lower proportion of processed (microbially-associated) organic matter (Margenot et al., 2023) indicate that conservation management preserves more plant-derived characteristics in the soil organic matter pool. Recent evidence suggests that physically-protected organic matter with relatively wide C:N ratios can achieve long-term persistence when embedded within stable aggregate structures (Kleber et al., 2011).
Nitrogen cycling patterns paralleled carbon dynamics but with distinct fractionation. The OLF carried a disproportionately larger share of recovered N under CTCC than under STNC, while the increase in HV nitrogen was more modest. The redistribution toward aggregate-mediated forms may improve nitrogen synchrony with crop demand and reduce leaching losses (Jilling et al., 2020).
4.5 Mediterranean System Responses and Global Implications
Our findings from California's Central Valley provide important validation that conservation agriculture principles are effective across diverse climatic conditions, with Mediterranean systems showing particularly strong responses to integrated conservation practices. The Mediterranean climate, characterized by pronounced seasonal moisture patterns and high potential evapotranspiration, creates conditions that enhance conservation agriculture benefits through intensified aggregate formation during wet-dry cycles and increased water use efficiency.
The improvements in this Mediterranean system suggest that these environments may be particularly responsive to conservation management. Global analyses indicate that Mediterranean agricultural regions show some of the highest potential returns on conservation agriculture investments, with water limitation creating strong incentives for practices that enhance water retention and use efficiency (Liu et al., 2025). The 12 % improvement in field capacity observed at 0–5 cm represents a localized but potentially valuable enhancement in water-limited systems. While the shallow extent may limit impact on deep-rooted crops during extended dry periods, it could benefit seedling establishment and shallow-rooted crops during critical early growth stages.
The depth stratification we observed – pronounced improvements in surface layers and direction-dependent changes at 5–10 cm – reflects the seasonal nature of Mediterranean precipitation, where enhanced surface infiltration and water storage provide value during the spring growing period. The magnitude of aggregate stability improvements (136 %) exceeds that reported in many temperate-region studies, consistent with the proposition that high clay content combined with pronounced wet–dry cycling creates particularly favorable conditions for aggregate development under conservation management (Caruso et al., 2018).
4.6 Methodological Insights and Limitations
Several limitations bound our inferences. Our sampling depth (0–10 cm) is appropriate for detecting management effects but does not capture deeper carbon dynamics; recent work suggests that carbon transport to subsoil layers may represent an important sequestration pathway in conservation systems (Liu et al., 2025). The high spatial variability in hydraulic conductivity highlights ongoing challenges in characterizing soil physical properties that exhibit pronounced heterogeneity, motivating future work using X-ray computed tomography or comparable high-resolution imaging (Poeplau et al., 2018). Finally, the physicochemical focus of this study leaves biological mechanisms – microbial community composition, enzymatic activity, microbial carbon use efficiency – unmeasured; these would directly test the mechanistic explanations we have advanced for the observed C and N partitioning.
4.7 Implications for Sustainable Agriculture and Carbon Sequestration
The improvements in soil health indicators documented in this 20-year study support conservation agriculture as an effective approach for enhancing agricultural sustainability and contributing to climate-change mitigation. The consistency of improvements after two decades is consistent with stable, long-term benefits rather than temporary responses to management changes (Caruso et al., 2018).
The shift toward aggregate-mediated carbon protection has implications for carbon market protocols, as physically-protected carbon may respond differently to environmental perturbations than mineral-sorptive carbon (Lavallee et al., 2020). Understanding these protection-mechanism differences will be important for accurate carbon accounting and for permanence requirements in carbon credit programs.
The four-treatment aggregate-stability comparison (Fig. 1) is consistent with synergistic effects of combining reduced tillage with cover cropping, emphasizing the value of integrated adoption (Liu et al., 2025). The substantial benefits seen under standard tillage with cover crops alone (STCC) also support stepwise adoption pathways for systems that cannot transition to integrated conservation management immediately.
After two decades of conservation agriculture in a Mediterranean cropping system, soil conditions are consistent with the approach toward a management-induced steady state described in the long-term literature (Caruso et al., 2018; West and Post, 2002), with aggregate stability 136 % greater under combined reduced tillage and cover cropping (CTCC) than under standard tillage (STNC), surface carbon stocks approximately doubled, water retention at field capacity 12 % greater, and the carbon-protection regime reorganized so that the occluded light fraction holds a substantially larger share of carbon under CTCC (44 % vs. 35 %). Mineral-associated carbon saturation under both treatments remains well below the theoretical maximum (11.5 % vs. 7.4 %), but this saturation gap reflects environmental constraints – low precipitation, seasonal aridity, limited carbon inputs – rather than untapped mineralogical capacity; in Mediterranean systems, mineral surface availability is not the bottleneck on carbon storage. Continued carbon accumulation beyond two decades under current management is unlikely to close the remaining gap to mineralogical capacity; interventions that change the environmental constraint (organic amendments, irrigation changes, deeper-rooted perennials) would be required. The four-treatment aggregate-stability comparison supports both stepwise adoption (substantial benefits under cover crops alone in standard-tilled systems) and the value of full integration (combined CTCC outperforming all single-factor treatments). These results provide a basis for permanence accounting in carbon-credit protocols and for prioritizing conservation-agriculture investments in water-limited Mediterranean agricultural regions.
A1 Tables
Table A1Sample-level mass and apparent carbon recoveries for the density fractionation procedure. All samples passed the ±10 % mass-recovery quality-control criterion. The lowest apparent carbon recovery (66.4 %, sample STNC18-19) coincided with the highest bulk carbon concentration in STNC, consistent with elevated dissolved organic carbon losses during SPT washing in carbon-rich samples.
A2 Figures
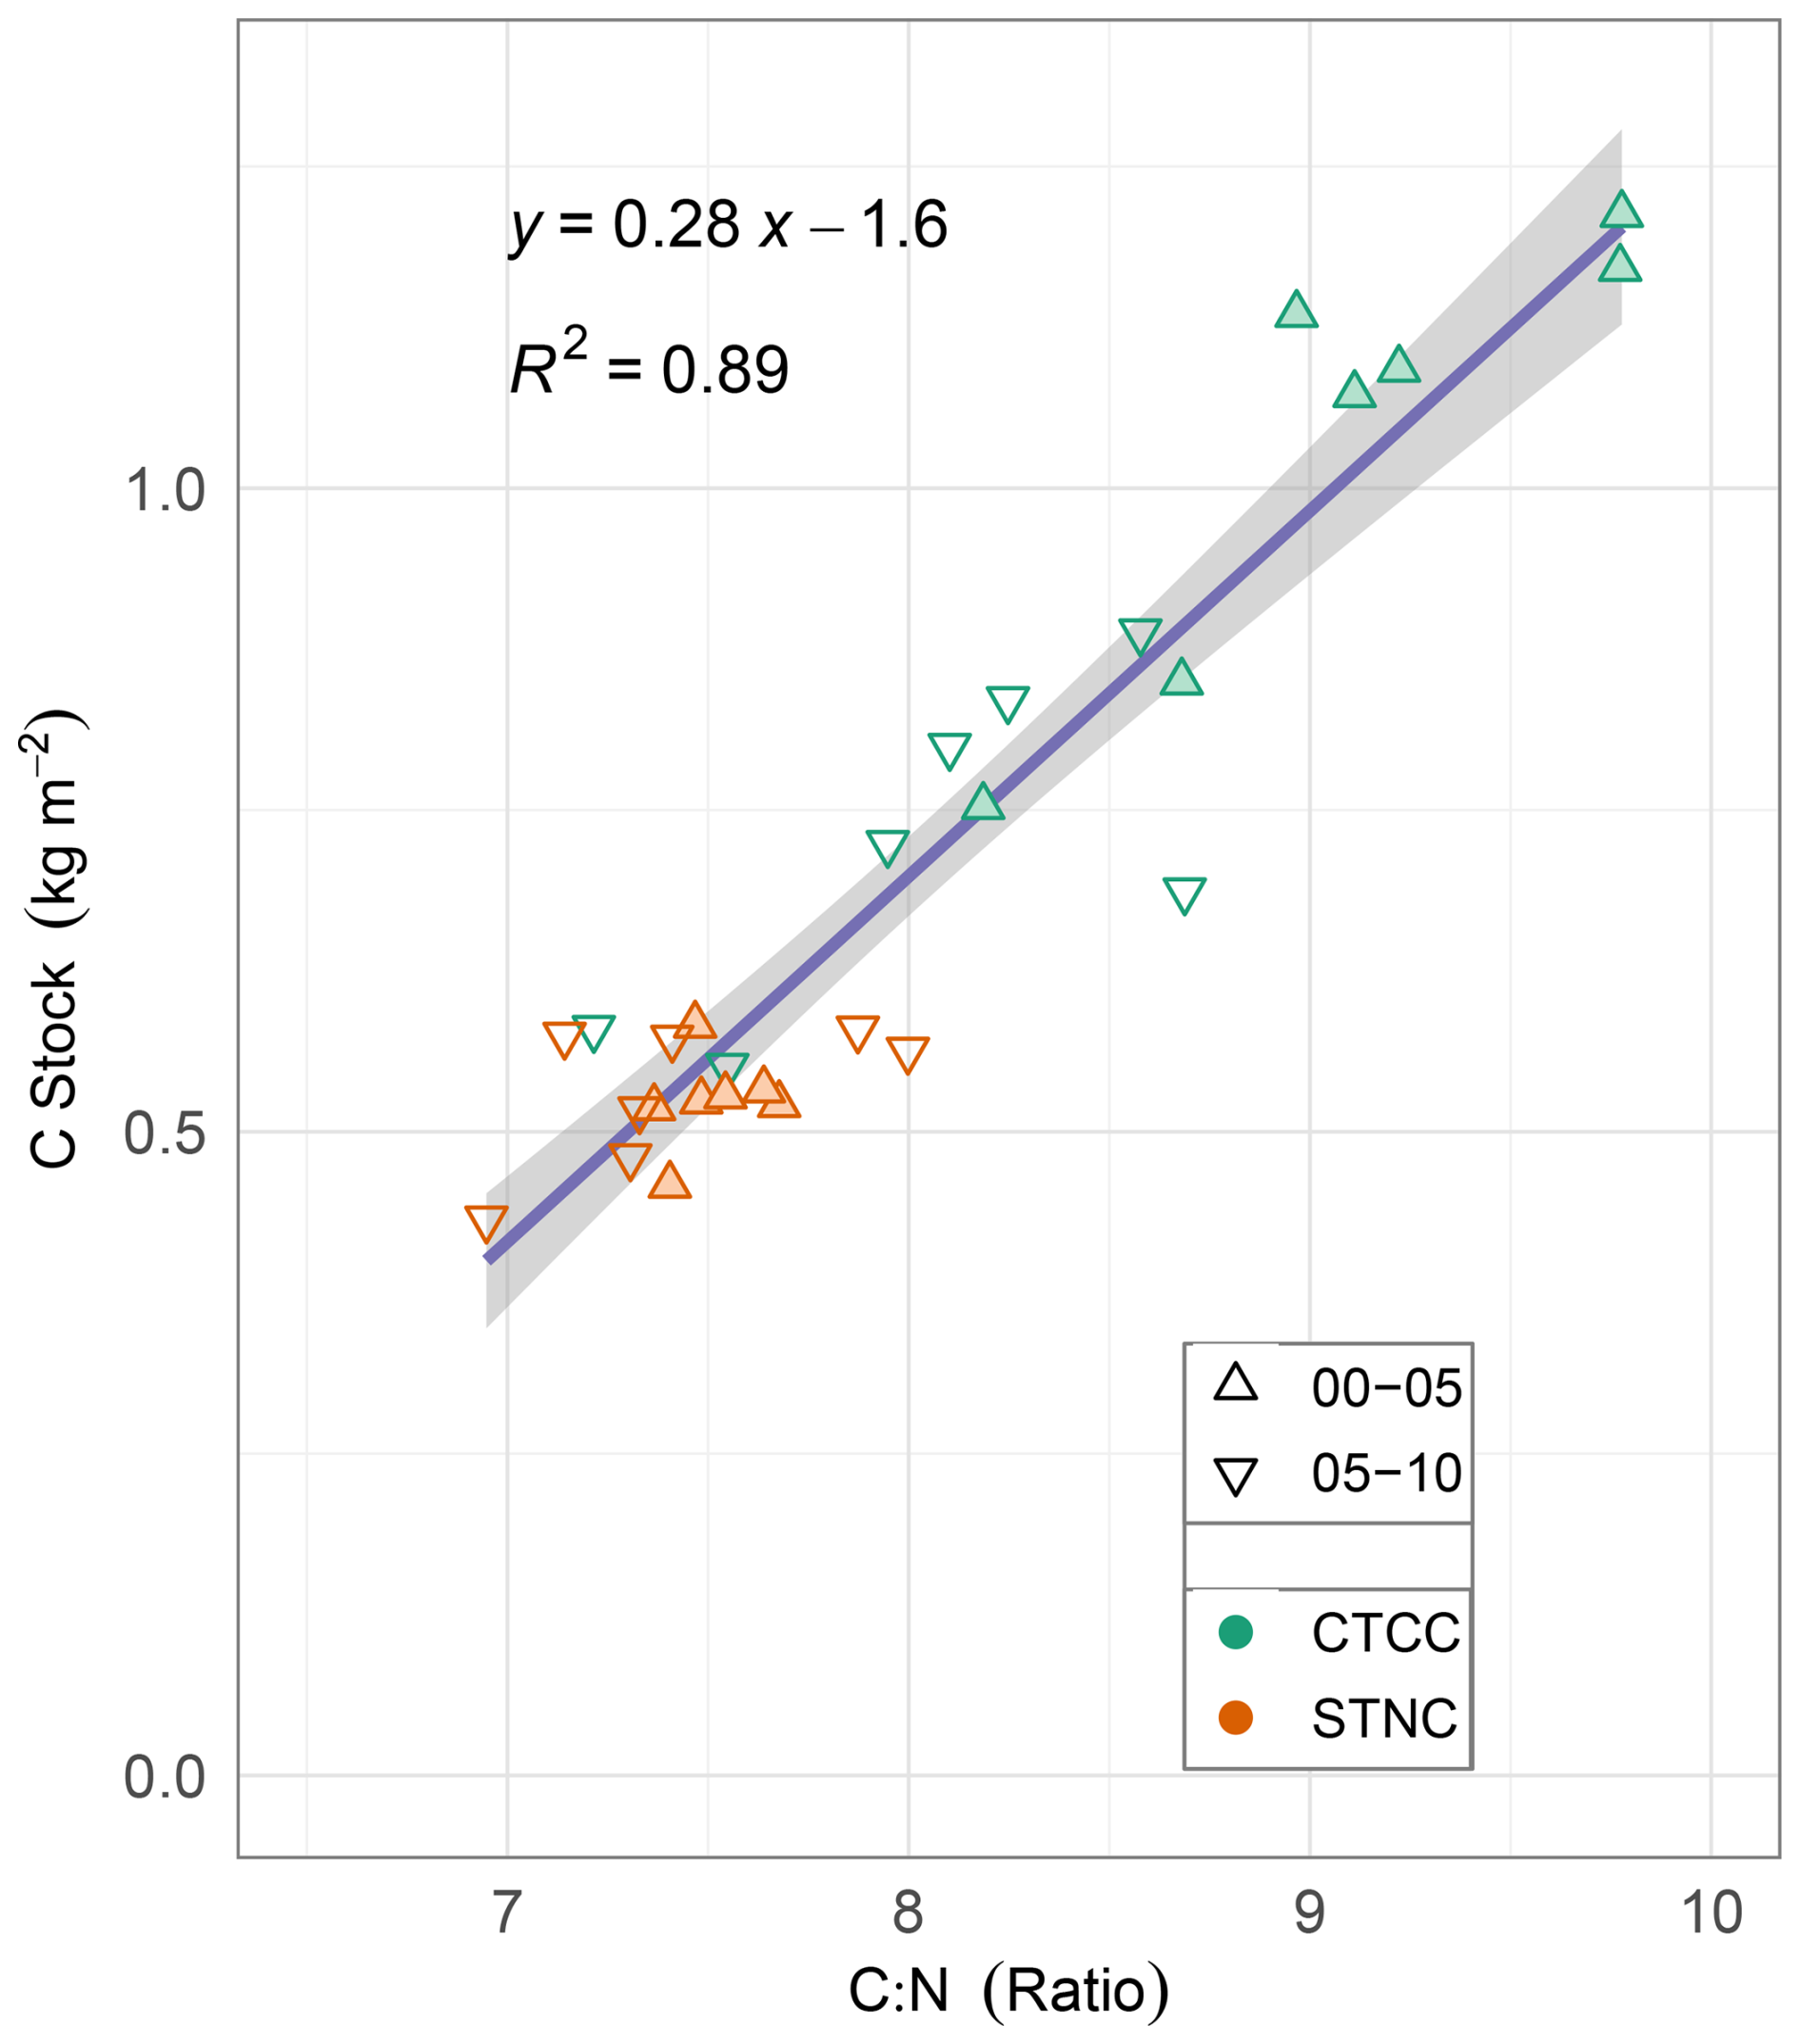
Figure A1Relationship between carbon stocks and C:N ratios under conservation (CTCC, green, n=7) and standard (STNC, orange, n=7) management. Samples from 0–5 cm depth are shown with upward-pointing triangles and 5–10 cm with downward-pointing triangles, illustrating the coupling between carbon accumulation and organic matter processing. Error bars omitted for clarity; statistical comparisons between treatments are presented in Fig. 5.
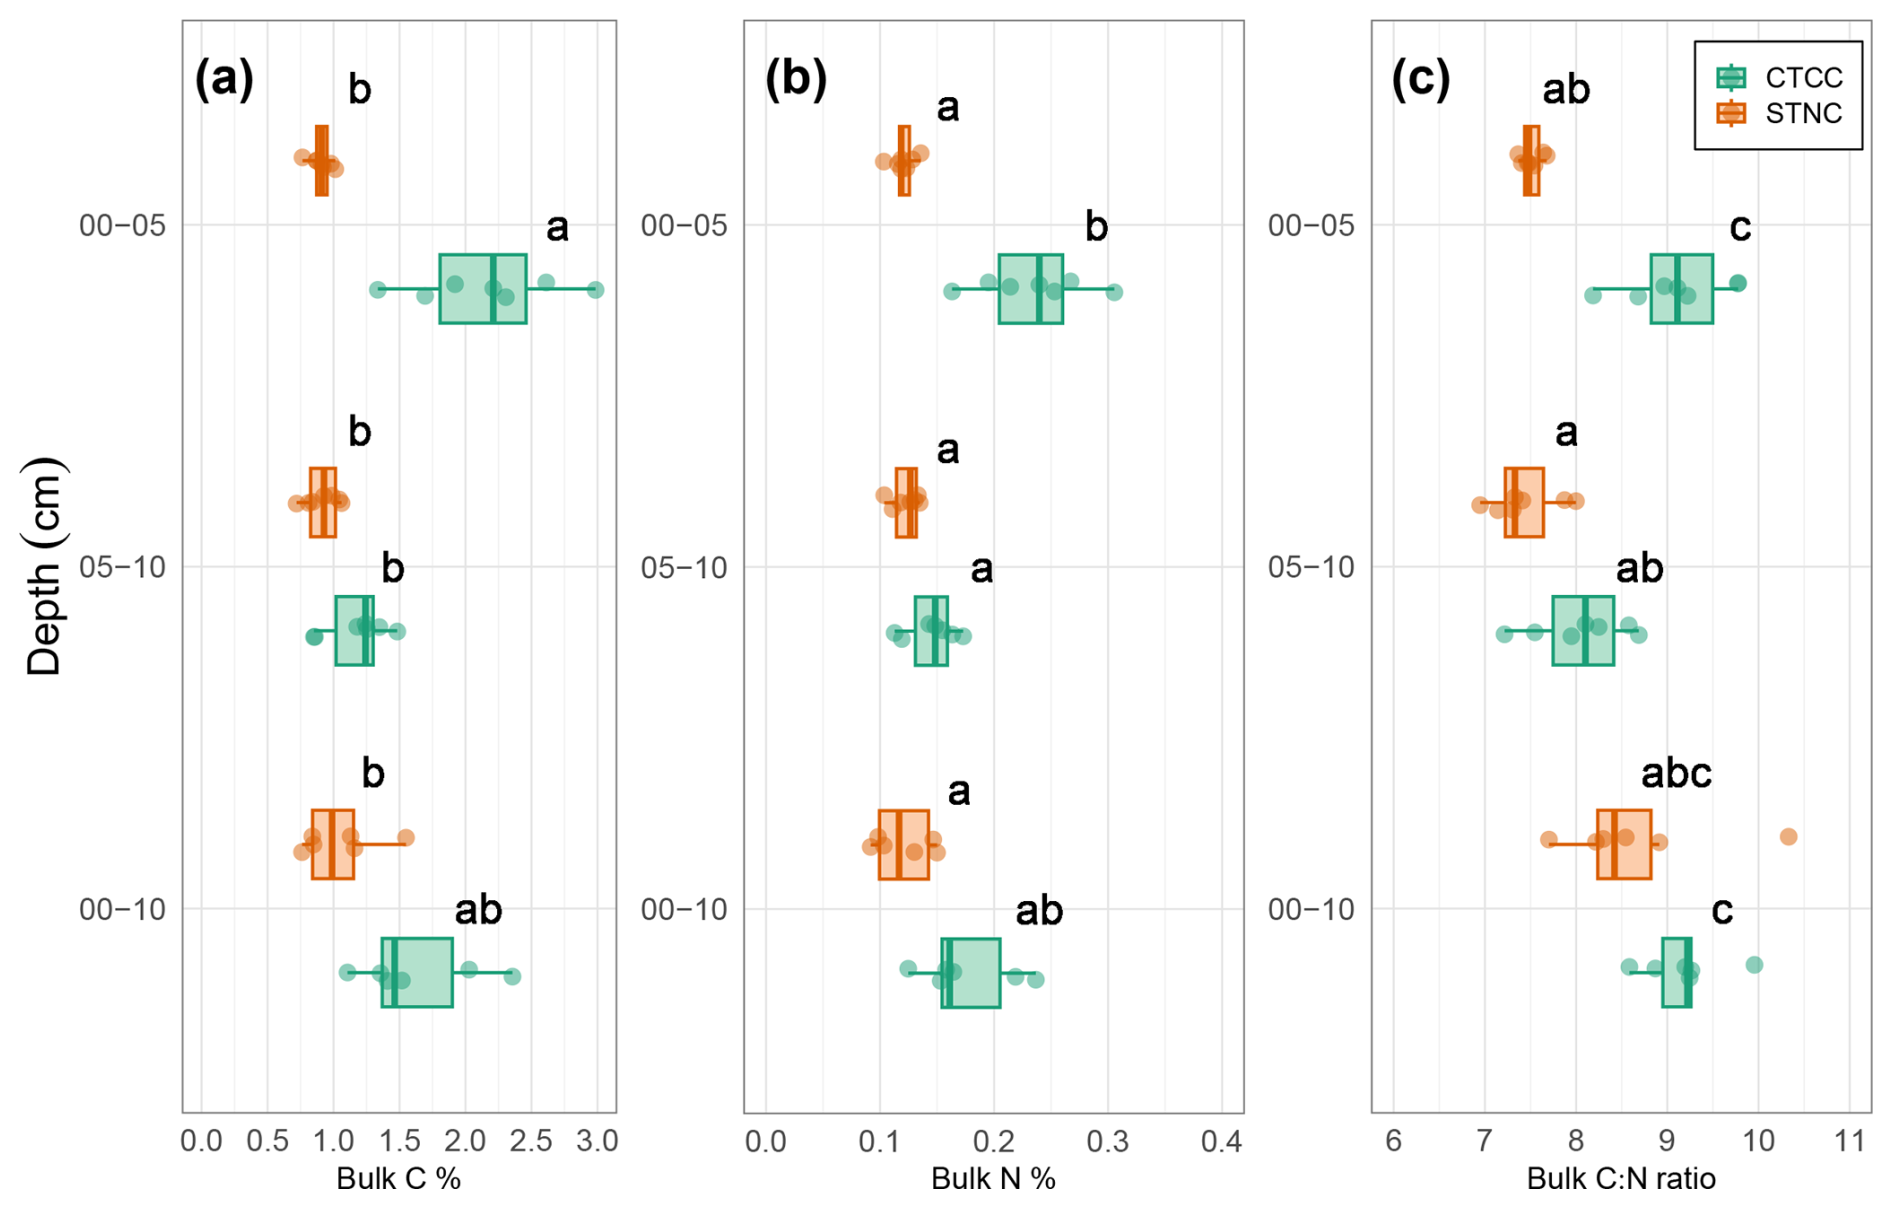
Figure A2Carbon and nitrogen content under conservation (CTCC, green) and standard (STNC, orange) management from core (0–5 and 5–10 cm, n=7) and bulk-soil samples (0–10 cm, n=6). (a) Carbon % weight, (b) nitrogen % weight (both determined via elemental combustion), and (c) C:N ratios. CTCC carries significantly greater C and N concentrations than STNC across both stratified-core depths and the bulk-soil sample; the largest effects are concentrated in the 0–5 cm horizon. Boxes span the interquartile range with the median marked; whiskers extend to the most extreme observations; individual data points are overlaid. Statistical significance between treatments is indicated by symbols: for p<0.001, for p<0.01, * for p<0.05 (paired t-test).
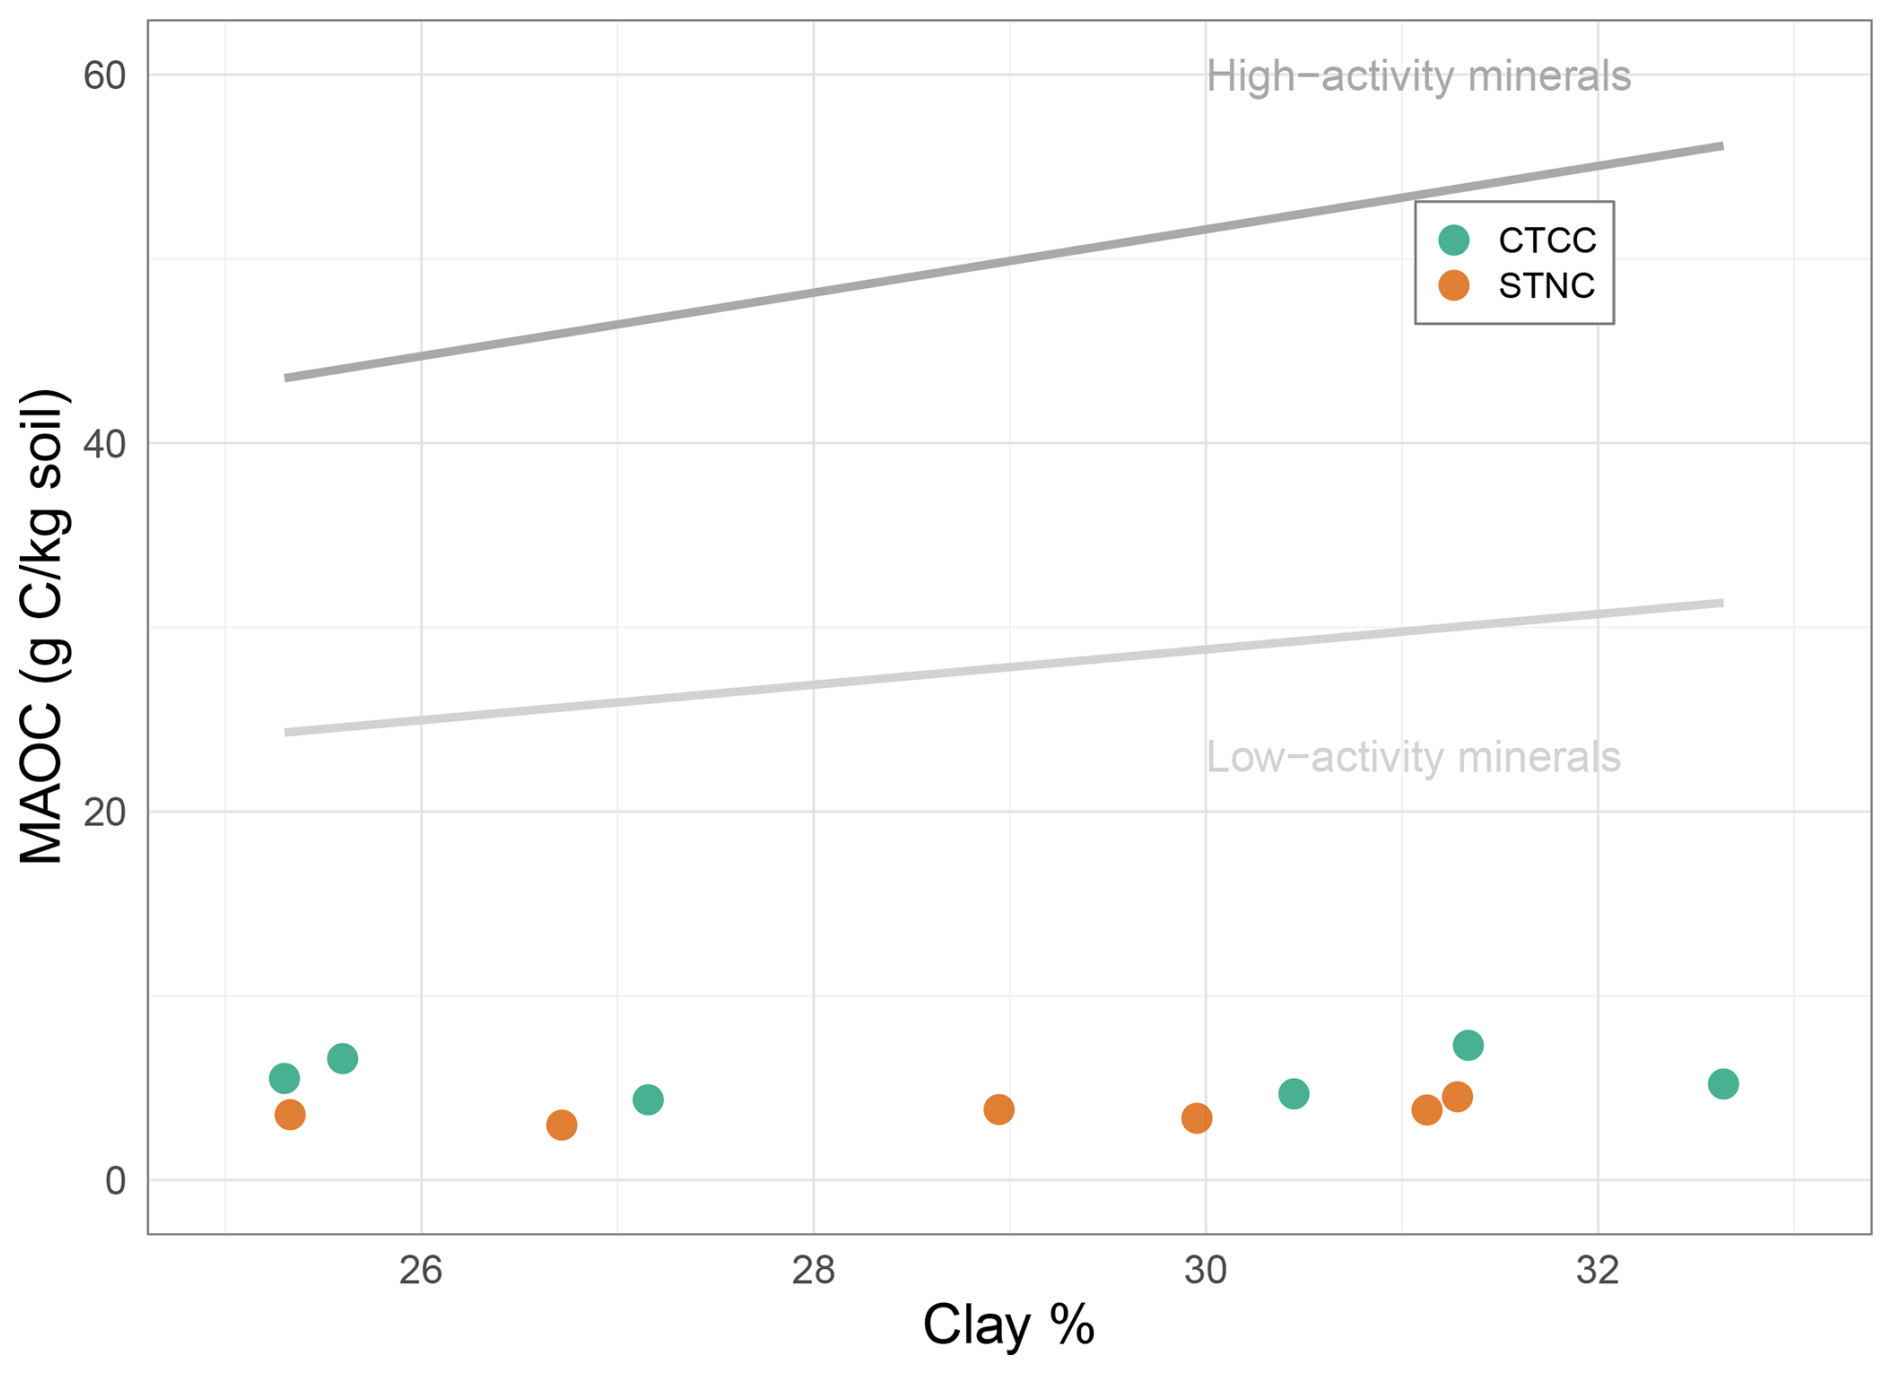
Figure A3Mineral-associated organic carbon content versus clay content under conservation (CTCC, green, n=6) and standard (STNC, orange, n=6) management at 0–10 cm depth. Dashed lines indicate the theoretical maximum carbon storage capacity for high-activity minerals from Georgiou et al. (2022), with the shaded band representing the propagated ±9 mg C g−1 uncertainty in the theoretical maximum. CTCC samples carry higher mineral-fraction carbon than STNC at comparable clay contents, but both treatments remain well below the theoretical capacity, consistent with environmental rather than mineralogical limitation of carbon storage in this Mediterranean system (see Sect. 4.2). Paired t-test, p=0.007.
The raw data and analytical code used to generate all figures and tables presented in this paper are available via Dryad: https://doi.org/10.5061/dryad.pg4f4qs3c (Alvarez‐Sagrero et al., 2026b).
JA contributed to study conceptualization, investigation, formal analysis, and original draft preparation. AAB performed formal data analysis and participated in manuscript review and editing. SSC performed formal data analysis and participated in manuscript review and editing. JM contributed methodology development and formal data analysis. TAG participated in conceptualization, formal data analysis, and both original draft preparation and manuscript review. All contributing authors have provided consent for submission of this manuscript in its current form.
The contact author has declared that none of the authors has any competing interests.
Publisher's note: Copernicus Publications remains neutral with regard to jurisdictional claims made in the text, published maps, institutional affiliations, or any other geographical representation in this paper. The authors bear the ultimate responsibility for providing appropriate place names. Views expressed in the text are those of the authors and do not necessarily reflect the views of the publisher.
We acknowledge financial support from the California Department of Water Resources under Grant Number 4600012156. JA received additional funding through the University of California F3 Innovation Initiative, the Economic Development Administration BBBR iCREATE project, and the USDA Hispanic Serving Institutions Education Grants Program. We extend our gratitude to Yulissa Perez Rojas, Samuel Lee, Lelia Wahab and members of the SIELO laboratory for their valuable assistance with laboratory analyses.
We employed Claude AI (Anthropic, Inc.) during manuscript preparation to enhance grammar, improve flow, and ensure clarity of expression. All AI-generated suggestions were carefully reviewed and modified as appropriate, with the authors maintaining complete responsibility for the final content.
This research has been supported by the Department of Water Resources (grant no. 4600012156).
This paper was edited by Jocelyn Lavallee and reviewed by Jenny Bower and one anonymous referee.
Alvarez‐Sagrero, J., Chacon, S. S., Mitchell, J. P., and Ghezzehei, T. A.: Soil structure changes under reduced tillage and cover cropping enhance carbon mineralization in Mediterranean croplands, Vadose Zone J., 25, e70065, https://doi.org/10.1002/vzj2.70065, 2026a. a
Alvarez-Sagrero, J., Berhe, A. A., Chacon, S., Mitchell, J. P., and Ghezzehei, T.: Data and code from: Two decades of conservation agriculture enhances soil structure, carbon sequestration, and water retention in Mediterranean soils, Dryad [data set and code], https://doi.org/10.5061/dryad.pg4f4qs3c, 2026b. a
Araya, S. N., Mitchell, J. P., Hopmans, J. W., and Ghezzehei, T. A.: Long-term impact of cover crop and reduced disturbance tillage on soil pore size distribution and soil water storage, SOIL, 8, 177–198, https://doi.org/10.5194/soil-8-177-2022, 2022. a, b, c, d, e, f, g, h
Baker, J. B., Southard, R. J., and Mitchell, J. P.: Agricultural Dust Production in Standard and Conservation Tillage Systems in the San Joaquin Valley, J. Environ. Qual., 34, 1260–1269, https://doi.org/10.2134/jeq2003.0348, 2005. a, b
Berhe, A. A., Harden, J. W., Torn, M. S., Kleber, M., Burton, S. D., and Harte, J.: Persistence of soil organic matter in eroding versus depositional landform positions, J. Geophys. Res.-Biogeo., 117, 2011JG001790, https://doi.org/10.1029/2011JG001790, 2012. a
Bienes, R., Marques, M. J., Sastre, B., García-Díaz, A., Esparza, I., Antón, O., Navarrete, L., Hernánz, J. L., Sánchez-Girón, V., Sánchez Del Arco, M. J., and Alarcón, R.: Tracking Changes on Soil Structure and Organic Carbon Sequestration after 30 Years of Different Tillage and Management Practices, Agronomy, 11, 291, https://doi.org/10.3390/agronomy11020291, 2021. a
Blanco-Canqui, H. and Ruis, S. J.: No-tillage and soil physical environment, Geoderma, 326, 164–200, https://doi.org/10.1016/j.geoderma.2018.03.011, 2018. a, b
Bronick, C. J. and Lal, R.: Soil structure and management: a review, Geoderma, 124, 3–22, https://doi.org/10.1016/j.geoderma.2004.03.005, 2005. a, b
Caruso, T., Vries, F. T. D., Bardgett, R. D., and Lehmann, J.: Soil organic carbon dynamics matching ecological equilibrium theory, Ecol. Evol., 8, 11169, https://doi.org/10.1002/ece3.4586, 2018. a, b, c, d, e, f, g, h, i
Christensen, B. T.: Physical fractionation of soil and structural and functional complexity in organic matter turnover, Eur. J.f Soil Sci., 52, 345–353, https://doi.org/10.1046/j.1365-2389.2001.00417.x, 2001. a, b
Dupla, X., Lemaître, T., Grand, S., Gondret, K., Charles, R., Verrecchia, E., and Boivin, P.: On-Farm Relationships Between Agricultural Practices and Annual Changes in Organic Carbon Content at a Regional Scale, Front. Environ. Sci., 10, 834055, https://doi.org/10.3389/fenvs.2022.834055, 2022. a
Francaviglia, R., Almagro, M., and Vicente-Vicente, J. L.: Conservation Agriculture and Soil Organic Carbon: Principles, Processes, Practices and Policy Options, Soil Sys. 7, 17, https://doi.org/10.3390/soilsystems7010017, 2023. a
Friedlingstein, P., O'Sullivan, M., Jones, M. W., Andrew, R. M., Hauck, J., Landschützer, P., Le Quéré, C., Li, H., Luijkx, I. T., Olsen, A., Peters, G. P., Peters, W., Pongratz, J., Schwingshackl, C., Sitch, S., Canadell, J. G., Ciais, P., Jackson, R. B., Alin, S. R., Arneth, A., Arora, V., Bates, N. R., Becker, M., Bellouin, N., Berghoff, C. F., Bittig, H. C., Bopp, L., Cadule, P., Campbell, K., Chamberlain, M. A., Chandra, N., Chevallier, F., Chini, L. P., Colligan, T., Decayeux, J., Djeutchouang, L. M., Dou, X., Duran Rojas, C., Enyo, K., Evans, W., Fay, A. R., Feely, R. A., Ford, D. J., Foster, A., Gasser, T., Gehlen, M., Gkritzalis, T., Grassi, G., Gregor, L., Gruber, N., Gürses, Ö., Harris, I., Hefner, M., Heinke, J., Hurtt, G. C., Iida, Y., Ilyina, T., Jacobson, A. R., Jain, A. K., Jarníková, T., Jersild, A., Jiang, F., Jin, Z., Kato, E., Keeling, R. F., Klein Goldewijk, K., Knauer, J., Korsbakken, J. I., Lan, X., Lauvset, S. K., Lefèvre, N., Liu, Z., Liu, J., Ma, L., Maksyutov, S., Marland, G., Mayot, N., McGuire, P. C., Metzl, N., Monacci, N. M., Morgan, E. J., Nakaoka, S.-I., Neill, C., Niwa, Y., Nützel, T., Olivier, L., Ono, T., Palmer, P. I., Pierrot, D., Qin, Z., Resplandy, L., Roobaert, A., Rosan, T. M., Rödenbeck, C., Schwinger, J., Smallman, T. L., Smith, S. M., Sospedra-Alfonso, R., Steinhoff, T., Sun, Q., Sutton, A. J., Séférian, R., Takao, S., Tatebe, H., Tian, H., Tilbrook, B., Torres, O., Tourigny, E., Tsujino, H., Tubiello, F., van der Werf, G., Wanninkhof, R., Wang, X., Yang, D., Yang, X., Yu, Z., Yuan, W., Yue, X., Zaehle, S., Zeng, N., and Zeng, J.: Global Carbon Budget 2024, Earth Syst. Sci. Data, 17, 965–1039, https://doi.org/10.5194/essd-17-965-2025, 2025. a
Georgiou, K., Jackson, R. B., Vindušková, O., Abramoff, R. Z., Ahlström, A., Feng, W., Harden, J. W., Pellegrini, A. F. A., Polley, H. W., Soong, J. L., Riley, W. J., and Torn, M. S.: Global stocks and capacity of mineral-associated soil organic carbon, Nat. Commun., 13, 3797, https://doi.org/10.1038/s41467-022-31540-9, 2022. a, b, c, d, e, f, g, h
Golchin, A., Oades, J., Skjemstad, J., and Clarke, P.: Study of free and occluded particulate organic matter in soils by solid state 13C Cp/MAS NMR spectroscopy and scanning electron microscopy, Soil Res., 32, 285, https://doi.org/10.1071/SR9940285, 1994. a
Gomes, A., DeVincentis, A. J., Solis, S. S., Zaccaria, D., Munk, D., Bali, K., Shrestha, A., Gould, K., and Mitchell, J.: Long-term reduced tillage and winter cover crops can improve soil quality without depleting moisture, California Agriculture, 77, 4–14, https://doi.org/10.3733/ca.2023a0001, 2023. a, b
Jilling, A., Kane, D., Williams, A., Yannarell, A. C., Davis, A., Jordan, N. R., Koide, R. T., Mortensen, D. A., Smith, R. G., Snapp, S. S., Spokas, K. A., and Stuart Grandy, A.: Rapid and distinct responses of particulate and mineral-associated organic nitrogen to conservation tillage and cover crops, Geoderma, 359, 114001, https://doi.org/10.1016/j.geoderma.2019.114001, 2020. a
Kleber, M., Nico, P. S., Plante, A., Filley, T., Kramer, M., Swanston, C., and Sollins, P.: Old and stable soil organic matter is not necessarily chemically recalcitrant: implications for modeling concepts and temperature sensitivity, Glob. Change Biol., 17, 1097–1107, https://doi.org/10.1111/j.1365-2486.2010.02278.x, 2011. a
Lavallee, J. M., Soong, J. L., and Cotrufo, M. F.: Conceptualizing soil organic matter into particulate and mineral‐associated forms to address global change in the 21st century, Glob. Change Biol., 26, 261–273, https://doi.org/10.1111/gcb.14859, 2020. a, b, c
Lee, S., Chu, M. L., Guzman, J. A., and Botero-Acosta, A.: A comprehensive modeling framework to evaluate soil erosion by water and tillage, J. Environ. Manage., 279, 111631, https://doi.org/10.1016/j.jenvman.2020.111631, 2021. a
Lessmann, M., Ros, G. H., Young, M. D., and De Vries, W.: Global variation in soil carbon sequestration potential through improved cropland management, Glob. Change Biol., 28, 1162–1177, https://doi.org/10.1111/gcb.15954, 2022. a
Leuthold, S., Lavallee, J. M., Haddix, M. L., and Cotrufo, M. F.: Contrasting properties of soil organic matter fractions isolated by different physical separation methodologies, Geoderma, 445, 116870, https://doi.org/10.1016/j.geoderma.2024.116870, 2024. a
Liu, A., Ma, B. L., and Bomke, A. A.: Effects of Cover Crops on Soil Aggregate Stability, Total Organic Carbon, and Polysaccharides, Soil Sci. Soc. Am. J., 69, 2041–2048, https://doi.org/10.2136/sssaj2005.0032, 2005. a
Liu, M., Zheng, S., Pendall, E., Smith, P., Liu, J., Li, J., Fang, C., Li, B., and Nie, M.: Unprotected carbon dominates decadal soil carbon increase, Nat. Commun., 16, 2008, https://doi.org/10.1038/s41467-025-57354-z, 2025. a, b, c, d, e
Liu, X., Wu, X., Liang, G., Zheng, F., Zhang, M., and Li, S.: A global meta‐analysis of the impacts of no‐tillage on soil aggregation and aggregate‐associated organic carbon, Land Degrad. Dev., 32, 5292–5305, https://doi.org/10.1002/ldr.4109, 2021. a
Mainka, M., Summerauer, L., Wasner, D., Garland, G., Griepentrog, M., Berhe, A. A., and Doetterl, S.: Soil geochemistry as a driver of soil organic matter composition: insights from a soil chronosequence, Biogeosciences, 19, 1675–1689, https://doi.org/10.5194/bg-19-1675-2022, 2022. a
Margenot, A. J., Parikh, S. J., and Calderón, F. J.: Fourier‐transform infrared spectroscopy for soil organic matter analysis, Soil Sci. Soc. Am. J., 87, 1503–1528, https://doi.org/10.1002/saj2.20583, 2023. a, b, c, d
Mitchell, J. P., Shrestha, A., Horwath, W. R., Southard, R. J., Madden, N., Veenstra, J., and Munk, D. S.: Tillage and Cover Cropping Affect Crop Yields and Soil Carbon in the San Joaquin Valley, California, Agron. J., 107, 588–596, https://doi.org/10.2134/agronj14.0415, 2015. a, b, c, d, e
Mitchell, J. P., Shrestha, A., Mathesius, K., Scow, K. M., Southard, R. J., Haney, R. L., Schmidt, R., Munk, D. S., and Horwath, W. R.: Cover cropping and no-tillage improve soil health in an arid irrigated cropping system in California’s San Joaquin Valley, USA, Soil Till. Res., 165, 325–335, https://doi.org/10.1016/j.still.2016.09.001, 2017. a, b, c, d, e, f, g, h, i
Mitchell, J. P., Jackson, L. E., Reicosky, D. C., Kassam, A., Shrestha, A., Harben, R., Miyao, E. M., Scow, K. M., Sposito, G., Beck, D., Friedrich, T., Mitchell, A. S., Schmidt, R., Park, S., Park, B., Foster, P., Muller, P., Brait, A., Willey, T., Bottens, M., Crum, C., Giacomazzi, D., Barcellos, T., Crowell, M. V., Roy, R., Ferris, H., Chiartas, J. L., Brennan, E., Gaudin, A., Diener, J., Diener, J., Asgill, L., Kueneman, E. A., Fisher, J., Bartz, M., Peiretti, R. A., Derpsch, R., Landers, J., Aegerter, B. J., Leinfelder‐Miles, M., Light, S. E., McPhee, J., and Branco, R. B. F.: The key role of local and global farmer networks in the development of conservation agriculture in California, J. Environ. Qual., jeq2.70039, https://doi.org/10.1002/jeq2.70039, 2025. a
Nimmo, J. R. and Perkins, K. S.: 2.6 Aggregate Stability and Size Distribution, in: Methods of Soil Analysis, John Wiley & Sons, Ltd, 317–328, ISBN 978-0-89118-893-3, https://doi.org/10.2136/sssabookser5.4.c14, 2002. a
Paustian, K., Collier, S., Baldock, J., Burgess, R., Creque, J., DeLonge, M., Dungait, J., Ellert, B., Frank, S., Goddard, T., Govaerts, B., Grundy, M., Henning, M., Izaurralde, R. C., Madaras, M., McConkey, B., Porzig, E., Rice, C., Searle, R., Seavy, N., Skalsky, R., Mulhern, W., and Jahn, M.: Quantifying carbon for agricultural soil management: from the current status toward a global soil information system, Carbon Manage., 10, 567–587, https://doi.org/10.1080/17583004.2019.1633231, 2019. a
Peters, A., Hohenbrink, T. L., Iden, S. C., and Durner, W.: A Simple Model to Predict Hydraulic Conductivity in Medium to Dry Soil From the Water Retention Curve, Water Resour. Res., 57, e2020WR029211, https://doi.org/10.1029/2020WR029211, 2021. a
Poeplau, C., Don, A., Six, J., Kaiser, M., Benbi, D., Chenu, C., Cotrufo, M. F., Derrien, D., Gioacchini, P., Grand, S., Gregorich, E., Griepentrog, M., Gunina, A., Haddix, M., Kuzyakov, Y., Kühnel, A., Macdonald, L. M., Soong, J., Trigalet, S., Vermeire, M.-L., Rovira, P., van Wesemael, B., Wiesmeier, M., Yeasmin, S., Yevdokimov, I., and Nieder, R.: Isolating organic carbon fractions with varying turnover rates in temperate agricultural soils – A comprehensive method comparison, Soil Biol. Biochem., 125, 10–26, https://doi.org/10.1016/j.soilbio.2018.06.025, 2018. a, b, c, d
R Core Team: R: A Language and Environment for Statistical Computing, R Foundation for Statistical Computing, Vienna, Austria, https://www.R-project.org/ (last access: 26 September 2026), 2025. a
Sanderman, J., Hengl, T., and Fiske, G. J.: Soil carbon debt of 12,000 years of human land use, P. Natl. Acad. Sci. USA, 114, 9575–9580, https://doi.org/10.1073/pnas.1706103114, 2017. a, b
Schmidt, R., Mitchell, J., and Scow, K.: Cover cropping and no-till increase diversity and symbiotroph:saprotroph ratios of soil fungal communities, Soil Biol. Biochem., 129, 99–109, https://doi.org/10.1016/j.soilbio.2018.11.010, 2019. a
Six, J., Conant, R. T., Paul, E. A., and Paustian, K.: Stabilization mechanisms of soil organic matter: Implications for C-saturation of soils, Plant Soil, 241, 155–176, https://doi.org/10.1023/A:1016125726789, 2002. a
Six, J., Bossuyt, H., Degryze, S., and Denef, K.: A history of research on the link between (micro)aggregates, soil biota, and soil organic matter dynamics, Soil Till. Res., 79, 7–31, https://doi.org/10.1016/j.still.2004.03.008, 2004. a, b
Soil Survey Staff, Natural Resources Conservation Service, United States Department of Agriculture: Web Soil Survey, https://websoilsurvey.nrcs.usda.gov/app/, last access: 25 August 2023. a
Stewart, C. E., Paustian, K., Conant, R. T., Plante, A. F., and Six, J.: Soil carbon saturation: Implications for measurable carbon pool dynamics in long-term incubations, Soil Biol. Biochem., 41, 357–366, https://doi.org/10.1016/j.soilbio.2008.11.011, 2009. a
Swanston, C. W., Torn, M. S., Hanson, P. J., Southon, J. R., Garten, C. T., Hanlon, E. M., and Ganio, L.: Initial characterization of processes of soil carbon stabilization using forest stand-level radiocarbon enrichment, Geoderma, 128, 52–62, https://doi.org/10.1016/j.geoderma.2004.12.015, 2005. a
Tian, J., Dungait, J. A. J., Hou, R., Deng, Y., Hartley, I. P., Yang, Y., Kuzyakov, Y., Zhang, F., Cotrufo, M. F., and Zhou, J.: Microbially mediated mechanisms underlie soil carbon accrual by conservation agriculture under decade-long warming, Nat. Commun.s, 15, 377, https://doi.org/10.1038/s41467-023-44647-4, 2024. a, b, c, d
Tisdall, J. M. and Oades, J. M.: Organic matter and water‐stable aggregates in soils, J. Soil Sci., 33, 141–163, https://doi.org/10.1111/j.1365-2389.1982.tb01755.x, 1982. a, b
Van Genuchten, M. T.: A Closed-form Equation for Predicting the Hydraulic Conductivity of Unsaturated Soils 1, Soil Sci. Soc. Am. J., 44, 892–898, https://doi.org/10.2136/sssaj1980.03615995004400050002x, 1980. a
Veenstra, J. J., Horwath, W. R., and Mitchell, J. P.: Tillage and Cover Cropping Effects on Aggregate-Protected Carbon in Cotton and Tomato, Soil Sci. Soc. Am. J., 71, 362–371, https://doi.org/10.2136/sssaj2006.0229, 2007. a, b, c, d
West, T. O. and Post, W. M.: Soil Organic Carbon Sequestration Rates by Tillage and Crop Rotation: A Global Data Analysis, Soil Sci. Soc. Am. J., 66, 1930–1946, https://doi.org/10.2136/sssaj2002.1930, 2002. a, b, c, d, e
Yang, J., Rahardja, S., and Fränti, P.: Outlier detection: how to threshold outlier scores?, in: Proceedings of the International Conference on Artificial Intelligence, Information Processing and Cloud Computing, ACM, Sanya China, 1–6, https://doi.org/10.1145/3371425.3371427, 2019. a