
the Creative Commons Attribution 4.0 License.
the Creative Commons Attribution 4.0 License.
 | 23 Sep 2026
Soil moisture as the dominant driver of CO2 efflux in Mediterranean urban green spaces: evidence for a Gaussian temperature response and mechanistic modelling of moisture and temperature interactions
Teresa Alía

Abel Sánchez-Jiménez
Rubén Abad-Calderón
Miguel Ángel Casermeiro
Soil respiration is a key component of the global carbon cycle, yet its dynamics in urban Mediterranean environments remain poorly understood. This study investigated the effects of soil temperature, soil moisture, and plant community on soil CO2 efflux in urban green spaces of Madrid (Spain), characterized by a Mediterranean pluvioseasonal-oceanic bioclimate with pronounced summer drought. Four dominant ruderal plant communities (Diplotaxis virgata, Hordeum leporinum, Malva spp., and Dactylis glomerata) were monitored across three urban green spaces. Soil CO2 efflux, temperature, and moisture were measured biweekly over one year using an infrared gas analyzer. Contrary to the Q10 exponential assumption, soil respiration showed a Gaussian relationship with temperature, with a positive correlation below a breakpoint of 18.4 °C and a negative effect above this threshold, consistent across plant communities. Soil respiration exhibited a positive exponential relationship with soil moisture and a logarithmic relationship with a rewetting index for values below 20. A mechanistic model described soil respiration as the joint outcome of temperature-driven moisture loss and moisture-stimulated CO2 emissions. Plant community identity had a limited effect, with the exception of Malva spp., which consistently produced higher emissions. These findings challenge the universal applicability of temperature-based respiration models and highlight soil moisture as the dominant driver of CO2 efflux in water-limited urban ecosystems. As climate change is expected to intensify both the urban heat island effect and summer drought in Mediterranean cities, soil moisture emerges as a critical variable for projecting urban soil CO2 fluxes and for designing evidence-based management strategies for Mediterranean urban green spaces, including improved soil infiltration capacity, moisture-sensitive irrigation planning, and the incorporation of moisture-temperature coupling into urban carbon monitoring protocols.
- Article
(10944 KB) - Full-text XML
-
Supplement
(478 KB) - BibTeX
- EndNote


The urban heat island (UHI) effect, the systematic elevation of temperatures in cities relative to surrounding rural areas, is one of the most documented consequences of urbanization, with profound implications for local climate, ecosystem functioning, and biogeochemical cycles (Oke, 1973; Luber and McGeehin, 2008; Tautenhahn et al., 2026). Among these cycles, soil respiration (SR) represents a major pathway of CO2 flux from terrestrial ecosystems to the atmosphere (Davidson et al., 2002; Bond-Lamberty and Thomson, 2010; Decina et al., 2016), yet its dynamics under urban thermal and moisture regimes remain poorly understood. While numerous studies have investigated the environmental controls of SR in natural and agricultural systems (Chen et al., 2014; Jian et al., 2018, 2021), showing that seasonal CO2 emissions are mainly driven by soil temperature (SST) (Hibbard et al., 2005), the extent to which the UHI modifies these relationships in urban soils has received comparatively little attention. The Q10 function, an exponential model describing SR as a function of temperature, remains the most widely used approach for SR prediction (Hashimoto et al., 2015; Lloyd and Taylor, 1994; Todd-Brown et al., 2013), but its applicability under the altered thermal and hydrological conditions of urban environments has rarely been tested.
However, assuming a constant temperature sensitivity of SR across all temperature ranges lacks ecological realism, as previously shown in mesic (Curiel Yuste et al., 2004; Lloyd and Taylor, 1994) and especially in water-limited ecosystems (Almagro et al., 2009; González-Ubierna et al., 2014; León et al., 2014). In such drought-prone systems, SST and soil moisture (SSM) often interact to regulate SR, with the process responding primarily to the most limiting factor (Correia et al., 2012; Almagro et al., 2009; Oyonarte et al., 2012).
Urban soils represent a particular case that is gaining increasing attention. Despite their importance, only a few studies have quantified soil CO2 efflux in urban environments, mostly in temperate regions (Goncharova et al., 2020). Urban areas typically exhibit higher and more variable surface temperatures due to the urban heat island (UHI) effect compared with nearby rural or natural areas (Shi et al., 2012). In Mediterranean climates, however, the UHI effect is partially reversed, moderating cold winter temperatures more than summer heat, while rural zones may still experience extreme summer heat (Vardoulakis et al., 2013; Donateo et al., 2023). Under such conditions, SSM is expected to play a decisive role in SR dynamics. Although SR is generally constrained by low SSM during summer droughts, rewetting events often trigger abrupt and substantial CO2 pulses (Jarvis et al., 2007; Unger et al., 2012; Matteucci et al., 2015).
These pulses are largely driven by soil biotic parameters (Fierer and Schimel, 2002). The relative influence of climatic, edaphic, and biotic factors (e.g., vegetation type, productivity, litterfall) on SR therefore remains an open question (Tang et al., 2020a; Yan et al., 2015). Vegetation can affect SR both directly, through its influence on soil carbon input and quality (Luo and Zhou, 2006; Yan et al., 2015), and indirectly, by modifying the soil microclimate, reducing temperature and evaporation and intercepting precipitation (Reichstein et al., 2002).
Some studies have compared SR across ecosystems (Tang et al., 2020b), but there is still a lack of research focused on microscale interactions among SR, climate, and biotic variables, especially in urban environments. In such human-modified systems, soils, microclimate, and vegetation structure are strongly altered by anthropogenic activities (Sæbø et al., 2003; Alía et al., 2025). These alterations affect soil quality (through contaminant deposition and recreational land use) and physical characteristics (e.g., compaction, artifacts) (Rebele, 1994; Sukopp and Werner, 1983), with significant implications for soil biogeochemical cycles and CO2 emissions.
Despite these differences, SR in urban environments is frequently assumed to behave similarly to that in natural or rural systems (Karvinen et al., 2024). As a result, the influence of human-induced changes on soil CO2 fluxes remains poorly understood. Microbial respiration, a major contributor to these fluxes, is known to be strongly affected by SST (Kaye et al., 2004; Lloyd and Taylor, 1994; Tomar and Baishya, 2020), yet this relationship has been scarcely examined in urban soils (Vasenev et al., 2021). While a few studies have explored microbial respiration in urban soils (Ghosh et al., 2016; Ivashchenko et al., 2019), spatially explicit datasets remain limited, hindering our understanding of how urban climate, particularly the UHI, affects microbial CO2 emissions, especially in Mediterranean contexts (Vasenev et al., 2021). Moreover, there is a growing need to assess the temporal dynamics of SR responses to environmental drivers within stands dominated by specific plant communities (Chen et al., 2013).
Climate change is expected to exacerbate the UHI effect, as increasing global temperatures enhance heat accumulation in urban areas (Oke, 1973; Luber and McGeehin, 2008). This intensified warming alters soil thermal regimes and moisture dynamics, potentially influencing SR – particularly in densely built environments and megacities (Argüeso et al., 2015; IPCC, 2018). Understanding these interactions is therefore essential to accurately assess CO2 fluxes in urban landscapes.
We hypothesized that SR in Mediterranean urban systems is significantly influenced by both SST and SSM, and that biotic factors such as plant community composition modulate these relationships. To test this hypothesis, we continuously monitored SR in the four most abundant frequent plant communities within Mediterranean urban green spaces in Madrid, measuring soil CO2 efflux, SST, and SSM quarterly over one year across three urban sites.
2.1 Study area
Three public greenspaces from Madrid city were selected, based on the objective of covering the diversity of habitats, human uses as well as the perimeter of the city and soils around Madrid as much as possible. It is well known that soils in these public urban green areas are subjected to a wide variety of anthropogenic pressures due to the different population activities that take place in greenspaces such as sports or leisure activities. Thus, soils in the green areas aforementioned are classified as Anthrosols (ATu). However, areas that are less exposed to human influences and that have soil conditions that are closer to natural ones are classified as calcareous Luvisols (Lvk) (Quintana et al., 2022). The location of the three greenspaces chosen for this study is shown in Fig. 1.
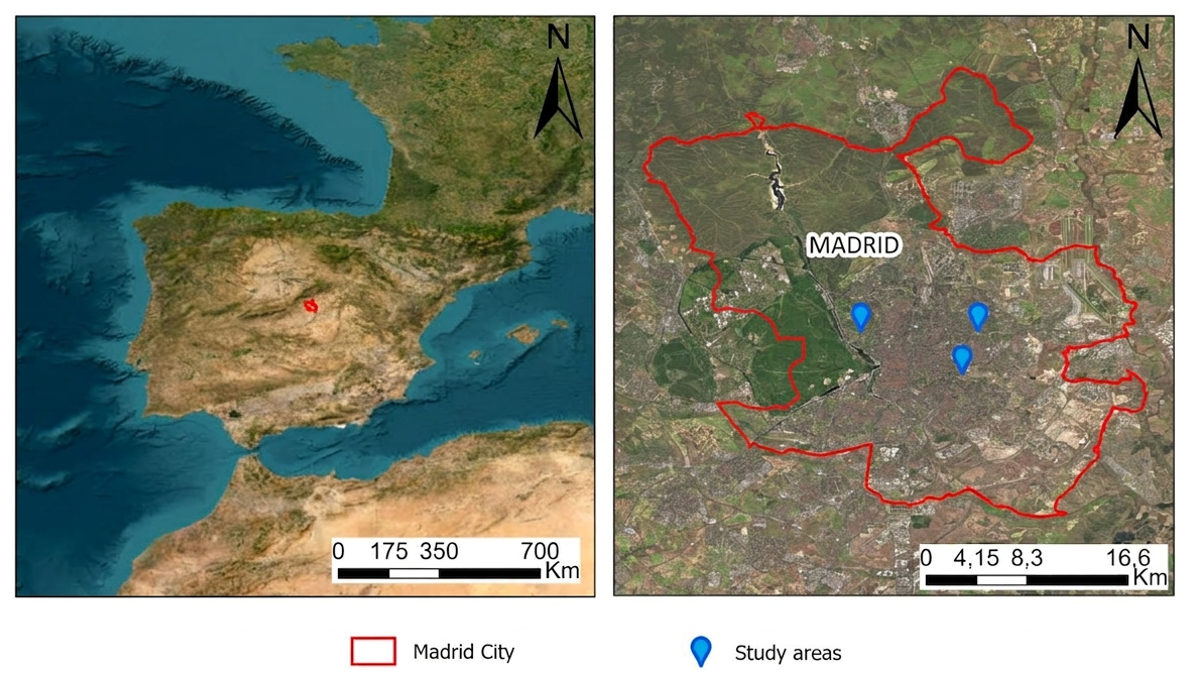
Figure 1Location of the urban green spaces monitored during the study in relation to Madrid municipality boundary. (a) Location of Madrid within the Iberian Peninsula. (b) Location of the three study areas within Madrid city limits. Satellite imagery: © Instituto Geográfico Nacional de España (IGN), CC BY 4.0.
Madrid city exhibits a typical Mediterranean pluvioseasonal-oceanic bioclimate and is located within an arid meso-Mediterranean belt (Rivas-Martínez et al., 2011). Madrid climate is defined by prominent contrasts, both diurnal and seasonal, with a severe drought period occurring during the summer months. The mean annual temperature is 19 °C and the average annual rainfall is 430 mm.
The three study sites (Ciudad Universitaria, La Elipa and Pinar de Conde Orgaz) spanned approximately 1.9, 0.8 and 0.5 km along their longest axis, respectively. Within each site, the four plant communities occurred as naturally distributed ruderal patches rather than in a fixed spatial arrangement, and three replicate sampling points were established within each community's patch.
2.2 Experimental design
Four plant communities were chosen after analysing the herbaceous plant matrix of the selected urban green spaces. These communities are among the most commonly found in such spaces in the Mediterranean region. The selected plant communities were: annual herbs dominated by Diplotaxis virgata (AH-D); annual grasslands dominated by Hordeum leporinum (AG-H); perennial herbs dominated by Malva spp. (PH-M); and perennial grasslands dominated by Dactylis glomerata (PG-D). At each of the three study sites, three replicate sampling points were established for each of the four plant communities (3 replicates × 4 communities = 12 sampling points per site; total n=36 sampling points across the study). The geographic coordinates of all sampling points are provided in Table S1 in the Supplement.
Soil heterotrophic respiration data (µmol CO2 m−2 s−1) were taken fortnightly over 1 year. Soil respiration samples were measured in situ from spring April 2023 to April 2024, using an automated system (infrared gas analyser model LI-8100; LI-COR Inc., Lincoln, NE, USA) with an open chamber of diameter 20 cm (Savage and Davidson, 2003). Three PVC cylinders 20 cm in diameter were randomly installed on each plot at a depth of 5 cm, 10 d before the first measure, to be sampled with the chamber. Any spontaneous vegetation was removed before each measurement. To ensure adequate coverage of the diurnal temperature range and avoid systematic timing bias between sites, the order in which the three parks were visited was systematically rotated so that each sampling campaign began at a different park. Within each park, the order of visiting the 12 sampling points (4 plant communities × 3 replicates) was randomized using a 12-sided die. Measurements were carried out between 08:00 and 18:00–19:00 local time, depending on fieldwork duration on a given day. This sampling intensity was designed to monitor the annual and daily variations in soil CO2 emission rate.
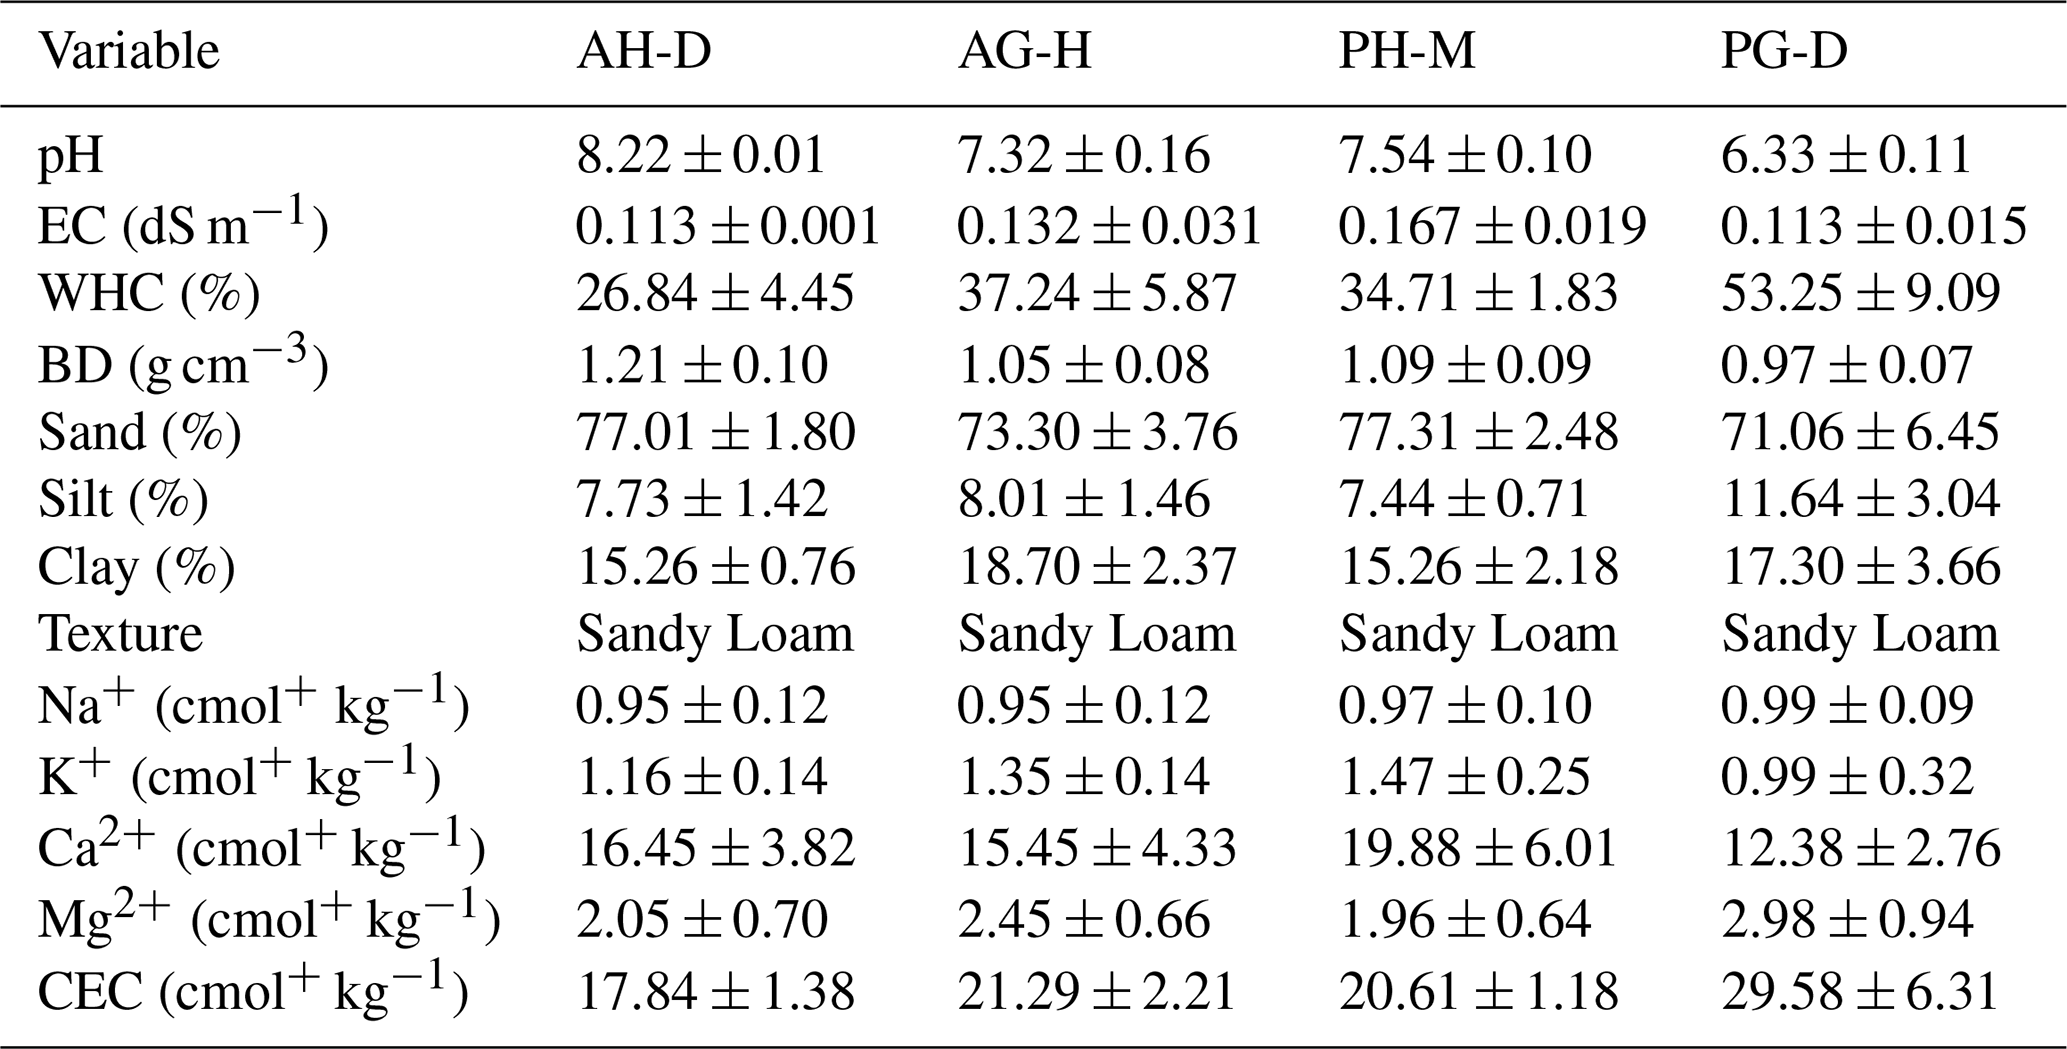
Prior to the start of the monitoring period, soil samples were collected from each plant community at each study site (n=3 per community) to characterize the main physicochemical properties of the soils. Soil pH, electrical conductivity (EC), bulk density (BD), water holding capacity (WHC), texture, cation exchange capacity (CEC) and exchangeable bases (Na+, K+, Ca2+, Mg2+) were determined following the standard procedures described by the International Soil Reference and Information Centre (ISRIC) (Van Reeuwijk, 2002). All soils were classified as Sandy Loam according to the USDA textural triangle. The physicochemical characteristics of the soils are summarized in Table 1.
Table 1Main soil physicochemical characteristics (mean ± SE, n=3) per plant community. AH-D: annual herbs dominated by Diplotaxis virgata; AG-H: annual grasslands dominated by Hordeum leporinum; PH-M: perennial herbs dominated by Malva spp.; PG-D: perennial grasslands dominated by Dactylis glomerata. BD: bulk density; WHC: water holding capacity; CEC: cation exchange capacity; EC: electrical conductivity.
2.3 Data analysis
Soil temperature (SST – in °C),moisture (SSM – in %) and evapotranspiration (EV – in mmol mol−1) were measured simultaneously with CO2 using chamber equipment, while hourly data on atmospheric moisture (AM – in %) and temperature (AT – in °C) were obtained from Ciudad Universitaria weather station (Code: 3194U) for the green space at the same location (maximum distance of 0.5 km), and from Barajas Airport weather station (Code: 3129) for the other two spaces: La Elipa and Pinar de Conde Orgaz, which are located 9.5 and 6.4 km from the station, respectively (data provided by the National Meteorological Agency, AEMET).
The rewetting index (RWi) was calculated, in mm d−1, following Almagro et al. (2009) using the expression (Eq. 1):
where RWi is the rewetting index, P is precipitation (mm), and t is the time elapsed between rainfall event and SR measurement (days).
General linear models were developed to assess the effect of ambient variables (AT, SST, AM, SSM and RWi) on CO2 and Evapotranspiration levels. Plant community was also included as a factor to check differences on dependent variables among them. Once the community factor was significant, pairwise comparisons were done by means of Tukey's post hoc tests (Lenth, 2025). Both dependent variables were log-transformed to satisfy the assumptions required for regression analysis (i.e. both normality and homoscedasticity). To avoid lack of independence between communities within the same plot, a random intercept was included in all models taking the plot as a grouping variable (Bates et al., 2015). To find a change in the slope of dependent variables, piecewise regression was done with every independent factor by means of the R segmented package (Fasola et al., 2018). The standard error and 95 % confidence interval of the estimated breakpoint were obtained using the confint.segmented() function of the R segmented package. The NLS function on r was used to fit data to the non linear model developed. All analyses were carried out on R language software (version 4.5.2, R Core Team, 2025) under RStudio environment (version 2025.9.1.401, Posit Team, 2025). Significant level was set at α=0.05 for all analysis
2.4 Soil respiration model
The change in CO2 soil emissions with soil temperature is due to two independent processes. In the absence of moisture, it would decrease proportional to the actual level at a rate of cT but moisture would interact with it to increase CO2 soil emissions at a rate of cM. This leads to the ordinary differential equation (Eq. 2):
where C(T) represents the amount of CO2 soil emissions at a certain soil temperature T and M(T) soil moisture with, in turn, also depends on T (Eq. 3):
With solution (Eq. 4):
where M0 is the soil moisture level at T=0 and mT the decreasing rate of moisture as a function of temperature. Substituting Eq. (4) on Eq. (2) and solving (Eq. 5):
where C0 represents the “basal” CO2 soil emissions i.e., at T=0.
This function reaches a maximum at (Eq. 6):
where reach a maximum respiration of (Eq. 7):
The purpose of this analysis was not to estimate population-level or plot-level effects, nor to quantify between-plot variance, but to test whether the theoretically derived functional form could reproduce the observed relationship between soil respiration and soil temperature. To assess whether this conclusion was robust to potential temporal autocorrelation in the repeated measurements, we additionally fitted a nonlinear mixed-effects version of the model, including plot as a random effect and alternative temporal correlation structures (see Sect. 3.4).
Soils were notably homogeneous in texture across all sites and plant communities, with sand content ranging from 71 % to 77 %. The most notable differences between communities were observed in pH, which was consistently higher in AH-D soils (8.22 ± 0.01) and lower in PG-D soils (6.33 ± 0.11), and in WHC, which was markedly higher in PG-D communities (53.25 ± 9.09 %), reflecting the greater root biomass and organic matter accumulation typically associated with perennial grasslands.
3.1 Yearly evolution of the variables under the vegetation communities
The evolution of the measured climatic variables followed the classic Mediterranean behaviour, characterized by warm and dry summers, and cold winters (Fig. 2). As pointed out, the thermal amplitude was clearly smaller than the average for the peri-urban and non-urban parts of Madrid region (AEMET dataset, 2023 and 2024). A parallel trend was observed between soil and atmospheric conditions, particularly for temperatures, where the relationship was more pronounced. As expected, the data revealed that soil temperatures were consistently higher than atmospheric temperatures, both annually and seasonally. Meanwhile, there were no differences in the annual values of moisture. However, SSM showed higher values in winter and lower values in summer and spring compared to atmospheric moisture.
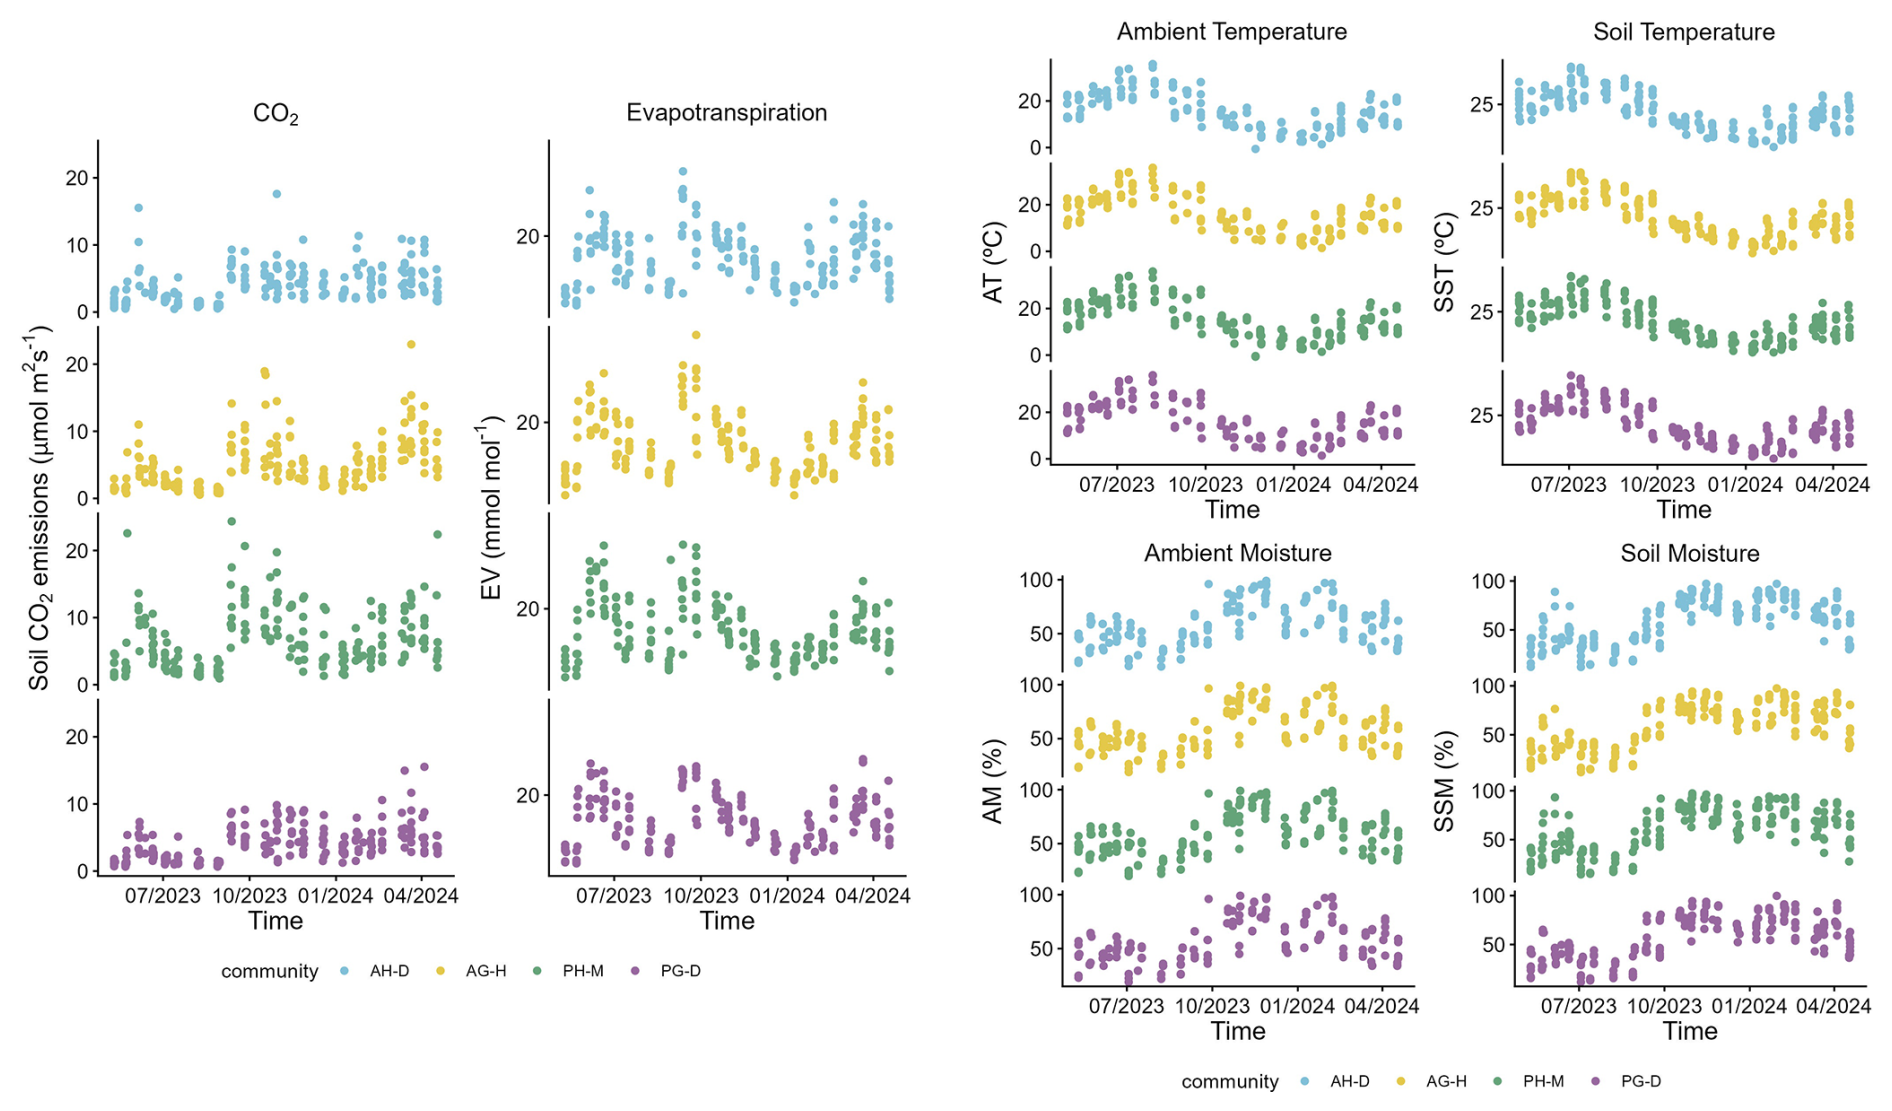
Figure 2Scatter plots showing climate variables values over time for the four plant communities.
Soil CO2 emissions and soil evapotranspiration exhibited a consistent pattern across all plant communities, with only minor variations observed. PG-D demonstrated the most stable rates (both soil respiration and evapotranspiration), while PH-M exhibited the greatest variability. The annual plant communities, for their part, displayed relatively similar emission behaviour throughout the year (Fig. 2).
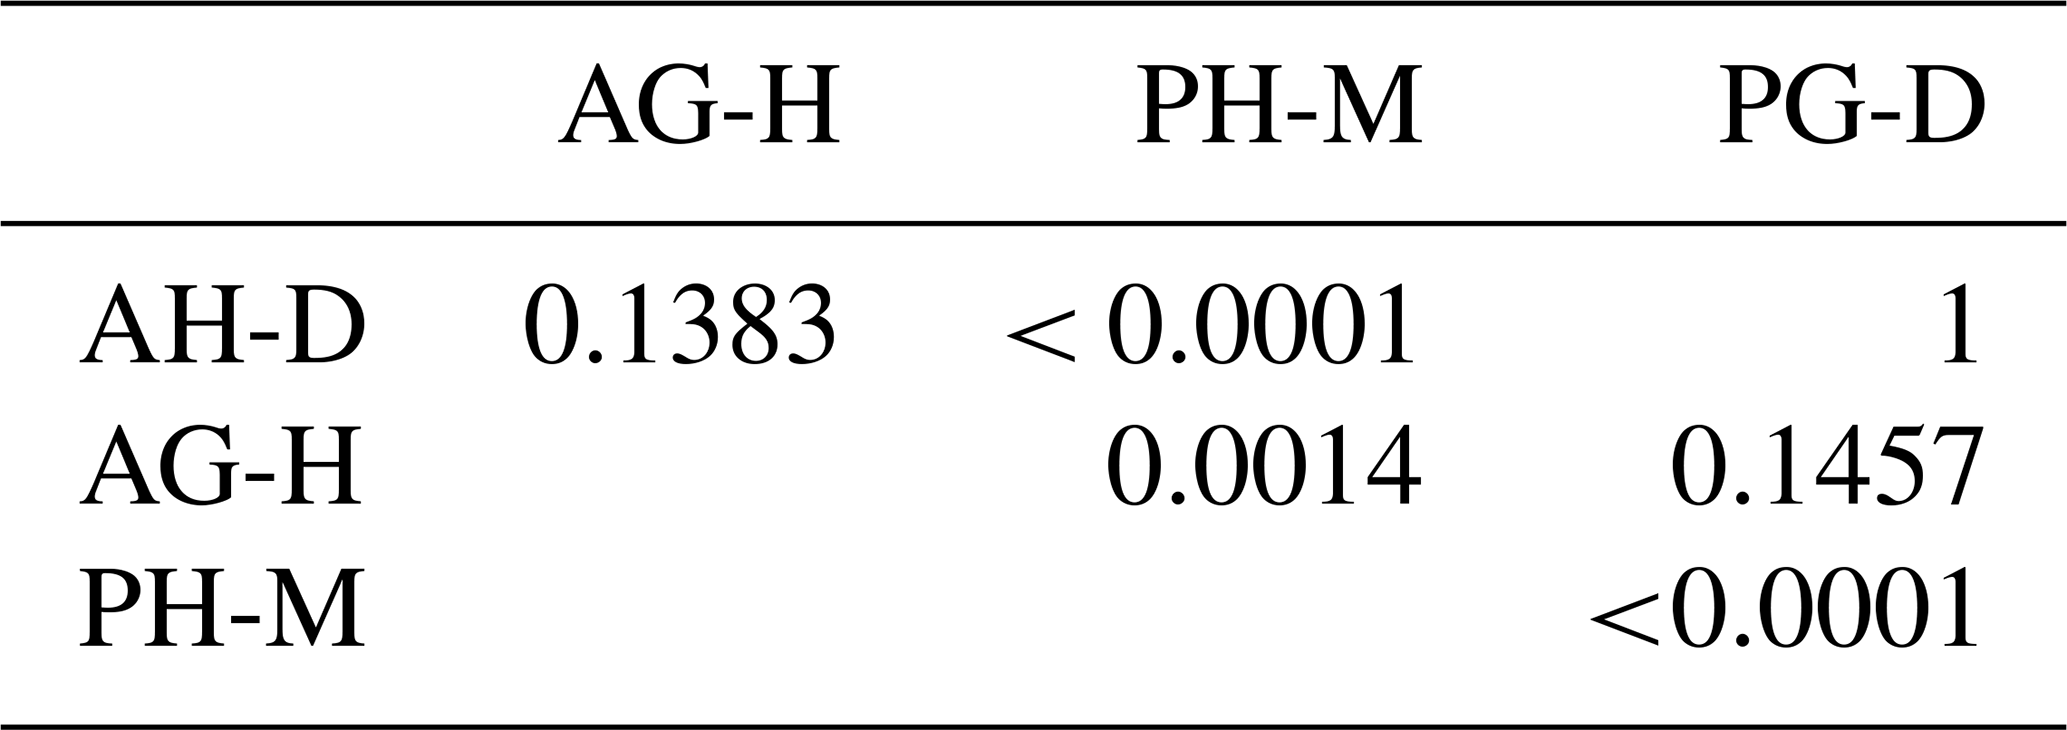
As expected, soil climate (SST and SSM) under the analysed plan communities showed no significant differences in temperature, moisture and evapotranspiration (Table 2). Additionally, no differences in soil respiration were found, with the only exception of PH-M, producing higher soil CO2 emission rates than the other communities (Fig. 3 and Table 3).
Table 2p-values for differences between communities for each climate variable: EV: Soil evapotranspiration (mmol mol−1). AT: Atmospheric temperature (°C). SST: Soil surface temperature (°C). AM: Atmospheric moisture (%). SSM: Soil surface moisture (%) and RWi: Rewetting index (mm d−1).

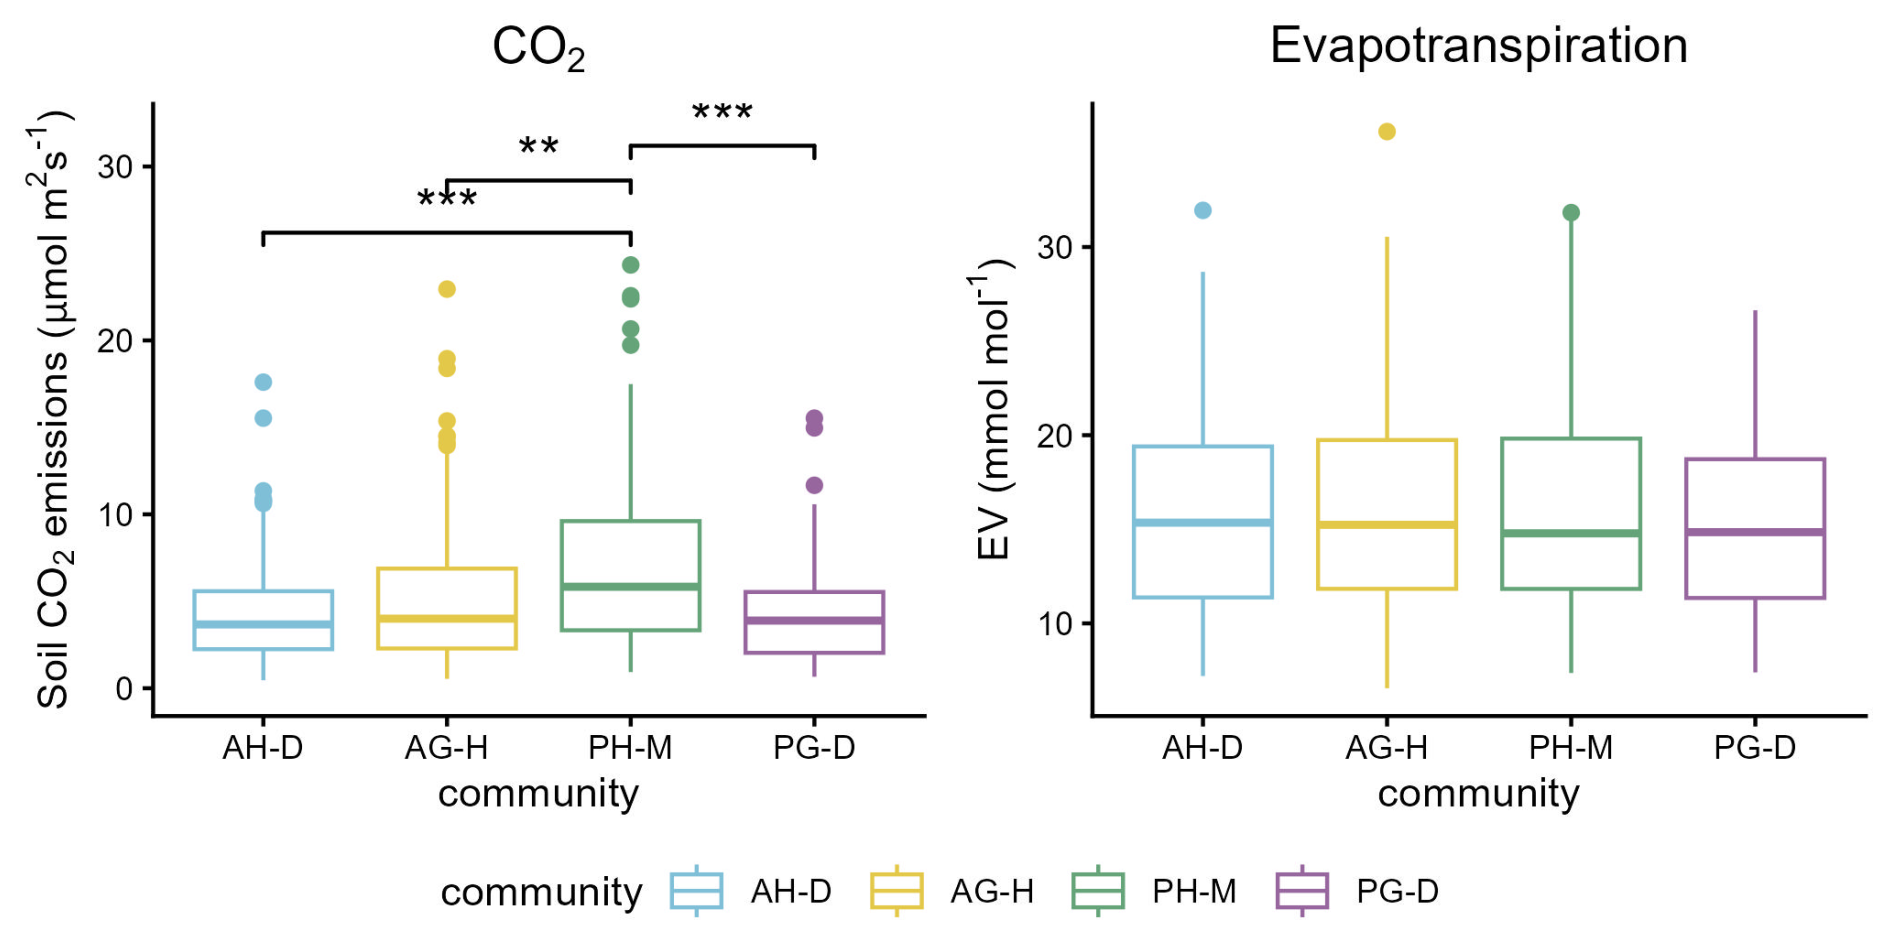
Figure 3Box-plots and comparisons of CO2 (left) and evapotranspiration (right) values among the plant communities. * p-value < 0.05, p-value < 0.01, p-value < 0.001.
Table 3Pairwise comparison of CO2 (µmol CO2 m−2 s−1). AH-D: annual herbs dominated by Diplotaxis virgata; AG-H: annual grasslands dominated by Hordeum leporinum; PH-M: perennial herbs dominated by Malva spp.; PG-D: perennial grasslands dominated by Dactylis glomerata.
When analysing the correlation between the variables (Fig. 4), it was found that moisture exhibited a strong and expected negative relationship with temperature (both soil and atmospheric), since the study was under a Mediterranean climate. A clear positive correlation was also observed between soil and atmospheric values of each variable throughout the year. As expected, rainfall appeared to have a greater influence on soil moisture than on atmospheric moisture, showing a higher correlation with RWi. This parameter, in turn, showed a positive correlation with moisture (in both soil and atmosphere) and a negative correlation with atmospheric temperature.
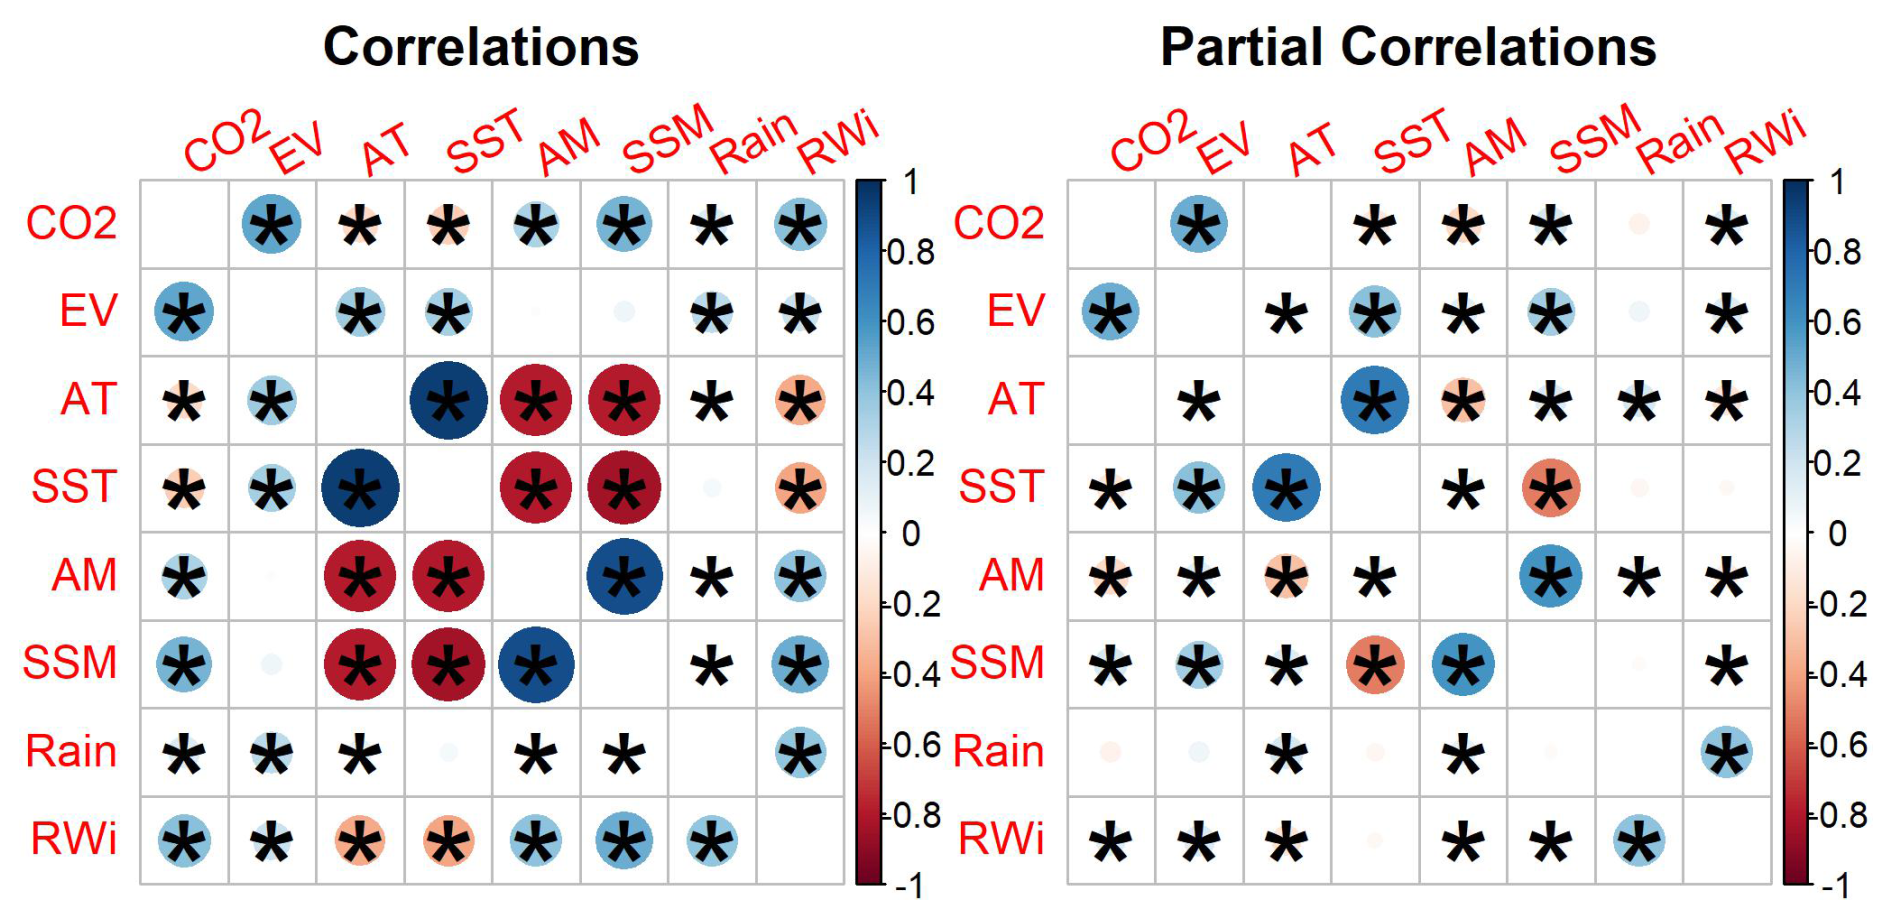
Figure 4Correlation (left) and partial correlation (right) coefficients between variables within the whole sample. Correlation values are shown as size and colour of the circles. Only significant correlations are shown.
Contrary to general assumptions, a negative correlation was found between soil and atmospheric temperatures and CO2 emissions. In addition, a positive correlation was found between soil respiration, soil moisture, and RWi.
Following the correlation results, relationships among soil climate and CO2 emissions were analysed deeply.
3.2 Relationships between soil respiration and climate variables
3.2.1 Soil respiration and temperature relationship
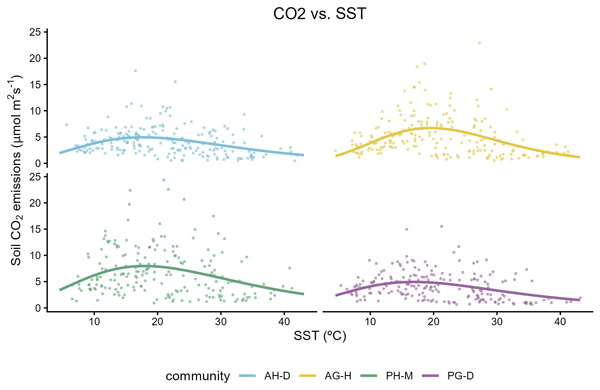
There seems to be a Gaussian relationship between both soil and atmospheric temperatures and CO2 emissions, with a positive correlation up to a regression breakpoint of 18.4 °C (95 % CI: 17.17–19.79 °C) (SST) and a negative effect above this value (Fig. 5). This pattern was observed in all analysed vegetation communities, with the only difference being the intensity of soil respiration rather than the behaviour of the relationship,
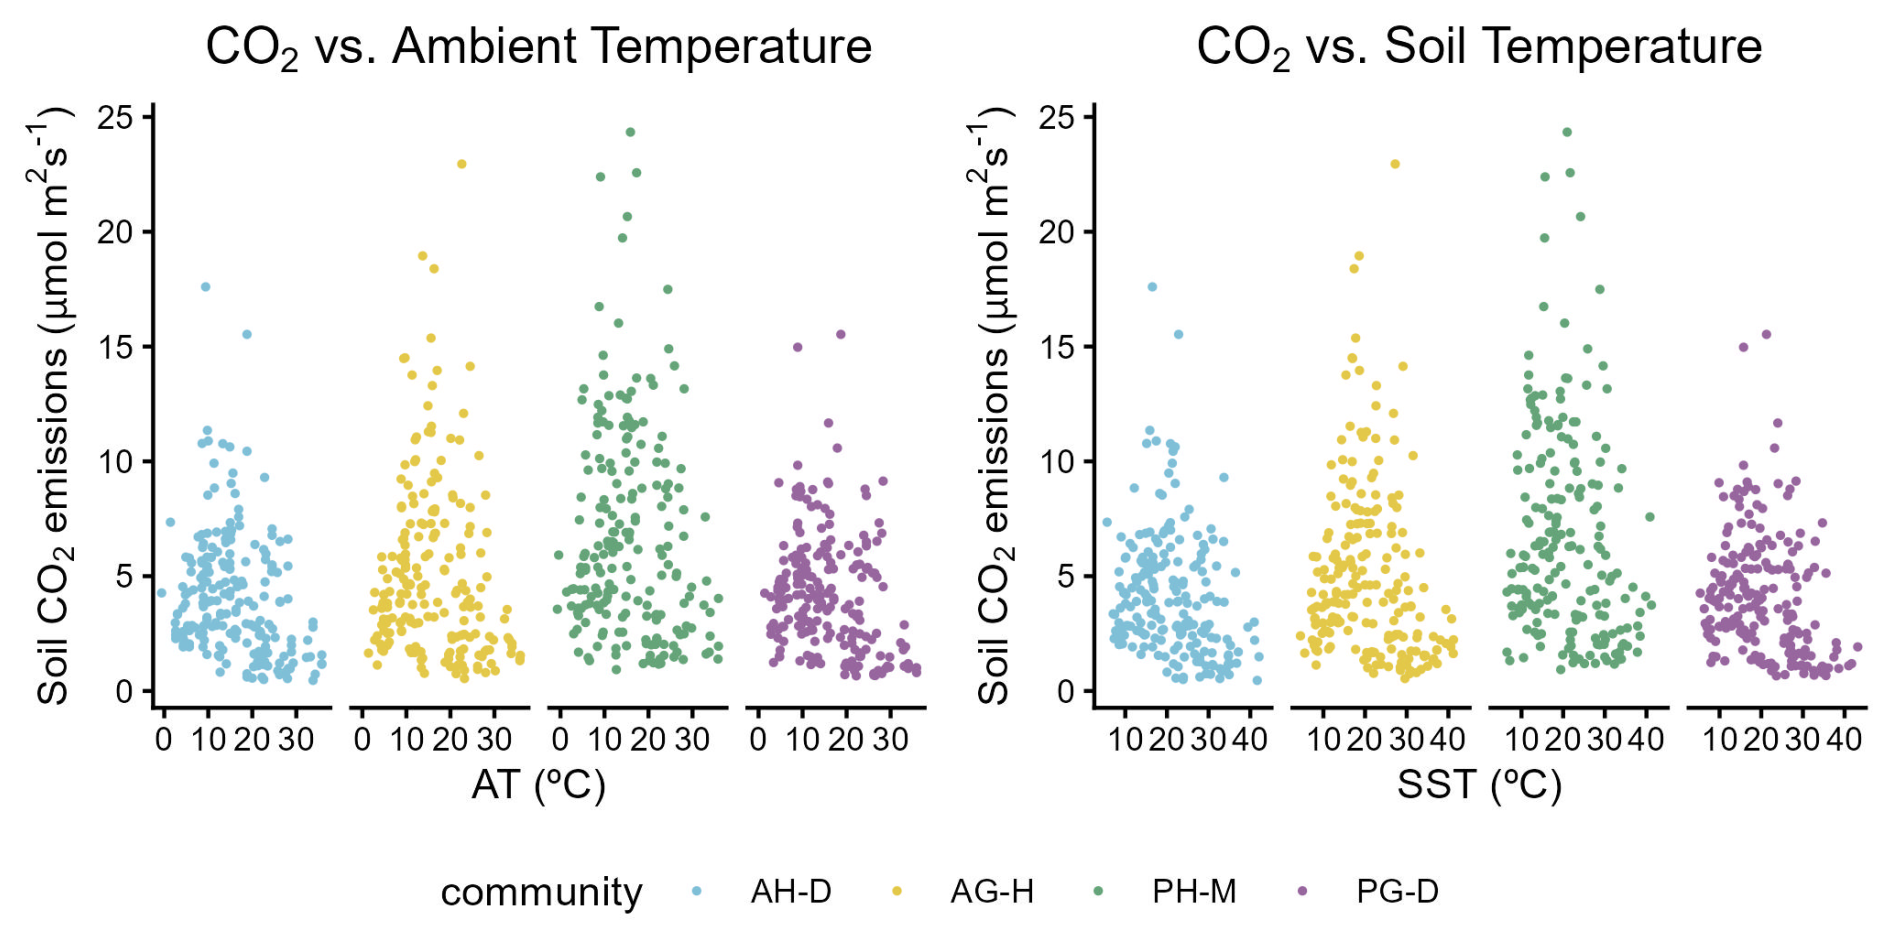
Figure 5Relationship between soil CO2 emissions and climate (left) and soil (right) temperature of the four plant communities.
3.2.2 Soil respiration and moisture relationship
Different to the findings for temperature, soil respiration exhibits an exponential positive relationship with soil and atmospheric moisture (Fig. 6). Once again, the relationship between the variables remained consistent across the four vegetation communities, with variations only observed in the intensity of CO2 emissions.
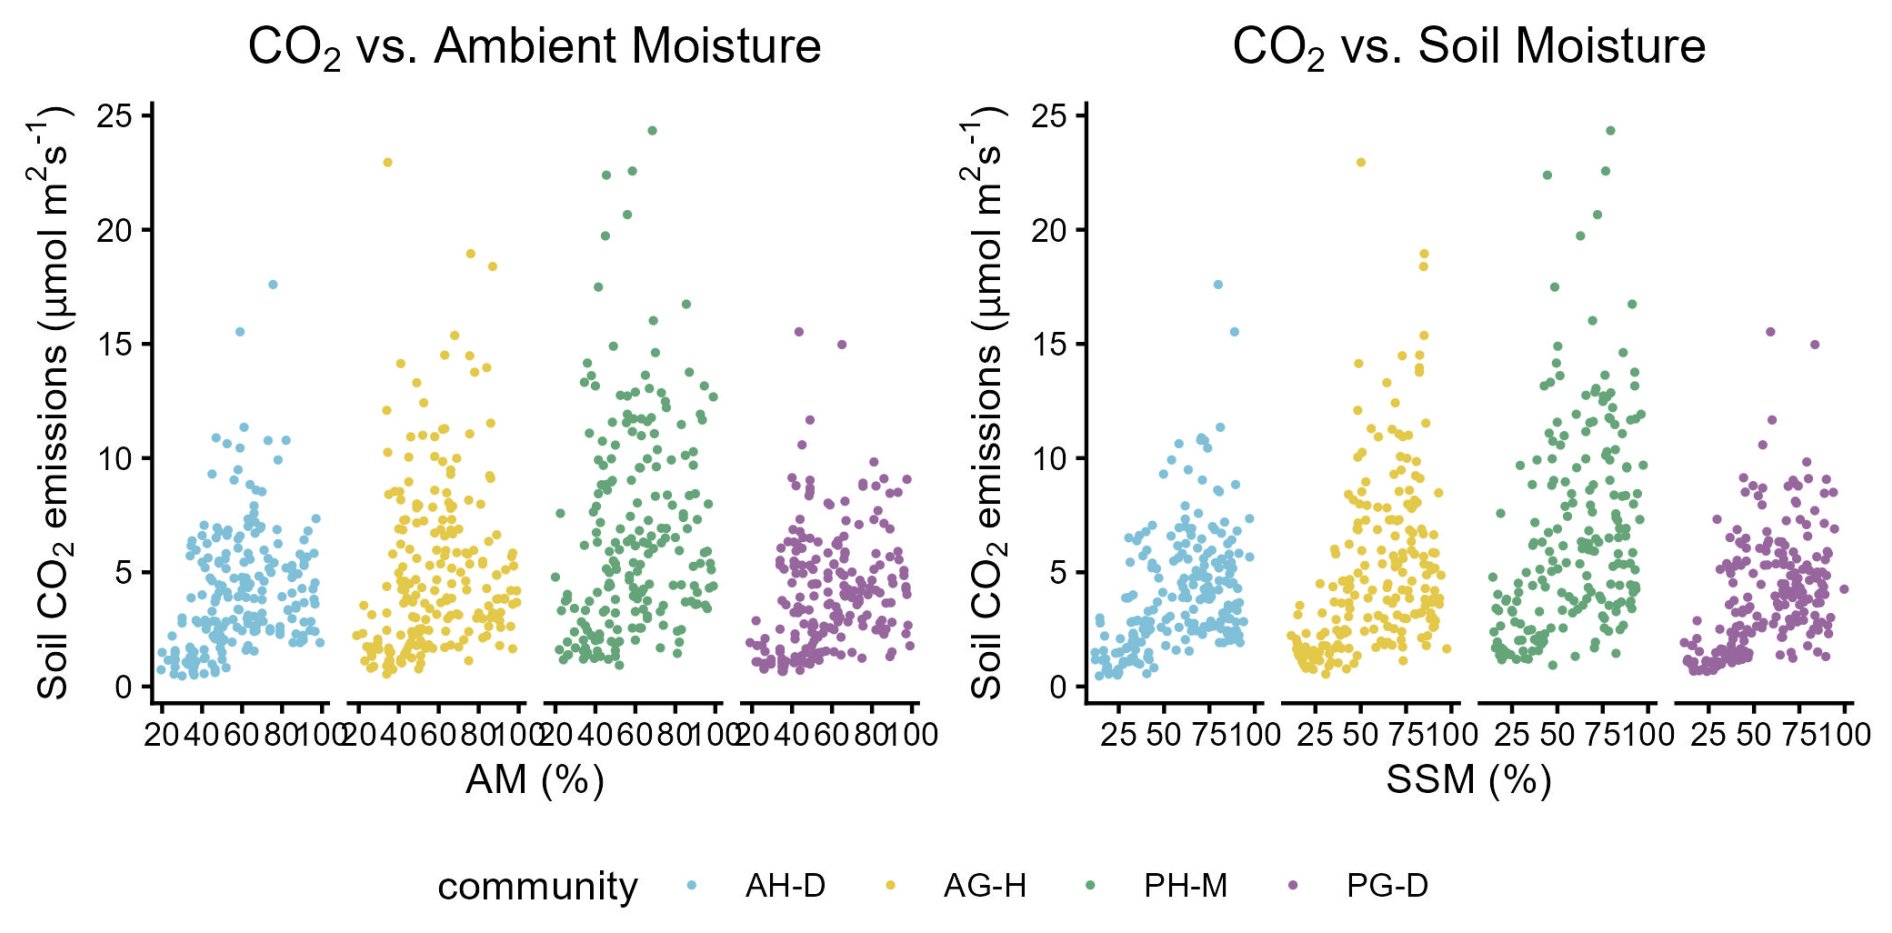
Figure 6Relationship between soil CO2 emissions and climate (left) and soil (right) moisture of the four plant communities.
3.2.3 Soil respiration and RWi relationship
The correlation results suggest that there is a positive and logarithmic relationship between RWi and CO2 emissions (Fig. 7). However, this trend is only evident for values below 20; the relationship appears to weaken at higher values. Unlike the other tested variables, differences were revealed among vegetation communities. AH-D displayed the most precise pattern, whereas PH-M showed the most variable response.
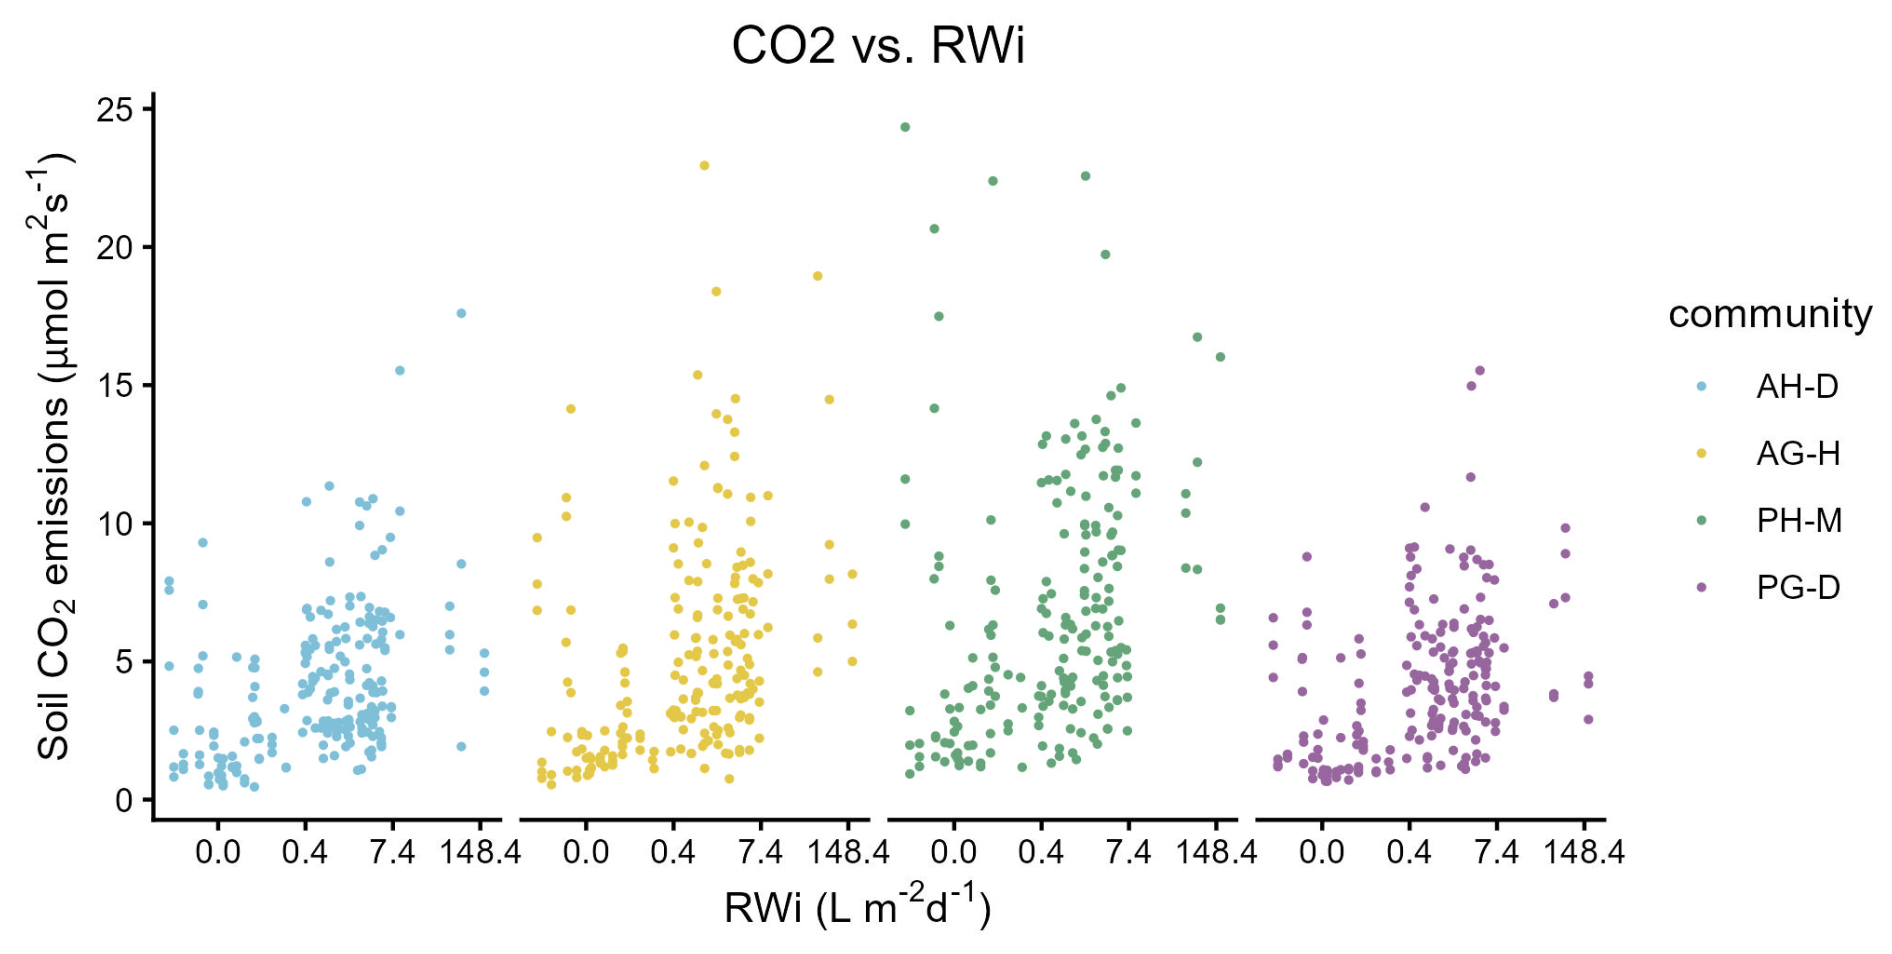
Figure 7Relationship between soil CO2 emissions and rewetting index of the four plant communities. Horizontal axis is displayed on logarithmic scale.
Due to the different behaviour observed above and below the identified threshold, the relationships were analysed in relation to this threshold.
3.3 Relationships under identified thresholds
3.3.1 Soil respiration behaviour under SST < 18.4 °C threshold
When analysing the relationships between the variables below the threshold of 18.4 °C, a positive correlation was observed between the soil climate variables and CO2 emissions (Fig. 8). Additionally, below this threshold, RWi does not appear to be correlated with soil respiration. A negative correlation was found between moisture and temperature in both the atmosphere and the soil. Temperature greatly affects moisture, causing the correlation between CO2 and moisture to disappear in a full correlation analysis but appearing as a positive partial correlation for SM.
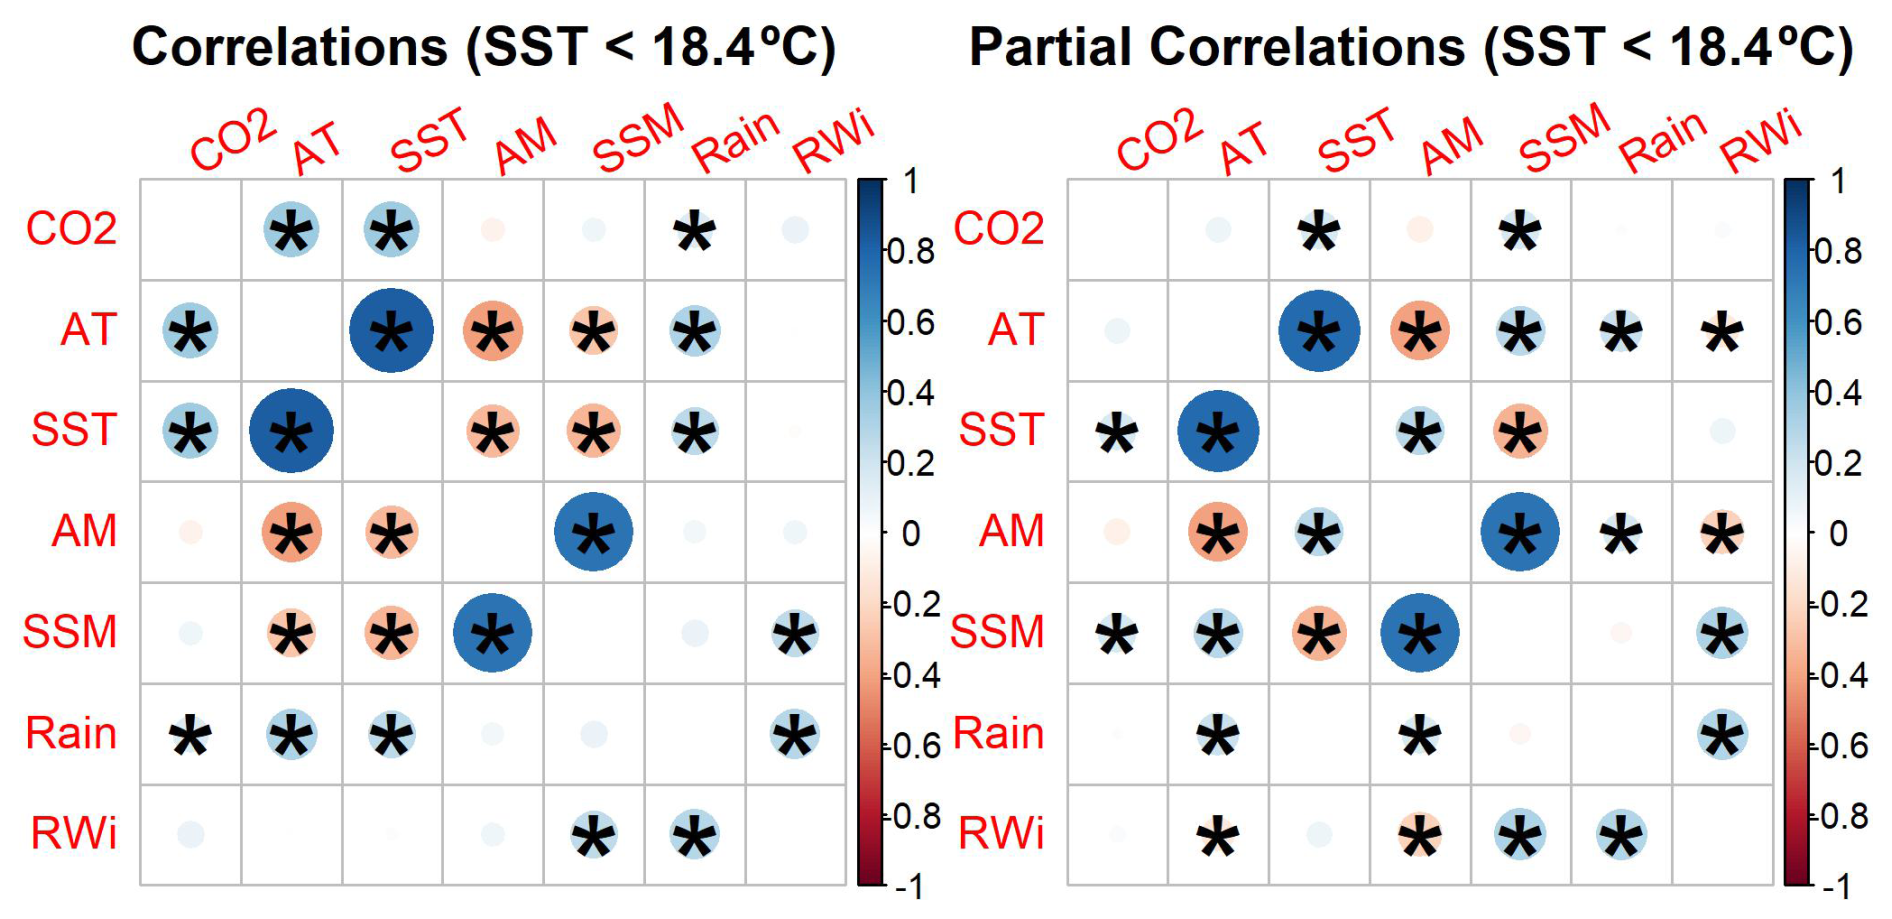
Figure 8Correlation (left) and partial correlation (right) coefficients between variables at soil temperature below the breakpoint (18.4 °C) within the whole sample. Correlation values are shown as size and colour of the circles. Only significant correlations are shown.
Below this threshold, there was a positive linear relationship between CO2 emissions and soil temperature (p= 1.3 × 10⁻¹⁵); the higher the temperature, the higher the CO2 emissions (Fig. 9 and Table 4). However, there are differences between the communities (p= 5.7 × 10⁻³), with PH-M showing higher CO2 emissions than AH-D regardless of soil temperature.
Table 4Pairwise comparisons between communities for each ambient variable for SST < 18.4 °C. AH-D: annual herbs dominated by Diplotaxis virgata; AG-H: annual grasslands dominated by Hordeum leporinum; PH-M: perennial herbs dominated by Malva spp.; PG-D: perennial grasslands dominated by Dactylis glomerata. SST: Soil surface temperature (°C). SSM: Soil surface moisture (%) and RWi: Rewetting index (mm d−1).
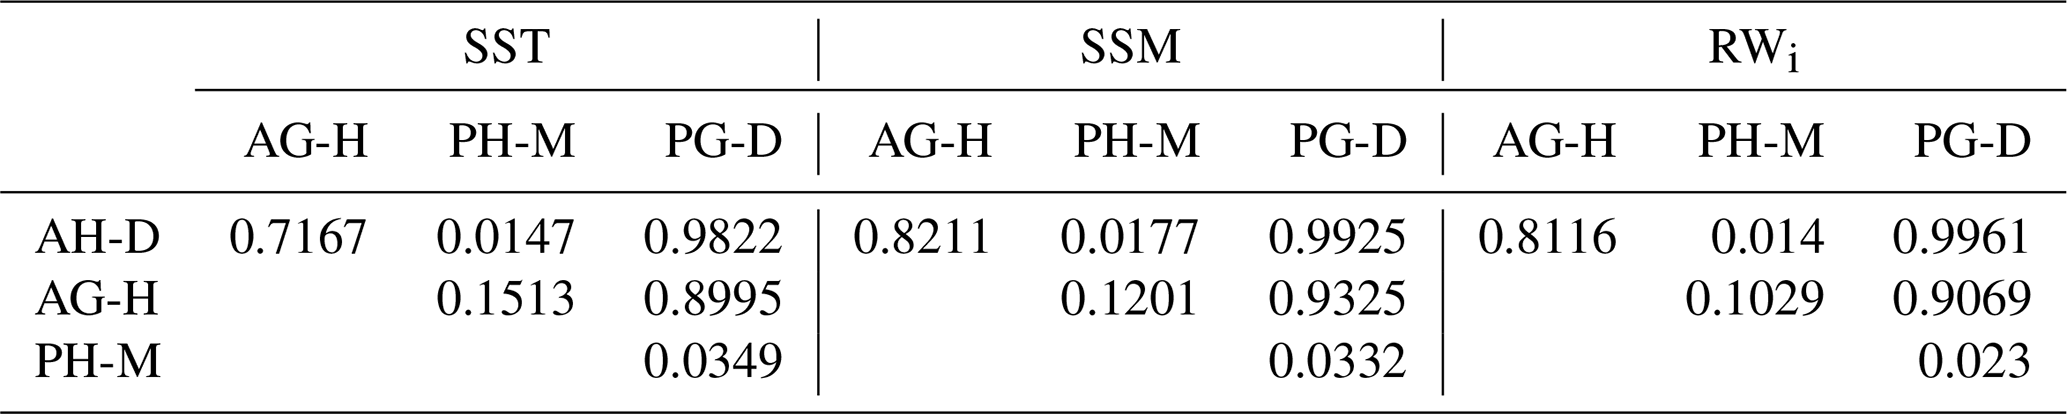
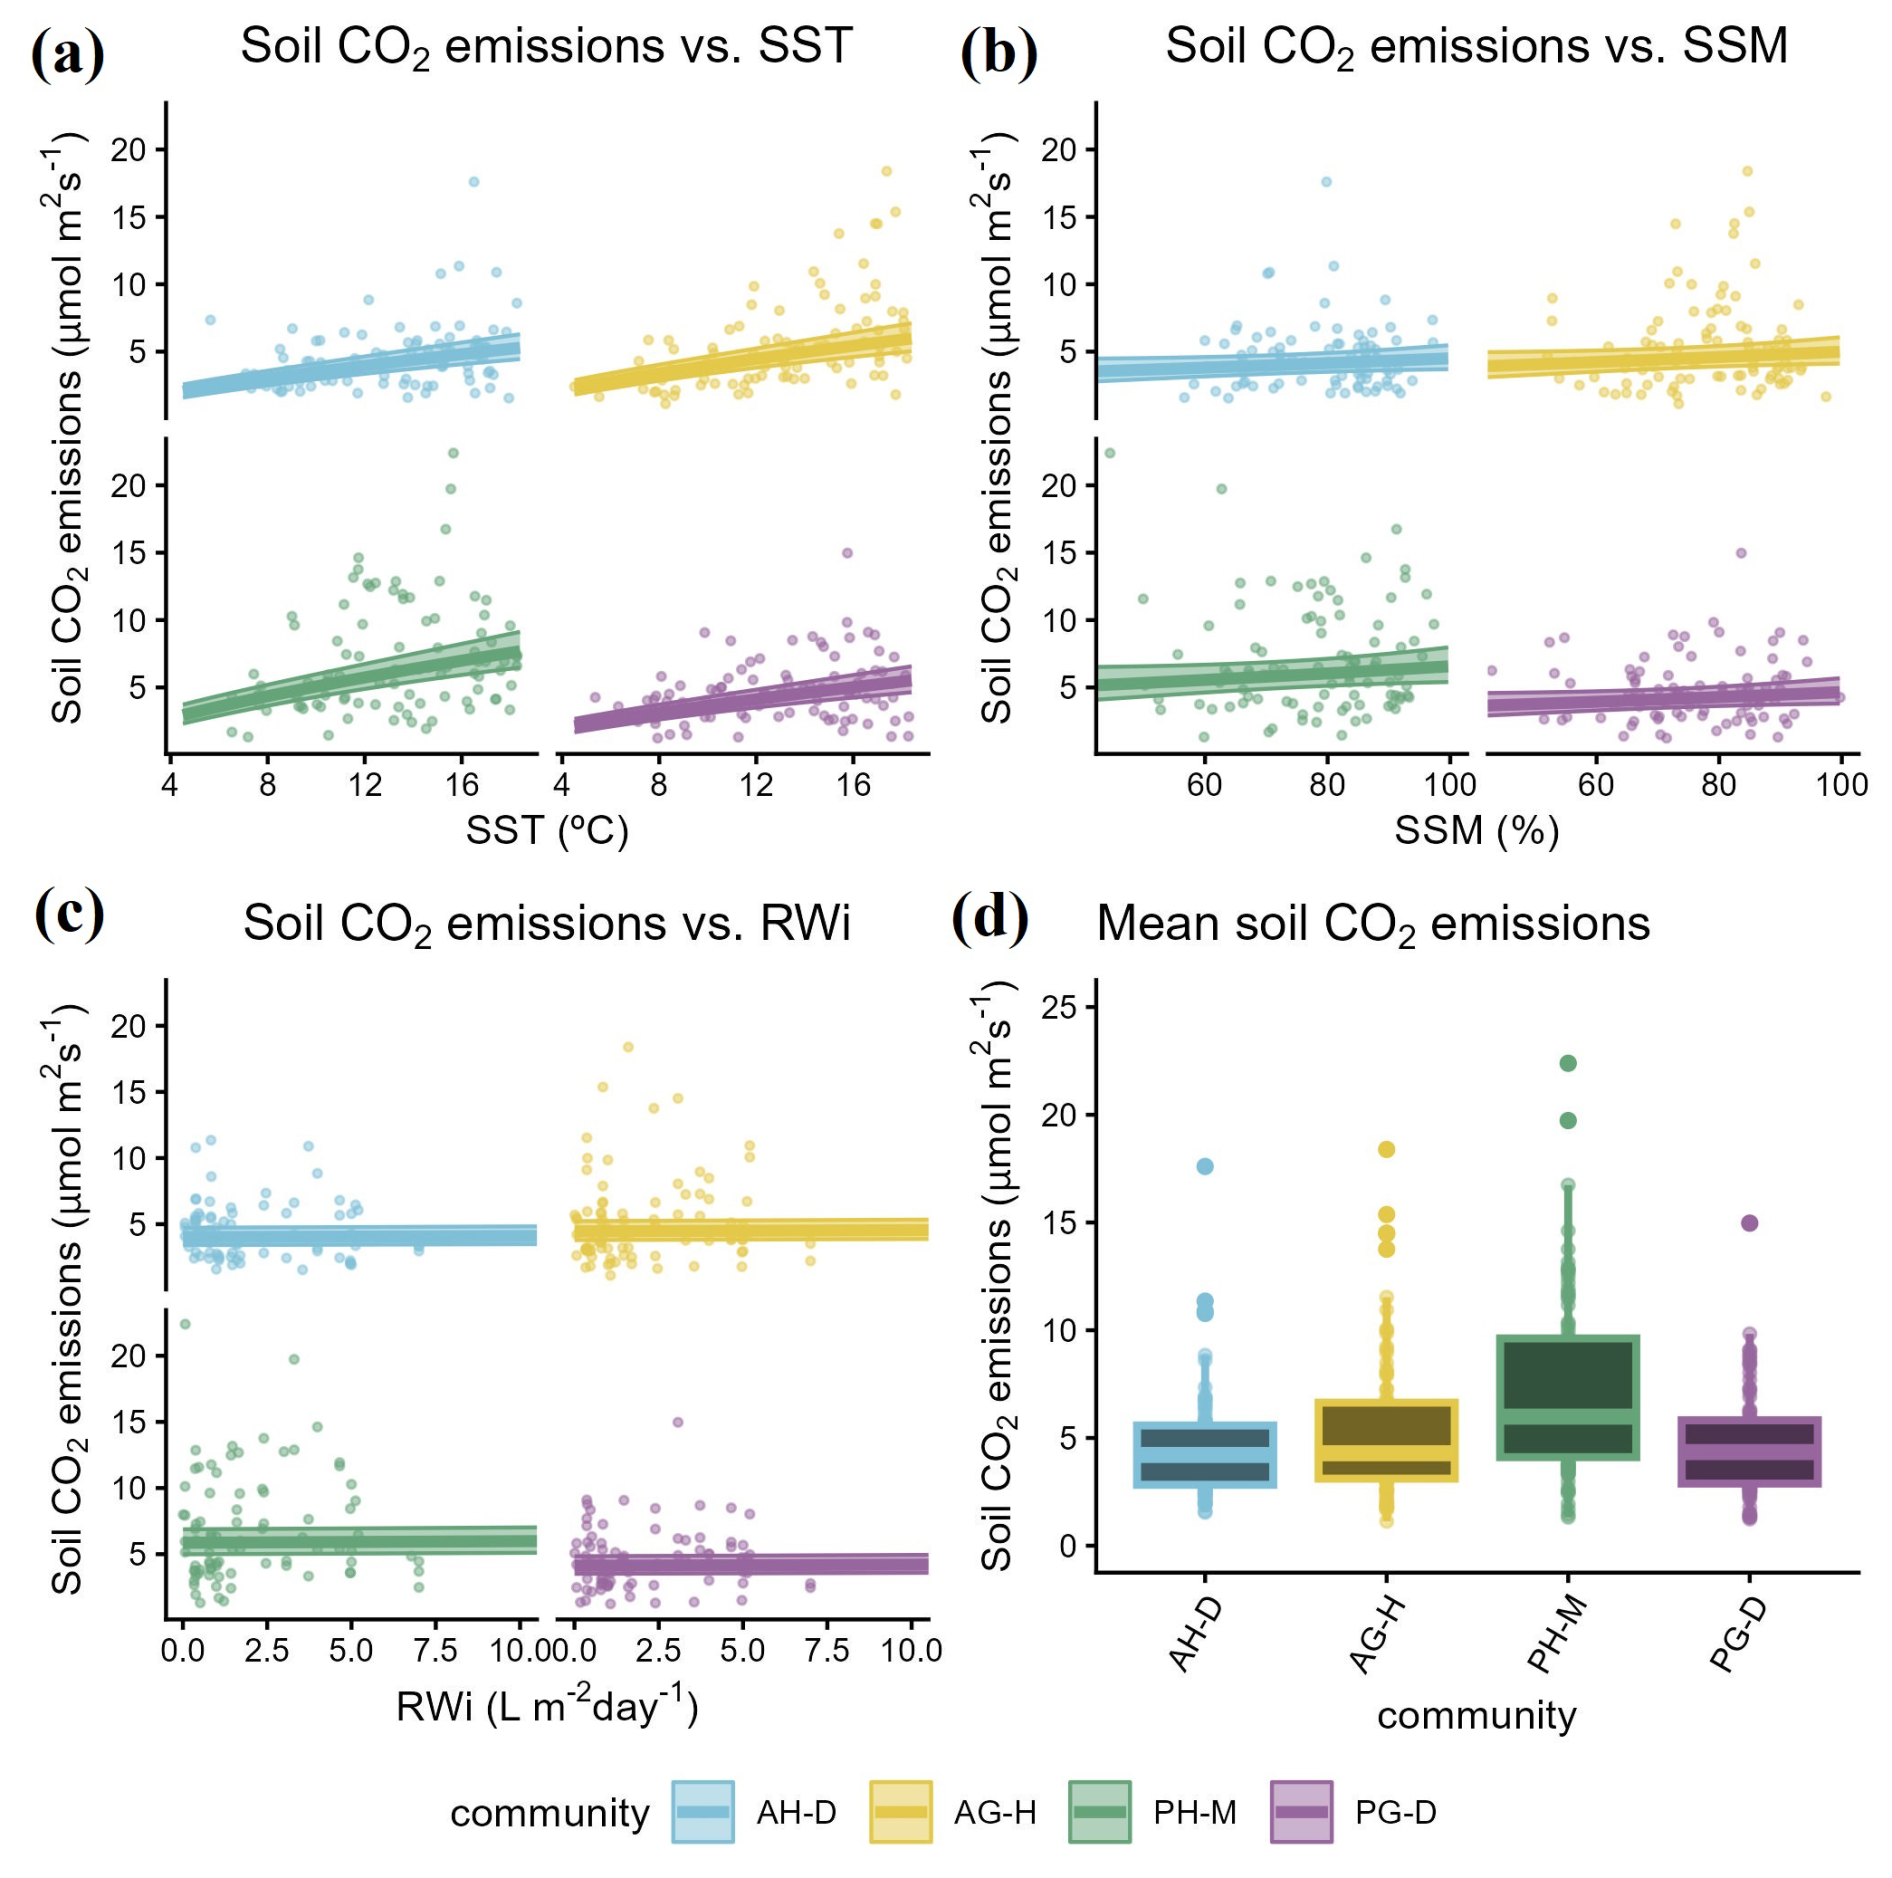
Figure 9Soil CO2 emissions below the breakpoint. Panels (a)–(c), real values (points) and regression fit (line) with 95 % confidence intervals (shadows) of the four plant communities against soil temperature, soil moisture and rewetting index respectively. Panel (d), box-plots of soil CO2 emissions below breakpoint for each plant community.
At this threshold, soil moisture had no apparent effect on CO2 emissions (p= 0.08). In this case, removing the effect of soil moisture, there are differences between PH-M and all other communities except AG-H (p= 0.006).
Below this threshold, in contrast to soil moisture, RWi has a small but significant positive effect on soil CO2 emission (p= 0.017). Again, as for moisture, when the effect of RWi is removed, there are differences between PH-M and all the other communities except AG-H (p= 0.004).
3.3.2 Soil respiration behaviour under SST > 18.4 °C threshold
Above the 18.4 °C threshold, the relationship between soil respiration and temperature became negative, and partial correlations were practically non-existent (Fig. 10). In contrast, water-related variables notably increased their relation with soil respiration and continued to positively influence soil CO2 emissions. The strongest correlation was observed between CO2 emissions and soil moisture, followed by RWi.
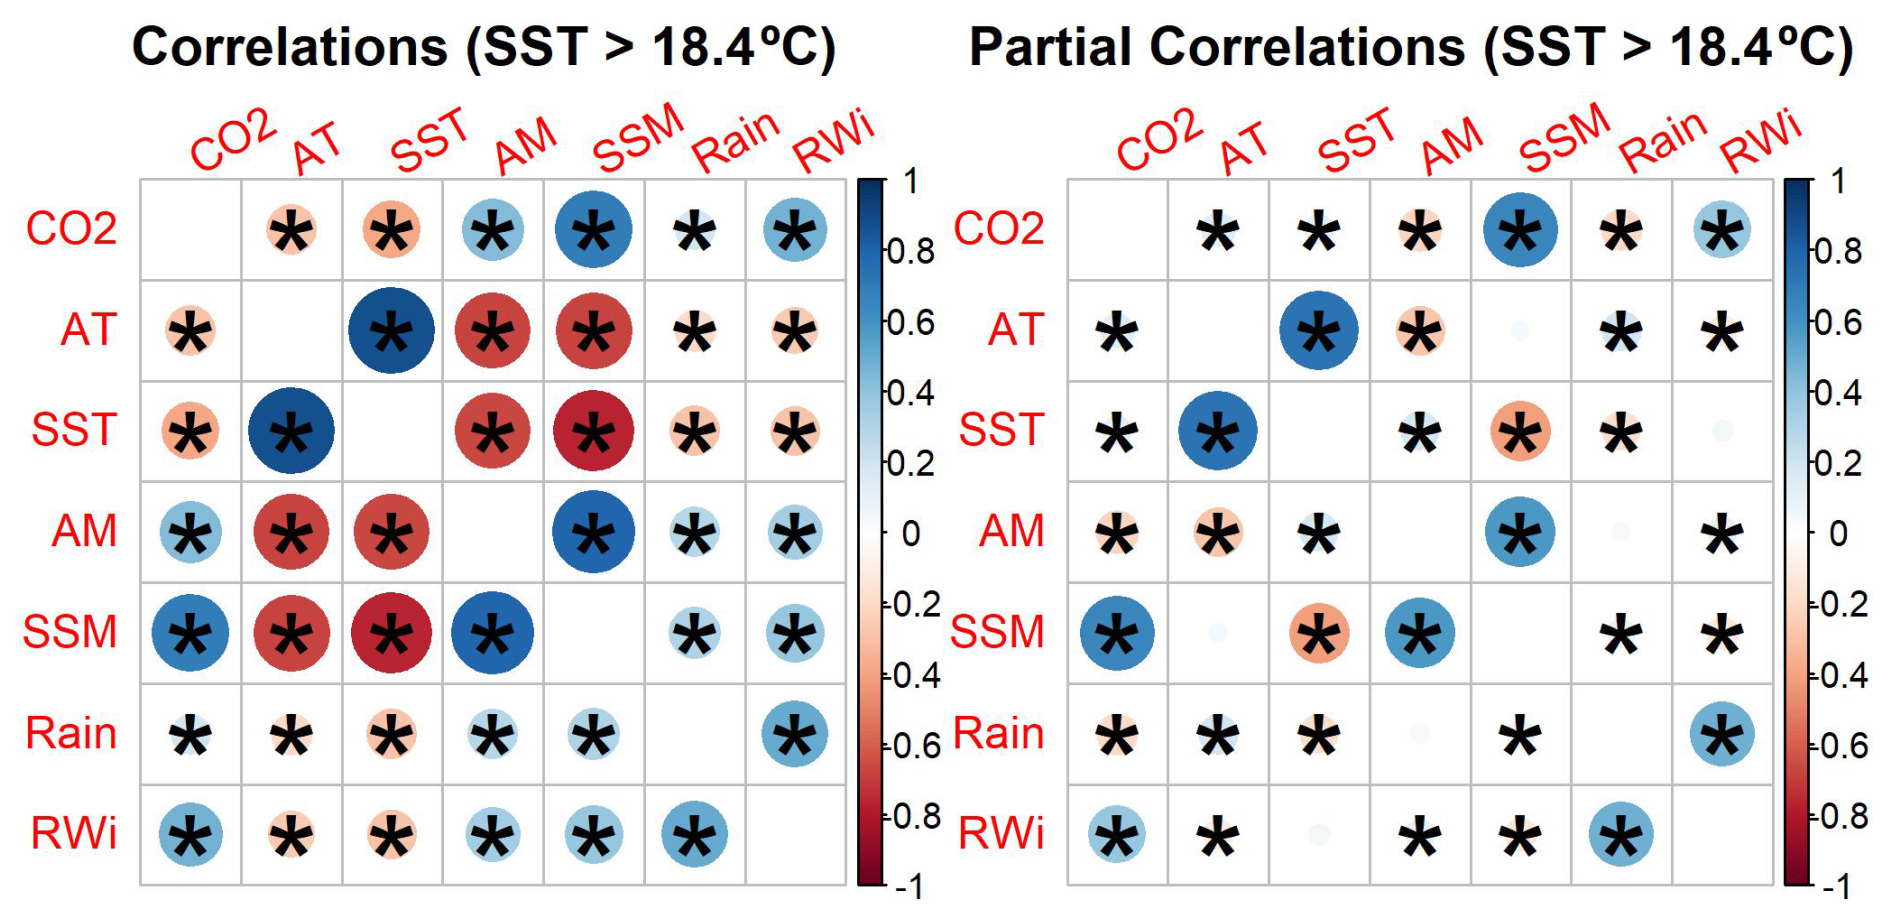
Figure 10Correlation (left) and partial correlation (right) coefficients between variables at soil temperature above the breakpoint (18.4 °C) within the whole sample. Correlation values are shown as size and colour of the circles. Only significant correlations are shown.
The relationship between CO2 emissions and soil temperature was linearly but changed direction above the threshold (Fig. 11 and Table 5), being negative (p < 2.2 × 10⁻¹⁶). An increase in temperature decreased soil CO2 emissions. In this case, soil respiration is significant higher, removing SST effect, in PH-M comparing to all other communities (p= 1.1 × 10⁻⁸).
Table 5Pairwise comparisons between communities for each climate variable for SST > 18.4 °C. AH-D: annual herbs dominated by Diplotaxis virgata; AG-H: annual grasslands dominated by Hordeum leporinum; PH-M: perennial herbs dominated by Malva spp.; PG-D: perennial grasslands dominated by Dactylis glomerata. SST: Soil surface temperature (°C). SSM: Soil surface moisture (%) and RWi: Rewetting index (mm d−1).

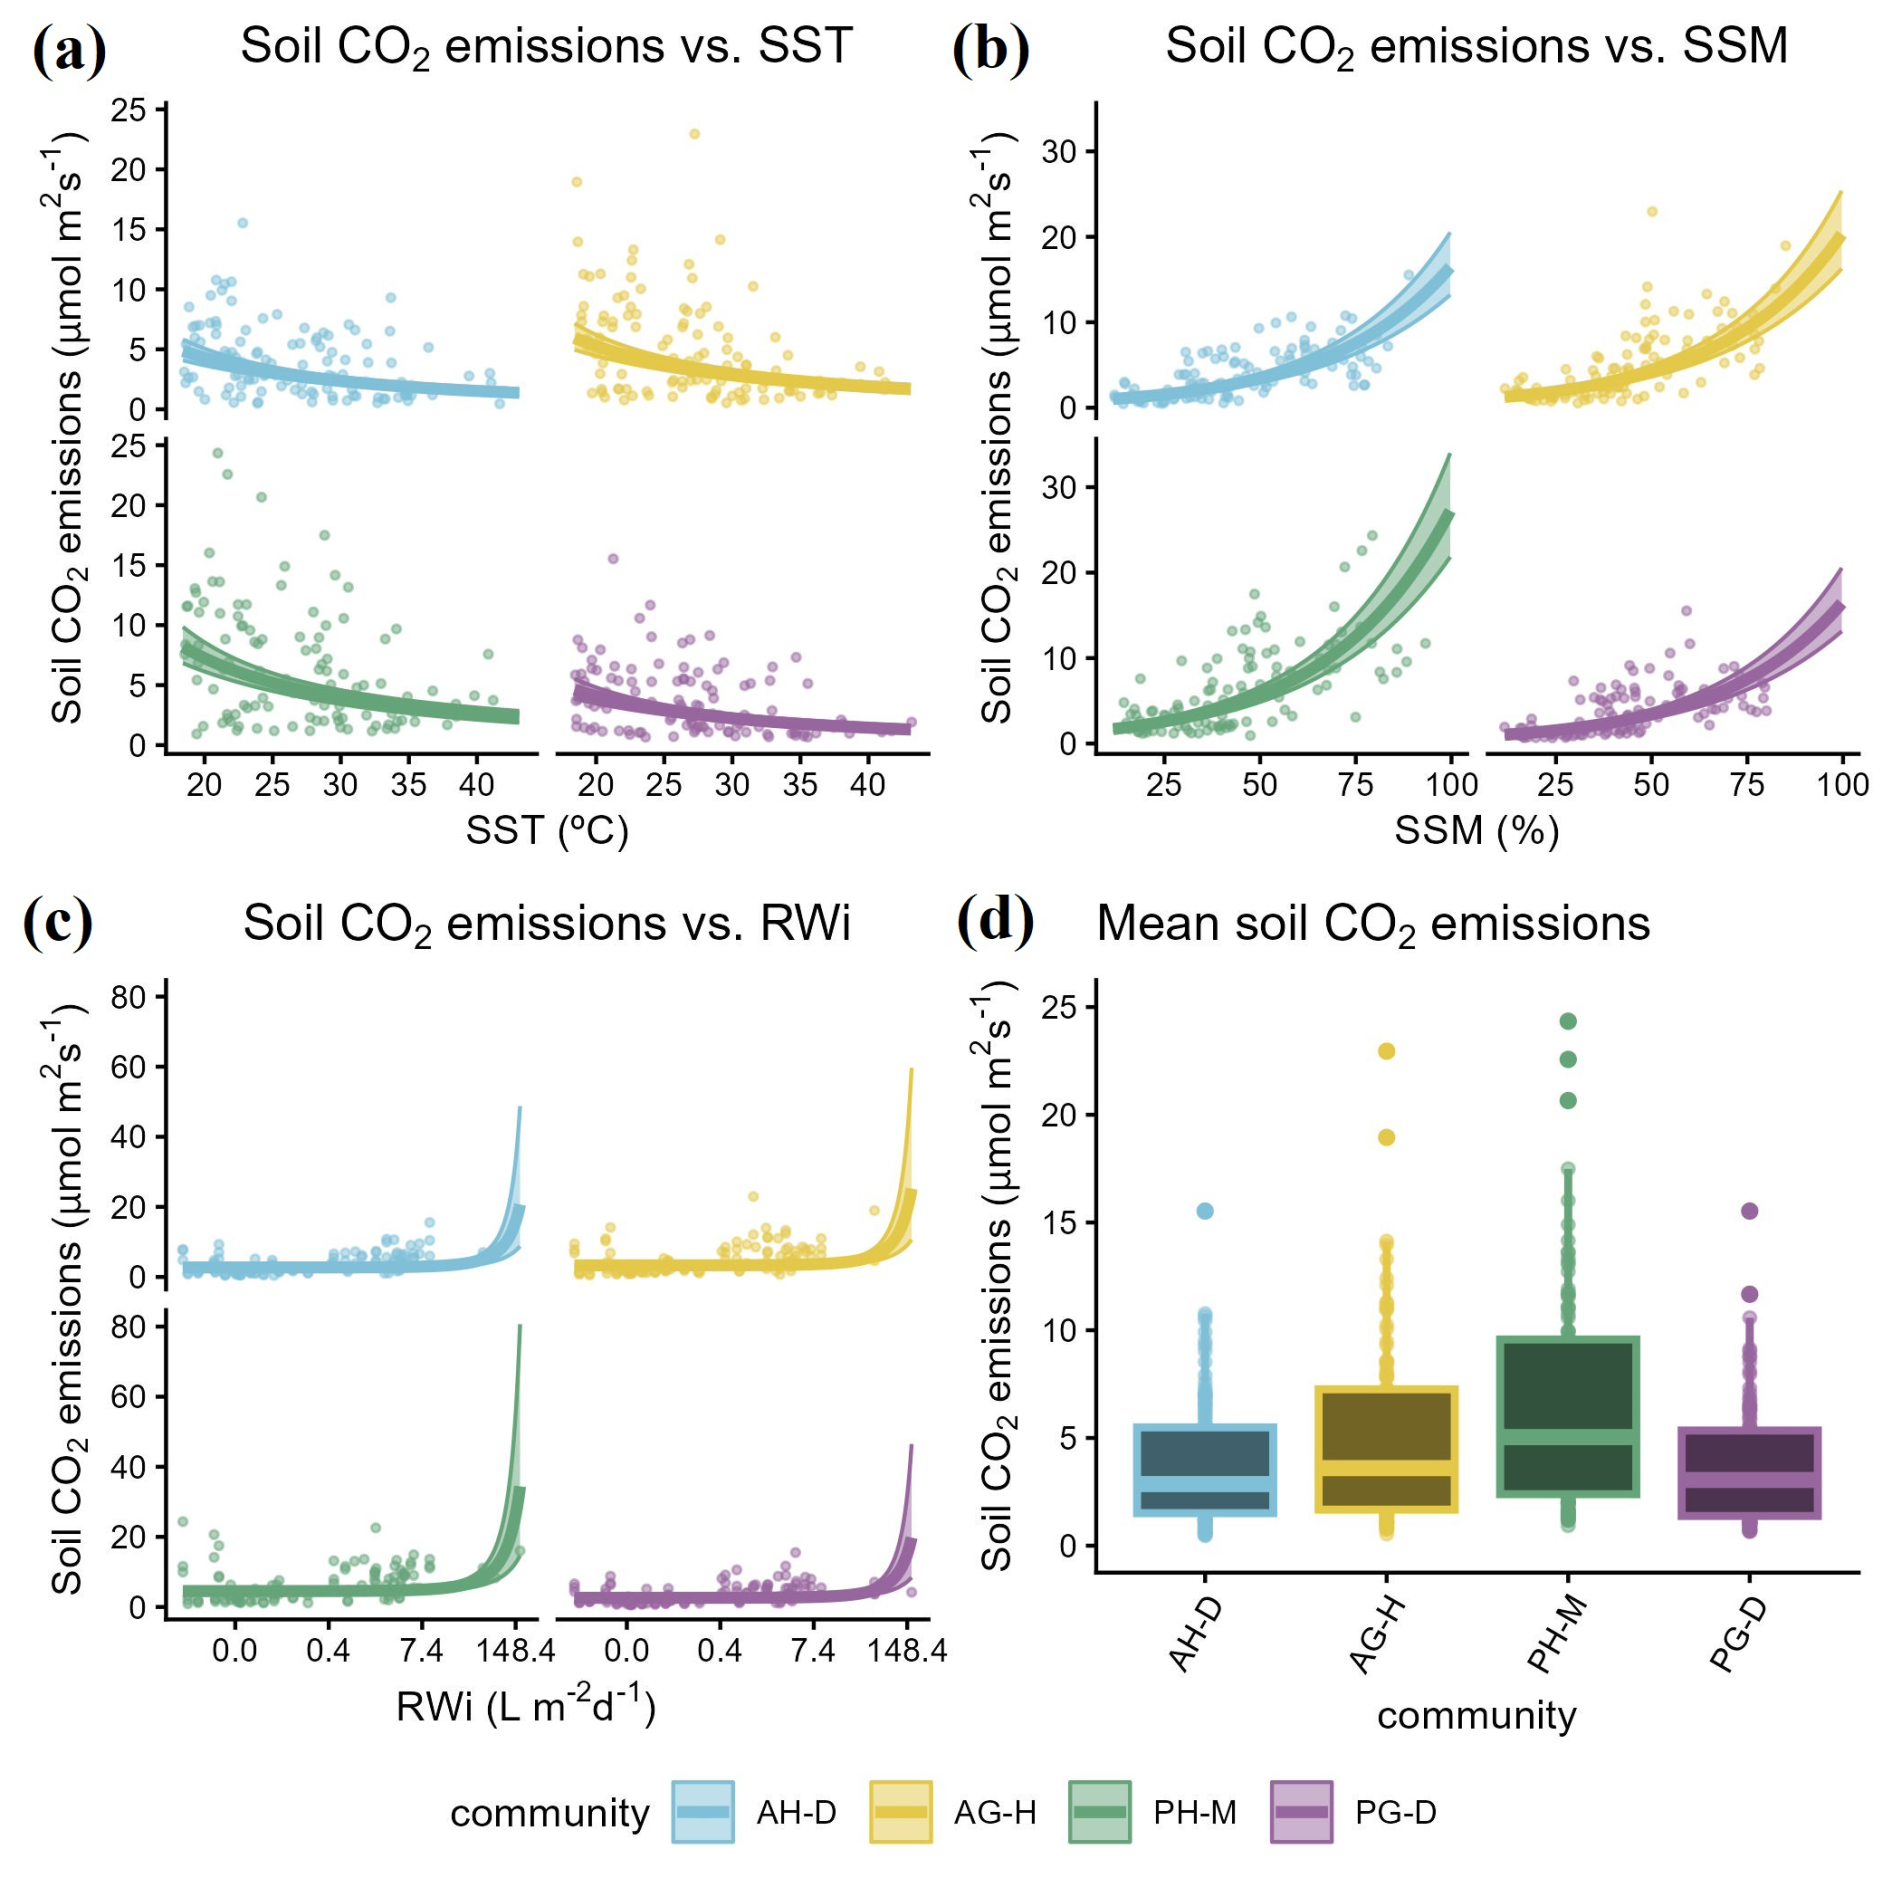
Figure 11Soil CO2 emissions above the breakpoint. Panels (a)–(c), real values (points) and regression fit (line) with 95 % confidence intervals (shadows) of the four plant communities against soil temperature, soil moisture and rewetting index respectively. Panel (d), box-plots of soil CO2 emissions above breakpoint for each plant community.
Contrary to the below threshold 18.4 °C, soil moisture had a positive and linear relationship with CO2 emissions over 18.4 °C (p < 2.2 × 10⁻¹⁶). Again, removing the soil moisture effect, there are differences between PH-M and all other communities (p= 3.5 × 10⁻⁶) although the comparison with AG-H does not reach statistical significance by a very narrow margin (p= 0.057).
RWi has a significant positive effect on soil CO2 emission at soil temperatures above 18.4 °C (p= 4.1 × 10⁻⁶). However, when the effect of RWi is removed, there are differences between PH-M and all the other communities (p= 2.8 × 10⁻⁷), not excluding AG-H.
3.3.3 Soil respiration, temperature and moisture, and RWi interactions
The interactions between soil moisture, temperature and RWi were tested. Below 18.4 °C, it was found that there was no interaction between SST and SSM (p= 0.24), with both having a positive slope. Meanwhile, RWi had no effect on CO2 (p= 0.67).
Above 18.4 °C, a third-order interaction was observed between SST, SSM and RWi (p= 0.0002). As previously mentioned, both SSM and RWi increase soil CO2 emissions if we analyze them separately, even over 18.4 °C, and in absence of any climate limitation. However, at temperatures above 18.4 °C, both variables interact and potentiate their effects. At these temperatures, the SST negative effect on SR is related mainly to SSM limitation because of dryness (due to their high correlation). That's why RWi showed a significant positive effect on CO2 emissions.
Therefore, the observed behaviour of CO2 at high temperatures (a decrease in CO2 emissions) is due to the negative correlation between SST and SSM, meaning high SSM values cannot occur alongside high SST values.
3.4 Modelling
The mechanistic model presented was developed by the authors based on the observed data structure and the ecological relationships identified during the analysis. Prior to adopting the proposed formulation, several alternative model structures were tested, including models assuming a positive effect of soil temperature on soil respiration, models excluding soil temperature as a predictor, and models incorporating a positive effect of soil temperature with a negative interaction with soil moisture. None of these alternative formulations converged when fitted to the observed data (Table 6).
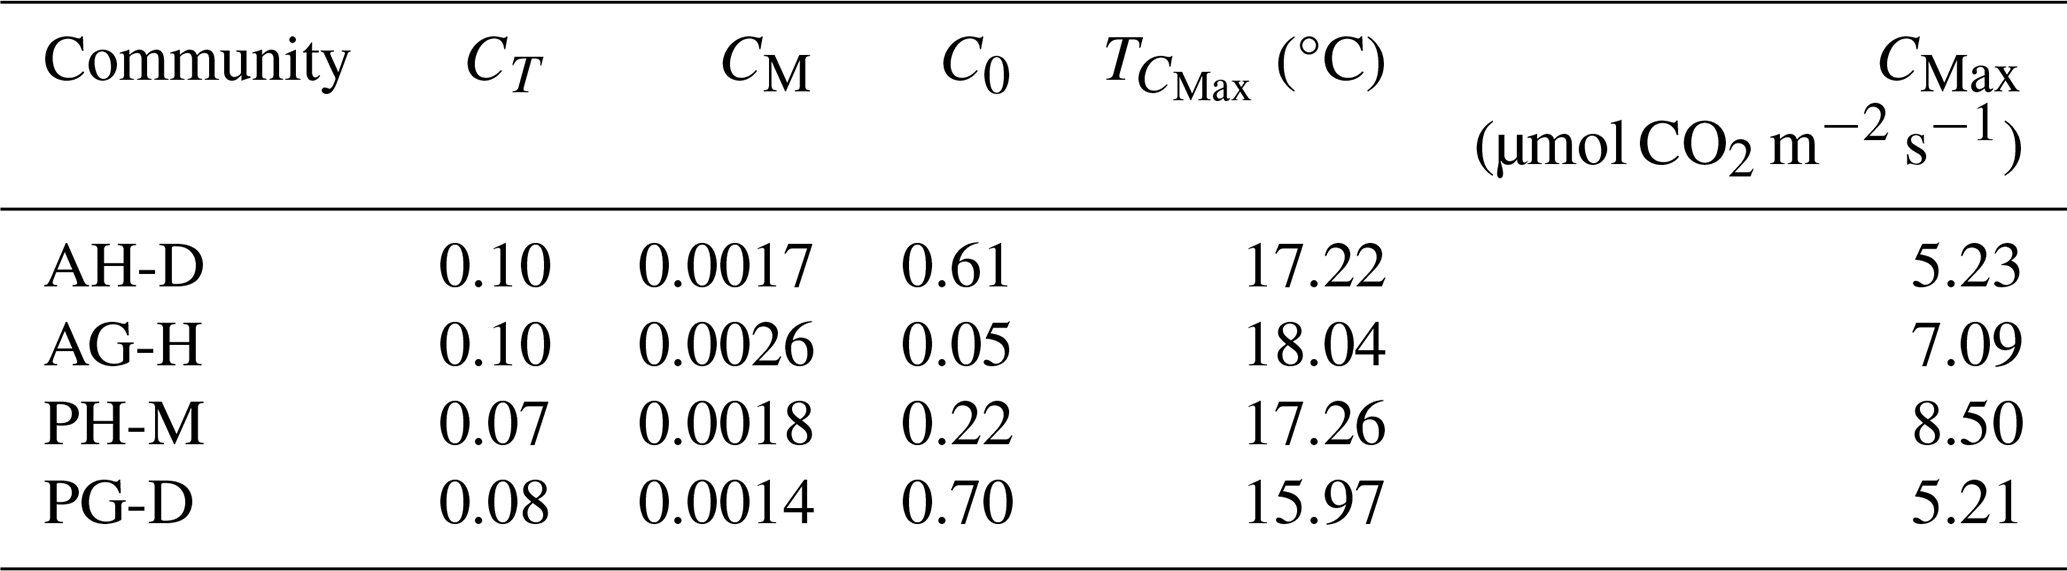
Table 6Developed mechanistic model results for each plant community described in Sect. 2.4. AH-D: annual herbs dominated by Diplotaxis virgata; AG-H: annual grasslands dominated by Hordeum leporinum; PH-M: perennial herbs dominated by Malva spp.; PG-D: perennial grasslands dominated by Dactylis glomerata. CT: temperature sensitivity coefficient of soil CO2 efflux. CM: moisture sensitivity coefficient of soil CO2 efflux. C0: basal CO2 soil emissions expected at soil surface temperature (SST) =0. : soil temperature producing the highest soil CO2 emissions. CMax: Maximum soil CO2 emission rate.
This systematic lack of convergence is ecologically informative: it typically occurs when the functional form of the proposed model differs substantially from the underlying structure of the data. Inspection of the alternative model outputs revealed that, under our observed conditions, all alternative formulations produced monotonic functions – either consistently increasing or consistently decreasing – whereas the observed data show a clearly unimodal pattern with a well-defined maximum. This unimodal behaviour cannot be reproduced by any monotonic function, which provides strong empirical justification for the negative effect of soil temperature included in the proposed model.
Since soil moisture can be expressed as a function of temperature, we analyzed the relationship between soil respiration and climate through SST, obtaining a Gaussian model for each plant community (Table 6). The model results showed that the decrease in CO2 with increasing temperature (CT) is similar in all four communities, although slightly lower in PH-M and PG-D (Fig. 12). In contrast, the effect of humidity (CM), differs considerably between the communities, with humidity increasing respiration much more in AG-H than in the others. The most pronounced differences were observed in C0, which represents the basal respiration rate (expected at SST = 0). Interestingly, communities with lower C0 values tended to exhibit higher CMax, suggesting that lower basal levels were associated with greater maximum respiration capacity.
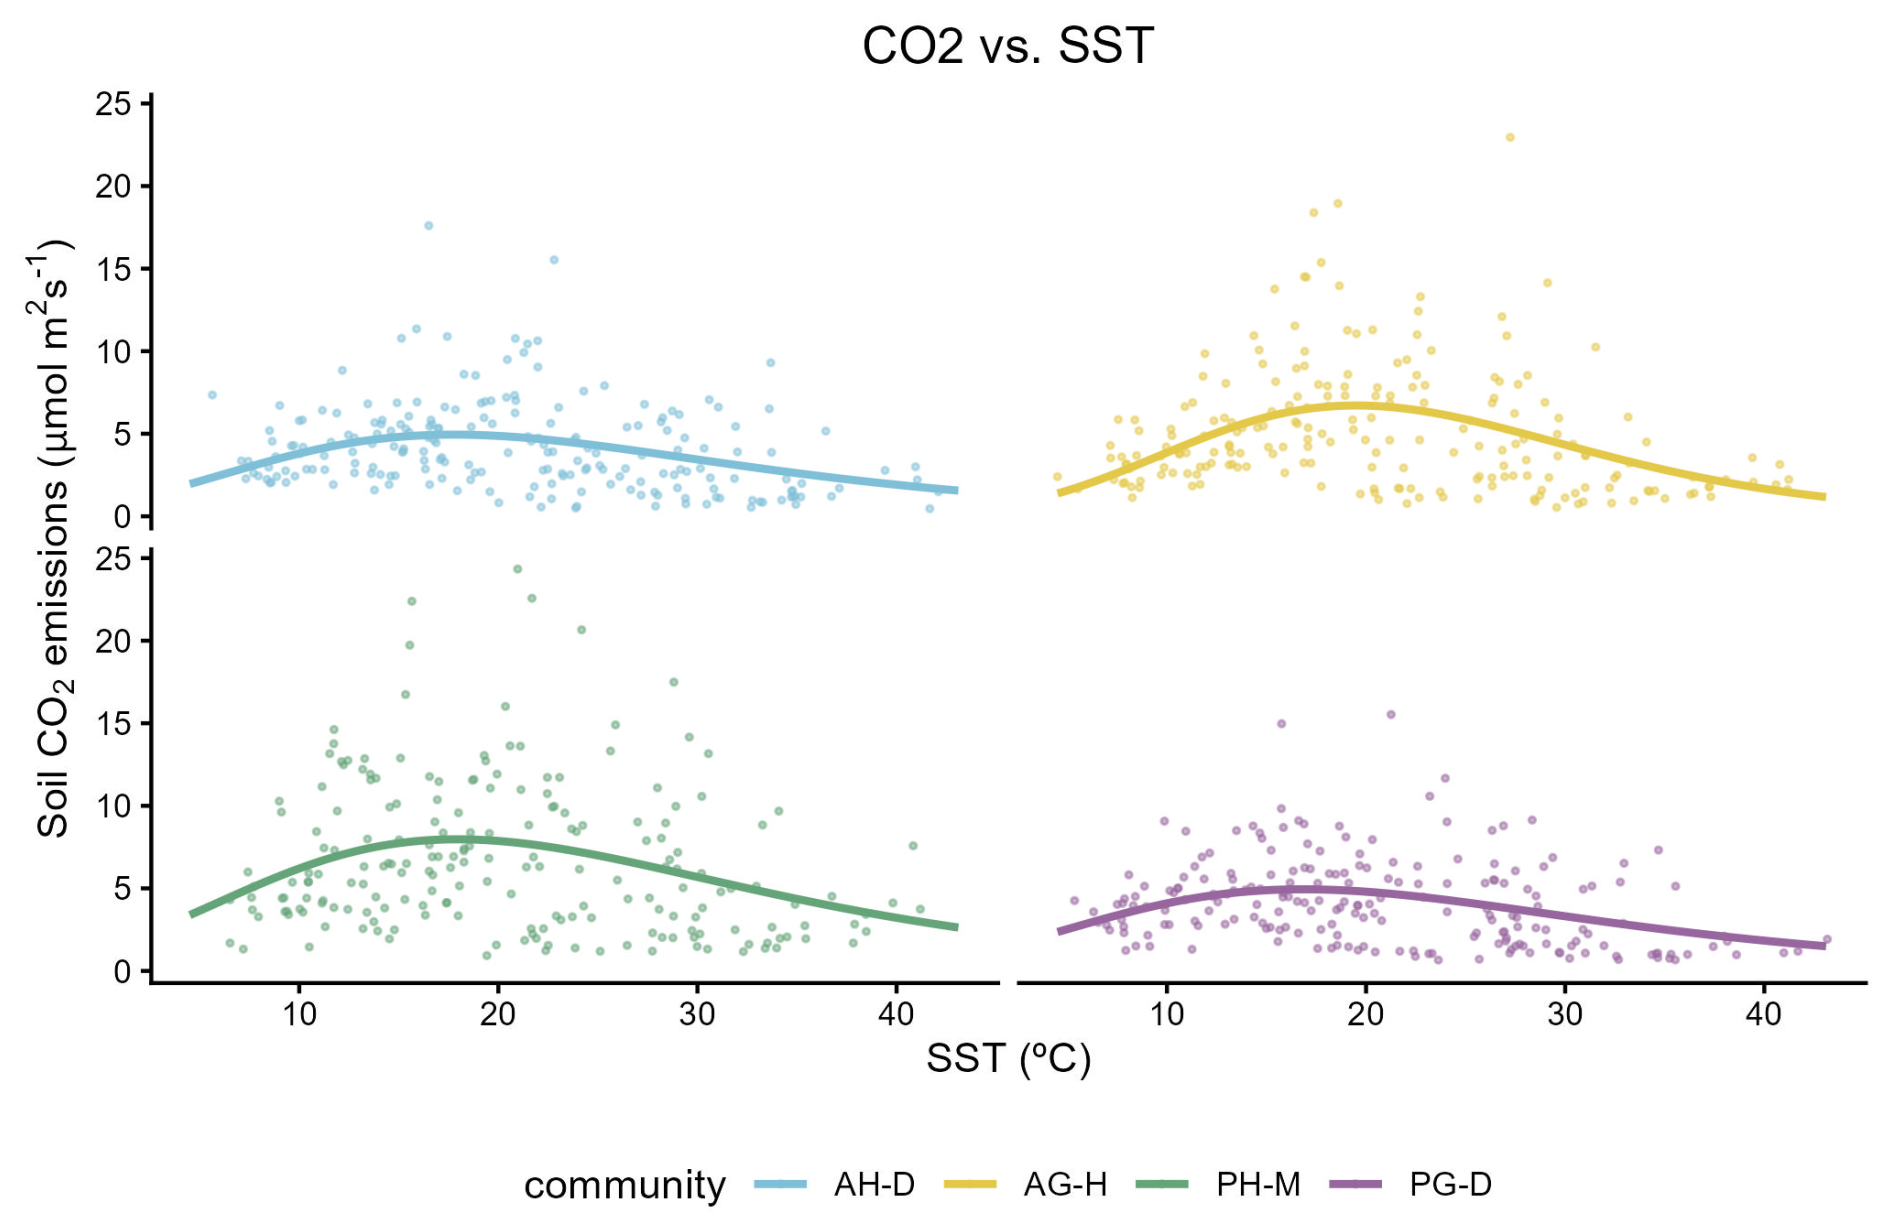
Figure 12Behaviour of the model presented. Fitting of the model (lines) to real values of soil CO2 emissions (points) against soil temperature for each plant community.
The model showed AH-D and AG-H presenting higher SST influence on CO2 emissions, meanwhile AG-H was the one with the highest influence of SSM on CO2 emissions increase. Thus, C0, which indicates the basal CO2 emissions, showed AG-H as the most climate-dependent SR process.
On the other hand, PH-M showed the highest SR at the optimum SST. There is a clear correlation between the influence of SSM and the optimum SST for SR. The optimum was at higher SST in AG-H and PH-M, the ones with higher SSM influence.
To further evaluate the performance of the proposed mechanistic model, we compared it against a standard Q10 exponential model and against the Gaussian model of Lellei-Kovács et al. (2011), fitted to the same dataset (Table 7). The proposed model achieved the lowest AIC and RMSE of the three models, and a BIC virtually indistinguishable from the Gaussian model, despite BIC's stronger penalty for complexity. Likelihood-ratio tests confirmed that the proposed model significantly reduced deviance relative to both the Q10 model (p < 2.2 × 10⁻¹⁶) and the Gaussian model (p=0.017), indicating that the improvement reflects genuine explanatory gain rather than added flexibility.
Table 7Comparison of model performance between the classical Q10 exponential model, the Gaussian model of Lellei-Kovács et al. (2011), and the proposed mechanistic model described in Sect. 2.4 (Eq. 5), fitted to the pooled dataset. AIC: Akaike Information Criterion. BIC: Bayesian Information Criterion. RMSE: root mean square error (µmol CO2 m−2 s−1). LRT: likelihood-ratio test p-value for the reduction in deviance achieved by the proposed model relative to each alternative.

To further assess predictive performance, we conducted a leave-one-plot-out cross-validation of the proposed mechanistic model, comparing the cross-validated RMSE, MAE, bias and predictive R2 against the original in-sample fit (Table 8). The cross-validated metrics were very close to the in-sample values, indicating that the model generalises well to plots not used in parameter estimation and is not overfitted
Table 8Leave-one-plot-out cross-validation of the proposed mechanistic model (Sect. 2.4), compared against the original in-sample fit. RMSE and MAE in µmol CO2 m−2 s−1. R2 (prediction): coefficient of determination between observed and cross-validated predicted values.

As a robustness check, we compared the original fit (Table 6, Fig. 12) against a nonlinear mixed-effects formulation of the same model incorporating alternative temporal correlation structures (Sect. 2.4). Models incorporating a first-order autoregressive structure (corAR1) converged and yielded parameter estimates broadly consistent with the original fit (Table S2, Fig. S1), with optimum temperatures () shifting modestly (+0.5 to +1.5 °C) while preserving the same ranking between plant communities. More complex correlation structures (e.g., corARMA) also converged but were less stable, with parameter estimates more sensitive to model specification. Residual temporal autocorrelation could not be fully eliminated under any structure tested; we consider this likely to reflect shared seasonal environmental drivers acting on soil respiration across all plots simultaneously, rather than a violation of the independence assumption. Because the mixed-effects formulation introduces variance components that are not part of the theoretical relationship being tested, and given the sensitivity of these components to model specification, we regard the mixed-effects results primarily as a sensitivity analysis (Table S2, Fig. S1) rather than as an alternative primary estimate; the original model is retained as our main result.
The soil physicochemical characterization revealed a notable textural homogeneity across all study sites and plant communities, with all soils classified as Sandy Loam (sand content 71 %–77 %). This uniformity supports the comparability of measurements across sites and suggests that differences in soil CO2 efflux among plant communities are more likely attributable to vegetation cover and its influence on microclimate and organic matter inputs than to contrasting soil physical properties. Nevertheless, marked differences in WHC were observed between communities, with PG-D soils showing the highest values (53.25 ± 9.09 %), which may partly reflect the greater root biomass and organic matter accumulation typically associated with perennial grasslands. Given that soil moisture emerged as the dominant driver of CO2 efflux in this study, the higher water retention capacity of PG-D soils may contribute to explaining the respiration dynamics observed in this community. Additionally, the consistently lower pH recorded in PG-D soils (6.33 ± 0.11) compared to the remaining communities (7.32–8.22) may favour higher microbial activity, as near-neutral pH values are generally considered optimal for soil microbial communities (Rousk et al., 2010)
The climatic variables (both atmospheric and soil-related) followed a typical Mediterranean pattern, characterized by cold – wet winters and warm – dry summers that generate highly transient soil moisture dynamics (Seager et al., 2019). The climatic evolution drove CO2 emissions in a consistent, parallel pattern. In our study site, soil moisture was markedly higher in winter and sharply declined through spring and summer compared to atmospheric moisture, consistent with the strong seasonal decoupling between precipitation and temperature that controls soil water availability in Mediterranean ecosystems (Viola et al., 2008). No differences were found between plant communities with the exception of CO2 emissions, with PH-M producing higher soil CO2 emission rates, and showing higher variability, than the other communities.
Soil respiration under Mediterranean climates clearly does not follow the general assumptions derived from other climatic regions (González-Ubierna and Lai, 2019). SST is not the clear driver of SR, and at the global scale there is no simple positive correlation between them because their relationship often follows a Gaussian-like response, with an optimum temperature beyond which SR declines (Lellei-Kovács et al., 2011; Anjileli et al., 2019). This non-linear behaviour has been reported in Mediterranean agricultural soils (González-Ubierna and Lai, 2019), natural ecosystems (Anjileli et al., 2019) and is now also observed under urban conditions. The Q10 index is therefore not useful in highly variable climates, such as Mediterranean ones (Chang et al., 2014; Meyer et al., 2018), and is not at all recommended under urban conditions (Wu et al., 2021 highlighted the doubts about Q10 index in a changing climate). Consistent with this, our own model comparison confirmed that the Q10 formulation performed markedly worse than both the Gaussian and the proposed mechanistic model. The UHI effect does not seem to substantially modify the shape of the SR–SST relationship, whereas the influence of soil water availability and rewetting pulses, expressed as a RWi, appears to be largely suppressed under urban conditions even in the absence of irrigation, likely due to reduced effective infiltration, soil sealing and altered rainfall partitioning (Scalenghe and Marsan, 2009; Gillefalk et al., 2021). Some authors have highlighted the impact of the UHI effect on drying intensity and the consequent reduction or elimination of rewetting pulses on CO2 emissions (Tautenhahn et al., 2026). Soil moisture and RWi showed a strong positive influence on soil CO2 emissions, without a clear maximum, which contradicts the patterns reported for Mediterranean soils under natural and semi-natural conditions. In contrast to the typical Mediterranean pattern, where drying–rewetting events generate discrete CO2 pulses superimposed on a temperature-driven seasonal cycle (Talmon et al., 2011; León et al., 2014; Bautista et al., 2021), SR in our urban sites increased monotonically with SSM and RWi within the observed range, without a marked optimum. In relation with RWi, the relation was consistent below 20, since with higher values, and due to poor water management in general (Tautenhahn et al., 2026), produced a weaker influence.
The plant community showed a modest effect on SR, with a single significant difference between PH-M and the other three communities (AH-D, AG-H, and PG-D). Because soil and atmospheric temperature did not differ significantly among plant communities, and because the visiting order of parks and sampling points was systematically rotated and randomized across a wide daily window (08:00–19:00), the higher emissions observed in PH-M cannot be attributed to a systematic measurement-time temperature bias, but rather point to an intrinsic community-level effect, likely related to soil disturbance and litter quality. PH-M exhibited the highest interannual variability and the greatest net CO2 emission rates, whereas PG-D showed the most stable temporal pattern over the year. No differences in climatic conditions were observed among communities, indicating that the effect is linked to plant community composition rather than to climate, or than the influence of plants on climate. Wang et al. (2014) highlighted the impact of plant communities on modifying SST sensitivity of SR. The effect of litter inputs is widely related to SR (Stanek and Stefanowicz, 2019; Woś et al., 2023; Zhang and Wang, 2015), due to their impact on microbial communities. In urban conditions, however, litter is not only coming from vegetation, and human wastes significantly alter soil carbon cycle and dynamics. PH-M is indicative of soil perturbation (Molina et al., 2023), which could explain the differences found. This was translated into a higher variability on the SR and RWi relationship in PH-M communities, due to the disruption of macronutrient cycles and its impact on microbial activities (Torija et al., 2026). In contrast, AH-D displayed the most stable interannual SR–RWi relationship, which can be attributed to more balanced nutrient cycles and to lower enzymatic and microbial activities relative to the more disturbed PH-M communities, in agreement with studies linking higher functional stability to less disturbed, structurally more complex ecosystems (Gough et al., 2021).
The Gaussian model describing the relationship between SR and SST exhibited a maximum at 18.4 °C, slightly lower than the optimum temperature reported for peri-urban agricultural soils in the same area (González-Ubierna et al., 2014). In semi-arid and Mediterranean climates, this Gaussian behaviour has been attributed to the combined effects of SST and SSM, which jointly constrain soil CO2 efflux under warm and dry, or cold and wet conditions (Lellei-Kovács et al., 2011; Chang et al., 2014). These studies have also shown that the SR optimum shifts towards higher temperatures when SSM is higher, whereas low SSM can inhibit microbial activity and thus lower the temperature at which soil respiration peaks. In our case, compared with the 2014 study, the data indicated predominantly high-moisture conditions (according to the original SSM classes), above 0.20 m3 m−3, previously identified as a threshold that constrains soil respiration and masks its dependence on soil temperature (Rey et al., 2002; Tedeschi et al., 2006). Thus, SR did not exhibit a moisture optimum but instead increased exponentially with SSM, which is consistent with the absence of very low SSM values and likely prevented moisture limitation. Under these conditions, the interaction between relatively warm SST and consistently high SSM may promote an exponential rather than a Gaussian SR–SSM relationship (Lellei-Kovács et al., 2016). In Mediterranean ecosystems, once soil water content exceeds the limiting threshold, the typical Arrhenius-type exponential increase of soil respiration with soil temperature re-emerges and respiration tends to increase monotonically with soil moisture, rather than showing bell-shaped moisture responses. Under these conditions, the interaction between relatively warm SST and consistently high SSM may therefore promote an exponential, rather than Gaussian, SR–SSM relationship.
It should be noted that the 18.4 °C breakpoint was estimated from a pooled dataset spanning a full annual cycle, and therefore predominantly reflects seasonal rather than diurnal variation in SST, given the defined daily sampling window and rotated visiting order described in Sect. 2.2. The narrow 95 % confidence interval of this estimate (17.17–19.79 °C) further supports its robustness as a meaningful threshold rather than a statistical artefact.
In cold conditions (SST < 18.4 °C), SST positively and approximately linearly influenced soil CO2 emissions and was the main driver of SR variability, as typically observed in temperate climates (Richardson et al., 2012; Zhou et al., 2014). The strong relationship between SST and SR meant that SSM and RWi showed no significant statistical relationship with SR, although SSM still tended to exhibit a positive association with soil CO2 efflux. The relatively high SSM values (above 0.20 m3 m−3, previously identified as a threshold that constrains soil respiration and masks its dependence on soil temperature (Rey et al., 2002; Tedeschi et al., 2006), and which are represented by the disconnect between SSM and SST, likely avoided limitations to microbial and root activities and may therefore explain the weak influence of water-related variables on SR variation (Chang et al., 2014). This suggests that under urban Mediterranean conditions, there are no clear rewetting pulses at high SSM combined with low SST (Morillas et al., 2017). Within this part of the response surface, PH-M produced higher CO2 emissions than all other communities except AG-H when controlling for soil water variables, and higher emissions than AH-D when the effect of SST was removed.
In warmer conditions (SST > 18.4 °C), soil water variables became the main drivers of SR, with both SSM and RWi exerting a positive influence on soil CO2 emissions, whereas SST had no detectable effect or even a slight negative effect once water-related variables were accounted for (Chang et al., 2014; Conant et al., 2004). This pattern is consistent with Mediterranean and semi-arid studies showing that soil moisture can overrule the temperature dependence of soil respiration under warm and dry conditions (Rey et al., 2002; Chang et al., 2014). The constriction of SSM at high SST (values frequently falling below 0.20 m3 m−3 during part of the year within this temperature range, with a negative correlation between the two variables) likely limited microbial and root activities, reducing CO2 emissions and driving their variability, in line with reported moisture thresholds that constrain soil respiration and mask its dependence on soil temperature (Rey et al., 2002; Tedeschi et al., 2006; Chang et al., 2014). Within this portion of the response surface, the PH-M community exhibited higher SR than the other communities even after controlling for climatic variables (SST, SSM and RWi), which agrees with previous findings that vegetation type and associated soil properties can generate consistent differences in soil CO2 efflux under similar microclimatic conditions (Rey et al., 2011; Han et al., 2014).
The development of a specific model allows us to analyze these relationships deeper. The biological rationale for the negative temperature effect is grounded in the interaction between soil temperature and soil moisture (Rey et al., 2022; Lellei-Kovács et al., 2016; González-Ubierna and Lai, 2019). Consider a soil system in which microbial activity drives CO2 emissions, in the absence of moisture, microbial communities would progressively decline, reducing respiration rates (Manzoni et al., 2012). Under these conditions, increasing temperature would accelerate desiccation and microbial mortality, further decreasing respiration. When moisture is reintroduced, however, temperature and moisture interact synergistically: higher moisture availability enables microbial activity, and the combination of warmth and moisture jointly stimulates CO2 emissions (Moyano et al., 2013; Brangarí et al., 2020). The critical constraint is that, in Mediterranean environments, increasing temperature inevitably leads to decreasing soil moisture, the two variables are negatively correlated. This physical coupling means that temperature and moisture cannot increase simultaneously without bound, and it is precisely this constraint that generates the unimodal response of soil respiration to temperature: emissions rise as temperature increases while moisture remains sufficient, but decline once temperature-driven desiccation reduces moisture below the level needed to sustain microbial activity (Alster et al., 2023). In the same way, the proposed model first describes how CO2 emissions would evolve with temperature alone, under the limiting assumption of zero moisture, and then introduces the moisture-temperature interaction to capture the full observed dynamics. The result is a biologically interpretable model that reproduces the unimodal structure of the data and is consistent with the known controls of microbial respiration in water-limited ecosystems (Peng et al., 2026).
Our results reinforce the idea that SST and SSM interact to control soil CO2 emissions under Mediterranean conditions (including now urban ones), with SR responding to whichever is the most limiting factor (Almagro et al., 2009; Chang et al., 2014; Bautista et al., 2021). These findings point to a more complex and nuanced role of the UHI in regulating urban soil CO2 fluxes than is commonly assumed. Rather than acting primarily as a thermal stimulator of microbial activity, as would be predicted by temperature-driven models such as Q10, the UHI in Mediterranean urban settings appears to operate predominantly as a drying agent, particularly during the summer period when its thermal effect is most intense and soil moisture reaches its seasonal minimum. This interpretation is consistent with the emerging concept of the Urban Dry Island (UDI), whereby the replacement of vegetated surfaces with impervious materials reduces evapotranspiration and infiltration, thereby lowering soil moisture availability even in unsealed green spaces embedded within the urban matrix (Hao et al., 2023; Scalenghe and Marsan, 2009). Under such conditions, the thermal energy that the UHI adds to the system is largely dissipated as sensible rather than latent heat, further accelerating soil desiccation and limiting the microbial and root activity that drives SR (Manoli et al., 2019). It should be noted, however, that the study period registered relatively high soil moisture conditions for much of the year, consistent with above-average precipitation during the monitoring period. Under these conditions, moisture limitation was only partially expressed, which may explain why SR responded exponentially to SSM rather than showing the bell-shaped optimum typical of more severely water-limited systems. This suggests that the drying effect of the UHI, while structurally present, was partially buffered by the interannual climatic variability of the monitoring period, and that its full suppressive impact on SR may be more pronounced in drier years. Consequently, the net effect of the UHI on soil CO2 emissions in Mediterranean cities is paradoxical: rather than enhancing SR as observed in temperate urban systems, it tends to suppress average emission rates while simultaneously increasing their temporal variability – driven by episodic rewetting pulses that briefly overcome moisture limitation (Tautenhahn et al., 2026; Gillefalk et al., 2021). This drying-dominated UHI effect also helps explain the suppression of rewetting pulses observed in our sites compared to non-urban Mediterranean ecosystems, likely attributable to reduced effective infiltration and altered rainfall partitioning in the urban environment (Scalenghe and Marsan, 2009; Gillefalk et al., 2021).
Plant communities differed in their modelled respiration parameters, revealing ecologically interpretable patterns. The inverse relationship between basal respiration and maximum respiration capacity, with communities with lower basal rates tending to reach higher maxima, suggests a functional trade-off between constitutive microbial activity and the capacity to respond to optimal temperature and moisture conditions. PH-M consistently showed the highest SR both annually and at the temperature optimum, reflecting the greater soil perturbation and labile carbon availability associated with this community (Molina et al., 2023; Torija et al., 2026). In contrast, PG-D exhibited the highest basal SR and the lowest temperature optimum, consistent with the more stable and recalcitrant carbon inputs characteristic of perennial grassland communities (Stanek and Stefanowicz, 2019). AH-D displayed intermediate behaviour across all parameters.
The most ecologically informative pattern was the positive correlation between the sensitivity of SR to soil moisture and the temperature optimum for SR: AG-H and PH-M, the communities with the strongest moisture influence on respiration, also showed the highest temperature optima (Schipper et al., 2019; Zhou et al., 2014). For AG-H, dominated by the annual grass Hordeum leporinum, this pattern is consistent with its phenological strategy. In Mediterranean urban environments, AG-H develops during autumn–winter and reaches peak biomass and root activity in spring, precisely when urban soils in Madrid retain moisture while soil temperatures rise rapidly (Molina et al., 2023; Xu and Baldocchi, 2004). This creates a narrow but intense seasonal window during which labile rhizospheric carbon inputs are highest and microbial activity is tightly coupled to both temperature and moisture simultaneously (Placella et al., 2012; Bahn et al., 2008), conditions that are expected to enhance the apparent sensitivity of soil respiration to these two drivers. As the growing season ends and soils dry, control shifts almost entirely to moisture availability (Chang et al., 2014; Almagro et al., 2009), explaining why AG-H shows the lowest basal respiration values despite its high maximum capacity.
These findings have direct implications for the management of urban green spaces in Mediterranean cities. Since soil moisture, and not temperature, is the dominant driver of CO2 efflux, management strategies that preserve or enhance soil water availability are likely to have a greater influence on the urban soil carbon balance than those focused on thermal regulation alone. Practical measures include reducing impervious surface cover adjacent to green spaces to improve lateral water inputs, enhancing soil infiltration capacity through reduced compaction and the incorporation of organic amendments, and implementing moisture-sensitive irrigation regimes adapted to the pronounced seasonal drought characteristic of Mediterranean cities. The Gaussian temperature response identified here further suggests that conventional temperature-based models used in urban carbon accounting tools will systematically overestimate soil CO2 emissions during summer months in water-limited Mediterranean cities, as they do not account for the simultaneous decline in soil moisture. Incorporating moisture-temperature coupling into urban green space management planning and carbon monitoring protocols would improve the accuracy of urban carbon budgets and support more effective climate adaptation strategies.
Some limitations of this study should be acknowledged. First, the monitoring period (April 2023–April 2024) was characterised by above-average precipitation for the Madrid region, which may have partially buffered the moisture limitation typically observed in Mediterranean urban soils during dry years. The dominance of soil moisture as a driver of SR and the absence of a clear moisture optimum may therefore reflect the specific hydroclimatic conditions of the monitoring period, and the relationships identified here should be validated across contrasting hydrological years. Second, total soil CO2 efflux was measured without partitioning autotrophic and heterotrophic components, as vegetation was removed prior to each measurement to avoid above-ground interference. While this approach is standard in field-based SR studies and minimises confounding effects of above-ground plant respiration, it precludes direct attribution of CO2 fluxes to microbial versus root-derived sources. Finally, the study was conducted across three urban green spaces in Madrid, and the generalisability of the findings to other Mediterranean cities or urban contexts with different soil management histories, vegetation structures, or degrees of imperviousness should be tested in future research.
Soil respiration in the studied Mediterranean urban green spaces does not follow the conventional Q10 exponential model. Instead, a Gaussian (unimodal) relationship between SR and soil temperature was identified, with a positive correlation below a breakpoint of 18.4 °C and a negative effect above this threshold, consistent across all plant communities studied. This finding challenges the universal applicability of temperature-based respiration models in water-limited urban environments and suggests that Q10-based approaches may misrepresent soil CO2 dynamics in Mediterranean cities.
Soil moisture emerged as the dominant driver of SR in the studied urban green spaces, exhibiting a positive exponential relationship with CO2 efflux across all plant communities. The rewetting index showed an additional positive logarithmic effect on SR for values below 20, reflecting the importance of episodic precipitation pulses in triggering CO2 emissions in these water-limited systems. Above this threshold, the relationship weakened, likely due to reduced effective infiltration under urban conditions.
The apparent negative effect of temperature on SR above 18.4 °C is not a direct thermal suppression of microbial activity, but rather an indirect consequence of the strong negative coupling between soil temperature and soil moisture in the Mediterranean climate, and should be considered when developing models of urban soil carbon fluxes in comparable Mediterranean urban settings.
A mechanistic model was developed describing SR as the joint outcome of temperature-driven moisture loss and moisture-stimulated CO2 emissions. The model successfully reproduced the unimodal structure of the observed data and provided biologically interpretable parameters for each plant community, offering a more ecologically realistic alternative to monotonic temperature-based formulations for water-limited urban ecosystems.
The urban heat island effect did not act primarily as a thermal stimulator of SR, as is commonly assumed for temperate urban systems. Instead, it appears to operate predominantly as a drying agent, suppressing average SR rates while increasing their temporal variability through episodic rewetting pulses. This drying-dominated role of the UHI, while consistent with the observed data, was partially buffered by above-average precipitation during the monitoring period, and its full suppressive impact on SR may be more pronounced in drier years.
Plant community identity had a limited overall effect on SR dynamics. The only significant exception was the perennial herb community dominated by Malva spp., which consistently produced higher CO2 emission rates and greater temporal variability than the other communities, likely reflecting greater soil perturbation and labile carbon availability associated with this ruderal community. Among the remaining communities, the annual grassland dominated by Hordeum leporinum showed the strongest sensitivity of SR to soil moisture and the highest temperature optimum, consistent with its phenological strategy of concentrating root activity and labile carbon inputs during the moist and warming spring period.
These findings collectively highlight the need for moisture-integrated approaches to accurately model soil CO2 fluxes in Mediterranean urban green spaces such as those studied here, and underscore the importance of accounting for the drying role of the urban heat island when projecting urban carbon budgets, pending validation across a broader range of cities and hydrological years.
The data underlying this study are deposited in the Zenodo repository and are publicly accessible via https://doi.org/10.5281/zenodo.22842075 (Alía et al., 2026). In the meantime, the data are available from the corresponding author (Sergio González-Ubierna; sergonza@ucm.es) upon reasonable request. During the review process, data can be made available to reviewers upon request.
The supplement related to this article is available online at https://doi.org/10.5194/soil-12-915-2026-supplement.
TA: Investigation, Data curation, Formal analysis, Validation, Writing (review and editing). SGU: Methodology, Data curation, Validation, Writing (original draft preparation). ASJ: Formal analysis, Methodology (mechanistic modelling), Writing (review and editing). RAC: Investigation, Data curation, Writing (review and editing). MAC: Conceptualization, Funding acquisition, Project administration, Writing (review and editing).
The contact author has declared that none of the authors has any competing interests.
Publisher's note: Copernicus Publications remains neutral with regard to jurisdictional claims made in the text, published maps, institutional affiliations, or any other geographical representation in this paper. The authors bear the ultimate responsibility for providing appropriate place names. Views expressed in the text are those of the authors and do not necessarily reflect the views of the publisher.
In loving memory of José Ramón Quintana Nieto, whose passion, kindness, and dedication will always remain with us. You were always looking for a better world and made ours a better place. Gracias siempre, Jose.
This work has been carried out as part of the project “Beneficios Ecosistémicos de los Espacios Verdes Urbanos Mediterráneos para una Transición Ecológica”, funded through the Proyectos de Transición Ecológica y Transición Digital programme (1 December 2022–1 November 2025). The authors gratefully acknowledge the Agencia Estatal de Meteorología (AEMET) for providing the meteorological data used in this study.
The authors used Claude (Anthropic) as an AI-assisted tool to support manuscript preparation, including text editing and revision. All scientific content, data, analyses, and conclusions are the sole responsibility of the authors.
This research has been supported by the Ministerio de Ciencia e Innovación (grant no. TED2021-130043B-I00).
This paper was edited by Marta Dondini and reviewed by Susana Ferreira and one anonymous referee.
Alía, T., Abad-Calderón, R., Quintana, J. R., Casermeiro, M. A., Fernández-Sanjulián, J., and González-Ubierna, S.: Aggregate-scale carbon dynamics in urban Mediterranean soils: Insights from enzyme activities and organic matter distribution, Appl. Soil Ecol., 212, 106176, https://doi.org/10.1016/j.apsoil.2025.106176, 2025.
Alía, T., González-Ubierna, S., Sánchez-Jiménez, A., Abad-Calderón, R., and Casermeiro, M. A.: Soil CO2 efflux, temperature, and moisture data from Mediterranean urban green spaces in Madrid, Spain (April 2023–April 2024), Zenodo [data set], https://doi.org/10.5281/zenodo.22842075, 2026.
Almagro, M., López, J., Querejeta, J. I., and Martínez-Mena, M.: Temperature dependence of soil CO2 efflux is strongly modulated by seasonal patterns of moisture availability in a Mediterranean ecosystem, Soil Biol. Biochem., 41, 594–605, https://doi.org/10.1016/j.soilbio.2008.12.021, 2009.
Alster, C. J., van de Laar, A., Goodrich, J. P. Arcus, V. L., Deslippe, J. R., Marshall, A. J., and Schipper, L. A.: Quantifying thermal adaptation of soil microbial respiration, Nat. Commun., 14, 5459, https://doi.org/10.1038/s41467-023-41096-x, 2023.
Anjileli, H., Moftakhari, H. R., Mazdiyasni, O., Norouzi, H., Ashraf, S., Farahmand, A., Bowler, P., Azarderakhsh, M., Huxman, T. E., and AghaKouchak, A.: Analyzing high-frequency soil respiration using a probabilistic model in a semiarid, Mediterranean climate, J. Geophys. Res.-Biogeo., https://doi.org/10.1029/2018JG004640, 2019.
Argüeso, D., Evans, J. P., Fita, L., and Bormann, K. J.: Temperature response to future urbanization and climate change, Clim. Dynam., 42, 2183–2199, https://doi.org/10.1007/s00382-013-1789-6, 2015.
Bahn, M., Rodeghiero, M., Anderson-Dunn, M., Dore, S., Gimeno, C., Drösler, M., Williams, M., Ammann, C., Berninger, F., Flechard, C., Jones, S., Balzarolo, M., Kumar, S., Newesely, C., Priwitzer, T., Raschi, A., Siegwolf, R., Susiluoto, S., Tenhunen, J., Wohlfahrt, G., and Cernusca, A.: Soil respiration in European grasslands in relation to climate and assimilate supply, Ecosystems, 11, 1352–1367, https://doi.org/10.1007/s10021-008-9198-0, 2008.
Brangarí, A. C., Manzoni, S., and Rousk, J.: A soil microbial model to analyze decoupled microbial growth and respiration during soil drying and rewetting, Soil Biol. Biochem., 148, 107871, https://doi.org/10.1016/j.soilbio.2020.107871, 2020.
Bates, D., Mächler, M., Bolker, B., and Walker, S.: Fitting Linear Mixed- Effects Models Using lme4, J. Stat. Softw., 67, 1–48, https://doi.org/10.18637/jss.v067.i01, 2015.
Bautista, I., Lidón, A., Lull, C., González-Sanchis, M., and del Campo, A. D.: Thinning decreased soil respiration differently in two dryland Mediterranean forests with contrasted soil temperature and humidity regimes, Eur. J. Forest Res., 140, 1059–1077, https://doi.org/10.1007/s10342-021-01413-9, 2021.
Bond-Lamberty, B. and Thomson, A.: A global database of soil respiration data, Biogeosciences, 7, 1915–1926, https://doi.org/10.5194/bg-7-1915-2010, 2010.
Chang, C. T., Sabaté, S., Sperlich, D., Poblador, S., Sabater, F., and Gracia, C.: Does soil moisture overrule temperature dependence of soil respiration in Mediterranean riparian forests?, Biogeosciences, 11, 6173–6185, https://doi.org/10.5194/bg-11-6173-2014, 2014.
Chen, S., Zou, J., Hu, Z., Chen, H., and Lu, Y.: Global annual soil respiration in relation to climate, soil properties and vegetation characteristics: Summary of available data, Agr. Forest Meteorol., 198–199, 335–346, https://doi.org/10.1016/j.agrformet.2014.08.020, 2014.
Chen, W., Jia, X., Zha, T., Wu, B., Zhang, Y., Li, C., Wang, X., He, G., Yu, H., and Chen, G.: Soil respiration in a mixed urban forest in China in relation to soil temperature and water content, Eur. J. Soil Biol., 54, 63–68, https://doi.org/10.1016/j.ejsobi.2012.10.001, 2013.
Conant, R. T., Dalla-Betta, P., Klopatek, C. C., and Klopatek, J. M.: Controls on soil respiration in semiarid soils, Soil Biol. Biochem., 36, 945–951, https://doi.org/10.1016/j.soilbio.2004.02.013, 2004.
Correia, A. C., Minunno, F., Caldeira, M. C., Banza, J., Mateus, J., Carneiro, M., Wingate, L., Shvaleva, A., Ramos, A., Jongen, M., Bugalho, M. N., Nogueira, C., Lecomte, X., and Pereira, J. S.: Soil water availability strongly modulates soil CO2 efflux in different Mediterranean ecosystems: model calibration using the Bayesian approach, Agr. Ecosyst. Environ., 161, 88–100, https://doi.org/10.1016/j.agee.2012.07.025, 2012.
Curiel Yuste, J., Janssens, I. A., Carrara, A., and Ceulemans, R.: Annual Q10 of soil respiration reflects plant phenological patterns as well as temperature sensitivity, Glob. Change Biol., 10, 161–169, https://doi.org/10.1111/j.1529-8817.2003.00727.x, 2004.
Davidson, E. A., Savage, K., Verchot, L. V., and Navarro, R.: Minimizing artifacts and biases in chamber-based measurements of soil respiration, Agr. Forest Meteorol., 113, 21–37, https://doi.org/10.1016/S0168-1923(02)00100-4, 2002.
Decina, S. M., Hutyra, L. R., Gately, C. K., Getson, J. M., Reinmann, A. B., Short Gianotti, A. G., and Templer, P. H.: Soil respiration contributes substantially to urban carbon fluxes in the greater Boston area, Environ. Pollut., 212, 433–439, https://doi.org/10.1016/j.envpol.2016.01.012, 2016.
Donateo, A., Palusci, O., Pappaccogli, G., Esposito, A., Martilli, A., Santiago, J. L., and Buccolieri, R.: Analysis of urban heat island and human thermal comfort in a Mediterranean city: A case study of Lecce (Italy), Sustain. Cities Soc., 98, 104849, https://doi.org/10.1016/j.scs.2023.104849, 2023.
Fasola, S., Muggeo, V. M. R., and Kuchenhoff, K.: A heuristic, iterative algorithm for change-point detection in abrupt change models, Comput. Stat., 33, 997–1015, https://doi.org/10.1007/s00180-017-0740-4, 2018.
Fierer, N. and Schimel, J. P.: Effects of drying–rewetting frequency on soil carbon and nitrogen transformations, Soil Biol. Biochem., 34, 777–787, https://doi.org/10.1016/S0038-0717(02)00007-X, 2002.
Gillefalk, M., Tetzlaff, D., Hinkelmann, R., Kuhlemann, L.-M., Smith, A., Meier, F., Maneta, M. P., and Soulsby, C.: Quantifying the effects of urban green space on water partitioning and ages using an isotope-based ecohydrological model, Hydrol. Earth Syst. Sci., 25, 3635–3652, https://doi.org/10.5194/hess-25-3635-2021, 2021.
Goncharova, O., Matyshak, G., Udovenko, M., Semenyuk, O., Epstein, H., and Bobrik, A.: Temporal dynamics, drivers, and components of soil respiration in urban forest ecosystems, Catena, 185, 104299, https://doi.org/10.1016/j.catena.2019.104299, 2020.
González-Ubierna, S. and Lai, R.: Modelling the effects of climate factors on soil respiration across Mediterranean ecosystems, J. Arid Environ., 168, 10–21, https://doi.org/10.1016/j.jaridenv.2019.02.008, 2019.
González-Ubierna, S., de la Cruz, M. T., and Casermeiro, M. A.: Climate factors mediate soil respiration dynamics in Mediterranean agricultural environments: an empirical approach, Soil Res., 52, 543–553, https://doi.org/10.1071/SR14008, 2014.
Ghosh, S., Scharenbroch, B. C., and Ow, L. F.: Soil organic carbon distribution in roadside soils of Singapore, Chemosphere, 165, 163–172, https://doi.org/10.1016/j.chemosphere.2016.09.028, 2016.
Gough, C. M., Atkins, J. W., Hardiman, B. S., Bond-Lamberty, B., Fahey, R. T., Curtin, S. J., Graves, S. J., Haber, L. T., Stuart-Haëntjens, E. J., Mathes, K. C., Nave, L. E., Reed, D. E., Sanders-DeMott, R., Scheuermann, C. M., and Shugart, H. H.: Forest structural complexity and biomass predict first-year carbon cycling resistance to disturbance, Ecosystems, 24, 687–704, https://doi.org/10.1007/s10021-020-00544-1, 2021.
Han, G., Xing, Q., Luo, Y., Rafique, R., Yu, J., and Mikle, N.: Vegetation types alter soil respiration and its temperature sensitivity at the field scale in an estuary wetland, PLOS ONE, 9, e91182, https://doi.org/10.1371/journal.pone.0091182, 2014.
Hao, L., Sun, G., Huang, X., Tang, R., Jin, K., Lai, Y., Chen, D., Zhang, Y., Zhou, D., Yang, Z.-L., Wang, L., Dong, G., and Li, W.: Urbanization alters atmospheric dryness through land evapotranspiration, npj Clim. Atmos. Sci., 6, 149, https://doi.org/10.1038/s41612-023-00479-z, 2023.
Hashimoto, S., Carvalhais, N., Ito, A., Migliavacca, M., Nishina, K., and Reichstein, M.: Global spatiotemporal distribution of soil respiration modeled using a global database, Biogeosciences, 12, 4121–4132, https://doi.org/10.5194/bg-12-4121-2015, 2015.
Hibbard, K. A., Law, B. E., Reichstein, M., and Sulzman, J.: An analysis of soil respiration across northern hemisphere temperate ecosystems, Biogeochemistry, 73, 29–70, https://doi.org/10.1007/s10533-004-2946-0, 2005.
IPCC: Global Warming of 1.5 °C. An IPCC Special Report on the impacts of global warming of 1.5 °C above pre-industrial levels, Special report, https://www.ipcc.ch/sr15/ (last access: 10 February 2026), 2018.
Ivashchenko, K., Ananyeva, N., Vasenev, V., Sushko, S., Seleznyova, A., and Kudeyarov, V.: Microbial C-availability and organic matter decomposition in urban soils of megapolis depend on functional zoning, Soil Environ., 38, https://doi.org/10.25252/SE/19/61524, 2019.
Jarvis, P., Rey, A., Petsikos, C., Wingate, L., Rayment, M., Pereira, J., Banza, J., David, J., Miglietta, F., Borghetti, M., Manca, G., and Valentini, R.: Drying and wetting of Mediterranean soils stimulates decomposition and carbon dioxide emission: the Birch effect, Tree Physiol., 27, 929–940, https://doi.org/10.1093/treephys/27.7.929, 2007.
Jian, J., Steele, M. K., Day, S. D., and Thomas, R. Q.: Future global soil respiration rates will swell despite regional decreases in temperature sensitivity caused by rising temperature, Earth's Future, 6, 1539–1554, https://doi.org/10.1029/2018EF000937, 2018.
Jian, J., Vargas, R., Anderson-Teixeira, K. J., Stell, E., Herrmann, V., Horn, M., Kholod, N., Manzon, J., Marchesi, R., Paredes, D., and Bond-Lamberty, B. P.: A Global Database of Soil Respiration Data, Version 5.0. ORNL DAAC [data set], https://doi.org/10.3334/ORNLDAAC/1827, 2021.
Karvinen, E., Backman, L., Järvi, L., and Kulmala, L.: Soil respiration across a variety of tree-covered urban green spaces in Helsinki, Finland, SOIL, 10, 381–406, https://doi.org/10.5194/soil-10-381-2024, 2024.
Kaye, J. P., Burke, I. C., Mosier, A. R., and Guerschman, J. P.: Methane and nitrous oxide fluxes from urban soils to the atmosphere, Ecol. Appl., 14, 975–981, https://doi.org/10.1890/03-5115, 2004.
Lellei-Kovács, E., Kovács-Láng, E., Botta-Dukát, Z., Kalapos, T., Emmett, B., and Beier, C.: Thresholds and interactive effects of soil moisture on the temperature response of soil respiration, Eur. J. Soil Biol., 47, 247–255, https://doi.org/10.1016/j.ejsobi.2011.05.004, 2011.
Lellei-Kovács, E., Botta-Dukát, Z., de Dato, G., Estiarte, M., Guidolotti, G., Kopittke, G. R., Kovács-Láng, E., Kröel-Dulay, G., Larsen, K. S., Peñuelas, J., Smith, A. R., Sowerby, A., Tietema, A., and Schmidt, I. K.: Temperature dependence of soil respiration modulated by thresholds in soil water availability across European shrubland ecosystems, Ecosystems, 19, 1460–1477, https://doi.org/10.1007/s10021-016-0016-9, 2016.
León, E., Vargas, R., Bullock, S., López, E., Panosso, A. R., and La Scala, N.: Hot spots, hot moments, and spatio-temporal controls on soil CO2 efflux in a water-limited ecosystem, Soil Biol. Biochem., 77, 12–21, https://doi.org/10.1016/j.soilbio.2014.05.029, 2014.
Lenth, R.: emmeans: Estimated Marginal Means, aka Least-Squares Means, R package version 1.11.2-8, https://doi.org/10.32614/CRAN.package.emmeans, 2025.
Lloyd, J. and Taylor, J. A.: On the temperature dependence of soil respiration, Funct. Ecol., 8, 315–323, https://doi.org/10.2307/2389824, 1994.
Luber, G. and McGeehin, M.: Climate change and extreme heat events, Am. J. Prev. Med., 35, 429–435, https://doi.org/10.1016/j.amepre.2008.08.021, 2008.
Luo, Y. and Zhou, X.: Soil Respiration and the Environment, Elsevier/Academic Press, Amsterdam, 316 pp., ISBN 978-0-12-088782-8, https://doi.org/10.1016/B978-0-12-088782-8.X5000-1, 2006.
Manoli, G., Fatichi, S., Schläpfer, M., Yu, K., Crowther, T. W., Meili, N., Burlando, P., Katul, G. G., and Bou-Zeid, E.: Magnitude of urban heat islands largely explained by climate and population, Nature, 573, 55–60, https://doi.org/10.1038/s41586-019-1512-9, 2019.
Manzoni, S., Schimel, J. P., and Porporato, A.: Responses of soil microbial communities to water stress: results from a meta-analysis, Ecology, 93, 930–938, https://doi.org/10.1890/11-0026.1, 2012.
Matteucci, M., Gruening, C., Goded Ballarin, I., Seufert, G., and Cescatti, A.: Components, drivers and temporal dynamics of ecosystem respiration in a Mediterranean pine forest, Soil Biol. Biochem., 88, 224–235, https://doi.org/10.1016/j.soilbio.2015.05.017, 2015.
Meyer, N., Welp, G., and Amelung, W.: The temperature sensitivity (Q10) of soil respiration: Controlling factors and spatial prediction at regional scale based on environmental soil classes, Global Biogeochem. Cy., 32, 306–323, https://doi.org/10.1002/2017GB005644, 2018.
Molina, J. A., Martín-Sanz, J. P., Casermeiro, M. Á., and Quintana, J. R.: Spontaneous urban vegetation as an indicator of soil functionality and ecosystem services, Appl. Veg. Sci., 26, e12728, https://doi.org/10.1111/avsc.12728, 2023.
Morillas, L., Roales, J., Portillo-Estrada, M., and Gallardo, A.: Wetting-drying cycles influence on soil respiration in two Mediterranean ecosystems, Eur. J. Soil Biol., 82, 10–19, https://doi.org/10.1016/j.ejsobi.2017.07.002, 2017.
Moyano, F. E., Manzoni, S., and Chenu, C.: Responses of soil heterotrophic respiration to moisture availability: an exploration of processes and models, Soil Biol. Biochem., 59, 72–85, https://doi.org/10.1016/j.soilbio.2013.01.002, 2013.
Oke, T. R.: City size and the urban heat island, Atmos. Environ., 7, 769–779, https://doi.org/10.1016/0004-6981(73)90140-6, 1973.
Oyonarte, C., Rey, A., Raimundo, J., Miralles, I., and Escribano, P.: The use of soil respiration as an ecological indicator in arid ecosystems of SE of Spain: spatial variability and controlling factors, Ecol. Indic., 14, 40–49, https://doi.org/10.1016/j.ecolind.2011.08.013, 2012.
Peng, J., Xie, S., Tang, J., Liao, J., Chen, C., Sun, C., Wang, Y., Zhou, Q., Yu, G., and Niu, S.: Global evidence of the unimodal response of ecosystem respiration to soil moisture, Adv. Sci., 13, e09753, https://doi.org/10.1002/advs.202509753, 2026.
Placella, S. A., Brodie, E. L., and Firestone, M. K.: Rainfall-induced carbon dioxide pulses result from sequential resuscitation of phylogenetically clustered microbial groups, P. Natl. Acad. Sci. USA, 109, 10931–10936, https://doi.org/10.1073/pnas.1204306109, 2012.
Posit Team: RStudio: Integrated Development Environment for R, Posit Software, PBC, Boston, MA, https://www.posit.co/ (last access: 2 March 2026), 2025.
Quintana, J. R., de la Cruz Caravaca, M. T., and Casermeiro, M. A.: Suelos de la Ciudad Universitaria, in: Trabajos en sostenibilidad y resiliencia socio-ecológica en la Universidad Complutense de Madrid, edited by: Rescia Perazzo, A., Lucas Olegario, M., and Gutiérrez Sáenz, M., Ediciones Complutense, Madrid, 91–97, ISBN 978-84-669-3734-4, 2022.
R Core Team: A Language and Environment for Statistical Computing, R Foundation for Statistical Computing, Vienna, Austria, https://www.R-project.org/ (last access: 2 March 2026), 2025.
Rebele, F.: Urban ecology and special features of urban ecosystems, Global Ecol. Biogeogr., 4, 173–187, https://doi.org/10.2307/2997649, 1994.
Reichstein, M., Tenhunen, J. D., Roupsard, O., Ourcival, J. M., Rambal, S., Miglietta, F., Peressotti, A., Pecchiari, M., Tirone, G., and Valentini, R.: Severe drought effects on ecosystem CO2 and H2O fluxes at three Mediterranean evergreen sites: revision of current hypotheses?, Glob. Change Biol., 8, 999–1017, https://doi.org/10.1046/j.1365-2486.2002.00530.x, 2002.
Rey, A., Pegoraro, E., Tedeschi, V., De Parri, I., Jarvis, P. G., and Valentini, R.: Annual variation in soil respiration and its components in a coppice oak forest in Central Italy, Glob. Change Biol., 8, 851–866, https://doi.org/10.1046/j.1365-2486.2002.00521.x, 2002.
Rey, A., Pegoraro, E., Oyonarte, C., Were, A., Escribano, P., and Raimundo, J.: Impact of land degradation on soil respiration in a steppe (Stipa tenacissima L.) semiarid ecosystem in the SE of Spain, Soil Biol. Biochem., 43, 393–403, https://doi.org/10.1016/j.soilbio.2010.11.007, 2011.
Richardson, J., Chatterjee, A., and Jenerette, G. D.: Optimum temperatures for soil respiration along a semi-arid elevation gradient in southern California, Soil Biol. Biochem., 46, 89–95, https://doi.org/10.1016/j.soilbio.2011.11.001, 2012.
Rivas-Martínez, S., Rivas-Sáenz, S., and Penas, A.: Worldwide bioclimatic classification system, Glob. Geobot., 1, 1–634, 2011.
Rousk, J., Bååth, E., Brookes, P. C., Lauber, C. L., Lozupone, C., Caporaso, J. G., Knight, R., and Fierer, N.: Soil bacterial and fungal communities across a pH gradient in an arable soil, ISME J., 4, 1340–1351, https://doi.org/10.1038/ismej.2010.58, 2010.
Sæbø, A., Benedikz, T., and Randall, K.: Selection of trees for urban forestry in the Nordic countries, Urban For. Urban Gree., 2, 101–114, https://doi.org/10.1078/1618-8667-00027, 2003.
Savage, K. and Davidson, E.: A comparison of manual and automated systems for soil CO2 flux measurements: trade-offs between spatial and temporal resolution, J. Exp. Bot., 54, 891–899, https://doi.org/10.1093/jxb/erg121, 2003.
Scalenghe, R. and Marsan, F. A.: The anthropogenic sealing of soils in urban areas, Landscape Urban Plan., 90, 1–10, https://doi.org/10.1016/j.landurbplan.2008.10.011, 2009.
Schipper, L. A., Petrie, O. J., O'Neill, T. A., Mudge, P. L., Liáng, L. L., Robinson, J. M., and Arcus, V. L.: Shifts in temperature response of soil respiration between adjacent irrigated and non-irrigated grazed pastures, Agr. Ecosyst. Environ., 285, 106620, https://doi.org/10.1016/j.agee.2019.106620, 2019.
Seager, R., Osborn, T. J., Kushnir, Y., Simpson, I. R., Nakamura, J., and Liu, H.: Climate Variability and Change of Mediterranean-Type Climates, J. Climate, 32, 2887–2915, https://doi.org/10.1175/JCLI-D-18-0472.1, 2019.
Shi, B., Tang, C. S., Gao, L., Liu, C., and Wang, B.: Observation and analysis of the urban heat island effect on soil in Nanjing, China, Environ. Earth Sci., 67, 215–229, https://doi.org/10.1007/s12665-011-1501-2, 2012.
Stanek, M. and Stefanowicz, A. M.: Invasive Quercus rubra negatively affected soil microbial communities relative to native Quercus robur in a semi-natural forest, Sci. Total Environ., 696, 133977, https://doi.org/10.1016/j.scitotenv.2019.133977, 2019.
Sukopp, H. and Werner, P.: Urban environments and vegetation, in: Man's impact on vegetation, edited by: Holzner, W., Werger, M. J. A., and Ikusima, I., Dr. W. Junk Publishers, The Hague, 247–260, ISBN 978-90-6193-685-5, 1983.
Talmon, Y., Sternberg, M., and Grünzweig, J. M.: Impact of rainfall manipulations and biotic controls on soil respiration in Mediterranean and desert ecosystems along an aridity gradient, Glob. Change Biol., 17, 1108–1118, https://doi.org/10.1111/j.1365-2486.2010.02285.x, 2011.
Tang, X., Fan, S., Du, M., Zhang, W., Gao, S., Liu, S., Chen, G., Yu, Z., and Yang, W.: Spatial and temporal patterns of global soil heterotrophic respiration in terrestrial ecosystems, Earth Syst. Sci. Data, 12, 1037–1051, https://doi.org/10.5194/essd-12-1037-2020, 2020a.
Tang, X., Fan, S., Du, M., Zheng, S., Yu, G., and Zhou, Y.: Global patterns of soil heterotrophic respiration – A meta-analysis of available dataset, CATENA, 191, 104574, https://doi.org/10.1016/j.catena.2020.104574, 2020b.
Tautenhahn, S., Jung, M., Rzanny, M., Mäder, P., Reichstein, M., Ahrens, B., Bebber, A., Boho, D., Chytrý, M., Dengler, J., Jansen, F., Katal, N., Midolo, G., Tichý, L., Walther, S., Weber, U., Wittich, H. C., and Wäldchen, J.: Urbanization signatures on climate and soils uncovered by crowd-sensed plants, Nat. Cities, 3, 126–135, https://doi.org/10.1038/s44284-025-00378-9, 2026
Tedeschi, V., Rey, A., Manca, G., Valentini, R., Jarvis, P. G., and Borghetti, M.: Soil respiration in a Mediterranean oak forest at different developmental stages after coppicing, Glob. Change Biol., 12, 110–121, https://doi.org/10.1111/j.1365-2486.2005.01081.x, 2006.
Todd-Brown, K. E. O., Randerson, J. T., Post, W. M., Hoffman, F. M., Tarnocai, C., Schuur, E. A. G., and Allison, S. D.: Causes of variation in soil carbon simulations from CMIP5 Earth system models and comparison with observations, Biogeosciences, 10, 1717–1736, https://doi.org/10.5194/bg-10-1717-2013, 2013.
Tomar, U. and Baishya, R.: Seasonality and moisture regime control soil respiration, enzyme activities, and soil microbial biomass carbon in a semi-arid forest of Delhi, India, Ecol. Process., 9, 50, https://doi.org/10.1186/s13717-020-00252-7, 2020.
Torija, M. G., Quintana, J. R., Pino-Bodas, R., González-Ubierna, S., Alía, T., Abad-Calderón, R., and Molina, J. A.: Soil macronutrients cycling and plants as indicators of Mediterranean urban ecosystem condition, Soil Ecol. Lett., 8, 260391, https://doi.org/10.1007/s42832-026-0391-x, 2026.
Unger, S., Maguas, C., Pereira, J. S., David, T. S., and Werner, C.: Interpreting post-drought rewetting effects on soil and ecosystem carbon dynamics in a Mediterranean oak savannah, Agr. Forest Meteorol., 154, 9e18, https://doi.org/10.1016/j.agrformet.2011.10.007, 2012.
Van Reeuwijk, L. P.: Procedures for Soil Analysis, 6th edn., Technical Paper 9, ISRIC, Wageningen, https://wrb.isric.org/files/ISRIC_TechPap09_2002.pdf (last access: 20 November 2025), 2002.
Vardoulakis, E., Karamanis, D., Fotiadi, A., and Mihalakakou, G. The urban heat island effect in a small Mediterranean city of high summer temperatures and cooling energy demands, Sol. Energy, 94, 128–144, https://doi.org/10.1016/j.solener.2013.04.016, 2013.
Vasenev, V. I., Varentsov, M., Konstantinov, P., Romzaykina, O., Kanareykina, I., Dvornikov, Y., and Manukyan, V.: Projecting urban heat island effect on the spatial-temporal variation of microbial respiration in urban soils of Moscow megalopolis, Sci. Total Environ., 786, 147457, https://doi.org/10.1016/j.scitotenv.2021.147457, 2021
Viola, F., Daly, E., Vico, G., Cantet, M., and Porporato, A.: Transient soil moisture dynamics and climate change in Mediterranean ecosystems, Water Resour. Res., 44, W11412, https://doi.org/10.1029/2007WR006371, 2008.
Wang, B., Zha, T. S., Jia, X., Wu, B., Zhang, Y. Q., and Qin, S. G.: Soil moisture modifies the response of soil respiration to temperature in a desert shrub ecosystem, Biogeosciences, 11, 259–268, https://doi.org/10.5194/bg-11-259-2014, 2014.
Woś, B., Józefowska, A., Wanic, T., and Pietrzykowski, M.: Impact of native Quercus robur and non-native Quercus rubra on soil properties during post-fire ecosystem regeneration, Diversity, 15, 559, https://doi.org/10.3390/d15040559, 2023.
Wu, Q., Ye, R., Bridgham, S. D., and Jin, Q.: Limitations of the Q10 coefficient for quantifying temperature sensitivity of anaerobic organic matter decomposition: A modelling based assessment, J. Geophys. Res.-Biogeo., 126, e2021JG006264, https://doi.org/10.1029/2021JG006264, 2021.
Xu, L. K. and Baldocchi, D. D.: Seasonal variation in carbon dioxide exchange over a Mediterranean annual grassland in California, Agr. Forest Meteorol., 123, 79–96, https://doi.org/10.1016/j.agrformet.2003.10.004, 2004.
Yan, M., Guo, N., Ren, H., Zhang, X., and Zhou, G.: Autotrophic and heterotrophic respiration of a poplar plantation chronosequence in northwest China, Forest Ecol. Manag., 344, 29–38, https://doi.org/10.1016/j.foreco.2014.11.009, 2015.
Zhang, X. and Wang, W.: The decomposition of fine and coarse roots: Their global patterns and controlling factors, Sci. Rep., 5, 9940, https://doi.org/10.1038/srep09940, 2015.
Zhou, W., Hui, D., and Shen, W.: Effects of Soil Moisture on the Temperature Sensitivity of Soil Heterotrophic Respiration: A Laboratory Incubation Study, PLoS ONE, 9, e92531, https://doi.org/10.1371/journal.pone.0092531, 2014.