
the Creative Commons Attribution 4.0 License.
the Creative Commons Attribution 4.0 License.
 | 15 Sep 2026
Post-disturbance soil monitoring in forests using remote sensing: an evidence map
Maisy Roach-Krajewski
Xavier Giroux-Bougard
David Paré
Catlan Dallaire
Luc Guindon
Florian Jordan
Charlotte Norris
Kara Webster
Jérôme Laganière

Forest soils underpin ecosystem resilience and productivity but are increasingly threatened by natural and anthropogenic disturbances. Monitoring post-disturbance soil degradation at operational scales remains challenging in forests, where ground-signal obstruction and reliance on proxy indicators constrain remote sensing (RS) applications. To identify where RS can benefit soil monitoring and inform emerging reporting needs, we developed a structured evidence map of studies assessing post-disturbance forest soil degradation using RS methods. From 4338 records, 72 primary studies were synthesized across disturbance types, biomes, platforms, scales, and indicators. The evidence base is dominated by wildfire and harvesting, reflecting disturbance pathways that produce observable surface impacts. Multispectral satellite data remain the primary tool for mapping post-fire severity and erosion-related indicators, while LiDAR and stereo-photogrammetry are most often used to quantify surface deformation after harvest operations. Indicators tied to subsurface physical, chemical, or biological change remain sparsely represented due to observability limits. Overall, RS is most effective for mapping disturbance footprints, detecting surface-expressed indicators, and stratifying landscapes for targeted field assessment, rather than directly measuring soil properties. This evidence map clarifies the benefits and limits of RS, identifies persistent gaps, and highlights priorities for developing disturbance-aware soil-monitoring frameworks. It also clarifies which soil indicators are most consistently observable with RS and which require complementary approaches. By linking disturbance processes to observable indicators, this synthesis helps identify realistic RS-supported objectives that may inform future reporting frameworks within national forest monitoring and assessment programs.
- Article
(2191 KB) - Full-text XML
- BibTeX
- EndNote


© His Majesty the King in Right of Canada, as represented by the Minister of Natural Resources, 2026.
Forest soils underpin ecosystem productivity, hydrological regulation, and long-term resilience following disturbance (e.g., Bonan, 2008; Paré et al., 2024; Pastore et al., 2025), yet they remain one of the least consistently monitored components of forest ecosystems. Physical, chemical, and biological soil properties govern post-disturbance recovery trajectories, influence erosion and nutrient loss, and condition forest responses to subsequent disturbances (Agbeshie et al., 2022; Bowd et al., 2019; Schoenholtz et al., 2000). Not only are soils fundamental to forest health, but they are also increasingly threatened and near irreplaceable. Soils are considered a non-renewable resource that can require millennia to form, yet an estimated one-third of global soils are already significantly degraded (Delgado-Baquerizo et al., 2025). Despite this importance, soil degradation following disturbance is difficult to measure systematically, particularly at spatial and temporal scales relevant to forest management (Delgado-Baquerizo et al., 2025; Pastore et al., 2025).
Disturbances common to managed and unmanaged forests (e.g., wildfire, forest harvesting and silvicultural treatments) can degrade soil structure, alter hydrologic behaviour, and disrupt biogeochemical processes (Bowd et al., 2019; Cambi et al., 2015; Jordan et al., 2026). These impacts are often spatially heterogeneous, occur at fine scales, and can persist long after above-ground vegetation appears to recover (Bowd et al., 2019; DeArmond et al., 2021). In wildfire-affected forests, the nature of soil impacts varies with fire intensity. High intensity crown fires consume the understory and canopy, leaving behind charred standing dead trees. The forest floor may also be burned, often in a patchy distribution. In contrast, low-intensity ground fires typically burn only the understory, resulting in more limited alteration of soil surface conditions (Brown et al., 2026). Variation occurs across forest-management disturbances as well. For example, impacts on the forest soil depend on the type of harvesting approach used (e.g., clear cut, partial cut) and subsequent silvicultural prescriptions for site preparation (e.g., blading, disc trenching), residue management (residue piled, residue removed), vegetation control (e.g., herbicide application, free to grow) and regeneration approach (e.g., planting, natural regeneration) (Brown et al., 2026). Collectively, the intensity and type of disturbance event shape forest soil condition in distinct ways, underscoring the need for monitoring approaches capable of capturing these nuances.
Traditional field-based soil monitoring provides essential, direct measurements of soil condition, but logistical constraints limit spatial coverage and frequency across large or remote forest landscapes (Maurya et al., 2020; Pastore et al., 2025). As a result, there is growing interest in complementary approaches that can support landscape-scale assessment and prioritization. Remote sensing (RS) has become a central tool for monitoring forest disturbance and recovery, offering consistent, repeatable observations over large areas (Gao et al., 2020; Perbet et al., 2025). In forestry, RS is widely used to map burned area and burn severity (Chen et al., 2024; Perbet et al., 2025), track forest harvesting and regeneration (Perbet et al., 2025; White, 2024), and characterize canopy structure and biomass (Borsah et al., 2023). Compared with agricultural settings, where seasonal soil exposure enables more direct observation, forest RS applications must contend with canopy and understory occlusion (Lausch et al., 2016; Weiss et al., 2020), moisture-driven spectral variability (Ge et al., 2011; Weiss et al., 2020), and topographic effects on illumination and temperature (Lausch et al., 2016; Quintano et al., 2019), which complicate the translation of image- or point-cloud products into soil-specific interpretations. Nevertheless, advances across optical, LiDAR, photogrammetric, thermal, and radar modalities, increasingly used in combination, are expanding opportunities to support soil-relevant monitoring aims after a disturbance (Gao et al., 2020; Nevalainen et al., 2017; Talbot and Astrup, 2021).
Although numerous studies have applied RS to assess post-disturbance forest soils, the literature remains disparate across disturbance types, sensor modalities, spatial scales, and indicator choices. Existing syntheses are typically either disturbance-specific, most often focused on wildfire (e.g., Morgan et al., 2014), or centered on particular methodological or operational contexts, such as LiDAR-based harvesting applications (e.g., Talbot and Astrup, 2021; Venanzi et al., 2023; Latterini et al., 2025). Taken together, these features of the literature make it difficult to determine which RS approaches are appropriate for different soil-monitoring objectives, which spatial and temporal scales are typical, and where major validation demands and sources of uncertainty arise.
To address this gap, we developed a structured evidence map (Cook et al., 2017) of studies that have applied RS to monitor post-disturbance soil degradation in forested landscapes, synthesizing primary studies published between 1996 and 2025 across disturbance types, biomes, sensor platforms, spatial and temporal scales, and soil-degradation indicators. Rather than evaluating individual techniques in isolation, we organize the evidence base using a disturbance–threat–indicator framework that links initiating disturbances to the soil degradation processes of concern and to the surface expressions that RS can plausibly detect (observable vs. proxy-based vs. limited) (Jordan et al., 2026).
Monitoring post-disturbance soil change is not only a scientific objective but also a reporting requirement for many forest agencies. To meet these obligations, land-management authorities must translate diverse soil impacts into indicators that are measurable, comparable through time, and interpretable in transparent reporting contexts. At the global scale, the FAO Global Forest Resources Assessment (FAO, 2025) reinforces the importance of standardized, indicator-driven approaches for national- and global-scale forest reporting.
Accordingly, this evidence map aims to: (i) describe the scope and distribution of RS applications for post-disturbance soil indicators across disturbance contexts and forest biomes; (ii) identify patterns linking disturbance type, soil threats, indicator selection, and RS design choices; and (iii) identify which RS-observable indicators currently show the clearest observability pathways and strongest evidence base for potential use in national monitoring and reporting, while clarifying strengths, limitations, and validation demands for operational uptake.
2.1 Publication search
Following the guidelines for conducting evidence maps in environmental sciences (Pullin et al., 2022), we composed a search string to capture publications that assessed indicators of post-disturbance soil degradation in forests using RS techniques (see Table A1 in the Appendix). This search string was used to query titles, keywords, and abstracts of relevant publications, which included journal articles, but also grey literature such as conference proceedings, theses, and reports. We used Scopus, EBSCO host, and OpenAlex databases to access and extract relevant publications between the 25 and 26 February 2025. We also used the same search string to query Google Scholar and retrieved the first 300 publications ranked by relevance using the Publish or Perish software (Harzing, 2007). To include published government reports not represented in the bibliographical databases, we expanded our search to government repositories including Québec's MFFP archive, Ontario's MNRF archive, Natural Resource Canada's Open Science and Technology repository (OSTR), and the United States Forest Service Tree Search repository. Only English and French records were retained across all databases.
2.2 Screening and eligibility
After extracting the raw search results from the bibliographical database searches, we parsed them into a common format using the “tidyverse” collection of packages (Wickham et al., 2019) implemented in R (R Core Team, 2024). Then, we screened the parsed results to identify and remove duplicate records by flagging any pairwise similarity of titles and authors.
To be retained for further inspection, a relevant publication had to meet the following four eligibility criteria: (1) use RS methods to analyze post-disturbance soil degradation in a forested area; (2) draw direct (e.g., in-situ measurement) or indirect (e.g., photointerpretation) links between RS measurements or products and in-situ indicators of soil degradation; (3) be conducted after a disturbance (i.e., simulation/predictive models and risk assessments were excluded); and (4) contain sufficient methodological details (e.g., sensor specifications, data processing steps, and validation methods) to understand how RS products were used. Relevant reviews were excluded from the primary set but retained for the snowball search (Sect. 2.3).
Publications that “passed” the initial title/abstract screening or were deemed “inconclusive” based on title/abstract alone were followed up with a full-text screening, to verify that all criteria were met. Screening was performed by a single reviewer for consistency.
2.3 Snowball search
To complement the initial database search, we used a snowball search method to examine the references (backward snowballing) and citations (forward snowballing) of a set of input publications (i.e., screened-in studies and relevant reviews). To facilitate this process, we used Research Rabbit (https://www.researchrabbit.ai, last access: 20 March 2025), a web-based tool that visualizes citation networks and thematic relationships, and recommends related papers based on an initial set of publications. Newly found records were screened against the same criteria by a second reviewer, and duplicates were removed before extraction.
2.4 Data extraction and coding
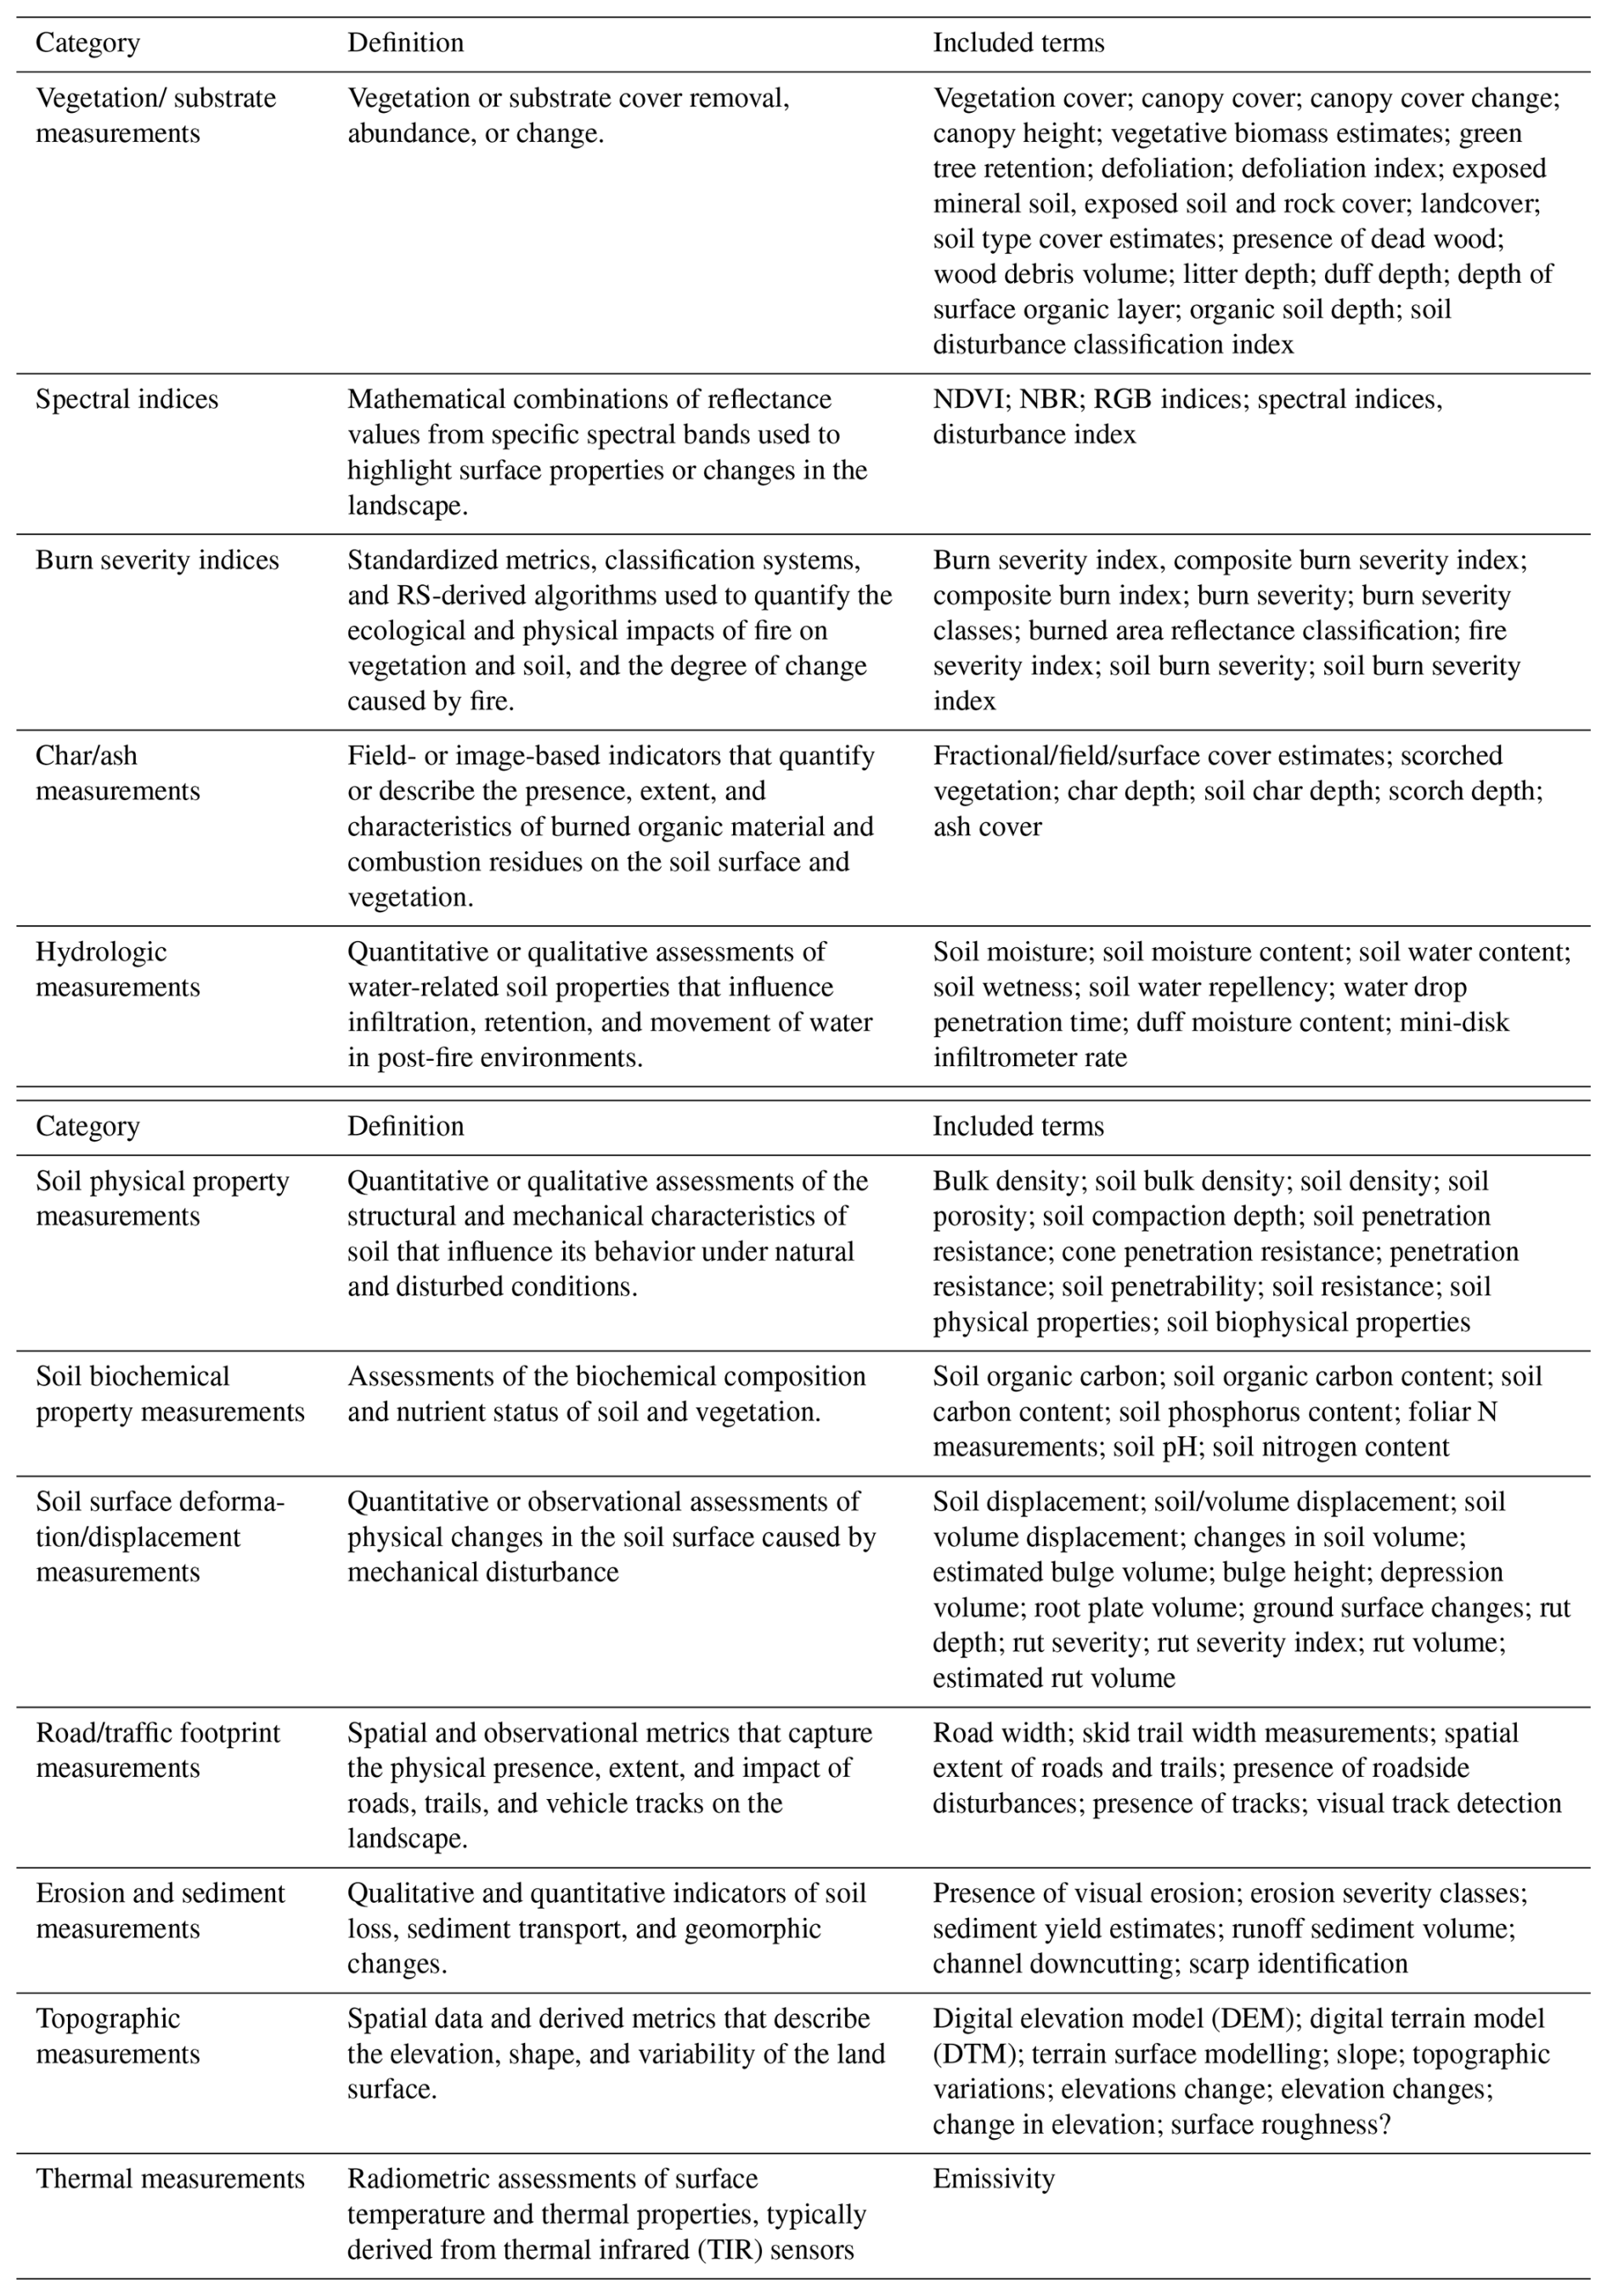
For each relevant primary study (excluding review articles), we extracted detailed information on study location, sample size, forest and soil characteristics, types and dates of disturbances, observed outcomes, and the soil degradation indicators used. We also extracted the types of sensors used in the study, associated RS methods (e.g., platform types, metric indices, classification, and validation techniques), in-situ indicators used for ground-truthing, study design, objectives, and overall conclusions. To streamline analysis, we grouped soil indicators into broader categories. This process involved: extracting all unique recorded values, correcting typos and merging redundant terms (e.g., “organic soil depth” and “depth of organic soil”), and identifying similar (e.g., “soil moisture content” and “soil water content”) and nested terms (e.g., “rut depth” and “rut volume” under “rut severity”). We then iteratively defined each broader category to encompass these groupings or distinct standalone terms. Field experts then reviewed the resulting categories, definitions, and grouped terms to validate their accuracy and relevance. Finalized categories can be found in the Appendix (Table A2).
To examine the scope and distribution of the evidence base, including temporal trends and biogeographical coverage, as well as variations within and across disturbance types and RS methods, we organized and visualized the compiled data in R (version 4.1.3; R Core Team, 2024) using packages including sf (Pebesma, 2018), ggplot2 (Wickham, 2016), naturalearth (Massicotte, 2025), forcats (Wickham, 2025), stringr (Wickham, 2010), googlesheets4 (Bryan, 2025), and scales (Wickham et al., 2025).
As a structured evidence map, this synthesis was designed to characterize the scope, distribution, and methodological patterns of the literature. It did not include a formal critical appraisal of study quality, validation strength, uncertainty, or transferability across forest types and regions. Accordingly, the results should be interpreted as reflecting evidence availability and observability patterns rather than as a ranked assessment of operational readiness or reporting robustness.
3.1 Overview of evidence base
3.1.1 Publication details
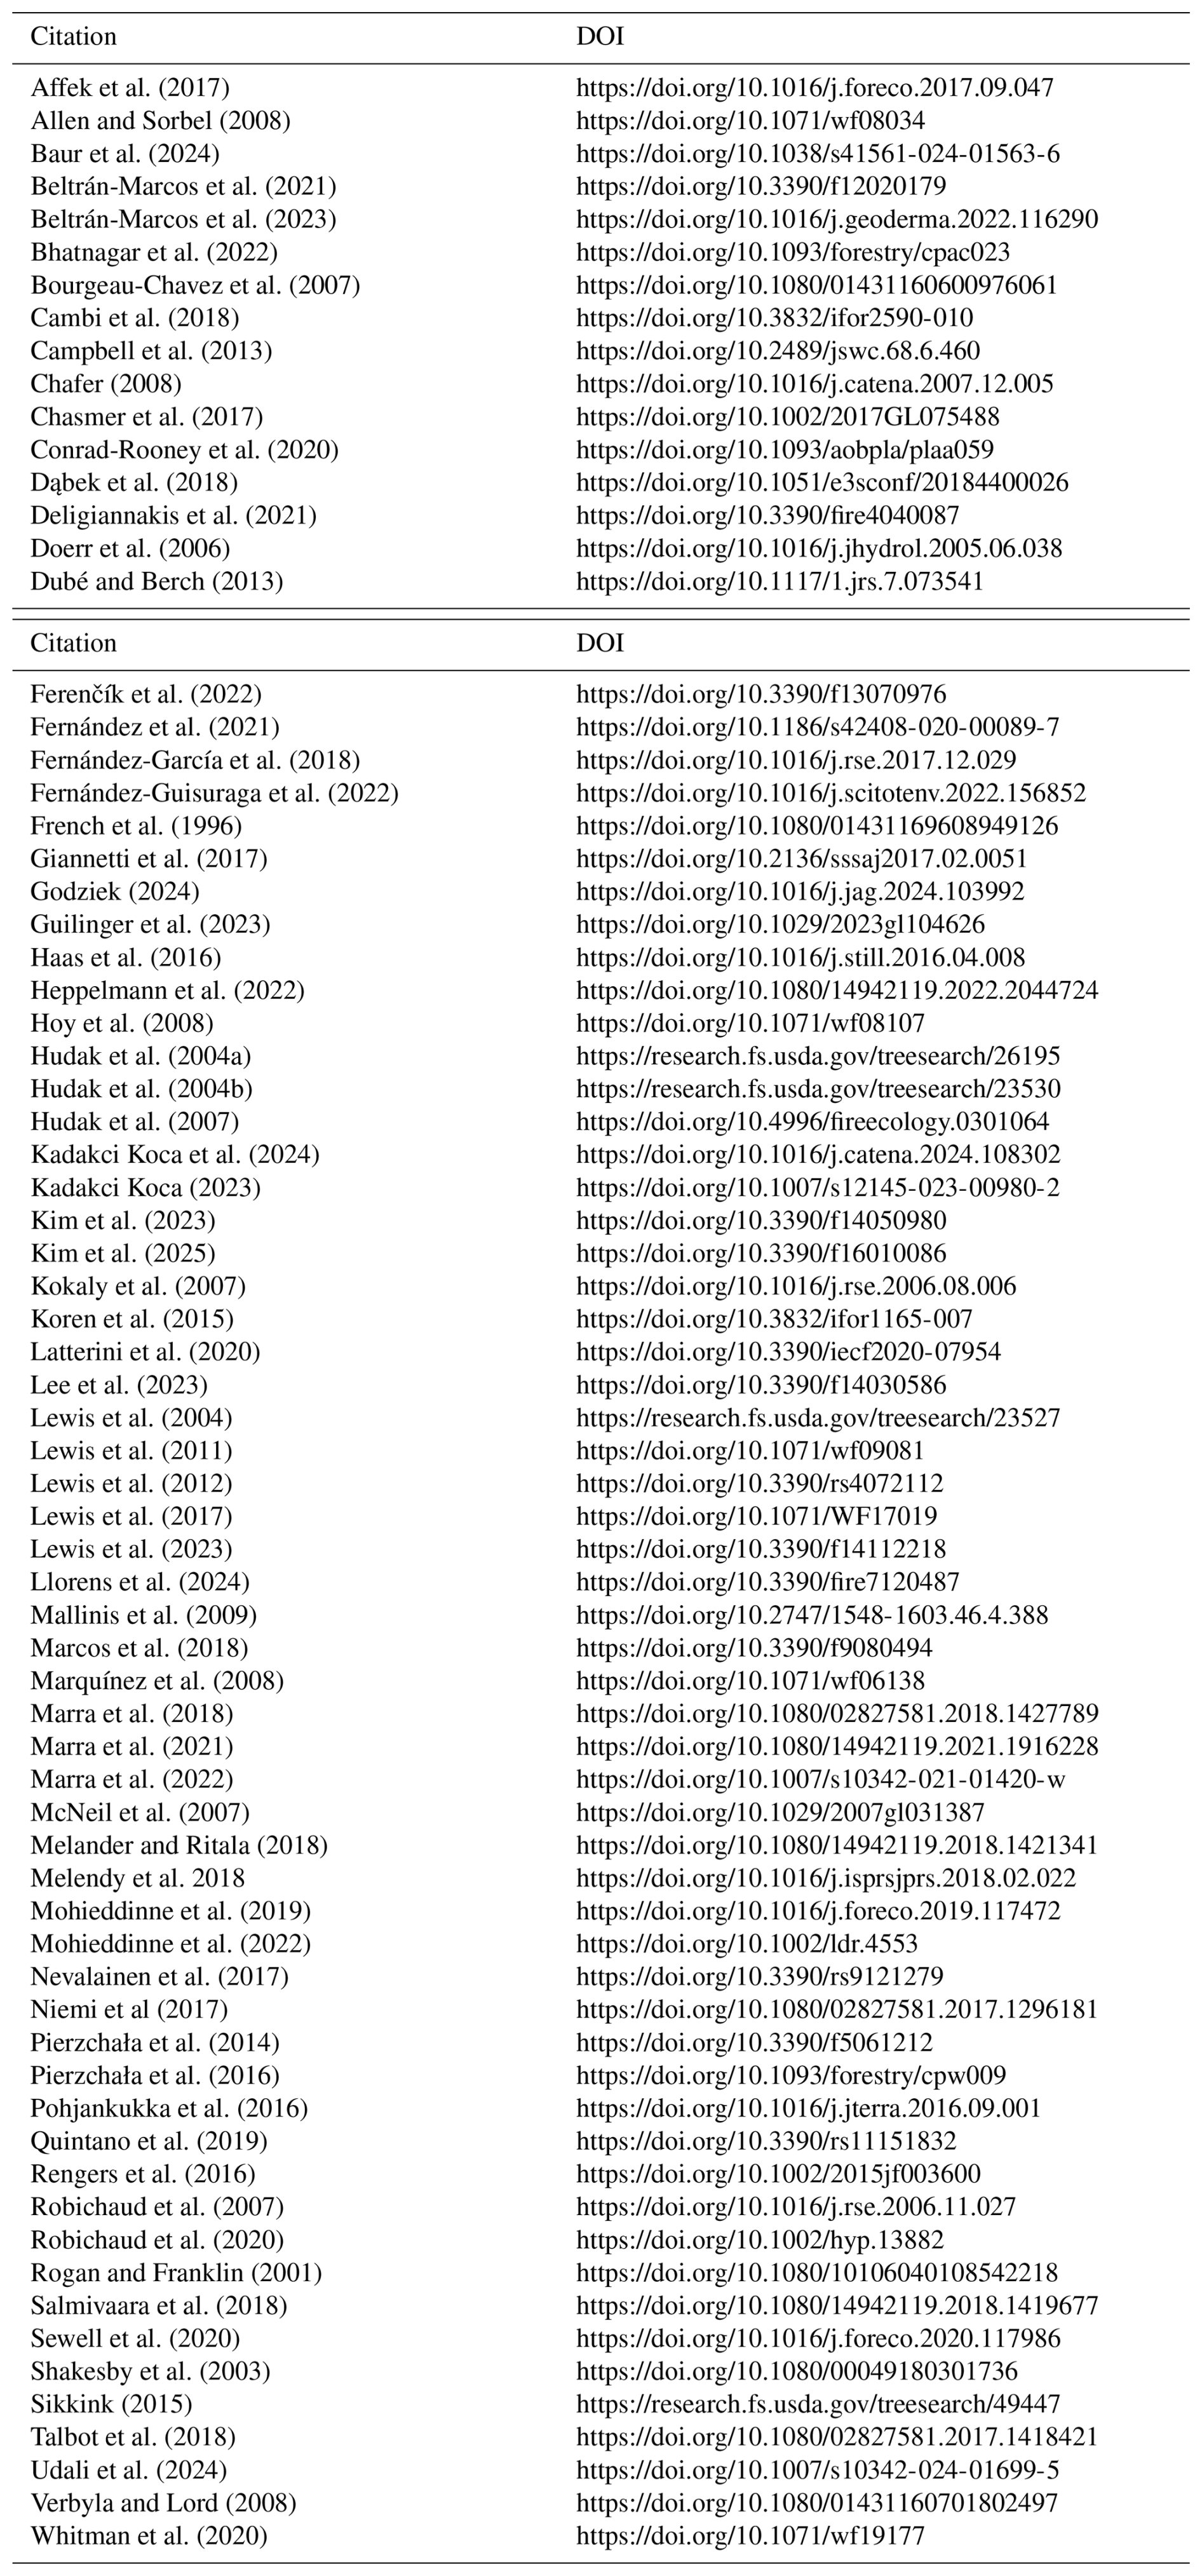
Our database search yielded 3256 publications for screening. After applying the eligibility criteria described in Sect. 2.2, we retained 64 publications and 6 relevant review papers. These 70 publications were then used to conduct a snowball search, which retrieved an additional 1082 distinct publications, for a total of 4338 publications. Screening of these snowball search results identified 8 more eligible studies, resulting in a final evidence base of 72 publications (Appendix, Fig. A1). A complete list of studies included in the final evidence base is provided in the Appendix (Table A3).
3.1.2 Disturbance types
The evidence base captures six types of disturbances: wildfire (n = 39/77; 50.6 %), harvesting (n = 33/77; 42.9 %), insect outbreak (n = 2; 2.6 %), windthrow (n = 2; 2.6 %), mining (n = 1; 1.3 %), and off-road vehicle use (n = 1; 1.3 %). Here, “harvesting” is used as an umbrella term for a range of harvesting practices represented in the evidence base, including clear-cutting, partial cutting, cut-to-length operations, thinning, skidding, selective harvesting, and salvage harvesting. Most publications (n = 66/72, 91.7 % of evidence base) assessed the aftereffects of only one disturbance type. Among the six studies that addressed multiple disturbance types, five involved salvage harvesting after a wildfire (n = 3; 4.2 %), insect outbreak (n = 1; 1.4 %), or windthrow (n = 1; 1.4 %) event. Post-wildfire studies provide the most consistent coverage across the temporal span of the evidence base (1996–2025), with at least one publication in 20 of the 29 years since the first case in 1996. In contrast, the first study involving harvesting, the second most frequently recorded disturbance, was published over a decade later in 2012 (Fig. 1).
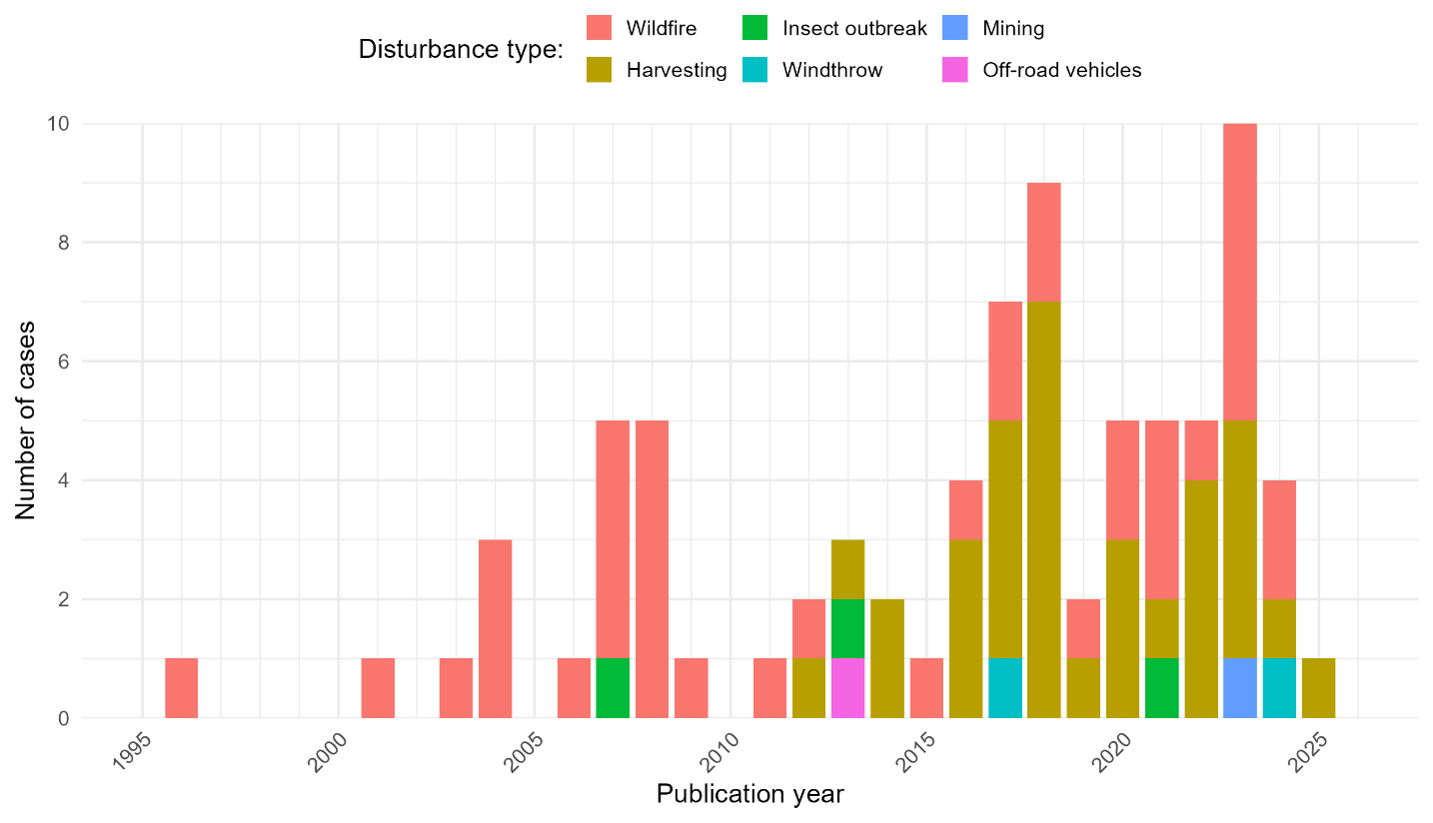
Figure 1Disturbance type frequency by publication year. Each bar shows the annual sum of disturbance cases reported across studies. Overall disturbance type totals were: Wildfire (39); Harvesting (33); Insect outbreak (3); Windthrow (2); Mining (1); Off-road vehicles (1).
3.1.3 Remote sensing technologies
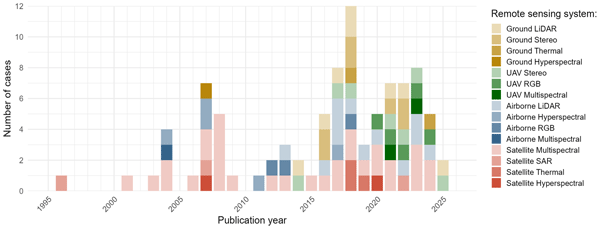
Multispectral sensors were the most used sensor type (n = 34; 37.0 %), followed by LiDAR (n = 20; 21.7 %) and stereo photogrammetric data (n = 14; 15.2 %). Satellite platforms were used most frequently (n=39; 42.4 %), paired with multispectral sensors (n = 31; 33.7 %) (Fig. 2). Satellite-based sensors provide the most consistent coverage across the temporal span of the evidence base (1996–2025), while sensors using unmanned aerial vehicles (UAV) only appeared in the literature after 2013 (Fig. 2). Platform-sensor combinations by disturbance are shown in Appendix Fig. A2. A single platform type was used in most studies (n = 59; 81.9 %), whereas 13 studies used more than one type. Analytically, studies most often used spectral index–based analysis (n = 29; 31.9 %), LiDAR-specific analyses (n = 19; 20.9 %), image differencing (n = 17; 18.7 %), and photogrammetry (n = 17; 18.7 %) (Appendix, Fig. A3). Only 10 studies (13.9 %) combined multiple approaches, with the rest of the studies (n = 62; 86.1 %) using only one.
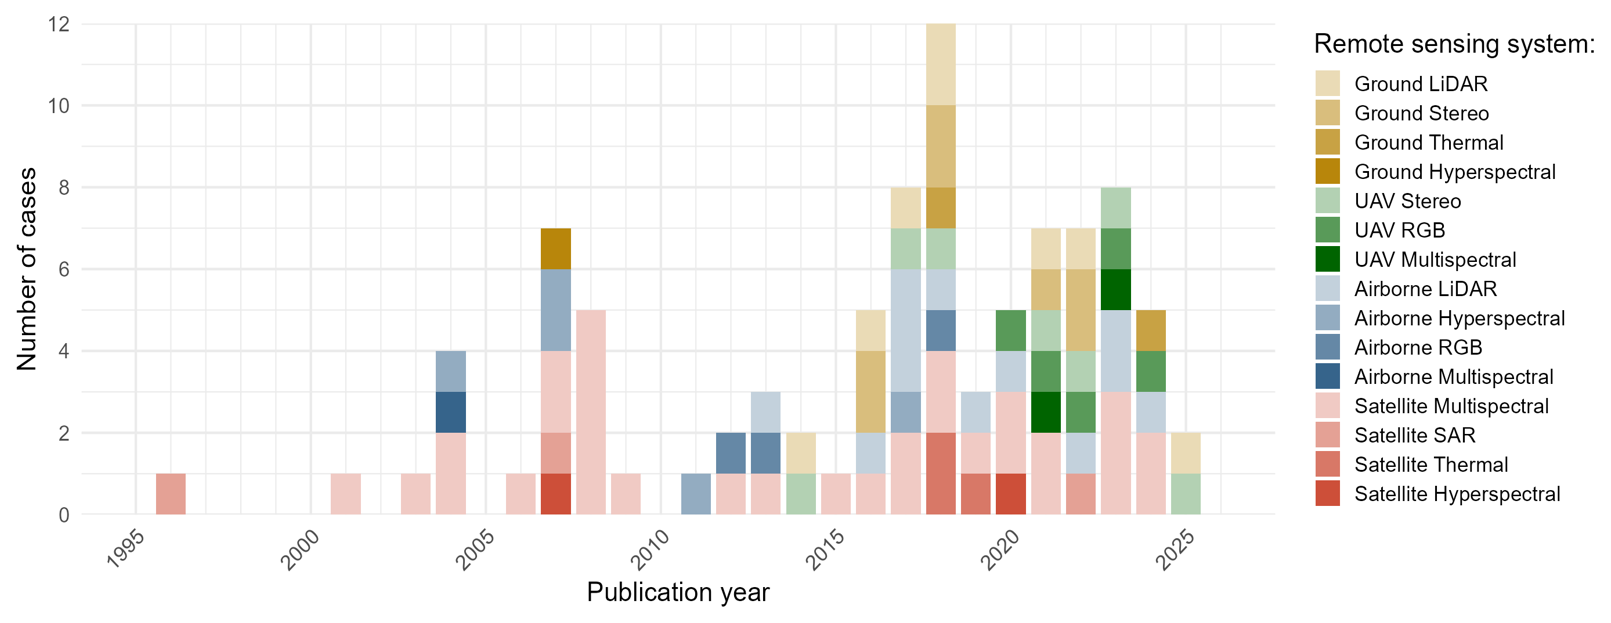
Figure 2Stacked counts of platform-sensor combinations by publication year. Note that a single study could contain more than one platform-sensor combination. Total counts for platform sensor combinations were: satellite Multispectral (31); airborne LiDAR (12); ground LiDAR (8); ground Stereo (7); UAV Stereo (7); UAV RGB (5); airborne Hyperspectral (5); airborne RGB (3); satellite SAR (3); satellite Thermal (3); ground Thermal (2); UAV Multispectral (2); satellite Hyperspectral (2); ground Hyperspectral (1); airborne Multispectral (1).
3.1.4 Study locations
Although our search placed no restrictions on country of origin, the majority of studies included were carried out in European (n = 37; 51.4 %) or North American (n = 27; 37.5 %) forests (Fig. 3). Collectively, the evidence base spans four of the seven global forested biomes and two of the seven non-forested biomes (Dinerstein et al., 2017). Most studies occurred in boreal forests/taiga (n = 22; 28.2 %), followed by Mediterranean forests and woodlands (n = 19; 24.4 %), temperate conifer forests (n = 17; 21.8 %), and temperate broadleaf and mixed forests (n = 17; 21.8 %). There were two cases of tropical and subtropical moist broadleaf forests (n = 2; 2.6 %), and one of tropical/subtropical grassland (n = 1; 1.3 %) within a eucalypt plantation in South Africa. This was the only case outside a naturally occurring forest (Fig. 3). Most studies (n = 67; 93.1 %) were conducted within a single biogeographic area, meaning all assessments took place within forests of the same terrestrial biome. Four studies included two biomes each, and one study (Hudak et al., 2007) included three.
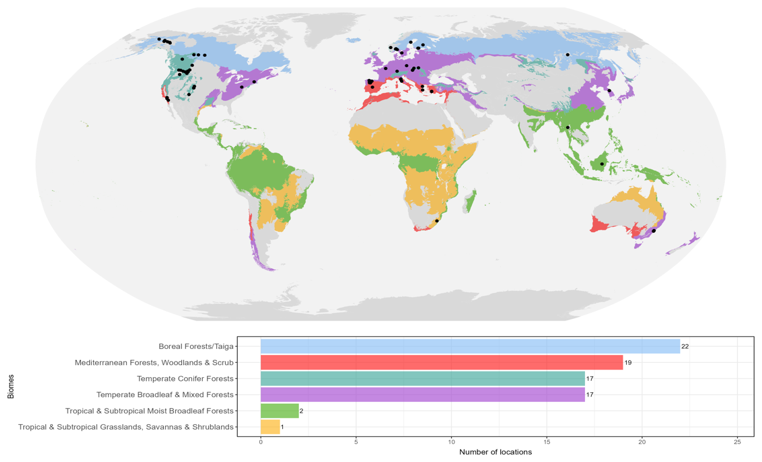
Figure 3Map of the study locations (n = 78) across included publications (n = 72) relative to the world's terrestrial biomes (data source: Dinerstein et al., 2017). Bar chart below shows the number of study locations by biome.
3.2 Patterns in study design and methodology
3.2.1 Sensor use by biome within different disturbance contexts
Across 106 biome × disturbance × sensor cases, the most frequent biome-disturbance pairings were: wildfire in Mediterranean forests (n = 22; 20.8 %), wildfire in temperate conifer (n = 14; 13.2 %), harvesting in boreal/taiga (n = 14; 13.2 %), and harvesting in temperate broadleaf/mixed (n = 11; 10.4 %) (Fig. 4). By disturbance-sensor pairing, multispectral sensors post-wildfire were most common (n = 32; 30.2 %), whereas LiDAR (n = 14; 13.2 %) and stereo photogrammetry (n = 13; 12.3 %) were most used post-harvesting. By biome-sensor pairing, multispectral dominated in Mediterranean (n = 14; 13.2 %), temperate conifer (n = 11; 10.4 %), and temperate broadleaf/mixed (n = 8; 7.5 %); in boreal/taiga, stereo (n = 7; 6.6 %) and multispectral (n = 7; 6.6 %) were co-dominant. The most frequent three-way combinations were multispectral for wildfire in Mediterranean (n = 13; 12.3 %), stereo for harvesting in boreal/taiga (n = 7; 6.6 %), multispectral for wildfire in temperate conifer (n = 7; 6.6 %), and multispectral for wildfire in temperate broadleaf/mixed (n = 6; 5.6 %) (Fig. 4).
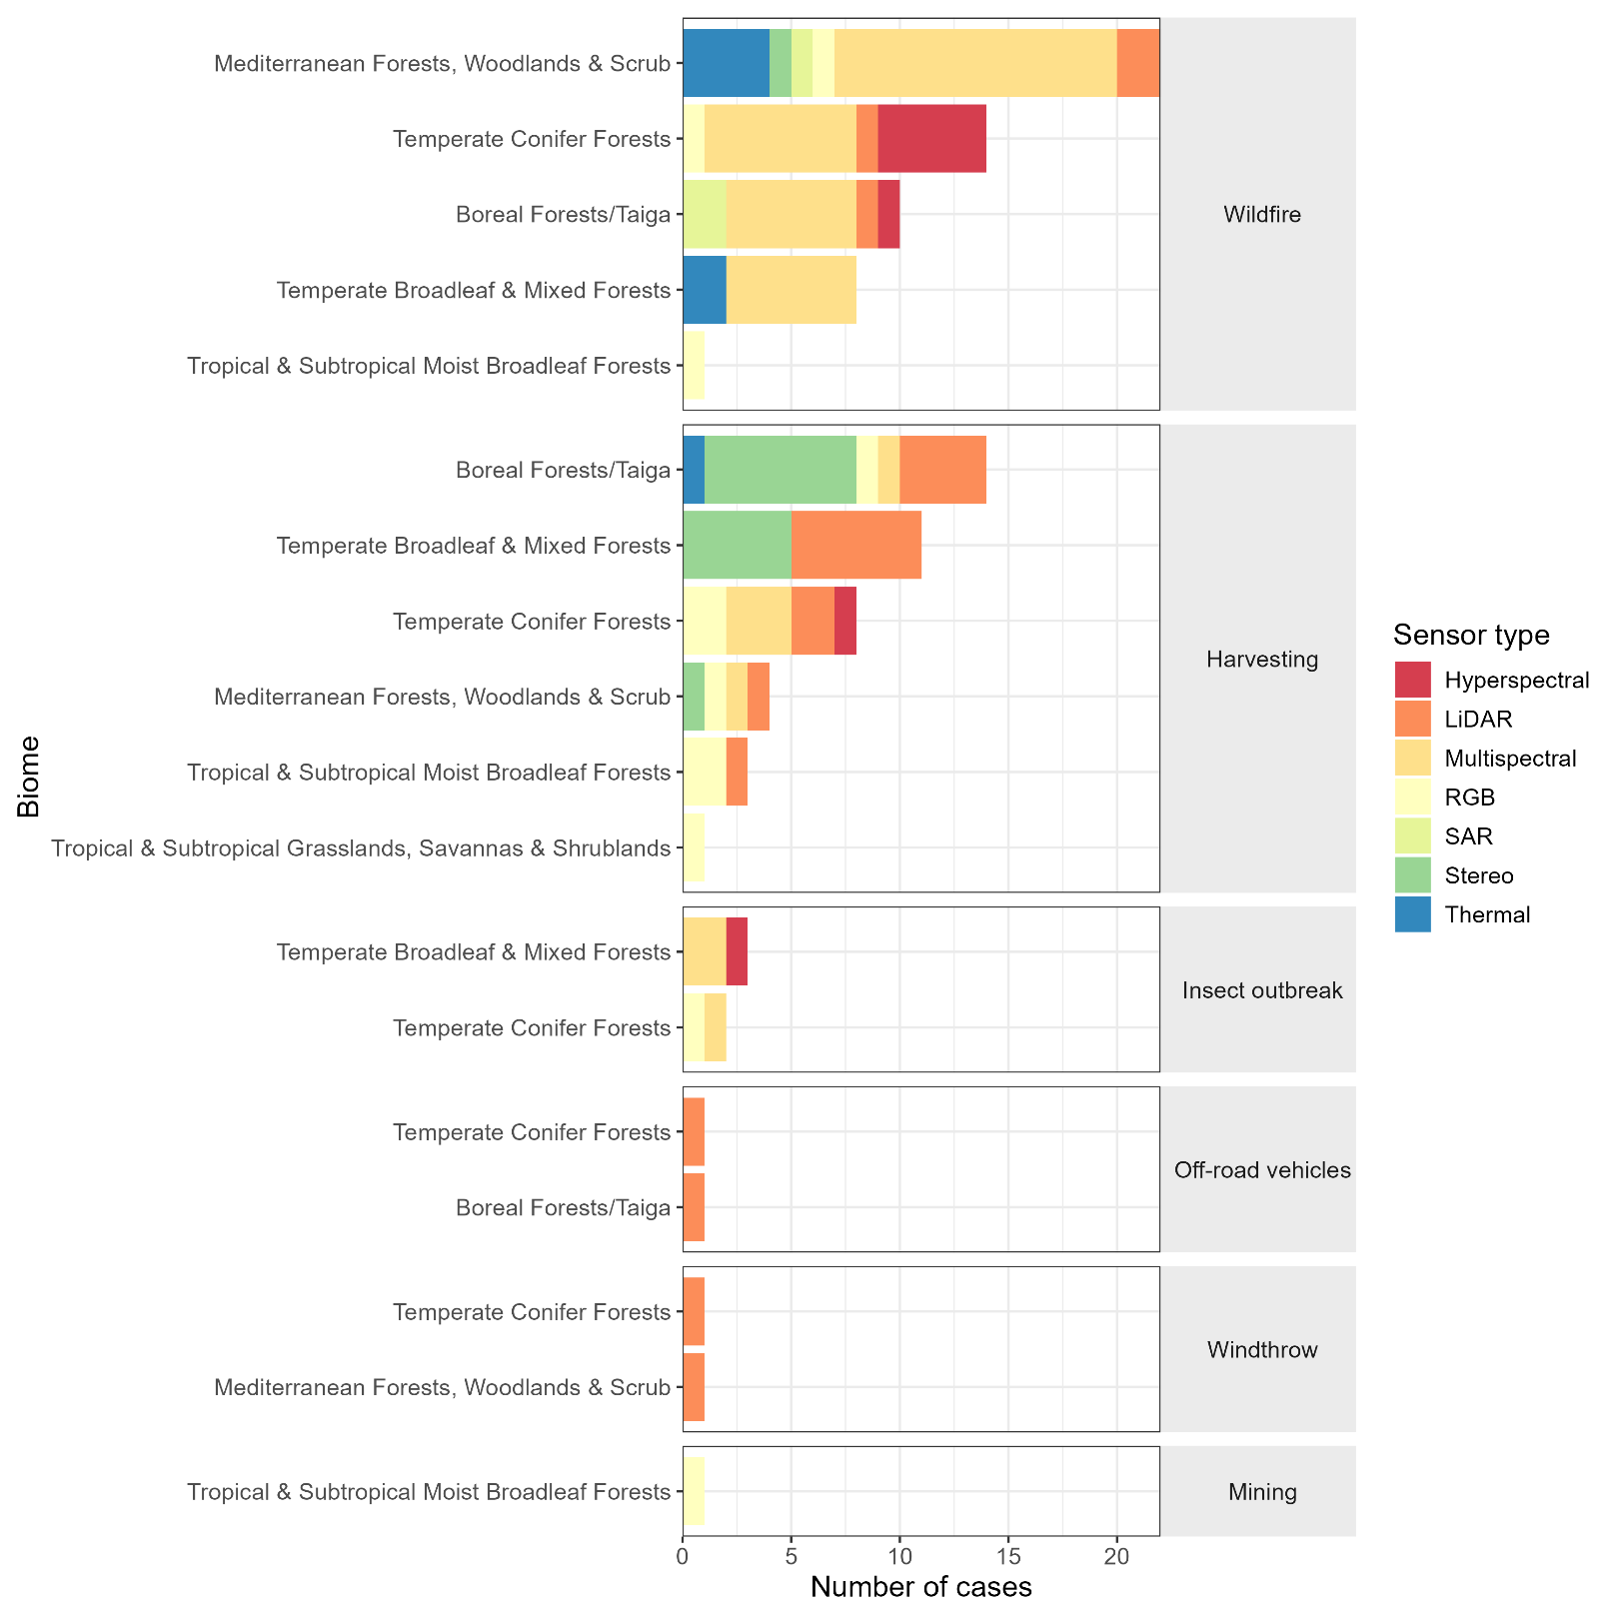
Figure 4Number of cases of each sensor type use across biomes, separated by disturbance type. Note that a single study could have more than one biome, sensor type, or disturbance type recorded, thus each combination of biome, sensor type, and disturbance type is counted as one “case” (106 cases across 72 studies).
3.2.2 Indicators and remote sensing methods
Across 173 indicator × method × disturbance cases, the leading indicator–disturbance pairs were: burn severity and wildfire (n = 24; 13.9 %), soil surface deformation/displacement and harvesting (n = 23; 13.3 %), char/ash and wildfire (n = 15; 8.7 %), vegetation/substrate and wildfire (n = 13; 7.5 %), soil physical properties and harvesting (n = 12; 6.9 %), and spectral indices and wildfire (n = 12; 6.9 %) (Fig. 5). Across indicator-method pairings, burn severity indices were predominantly derived from spectral analysis (n = 13; 7.5 %) and image differencing (n = 11; 6.4 %), whereas soil surface deformation/displacement measurements were most often obtained from photogrammetry (n = 13; 7.5 %) and LiDAR (n = 9; 5.2 %). Topographic measurements relied mainly on LiDAR (n = 10; 5.8 %), and vegetation/substrate measurements were typically quantified using spectral analysis (n = 10; 5.8 %) or image differencing (n = 7; 4 %). Correspondingly, spectral analysis and image differencing dominated wildfire applications (n = 48; 28 %, and n = 36; 21 %, respectively), while harvesting assessments relied primarily on LiDAR (n = 24; 14 %) and photogrammetry (n = 23; 13 %). Overall, the most frequent combinations for indicator-disturbance-method were burn severity indices derived from spectral analysis in wildfire studies (n = 13; 7.5 %) and soil surface deformation/displacement measurements derived from photogrammetry in harvesting contexts (n = 13; 7.5 %). Additional RS methods combinations are shown in Appendix Fig. A3.
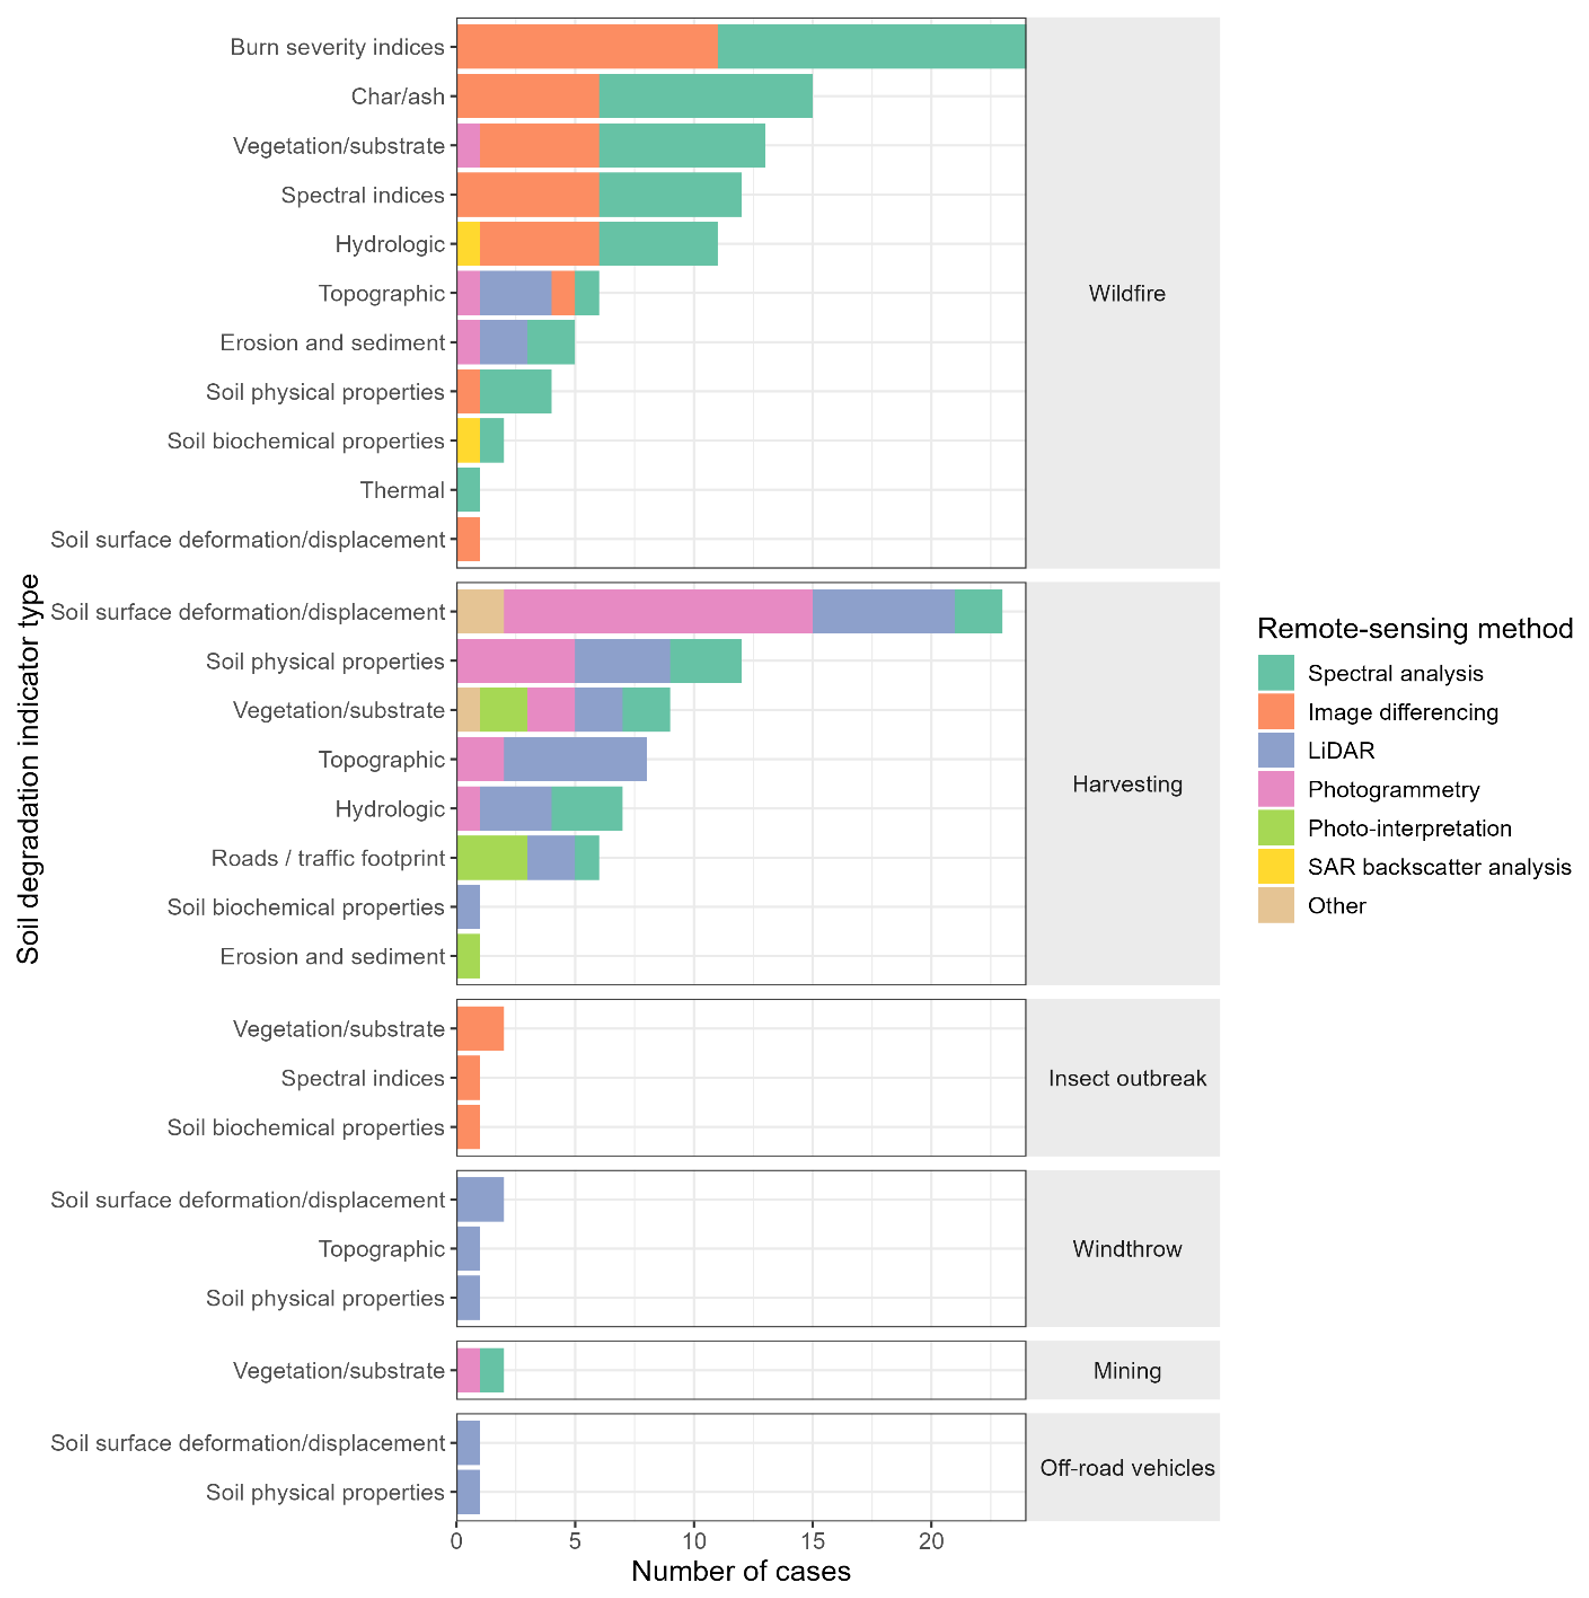
Figure 5Number of cases of each remote-sensing method used across soil degradation indicator type, separated by disturbance type. Soil degradation indicator type classifications are summarized in Table A2. Note that a single study could have more than one degradation type, remote-sensing method, or disturbance type recorded, thus each combination of degradation type, remote-sensing method, or disturbance type is counted as one “case” (173 cases across 72 studies).
3.2.3 Spatial scale
Across the 62 studies with reported study area (i.e., full area of undertaking assessed by RS tools), the spatial extent of assessments ranged from 0.002 to 1 455 268 ha (median = 10 858 ha, mean = 91 137 ha), with a harvesting study holding the smallest study area, and a wildfire study holding the largest (Fig. 6). Wildfire cases (most frequent, n = 35; 56.5 %) had the largest extents (mean 149 665 ha; range 0.55–1 455 268 ha). Harvesting cases (n = 27; 43.5 %) spanned smaller but variable extents (mean 24 513 ha; range 0.002–263 900 ha). Insect and windthrow were fewer (n = 2; 3.2 % each) and smaller (mean 8045 and 636 ha), while the single mining case averaged 5.9 ha. By platform, satellite (n = 51; 46.4 % of platform-type cases) covered 8.1 to 1 455 268 ha (mean 180 508 ha); UAV (n = 23; 20.9 %) covered 3.0 to 105.3 ha (mean 75.2 ha); ground ranged 0.002 to 100 000 ha (mean 10 396 ha). By sensor, multispectral (n = 46; 41.8 % of sensor-type cases) averaged 106 110 ha (range 8.1–1 455 268 ha), while stereo (n = 13; 11.8 %) had the lowest mean (1509 ha) but the broadest range (0.002–9726 ha). Soil burn (n = 29; 29.3 % of outcome-type cases) and soil erosion (n = 8; 8.1 %) were often mapped over large to very large extents (means of 174 660 and 123 021 ha, with maximum areas up to 1 455 268 and 750 000 ha, respectively), whereas soil rutting (n = 20; 20.2 %), compaction (n = 9; 9.1 %), and displacement (n = 8; 8.1 %) tended to be evaluated at intermediate scales (means of 20 339, 14 712, and 10 919 ha) with broad ranges. Plots were the most common sampling unit (n = 43; 70.5 % of sample unit-type cases) and spanned 0.002 to 1 455 268 ha (mean 106 110 ha); a single transect study (n = 1; 1.6 %) had the largest mean (589 552 ha).
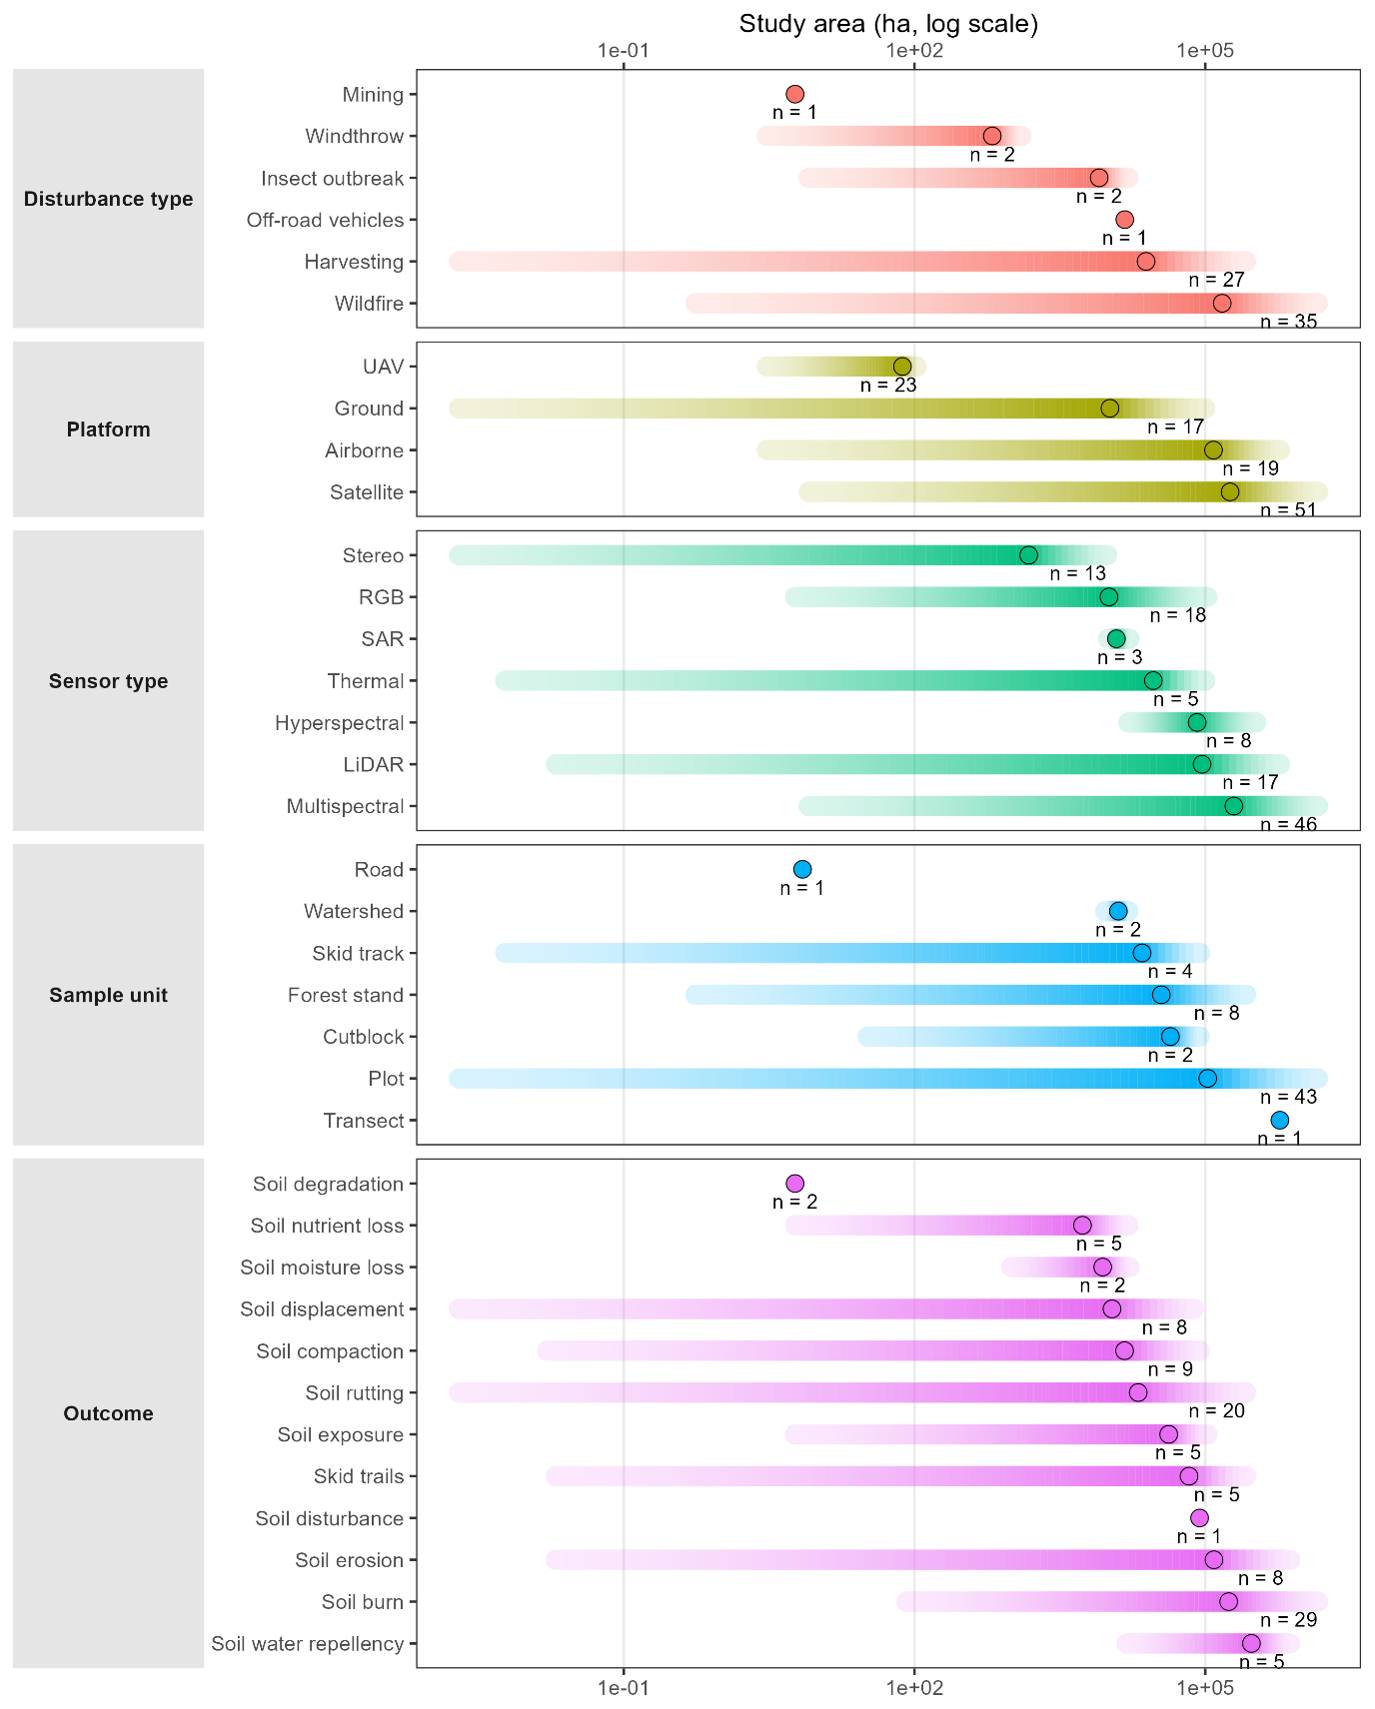
Figure 6Spatial extent of included studies which reported study area (n = 62), according to disturbance type, platform type, sensor type, sample unit, and soil degradation outcome. Each horizontal bar shows the area of interest for a given category, with the gradient indicating the range from minimum to maximum study area, with the black circle marking the mean. Values are plotted on a log10 scale. Note that a single study could have more than one disturbance type, platform type, sensor type, or outcome recorded, thus each unique combination is counted as one “case”, denoted by n.
To represent the remote-sensing mapping scale rather than field-sampling scale, Fig. 6 uses the larger reported area as study extent. This choice captures the scope at which RS characterized disturbance patterns but yields broad ranges, especially for ground platforms that were applied only to subsets of larger areas mapped with satellite or airborne data. Consequently, spatial patterns in Fig. 6 should be treated as approximate indicators of monitoring design, with comparisons informed by both mean values and the full range of reported extents.
3.2.4 Temporal patterns for disturbance events, RS acquisition, and data collection
Of the 72 studies in the evidence base, 49 (68.1 %) provided enough detail on sampling years (i.e., data collection) and disturbance timing to allow assessment of temporal patterns. Across these studies, we identified 92 disturbance events: wildfires were most common (n = 57; 62.0 %), followed by harvesting (n = 26; 28.3 %), insect outbreaks (n = 5; 5.4 %), and windthrow (n = 4; 4.3 %) (Fig. 7). Fifteen studies (30.6 %) recorded multiple events of the same type (11 of which were wildfires). RS acquisition years were reported in 46/49 timing-eligible studies (93.9 %), and 40/46 (87.0 %) included at least one acquisition year matching a disturbance year. The longest minimum post-disturbance lag between disturbance timing and RS acquisition was 9 years (harvesting in 1999 with RS acquisition in 2008; Sewell et al., 2020). Pre-disturbance RS was reported in 10 studies (20.4 %), all of which were for wildfire cases. The mean minimum disturbance-to-sampling difference was 3.1 years (median 0). The largest gap between disturbance and sampling period was 45 years (historical event used for multi-decadal recovery), followed by 17 years (harvesting case). Sampling periods took place over one year or more in 60 % of studies, with the longest spanning 10 years (2003–2013). RS acquisition typically coincided with sampling: 65 % of RS acquisition years fell within sampling windows and 82 % of studies used at least one RS acquisition during sampling. When acquisition and sampling did not overlap, acquisition more often preceded sampling (33 years) than followed it (2 years), with the largest offset 16 years (acquisition 1985; sampling 2001–2003) (Fig. 7).
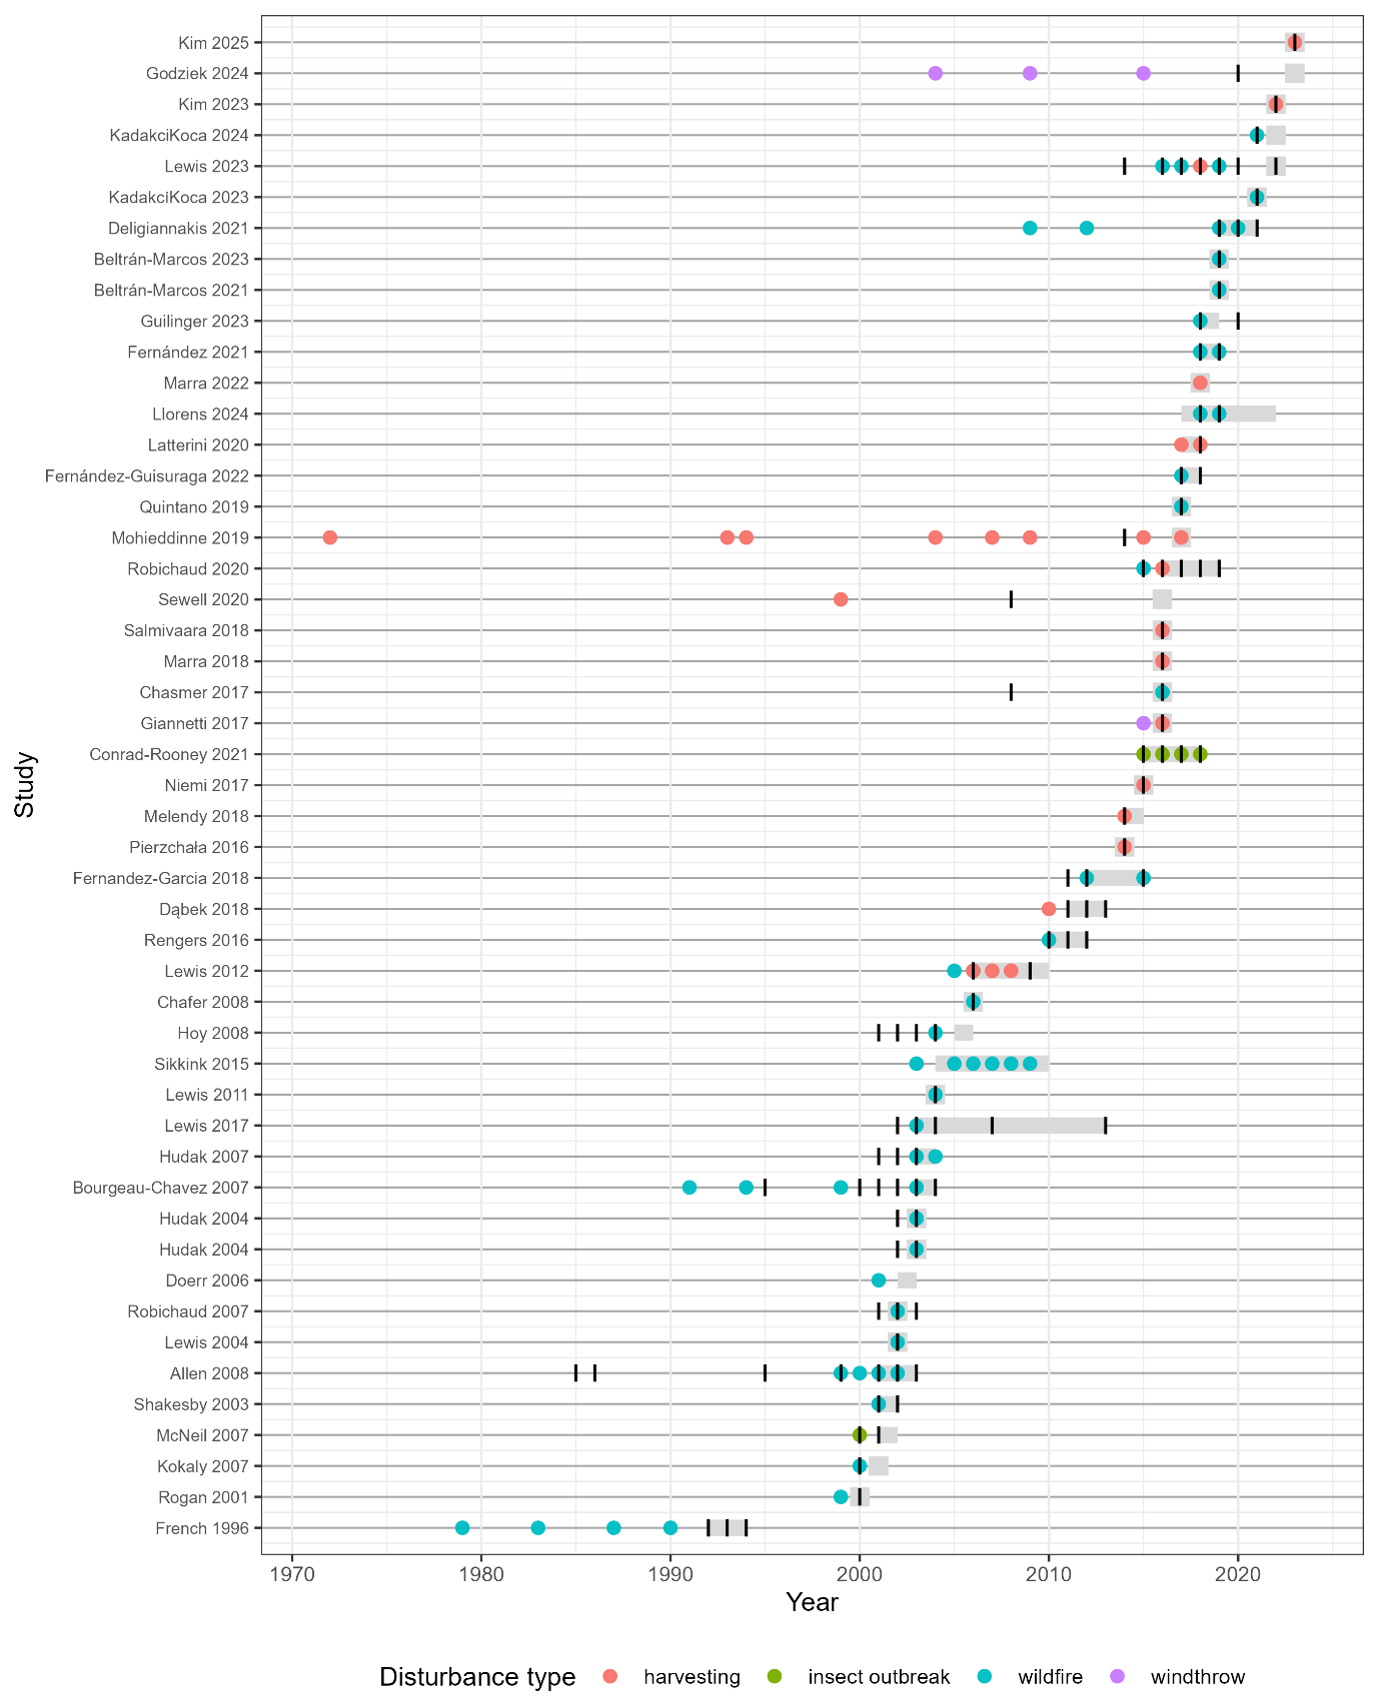
Figure 7Timeline of disturbance events, RS acquisition, and sampling (i.e., data collection) periods for all studies with sufficient timing information (n = 49). Each row represents a single study; grey squares and horizontal bars show the year(s) that sampling took place, black tick marks represent the years associated with RS acquisition, and coloured points mark the years of disturbance events, identified by type.
4.1 Disturbance contexts and observability
Across the evidence base, RS of post-disturbance soil degradation is not approached as a single measurement. Instead, methods are selected (and validated) in relation to the disturbance-threat pathway that makes soil degradation observable (Kubiak et al., 2024; Talbot et al., 2018). Disturbances that produce widespread canopy loss and altered surface reflectance (e.g., wildfire) (Lewis et al., 2011; Llorens et al., 2024; Veraverbeke et al., 2018) or mechanically induced surface deformation (e.g., forest operations) (Nevalainen et al., 2017; Pierzchała et al., 2016; Talbot and Astrup, 2021) dominate because they create signals that RS can detect with comparatively high confidence. This section summarizes how these dominant contexts shape the structure of the evidence base and the interpretability of RS-derived soil indicators.
4.1.1 Dominant disturbance pathways
Wildfire and harvesting dominate the evidence base, whereas insect outbreaks, windthrow, mining, and off-road vehicle use are sparsely documented reflecting an imbalance in research priorities and fundamental differences in observability. After wildfire, the combination of canopy loss, surface exposure, and combustion residues produces clear spectral signals that multispectral sensors can detect over large areas, enabling rapid assessment using spectral indices and pre/post-fire differencing (e.g., Hudak et al., 2004a; Shakesby et al., 2003). The depth of satellite archives further enables disturbance-proximal analyses and helps explain the persistent representation of wildfire studies across nearly three decades (Kokaly et al., 2007).
By contrast, soil impacts from mechanized harvesting are spatially discontinuous (e.g., tracks, ruts, landings, localized displacement) and often obscured by slash and residual canopy, increasing dependence on very-high-resolution imagery and/or 3D surface reconstruction (Talbot and Astrup, 2021). These requirements constrain geographic coverage and sample sizes relative to fire studies. Consistent with this pattern, harvesting-focused studies most commonly employ close-range terrestrial, airborne, or UAV platforms, and rely on LiDAR or stereo-photogrammetry to resolve traffic footprints (e.g., Bhatnagar et al., 2022) and quantify surface deformation via terrain modelling (DTM differencing or point-cloud change; Venanzi et al., 2023, Latterini et al., 2025).
Unlike prior syntheses that are disturbance-specific (often wildfire) or technology-specific (e.g., LiDAR), this review assembles multiple disturbance contexts within one evidence map, enabling direct comparisons of observability, indicator selection, and scale. This integrated perspective also reveals diverging uptake trajectories, with wildfire applications recurring across nearly three decades, whereas harvesting studies appear only after 2012 and remain comparatively intermittent.
4.1.2 Compound and stacked disturbances
A smaller but important subset of the evidence base addresses compound disturbances, most often salvage harvesting following wildfire. Stacked sequences complicate RS by requiring attribution across overlapping temporal signals and by narrowing the window during which soil-relevant surface expressions remain detectable. Detection accuracy declines rapidly as vegetation regrowth and slash obscure signals, making disturbance-proximal acquisition critical. Further, fine spatial resolution is frequently required to separate salvage-related soil disturbance from fire effects (Dubé and Berch, 2013; Lewis et al., 2012). When timing and resolution are adequate, optical indices, high-resolution imagery, and LiDAR can jointly support attribution by separating vegetation recovery patterns from mechanically induced surface change (Giannetti et al., 2017; Lewis et al., 2023; Robichaud et al., 2020). Evidence also indicates that stacked disturbances are non-additive: salvage can amplify erosion risk, increase connectivity along trail networks, and delay vegetation recovery relative to fire alone (Lewis et al., 2023, 2012; Robichaud et al., 2020). These interactions highlight the need for monitoring frameworks that explicitly account for disturbance sequencing and pathway interactions.
4.2 Disturbance-threat-indicator pathways
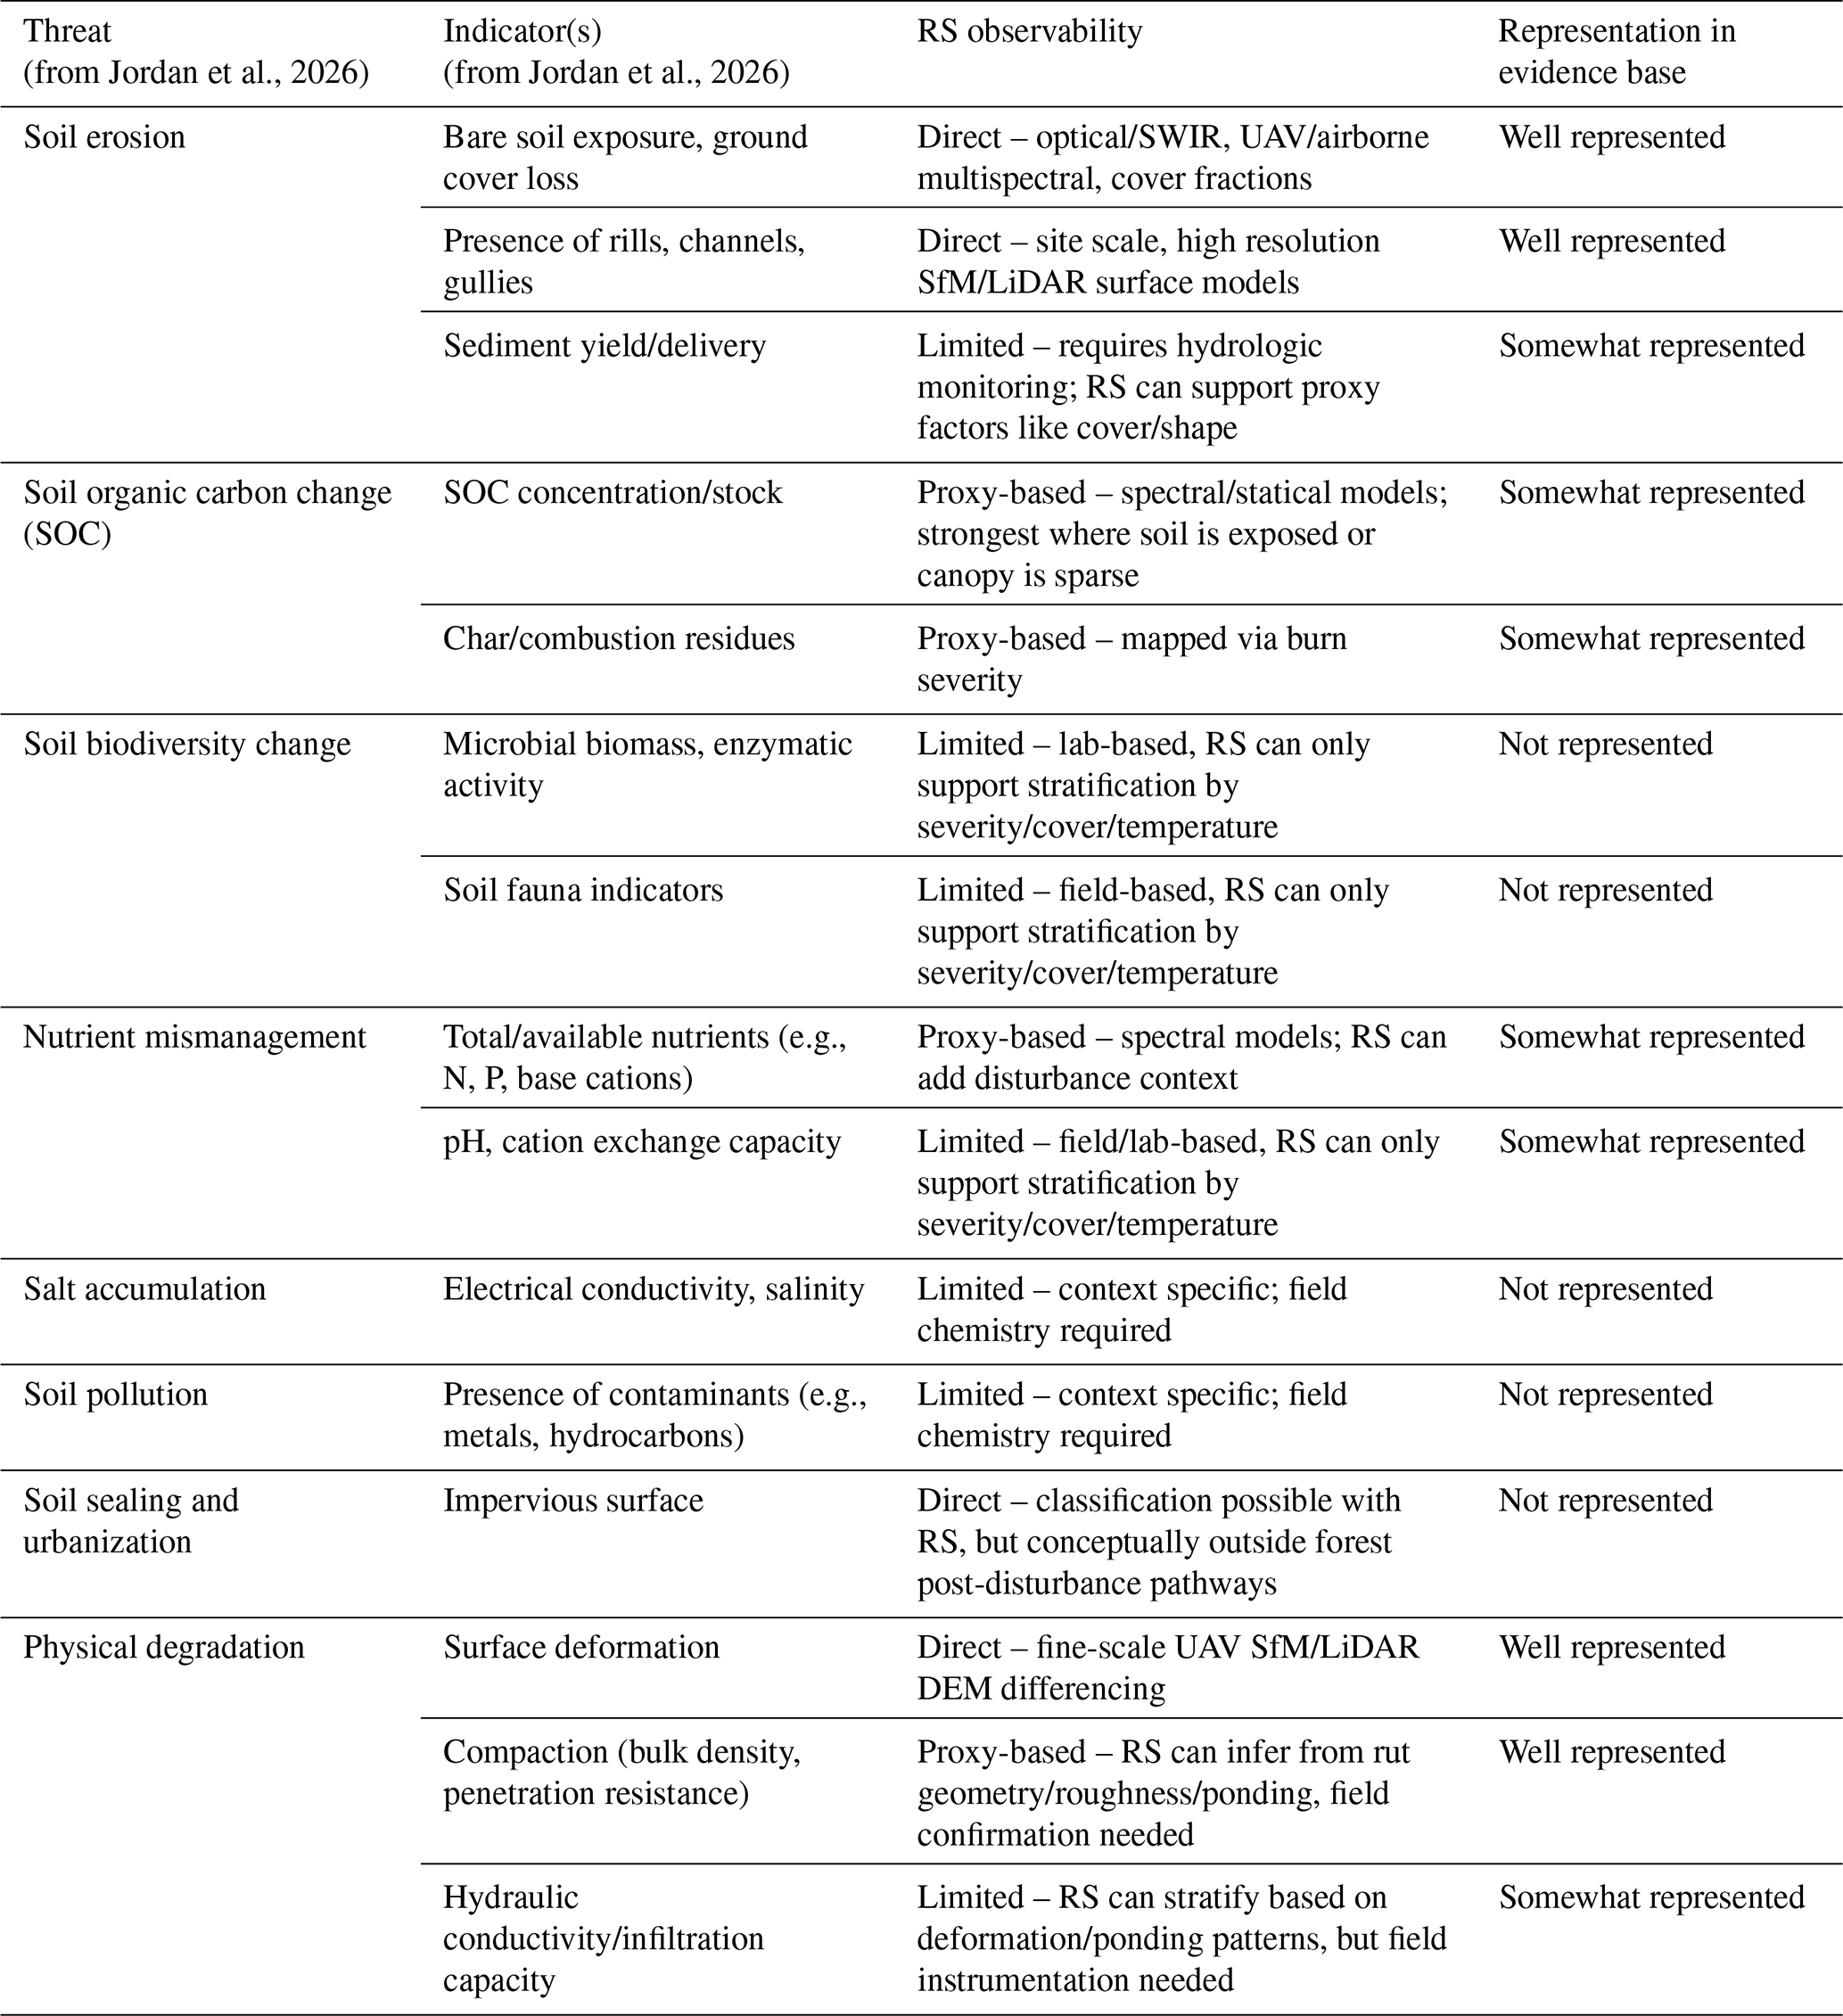
A useful way to interpret how RS is being used within the forest soil context is to break down the disturbance-threat-indicator pathway that links an initiating event to the soil threat of concern and to the indicator(s) that RS can plausibly detect. This framing helps explain why some threats are well represented in the evidence base while others remain largely invisible without ground validation. To understand where sensor-based monitoring can be most effective, we can match major disturbances with known soil degradation threats and associated indicators (Jordan et al., 2026) and classify observability as direct (sensor measures the indicator itself), proxy-based (sensor measures a correlated surface expression), or limited (indicator is predominantly subsurface/chemical/biological and requires field validation) (Table 1). This pathway-based framing is also directly relevant for indicator development in reporting contexts, where only indicators with clear threat linkages and transparent observability are more likely to be interpreted consistently across regions and disturbance types.
Table 1Threat-indicator observability matrix linking key forest soil degradation threats and associated indicators to remote-sensing observability (direct, proxy-based, or limited) and their level of representation in the mapped evidence base. “Direct” indicates indicators commonly measurable as surface expressions, “proxy-based” indicates reliance on correlated disturbance signals, and “limited” indicates indicators generally requiring field/laboratory validation.
4.2.1 Observability of dominant pathways
Wildfire and forest harvesting practices dominate the evidence base because they generate surface-expressed signals that are tractable for RS. This advantage is most pronounced for stand-replacing disturbances, where canopy removal exposes soil and combustion residues. By contrast, partial burns or partial cuts may not expose enough soil signal for robust RS inference. After a stand-replacing fire event, canopy loss and combustion residues create clear spectral signals that multispectral sensors can map efficiently over large areas. Harvesting of trees and subsequent silvicultural prescriptions, produces discontinuous, fine-scale deformation (ruts, berms, altered organic layer, debris piles) requiring high-resolution structural sensing to resolve. This difference in signal geometry and persistence explains much of the divergence in sensor choice, scale, and timing seen across the literature.
Wildfire can generate multiple threats to soil condition, including erosion, altered soil organic carbon (SOC), biodiversity changes, and short-term nitrogen surges (Jordan et al., 2026). In many cases, the resulting surface expression of burn severity produces strong, spatially coherent spectral contrasts that are well captured by multispectral data (Chafer, 2008; Guindon et al., 2021; Key and Benson, 2006). Short wave infrared bands (SWIR) bands are especially informative because sensitivity to moisture and char improves discrimination among severity classes. At finer scales, UAV multispectral data can predict composite soil burn severity more robustly than single surface metrics (e.g., ash depth alone) (Beltrán-Marcos et al., 2021; Fraser et al., 2017; Llorens et al., 2024). However, the timing of acquisitions is critical: detectability of soil-relevant contrasts declines rapidly with regrowth and surface wetting/drying cycles, which is why disturbance-proximal acquisitions anchor operational workflows (Kokaly et al., 2007; Moody et al., 2013; Robichaud et al., 2007). In contrast, SOC loss, short-lived mineral-N pulses, and below-ground biodiversity responses are not directly observable with RS in forested settings (Whitman et al., 2020) (Table 1). SOC change can sometimes be inferred along burn-severity gradients, but absolute stock losses require field sampling. Nitrogen pulses and microbial/faunal shifts are field-dependent, with RS products used mainly to stratify sampling by severity and connectivity (Jordan et al., 2026; Lewis et al., 2012; Llorens et al., 2024; Mallinis et al., 2009; Pellegrini et al., 2021; Veraverbeke et al., 2018).
Harvesting operations and subsequent silvicultural prescriptions introduce soil threats primarily through mechanical disturbance, including compaction, rutting, alteration of the forest floor and debris piles (Cambi et al., 2018; Giannetti et al., 2017; Haas et al., 2016; Marra et al., 2018). These processes, coupled with the removal of canopy, reduce porosity, alter infiltration, and increase erosion risk (Giannetti et al., 2017; Haas et al., 2016; Marra et al., 2018; Nevalainen et al., 2017; Pierzchała et al., 2016; Talbot et al., 2018; Jordan et al., 2026). Unlike wildfire, harvesting footprints are discontinuous and fine scale, with most severe impacts often confined to skid trails, landings, and haul roads, but less severe, but broader scale impacts occurring across the cut block. Soil-surface deformation and displacement (e.g., rut depth/width, berms, trail/landing footprints, microrelief) are directly observable with high-resolution structural sensing, notably UAV photogrammetry/Structure-from-Motion (SfM) (e.g., Haas et al., 2016; Marra et al., 2018; Nevalainen et al., 2017; Pierzchała et al., 2016), and airborne or portable LiDAR (e.g., Giannetti et al., 2017; Melendy et al., 2018; Mohieddinne et al., 2022). Some common indicators of post-harvest soil degradation, most notably compaction, are only proxy-observable with RS. For example, compaction can be inferred from rut geometry, surface roughness, or ponding patterns. Some of the most consequential subsurface indicators of harvesting damage to soil remain limited to field validation: bulk density, porosity, and hydraulic conductivity cannot be retrieved remotely and require in situ testing (Cambi et al., 2018; Giannetti et al., 2017; Marra et al., 2018). In practice, post-harvesting assessments often combine high-resolution disturbance maps with targeted field assessment of subsurface condition (Talbot and Astrup, 2021).
4.2.2 How threat pathways appear in the evidence base
The pathway logic developed in this section aligns closely with what the evidence map reports: disturbances most frequently studied are those linked to soil indicators with strong surface expression and high remote-sensing observability (see Table 1). In post-wildfire assessments, burn severity indices dominate, followed by measures of char/ash and vegetation or substrate cover (e.g., NDVI, NBR). Methodologically, wildfire studies overwhelmingly rely on optical multispectral satellite data (especially Landsat and Sentinel-2) because SWIR/NIR sensitivity to ash, char, exposed soil and vegetation loss enables robust, landscape-scale mapping across long time series and diverse biomes (e.g., Beltrán-Marcos et al., 2023; Guindon et al., 2021; Kadakci Koca, 2023). Seasonal spectral trajectories derived from dense Landsat time series have similarly been shown to capture post-fire shifts in NDVI and NBR phenology, supporting the use of temporal metrics as indicators of disturbance and recovery (Rose and Nagle, 2021).
By contrast, harvesting produces discontinuous, fine-scale surface deformation that requires structural sensors and high-resolution products. As such, harvesting studies employ UAV-based SfM photogrammetry (e.g., Haas et al., 2016; Marra et al., 2018; Nevalainen et al., 2017; Pierzchała et al., 2016) and LiDAR (e.g., Giannetti et al., 2017; Melendy et al., 2018; Mohieddinne et al., 2022) to reconstruct rut geometry and surface disturbance in three dimensions. Other significant impacts of harvesting traffic, such as subsurface compaction, appear in the evidence base primarily through paired designs where sensor-derived disturbance maps are used to stratify sampling and interpret field measurements (e.g., Cambi et al., 2018; Dubé and Berch, 2013).
4.2.3 Pathways with limited observability and threat–indicator mismatch
Not all disturbance-threat pathways produce surface expressions that are stable or diagnostic enough for direct observation with RS. As a result, pathways dominated by subsurface physical change or chemical and biological alteration remain under-represented in the evidence base, even when they are highly relevant to long-term soil functioning and site productivity. This reflects a fundamental observability constraint, not a lack of ecological importance. Across disturbances, indicators such as bulk density, porosity, hydraulic conductivity, nutrient availability, pH, salinity, and soil biodiversity metrics generally require field or laboratory measurement (Table 1). Where RS contributes, it does so indirectly by mapping correlated surface conditions (e.g., disturbance footprint, vegetation loss, surface deformation, moisture regime) that co-vary with subsurface processes. These proxy approaches support spatial stratification and hypothesis testing but typically require local calibration and repeated field validation, limiting transferability across forest types and regions (Table 1).
This constraint helps explain why insect outbreaks, windthrow, and mining are sparsely represented relative to wildfire and harvesting. For insect outbreaks, RS readily maps defoliation severity, yet the soil pathways of interest (nutrient cycling shifts, leaching signals, microbial responses) are largely field-dependent, making RS most defensible as disturbance context rather than as a soil indicator (e.g., coupling Landsat-derived defoliation with soil/solution N, Conrad-Rooney et al., 2020). In windthrow, pit-mound microtopography is detectable from high-resolution 3D data, but observability windows are short and performance depends on data quality and point-cloud classification, limiting routine operations (e.g., Godziek, 2024). In mining contexts, dominant indicators are often chemical or subsurface (contamination, salinity, acidity), placing them largely outside current forest-focused RS workflows (e.g., Lee et al., 2023).
A recurring operational issue is threat-indicator mismatch, where commonly mapped RS indicators do not directly represent the soil threat of management concern. In wildfire contexts, widely used severity products often track vegetation change more strongly than soil impacts unless explicitly calibrated to soil-focused severity frameworks and validated against ground indicators. In harvesting, high-resolution 3D products derived from UAV SfM photogrammetry and airborne/terrestrial LiDAR can map where disturbance occurred (e.g., rut geometry, displaced material), typically via DEM/DTM differencing or point-cloud change detection. However, subsurface compaction and hydraulic impairment must be inferred and confirmed through field measurements (e.g., Kim et al., 2025; Marra et al., 2018; Nevalainen et al., 2017). The practical remedy is to make the threat-indicator link explicit: state the threat, identify what is directly observed versus inferred, justify any proxy relationship and its limits, and treat RS products as stratification/decision-support layers when targets are subsurface or biogeochemical.
Overall, RS is most reliable when degradation is persistently surface-expressed and least reliable when signals are ephemeral or subsurface. Accordingly, designs should prioritize disturbance-proximal acquisitions for short-lived surface signals; select SWIR-inclusive optics (wildfire) or high-resolution structural sensing (harvesting) matched to the pathway; and pair RS with targeted field validation wherever indicators are proxy-based or calibration-sensitive.
4.3 Constraints on operational soil monitoring in forest landscapes
Even when disturbance-threat-indicator pathways are clear, operational soil monitoring in forests is limited by canopy/understory occlusion, moisture dynamics and seasonality, and topography/illumination, which together raise uncertainty and validation burden. In contrast to agricultural systems, where frequent bare-soil exposure accelerates method standardization, forests offer fewer, shorter observation windows, making inference more opportunistic and disturbance-contingent.
4.3.1 Canopy and understory occlusion
In optical systems, overstory/understory signals frequently dominate pixel reflectance, so satellite-derived indices often correlate more strongly with vegetation and surface cover than with soil processes occurring beneath the canopy (Fernández-Guisuraga et al., 2022; Hudak et al., 2007). This same constraint extends to high-resolution structural approaches: UAV SfM point clouds can concentrate returns in the upper canopy and undergrowth, resulting in a ground model that is too sparse or constrained in densely vegetated areas (Nevalainen et al., 2017). Even when canopy gaps exist (e.g., along trails), discontinuities and partial exposure can complicate detection and often require workflow adaptations such as low-altitude flights or denser image overlap to improve ground model continuity (Nevalainen et al., 2017; Talbot and Astrup, 2021).
4.3.2 Moisture interference and seasonality
Moisture is both a target variable and a major source of confounding variability. Post-fire SWIR-based indices, for example, are highly sensitive to surface wetness, and fluctuations in drying or rehydration can shift spectral values independently of changes in soil condition (Beltrán-Marcos et al., 2021; Llorens et al., 2024). Soil moisture varies with texture, microtopography, canopy interception, and recent weather, making it difficult to determine whether observed spectral or structural differences reflect degradation or transient hydrological states. Seasonality amplifies these challenges: snowmelt, spring saturation, and prolonged cloud cover limit the number of stable observation windows, especially in boreal and temperate climates (Niemi et al., 2017). Even dense satellite time series (e.g., Sentinel-2) may include gaps that preclude tightly timed post-disturbance analyses (Llorens et al., 2024). As a result, operational soil monitoring requires clearly defined seasonal acquisition windows, explicit handling of moisture as a covariate, and the strategic incorporation of SAR data, which is less constrained by illumination and cloud cover. However, SAR-based inference remains sensitive to wavelength choice and forest structure, leading to context-dependent performance (Fernández-Guisuraga et al., 2022).
4.3.3 Topography and illumination effects
Slope and aspect introduce systematic reflectance differences due to variable illumination geometry, shadows, and bidirectional reflectance effects. These influences can bias optical metrics and create apparent gradients in soil exposure, burn severity, or vegetation recovery that are unrelated to actual soil processes (Kadakci Koca, 2023; Quintano et al., 2019). In post-fire mapping, for example, severity estimations may vary with topographic position rather than with combustion intensity if terrain effects are not corrected. These issues are magnified in UAV imagery, where fine-scale illumination variability, deep shadows, and occlusions can degrade orthomosaics and distort surface-model change detection (Marra et al., 2021). Structural data also face limitations: LiDAR point-cloud classification can misidentify understory vegetation or debris as ground surface in steep or complex terrain (Nevalainen et al., 2017). Effective operational workflows therefore require robust topographic correction, careful shadow management, and illumination-aware acquisition planning to distinguish true soil-surface change from geometric artifacts.
4.3.4 Technology implementation time lags
Together, canopy occlusion, moisture variability, and topographic complexity contribute to a broader “implementation lag” for operational, soil-focused RS in forests. While agricultural applications have benefited from extensive bare-soil periods, stable phenology, and consistent observation conditions that support rapid sensor and index development, forest environments provide limited and often disturbance-dependent windows in which soil conditions can be observed. Rapid vegetation regrowth, seasonal wetness, and strong dependence on proxy indicators slow the development and uptake of standardized soil-monitoring products (Fassnacht et al., 2024). Consequently, forest applications remain dominated by site-specific studies, experimental methods, and nested designs that use broad-scale optical screening to direct targeted UAV/LiDAR surveys (e.g., Puliti et al., 2018; Talbot et al., 2018). High-resolution structural workflows (e.g., DEM differencing) also require rigorous reporting of vertical uncertainty and limits of detection to separate true soil change from noise (Nevalainen et al., 2017; Rengers et al., 2016). As a result, RS continues to function best as a complementary component of integrated soil-monitoring systems rather than a stand-alone replacement for field measurement.
4.4 Scale and timing trade-offs in post-disturbance soil monitoring
The value of RS application depends not only on whether indicators are observable, but on where and when they can be captured relative to management objectives. Study areas in the evidence base span hundreds of square metres to hundreds of thousands of hectares, with designs clustering around the spatial footprint of the threat (e.g., broad-footprint erosion vs. narrow-footprint rutting) and the temporal window during which surface expressions remain detectable.
4.4.1 Short-term detection vs long-term recovery tracking
Short-term, post-disturbance mapping leverages strong but transient surface contrasts, such as ash/char deposition, exposed mineral soil, and abrupt vegetation loss after fire, or cleat surface deformation following traffic, making disturbance-proximal acquisitions especially effective for triage, erosion-risk screening, and early stabilization planning (e.g., Burned area mapping workflows based on NBR/dNBR) (Chafer, 2008; Perbet et al., 2025; White, 2024). This design logic is reflected in our synthesis: acquisition years frequently coincide with disturbance and sampling windows, reflecting the operational need to capture short-lived surface expressions while they remain detectable. It is important to note, however, that because timing in Fig. 7 was compiled at annual resolution, cases plotted as “same-year” may represent imagery acquired weeks to months pre- and post-event. This granularity is sufficient to show the strong emphasis on disturbance-proximal observation but does not resolve month-scale dynamics, which matters where signals attenuate quickly. Spectrally, inclusion of SWIR bands improves discrimination among post-fire severity classes when moisture and char fractions are changing rapidly. At finer scales, UAV multispectral data can predict composite soil burn severity more robustly than single surface metrics, which further motivates early acquisitions before signal attenuation (Beltrán-Marcos et al., 2021; Llorens et al., 2024).
By contrast, assessing long-term recovery requires observation strategies that extend beyond the period of maximum detectability. As vegetation regrows, litter and debris accumulate, and surface moisture regimes normalize, surface-expressed indicators weaken, and the soil attributes of greatest long-term significance (e.g., hydraulic function, SOC stability, and broader biogeochemical trajectories) become increasingly field-dependent (Lewis et al., 2017; Mohieddinne et al., 2019). In practice, this pushes monitoring toward a two-tier approach: (i) early RS to map disturbance footprints and surface indicators for screening and stratification, followed by (ii) targeted, field-anchored campaigns and repeated acquisitions to track recovery processes that RS cannot directly measure with confidence.
4.4.2 Broad-scale screening vs site-scale diagnosis
Spatial scale choices in the evidence base also highlight a contrast between broad-scale screening and site-scale diagnosis. The evidence base shows that broad-footprint outcomes, particularly soil burn severity and post-fire erosion, most often pair with multispectral satellite systems. This is consistent with previous studies demonstrating that these systems offer standardized, repeatable coverage suitable for landscape-to-regional mapping (Guindon et al., 2021; Perbet et al., 2025). In contrast, the evidence base suggests that narrow and discontinuous mechanically induced outcomes, such as rutting, displacement, and compaction proxies along skid trails and at landings, were consistently mapped using very-high-resolution structural sensing. This reliance on UAV/SfM photogrammetry and LiDAR for fine-scale assessments is also supported by prior studies (e.g., Pierzchała et al., 2014; Talbot et al., 2018; Venanzi et al., 2023). This produces a practical trade-off: coarse-resolution approaches maximize coverage and comparability but offer limited mechanistic specificity, whereas fine-resolution approaches deliver diagnostic detail at the expense of coverage efficiency and cross-site uniformity (Talbot and Astrup, 2021; Latterini et al., 2025).
To bridge these scales, many applications adopt nested designs: use regional satellite screening to identify and prioritize high-risk areas, then deploy targeted UAV/LiDAR diagnostics to quantify mechanisms (e.g., rut depth/width, displaced volumes, microtopography) where management action is most needed (e.g., Latterini et al., 2020; Talbot et al., 2018). This combination preserves regional consistency for decision-making while capturing the site-scale resolution required for mitigation and adaptive planning (Kokaly et al., 2007; Pierzchała et al., 2014).
It is important to note that most studies used multi-sensor and/or multi-scale designs, making it difficult to assign a single spatial extent to a specific sensor or platform. Publications typically report a single overall study area (e.g., an entire fire footprint) alongside plot sizes for validation, without specifying how coverage was divided across methods; sensor-specific footprints are thus often implicit.
Overall, the trade-off between broad-scale coverage and site-scale diagnostic resolution is well documented: greater mechanistic specificity entails reduced coverage efficiency (higher per-site effort and cost) and limited generalization (Puliti et al., 2018), a pattern also evident in national Landsat time-series monitoring where synoptic consistency is achieved at the expense of fine-scale diagnostic detail. Nested, multiresolution designs therefore remain essential for linking coarse-scale screening with the fine-scale diagnostics needed to interpret underlying mechanisms, especially when standardized satellite time-series products provide consistent but non-mechanistic baselines (White et al., 2017).
4.4.3 Validation requirements and uncertainty
Validation requirements increase as monitoring products are transferred across broader spatial extents or rely on indirect indicators. In post-wildfire contexts, this is evident in how severity products often track vegetation change more directly than soil effects, making explicit calibration to soil-burn-severity frameworks and field indicators essential (Beltrán-Marcos et al., 2021; Chafer, 2008; Marcos et al., 2018). Similar constraints arise when optical indices are used to infer soil properties that are only intermittently exposed; threat–indicator coherence becomes increasingly context-dependent and degrades with canopy cover, moisture variability, and site heterogeneity (Beltrán-Marcos et al., 2023; Kadakci Koca, 2023). For SAR-based approaches, transferability is also conditional: models of post-fire soil properties can perform well, but sensitivity to wavelength and forest structure reinforces the need for local calibration and explicit uncertainty reporting (Fernández-Guisuraga et al., 2022).
For fine-scale, structurally expressed soil threats (e.g., rutting, soil displacement), uncertainty often stems from measurement and processing limits (e.g., point density, vegetation masking, or surface-model generation) rather than sensor physics alone. These uncertainties must be validated to distinguish true change from noise. Best practice includes accounting for elevation error when differencing surface models and applying a limit of detection (LoD) threshold below which apparent change is discarded (Rengers et al., 2016). In forest settings, however, vegetation cover reduces ground-surface capture quality, limiting the accuracy of rut and microtopography measurements (Nevalainen et al., 2017; Talbot et al., 2018). Reporting vertical uncertainty and the selected LoD, as well as qualifying sparse-return or understory-dense areas as lower confidence, strengthens confidence in the interpretation of surface-change indicators in operational contexts (Mesa-Mingorance and Ariza-López, 2020).
4.4.4 Proactive vs. reactive monitoring: required baseline
A key distinction in post-disturbance soil monitoring is whether inference relies on proactive baselines (pre-event) or reactive observations (post-event only). The evidence base shows this split aligns strongly with disturbance type and scale: wildfire studies overwhelmingly use pre-event imagery and spectral differencing (e.g., dNBR), with explicit pre-disturbance acquisitions reported almost exclusively for fire cases. This reflects the practicality of long-running satellite archives that enable standardized pre/post comparisons across large areas at low marginal cost (Guindon et al., 2021; Quintano et al., 2019; Whitman et al., 2020). By contrast, harvesting and other site-scale disturbances seldom have comparable pre-event, high-resolution baselines; studies therefore map post-event surface footprints and infer subsurface condition via targeted field sampling rather than true pre/post change detection (e.g., Cambi et al., 2018; Giannetti et al., 2017).
Baselines matter because they (i) reduce ambiguity between disturbance effects and pre-existing heterogeneity (soils, topography, vegetation) and (ii) support clearer uncertainty characterization for proxy-based indicators by anchoring post-event signals to known pre-conditions. Without them, post-event maps risk conflating management impacts with background variability, especially where soil signals are indirect or intermittently expressed. Despite this, proactive baselines are difficult to maintain in forests: canopy closure, seasonal limits on exposure, and field-validation needs narrow acquisition windows and raise costs, particularly for high-resolution platforms. Accordingly, the evidence supports a hybrid strategy rather than a strict proactive/reactive choice: maintain coarse but repeatable baselines in priority areas (e.g., periodic LiDAR, standardized seasonal satellite composites, sentinel field plots) and pair them with reactive post-disturbance mapping to triage where intensive site-scale diagnostics and field campaigns add the most value (Fernández-Guisuraga et al., 2022; Robichaud et al., 2007; Talbot et al., 2018).
4.5 Evidence gaps and research priorities
This evidence map reveals clear strengths in RS-based soil monitoring while also exposing persistent gaps. These gaps arise from fundamental observability constraints that limit which soil threats can be detected remotely, uneven biogeographical and disturbance-type representation, and methodological or search-design choices that bias retrieval toward certain pathways. Addressing these limitations offers opportunities to expand coverage, improve uncertainty handling, and enhance the value of RS for disturbance-aware soil assessment and management.
4.5.1 Coverage and representation gaps
A primary gap is uneven biogeographical coverage: studies cluster in boreal and temperate forests, with Mediterranean systems less frequent and tropical forests rarely captured. This largely reflects differences in disturbance observability and data continuity across biomes. In humid tropical forests, persistent cloud cover limits optical RS; archive analyses show many regions experience months-long gaps without cloud-free Landsat/Sentinel-2 observations, constraining event-timed mapping and short-interval change detection (Flores-Anderson et al., 2023). Even when images are available, dense canopies and rapid regrowth shorten the detection window for soil-related indicators (DeVries et al., 2015; Dupuis et al., 2020). By contrast, boreal and temperate forests often present more favorable conditions for soil monitoring after disturbance. Seasonal leaf-off periods, and slower vegetation recovery extend the window during which soil surface conditions can be observed (Melaas et al., 2016; White, 2024).
Apparent sensor–biome tendencies mainly mirror dominant disturbances, not inherent sensor–biome fit. Multispectral data are common in Mediterranean/temperate forests because wildfire is prevalent, and optical sensors excel when canopy loss exposes spectrally distinctive ash and bare mineral soil (Chafer, 2008; Veraverbeke et al., 2018). In boreal forests, harvesting dominates and produces persistent structural soil features that are less spectrally distinct but well captured with stereo photogrammetry and LiDAR, which directly characterize topography and disturbance geometry (Talbot and Astrup, 2021; Venanzi et al., 2023). In short, sensor choice in the literature tends to follow disturbance expression within each biome.
A parallel gap is uneven disturbance representation, with wildfire and harvesting dominating relative to mining, insect outbreaks, and windthrow. As noted in Sect. 4.1, this reflects a basic observational advantage: these disturbances leave clearer or more persistent soil-related signals (ash/char, exposed mineral soil, ruts, surface deformation) that RS can track. A methodological factor likely contributed as well: the intervention search string employed in this study emphasized forestry terms (“fire/burn”, “harvest/harvesting”, “insects/disease”, “windthrow/blowdown”) and omitted common extractive-sector terms (e.g., mining, extraction, quarry/aggregates, tailings, reclamation). Outcome terms likewise prioritized physical/hydrologic pathways (compaction, rutting, skid trails, runoff/erosion, soil moisture), biasing retrieval toward fire/harvest and away from chemically framed extractive pathways (contamination, acidification, salinization). The only mining study retrieved, Lee et al., 2023, is consistent with this: in a post-quarry restoration context, degradation was assessed via surface-visible metrics (exposed soil/rock) aligned with our inclusion criteria.
A final gap concerns the treatment of compound or stacked disturbances. While these disturbance sequences are well represented as salvage harvesting cases in the evidence base, they remain comparatively poorly understood. As discussed above, stacked sequences require careful attribution across overlapping temporal signals and tighter timing/resolution to separate effects (Dubé and Berch, 2013; Lewis et al., 2012). High-resolution optical and LiDAR can disentangle salvage impacts under favorable conditions, but applications are inconsistent, and few studies frame disturbance effects cumulatively (Giannetti et al., 2017; Lewis et al., 2012; Robichaud et al., 2020). Given evidence that soil impacts are non-additive (e.g., amplifying erosion risk and delaying recovery) monitoring frameworks should explicitly account for disturbance sequencing and pathway interactions.
4.5.2 Emerging technologies and methodological frontiers
Recent advances in sensing physics, data fusion, and analytics are expanding what is technically feasible for post-disturbance soil monitoring, particularly where conventional optical or structural sensors reach their observability limits. Several emerging technologies show promise for overcoming long-standing challenges related to canopy occlusion, moisture interference, and subsurface detectability.
One important frontier is quantum sensing. Cold-atom gravity gradiometers can detect density contrasts at sub-metre resolution, revealing buried voids, density anomalies, or moisture differences that are invisible to conventional optical or LiDAR systems (Stray et al., 2022). Stray et al. demonstrated precise detection of a buried tunnel, outperforming traditional ground-gravity methods, suggesting that such sensors could eventually support identification of compaction, hidden water pockets, or buried layers in forest environments (Stray et al., 2022). Looking ahead, NASA's Earth Science Technology Office highlights next-generation quantum-based gravity and microwave detectors as promising tools for future Earth-observation systems, potentially mitigating canopy and illumination constraints that limit current RS (NASA Earth Science Technology Office, 2024).
Concurrently, hyperspectral remote sensing is enhancing detection of soil-relevant biochemical and physical properties. By capturing narrow spectral features linked to mineralogy, organic matter, ash/char composition, and moisture, hyperspectral systems can improve soil-signal discrimination relative to broadband multispectral data and strengthen proxy relationships for soil carbon and nutrient loss when paired with field spectroscopy (Tarun Kshatriya and Thamizh Vendan, 2025; Yu et al., 2020). In post-fire and harvesting contexts, integrating hyperspectral data with machine learning and change detection has shown promise for isolating soil-surface signals (e.g., sealing, exposed mineral soil, char fractions) from overstory effects (Tarun Kshatriya and Thamizh Vendan, 2025; Yu et al., 2020).
A complementary frontier is AI-enabled multi-sensor fusion. Deep learning and related data-fusion approaches can integrate structural (LiDAR/SfM), spectral (optical/hyperspectral), and radar (C-/L-band SAR) data streams to improve detection of harvesting-related disturbance under partial canopy and across complex terrain (Essbiti et al., 2025; Latterini et al., 2025). Soil-focused studies show that fused sensor-AI systems can accurately predict moisture, salinity, and nutrient availability, and translate these predictions into actionable management tools (Tarun Kshatriya and Thamizh Vendan, 2025). In forest applications, such approaches could enhance rut detection under partial canopy, automate erosion-feature mapping, and help separate soil-burn-severity signals from overlying vegetation patterns (Essbiti et al., 2025; Howari, 2025).
This evidence map synthesizes nearly three decades of research on RS for post-disturbance soil monitoring and clarifies how disturbance context, sensor choice, and indicator observability shape current practice. Across biomes, RS is most effective when soil degradation generates persistent surface expressions, such as post-fire exposure of mineral soil or traffic-induced deformation, while subsurface physical, chemical, and biological changes remain largely beyond direct detection. The disturbance-threat-indicator framework used here highlights these constraints and emphasizes that RS must be aligned with the specific soil threat, spatial footprint of disturbance, and the temporal window during which indicators are detectable. Several cross-cutting insights emerge: (1) wildfire and harvesting dominate the evidence base because they produce strong or fine-scale surface signals suited to optical or structural sensors respectively, (2) scale and timing strongly influence capability: broad-scale satellite observations support consistent screening, whereas site-scale diagnostics require targeted, high-resolution acquisitions collected closely after disturbance, (3) RS adds the most value when paired with field validation, providing spatial context for interpreting soil processes that cannot be observed directly.
Although remote sensing enables broad-scale characterization of disturbance footprints and surface-expressed soil indicators, our synthesis also highlights that observability constraints fundamentally shape which indicators are currently most suited to reporting applications. Indicators tied to discontinuous, fine-scale surface deformation (e.g., rutting, displacement) or persistent spectral change (e.g., burn severity) have the strongest evidence base for consistent RS monitoring, whereas indicators dominated by subsurface physical, chemical, or biological change remain dependent on field validation and are therefore less well suited to standardized reporting without hybrid RS–field workflows. These distinctions matter because global assessment frameworks such as the FAO Global Forest Resources Assessment explicitly rely on transparent, repeatable, indicator-driven reporting produced with acceptable consistency, uncertainty, and scalability (FAO, 2025). Thus, this evidence map clarifies not only where RS provides reliable post-disturbance soil information, but also which indicators currently show the clearest observability pathways and strongest evidence base for potential integration into emerging national and international monitoring programs, helping to identify realistic pathways toward disturbance-aware soil indicators for future reporting applications.
Overall, RS should be viewed not as a replacement for field-based assessment but as a core element of integrated, multi-scale soil-monitoring systems. By clarifying strengths, limitations, and evidence gaps, this synthesis provides a foundation for developing more operational, disturbance-aware frameworks for protecting forest soils.
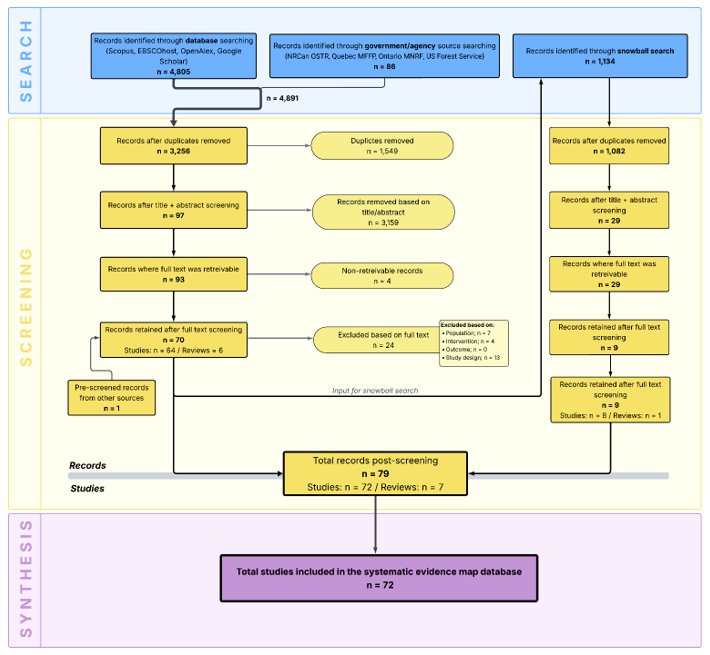
Figure A1ROSES-style diagram of the article screening process for this knowledge map. Inspired by template from Haddaway et al. (2018).
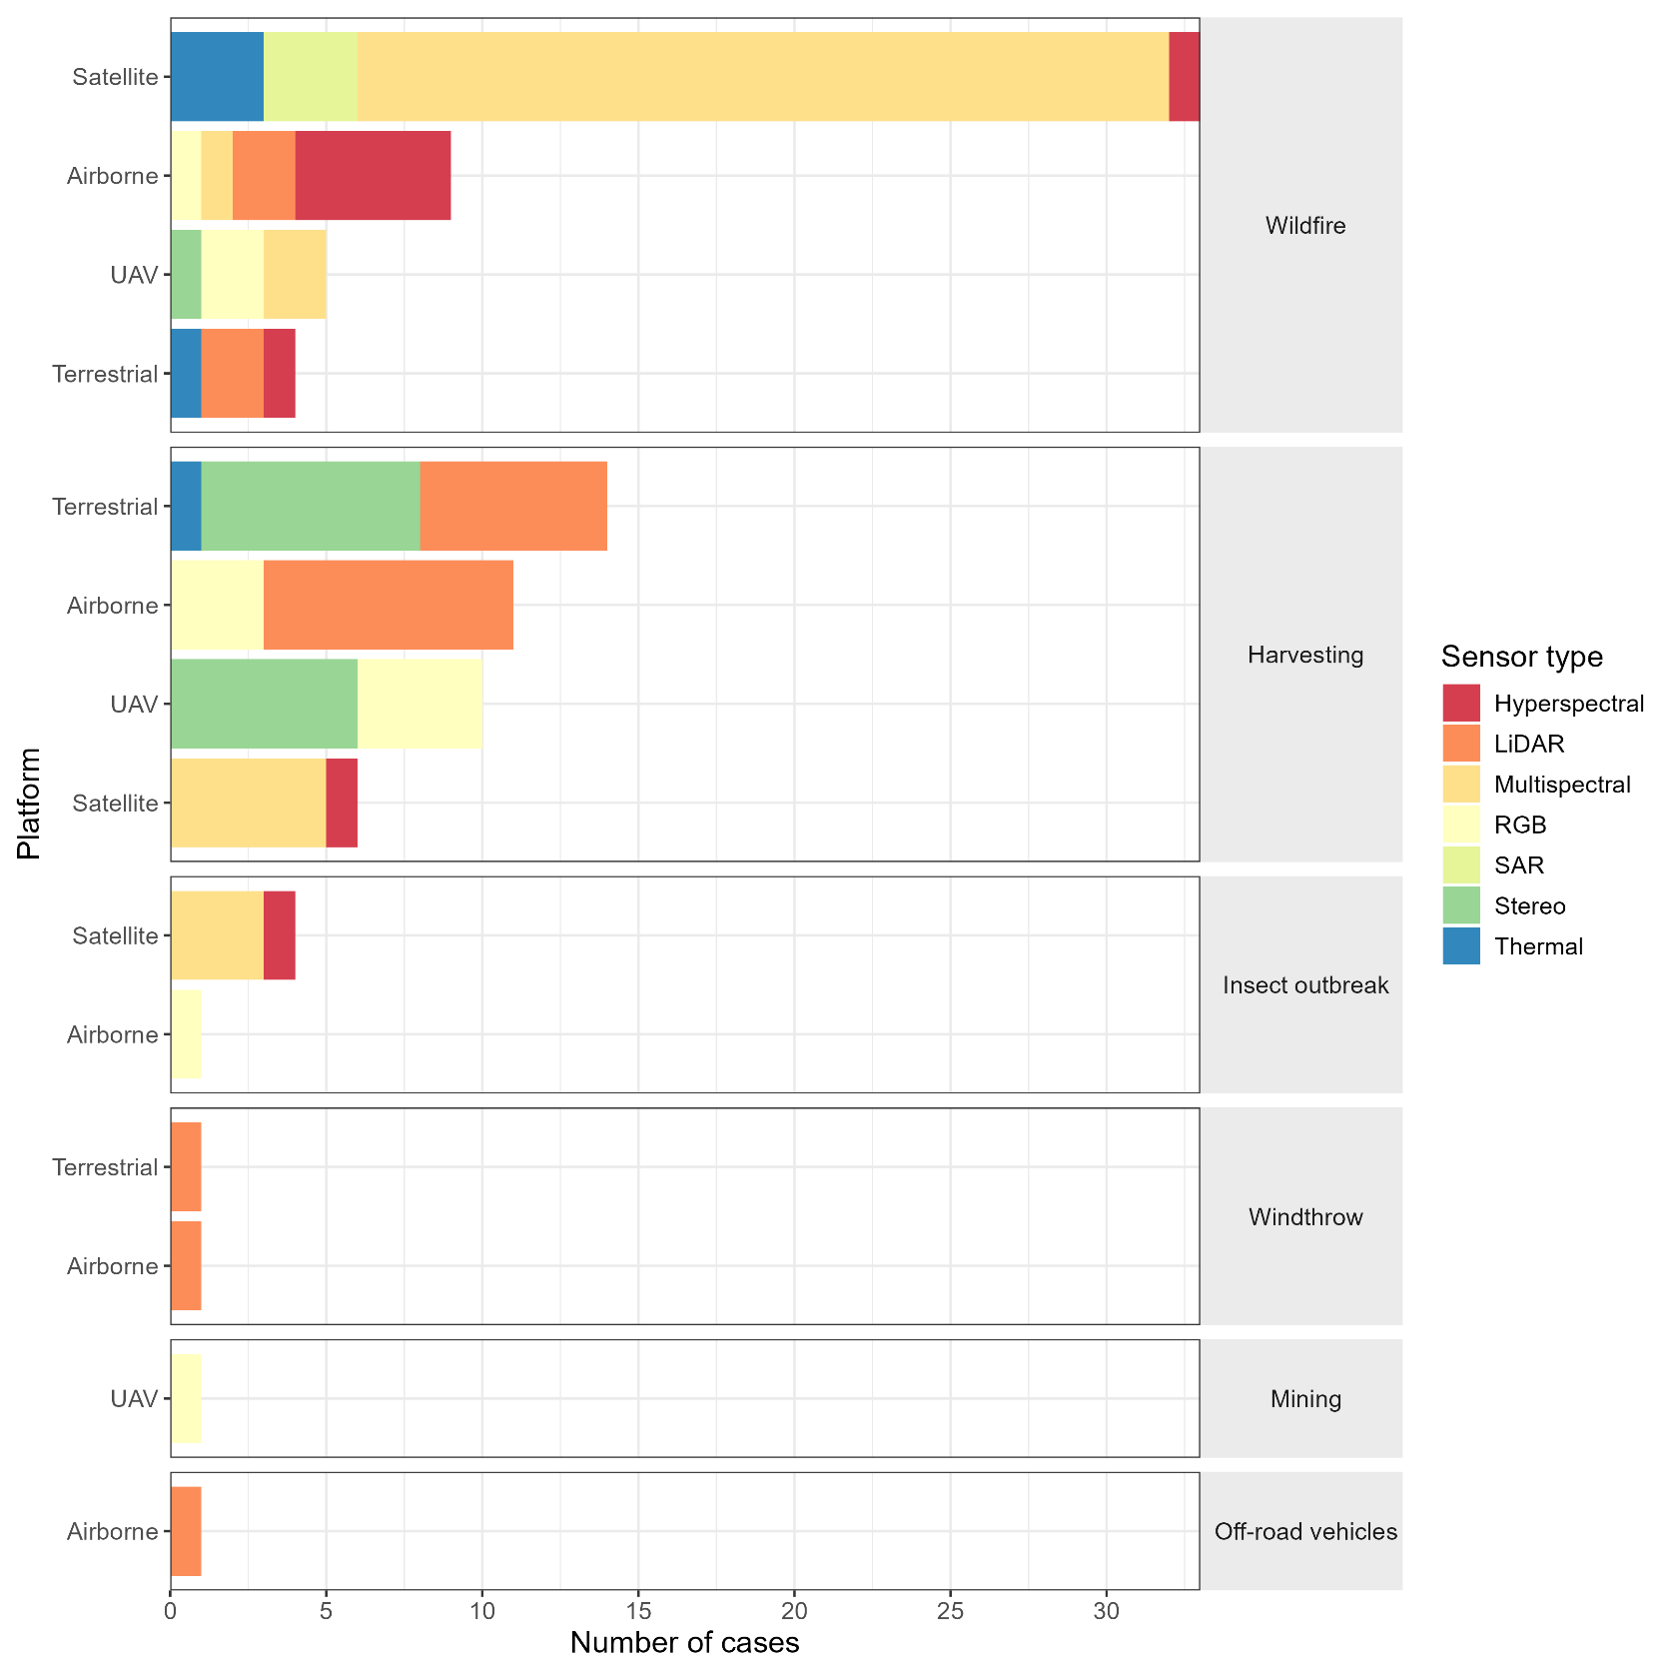
Figure A2Number of cases of each sensor type use across RS platform types, separated by disturbance type. Note that a single study could report the use of more than one platform type, sensor type, or disturbance type, thus each combination of platform, sensor type, and disturbance type is counted as one “case” (91 cases across 72 studies).
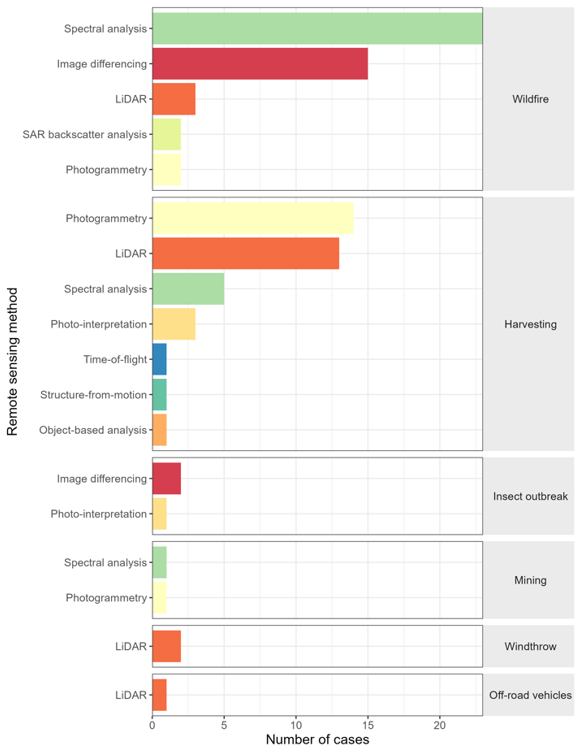
Figure A3Number of cases of each RS method used by disturbance type. Note that a single study could report more than one RS method or disturbance type, thus each combination of method and disturbance type is counted as one “case” (91 cases across 72 studies).
Table A1Search strings used to target population, intervention, outcome, and method components of remote sensing (RS) studies that monitor forest soil degradation. The search strings include wildcards (∗) and, in order of precedence, the Boolean operators NOT, AND, and OR. The strings for each of the four study components are joined with a Boolean AND.
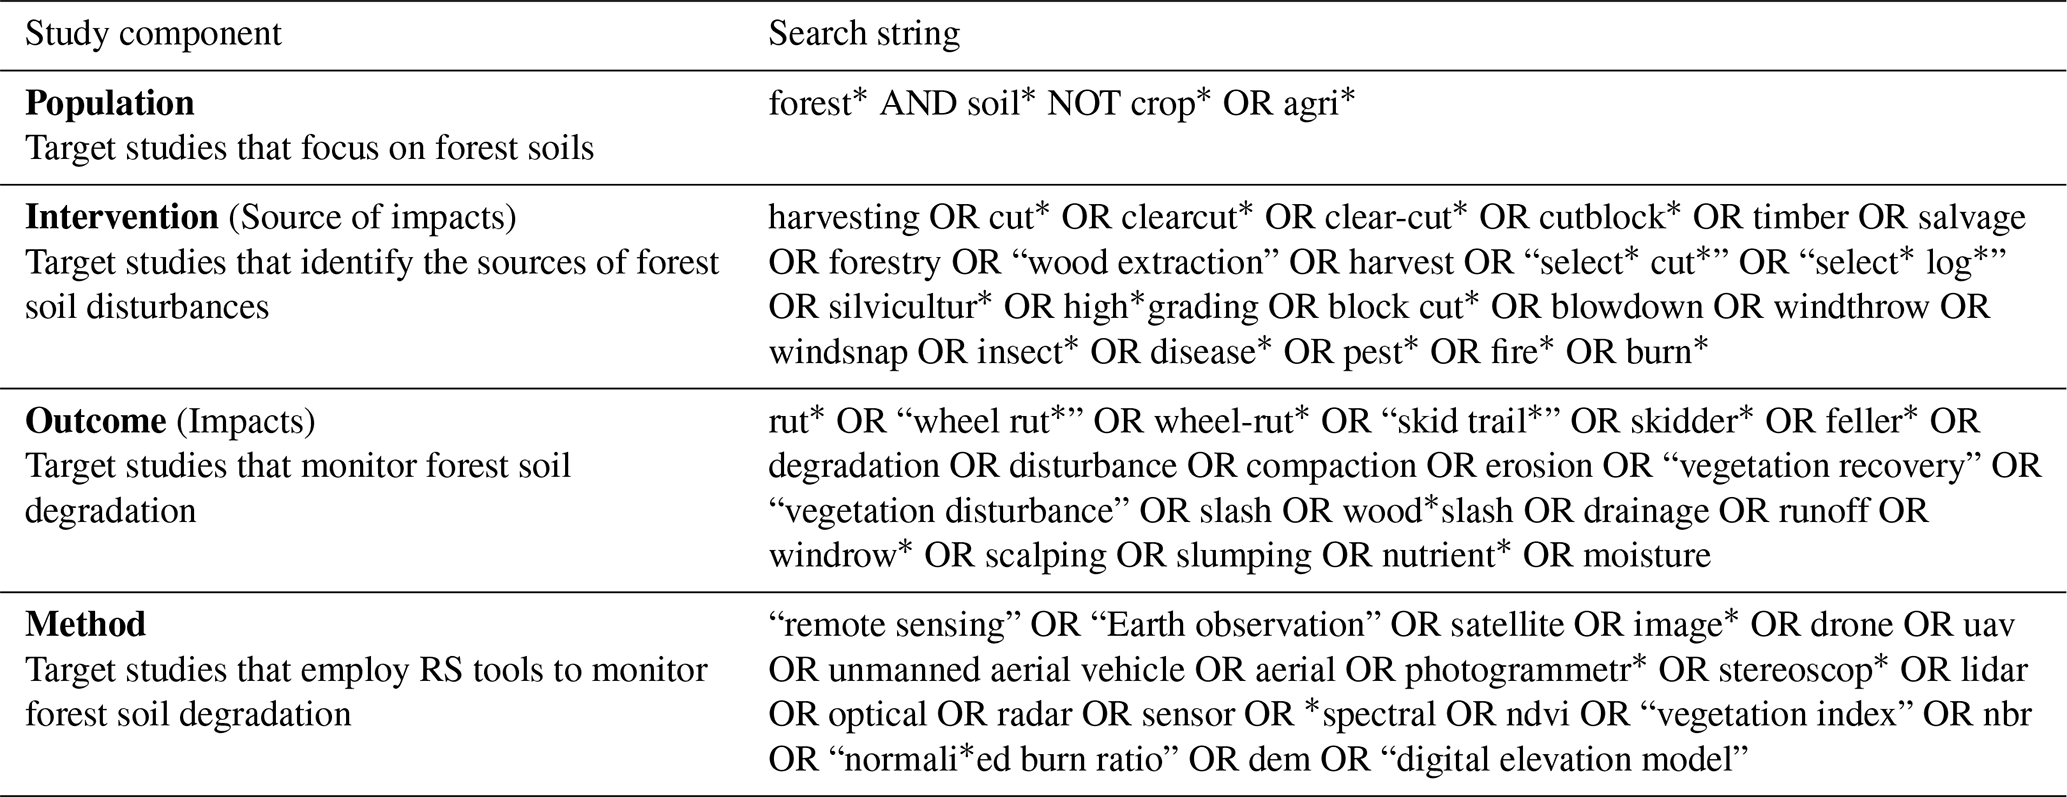
Table A2Broad categories for soil degradation indicators, including definitions and included terms.
All code and data associated with the work reported in this paper can be accessed on Zenodo: https://doi.org/10.5281/zenodo.19225706 (Roach-Krajewski et al., 2026).
Maisy Roach-Krajewski: Data curation, Investigation, Formal analysis, Methodology, Visualization, Writing – Original draft.
Xavier Giroux-Bougard: Conceptualization, Data curation, Investigation, Formal analysis, Methodology, Writing – Original draft.
David Paré: Conceptualization, Funding acquisition, Writing – Review and editing.
Catlan Dallaire: Writing – Review and editing.
Luc Guindon: Writing – Review and editing.
Florian Jordan: Writing – Review and editing.
Charlotte Norris: Funding acquisition, Writing – Review and editing.
Kara Webster: Funding acquisition, Writing – Review and editing.
Jérôme Laganière: Conceptualization, Funding acquisition, Project administration, Supervision, Writing – Review and editing.
The contact author has declared that none of the authors has any competing interests.
Publisher's note: Copernicus Publications remains neutral with regard to jurisdictional claims made in the text, published maps, institutional affiliations, or any other geographical representation in this paper. The authors bear the ultimate responsibility for providing appropriate place names. Views expressed in the text are those of the authors and do not necessarily reflect the views of the publisher.
The authors would like to thank Aicha Hezit for her contribution to the data extraction for this evidence map, as well as all members of the forests soil degradation team for their valuable input and constructive feedback. We would also like to acknowledge the researchers who have put immeasurable time and resources into advancing this field of study. Without your work, the compilation of this evidence map would not be possible.
Declaration of generative AI and AI-assisted technologies in the writing process. During the preparation of this work the authors used Microsoft Copilot to help condense sections of the text in late-stage reviewing. After using this tool, the authors reviewed and edited the content as needed and takes full responsibility for the content of the published article.
This work was funded by the Forest Systems Information and Technology Enhancement (ForSITE) program of the Canadian Forest Service.
This paper was edited by Jonathan Maynard and reviewed by Mark Kimsey and one anonymous referee.
Affek, A. N., Zachwatowicz, M., Sosnowska, A., Gerlée, A., and Kiszka, K.: Impacts of modern mechanised skidding on the natural and cultural heritage of the Polish Carpathian Mountains, Forest Ecol. Manage., 405, 391–403, https://doi.org/10.1016/j.foreco.2017.09.047, 2017.
Agbeshie, A. A., Abugre, S., Atta-Darkwa, T., and Awuah, R.: A review of the effects of forest fire on soil properties, J. Forest Res., 33, 1419–1441, https://doi.org/10.1007/s11676-022-01475-4, 2022.
Allen, J. L. and Sorbel, B.: Assessing the differenced Normalized Burn Ratio's ability to map burn severity in the boreal forest and tundra ecosystems of Alaska's national parks, Int. J. Wildland Fire, 17, 463–475, https://doi.org/10.1071/WF08034, 2008.
Baur, M. J., Friend, A. D., and Pellegrini, A. F. A.: Widespread and systematic effects of fire on plant–soil water relations, Nat. Geosci., 17, https://doi.org/10.1038/s41561-024-01563-6, 2024.
Beltrán-Marcos, D., Suárez-Seoane, S., Fernández-Guisuraga, J. M., Fernández-García, V., Pinto, R., García-Llamas, P., and Calvo, L.: Mapping soil burn severity at very high spatial resolution from unmanned aerial vehicles, Forests, 12, 179, https://doi.org/10.3390/f12020179, 2021.
Beltrán-Marcos, D., Suárez-Seoane, S., Fernández-Guisuraga, J. M., Fernández-García, V., Marcos, E., and Calvo, L.: Relevance of UAV and Sentinel-2 data fusion for estimating topsoil organic carbon after forest fire, Geoderma, 430, 116290, https://doi.org/10.1016/j.geoderma.2022.116290, 2023.
Bhatnagar, S., Puliti, S., Talbot, B., Heppelmann, J. B., Breidenbach, J., and Astrup, R.: Mapping wheel-ruts from timber harvesting operations using deep learning techniques in drone imagery, Forestry, cpac023, https://doi.org/10.1093/forestry/cpac023, 2022.
Bonan, G. B.: Forests and Climate Change: Forcings, Feedbacks, and the Climate Benefits of Forests, Science, 320, 1444–1449, https://doi.org/10.1126/science.1155121, 2008.
Borsah, A. A., Nazeer, M., and Wong, M. S.: LIDAR-Based Forest Biomass Remote Sensing: A Review of Metrics, Methods, and Assessment Criteria for the Selection of Allometric Equations, Forests, 14, 2095, https://doi.org/10.3390/f14102095, 2023.
Bourgeau-Chavez, L. L., Kasischke, E. S., Riordan, K., Brunzell, S., Nolan, M., Hyer, E., Slawski, J., Medvecz, M., Walters, T., and Ames, S.: Remote monitoring of spatial and temporal surface soil moisture in fire disturbed boreal forest ecosystems with ERS SAR imagery, Int. J. Remote Sens., 28, 2133–2162, https://doi.org/10.1080/01431160600976061, 2007.
Bowd, E. J., Banks, S. C., Strong, C. L., and Lindenmayer, D. B.: Long-term impacts of wildfire and logging on forest soils, Nat. Geosci., 12, 113–118, https://doi.org/10.1038/s41561-018-0294-2, 2019.
Brown, K. J., Metsaranta, J., Paré, D., Perrakis, D. D., Van Der Kamp, D., Webster, K. L., Whitman, E., Arsenault, A., Dranga, S., Harvey, J. E., and Laganière, J.: Examining post-fire environmental change and succession in Canada, Environ. Rev., https://doi.org/10.1139/er-2025-0224, 2026.
Bryan, J.: googlesheets4: Access Google Sheets using the Sheets API V4, R package version 1.1.2, https://googlesheets4.tidyverse.org (last access: 26 March 2026), 2025.
Cambi, M., Certini, G., Neri, F., and Marchi, E.: The impact of heavy traffic on forest soils: A review, Forest Ecol. Manage., 338, 124–138. https://doi.org/10.1016/j.foreco.2014.11.022, 2015.
Cambi, M., Giannetti, F., Bottalico, F., Travaglini, D., Nordfjell, T., Chirici, G., and Marchi, E.: Estimating machine impact on strip roads via close-range photogrammetry and soil parameters: A case study in central Italy, iForest 11, 148–154, https://doi.org/10.3832/ifor2590-010, 2018.
Campbell, D. M. H., White, B., and Arp, P. A.: Modeling and mapping soil resistance to penetration and rutting using LiDAR-derived digital elevation data, J. Soil Water Conserv., 68, 460–473, https://doi.org/10.2489/jswc.68.6.460, 2013.
Chafer, C. J.: A comparison of fire severity measures: An Australian example and implications for predicting major areas of soil erosion, CATENA, 74, 235–245, https://doi.org/10.1016/j.catena.2007.12.005, 2008.
Chasmer, L. E., Hopkinson, C. D., Petrone, R. M., and Sitar, M.: Using multitemporal and multispectral airborne lidar to assess depth of peat loss and correspondence with a new Active Normalized Burn Ratio for wildfires, Geophys. Res. Lett., 44, 11851–11859, https://doi.org/10.1002/2017GL075488, 2017.
Chen, Y., Morton, D. C., and Randerson, J. T.: Remote sensing for wildfire monitoring: Insights into burned area, emissions, and fire dynamics, One Earth, 7, 1022–1028, https://doi.org/10.1016/j.oneear.2024.05.014, 2024.
Conrad-Rooney, E., Barker Plotkin, A., Pasquarella, V. J., Elkinton, J., Chandler, J. L., and Matthes, J. H.: Defoliation severity is positively related to soil solution nitrogen availability and negatively related to soil nitrogen concentrations following a multi-year invasive insect irruption, AoB PLANTS, 12, plaa059, https://doi.org/10.1093/aobpla/plaa059, 2020.
Cook, C. N., Nichols, S. J., Webb, J. A., Fuller, R. A., and Richards, R. M.: Simplifying the selection of evidence synthesis methods to inform environmental decisions: A guide for decision makers and scientists, Biol. Conserv., 213, 135–145, https://doi.org/10.1016/j.biocon.2017.07.004, 2017.
Dąbek, P. B., Żmuda, R., Szczepański, J., and Ćmielewski, B.: Evaluation of water soil erosion processes in forest areas in the Western Sudetes using terrestrial laser scanning and GIS tools, E3S Web of Conferences, 44, 00026, https://doi.org/10.1051/e3sconf/20184400026, 2018.
DeArmond, D., Ferraz, J. B. S., and Higuchi, N.: Natural recovery of skid trails: a review, Can. J. Forest Res., 51, 948–961, https://doi.org/10.1139/cjfr-2020-0419, 2021.
Delgado-Baquerizo, M., Eldridge, D. J., Liu, Y.-R., Liu, Z.-W., Coleine, C., and Trivedi, P.: Soil biodiversity and function under global change, PLoS Biol., 23, e3003093, https://doi.org/10.1371/journal.pbio.3003093, 2025.
Deligiannakis, G., Pallikarakis, A., Papanikolaou, I., Alexiou, S., and Reicherter, K.: Detecting and monitoring early post-fire sliding phenomena using UAV–SfM photogrammetry and t-LiDAR-derived point clouds, Fire, 4, 87, https://doi.org/10.3390/fire4040087, 2021.
DeVries, B., Verbesselt, J., Kooistra, L., and Herold, M.: Robust monitoring of small-scale forest disturbances in a tropical montane forest using Landsat time series, Remote Sens. Environ., 161, 107–121, https://doi.org/10.1016/j.rse.2015.02.012, 2015.
Dinerstein, E., Olson, D., Joshi, A., Vynne, C., Burgess, N. D., Wikramanayake, E., Hahn, N., Palminteri, S., Hedao, P., Noss, R., Hansen, M., Locke, H., Ellis, E. C., Jones, B., Barber, C. V., Hayes, R., Kormos, C., Martin, V., Crist, E., Sechrest, W., Price, L., Baillie, J. E. M., Weeden, D., Suckling, K., Davis, C., Sizer, N., Moore, R., Thau, D., Birch, T., Potapov, P., Turubanova, S., Tyukavina, A., De Souza, N., Pintea, L., Brito, J. C., Llewellyn, O. A., Miller, A. G., Patzelt, A., Ghazanfar, S. A., Timberlake, J., Klöser, H., Shennan-Farpón, Y., Kindt, R., Lillesø, J.-P. B., Van Breugel, P., Graudal, L., Voge, M., Al-Shammari, K. F., and Saleem, M.: An ecoregion-based approach to protecting half the terrestrial realm, BioScience 67, 534–545, https://doi.org/10.1093/biosci/bix014, 2017.
Doerr, S. H., Shakesby, R. A., Blake, W. H., Chafer, C. J., Humphreys, G. S., and Wallbrink, P.: Effects of differing wildfire severities on soil wettability and implications for hydrological response, J. Hydrol., 319, 295–311, https://doi.org/10.1016/j.jhydrol.2005.06.038, 2006.
Dubé, S. and Berch, S.: Monitoring soil disturbance on salvaged areas within the mountain pine beetle infestation using digital imagery, J. Appl. Remote Sens., 7, 073541, https://doi.org/10.1117/1.JRS.7.073541, 2013.
Dupuis, C., Lejeune, P., Michez, A., and Fayolle, A.: How Can Remote Sensing Help Monitor Tropical Moist Forest Degradation? – A Systematic Review, Remote Sens., 12, 1087, https://doi.org/10.3390/rs12071087, 2020.
Essbiti, M. C., Namous, M., Krimissa, S., Elaloui, A., Hajaj, S., Mosaid, H., Ismaili, M., Hajji, S., El Atiq, J., and El Kamouni, F. E.: Emerging trends and future directions in remote-sensing techniques and platforms for sustainable forest degradation monitoring: a review, Med. Geosc. Rev., 7, 953–976, https://doi.org/10.1007/s42990-025-00184-4, 2025.
FAO: Status of the World's Soil Resources 2025, Food and Agriculture Organization of the United Nations, Rome, Italy, https://openknowledge.fao.org/handle/20.500.14283/i5199e (last access: 8 September 2026), 2025
Fassnacht, F. E., White, J. C., Wulder, M. A., and Næsset, E.: Remote sensing in forestry: current challenges, considerations and directions. Forestry, 97, 11–37, https://doi.org/10.1093/forestry/cpad024, 2024.
Ferenčík, M., Dudáková, Z., Kardoš, M., Sivák, M., Merganičová, K., and Merganič, J.: Measuring soil surface changes after traffic of various wheeled skidders with close-range photogrammetry, Forests, 13, 976, https://doi.org/10.3390/f13070976, 2022.
Fernández, C., Fernández-Alonso, J. M., Vega, J. A., Fontúrbel, T., Llorens, R., and Sobrino, J. A.: Exploring the use of spectral indices to assess alterations in soil properties in pine stands affected by crown fire in Spain, Fire Ecol., 17, 2, https://doi.org/10.1186/s42408-020-00089-7, 2021.
Fernández-García, V., Santamarta, M., Fernández-Manso, A., Quintano, C., Marcos, E., and Calvo, L.: Burn severity metrics in fire-prone pine ecosystems along a climatic gradient using Landsat imagery, Remote Sens. Environ., 206, 205–217, https://doi.org/10.1016/j.rse.2017.12.029, 2018.
Fernández-Guisuraga, J. M., Marcos, E., Suárez-Seoane, S., and Calvo, L.: ALOS-2 L-band SAR backscatter data improves the estimation and temporal transferability of wildfire effects on soil properties under different post-fire vegetation responses, Sci. Total Environ., 842, 156852, https://doi.org/10.1016/j.scitotenv.2022.156852, 2022.
Flores-Anderson, A. I., Cardille, J., Azad, K., Cherrington, E., Zhang, Y., and Wilson, S.: Spatial and Temporal Availability of Cloud-free Optical Observations in the Tropics to Monitor Deforestation, Sci. Data, 10, 550, https://doi.org/10.1038/s41597-023-02439-x, 2023.
Fraser, R., Van Der Sluijs, J., and Hall, R.: Calibrating Satellite-Based Indices of Burn Severity from UAV-Derived Metrics of a Burned Boreal Forest in NWT, Canada, Remote Sensing, 9, 279, https://doi.org/10.3390/rs9030279, 2017.
French, N. H. F., Kasischke, E. S., Bourgeau-Chavez, L. L., and Harrell, P. A.: Sensitivity of ERS-1 SAR to variations in soil water in fire-disturbed boreal forest ecosystems, Int. J. Remote Sens., 17, 3037–3053, https://doi.org/10.1080/01431169608949126, 1996.
Gao, Y., Skutsch, M., Paneque-Gálvez, J., and Ghilardi, A.: Remote sensing of forest degradation: a review, Environ. Res. Lett., 15, 103001, https://doi.org/10.1088/1748-9326/abaad7, 2020.
Ge, Y., Thomasson, J. A., and Sui, R.: Remote sensing of soil properties in precision agriculture: A review, Front. Earth Sci., https://doi.org/10.1007/s11707-011-0175-0, 2011.
Giannetti, F., Chirici, G., Travaglini, D., Bottalico, F., Marchi, E., and Cambi, M.: Assessment of soil disturbance caused by forest operations by means of portable laser scanner and soil physical parameters, Soil Sci. Soc. Am. J., 81, 1577–1585, https://doi.org/10.2136/sssaj2017.02.0051, 2017.
Godziek, J.: Root plates of uprooted trees – Automatic detection and biotransport estimation using LiDAR data and field mapping, Int. J. Appl. Earth Obs., 131, 103992, https://doi.org/10.1016/j.jag.2024.103992, 2024.
Guilinger, J. J., Foufoula-Georgiou, E., Gray, A. B., Randerson, J. T., Smyth, P., Barth, N. C., and Goulden, M. L.: Predicting postfire sediment yields of small steep catchments using airborne lidar differencing, Geophys. Res. Lett., 50, e2023GL104626, https://doi.org/10.1029/2023GL104626, 2023.
Guindon, L., Gauthier, S., Manka, F., Parisien, M.-A., Whitman, E., Bernier, P., Beaudoin, A., Villemaire, P., and Skakun, R.: Trends in wildfire burn severity across Canada, 1985 to 2015, Can. J. Forest Res., 51, 1230–1244, https://doi.org/10.1139/cjfr-2020-0353, 2021.
Haas, J., Hagge Ellhöft, K., Schack-Kirchner, H., and Lang, F.: Using photogrammetry to assess rutting caused by a forwarder – A comparison of different tires and bogie tracks, Soil Till. Res., 163, 14–20, https://doi.org/10.1016/j.still.2016.04.008, 2016.
Haddaway, N., Macura, B., Whaley, P., and Pullin, A.: ROSES flow diagram for systematic maps, Version 1.0, figshare, https://doi.org/10.6084/M9.FIGSHARE.6085940, 2018.
Harzing, A. W.: Publish or perish, https://harzing.com/resources/publish-or-perish (last access: 26 February 2025), 2007.
Heppelmann, J. B., Talbot, B., Antón Fernández, C., and Astrup, R.: Depth-to-water maps as predictors of rut severity in fully mechanized harvesting operations, International Journal of Forest Engineering, 33, 108–118, https://doi.org/10.1080/14942119.2022.2044724, 2022.
Howari, F.: AI–Remote Sensing for Soil Variability Mapping and Precision Agrochemical Management: A Comprehensive Review of Methods, Limitations, and Climate-Smart Applications, Agrochemicals, 5, 1, https://doi.org/10.3390/agrochemicals5010001, 2025.
Hoy, E. E., French, N. H. F., Turetsky, M. R., Trigg, S. N., and Kasischke, E. S.: Evaluating the potential of Landsat TM/ETM+ imagery for assessing fire severity in Alaskan black spruce forests, Int. J. Wildland Fire, 17, 500–514, https://doi.org/10.1071/WF08107, 2008.
Hudak, A., Robichaud, P. R., Jain, T., Morgan, P., Stone, C., and Clark, J.: The relationship of field burn severity measures to satellite-derived Burned Area Reflectance Classification (BARC) maps, American Society of Photogrammetry and Remote Sensing Conference Proceedings, https://research.fs.usda.gov/treesearch/26195 (last access: 20 March 2025), 2004a.
Hudak, A. T., Robichaud, P. R., Evans, J. S., Clark, J., Lannom, K., Morgan, P., and Stone, C.: Field validation of Burned Area Reflectance Classification (BARC) products for post fire assessment, in: Remote Sensing for Field Users: Proceedings of the Tenth Forest Service Remote Sensing Applications Conference, edited by: Greer, J. D., Salt Lake City, Utah, 5–9 April 2004, American Society for Photogrammetry and Remote Sensing, Bethesda, Maryland, https://research.fs.usda.gov/treesearch/23530 (last access: 20 March 2025), 2004b.
Hudak, A. T., Morgan, P., Bobbitt, M. J., Smith, A. M. S., Lewis, S. A., Lentile, L. B., Robichaud, P. R., Clark, J. T., and McKinley, R. A.: The relationship of multispectral satellite imagery to immediate fire effects, Fire Ecol., 3, 64–90, https://doi.org/10.4996/fireecology.0301064, 2007.
Jordan, F., Paré, D., Norris, C., Webster, K., Dallaire, C., and Laganière, J.: Understanding Forest Soil Degradation in Canada: Threats, Indicators, and Knowledge Gaps, SSRN [preprint], https://doi.org/10.2139/ssrn.7265238, 31 July 2026.
Kadakci Koca, T.: A statistical approach to site-specific thresholding for burn severity maps using bi-temporal Landsat-8 images, Earth Sci. Inform., 16, 1313–1327, https://doi.org/10.1007/s12145-023-00980-2, 2023.
Kadakci Koca, T., Küçükuysal, C., Gül, M., and Esetlili, T.: A comprehensive approach to soil burn severity mapping for erosion susceptibility assessment, Catena, 245, 108302, https://doi.org/10.1016/j.catena.2024.108302, 2024.
Key, C. H. and Benson, N. C.: Landscape Assessment (LA), in: FIREMON: Fire effects monitoring and inventory system, edited by: Lutes, D. C., Keane, R. E., Caratti, J. F., Key, C. H., Benson, N. C., Sutherland, S., and Gangi, L. J., Gen. Tech. Rep. RMRS-GTR-164-CD, U.S. Department of Agriculture, Forest Service, Rocky Mountain Research Station, Fort Collins, CO, LA-1–LA-55, https://research.fs.usda.gov/treesearch/24066 (last access: 8 September 2026), 2006.
Kim, I., Seo, J., Woo, H., and Choi, B.: Assessing rutting and soil compaction caused by wood extraction using traditional and remote sensing methods, Forests, 16, 86, https://doi.org/10.3390/f16010086, 2025.
Kim, J., Kim, I., Ha, E., and Choi, B.: UAV photogrammetry for soil surface deformation detection in a timber harvesting area, South Korea, Forests, 14, 980, https://doi.org/10.3390/f14050980, 2023.
Kokaly, R. F., Rockwell, B. W., Haire, S. L., and King, T. V. V.: Characterization of post-fire surface cover, soils, and burn severity at the Cerro Grande Fire, New Mexico, using hyperspectral and multispectral remote sensing, Remote Sens. Environ., 106, 305–325, https://doi.org/10.1016/j.rse.2006.08.006, 2007.
Koren, M., Slančík, M., Suchomel, J., and Dubina, J.: Use of terrestrial laser scanning to evaluate the spatial distribution of soil disturbance by skidding operations, iForest, 8, 386–393, https://doi.org/10.3832/ifor1165-007, 2015.
Kubiak, K., Spiralski, M., Pompeu, J., Levavasseur, V., and Wawer, R.: Advances in Remote Sensing for Monitoring Soil Conditions in Forest Ecosystems: Techniques, Challenges, and Applications, Transactions on Aerospace Research, 2024, 1–13, https://doi.org/10.2478/tar-2024-0019, 2024.
Latterini, F., Venanzi, R., Tocci, D., Moschetti, F., and Picchio, R.: Comparing accuracy of three remote sensing methods to evaluate soil impact related to forest operations, in: The 1st International Electronic Conference on Forests; Forests for a Better Future: Sustainability, Innovation, Interdisciplinarity, International Electronic Conference on Forests, MDPI, p. 59, https://doi.org/10.3390/IECF2020-07954, 2020.
Latterini, F., Camarretta, N., and Watt, M. S.: Remote sensing for planning harvesting operations and monitoring their effects on the forest ecosystem: State of the art and future perspectives, Forest Ecol. Manage., 597, 123175, https://doi.org/10.1016/j.foreco.2025.123175, 2025.
Lausch, A., Erasmi, S., King, D., Magdon, P., and Heurich, M.: Understanding Forest Health with Remote Sensing – Part I – A Review of Spectral Traits, Processes and Remote-Sensing Characteristics, Remote Sens., 8, 1029, https://doi.org/10.3390/rs8121029, 2016.
Lee, K., Elliott, S., and Tiansawat, P.: Use of drone RGB imagery to quantify indicator variables of tropical-forest-ecosystem degradation and restoration, Forests, 14, 586, https://doi.org/10.3390/f14030586, 2023.
Lewis, S. A., Robichaud, P. R., Elliot, W. J., Frazier, B. E., and Wu, J. Q.: Hyperspectral remote sensing of postfire soil properties. In: Proceedings of the Tenth Biennial USDA Forest Service Remote Sensing Applications Conference, Salt Lake City, Utah, 5–9 April 2004, https://research.fs.usda.gov/treesearch/23527 (last access: 20 March 2025), 2004.
Lewis, S. A., Hudak, A. T., Ottmar, R. D., Robichaud, P. R., Lentile, L. B., Hood, S. M., Cronan, J. B., and Morgan, P.: Using hyperspectral imagery to estimate forest floor consumption from wildfire in boreal forests of Alaska, USA, Int. J. Wildland Fire, 20, 255, https://doi.org/10.1071/WF09081, 2011.
Lewis, S. A., Hudak, A. T., Robichaud, P. R., Morgan, P., Satterberg, K. L., Strand, E. K., Smith, A. M. S., Zamudio, J. A., and Lentile, L. B.: Indicators of burn severity at extended temporal scales: A decade of ecosystem response in mixed-conifer forests of western Montana, Int. J. Wildland Fire, 26, 755, https://doi.org/10.1071/WF17019, 2017.
Lewis, S. A., Robichaud, P. R., Archer, V. A., Hudak, A. T., Eitel, J. U. H., and Strand, E. K.: Informing sustainable forest management: Remote sensing strategies for assessing soil disturbance after wildfire and salvage logging, Forests, 14, 2218, https://doi.org/10.3390/f14112218, 2023.
Lewis, S. A., Robichaud, P. R., Hudak, A. T., Austin, B., and Liebermann, R. J.: Utility of remotely sensed imagery for assessing the impact of salvage logging after forest fires, Remote Sens., 4, 2112–2132, https://doi.org/10.3390/rs4072112, 2012.
Llorens, R., Sobrino, J. A., Fernández, C., Fernández-Alonso, J. M., and Vega, J. A.: Soil burn severity assessment using Sentinel-2 and radiometric measurements, Fire, 7, 487, https://doi.org/10.3390/fire7120487, 2024.
Mallinis, G., Maris, F., Kalinderis, I., and Koutsias, N.: Assessment of post-fire soil erosion risk in fire-affected watersheds using remote sensing and GIS, GISci. Remote Sens., 46, 388–410, https://doi.org/10.2747/1548-1603.46.4.388, 2009.
Marcos, E., Fernández-García, V., Fernández-Manso, A., Quintano, C., Valbuena, L., Tárrega, R., Luis-Calabuig, E., and Calvo, L.: Evaluation of Composite Burn Index and Land Surface Temperature for Assessing Soil Burn Severity in Mediterranean Fire-Prone Pine Ecosystems, Forests, 9, 494, https://doi.org/10.3390/f9080494, 2018.
Marquínez, J., Wozniak, E., Fernández, S., and Martínez, R.: Analysis of the evolution of soil erosion classes using multitemporal Landsat imagery, Int. J. Wildland Fire, 17, 549–558, https://doi.org/10.1071/WF06138, 2008.
Marra, E., Cambi, M., Fernandez-Lacruz, R., Giannetti, F., Marchi, E., and Nordfjell, T.: Photogrammetric estimation of wheel rut dimensions and soil compaction after increasing numbers of forwarder passes, Scand. J. Forest Res., 33, 613–620, https://doi.org/10.1080/02827581.2018.1427789, 2018.
Marra, E., Wictorsson, R., Bohlin, J., Marchi, E., and Nordfjell, T.: Remote measuring of the depth of wheel ruts in forest terrain using a drone, International Journal of Forest Engineering, 32, 224–234, https://doi.org/10.1080/14942119.2021.1916228, 2021.
Marra, E., Laschi, A., Fabiano, F., Foderi, C., Neri, F., Mastrolonardo, G., Nordfjell, T., and Marchi, E.: Impacts of wood extraction on soil: Assessing rutting and soil compaction caused by skidding and forwarding by means of traditional and innovative methods, Eur. J. Forest Res., 141, 71–86, https://doi.org/10.1007/s10342-021-01420-w, 2022.
Massicotte, P.: rnaturalearth: World Map Data from Natural Earth, R package, https://doi.org/10.32614/CRAN.package.rnaturalearth, 2025.
Maurya, S., Abraham, J. S., Somasundaram, S., Toteja, R., Gupta, R., and Makhija, S.: Indicators for assessment of soil quality: a mini-review, Environ. Monit. Assess., 192, 604, https://doi.org/10.1007/s10661-020-08556-z, 2020.
McNeil, B. E., de Beurs, K. M., Eshleman, K. N., Foster, J. R., and Townsend, P. A.: Maintenance of ecosystem nitrogen limitation by ephemeral forest disturbance: An assessment using MODIS, Hyperion, and Landsat ETM+, Geophys. Res. Lett., 34, L19406, https://doi.org/10.1029/2007GL031387, 2007.
Melaas, E. K., Sulla-Menashe, D., Gray, J. M., Black, T. A., Morin, T. H., Richardson, A. D., and Friedl, M. A.: Multisite analysis of land surface phenology in North American temperate and boreal deciduous forests from Landsat, Remote Sens. Environ., 186, 452–464, https://doi.org/10.1016/j.rse.2016.09.014, 2016.
Melander, L. and Ritala, R.: Time-of-flight imaging for assessing soil deformations and improving forestry vehicle tracking accuracy, International Journal of Forest Engineering, 29, 14–24, https://doi.org/10.1080/14942119.2018.1421341, 2018.
Melendy, L., Hagen, S. C., Sullivan, F. B., Pearson, T. R. H., Walker, S. M., Ellis, P., Kustiyo, K., Sambodo, A. K., Roswintiarti, O., Hanson, M. A., Klassen, A. W., Palace, M. W., Braswell, B. H., and Delgado, G. M.: Automated method for measuring the extent of selective logging damage with airborne LiDAR data, ISPRS J. Photogramm., 139, 228–240, https://doi.org/10.1016/j.isprsjprs.2018.02.022, 2018.
Mesa-Mingorance, J. L. and Ariza-López, F. J.: Accuracy Assessment of Digital Elevation Models (DEMs): A Critical Review of Practices of the Past Three Decades, Remote Sensing, 12, 2630, https://doi.org/10.3390/rs12162630, 2020.
Mohieddinne, H., Brasseur, B., Gallet-Moron, E., Lenoir, J., Spicher, F., Kobaissi, A., and Horen, H.: Assessment of soil compaction and rutting in managed forests through an airborne LiDAR technique, Land Degrad. Dev., 34, 1558–1569, https://doi.org/10.1002/ldr.4553, 2022.
Mohieddinne, H., Brasseur, B., Spicher, F., Gallet-Moron, E., Buridant, J., Kobaissi, A., and Horen, H.: Physical recovery of forest soil after compaction by heavy machines, revealed by penetration resistance over multiple decades, Forest Ecol. Manage., 449, 117472, https://doi.org/10.1016/j.foreco.2019.117472, 2019.
Moody, J. A., Shakesby, R. A., Robichaud, P. R., Cannon, S. H., and Martin, D. A.: Current research issues related to post-wildfire runoff and erosion processes, Earth-Sci. Rev., 122, 10–37, https://doi.org/10.1016/j.earscirev.2013.03.004, 2013.
Morgan, P., Keane, R. E., Dillon, G. K., Jain, T. B., Hudak, A. T., Karau, E. C., Sikkink, P. G., Holden, Z. A., and Strand, E. K.: Challenges of assessing fire and burn severity using field measures, remote sensing and modelling, Int. J. Wildland Fire, 23, 1045, https://doi.org/10.1071/WF13058, 2014.
NASA Earth Science Technology Office: ESTO annual report 2024, National Aeronautics and Space Administration, Washington, D.C., USA, https://esto.nasa.gov/2024-esto-annual-report/ (last access: 8 September 2026), 2024.
Nevalainen, P., Salmivaara, A., Ala-Ilomäki, J., Launiainen, S., Hiedanpää, J., Finér, L., Pahikkala, T., and Heikkonen, J.: Estimating the rut depth by UAV photogrammetry, Remote Sens., 9, 1279, https://doi.org/10.3390/rs9121279, 2017.
Niemi, M. T., Vastaranta, M., Vauhkonen, J., Melkas, T., and Holopainen, M.: Airborne LiDAR-derived elevation data in terrain trafficability mapping, Scand. J. Forest Res., 32, 762–773, https://doi.org/10.1080/02827581.2017.1296181, 2017.
Paré, D., Bognounou, F., Emilson, E. J. S., Laganière, J., Leach, J., Mansuy, N., Martineau, C., Norris, C., Venier, L., and Webster, K.: Connecting forest soil properties with ecosystem services: Toward a better use of digital soil maps – A review, Soil Sci. Soc. Am. J., 88, 981–999, https://doi.org/10.1002/saj2.20705, 2024.
Pastore, M. A., Lang, A. K., Shaw, J. D., Cahoon, S. M. P., Peter-Contesse, H., Owen, S. M., Morin, R. S., Knott, J. A., Domke, G. M., Esham, B., and Berryman, E. M.: Beneath the surface: A 25-year review of soil monitoring in the U.S. Forest Inventory and Analysis program, Forest Ecol. Manage., 595, 123023, https://doi.org/10.1016/j.foreco.2025.123023, 2025.
Pebesma, E.: Simple Features for R: Standardized Support for Spatial Vector Data, R J., 10, 439–446, 2018.
Pellegrini, A. F. A., Harden, J., Georgiou, K., Hemes, K. S., Malhotra, A., Nolan, C. J., and Jackson, R. B.: Fire effects on the persistence of soil organic matter and long-term carbon storage, Nat. Geosci., 15, 5–13, https://doi.org/10.1038/s41561-021-00867-1, 2021.
Perbet, P., Guindon, L., Côté, J.-F., and Béland, M.: Evaluating landsat time series of above-ground biomass to monitor boreal forest recovery following different types of disturbance, Can. J. Remote Sens., 51, 2587489, https://doi.org/10.1080/07038992.2025.2587489, 2025.
Pierzchała, M., Talbot, B., and Astrup, R.: Estimating soil displacement from timber extraction trails in steep terrain: Application of an unmanned aircraft for 3D modelling, Forests, 5, 1212–1223, https://doi.org/10.3390/f5061212, 2014.
Pierzchała, M., Talbot, B., and Astrup, R.: Measuring wheel ruts with close-range photogrammetry, Forestry, 89, 383–391, https://doi.org/10.1093/forestry/cpw009, 2016.
Pohjankukka, J., Riihimäki, H., Nevalainen, P., Pahikkala, T., Ala-Ilomäki, J., Hyvönen, E., Varjo, J., and Heikkonen, J.: Predictability of boreal forest soil bearing capacity by machine learning, J. Terramechanics, 68, 1–8, https://doi.org/10.1016/j.jterra.2016.09.001, 2016.
Puliti, S., Saarela, S., Gobakken, T., Ståhl, G., and Næsset, E.: Combining UAV and Sentinel-2 auxiliary data for forest growing stock volume estimation through hierarchical model-based inference, Remote Sens. Environ., 204, 485–497, https://doi.org/10.1016/j.rse.2017.10.007, 2018.
Pullin, A. S., Frampton, G. K., Livoreil, B., and Petrokofsky, G. (Eds.): Guidelines and Standards for Evidence Synthesis in Environmental Management, Version 5.1, Collaboration for Environmental Evidence, https://environmentalevidence.org/information-for-authors/ (last access: 8 September 2026), 2022.
Quintano, C., Fernández-Manso, A., Calvo, L., and Roberts, D. A.: Vegetation and Soil Fire Damage Analysis Based on Species Distribution Modeling Trained with Multispectral Satellite Data, Remote Sens., 11, 1832, https://doi.org/10.3390/rs11151832, 2019.
R Core Team: R: A Language and Environment for Statistical Computing, R Foundation for Statistical Computing, Vienna, Austria, https://www.R-project.org/ (last access: 8 September 2026), 2024.
Rengers, F. K., Tucker, G. E., Moody, J. A., and Ebel, B. A.: Illuminating wildfire erosion and deposition patterns with repeat terrestrial LiDAR, J. Geophys. Res.-Earth, 121, 588–608, https://doi.org/10.1002/2015JF003600, 2016.
Roach-Krajewski, M., Giroux-Bougard, X., Paré, D., Dallaire, C., Guindon, L., Jordan, F., Norris, C., Webster, K., and Laganière, J.: Post-Disturbance Soil Monitoring in Forests using Remote Sensing: An Evidence Map, Zenodo [code, data set], https://doi.org/10.5281/zenodo.19225706, 2026.
Robichaud, P. R., Lewis, S. A., Laes, D. Y. M., Hudak, A. T., Kokaly, R. F., and Zamudio, J. A.: Postfire soil burn severity mapping with hyperspectral image unmixing, Remote Sens. Environ., 108, 467–480, https://doi.org/10.1016/j.rse.2006.11.027, 2007.
Robichaud, P. R., Lewis, S. A., Brown, R. E., Bone, E. D., and Brooks, E. S.: Evaluating post-wildfire logging-slash cover treatment to reduce hillslope erosion after salvage logging using ground measurements and remote sensing, Hydrol. Process., 34, 4431–4445, https://doi.org/10.1002/hyp.13882, 2020.
Rogan, J. and Franklin, J.: Mapping wildfire burn severity in Southern California forests and shrublands using Enhanced Thematic Mapper imagery, Geocarto Int., 16, 91–106, https://doi.org/10.1080/10106040108542218, 2001.
Rose, M. B. and Nagle, N. N.: Characterizing Forest Dynamics with Landsat-Derived Phenology Curves, Remote Sens., 13, 267, https://doi.org/10.3390/rs13020267, 2021.
Salmivaara, A., Miettinen, M., Finér, L., Launiainen, S., Korpunen, H., Tuominen, S., Heikkonen, J., Nevalainen, P., Sirén, M., Ala-Ilomäki, J., and Uusitalo, J.: Wheel rut measurements by forest machine-mounted LiDAR sensors: Accuracy and potential for operational applications?, International Journal of Forest Engineering, 29, 41–52, https://doi.org/10.1080/14942119.2018.1419677, 2018.
Schoenholtz, S. H., Miegroet, H. V., and Burger, J. A.: A review of chemical and physical properties as indicators of forest soil quality: challenges and opportunities, Forest Ecol. Manage., 138, 335–356, https://doi.org/10.1016/S0378-1127(00)00423-0, 2000.
Sewell, P. D., Quideau, S. A., Dyck, M., and Macdonald, E.: Long-term effects of harvest on boreal forest soils in relation to a remote sensing-based soil moisture index, Forest Ecol. Manage., 462, 117986, https://doi.org/10.1016/j.foreco.2020.117986, 2020.
Shakesby, R. A., Chafer, C. J., Doerr, S. H., Blake, W. H., Wallbrink, P., Humphreys, G. S., and Harrington, B. A.: Fire severity, water repellency characteristics and hydrogeomorphological changes following the Christmas 2001 Sydney forest fires, Aust. Geogr., 34, 147–175, https://doi.org/10.1080/00049180301736, 2003.
Sikkink, P. G.: Comparison of six fire severity classification methods using Montana and Washington wildland fires, USDA Forest Service, Rocky Mountain Research Station, General Technical Report RMRS-GTR-337, Fort Collins, Colorado, https://research.fs.usda.gov/treesearch/49447 (last access: 20 March 2025), 2015.
Stray, B., Lamb, A., Kaushik, A., Vovrosh, J., Rodgers, A., Winch, J., Hayati, F., Boddice, D., Stabrawa, A., Niggebaum, A., Langlois, M., Lien, Y.-H., Lellouch, S., Roshanmanesh, S., Ridley, K., De Villiers, G., Brown, G., Cross, T., Tuckwell, G., Faramarzi, A., Metje, N., Bongs, K., and Holynski, M.: Quantum sensing for gravity cartography, Nature, 602, 590–594, https://doi.org/10.1038/s41586-021-04315-3, 2022.
Talbot, B. and Astrup, R.: A review of sensors, sensor-platforms and methods used in 3D modelling of soil displacement after timber harvesting, Croat. J. For. Eng. (Online), 42, 149–164, https://doi.org/10.5552/crojfe.2021.837, 2021.
Talbot, B., Rahlf, J., and Astrup, R.: An operational UAV-based approach for stand-level assessment of soil disturbance after forest harvesting, Scand. J. Forest Res., 33, 387–396, https://doi.org/10.1080/02827581.2017.1418421, 2018.
Tarun Kshatriya, T. and Thamizh Vendan, R.: Emerging Role of Hyperspectral Remote Sensing in Predictive Soil Health Monitoring Under Climate-Induced Stress Scenarios, Int. J. Environ. Clim. Change, 15, 170–178, https://doi.org/10.9734/ijecc/2025/v15i64881, 2025.
Udali, A., Talbot, B., Ackerman, S., Crous, J., and Grigolato, S.: Enhancing precision in quantification and spatial distribution of logging residues in plantation stands, Eur. J. Forest Res., 143, https://doi.org/10.1007/s10342-024-01699-5, 2024.
Venanzi, R., Latterini, F., Civitarese, V., and Picchio, R.: Recent applications of smart technologies for monitoring the sustainability of forest operations, Forests, 14, 1503, https://doi.org/10.3390/f14071503, 2023.
Veraverbeke, S., Dennison, P., Gitas, I., Hulley, G., Kalashnikova, O., Katagis, T., Kuai, L., Meng, R., Roberts, D., and Stavros, N.: Hyperspectral remote sensing of fire: State-of-the-art and future perspectives, Remote Sens. Environ., 216, 105–121, https://doi.org/10.1016/j.rse.2018.06.020, 2018.
Verbyla, D. and Lord, R.: Estimating post-fire organic soil depth in the Alaskan boreal forest using the Normalized Burn Ratio, Int. J. Remote Sens., 29, 3845–3853, https://doi.org/10.1080/01431160701802497, 2008.
Weiss, M., Jacob, F., and Duveiller, G.: Remote sensing for agricultural applications: A meta-review, Remote Sens. Environ., 236, 111402, https://doi.org/10.1016/j.rse.2019.111402, 2020.
White, J. C.: Characterizing forest recovery following stand-replacing disturbances in boreal forests: contributions of optical time series and airborne laser scanning data, Silva Fenn., 58, https://doi.org/10.14214/sf.23076, 2024.
White, J. C., Wulder, M. A., Hermosilla, T., Coops, N. C., and Hobart, G. W.: A nationwide annual characterization of 25 years of forest disturbance and recovery for Canada using Landsat time series, Remote Sens. Environ., 194, 303–321, https://doi.org/10.1016/j.rse.2017.03.035, 2017.
Whitman, E., Parisien, M.-A., Holsinger, L. M., Park, J., and Parks, S. A.: A method for creating a burn severity atlas: An example from Alberta, Canada, Int. J. Wildland Fire, 29, 995, https://doi.org/10.1071/WF19177, 2020.
Wickham, H.: stringr: Modern, consistent string processing, R J., 2, 51–55, https://journal.r-project.org/articles/RJ-2010-012/ (last access: 29 May 2025), 2010.
Wickham, H.: ggplot2: Elegant Graphics for Data Analysis, Springer-Verlag New York, ISBN 978-3-319-24277-4, https://ggplot2.tidyverse.org (last access: 8 October 2025), 2016.
Wickham, H.: forcats: Tools for Working with Categorical Variables (Factors), R package version 1.0.1, https://forcats.tidyverse.org/ (last access: 29 May 2025), 2025.
Wickham, H., Averick, M., Bryan, J., Chang, W., McGowan, L. D., François, R., Grolemund, G., Hayes, A., Henry, L., Hester, J., Kuhn, M., Pedersen, T. L., Miller, E., Bache, S. M., Müller, K., Ooms, J., Robinson, D., Seidel, D. P., Spinu, V., Takahashi, K., Vaughan, D., Wilke, C., Woo, K., and Yutani, H.: Welcome to the tidyverse, Journal of Open Source Software, 4, 1686, https://doi.org/10.21105/joss.01686, 2019.
Wickham, H., Pedersen, T., and Seidel, D.: scales: Scale Functions for Visualization, R package version 1.4.0, https://scales.r-lib.org (last access: 8 October 2025), 2025.
Yu, H., Kong, B., Wang, Q., Liu, X., and Liu, X.: Hyperspectral remote sensing applications in soil: a review, in: Hyperspectral Remote Sensing, Elsevier, 269–291, https://doi.org/10.1016/B978-0-08-102894-0.00011-5, 2020.