the Creative Commons Attribution 4.0 License.
the Creative Commons Attribution 4.0 License.
 | 13 May 2026
Estimating soil carbon sequestration potential with mid-IR spectroscopy and explainable machine learning
Yang Hu
Raphael A. Viscarra Rossel
Soil carbon sequestration refers to the process of capturing atmospheric carbon through plant photosynthesis and storing it in soil as organic carbon. The primary mechanism for carbon sequestration is the adsorption of organic carbon molecules onto the mineral surfaces of the soil's fine fraction (clay + silt ≤ 20 µm), forming mineral-associated organic carbon (MAOC). Soil has a finite capacity to stabilise and sequester organic carbon, known as carbon saturation capacity, which depends on the proportion of reactive minerals in the soil. The difference between the current MAOC content and the carbon saturation capacity is referred to as the organic carbon saturation deficit (Cdef) or sequestration potential. Fourier-transformed (FTIR) mid-infrared (mid-IR) spectroscopy can simultaneously measure soil properties relevant to carbon stabilisation: organic carbon functional groups, clay and iron-oxide mineralogy and particle size. Therefore, we hypothesise that mid-IR spectroscopy can effectively and accurately estimate Cdef. Here, we aim to (i) develop spectroscopic models to estimate the MAOC and Cdef of 482 Australian topsoil samples, (ii) model MAOC and Cdef using mid-IR spectra and an interpretable machine learning algorithm, and (iii) further interpret the MAOC and Cdef models using SHapley Additive exPlanations (SHAP). Using frontier line analysis, we fitted a function to the upper envelope of the MAOC vs. clay + silt relationship to derive Cdef. We recorded mid-IR spectra of the samples and used the regression trees method CUBIST to model MAOC content and Cdef. We interpreted these models by examining the regression trees and using SHAP. The models were unbiased and estimated MAOC content with R2 of 0.86 and RMSE of 2.77 (g kg soil−1), and Cdef with R2 of 0.89 and RMSE of 3.72 (g kg soil−1). Model interpretation showed that Cdef estimates relied on negative interactions with absorptions from organic matter functional groups and positive interactions with absorptions from clay minerals. Our results demonstrate that mid-IR spectra can effectively estimate MAOC and soil Cdef, providing a rapid, cost-effective method for assessing and monitoring this critical soil function.
- Article
(4275 KB) - Full-text XML
-
Supplement
(3317 KB) - BibTeX
- EndNote


Soil organic carbon (C) sequestration refers to the process by which plants capture atmospheric C through photosynthesis and store it in the soil. The United Nations Framework Convention on Climate Change (UNFCCC) has identified soil C sequestration as a critical, nature-based process for withdrawing atmospheric carbon dioxide (CO2) (UNFCCC, 2019). Soil organic C sequestration also improves soil health, food and nutritional security, water quality, biodiversity, and elemental recycling (Lal et al., 2015). Thus, it is crucial to estimate the amount of C stored in soil and how much it could store in the future to advance our scientific understanding of C cycling. This understanding will provide the foundation for land managers to develop practices that enhance C sequestration and for policymakers to formulate climate change adaptation strategies. However, rapidly, cost-effectively, and scientifically estimating the soil C saturation deficit remains challenging.
Soil C from plants begins as particulate organic C (POC). Over time, soil microorganisms consume this POC, and some of it is broken down into smaller molecules. Some of these molecules are protected from further decomposition through adsorption onto mineral particles, forming mineral-associated organic carbon (MAOC) and providing protection within soil microaggregates (Hassink and Whitmore, 1997; Six et al., 2002; Beare et al., 2014). Soils with higher silt and clay content have a larger mineral surface area and a greater capacity to adsorb and stabilise C. Hassink (1997) found a positive linear relationship between the proportion of clay and silt (particles <20 µm) and the amount of C in this fraction. This relationship has been used to estimate the soil's maximum capacity to stabilise C (Hassink, 1997), referred to as the C saturation capacity (Csat). The difference between actual MAOC content and Csat is known as the C saturation deficit (Cdef) or C sequestration potential.
Subsequent studies, such as Six et al. (2002), also found a direct relationship between MAOC and the amount of clay and silt in soil, further recognising that this relationship depends on the reactivity of the soil's clay minerals. Many researchers have since used such linear relationships to estimate Csat. Feng et al. (2013) found this approach underestimated Csat and proposed a boundary line method as an alternative, fitting a line to the upper tenth percentile of the data in the MAOC vs. clay and silt relationship. More recently, the relationship has been fitted using quantile regression at the 95th percentile of the data (Georgiou et al., 2022). However, these methods underestimate Csat by fitting through the data rather than capturing the maximum values. To address this shortcoming, Viscarra Rossel et al. (2024) proposed using a bootstrapped frontier lines analysis that fits an envelope to the maximum values of the relationship between MAOC and the soil's fine fraction, thereby preventing underestimation of the soil's C storage capacity and providing uncertainty estimates. Additionally, considering the maximum attainable C storage under a given environment (CAmax) approaches maximum asymptotically (Ingram and Fernandes, 2001; Viscarra Rossel et al., 2024), the frontier line approach better reflects CAmax by showing the asymptotic increase in soil C storage capacity with increasing soil clay and silt content (Viscarra Rossel et al., 2024).
Establishing reliable estimates of CAmax and Cdef using the methods above requires many soil samples with measured MAOC and clay-plus-silt content. Measuring MAOC involves fractionating soil to isolate the C in the ≤50 µm soil fraction and then measuring the organic C content (Poeplau et al., 2018). Fourier-transformed (FTIR) mid-infrared (mid-IR) spectroscopy offers a faster, more cost-effective, and repeatable alternative. It measures soil composition by capturing interactions between mid-IR wavelengths and the vibrations of bonds in soil molecules, providing data on a soil's organic and mineral composition (Viscarra Rossel et al., 2022). These spectra have been used to estimate organic and inorganic C, clay, sand and silt contents, cation exchange capacity and other chemical, physical and biological properties through calibration that relates the measured soil properties to their spectra (Soriano-Disla et al., 2014).
Mid-IR spectra serve as an integrative “molecular fingerprint” of the soil, reflecting its mineralogy, organic matter, and physical properties (Viscarra Rossel et al., 2006), which directly determine a soil's biological activity, soil structure and ultimately the ability to sequester C (Wiesmeier et al., 2019). Baldock et al. (2019) estimated the C saturation deficit (Cdef) of New Zealand soils using pedotransfer functions derived from the quantile regression approach, modelling Cdef with mid-IR spectra through partial least squares regression (PLSR), showing good predictability. Similarly, Karunaratne et al. (2024) estimated the Cdef of Australian soils using a quantile regression approach and modelled it with mid-IR spectra coupled with PLSR, also achieving good predictability. We did not find other research that estimates Cdef using soil spectra. We hypothesise that mid-IR spectra, combined with explainable machine learning, can be used to estimate soil MAOC content and Cdef while also providing insights into how the model uses spectral absorption features to identify the soil constituents important for prediction. Thus, we aimed to:
-
Develop spectroscopic models to estimate the MAOC content and the Cdef of Australian soils using mid-IR spectra with the regression trees algorithm CUBIST;
-
Interpret these models by analysing the CUBIST rulesets and SHapley Additive exPlanations (SHAP) values to understand how the absorptions of soil organic and inorganic constituents affected model prediction.
2.1 Soil samples
We used 488 topsoil samples from 275 sites across Australia (Fig. 1). The soils were sampled from three depth layers (0–10, 10–20 and 20–30 cm). All soil orders in the Australian soil classification were present, except Anthroposol and Organosol (Teng et al., 2018). Kandosols were the most abundant soil type, followed by Tenosols and Calcarosols, Chromosols and Vertosols, while Rudosols, Dermodols, Kurosols, Ferrosols, and Podosols were present in smaller numbers. Three Hydrosols were excluded from further analysis due to the distinct C storage mechanisms in anoxic soils (Six et al., 2024).
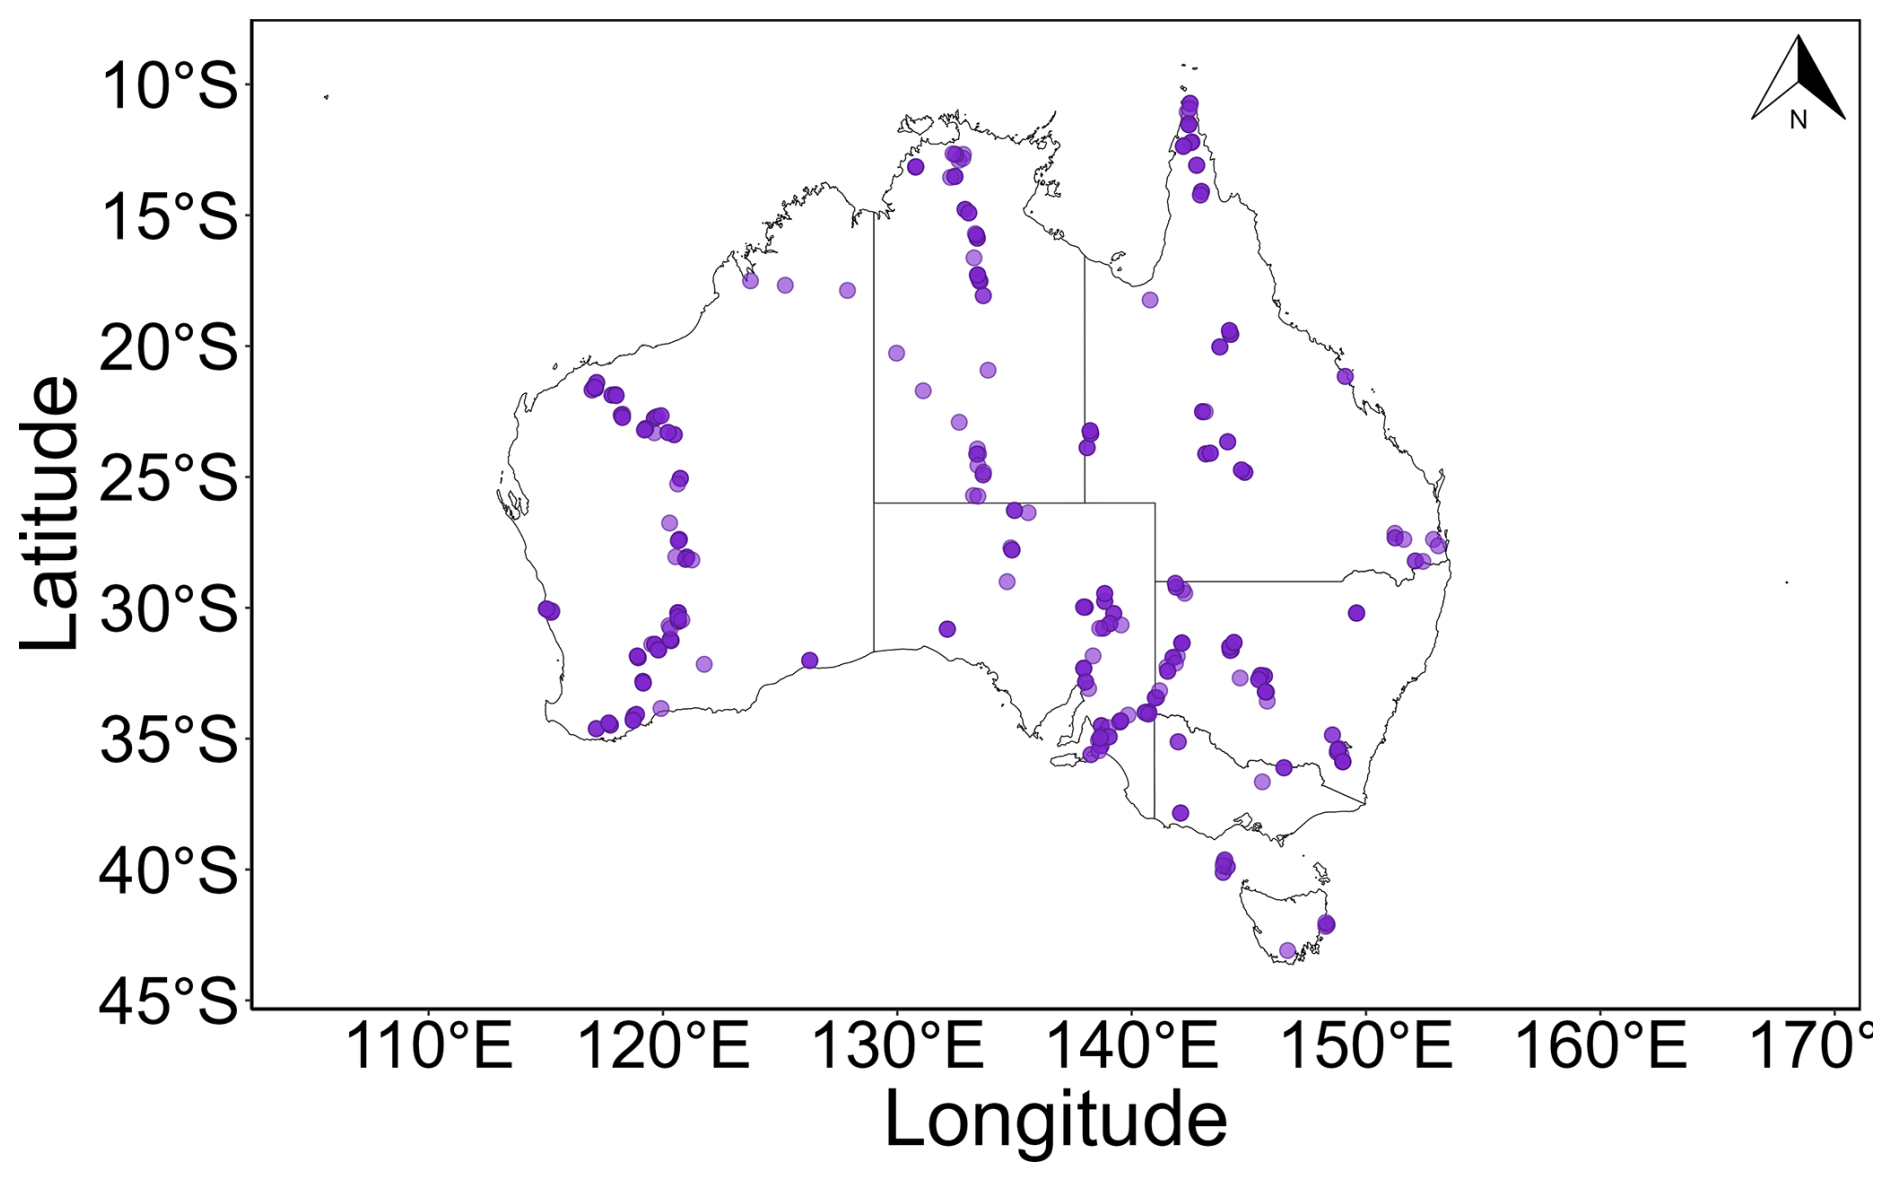
Figure 1Location of sampling points.
The sampling area spans the main Köppen-Geiger climate zones (Beck et al., 2018), with most of the samples collected from arid hot deserts, with smaller proportions from arid hot steppes and tropical savannahs. Samples were primarily collected from areas with minimal human impact, particularly nature conservation sites, native vegetation grazing lands, and other minimally used areas. Only a small proportion of samples came from production or intensive land use. The vegetation at the sampling sites was diverse, comprising 24 major vegetation groups, with eucalyptus woodlands being the most common (Commonwealth of Australia, 2020). Most samples were taken from native vegetation or natural bare land, with the rest from non-native vegetation or cleared land (ABARES, 2022).
2.2 Soil fractionation
Soil samples were fractionated through physical granulometric separation. The samples were dispersed in deionised water using an ultrasonic probe (Sonics VCX 500 Sonicator, Newtown, Connecticut) with an energy output of 500 J mL−1 for 200 s (Walden et al., 2025). After dispersion, the samples were fractionated using an automated wet sieving apparatus (Analysette 3 Pro, Fritsch GmbH, IdarOberstein, Germany) with 250 and 50 µm sieves. The resulting soils were in three size fractions: macroaggregates (2000–250 µm), microaggregates (250–50 µm), and the fine fraction (≤ 50 µm). The fractionated samples were then oven-dried at 60 °C overnight and ground to approximately ≤ 80 µm, before the organic C content of each size fraction was measured using an elemental analyser (SoliTOC Cube, Elementar Analysensysteme, Hanau, Germany). The organic C content of the fine fraction, representing MAOC, was recorded in grams per kilogram of whole soil.
2.3 mid-IR spectroscopy
The whole soils (sieved to ≤ 2 mm) were air-dried before fine grinding to µm. The mid-IR spectra of the finely ground samples were measured with a diffuse reflectance infrared Fourier transform (DRIFT) spectrometer (Bruker Invenio HTS-XT, Massachusetts, United States). Spectra were recorded from 4000–450 cm−1 with a spectral resolution of 4 cm−1 and measuring 64 scans per sample. The spectrometer was calibrated with a gold standard before measuring each sample plate with 23 samples (Bruker, Massachusetts, United States). Reflectance spectra were recorded in (apparent absorbance).
Silt + clay content
The silt and clay content of the whole soil was determined using mid-IR spectroscopic modelling with CUBIST (Hicks et al., 2015). The silt % model has an R2 value of 0.84 with a concordance of 0.92, and the clay % model has an R2 value of 0.90 with a concordance of 0.95. The estimated silt and clay content in % was combined for further analysis.
2.4 Frontier lines and calculation of Cdef
The MAOC content of samples displayed a log-normal distribution. We performed a loge transformation on the MAOC content and removed three outliers that were more than 1.5 times the interquartile range above Q3 or below Q1. We proceeded with the analysis of the remaining 482 samples from 270 sites.
We fitted a monotonically increasing and concave frontier line (Parmeter and Racine, 2013) to the relationship between log(MAOC) and clay + silt content of the samples using the smooth, non-parametric frontier line analysis with the R package SNFA (McKenzie, 2022). We calculated the CAmax and Cdef following the approach described in Viscarra Rossel et al. (2024). Each point on the frontier line represents the maximum attainable amount of MAOC that soil could store for a particular clay and silt content.
To estimate uncertainty, we performed 100 non-parametric bootstrap resamples to fit the frontier lines, keeping samples from the same site together during resampling to prevent data leakage. We then averaged all 100 frontier-line fits from the bootstraps. The Cdef was calculated as the difference between the estimated mean frontier line and the MAOC content. We also computed the uncertainties of our frontier line estimate by calculating the 95 % confidence limits. All values were then back-transformed to their original units for the spectroscopic modelling.
2.5 Spectroscopic modelling
The mid-IR spectra were interpolated to 32 cm−1 wavenumber intervals to reduce inherent collinearity. Since mid-IR spectra are highly collinear and contain broad absorption features, we interpolated the spectra to 32 cm−1 to reduce the redundant information passed into the machine learning model (Deiss et al., 2020). Visual checks confirmed relevant absorption features remained distinguishable at this resolution. We also checked Cdef model performance using spectra interpolated to 8, 16, 24, and 32 cm−1 resolutions and found no significant difference between these resolutions. Preprocessing consisted of an initial offset correction, in which the minimum spectral value minus 0.01 was subtracted from all measurements so that each spectrum was shifted to a common baseline just above zero, followed by a standard normal variate (SNV) transformation, and a final offset correction to address the baseline shift introduced by the SNV transformation. Spectral regions that were either featureless (4000 to 3746 cm−1) or containing distracting features from noise and artefacts from water and CO2 (2370 to 2082 cm−1) were removed before modelling.
We modelled the MAOC and the estimated Cdef with CUBIST. CUBIST is a rule-based regression tree algorithm (Quinlan, 1992; Wang and Witten, 1997). CUBIST creates a tree structure, with branches as a series of “if-then” conditions, then reduced into rules. Each CUBIST rule corresponds to a subset of the data that satisfies the rule's condition. For each rule, a linear regression model is fit to the data using relevant predictors (Kuhn et al., 2012). CUBIST balances accurate predictions and model interpretability through its rule-based structure. CUBIST is tuned by two parameters: committees and neighbours. The number of committees specifies the number of ensembles contributing to the final prediction, with more committees typically improving performance but reducing interpretability, and the number of neighbours specifies how many nearest-neighbours of a sample CUBIST uses to adjust its rule-based predictions. Viscarra Rossel and Webster (2012) described the method for spectroscopic modelling. In our experiments, since our goal was to understand which spectral regions influence predictions and how they relate to soil properties, we prioritised model interpretability by using a single committee to maintain model transparency, avoiding the added complexity of ensemble averaging. We optimised the number of neighbours by testing all values from 0 to 9. Model fitting and validation were carried out using 10-fold cross-validation grouped by site, in which the 270 sampling sites were randomly assigned to 10 folds to ensure that samples from the same site and the three depth layers were kept together within the same fold. We assessed the models based on their coefficient of determination (R2), Lin's concordance correlation coefficient (CCC) (Lin, 1989) and the root mean squared error (RMSE).
We propagated the uncertainty of the frontier line fitting and the CUBIST modelling. From the 100 frontier line fits made with the bootstraps, we derived the upper and lower 95 % confidence intervals (CI) for the frontier line fit and calculated the upper and lower limit of Cdef. The upper and lower limits of Cdef were also modelled with CUBIST following the same method described above.
2.6 Interpretation
To interpret the models, we extracted each CUBIST rule from the MAOC and Cdef models to analyse their rule partitioning. For the MAOC model, we examined the distribution of MAOC values within each rule, while for the Cdef model, we analysed the distributions of both MAOC and Cdef values within each rule. For the linear models in each CUBIST rule, we examined the wavenumber corresponding to specific absorptions of soil constituents and their coefficients. Furthermore, we calculated the SHAP (SHapley Additive exPlanations) values for each sample for each linear model of the CUBIST rules, focusing the analysis on the Cdef model. (SHAP analysis results of MAOC CUBIST model provided in the Supplement) The SHAP values are used to explain the outputs of machine learning models. SHAP is based on game theory (Shapley, 1953) and assigns an importance value to each instance at each feature (in our case, each sample's absorptions at specific wavenumbers) in a model. While the regression coefficients summarise the average effect of a wavenumber within a given rule, SHAP values provide instance-level attributions that quantify each wavenumber's contribution to the prediction for each individual sample. Positive SHAP values indicate a positive impact on the prediction, while those with negative values indicate a negative impact. The magnitude measures the strength of the effect.
All statistical analyses were performed using R (R Core Team, 2024).
3.1 The maximum attainable MAOC storage, the MAOC deficit and C sequestration potential
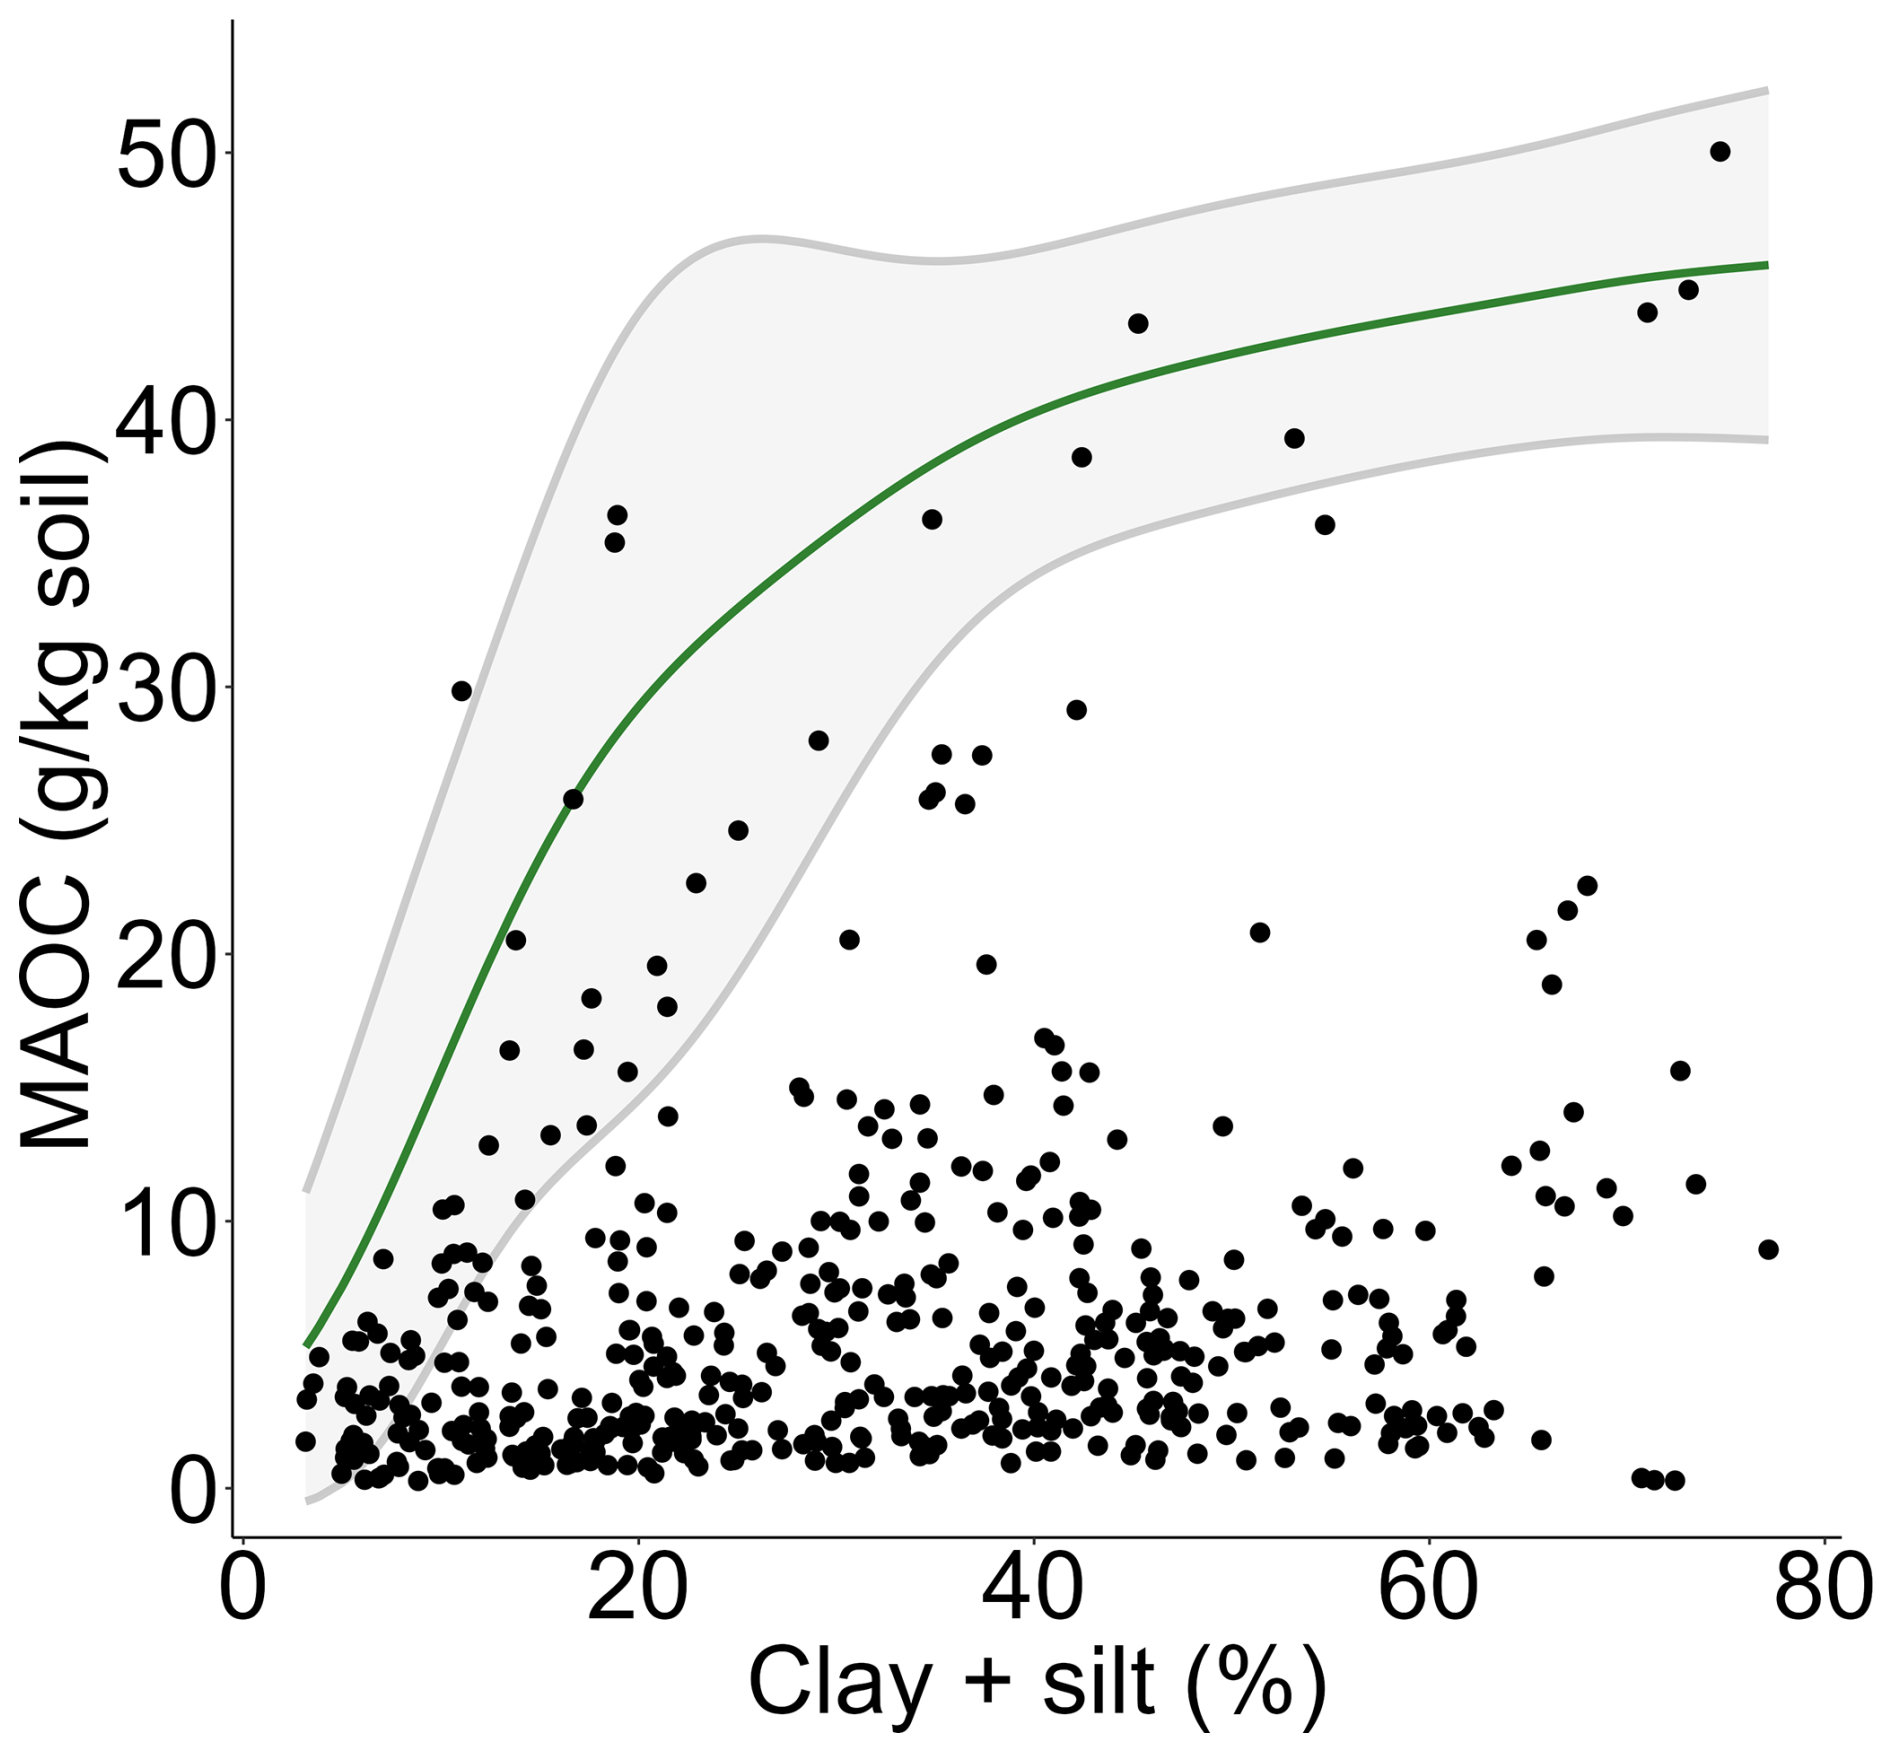
Our samples represent a wide geographical area in Australia (Fig. 1) with large variations in MAOC content and texture (Table 1). The MAOC content ranges from 0.27 to 50.04 g kg soil−1, while silt content ranges from 0.54 % to 31.81 %, and clay content ranges from 2.34 % to 54.25 % (Table 1). The frontier line estimates the maximum C that can be stored in their current environments over their range of clay + silt contents for all 482 samples, with their 95 % confidence intervals shown in Fig. 2. The frontier line increases with increasing clay + silt content to around 20 %–45 %, after which the rate of increase slows. The CAmax ranges from 5.29 to 45.79 g kg soil−1 with a mean of 32.76 g kg soil−1 (Table 1). The Cdef ranges from none to 45.17 g kg soil−1 with a mean of 26.31 g kg soil−1 (Table 1).
Table 1Summary statistics.
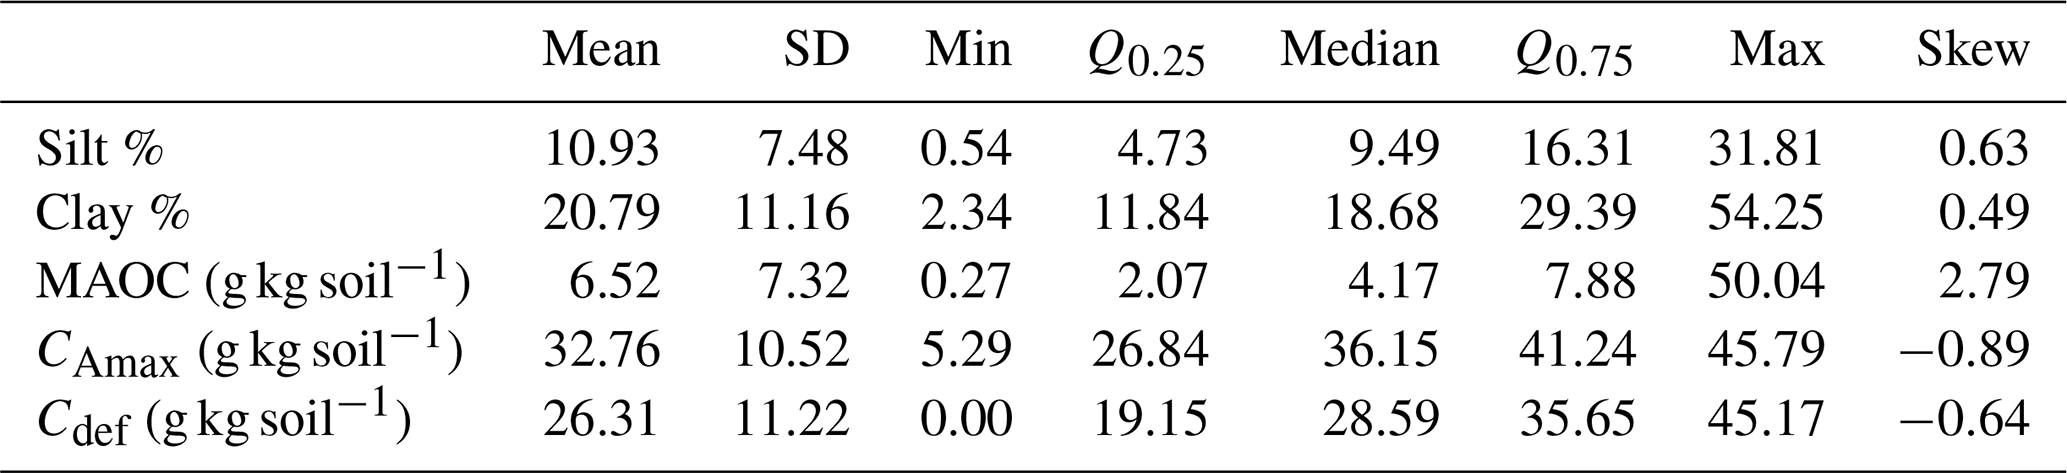
Note: SD = Standard Deviation, Min = Minimum, Q0.25 = Lower 25 % quartiles, Med = Median, Q0.75 = Upper 25 % quartiles, Max = Maximum, Skew = Skewness.
3.2 Spectroscopic modelling of MAOC content
The CUBIST model predicts MAOC with an RMSE of 2.77 g kg soil−1, is unbiased with R2 of 0.86, and CCC of 0.91 (Table 2, Fig. 3 b). The model partitions the data into four rule sets, corresponding to different MAOC content levels, which increase from Rule 1 to Rule 4 (Fig. 3a). Samples in Rule 1 have the least MAOC and are not significantly different from Rule 2 (Fig. 3a). Rule 3 samples have significantly more MAOC than Rule 1 but are not significantly different from Rule 2 (Fig. 3a). Rule 4 samples have significantly more MAOC than all other rules and exhibit the largest spread (Fig. 3a).
Table 2Tuning parameters and model statistics for MAOC and Cdef CUBIST models.
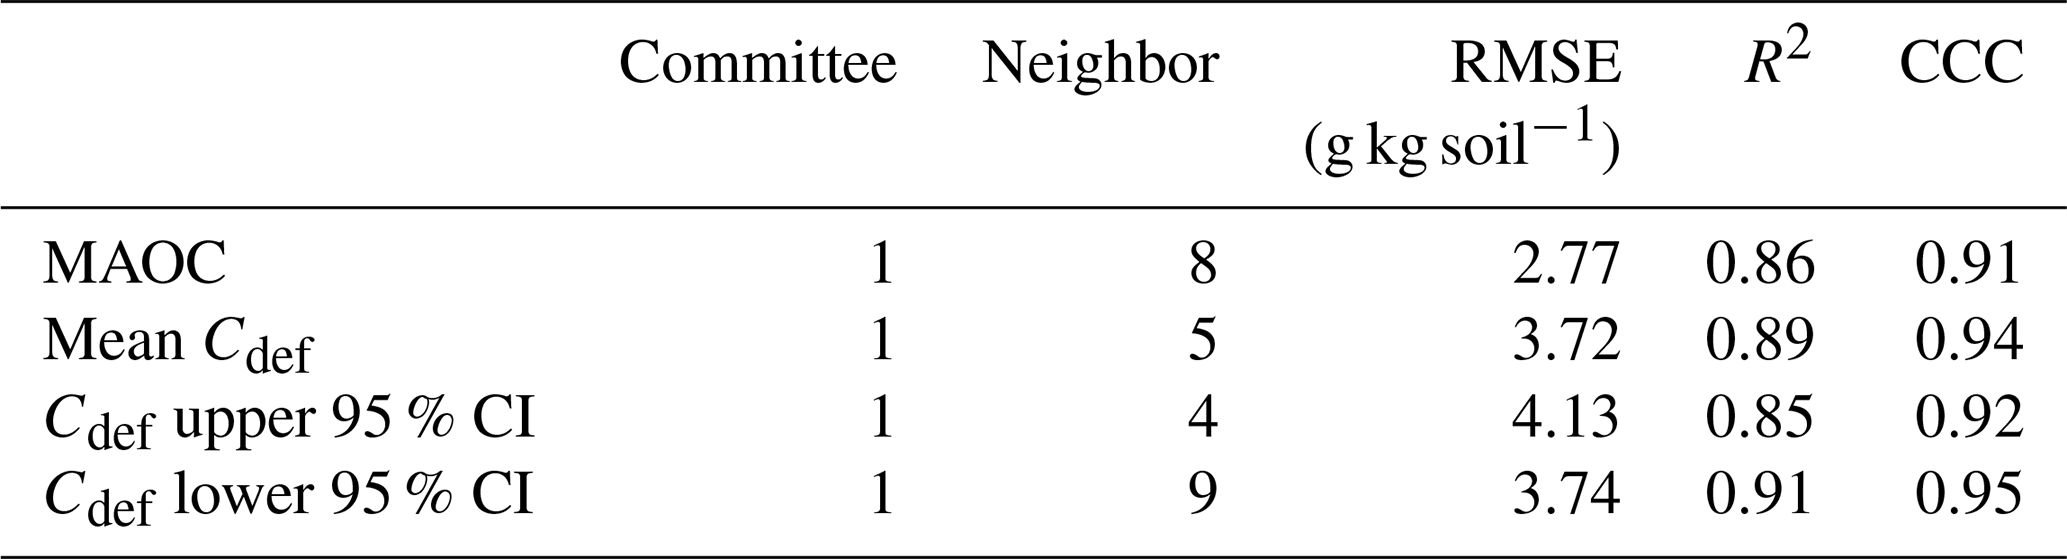
Note: RMSE = Root mean square error, CCC = Lin's concordance correlation coefficient, CI = Confidence interval.
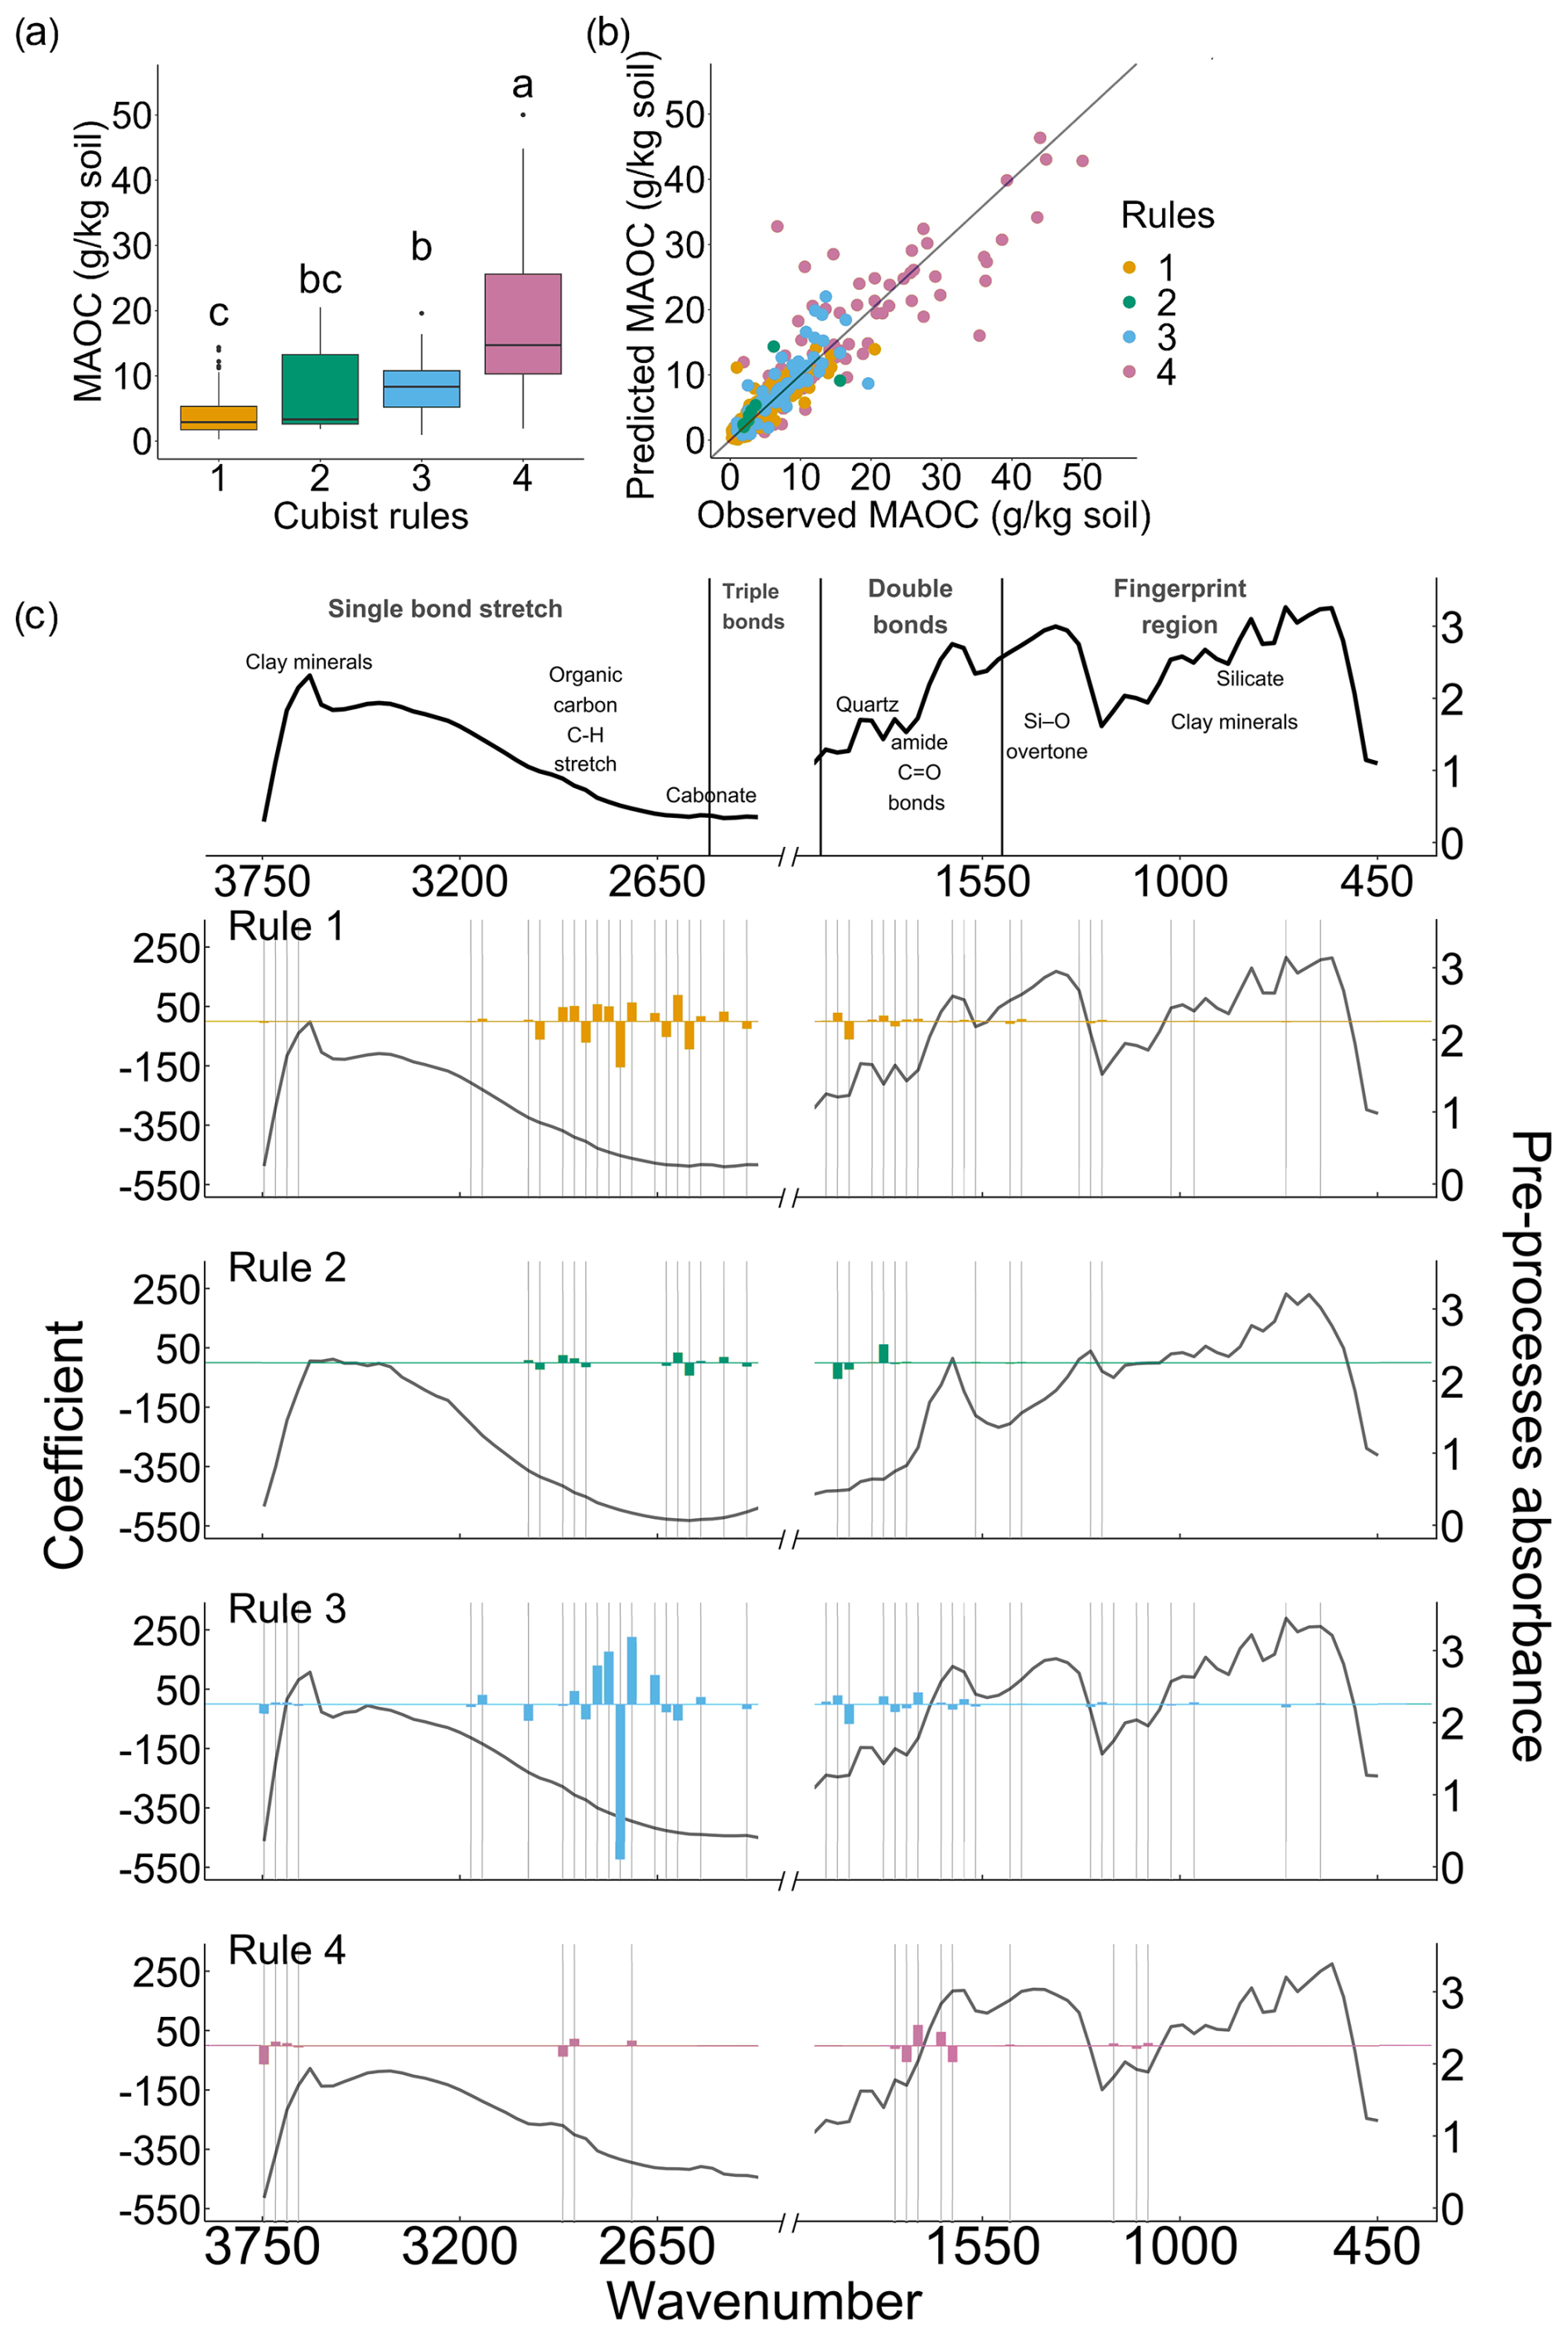
Figure 3CUBIST model result for MAOC. (a) The distribution of MAOC content for each CUBIST rule and Tukey's HSD between each CUBIST rule. (b) The correlation between observed and predicted MAOC of the CUBIST model, coloured by CUBIST rules. (c) The coefficient of each linear model for each CUBIST rule is plotted over the mean spectra of each CUBIST rule.
The mean mid-IR spectra of the samples of the four rule sets show overall consistent patterns, with differences in absorption intensities at 3700–3500, 2946–2850, 1986–1794, and 1634–1300 cm−1) (Fig. 3c).
Specifically, the mean spectrum of Rule 4 has the highest absorption in the 2946–2850 cm−1 region associated with organic C (C–H vibrations of alkyl CH2), corresponding to having the highest MAOC content (Fig. 3a, c).
The wavenumbers selected for linear models of the four rules differ, although there is some overlap. All rules use wavenumbers between 2946–2850 cm−1, organic C–H vibrations of alkyl CH2 groups (Nguyen et al., 1991), though the specific selections vary (Fig. 3c), suggesting that the models rely directly on spectral signals from organic C to predict MAOC content. Rule 1 exhibits densely distributed wavenumbers across both these regions with high coefficient values. Rule 3 shows a similarly dense distribution, concentrated primarily in the 2946–2850 cm−1 region, with the largest coefficient values. Rule 2 displays more sparsely distributed wavenumbers across both regions, while Rule 4 uses only a few select wavenumbers around 2946–2850 cm−1.
Rules 1, 2, and 3 with the smallest MAOC values all use the region between 1986–1794 cm−1, associated with quartz, whereas Rule 4 does not (Fig. 3c). Quartz is chemically inert, carries negligible surface charge, and has a low specific surface area compared to clay minerals, which limits the reactive surface area available for organo-mineral bonding and thus associated with low MAOC content, as found in coarser-textured soils dominated by quartz. Rules 1, 2, and 3 also use region 2515 cm−1 associated with carbonate (Nguyen et al., 1991), as soils with more carbonate commonly form in arid or semi-arid regions with low plant productivity and rainfall, and therefore low organic C.
Rule 4 uniquely includes absorptions at the 3750 cm−1 region, associated with the hydroxyl stretching vibrations of clay minerals (Nguyen et al., 1991). Clay minerals provide a more mineralogically reactive soil matrix that facilitates greater organo-mineral bonding, and the model's use of spectral signals reflecting mineral surface reactivity is particularly informative in soils where mineral-organic associations are most developed. Rule 4 also uses wavenumbers between 1762–1634 cm−1, associated with amide C=O bond (Volkov et al., 2021), as well as wavenumbers around 1154 cm−1, which correspond to the SiO2 lattice (Spitzer and Kleinman, 1961) and C-OH stretch of aliphatic O–H (Senesi et al., 2003) (Fig. 3c), with Rule 3 also using these latter wavenumbers to a lesser extent. SiO2 lattice indicating the silicate mineral of the soil matrix, while aliphatic C-OH groups indicate polysaccharide-derived and carbohydrate-like organic matter, and amide indicates protein-derived organic matter. Taken together, this suggests that the model draws on both organic-matter and mineral-related absorptions to estimate MAOC content.
3.3 Spectroscopic modelling of the organic C deficit (Cdef)
The model predicts Cdef with an RMSE of 3.72 g kg soil−1, R2 of 0.89, and CCC of 0.94 while also being unbiased (Table 2, Fig. 4c). The model partitions the data into 3 rule sets, and the linear models of each CUBIST rule also show good precision (Table 3).
Table 3Model statistics for each linear model of the CUBIST rules in the mean Cdef CUBIST model.
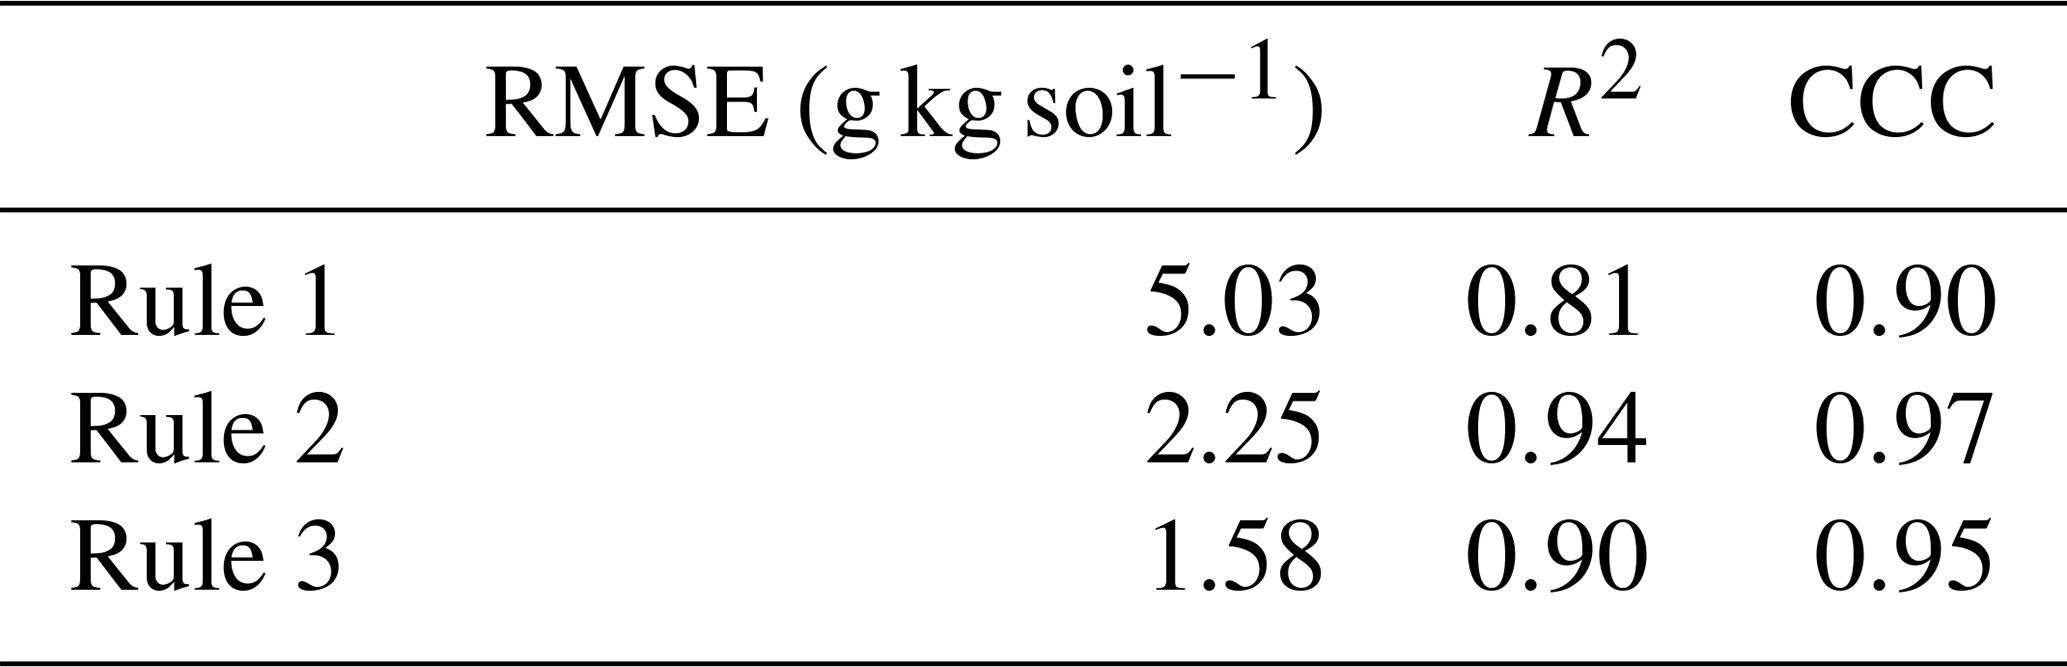
Note: RMSE = Root mean square error, CCC = Lin's concordance correlation coefficient.
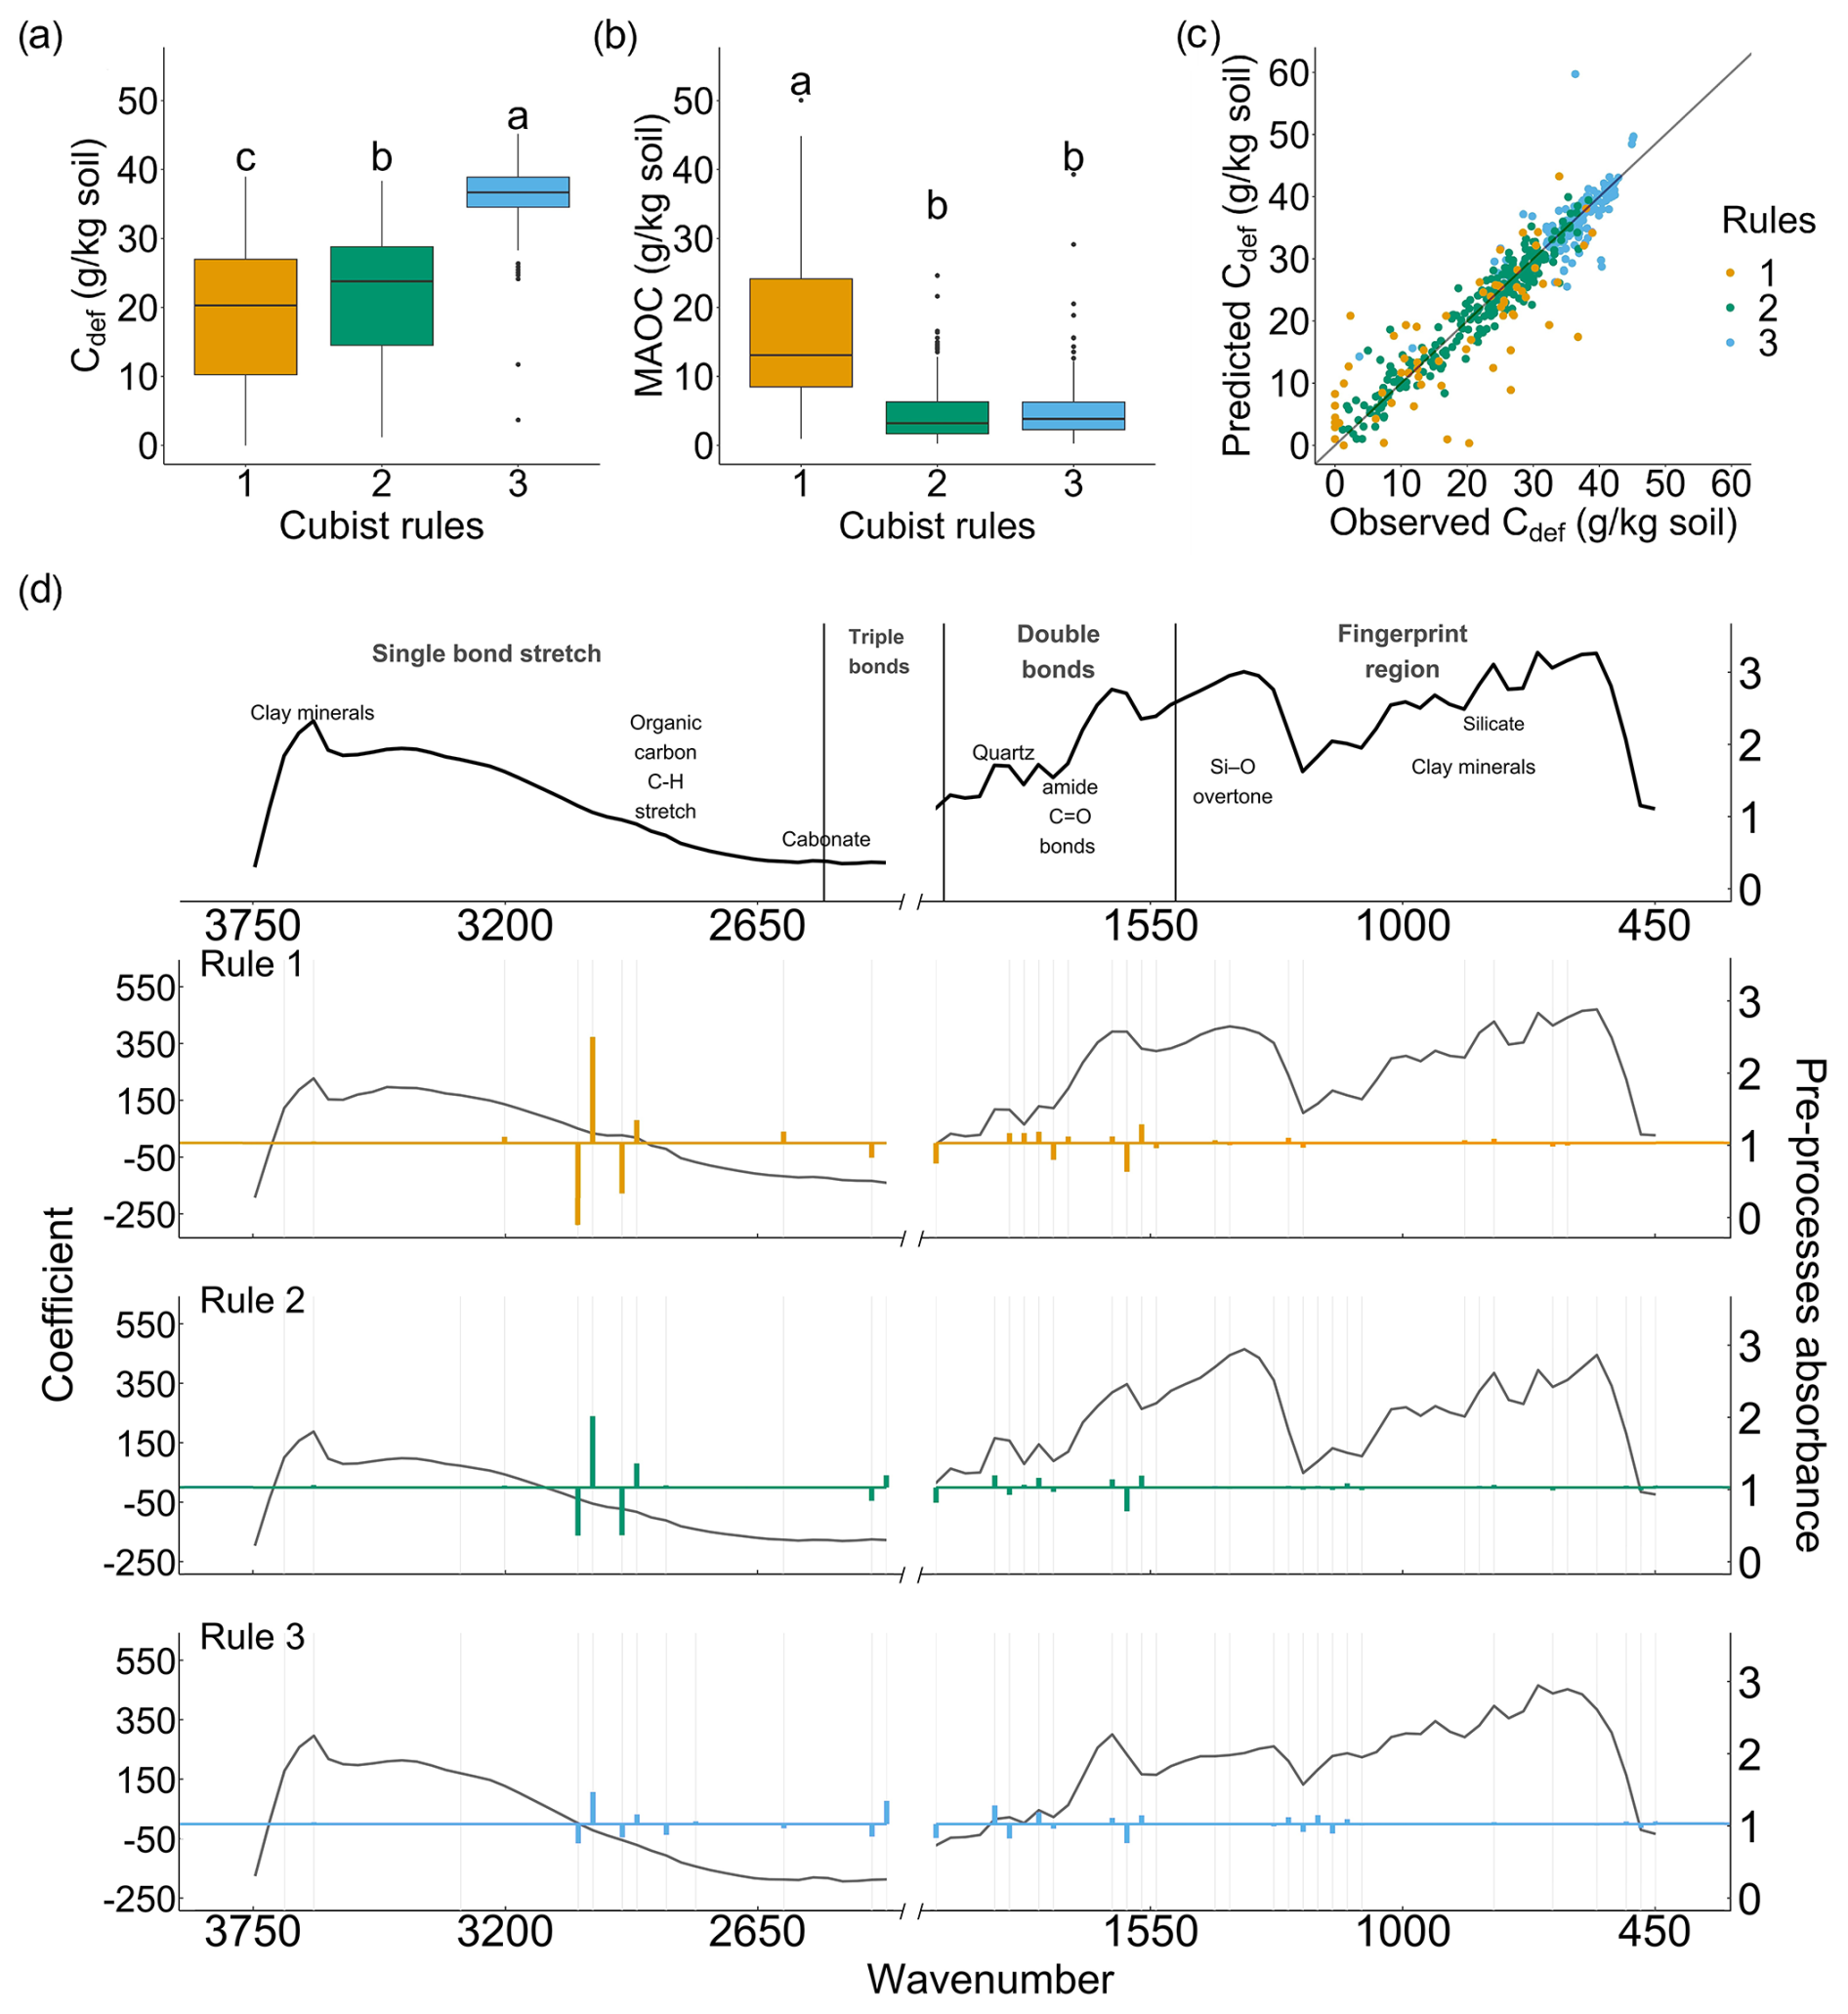
Figure 4CUBIST model result for Cdef, showing the CUBIST rules separation, including the distribution of (a) Cdef and (b) MAOC content for each CUBIST rule and Tukey's HSD between each CUBIST rule. Along with (c) the correlation between observed and predicted Cdef of the CUBIST model coloured by CUBIST rules, and (d) the coefficient of each linear model for each CUBIST rule plotted over the mean spectra of each CUBIST rule.
Rule 1 includes samples with the lowest Cdef and the highest MAOC content, representing samples that have smaller C sequestration potential, as these samples contain more MAOC (Fig. 4a, b). Rule 2 represents samples with intermediate Cdef, and contains little MAOC and clay and silt content, representing coarser-textured soils with more C sequestration potential than samples in Rule 1 because they hold less MAOC (Fig. 4a, b). Rule 3 includes samples with high Cdef, low MAOC content and the most clay and silt content. Since these samples contain the finest particles, their capacity is largest and is thus undersaturated with C relative to their potential (Fig. 4a, b).
The three rule sets show similar overall mean spectral patterns but with distinct differences in absorption intensities at key regions, including 2946–2850 cm−1 associated with organic C, 1986–1794 cm−1 associated with SiO2 overtone and combination bands, and 1538–1218 cm−1) region associated with various organic and mineral absorptions (Fig. 4d). The wavenumbers selected for the models in each CUBIST rule are generally consistent, with the magnitude of the coefficient decreasing from Rule 1 to Rule 3 (Fig. 4d).
In the 2946–2850 cm−1 region, associated with organic C–H vibrations of alkyl CH2 groups (Nguyen et al., 1991), Rule 1 shows greater average absorption compared to Rule 2 and Rule 3 consistent with Rule 1 having the highest MAOC content (Fig. 4b, d). All three CUBIST rules use wavenumbers within and near this region with relatively large coefficients, but the coefficient magnitude decreases from Rule 1 to Rule 3 (Fig. 4b, d). This pattern reflects that the model predicts Cdef by leveraging the spectral signal of existing organic C (MAOC) already occupying reactive mineral surfaces. As Cdef represents the remaining sequestration potential, more existing MAOC implies less remaining capacity. Thus, Rule 1 with the highest MAOC and largest organic-region coefficient has the lowest Cdef. Rule 2 has intermediate MAOC and coefficient magnitude, and Rule 3 has the lowest MAOC, smallest coefficient, and consequently the highest Cdef (Fig. 4a, b, d).
In the region near 1986–1794 cm−1, which is due to the overtones of Si-O vibrations (Volkov et al., 2021), absorption intensity decreases from Rule 2 to Rule 1 to Rule 3, corresponding to decreasing sand content and increasing clay and silt content (Fig. 4d).
All three rules have prominent absorption at and near 1634 cm−1, which are associated with amide, carboxylate and carboxylic acid (Nguyen et al., 1991; Tanykova et al., 2021), aromatic –C=C– stretch (Du et al., 2014), HO–H stretch (Kronenberg, 1994), N–H bend, C=O stretch (Volkov et al., 2021) and absorbed water (Max and Chapados, 2009) (Fig. 4d). This indicates that organic matter types, including polysaccharide-derived, carbohydrate-like, and protein-derived organic C, are used across all three rules similarly to the 2946–2850 cm−1 region, to predict whether the C saturation capacity is filled.
In the fingerprint region (1550–450 cm−1), the band assignments are more challenging due to significant overlaps between mineral and organic absorptions (Soriano-Disla et al., 2014). The region from 1538 to 1218 cm−1, likely associated with quartz minerals as well as organic matter (Volkov et al., 2021), is more prominent in Rule 2 and Rule 1, and lower in Rule 3 (Fig. 4d). Rule 3 exhibits proportionally larger coefficients for wavenumbers in the fingerprint region because of low organic C content and high fine mineral particle content (Fig. 4b, d).
The absorption near 2515 cm−1 due to carbonates shows more prominent absorption in Rule 3. Where Cdef is high, and MAOC is low, which matches the tendency of higher carbonate soils from arid or semi-arid regions with low organic C input that leave mineral surfaces unsaturated.
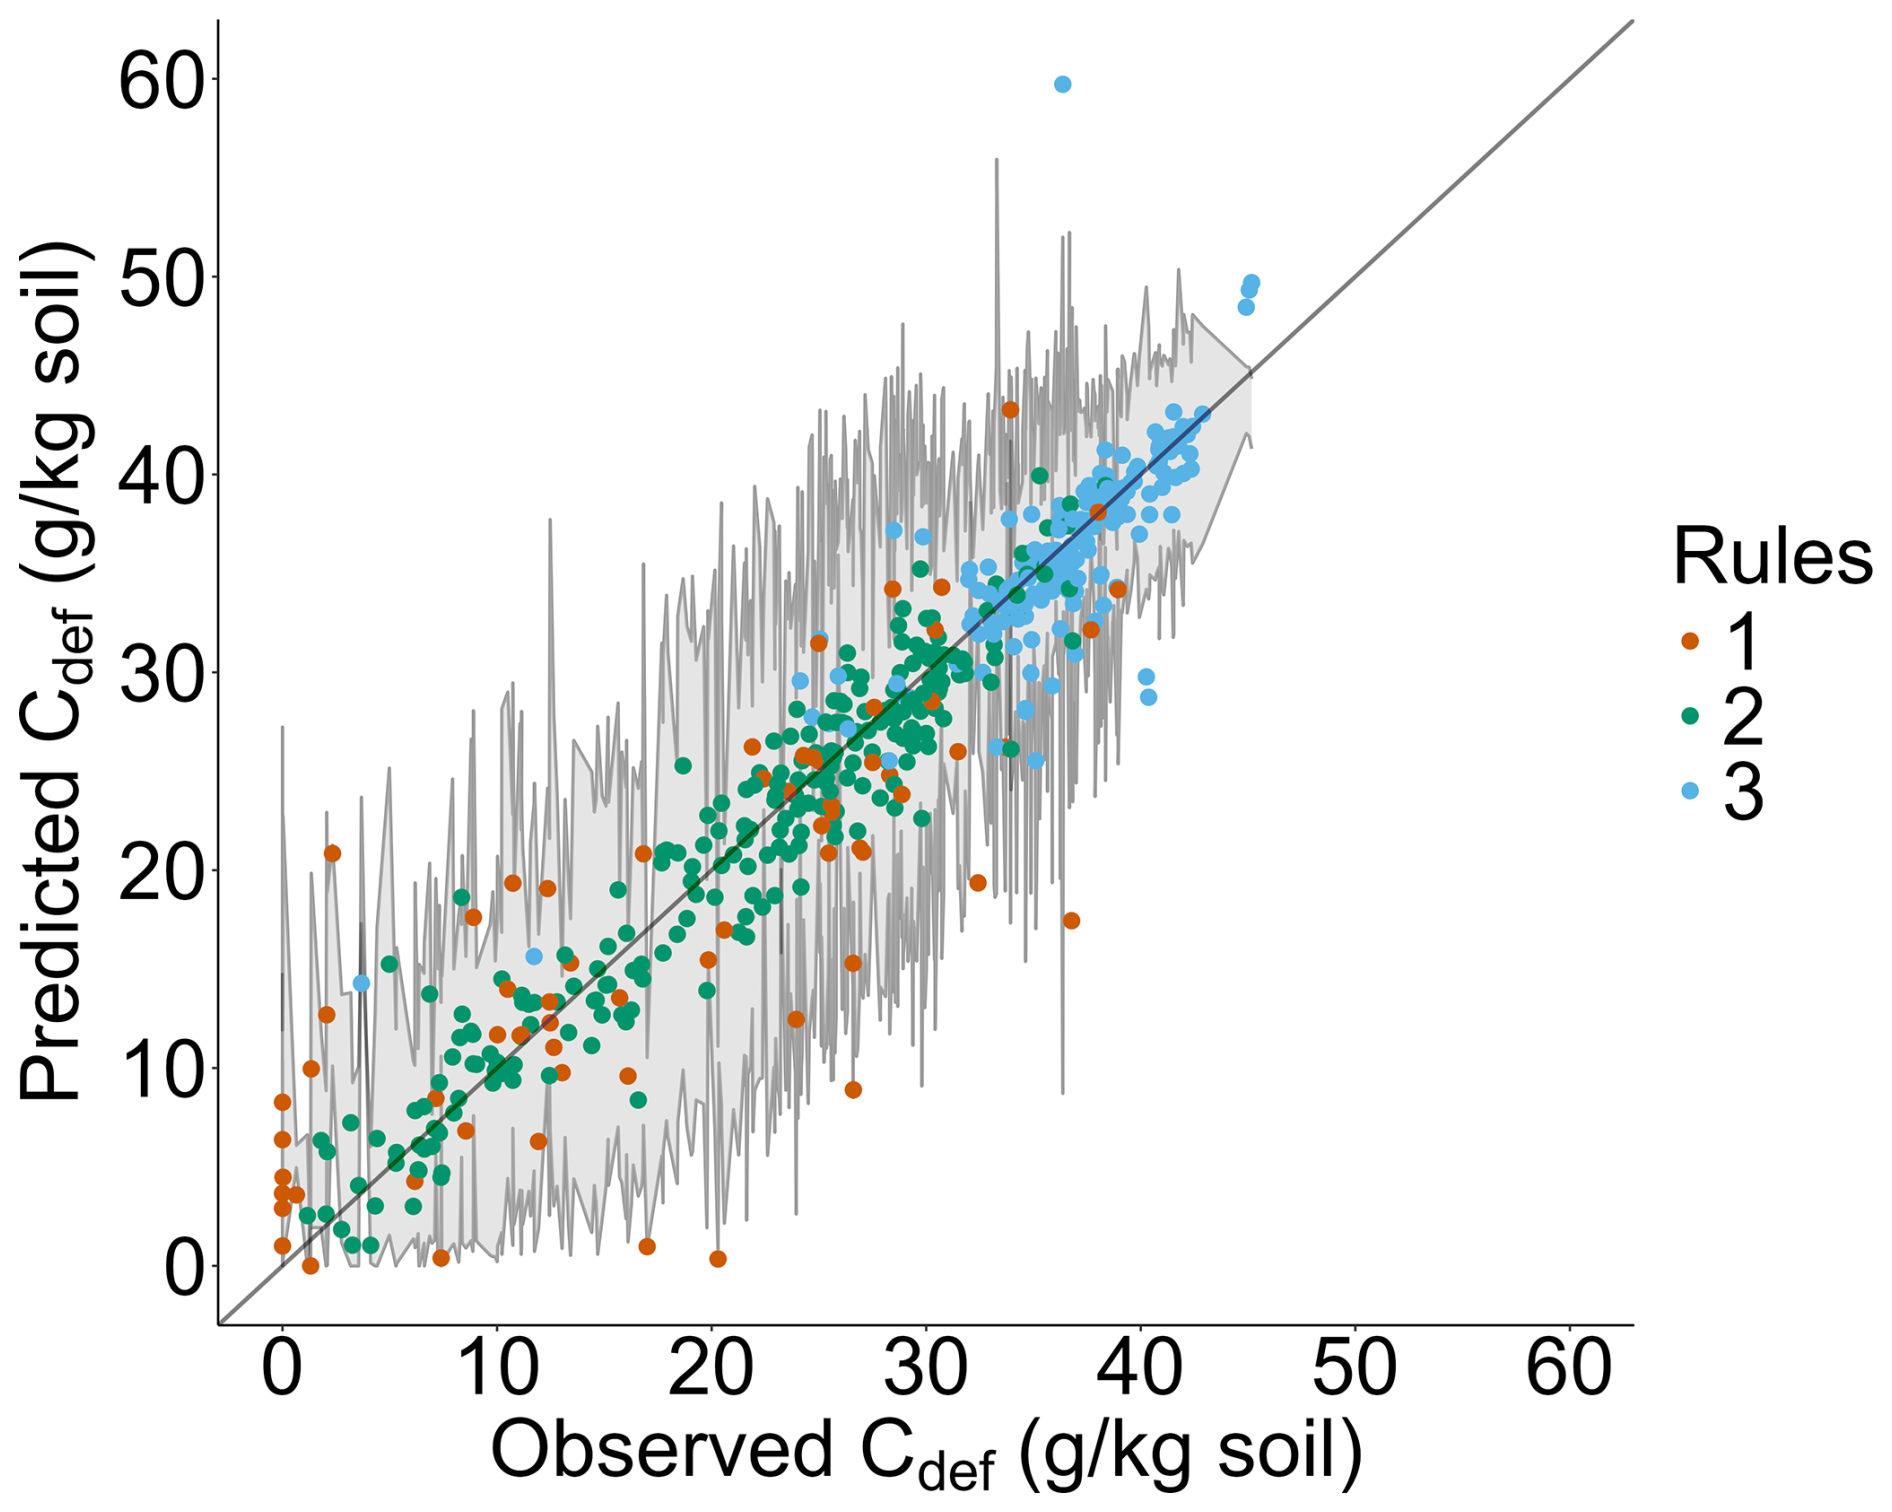
Figure 5The correlation between observed and predicted Cdef of the CUBIST model coloured by CUBIST rules, as well as the observed and predicted Cdef estimated from the upper 95 % CI and lower 95 % CI of the frontier line fit. The grey envelopes represent the range of Cdef predictions obtained when CUBIST is applied separately to the upper and lower 95 % CI frontier-line estimates, indicating the uncertainty of the frontier-line fit propagating to the Cdef predictions.
The model statistics of the CUBIST models of Cdef estimated from the upper and lower 95 % CI of CAmax are shown in Table 2. The model for the Cdef estimated with the lower 95 % CI of the frontier line performs better than the model estimated with the upper 95 % CI. This can be attributed to the upper 95 % CI of the frontier line being more uncertain than the lower 95 % CI. Specifically, the upper uncertainty of the frontier line fit is high around 25 % clay + silt content due to the low sample number (Fig. 2). The uncertainty of Cdef estimated from CUBIST models of Cdef calculated from the upper CI and lower CI of the CAmax is shown in Fig. 5.
3.4 Cdef model interpretation with SHAP
The SHAP contribution of spectral absorption at each wavenumber for the linear model of each CUBIST rule is shown in Fig. 6. The SHAP values coincide with the regression coefficients of the CUBIST rules (Fig. 6). The regression coefficients and SHAP values are generally consistent: large coefficients correspond to strong SHAP model contributions. Rule 1 shows strong contributions primarily from organic C features, and Rule 2 displays a similar pattern but with more contributions from the fingerprint region. For Rule 3, there is a relatively stronger contribution from the absorptions in the double bonds region (including absorption from quartz and the region associated with amide overlapping with other absorptions), and the fingerprint regions have a relatively stronger contribution (Fig. 6).
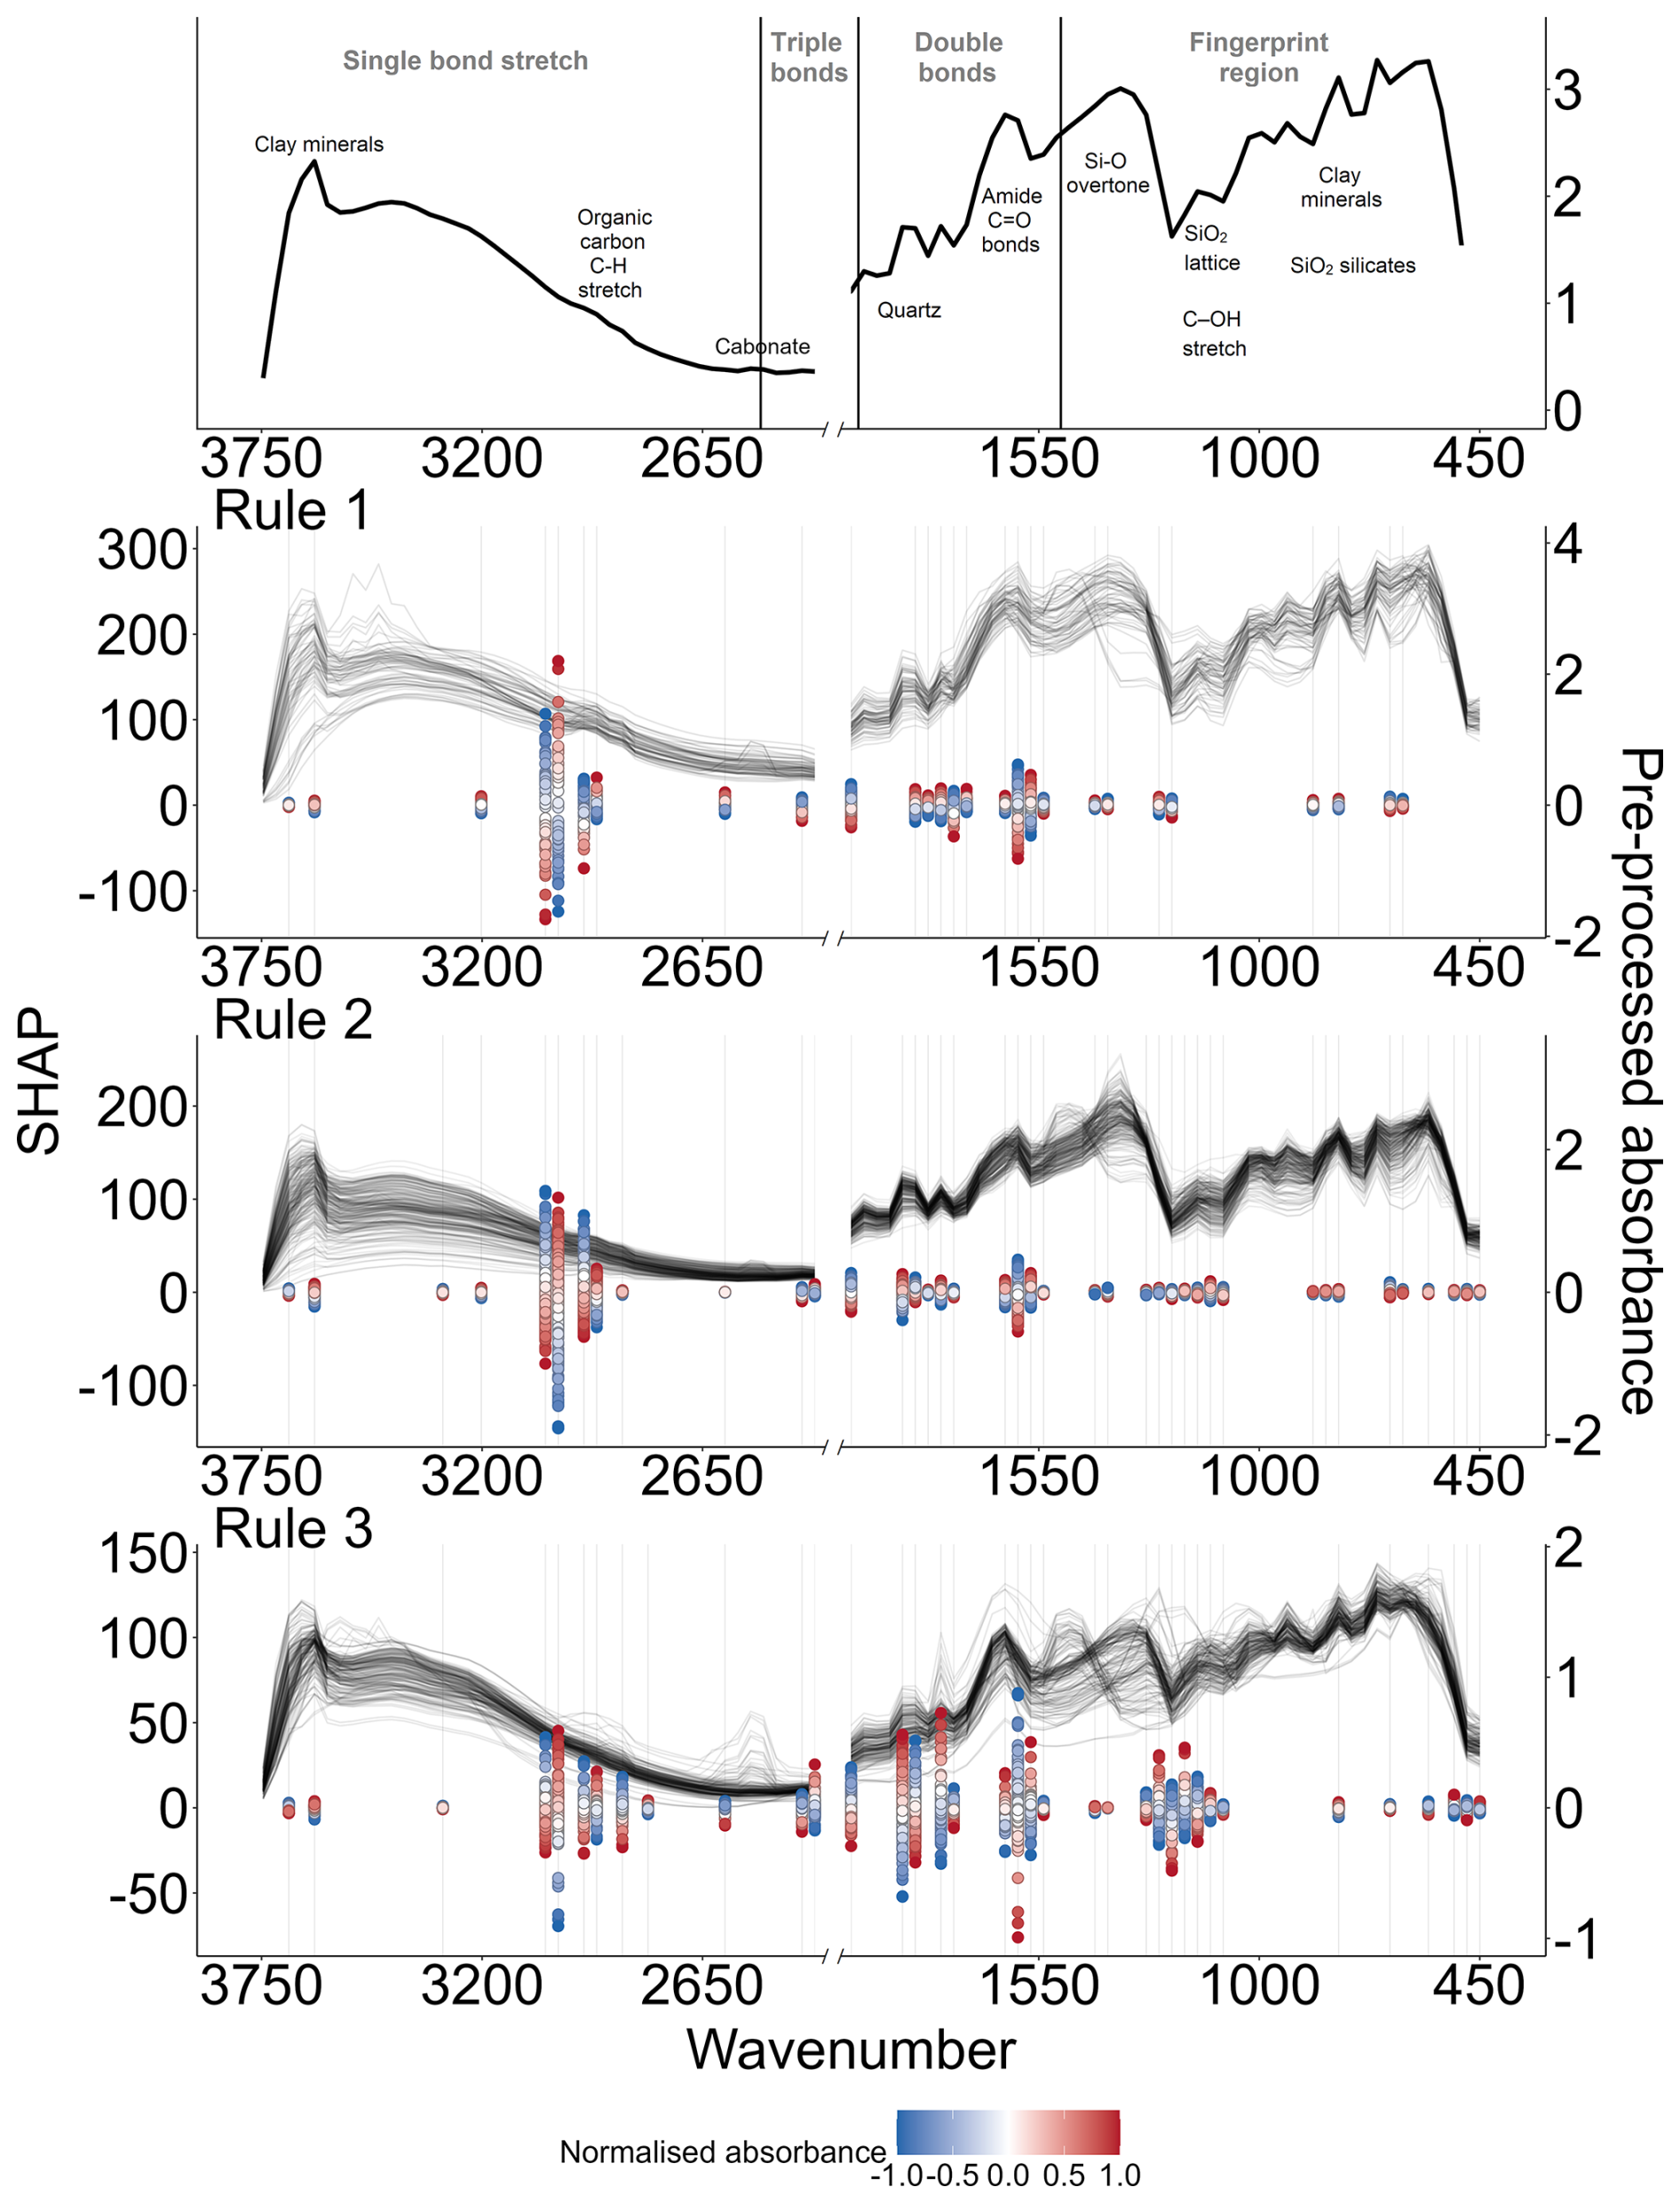
Figure 6The mean spectra, key spectral assignment, and the SHAP contribution of the spectral regions used in each linear model of each Cdef CUBIST rule. A positive SHAP value indicates a positive contribution to a model with increased absorbance, whereas a negative SHAP value indicates a negative contribution with increased absorbance. The magnitude of SHAP indicates the strength of the contribution. The SHAP values are plotted over the pre-processed spectra of each rule set. The SHAP values are coloured by the normalised absorbance value at each wavenumber, ranging from −1 (lowest absorbance at each wavenumber) to 1 (highest absorbance at each wavenumber). SHAP values of each rule are plotted in different y-axes to accommodate differences in magnitude across rules.
The SHAP values indicate positive and negative contributions from spectral regions associated with characteristic absorption of clay minerals, organic matter, and quartz (Fig. 6). Generally, peaks associated with organic C have a negative model contribution with an increase in absorbance, while the troughs have a positive contribution with increasing absorbance (Fig. 6). Absorbance in these regions indicates existing MAOC that already occupies reactive mineral surface sites. As mineral binding sites fill, the remaining deficit diminishes. Similarly, absorptions associated with clay minerals and silicate have a positive model contribution, while the troughs have a negative contribution (Fig. 6). Absorbance from clay minerals indicates abundant reactive surface area that is available but not yet occupied by organic matter. The positive SHAP contribution reflects unrealised adsorption capacity, whereas quartz has negligible reactive surface area and contributes to coarser texture without contributing to adsorption capacity, which constrains CAmax.
In comparison to SHAP analysis of the MAOC CUBIST model (Fig. S1 in the Supplement), both models draw heavily on the organic C-H region, but the Cdef model shows a progressive shift across rules from organic-C-dominated (Rule 1) to mineral-dominated (Rule 3), indicating the model increasingly relies on mineralogy for available surface in soil with higher Cdef. The MAOC model's contributions remain more consistently concentrated in the organic C-H region across all rules, with the fingerprint region playing a lesser role throughout. This reflects that the MAOC model is more driven by the organic C information in the spectra, whereas the Cdef model integrates both organic and mineral information.
Our findings support the hypothesis that mid-IR spectra, combined with machine learning and enhanced by SHAP analysis for interpretability, can accurately estimate soil MAOC content and Cdef (Table 2) by elucidating the contribution of specific mid-IR absorptions.
Our results demonstrate that combining soil spectroscopy with machine learning offers a rapid, cost-effective, and robust method for estimating MAOC and Cdef. The spectroscopic approach enables many more measurements than conventional methods, thereby enhancing our understanding of how MAOC and Cdef vary in soil across space and time (Angers et al., 2011). This approach could also provide essential data for soil biogeochemical and Earth System models, improving their initialisation, validation and ongoing development (Stewart et al., 2007; Georgiou et al., 2022; Abramoff et al., 2022; Vereecken et al., 2016). Given that C storage is a key soil function for maintaining soil health (Lal, 2016; Lehmann et al., 2020), our findings highlight how the current state and potential for C sequestration can be rapidly and cost-effectively measured as part of soil health assessment (Vogel et al., 2019). This aligns with growing evidence that soil spectra, when combined with machine learning, can model soil functions, going beyond predicting individual soil properties (Cohen et al., 2006; Elliott et al., 2007; Cécillon et al., 2009; Viscarra Rossel et al., 2010; Maynard and Johnson, 2018; Deiss et al., 2023).
Two other studies estimated soil Cdef using mid-IR spectroscopic modelling Karunaratne et al. (2024); Baldock et al. (2019). Unlike these studies, which used quantile regressions to estimate Cdef, our approach avoids under- or over-estimations (of Cdef) using bootstrapped frontier lines that more accurately capture the relationship between MAOC and clay + silt content (Viscarra Rossel et al., 2024). Specifically, the frontier-line approach estimates the upper envelope of the MAOC–(clay + silt) relationship under current environmental conditions. Other approaches that aim to avoid under- or overestimation, e.g. Shi et al. (2025), which fit quantile regressions to mineralogically stratified subsets of the data, are effective but still impose a parametric relationship via an internal upper percentile. In contrast, the frontier-line prevents observed values from exceeding the estimated CAmax and allows them to level off at high clay + silt contents, reflecting diminishing stabilisation due to finite organic inputs. As a result, frontier-line analysis reduces both underestimation (by targeting the upper boundary rather than an internal quantile) and overestimation (by avoiding unconstrained extrapolation at high clay + silt), yielding more realistic estimates of attainable MAOC storage. Additionally, unlike the earlier studies, we characterised two distinct sources of uncertainty: those from the frontier-line fitting and from the cross-validated CUBIST model. The 95 % confidence limits of the frontier-line fit were propagated to Cdef predictions by applying CUBIST separately to the upper and lower CI of Cdef estimation (Fig. 5).
The MAOC and Cdef models relied on spectral regions related to organic functional groups such as the C-H groups near 2900 and 2800 cm−1, the C=O stretch near 1725 cm−1 (Volkov et al., 2021), and 1 : 1 and 2 : 1 clay minerals, which provide surfaces for organic matter adsorption . Absorptions for quartz and other minerals in the fingerprint region were also important in the models, but negatively affected the estimates. The Cdef model drew on information on C already present in the soil, which contributed negatively and on soil mineralogy, which indicates what soil minerals could potentially adsorb, contributing positively.
The spectroscopic MAOC and Cdef models were developed using CUBIST, which offers good predictability and interpretability, effectively handling non-linearities, and is advantageous compared to linear methods like PLSR. Specifically, CUBIST performs data-driven selection of relevant informative spectral features from the full spectrum input, as well as utilising contextual information across spectral regions from regions without distinct absorption peaks. CUBIST is therefore advantageous, given that mid-IR spectra are high-dimensional and contain regions that vary in information content, and peak positions can shift under varying molecular environments. As a tree-based algorithm, it can be locally interpreted, unlike other algorithms that are limited to global-level interpretation (Viscarra Rossel and Webster, 2012). SHAP values provided additional interpretation, allowing us to not only know how each wavelength contributes to the model and how strongly they contributed to it but also show what direction an increase or decrease in absorbance affects the model, thus identifying which soil constituents (clay minerals, quartz, and organic C) significantly contribute to determining MAOC and Cdef. Nevertheless, given the heterogeneity of soil composition, overlapping absorptions make it challenging to distinguish molecular vibrations, particularly in the fingerprint region. Like other regression tree methods, CUBIST can be sensitive to strong collinearity, potentially leading to model instability and overfitting (Kuhn and Johnson, 2013). To minimise the effect of collinearity in our modelling, we interpolated the spectra to a resolution of 32 cm−1 (see Methods section).
This study extends beyond previous research by incorporating samples from various other ecosystems. The samples span Australia's main Köppen-Geiger climate zones, 24 major vegetation groups, and 11 of the 14 Australian soil classification orders (Isbell and the National Committee on Soil and Terrain, 2016). We excluded hydrosols with different C-stabilisation dynamics. Future work will include more samples and a broader representation of soils to develop site-specific Cdef estimates. Although MAOC was measured in the ≤ 50 µm fraction and clay + silt content follows the Australian classification (clay <2 µm, silt 2–20 µm), the practical impact of this mismatch is likely modest given that Australian soils tend to have low silt contents and fine fractions dominated by clay-sized particles. Nevertheless, future work should align these operational definitions where possible, for example by directly measuring and modelling ≤50 µm or ≤53 µm silt + clay fractions, to better reflect the true mineral capacity for C stabilisation.
Our method facilitates efficient data acquisition, providing an effective approach to help farmers and land managers gain the insights needed to assess the current and potential for C sequestration on their land. Identifying regions and soil types where increasing organic C storage is feasible enables more targeted resource allocation and informed decision-making.
While our study pertains to Australian soils, the principles of applying laboratory-based mid-IR spectroscopy and machine learning to estimate MAOC and Cdef are applicable across various land uses, soil types, and climatic conditions. This approach provides high-throughput MAOC and Cdef estimation on sampled soils. Furthermore, such laboratory models can, in the future, underpin and improve the calibration and validation of remote-sensing-based approaches. When used in combinations, these methods provide the rapid assessment capability needed to scale soil C initiatives for monitoring soil organic C and its potential contribution to climate adaptation and mitigation targets under the Paris Agreement and the UN Sustainable Development Goals. The method's ability to support large-scale monitoring of C sequestration potential also makes it relevant to soil C credit systems such as the Australian Carbon Credit Units (ACCU) scheme.
We demonstrated that mid-IR spectroscopy combined with machine learning could effectively estimate soil MAOC content (RMSE = 2.77 g kg soil−1, R2 = 0.86, CCC = 0.91) and Cdef (RMSE = 3.72 g kg soil−1, R2 = 0.89, CCC = 0.94). We interpreted CUBIST, confirming the contributions to the models from functional groups related to organic functional groups, clay minerals, and quartz, reflecting existing soil organic C, soil mineralogy, particle size distribution, and surface area available for C adsorption, which are critical for estimating MAOC and Cdef. Our approach contributes to the analysis of C sequestration potential using mid-IR spectroscopy and machine learning, supporting the development of rapid and cost-effective soil C sequestration assessment and monitoring.
The code and dataset will be made available upon reasonable request.
The supplement related to this article is available online at https://doi.org/10.5194/soil-12-619-2026-supplement.
YH: Investigation, methodology, analysis, visualisation and writing. RAVR: Conceptualisation, methodology, writing, editing, supervision and funding acquisition.
At least one of the (co-)authors is a member of the editorial board of SOIL. The peer-review process was guided by an independent editor, and the authors also have no other competing interests to declare.
Publisher's note: Copernicus Publications remains neutral with regard to jurisdictional claims made in the text, published maps, institutional affiliations, or any other geographical representation in this paper. The authors bear the ultimate responsibility for providing appropriate place names. Views expressed in the text are those of the authors and do not necessarily reflect the views of the publisher.
We thank Mr. Farid Sepanta for the laboratory analyses of the soils, and Drs. Zefang Shen and Adam Cross for earlier project discussions. We are grateful to the Terrestrial Ecosystem Research Network (TERN) and Dr. Andrew Bissett, who provided us with some of the soil samples used in the work.
RAVR thanks the Australian Government's Australia-China Science and Research Fund-Joint Research Centres (ACSRF-JRCs) (grant ACSRIV000077) and the Australian Research Council's Discovery Projects scheme (project DP210100420) for funding.
This paper was edited by Bas van Wesemael and reviewed by two anonymous referees.
ABARES: Land use of Australia 2010–11 to 2015–16, 250 m, CC BY 4.0, Australian Bureau of Agricultural and Resource Economics and Sciences, https://doi.org/10.25814/7ygw-4d64, 2022. a
Abramoff, R. Z., Guenet, B., Zhang, H., Georgiou, K., Xu, X., Viscarra Rossel, R. A., Yuan, W., and Ciais, P.: Improved global-scale predictions of soil carbon stocks with Millennial Version 2, Soil Biol. Biochem., 164, 108466, https://doi.org/10.1016/j.soilbio.2021.108466, 2022. a
Angers, D., Arrouays, D., Saby, N., and Walter, C.: Estimating and mapping the carbon saturation deficit of French agricultural topsoils, Soil Use Manage., 27, 448–452, https://doi.org/10.1111/j.1475-2743.2011.00366.x, 2011. a
Baldock, J., McNally, S., Beare, M., Curtin, D., and Hawke, B.: Predicting soil carbon saturation deficit and related properties of New Zealand soils using infrared spectroscopy, Soil Res., 57, 835–844, https://doi.org/10.1071/SR19149, 2019. a, b
Beare, M., McNeill, S., Curtin, D., Parfitt, R., Jones, H., Dodd, M., and Sharp, J.: Estimating the organic carbon stabilisation capacity and saturation deficit of soils: a New Zealand case study, Biogeochemistry, 120, 71–87, https://doi.org/10.1007/s10533-014-9982-1, 2014. a
Beck, H. E., Zimmermann, N. E., McVicar, T. R., Vergopolan, N., Berg, A., and Wood, E. F.: Present and future Köppen-Geiger climate classification maps at 1-km resolution, Sci. Data, 5, 1–12, https://doi.org/10.1038/sdata.2018.214, 2018. a
Cécillon, L., Cassagne, N., Czarnes, S., Gros, R., Vennetier, M., and Brun, J.-J.: Predicting soil quality indices with near infrared analysis in a wildfire chronosequence, Sci. Total Environ., 407, 1200–1205, https://doi.org/10.1016/j.scitotenv.2008.07.029, 2009. a
Cohen, M., Dabral, S., Graham, W. D., Prenger, J., and Debusk, W.: Evaluating ecological condition using soil biogeochemical parameters and near infrared reflectance spectra, Environ. Monitor. Assess., 116, 427–457, https://doi.org/10.1007/s10661-006-7664-8, 2006. a
Commonwealth of Australia: National Vegetation Information System V6.0, https://erin.maps.arcgis.com/home/item.html?id=1dab9240522d42c5804677bf19ac64af (last access: 30 April 2026), 2020. a
Deiss, L., Margenot, A. J., Culman, S. W., and Demyan, M. S.: Optimizing acquisition parameters in diffuse reflectance infrared Fourier transform spectroscopy of soils, Soil Sci. Soc. Am. J., 84, 930–948, https://doi.org/10.1002/saj2.20028, 2020. a
Deiss, L., Demyan, M. S., Fulford, A., Hurisso, T., and Culman, S. W.: High-throughput soil health assessment to predict corn agronomic performance, Field Crop. Res., 297, 108930, https://doi.org/10.1016/j.fcr.2023.108930, 2023. a
Du, C., Goyne, K. W., Miles, R. J., and Zhou, J.: A 1915–2011 microscale record of soil organic matter under wheat cultivation using FTIR-PAS depth-profiling, Agron. Sustain. Dev., 34, 803–811, https://doi.org/10.1007/s13593-013-0201-6, 2014. a
Elliott, G. N., Worgan, H., Broadhurst, D., Draper, J., and Scullion, J.: Soil differentiation using fingerprint Fourier transform infrared spectroscopy, chemometrics and genetic algorithm-based feature selection, Soil Biol. Biochem., 39, 2888–2896, https://doi.org/10.1016/j.soilbio.2007.05.032, 2007. a
Feng, W., Plante, A. F., and Six, J.: Improving estimates of maximal organic carbon stabilization by fine soil particles, Biogeochemistry, 112, 81–93, https://doi.org/10.1007/s10533-011-9679-7, 2013. a
Georgiou, K., Jackson, R. B., Vindušková, O., Abramoff, R. Z., Ahlström, A., Feng, W., Harden, J. W., Pellegrini, A. F. A., Polley, H. W., Soong, J. L., Riley, W. J., and Torn, M. S.: Global stocks and capacity of mineral-associated soil organic carbon, Nat. Commun., 13, 3797, https://doi.org/10.1038/s41467-022-31540-9, 2022. a, b
Hassink, J.: The capacity of soils to preserve organic C and N by their association with clay and silt particles, Plant Soil, 191, 77–87, https://doi.org/10.1023/A:1004213929699, 1997. a, b
Hassink, J. and Whitmore, A. P.: A model of the physical protection of organic matter in soils, Soil Sci. Soc. Am. J., 61, 131–139, https://doi.org/10.2136/sssaj1997.03615995006100010020x, 1997. a
Hicks, W., Viscarra Rossel, R., and Tuomi, S.: Developing the Australian mid-infrared spectroscopic database using data from the Australian Soil Resource Information System, Soil Res., 53, 922–931, https://doi.org/10.1071/SR15171, 2015. a
Ingram, J. and Fernandes, E.: Managing carbon sequestration in soils: concepts and terminology, Agr. Ecosyst. Environ., 87, 111–117, https://doi.org/10.1016/S0167-8809(01)00145-1, 2001. a
Isbell, R. and the National Committee on Soil and Terrain: The Australian soil classification, CSIRO publishing, ISBN 9781486314775, https://www.publishing.csiro.au/book/8016/ (last access: 30 April 2026), 2016. a
Karunaratne, S., Asanopoulos, C., Jin, H., Baldock, J., Searle, R., Macdonald, B., and Macdonald, L. M.: Estimating the attainable soil organic carbon deficit in the soil fine fraction to inform feasible storage targets and de-risk carbon farming decisions, Soil Res., 62, https://doi.org/10.1071/SR23096, 2024. a, b
Kronenberg, A. K.: Hydrogen speciation and chemical weakening of quartz, Rev. Mineral. Geochem., 29, 123–176, 1994. a
Kuhn, M. and Johnson, K.: Applied predictive modeling, Springer, 1st edn., ISBN 978-1-4614-6848-6, https://doi.org/10.1007/978-1-4614-6849-3, 2013. a
Kuhn, M., Weston, S., Keefer, C., and Coulter, N.: Cubist models for regression, R package Vignette R package version 0.0, 18, 480, https://rdrr.io/rforge/Cubist/f/inst/doc/cubist.pdf (last access: 30 April 2026), 2012. a
Lal, R.: Soil health and carbon management, Food and Energy Security, 5, 212–222, https://doi.org/10.1002/fes3.96, 2016. a
Lal, R., Negassa, W., and Lorenz, K.: Carbon sequestration in soil, Curr. Opin. Env. Sust., 15, 79–86, https://doi.org/10.1079/PAVSNNR20083030, 2015. a
Lehmann, J., Bossio, D. A., Kögel-Knabner, I., and Rillig, M. C.: The concept and future prospects of soil health, Nature Reviews Earth & Environment, 1, 544–553, https://doi.org/10.1038/s43017-020-0080-8, 2020. a
Lin, L. I.: A concordance correlation coefficient to evaluate reproducibility, Biometrics, 45, 255–268, https://www.jstor.org/stable/2532051 (last access: 30 April 2026), 1989. a
Max, J.-J. and Chapados, C.: Isotope effects in liquid water by infrared spectroscopy. III. H2O and D2O spectra from 6000to cm-1, J. Chem. Phys., 131, https://doi.org/10.1063/1.3258646, 2009. a
Maynard, J. J. and Johnson, M. G.: Applying fingerprint Fourier transformed infrared spectroscopy and chemometrics to assess soil ecosystem disturbance and recovery, J. Soil Water Conserv., 73, 443–451, https://doi.org/10.2489/jswc.73.4.443, 2018. a
McKenzie, T.: snfa: Smooth Non-Parametric Frontier Analysis, R package version ≥ 3.5.0, https://cran.r-project.org/web/packages/snfa/snfa.pdf (last access: 30 April 2026), 2022. a
Nguyen, T., Janik, L. J., and Raupach, M.: Diffuse reflectance infrared Fourier transform (DRIFT) spectroscopy in soil studies, Soil Res., 29, 49–67, https://doi.org/10.1071/SR9910049, 1991. a, b, c, d, e
Parmeter, C. F. and Racine, J. S.: Smooth constrained frontier analysis, Recent Advances and Future Directions in Causality, Prediction, and Specification Analysis: Essays in Honor of Halbert L. White Jr., Springer, New York, NY, 463–488, https://doi.org/10.1007/978-1-4614-1653-1_18, 2013. a
Poeplau, C., Don, A., Six, J., Kaiser, M., Benbi, D., Chenu, C., Cotrufo, M. F., Derrien, D., Gioacchini, P., Grand, S., Gregorich, E., Griepentrog, M., Gunina, A., Haddix, M., Kuzyakov, Y., Kühnel, A., Macdonald, L. M., Soong, J., Trigalet, S., Vermeire, M.-L., Rovira, P., van Wesemael, B., Wiesmeier, M., Yeasmin, S., Yevdokimov, I., and Nieder, R.: Isolating organic carbon fractions with varying turnover rates in temperate agricultural soils – A comprehensive method comparison, Soil Biol. Biochem., 125, 10–26, https://doi.org/10.1016/j.soilbio.2018.06.025, 2018. a
Quinlan, J. R.: Learning with continuous classes, in: 5th Australian joint conference on artificial intelligence, Vol. 92, 343–348, World Scientific, https://doi.org/10.1142/1897, 1992. a
R Core Team: R: A language and environment for statistical computing, https://www.R-project.org/ (last access: 30 April 2026), 2024. a
Senesi, N., D'Orazio, V., and Ricca, G.: Humic acids in the first generation of EUROSOILS, Geoderma, 116, 325–344, https://doi.org/10.1016/S0016-7061(03)00107-1, 2003. a
Shapley, L. S.: A value for n-person games, Contribution to the Theory of Games, 2, https://www.rand.org/content/dam/rand/pubs/papers/2021/P295.pdf (last access: 30 April 2026), 1953. a
Shi, L., Daly, K., and O'Rourke, S.: Estimating mineral-associated organic carbon saturation and sequestration potential using MIR spectral based local quantile regression, Geoderma, 454, 117181, https://doi.org/10.1016/j.geoderma.2025.117181, 2025. a
Six, J., Conant, R. T., Paul, E. A., and Paustian, K.: Stabilization mechanisms of soil organic matter: implications for C-saturation of soils, Plant Soil, 241, 155–176, https://doi.org/10.1023/A:1016125726789, 2002. a, b
Six, J., Doetterl, S., Laub, M., Müller, C. R., and Van de Broek, M.: The six rights of how and when to test for soil C saturation, SOIL, 10, 275–279, https://doi.org/10.5194/soil-10-275-2024, 2024. a
Soriano-Disla, J. M., Janik, L. J., Viscarra Rossel, R. A., Macdonald, L. M., and McLaughlin, M. J.: The performance of visible, near-, and mid-infrared reflectance spectroscopy for prediction of soil physical, chemical, and biological properties, Appl. Spectrosc. Rev., 49, 139–186, https://doi.org/10.1080/05704928.2013.811081, 2014. a, b
Spitzer, W. and Kleinman, D.: Infrared lattice bands of quartz, Phys. Rev., 121, 1324, https://doi.org/10.1103/PhysRev.121.1324, 1961. a
Stewart, C. E., Paustian, K., Conant, R. T., Plante, A. F., and Six, J.: Soil carbon saturation: concept, evidence and evaluation, Biogeochemistry, 86, 19–31, https://doi.org/10.1007/s10533-007-9140-0, 2007. a
Tanykova, N., Petrova, Y., Kostina, J., Kozlova, E., Leushina, E., and Spasennykh, M.: Study of organic matter of unconventional reservoirs by IR spectroscopy and IR microscopy, Geosciences, 11, 277, https://doi.org/10.3390/geosciences11070277, 2021. a
Teng, H., Viscarra Rossel, R. A., Shi, Z., and Behrens, T.: Updating a national soil classification with spectroscopic predictions and digital soil mapping, Catena, 164, 125–134, https://doi.org/10.1016/j.catena.2018.01.015, 2018. a
UNFCCC: Improved soil carbon, soil health and soil fertility under grassland and cropland as well as integrated systems, including water management: Workshop report by the secretariat, document GE.19-15339(E), https://unfccc.int/documents/199954 (last access: 30 April 2026), 2019. a
Vereecken, H., Schnepf, A., Hopmans, J. W., Javaux, M., Or, D., Roose, T., Vanderborght, J., Young, M. H., Amelung, W., Aitkenhead, M., Allison, S. D., Assouline, S., Baveye, P., Berli, M., Brüggemann, N., Finke, P., Flury, M., Gaiser, T., Govers, G., Ghezzehei, T., Hallett, P., Hendricks Franssen, H. J., Heppell, J., Horn, R., Huisman, J. A., Jacques, D., Jonard, F., Kollet, S., Lafolie, F., Lamorski, K., Leitner, D., McBratney, A., Minasny, B., Montzka, C., Nowak, W., Pachepsky, Y., Padarian, J., Romano, N., Roth, K., Rothfuss, Y., Rowe, E. C., Schwen, A., Šimůnek, J., Tiktak, A., Van Dam, J., van der Zee, S. E. A. T. M., Vogel, H. J., Vrugt, J. A., Wöhling, T., and Young, I. M.: Modeling soil processes: Review, key challenges, and new perspectives, Vadose Zone J., 15, vzj2015-09, https://doi.org/10.2136/vzj2015.09.0131, 2016. a
Viscarra Rossel, R. and Webster, R.: Predicting soil properties from the Australian soil visible–near infrared spectroscopic database, Eur. J. Soil Sci., 63, 848–860, https://doi.org/10.1111/j.1365-2389.2012.01495.x, 2012. a, b
Viscarra Rossel, R., Walvoort, D., McBratney, A., Janik, L. J., and Skjemstad, J.: Visible, near infrared, mid infrared or combined diffuse reflectance spectroscopy for simultaneous assessment of various soil properties, Geoderma, 131, 59–75, https://doi.org/10.1016/j.geoderma.2005.03.007, 2006. a
Viscarra Rossel, R., Webster, R., Zhang, M., Shen, Z., Dixon, K., Wang, Y.-P., and Walden, L.: How much organic carbon could the soil store? The carbon sequestration potential of Australian soil, Glob. Change Biol., 30, e17053, https://doi.org/10.1111/gcb.17053, 2024. a, b, c, d, e
Viscarra Rossel, R. A., Rizzo, R., Demattê, J. A. M., and Behrens, T.: Spatial Modeling of a Soil Fertility Index using Visible–Near-Infrared Spectra and Terrain Attributes, Soil Sci. Soc. Am. J., 74, 1293–1300, https://doi.org/10.2136/sssaj2009.0130, 2010. a
Viscarra Rossel, R. A., Behrens, T., Ben-Dor, E., Chabrillat, S., Demattê, J. A. M., Ge, Y., Gomez, C., Guerrero, C., Peng, Y., Ramirez-Lopez, L., Shi, Z., Stenberg, B., Webster, R., Winowiecki, L., and Shen, Z.: Diffuse reflectance spectroscopy for estimating soil properties: A technology for the 21st century, Eur. J. Soil Sci., 73, e13271, https://doi.org/10.1111/ejss.13271, 2022. a
Vogel, H.-J., Eberhardt, E., Franko, U., Lang, B., Ließ, M., Weller, U., Wiesmeier, M., and Wollschläger, U.: Quantitative evaluation of soil functions: Potential and state, Frontiers in Environmental Science, 7, 463905, https://doi.org/10.3389/fenvs.2019.00164, 2019. a
Volkov, D. S., Rogova, O. B., and Proskurnin, M. A.: Organic matter and mineral composition of silicate soils: FTIR comparison study by photoacoustic, diffuse reflectance, and attenuated total reflection modalities, Agronomy, 11, 1879, https://doi.org/10.3390/agronomy11091879, 2021. a, b, c, d, e
Walden, L., Sepanta, F., and Viscarra Rossel, R.: FT-MIR Spectroscopic Analysis of the Organic Carbon Fractions in Australian Mineral Soils, Eur. J. Soil Sci., 76, e70084, https://doi.org/10.1111/ejss.70084, 2025. a
Wang, Y. and Witten, I. H.: Inducing model trees for continuous classes, in: Proceedings of the ninth European conference on machine learning, Vol. 9, 128–137, Citeseer, https://researchcommons.waikato.ac.nz/entities/publication/d6e1955d-92f8-4993-8999-98be1a1c1b59 (last access: 30 April 2026), 1997. a
Wiesmeier, M., Urbanski, L., Hobley, E., Lang, B., von Lützow, M., Marin-Spiotta, E., van Wesemael, B., Rabot, E., Ließ, M., Garcia-Franco, N., Wollschläger, U., Vogel, H.-J., and Kögel-Knabner, I.: Soil organic carbon storage as a key function of soils – A review of drivers and indicators at various scales, Geoderma, 333, 149–162, https://doi.org/10.1016/j.geoderma.2018.07.026, 2019. a