the Creative Commons Attribution 4.0 License.
the Creative Commons Attribution 4.0 License.
 | 04 May 2026
Drivers of soil C quality and stability: insights from a topsoil dataset at landscape scale in Ontario, Canada
Adam W. Gillespie
Daniel D. Saurette
Laura L. Van Eerd
Although soil C is a critical component of soil health, studies robustly exploring the agronomic and pedoclimatic effects on soil C are limited, especially at the landscape scale. Therefore, a dataset of 1490 topsoil samples from agricultural fields across Ontario was used to evaluate the impacts of agronomic and pedoclimatic factors on eight soil C indicators including chemistry and thermal stability of soil C using the programmed pyrolysis approach. Soil C quality and stability were largely controlled by the inherent soil characteristics such as soil texture. Significant interactive effects of cropping system and tillage intensity on soil C indicators were observed; however, the number of significant effects varied among the three soil textural classes. All soil C indicators were significantly different among the cropping systems for the coarse textured soils, but the cropping system differences decreased under medium and fine textured soils. From the pyrolysis analysis, the hydrogen index (HI) and oxygen index (OI) also confirmed that the soil C chemistry was influenced by the cropping system. For instance, orchard systems had stable pools of soil C whereas vegetable systems were associated with less advanced degree of soil C decomposition. Remaining soil management variables (cover crop use, tillage intensity, and organic amendments) had a weaker influence than cropping systems and soil textural classes on soil C indicators. Principal component analysis revealed a close association of soil C indicators with the mean annual precipitation (MAP) and cropping system; suggesting that the quantity and quality of soil C inputs associated with different cropping systems and increase in precipitation had a large influence on soil C. Our results confirm the significant effects of agronomic and pedoclimatic variables on chemistry, thermal stability, and composition of soil C pools, which have long-term implications on soil C storage, mitigating global climate change, and improving soil health.
- Article
(1817 KB) - Full-text XML
-
Supplement
(558 KB) - BibTeX
- EndNote


Soil C dynamics is estimated based on the amount of C in various soil C pools and the transformation rate of C within these pools due to microbial processes (Cotrufo et al., 2013; Parton et al., 1988). Several indicators, therefore, have been proposed to assess soil C dynamics. Soil organic C (SOC) content or concentration is one of the most measured parameters of soil health (Bünemann et al., 2018) and plays a significant role in many soil functions like nutrient and water cycling and greenhouse gas emissions (Lal, 2016). Soil organic C comprises C compounds with a wide range of stabilities, and so it takes a long time (5 to 10 years) to detect changes after implementation of new land use management practices (Poeplau and Don, 2015). Total organic C includes a labile C pool, which is easily metabolized by soil microbes and has a rapid turnover time. Measurements of the labile soil C pool, by using the permanganate oxidizable C (POXC; Moebius-Clune et al., 2016), potential C mineralization and soil respiration (Haney et al., 2008) tests, are useful assessments of the quantity of C that is metabolized by the soil microbes and may offer early detection of SOC changes from land use changes. Likewise, autoclaved citrate extractable protein (ACE) may be used as a predictor of labile soil N and C (Agnihotri et al., 2022). Assessment of these soil C indicators, hence, provide direct or indirect information on the soil C storage and functions across diverse soil textures, management practices, and climatic conditions (Liptzin et al., 2022). Most of the research on soil C indicators and its response to management practices is conducted in field experiments and at a small-plot scale (Chahal et al., 2021; Culman et al., 2013; Mesgar et al., 2024). In this study, we apply these techniques to samples obtained at the landscape scale from operational agricultural fields. This is important to comprehensively characterize the relationship between soil C indicators and the farm management strategies that drive soil health.
Thermal analysis methods, such as programmed pyrolysis, is a novel technique in soil science and is used to assess the molecular composition and the thermal stability of SOC (Gillespie et al., 2014). Programmed pyrolysis subjects soil samples to a temperature ramp under an inert atmosphere and measures the organic and inorganic C released as a function of increasing temperature (Lafargue et al., 1998; Sebag et al., 2016). The thermal stability is related to the biodegradation potential of SOC (Peltre et al., 2013; Sebag et al., 2016; Soucémarianadin et al., 2018), which is inferred from the hydrogen index (HI), oxygen index (OI), and T50 (temperature at which 50 % of the pyrolyzable C has been released). The HI primarily represents fresh, hydrogenated organic matter, and is related to the labile pool of soil C whereas the OI represents organic matter that has been oxidized through microbial metabolism, and is a more resistant and stable pool of soil C (Carrie et al., 2012; Mesgar et al., 2024). The T50 is inversely related to the decomposition potential, in that increasing T50 indicates lower decomposition potential and thus more biologically stable organic matter (Gillespie et al., 2014; Gregorich et al., 2015). While the HI, OI, and T50 are not direct indicators of soil health, the assessment of SOC stability and quality using these indicators (pyrolysis method) provides valuable knowledge on how to build soil C and to develop effective strategies to reduce the C loss under different land use management practices.
Soil C quality and stability is controlled by numerous variables such as soil texture, tillage, crops grown, cover crops, use of organic amendments, changes in temperature, precipitation, and the interactions among these factors (McDaniel and Grandy, 2016). Furthermore, these controlling variables influence the composition of SOC and can potentially alter the stable and labile pools of C (McDaniel and Grandy, 2016; Soon et al., 2007). Adding manure, for instance, to an intensively managed long-term sorghum-wheat cropping system increased the labile fraction of soil C (Datta et al., 2018). Soil C mineralization and respiration was increased by using no-tillage, cover crops, and a diverse crop rotation (Balota et al., 2004; Chahal and Van Eerd, 2020; Viaud et al., 2011). Adopting reduced tillage along with cover crops or perennial crops increased SOC content and soil microbial biomass C (Sun et al., 2023). Likewise, POXC increased with the reduction in tillage intensity and cover cropping (Liptzin et al., 2022). These studies from long-term experiments confirm that different management practices impact the SOC composition which in turn, affects the labile and stable pools of soil C. Yet, it remains uncertain which management or environmental variables exert the strongest influence on soil C stability under the complexity of agricultural fields.
Here, we used a large dataset of mineral topsoil samples collected from agricultural fields across Ontario through the Ontario Topsoil Sampling Project (OTSP). Previously, the OTSP dataset was used to assess the soil health scoring functions (Chahal et al., 2023) and SOC : clay ratio as an indicator of soil functionality (Chahal et al., 2024). The goal of the present study was to evaluate the impact of agricultural management and environmental variables on soil C indicators (SOC, 96 h C mineralization potential (Cmin-96h), POXC, Solvita CO2-burst, and ACE) and indicators of thermal stability of soil C using programmed pyrolysis (HI, OI, and T50). We also assessed the associations among these soil C indicators at the landscape scale to comprehensively assess the major drivers of soil C storage and stability. The study results will contribute to making improved recommendations regarding selection of soil C indicators and help growers and researchers to adjust management practices to increase soil C storage.
2.1 Soil sample collection
Topsoil samples (n=1511) for this study were collected as a part of the OTSP from 2019 to 2022. The soil samples for this project were collected from multiple locations throughout southern Ontario. The OTSP was a collaborative project between the Ontario Ministry of Agriculture, Food, and Agribusiness (formerly known as Ontario Ministry of Agriculture, Food, and Rural Affairs) and the School of Environmental Sciences at the University of Guelph, to assess the soil physical, chemical, and biological characteristics in agricultural soils in Ontario (Chahal et al., 2023, 2024). Soil samples were collected from the Ap horizon (agricultural tilled layer). To ensure all samples were restricted to this horizon depth, the sampling depth was terminated at 30 cm if the Ap horizon exceeded this depth. The median thickness of the sampled Ap horizons across all the sites was 25 cm. Details about soil sample collection and the selection of the locations is explained in detail in Chahal et al. (2023). Briefly, for each site, three soil samples were collected, georeferenced, and a comprehensive land management survey with the grower was conducted to document information on the crop rotation, type of crops grown, tillage, use of cover crops, and application of organic amendments. The agricultural management factors identified in our study were consistent with the commonly adopted practices by the growers and were representative of the geographical area. Mean annual temperature (MAT) and mean annual precipitation (MAP) data were collected using the WorldClim version 2.1 from 1970 to 2000 (http://www.worldclim.org/data/worldclim21.html, last access: 11 November 2023). The MAP and MAT were grouped into two (intermediate zone with precipitation between 800 and 1000 mm and wet zone with precipitation greater than 1000 mm) and three classes (0 to 5 °C, 5.01 to 10 °C, and 10.01 to 15 °C), respectively. All the soil samples were classified into three soil textural classes (coarse with sand % ranging between 52 % to 94 %), medium (between 2 % to 78 % sand) , and fine (between 1 % to 45 % sand); Moebius-Clune et al., 2016), five cropping system (annual grain, forage, vegetable, orchard, and perennial), five tillage intensity (conventional tillage, moderate disturbance, light disturbance, no disturbance, and no-tillage), two cover crop (yes or no), and two organic amendment (yes or no) classes. For the tillage intensity classes, conventional tillage represented the moldboard plow tillage with full soil disturbance, moderate tillage represented more than 2 passes with disk or chisel plow, light disturbance represented 1 or 2 passes with disk or cultivator, no disturbance referred to the little or no soil movement as observed in pasture and perennial cropping systems, and no-tillage represented minimal or no disturbance to the soil such as slot-tillage during planting.
We focused on the mineral soils for this study; thus, 21 soil samples with topsoil SOC concentration more than 8.7 % were removed from the dataset (Chahal et al., 2024). Therefore, total number of samples used for the soil C analysis were 1490. It is important to note that the number of observations for each soil C indicator (given in Sect. 2.2) varied by the indicator and hence the management practices. For instance, programmed pyrolysis was restricted to 151 soil samples selected via conditioned Latin hypercube approach (Minasny and McBratney, 2006) as representative of full dataset (Chahal et al., 2023).
2.2 Laboratory analyses
After quality assurance and quality control (QA/QC) analysis, the database consisted of eight soil C indicators: SOC (n=1490), Cmin-96h (n=1017), POXC (n=1413), Solvita CO2-burst (n=768), ACE protein (n=151), HI (n=151), OI (n=151) and T50 (n=151). As described above, 151 soil samples used to measure ACE protein and pyrolysis parameters were representative of the full dataset and refer to the same set of soil samples. Soil organic C concentration was calculated as the difference between total C and inorganic C. Total C was estimated using the dry combustion method (samples were combusted at 1300 °C) on LECO 828 Series CN analyzer (Skjemstad and Baldock, 2008). Inorganic C was determined by subjecting a ground subsample of soil to combustion in a muffle furnace at 470 °C to remove organic C (Krom and Berner, 1983). Soil C mineralization (Cmin-96h) was quantified using the KOH trap method and was determined by measuring the concentration of CO2 evolved (mg CO2-C 20 g−1 soil) when 7.5 mL water was added to 20 g air dried soil placed in an air-tight jar with 9 mL of 0.5 M KOH at room temperature (Schindelbeck et al., 2016). Permanganate oxidizable C (µg g−1) was measured using spectrophotometer where the colorimetric change due to the reduction of manganese in a potassium permanganate solution on air dried soil was quantified (Moebius-Clune et al., 2016). Solvita CO2-burst was quantified as per the updated protocol by the Woods End® Laboratories Inc., Mt. Vernon, ME. A 30-cc scoop (around 25 to 35 g) of oven-dried (40 °C) soil was placed in a vial and was wetted using 9 to 10 mL distilled water. The vials were transferred to 475 mL glass jars and Solvita CO2-burst paddles were inserted into each jar. The jars were sealed and left undisturbed for 24 h at room temperature and evolved CO2 concentration (mg kg−1) was determined using a digital colorimeter reader (Brinton, 2019). Autoclaved citrate extractable protein (mg kg−1) was quantified on air-dried soils by autoclaving, centrifuging, and treating a sodium citrate soil extract with bicinchoninic acid (Schindelbeck et al., 2016). Soil particle size analysis was done using the pipette method where soil organic matter was removed by treating the soil with hydrogen peroxide (Sheldrick and Wang, 1993). Consistent with soil textural grouping recommended by Moebius-Clune et al. (2016), the dataset was divided into three soil textural classes (coarse, medium, and fine).
The programmed pyrolysis analysis was conducted using a HAWK pyrolyzer (Wildcat Technologies, Humble, Texas, USA) at the Canadian Geological Survey in Calgary Alberta according to Gillespie et al. (2014) and Gregorich et al. (2015). The standard manufacturer recommended settings (with the helium flow rate at 100 mL min−1) were followed to conduct the programmed pyrolysis. About 70 mg air-dried ground soil sample is subjected to a constant temperature of 300 °C for 3 min under helium gas, to quantify free hydrocarbons using a flame ionization detector (mg HC g−1) and referred to as S1. Next, the soil sample was heated at a rate of 25 °C min−1 until 650 °C where hydrocarbons were released (i.e., cracking SOC) and quantified as S2. The concentration of CO2 (mg CO2 g−1) released during S1 and S2 was determined using an infrared detector and represented as S3. Hydrogen index of a soil sample represents the ratio of all hydrocarbons measured as S1 + S2 divided by SOC, whereas OI refers to the ratio of CO2 released (S3) divided by SOC (Lafargue et al., 1998). The stability of soil C is represented by the T50 which is the temperature at which 50 % of the SOC was pyrolyzed (Gillespie et al., 2014). It is important to note that T50 is measured under S1 and S2 only.
2.3 Data analysis
All soil data were analyzed using the SAS (SAS Institute version 9.4, Cary, NC, USA). A variance component analysis was conducted to test the relative importance of the agronomic and pedoclimatic variables for each soil C indicator. Prior to conducting the variance component analysis, the assumptions of normality were assessed. Given the relatively large sample sizes for most of the variables studied, variance component estimates were considered robust to minor deviations from normality. For each soil textural class, the main as well the interactive effect of the agronomic management practices (cropping system, tillage intensity, cover crops, and organic amendments) on soil C indicators were tested using PROC GLIMMIX in SAS. The relationship among the soil C indicators was tested using the Pearson correlation analysis (PROC CORR). To linearize the relationships among indicators, all the indicators were log-transformed for correlation analysis. Consistent with Liptzin et al. (2022) and Mesgar et al. (2024), a principal component analysis using PRINCOMP procedure was also conducted to explore how the soil C indicators interacted with the site characteristics (i.e., agronomic management practices (cropping system, tillage, cover crop, organic amendment) and pedoclimatic conditions (sand, silt, clay, mean annual temperature and precipitation)). In addition to the site characteristics and pedoclimatic conditions, the variables included in the PCA were SOC concentration, POXC, Cmin-24h, Solvita CO2-burst, ACE, HI, OI, and T50. The first two PCs were selected based on scree plots and the eigenvalues of the soil C indicators were used to create the biplots to better understand the interdependence among the soil C indicators and how they interacted with the site characteristics and pedoclimatic conditions. The statistical significance of all the tests was assessed at P<0.05.
3.1 Agronomic and pedoclimatic effects on soil C indicators
The results of variance partitioning revealed that soil textural classes and cropping system explained a larger percentage of variance for all soil C indicators compared to the other variables (tillage intensity, cover crop, organic amendments, MAP and MAT; Table 1). For SOC, the amount of variance explained by soil texture was higher than for cropping system (60.5 % and 26.4 %, respectively), and for POXC, it was 53.5 % and 21.7 %, respectively (Table 1). Our results of strong dependence of soil texture on SOC confirm the texture mediated soil C stabilization processes. For instance, soil C retention is higher in fine textured than coarse textured soils mainly due to mineral-organic associations and through the formation of microaggregates which physically protect the soil C from microbial decomposition. This finding also aligned with Fig. 1 where fine textured soils exhibited greatest T50 values (i.e. indicating greater thermal stability); thus, further highlighting the role of clay induced protection of SOC. Interestingly, the percentage of variance explained by texture was comparable or less than for cropping system in Cmin-96h (38.8 % and 36.9 %), Solvita CO2-burst (37.5 % and 38.7 %), and ACE (4.87 % and 50.7 %) (Table 1). The type of main crops grown (i.e., the cropping system) was found to be a key driver of labile pools of soil C (such as Cmin and ACE) in a study by Amsili et al. (2021). Soil texture also explained a large amount of variance (75.2 %) in the thermal-based parameters of soil C (Table 1). Measures of SOC stability (T50) and quality (HI and OI) were largely controlled by soil texture for T50 and cropping system for HI and OI. Unlike cropping system and soil textural classes, tillage intensity was not found to be an important predictor of any of the tested soil C indicators (Table 1). While tillage intensity was not found to be an important variable impacting soil C indicators when the bulk dataset was used, its effects were detected for some soil C indicators when the data were categorized based on soil textural classes. In particular, tillage intensity significantly influenced POXC in fine-textured soils (Table 2) suggesting that effects of tillage are more pronounced on labile soil C pools in soils with high clay content than the stable fractions of soil C. The least amount of variance in soil C indicators was explained by MAT, use of cover crops, and organic amendments (Table 1), suggesting a minor influence of these factors on soil C variability in our study. One possible explanation for this result could be that cover crop and organic amendment effects varies with soil type, climatic conditions, and baseline fertility which might have potentially masked their overall impact on soil C indicators in our multi-site study. Therefore, consideration of soil textural class and cropping system is needed when interpreting the soil C indicators (Nunes et al., 2021).
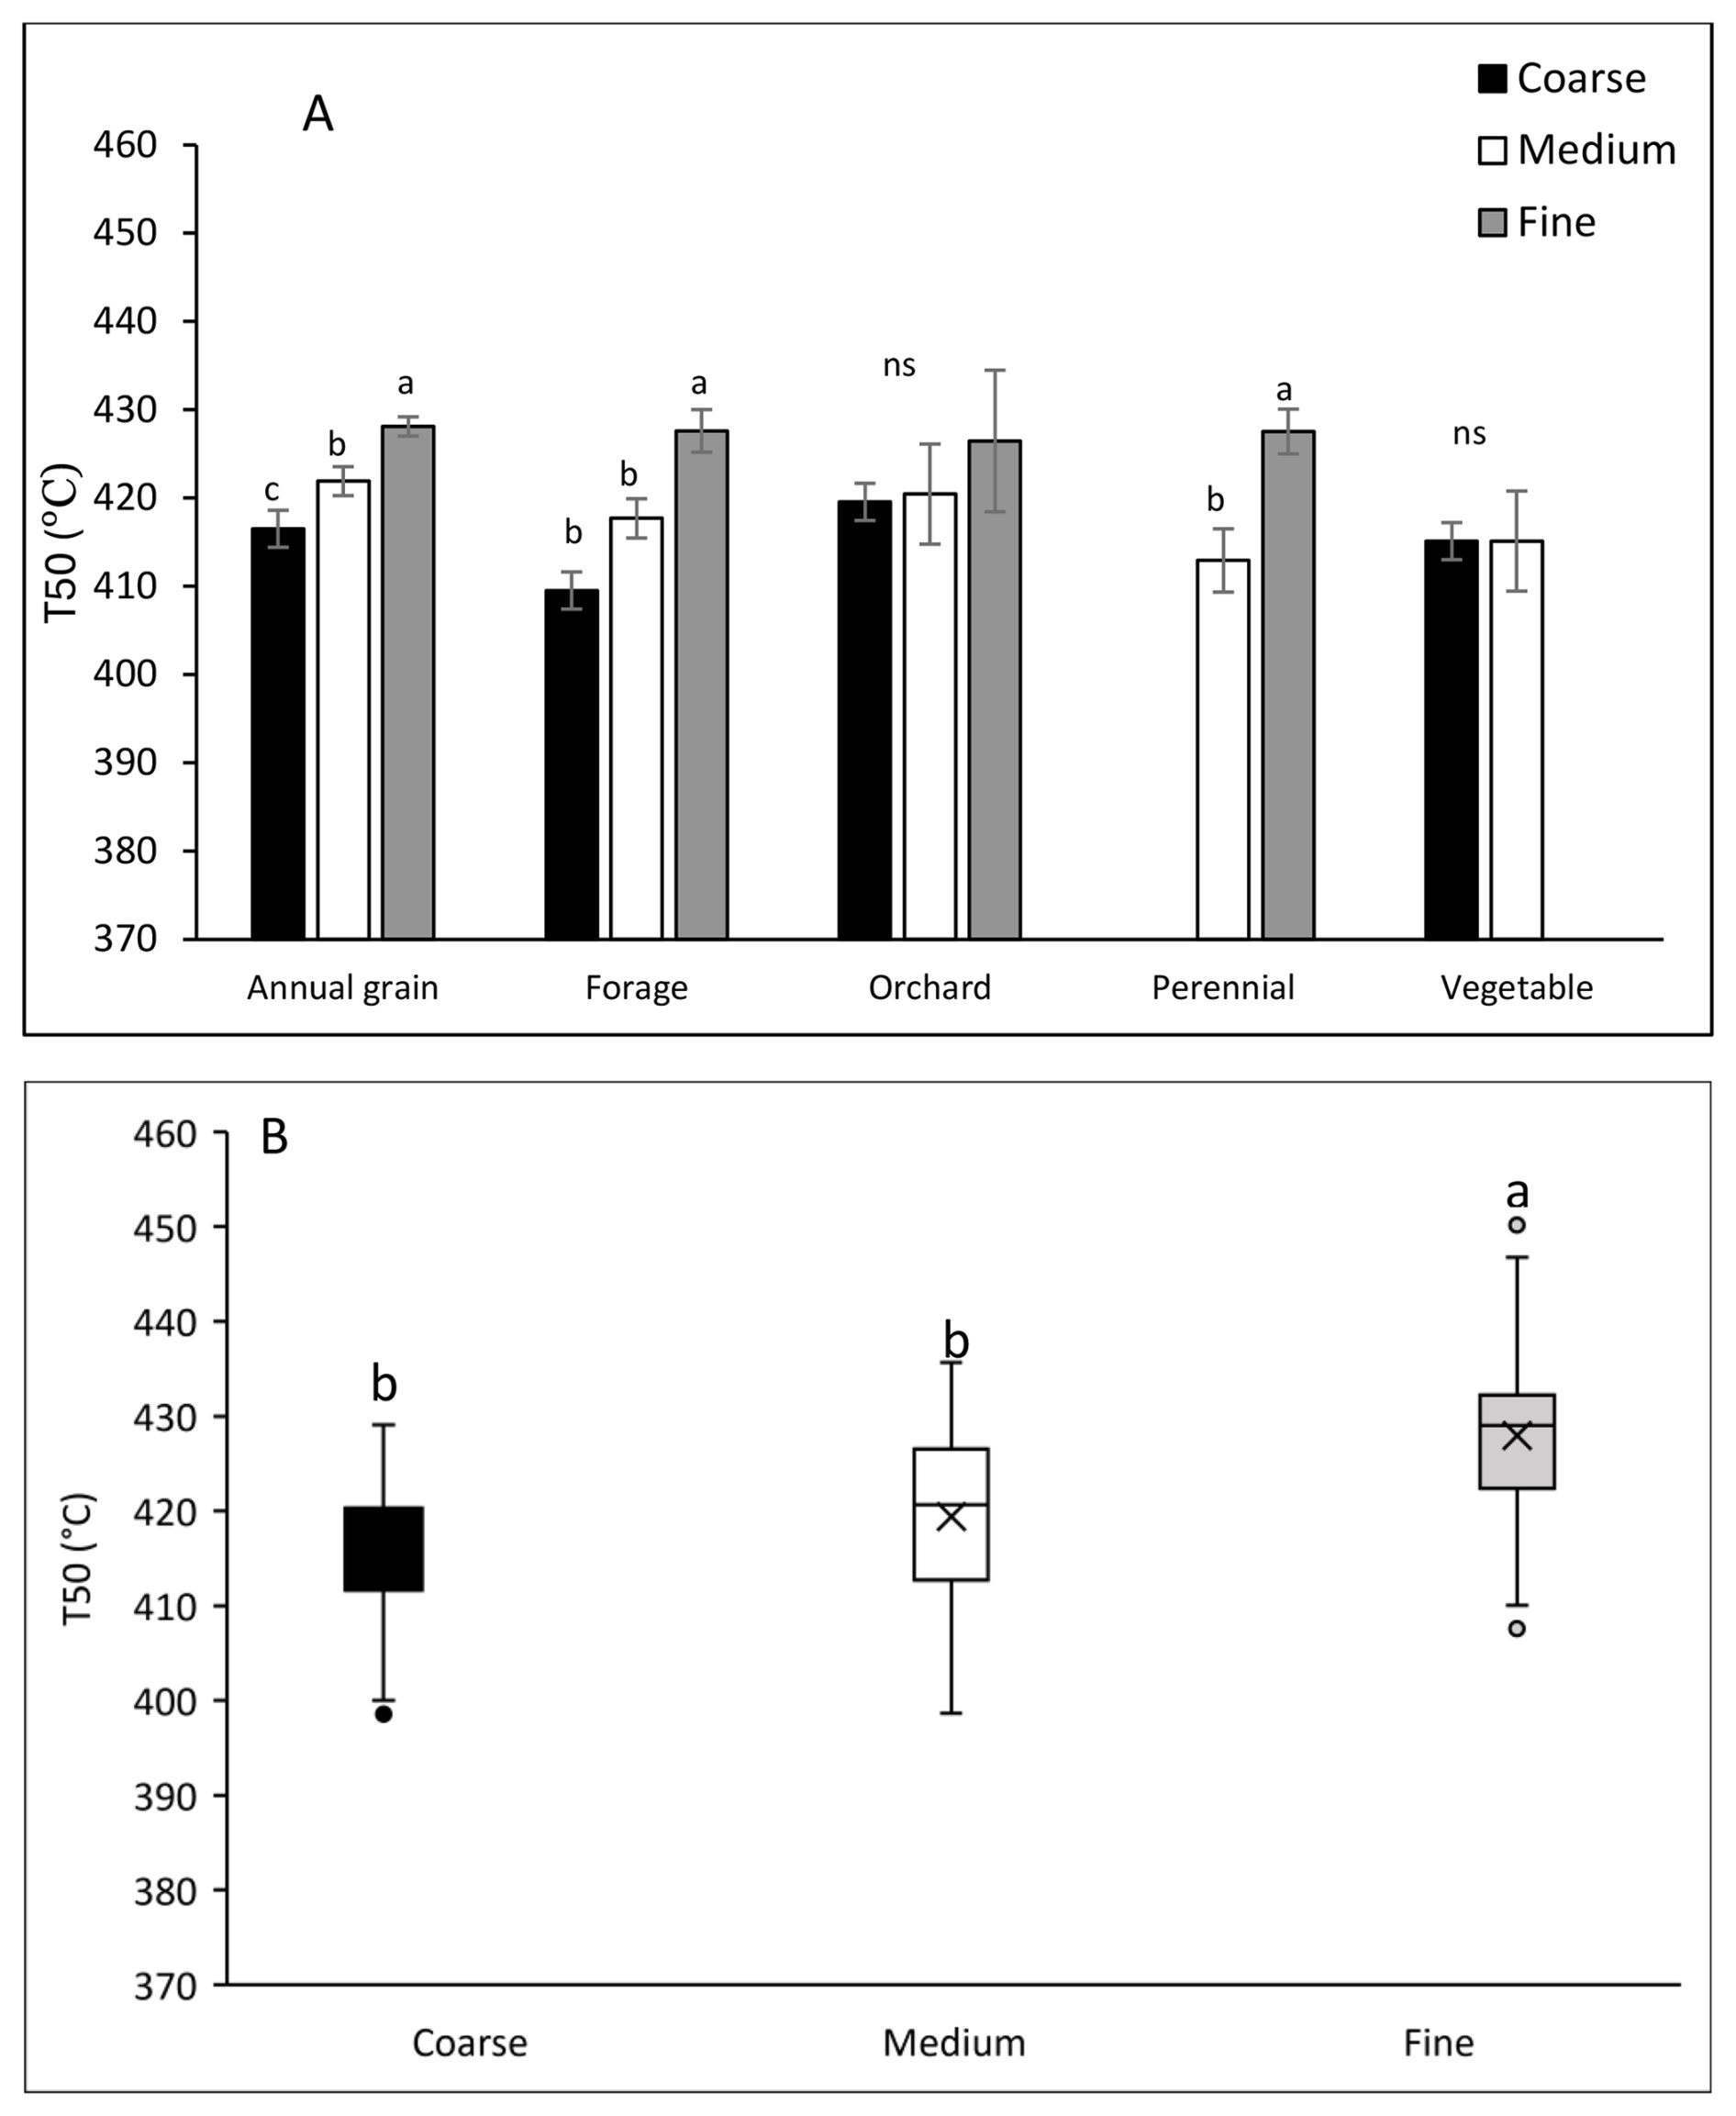
Figure 1Plots of T50 demonstrating differences due to soil textural class within each cropping system category (a) and soil textural classes (b) for the soils in the Ontario Topsoil Sampling Project in 2019 (n=151). Different letters indicate statistically significant differences at P<0.05. ns represents non-significant statistical differences among soil textural classes within the cropping system category.
Table 1Partitioning of variance of soil C indicators * in the Ontario Topsoil Sampling Project database from 2019 to 2022 into soil and crop management, soil texture, and climatic variables.
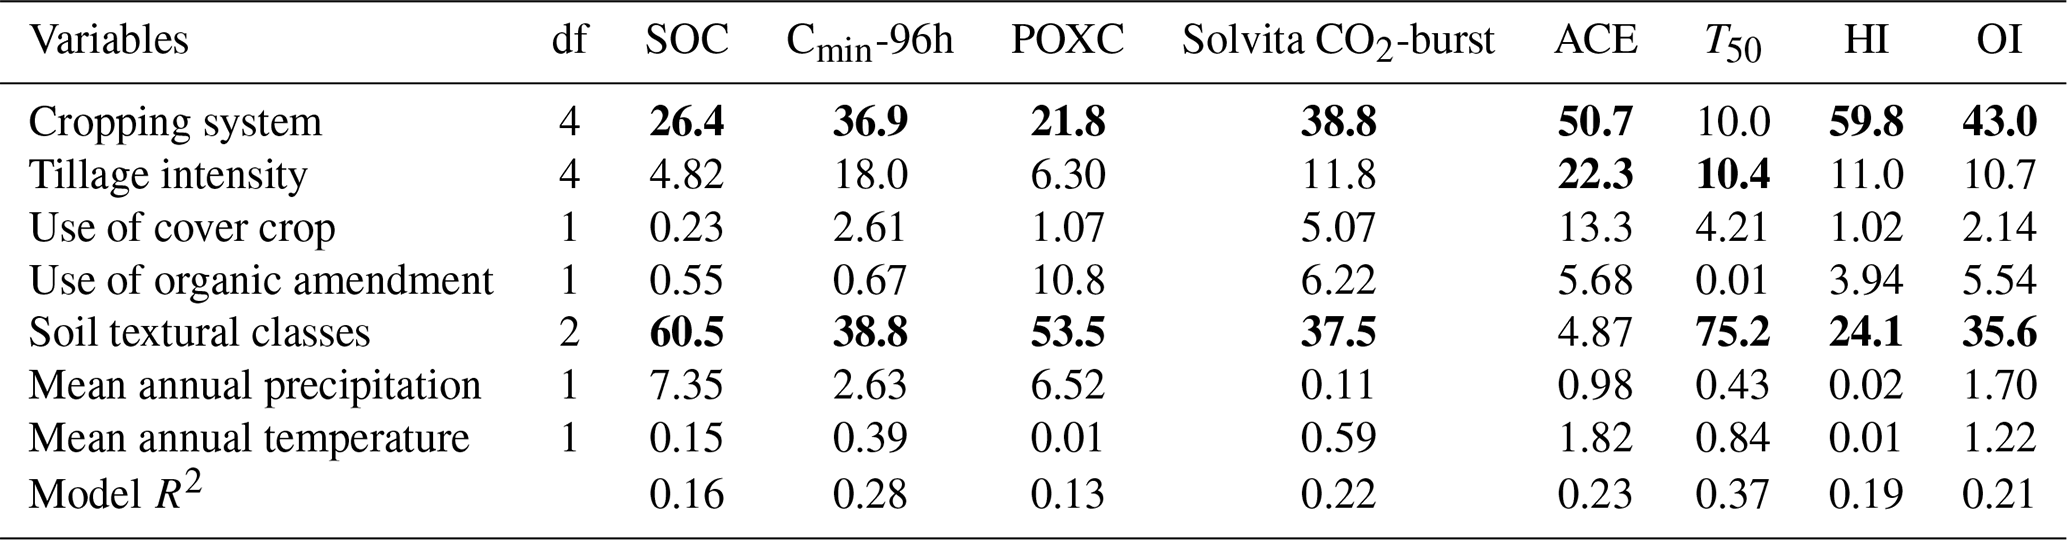
* Number of observations used were: SOC = 1490, Cmin-96h = 1017, Solvita CO2-burst = 768, and POXC = 1413, whereas the number of observations for ACE and programmed pyrolysis parameters (HI, OI, and T50) were 151. SOC = soil organic carbon; Cmin-96h = 96 h carbon mineralization; POXC = permanganate oxidizable carbon; Solvita CO2-burst = 24 h soil respiration test; ACE = autoclaved citrate extractable protein index; T50 = temperature at which 50 % of SOC was pyrolyzed; HI = hydrogen index; and OI = oxygen index. For each soil C indicator, bold font indicates the top two variables explaining the variance.
Table 2Within each soil textural class, variance analysis (P values) of soil and crop management parameters on soil C indicators * analyzed in the Ontario Topsoil Sampling Project from 2019 to 2022.
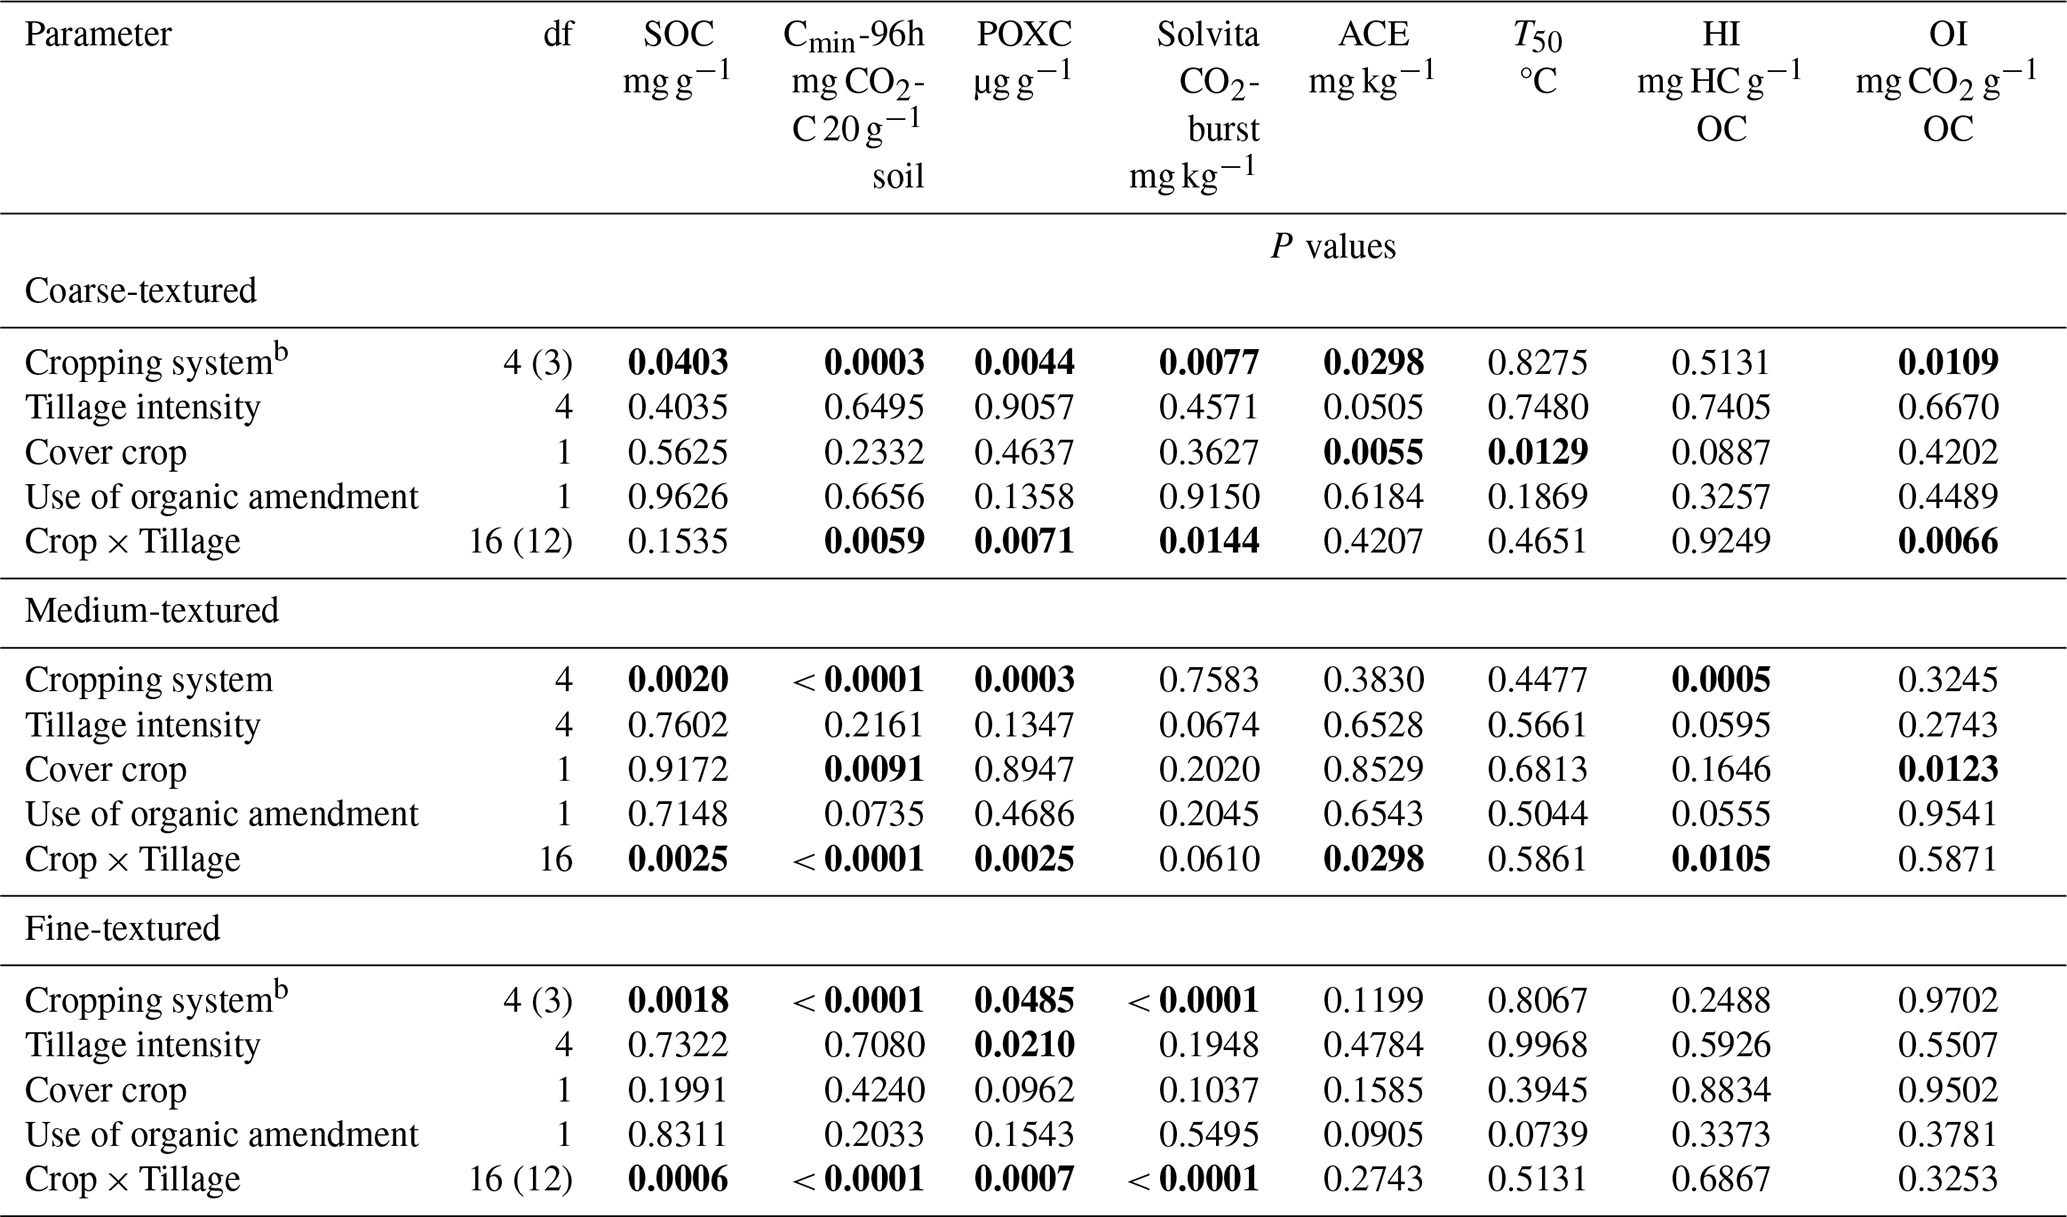
Bold font indicates statistically significant treatment differences at P<0.05. a Number of observations used were: SOC = 1490, Cmin-96h = 1017, Solvita CO2-burst = 768, and POXC = 1413, whereas the number of observations for ACE and programmed pyrolysis parameters (HI, OI, and T50) were 151. b For the coarse and fine-textured soil, number of cropping system categories analyzed for HI, OI, and T50 were 4. For instance, no soil samples were collected from the perennial cropping system in coarse-textured soil and from vegetable system in fine-textured soils. Hence, the degree of freedom for cropping system and interaction between cropping system and tillage treatments was adjusted accordingly in the statistical model. SOC = soil organic C; Cmin-96h = 96 h carbon mineralization; POXC = permanganate oxidizable carbon; Solvita CO2-burst = 24 h soil respiration test; ACE = autoclaved citrate extractable protein index; T50 = temperature at which 50 % of SOC was pyrolyzed; HI = hydrogen index; and OI = oxygen index.
It is important to note that the model R2 values in our study were relatively low ranging between 0.16 to 0.37 (Table 1). This is not unexpected for agronomic studies on SOC that integrate variable land use management practices and complex biochemical processes. The unexplained variance likely reflects the additional variables which were not captured in our model such as the crop residue inputs, soil microbial community composition, and/or the historical land use intensity. Although these variables are known to influence the SOC dynamics, the data on these factors were not consistently available for all the sites studied. Incorporating these variables in the future research might improve the model R2 values; however, the current results still clearly highlight the importance of soil texture as the major predictor of SOC in our study.
Table 2 shows the variance analysis on soil C indicators broken out by texture class and parameter, and Table 3 shows the mean values and groupings. In all soil textural classes, significant differences in SOC, Cmin-96h, and POXC concentration due to cropping systems were observed (Table 2). Perennial and forages when grown with annual crops exhibited greater or comparable SOC concentrations relative to the other cropping systems in all soil textural classes (Table 3). Likewise, forages and perennial systems had greater or comparable concentrations of Cmin-96h and POXC than the remaining systems in all soil textural classes (Table 3). Less soil disturbance due to tillage, greater diversity of crop species, continuous presence of living roots in perennial systems perhaps contributed to the greatest concentration of SOC, Cmin-96h, and POXC observed (Amsili et al., 2021; Congreves et al., 2015; Nunes et al., 2020). Compared to annual grain, perennial and forage systems provide a more temporally consistent (i.e., no fallow period) source of substrate quality to microbial communities mainly due to high C : N ratio, lower lignin content, and high concentration of mineralizable C (Mesgar et al., 2024). For most of the soil C indicators, annual grain, orchard, and vegetable cropping systems had the lowest values (Table 3). Vegetable and annual grain systems are intensively managed with high intensity of tillage and have lower soil C inputs (Norris and Congreves, 2018; Nunes et al., 2020), which negatively impact soil C. Therefore, in all soil textural classes, diversification of cropping systems and addition of organic amendments are critical components of building soil C. While our findings suggest that diversification of cropping systems results in greater soil C, we did not measure the quantity and quality of crop residue inputs, which limits our ability to confirm the exact mechanisms of soil C accumulation in our study. Nevertheless, previous studies by King and Blesh (2018), McDaniel and Grandy (2016) have reported that diversifying crop rotations with cover crops, perennials, or forages tend to increase the quantity and biochemical diversity of soil C inputs than the conventional monocultures (e.g. simple annual grain systems). Similarly, studies by Adhikari and Hartemink (2017) and Presley et al. (2004) demonstrated that adoption of conservational agricultural practices such as reduced tillage, diversified cropping systems and addition of organic amendments contributed to a build up of SOC even on coarse textured soils.
Table 3Within each soil textural class, mean (SE) values of the soil C indicators 2 by the cropping system category sampled in the Ontario Topsoil Sampling Project from 2019 to 2022.
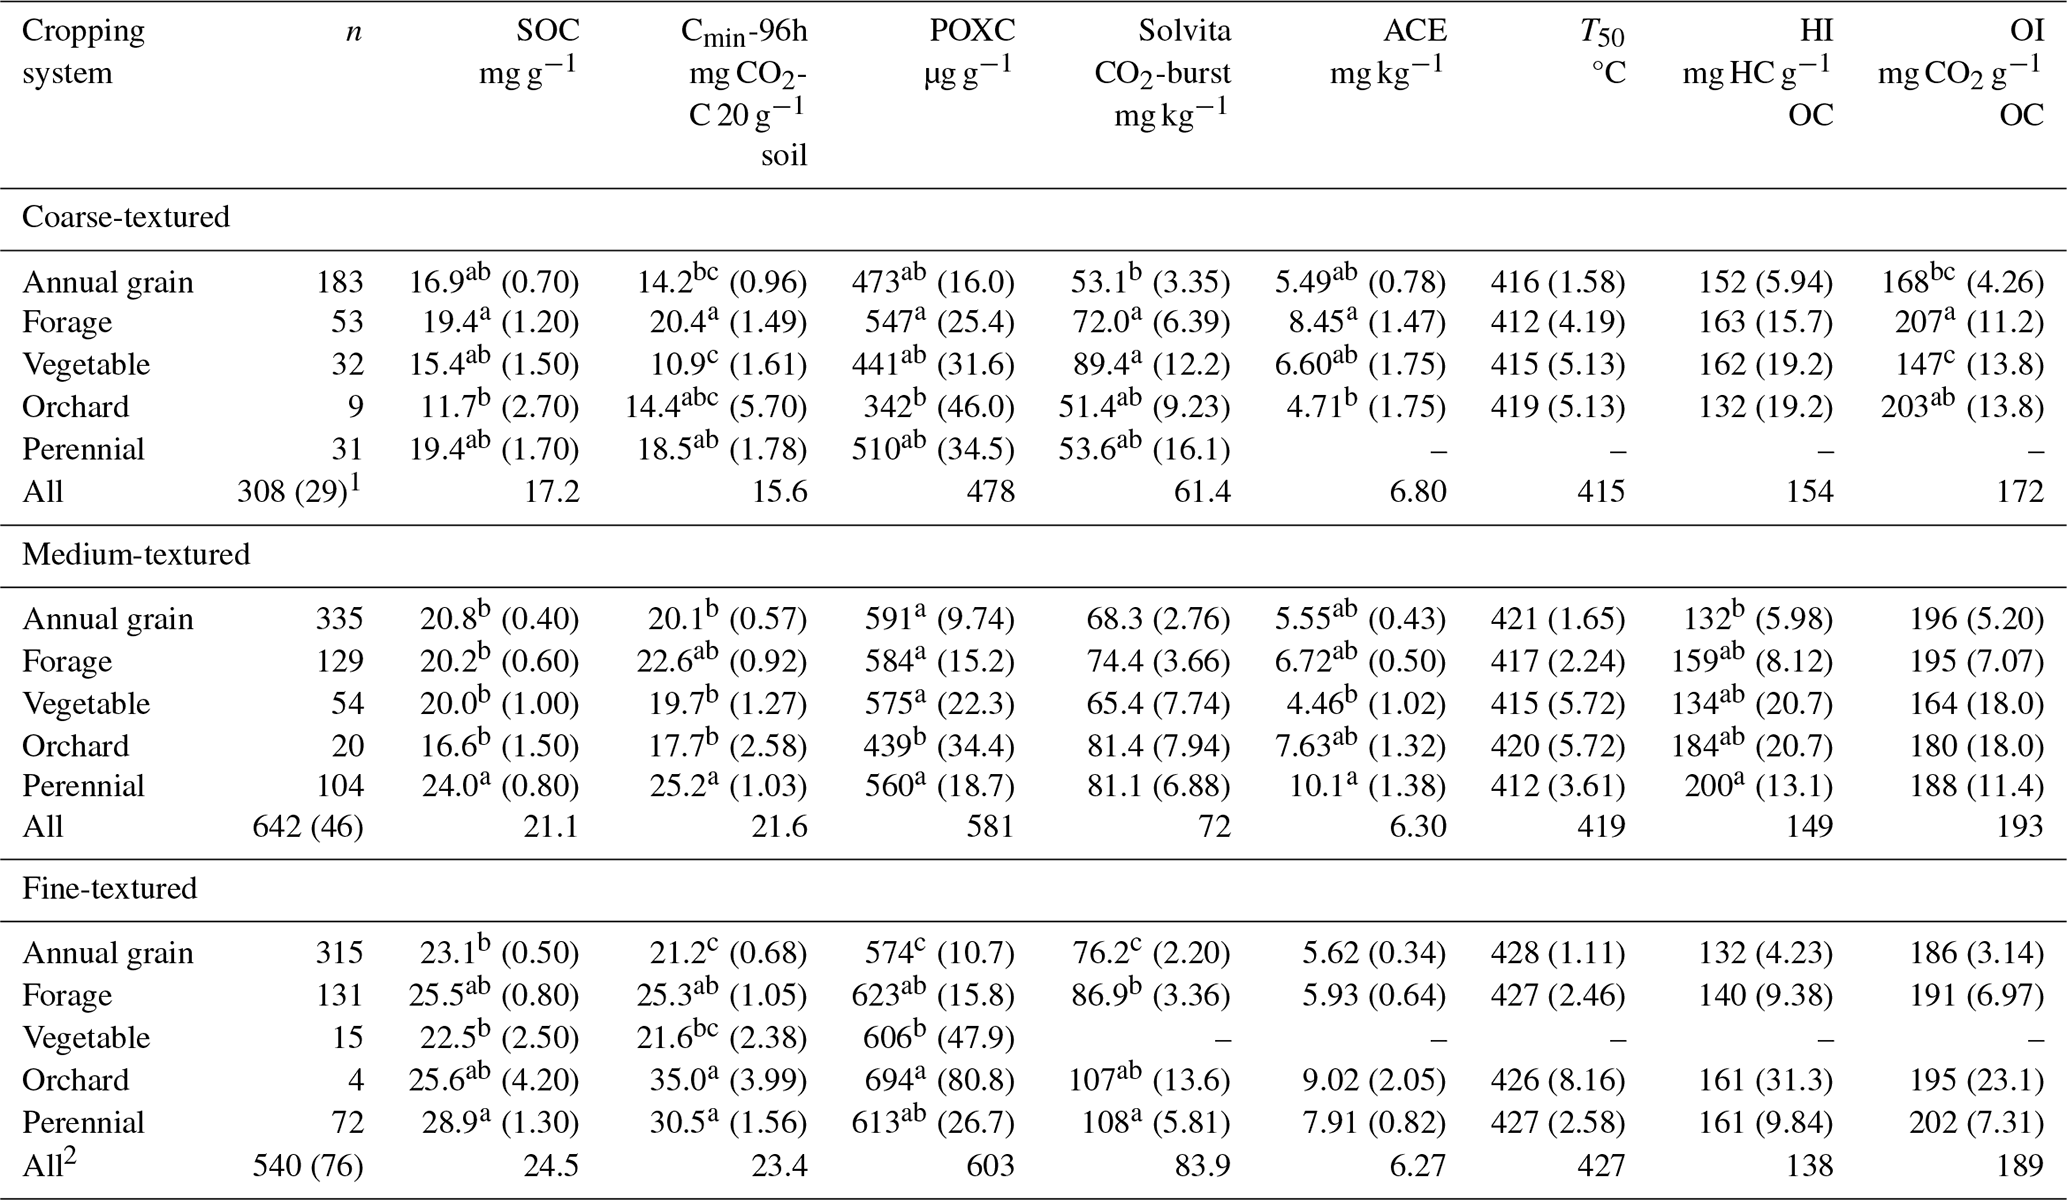
1 The number in the parenthesis represents the number of observations for ACE and the programmed parameters (T50, HI, and OI) in each soil textural class. 2 There were 3 observations within the fine-textured soils for which cropping system details were missing. a–c Within each soil textural class and for each parameter, treatment means followed by a different letter indicate statistical significance at P<0.05. SOC = soil organic carbon; Cmin-96h = 96 h carbon mineralization; POXC = permanganate oxidizable carbon; Solvita CO2-burst = 24 h soil respiration test; ACE = autoclaved citrate extractable protein index; HI = hydrogen index; and OI = oxygen index; – = not applicable.
While T50 was not statistically different due to cropping system and tillage practices in all soil textures (Table 2), annual grain had the highest whereas forage had the lowest T50 when averaged across all soil textures (Fig. 1a). These results suggest that annual grain perhaps contribute to more resistant organic matter additions to soil whereas forage systems might add relatively easily decomposable residue. Usually, forage cropping systems (specifically legumes) have a higher residue quality (high biomass N and low C : N) and result in larger proportion of labile fractions of soil C. Mesgar et al. (2024) found similar results where crop rotations with forages (such as alfalfa or red clover) contributed to labile components of soil C. Furthermore, fine textured soils had the highest whereas coarse and medium textured soils had the lowest T50 (Table 3 and Fig. 1b), confirming that the soil texture and clay content influence the thermal stability of soil organic matter. It is likely related to the greater organo-mineral associations in clay rich fine textured soils than the coarse textured soils, which contributed to the protection of soil organic matter from microbial decomposition and increase its thermal stability. Previous studies by Simkovic et al. (2025) and Stoner et al. (2023) have also confirmed a positive relationship between clay content and stabilization of soil organic matter.
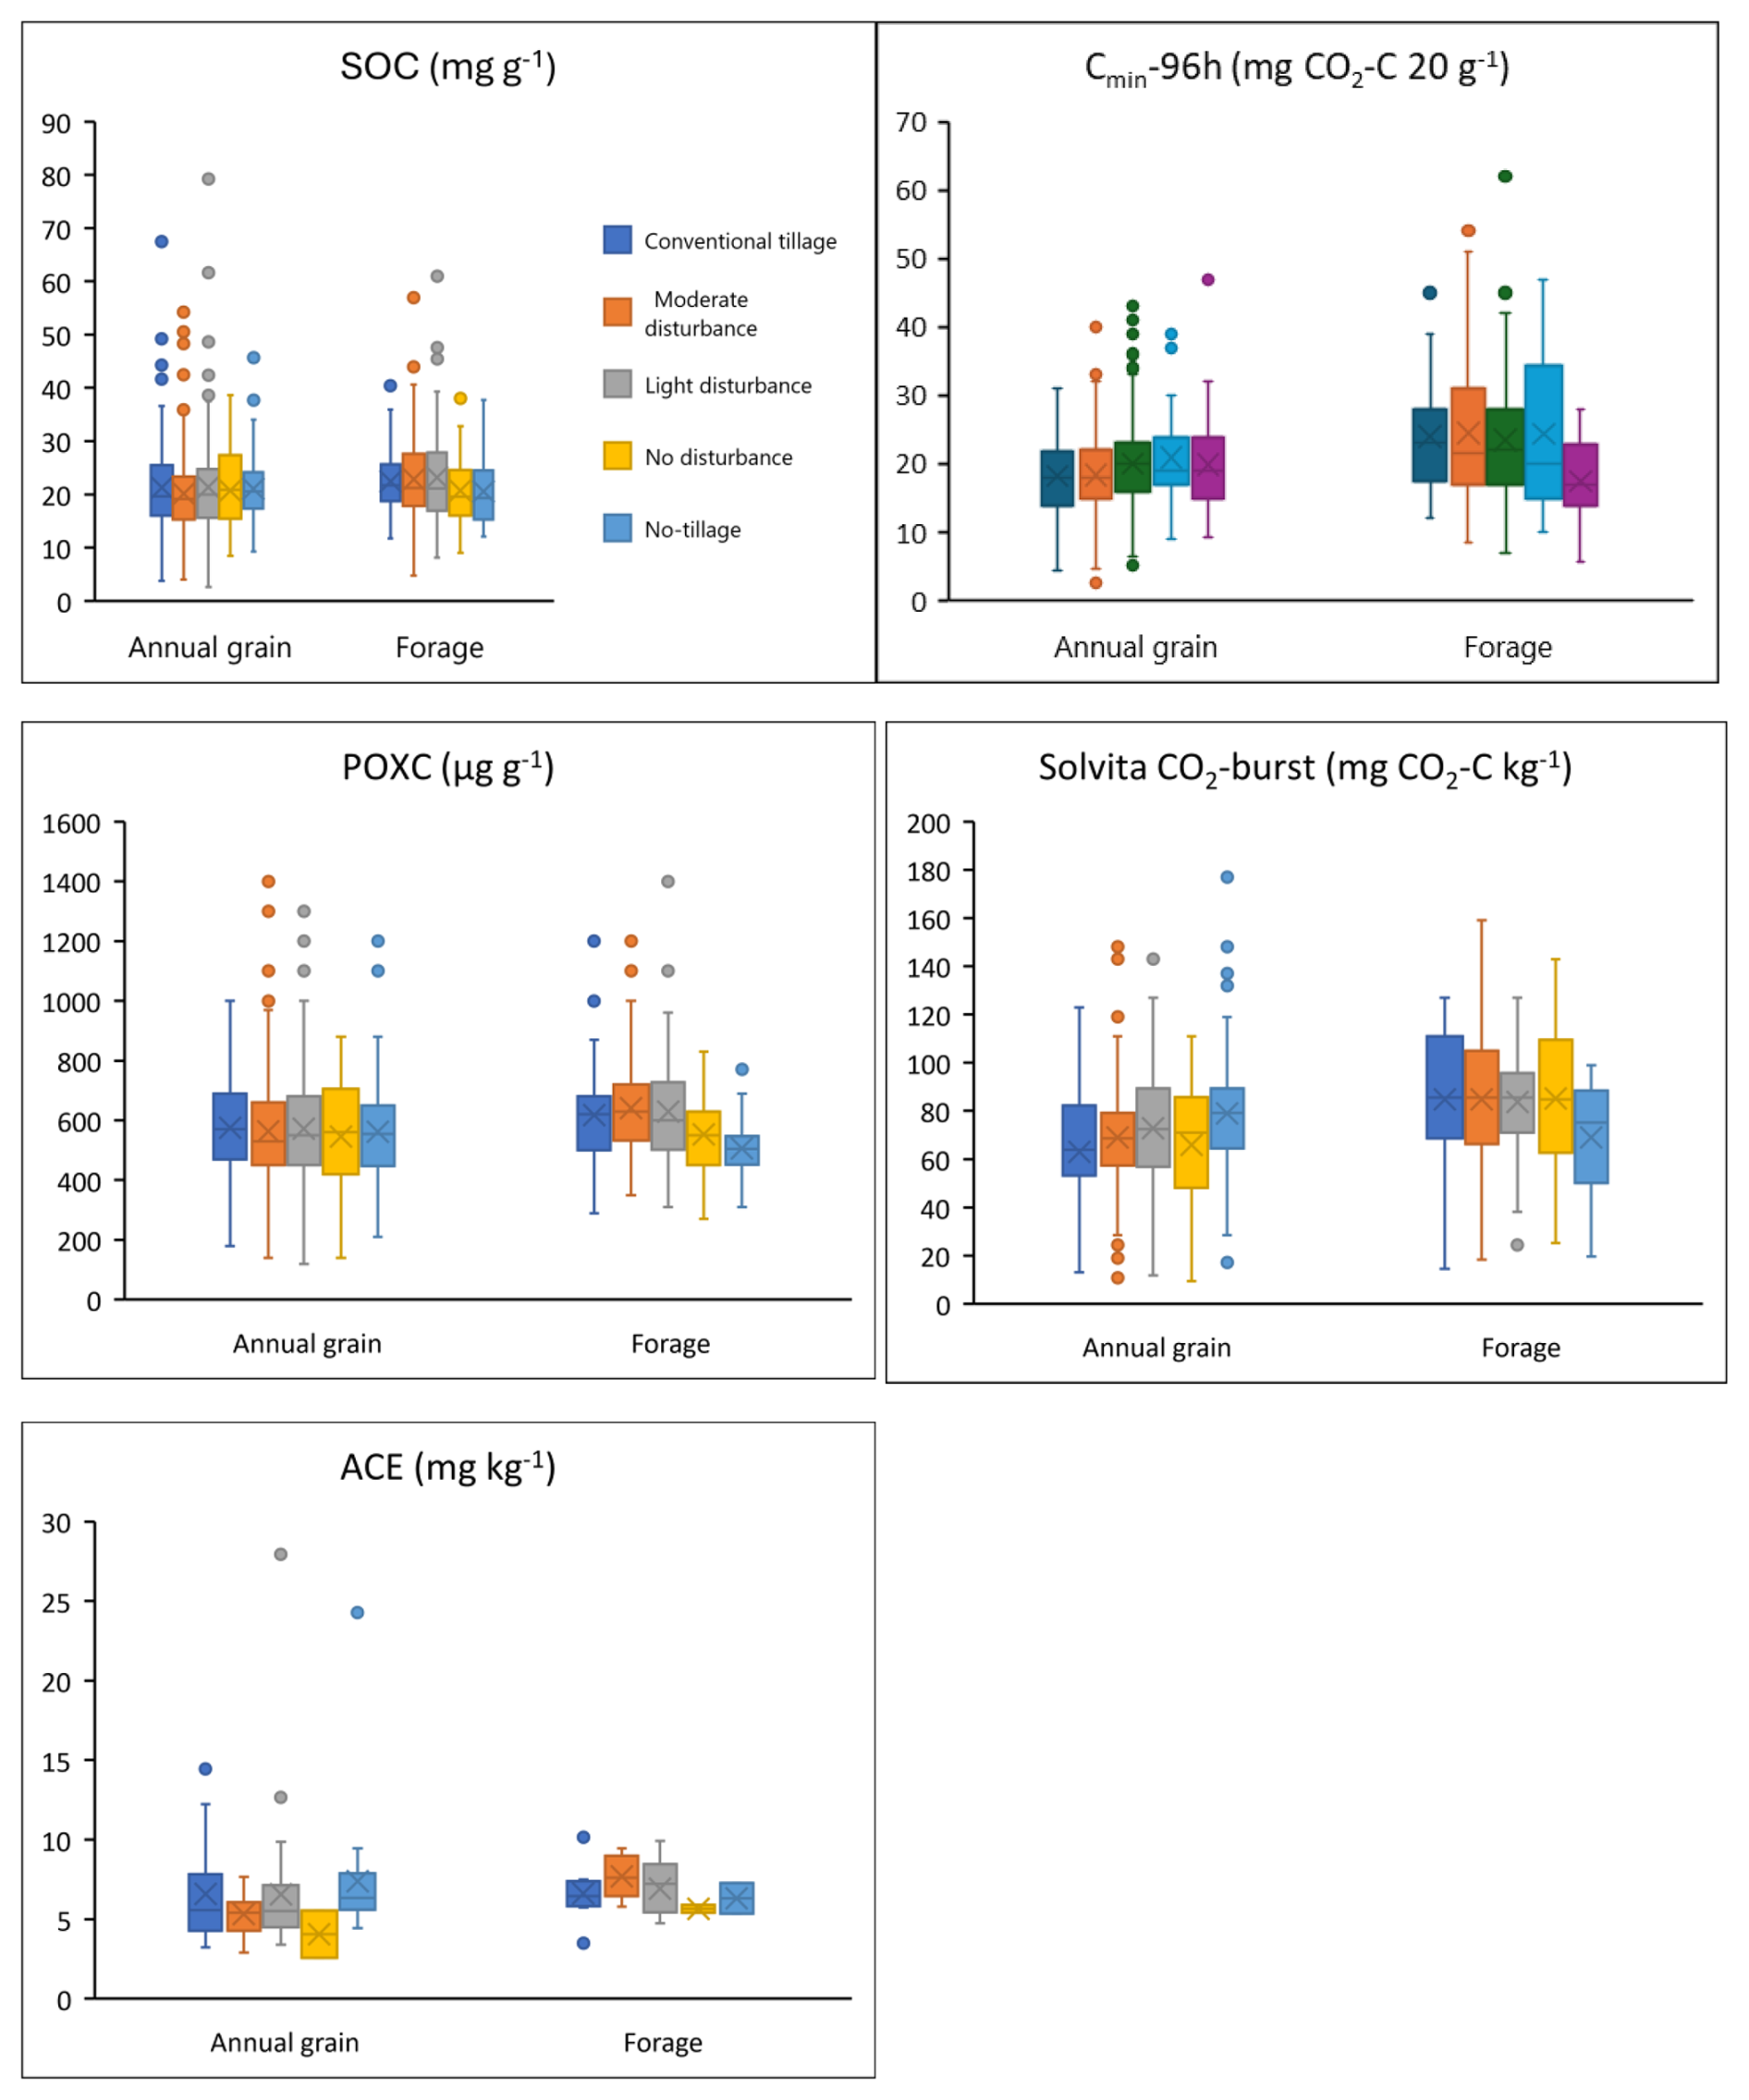
Figure 2Box plots demonstrating the interactive effects of cropping system category and tillage intensity on soil C indicators sampled in the Ontario Topsoil Sampling Project from 2019 to 2022. SOC = soil organic carbon; Cmin-96h = 96 h carbon mineralization; POXC = permanganate oxidizable carbon; Solvita CO2-burst = 24 h soil respiration test; ACE = autoclaved citrate extractable protein index. Due to insufficient number of observations, data for other cropping systems not shown.
The other thermal-based parameters of soil C characterization were the HI and OI, which represented the maturity level of soil organic matter. Typically, a high HI represents a thermally labile pool of organic matter which is enriched with hydrogen and the freshly added carbohydrates and lignin (Mesgar et al., 2024). Conversely, OI represents a more resistant pool of organic matter following the oxidation processes occurring during the soil organic matter decomposition (Carrie et al., 2012; Mesgar et al., 2024; Saenger et al., 2013). Simultaneous reduction in both the HI and OI indicates aromatization. The HI was not different among the agronomic management practices in coarse and fine textured soils, but significant differences were observed in medium textured soil. Among the cropping systems in medium textured soils, perennial (200 mg HC g−1 OC) had greatest while annual grain (132 mg HC g−1 OC) had the least HI (Table 3). These results confirm that the diversified cropping systems with forages and perennial crops had a higher quantity and quality of H-rich labile components of soil organic matter and represented a more labile state of organic matter decomposition than the intensively managed systems with less C inputs (Ding et al., 2006; Mesgar et al., 2024). Furthermore, differences in OI due to cropping system were detected in coarse textured soil only (Table 2). Orchard (203 mg CO2 g−1 OC) had greatest whereas vegetable (147 mg CO2 g−1 OC) had the least OI in coarse textured soils; suggesting that the orchard systems represent a more advanced state of soil organic matter decomposition than the other cropping system categories.
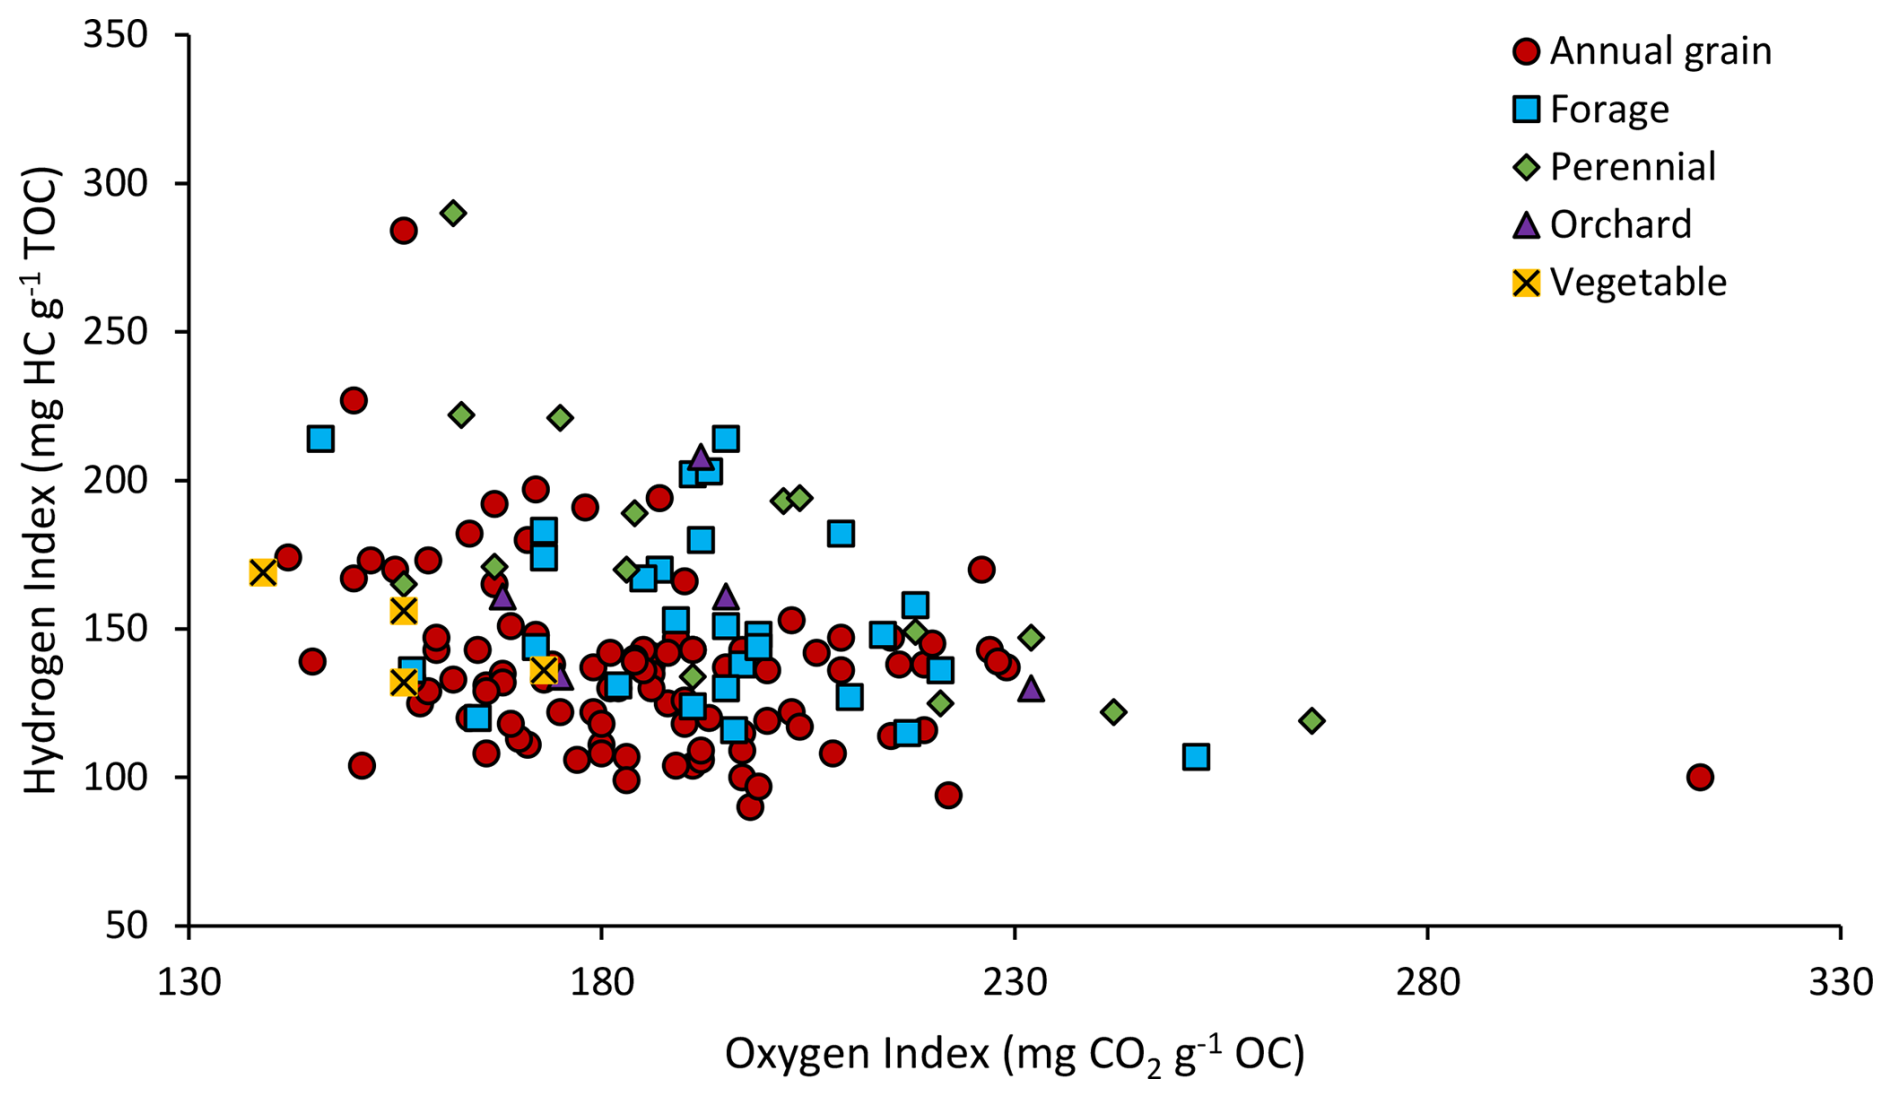
Figure 3Pseudo van Krevelan diagram from programmed pyrolysis data for soils indicating cropping system category sampled in the Ontario Topsoil Sampling Project in 2019 (n=151).
A significant interaction between cropping system and tillage intensity was detected for some of soil C indicators in all soil textural classes (Table 2), but trends varied among indicators and texture. For the thermal based soil C indicators, significant interaction between cropping system and tillage intensity was observed for the HI in medium-textured soil and for OI in coarse textured soil (Tables 2 and S1–S4 in the Supplement). Given that the annual grain and forage cropping systems showed the strongest contrast for these indicators with sufficient number of observations, we selected only these two cropping systems to evaluate the effects of tillage intensity (Fig. 2, Table S1). In coarse-textured soils, Cmin-96h, POXC and Solvita CO2-burst concentrations were significantly impacted by the intensity of tillage adopted in annual grain and forage systems, while the remaining indicators were comparable across all the tillage and cropping system combinations (Table S1). In medium-textured soils, all soil C indicators except Solvita CO2-burst had a significant interaction between cropping system and tillage intensity (Table S1). In fine textured soils, all but ACE were significantly different among the cropping system and tillage treatment combinations (Table S1). Therefore, medium and fine textured soils had a greater number of interactions than coarse textured soils. One possible mechanism might be that fine textured soils have high clay content which stabilizes soil C via mineral adsorption and formation of microaggregates. Fine textured soils also promote and support diverse soil microbial communities which play a critical role in supporting the complex microbial mediated soil C transformation processes (Six et al., 2002). In contrast, coarse textured soils have lower surface area, lower water holding capacity, and less soil microbial activity, which perhaps contributed to lesser number of detectable interactions between the management practices on soil C indicators. Overall, the significant interaction of cropping system with tillage demonstrates that the changes in soil C pools brought on by various tillage intensity treatments is dependent on the type of the crop species grown and the soil texture. Similar interactive effects of tillage and cropping system on soil health were reported by Angon et al. (2023).
A pseudo-Van Krevelen diagram was created by plotting HI against OI (Fig. 3) to visually characterize the composition of soil organic matter across various cropping systems (Carrie et al., 2012; Mesgar et al., 2024). We found that most of the orchard systems have oxygenated products and represented the more stable pool of soil organic matter whereas for vegetable systems, the organic matter composition mainly consisted of hydrogenated products and was associated with a less advanced stage of organic matter decomposition (Fig. 3). While the visual representation of HI vs. OI between both systems (i.e. vegetable and orchards) may appear similar due to variability and sample size, the underlying data distribution supports our interpretation (Fig. 3). Interestingly, the OI values for vegetable systems were not significantly different than the annual grain systems in coarse textured soils (Table 3), suggesting that the slow decomposition of organic matter in vegetable systems is dependent on the soil texture and agronomic management practices followed. For the remaining systems, points found closer to the origin, such as in the annual grain site data, suggests that organic matter structures are undergoing aromatization processes compared to sites with forages or with perennial crops.
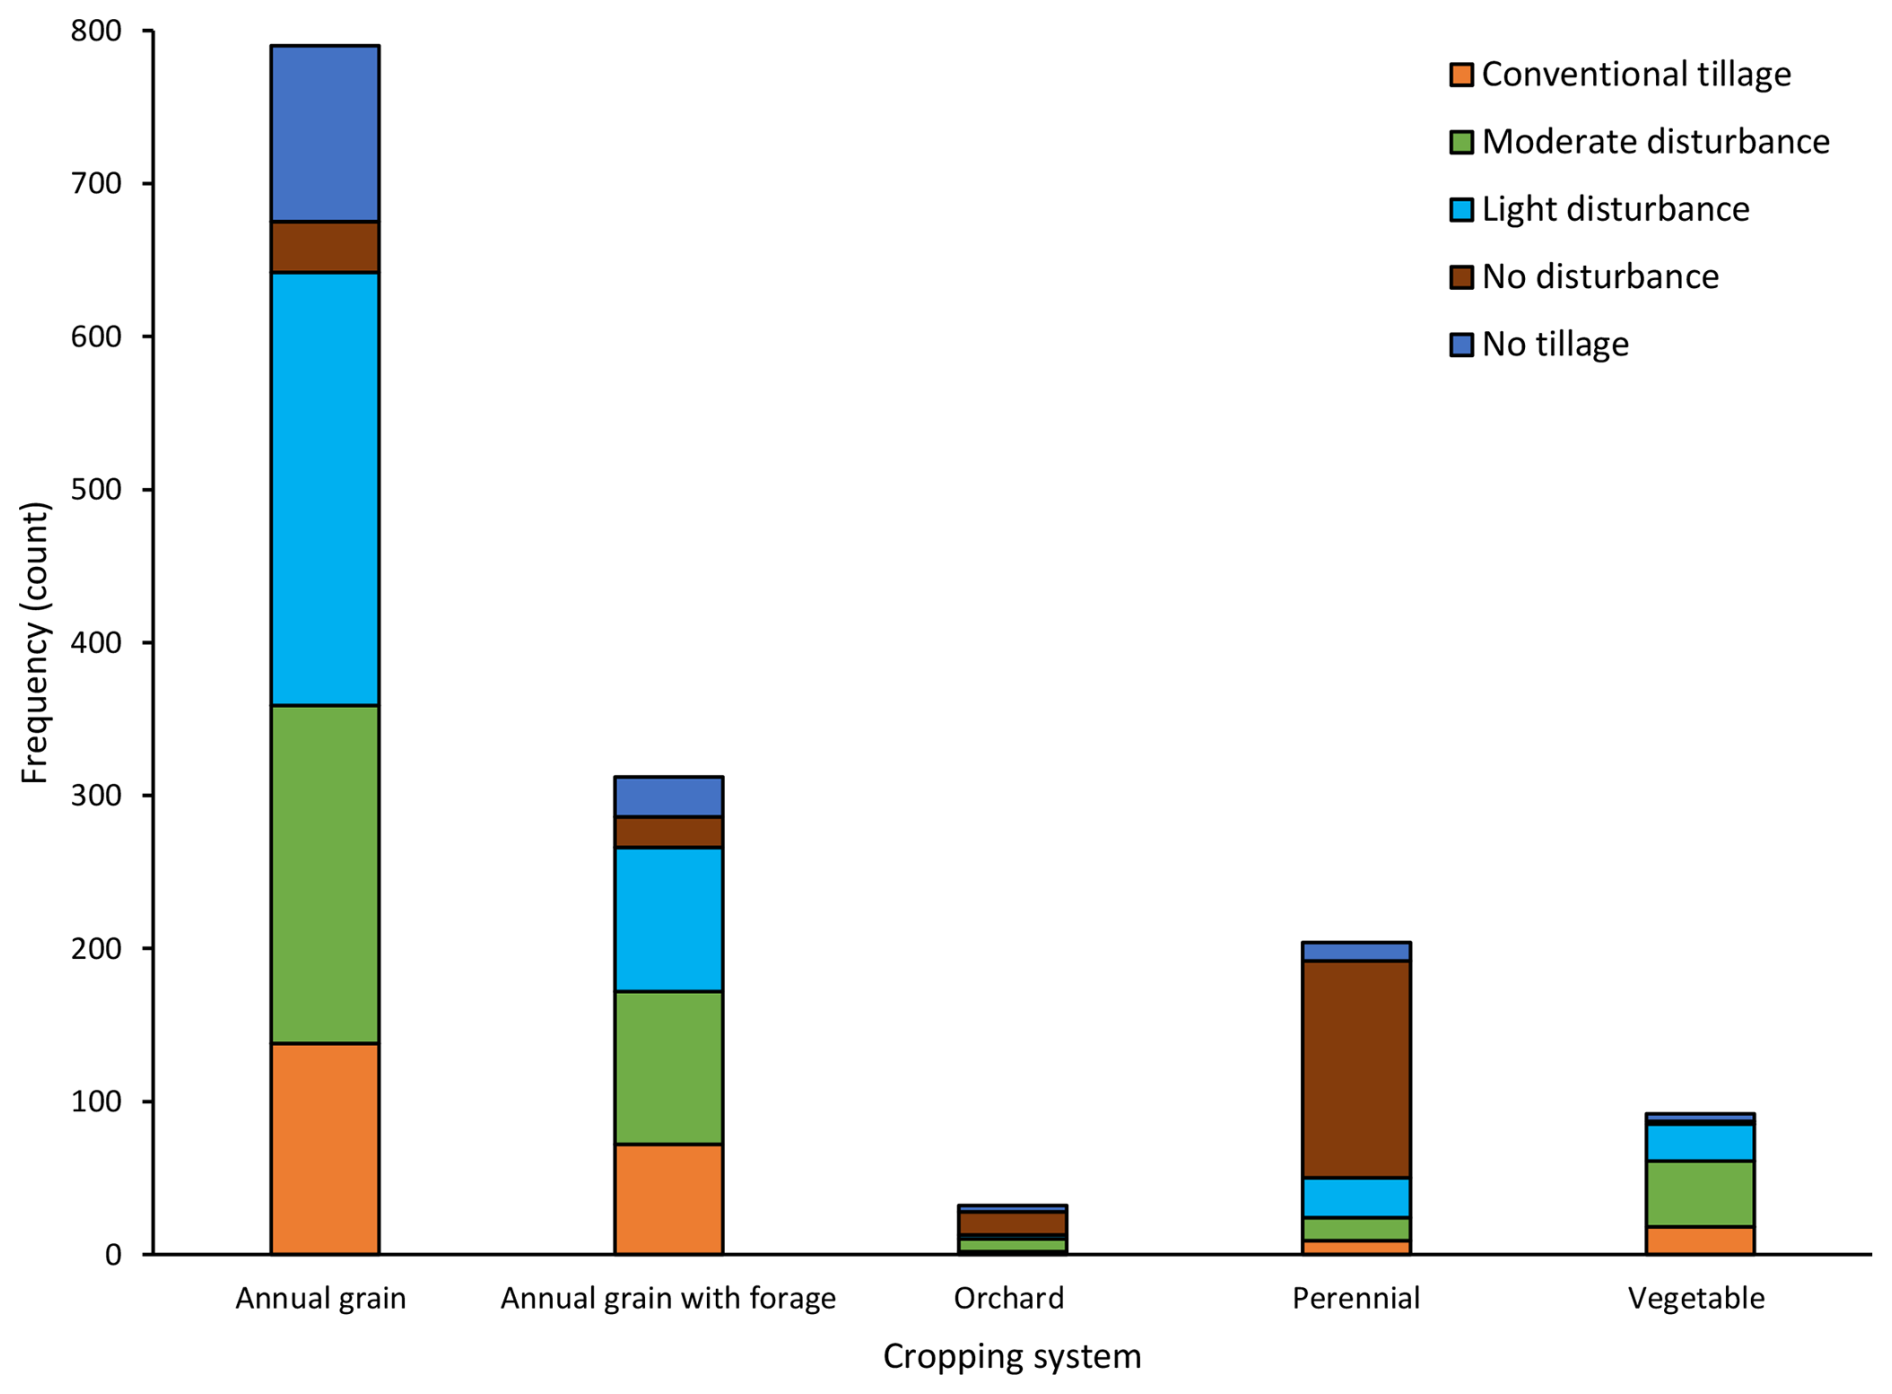
Figure 4Frequency distribution of soils partitioned by tillage intensity within each cropping system category sampled in the Ontario Topsoil Sampling Project from 2019 to 2022. Conventional tillage represents the plow tillage in our study. No disturbance represented little to no soil movement and was associated mainly with pastures and perennial forages.
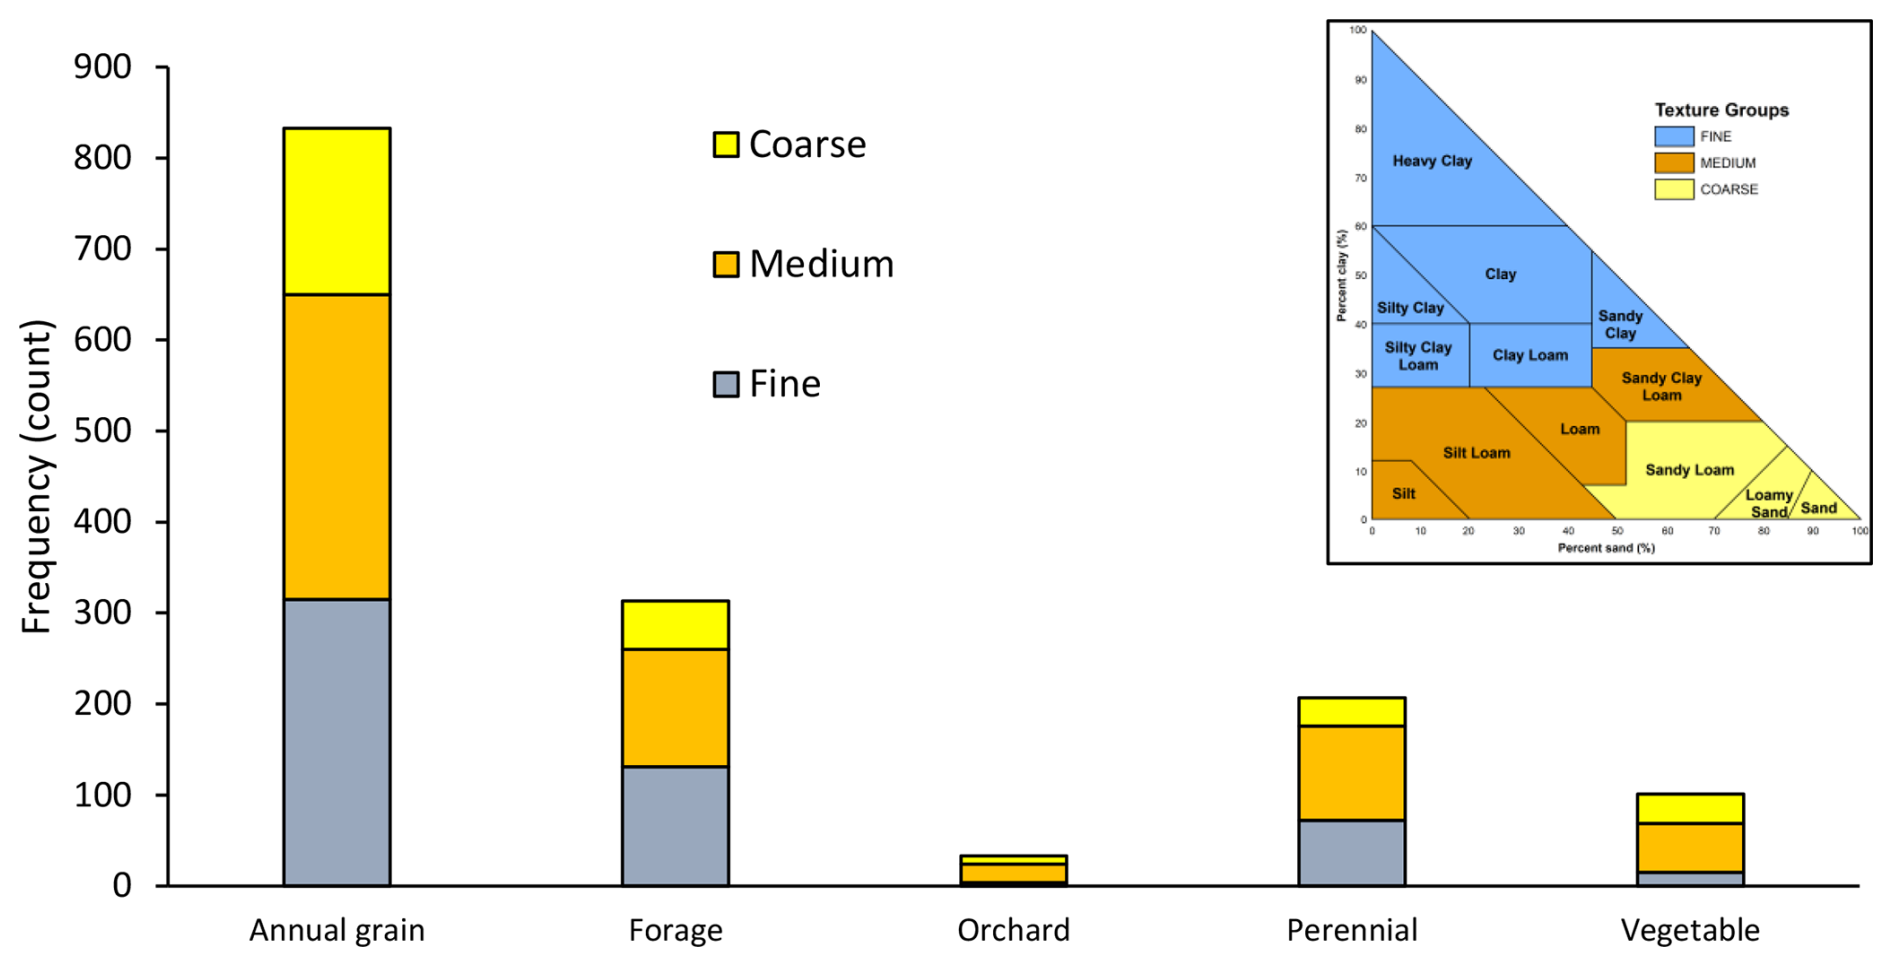
Figure 5Frequency distribution of soils partitioned by soil textural classes within each cropping system category sampled in the Ontario Topsoil Sampling Project from 2019 to 2022.
It is important to note that the frequency count of observations within the various tillage intensity classes among the cropping system categories was not equal nor balanced (Fig. 4) but are reflective of typical management practices employed within the various cropping systems. For instance, and as expected, the number of observations collected from the “no disturbance” category was greatest in perennial systems (n=142, Fig. 4). Vegetable (n=5) and orchard (n=4) cropping systems had the least number of observations for no-tillage (Fig. 4). Orchards had the least number of total observations (n=33, Fig. 4), which is consistent with Ontario agriculture census data where orchards represent 7.03 % of farmland (Fruit and Vegetable Survey, Statistics Canada 2023). Furthermore, the frequency count of samples collected from coarse textured soils (n=308) was lower than medium (n=642) and fine textured soils (n=540, Fig. 5) which is largely attributed to glacier deposits that shaped the region and the topography where more sand on top and less fine particles as they are more prone to loss due to erosion. While clearly reflective of Ontario soils and agriculture, the discrepancy in the count of observations suggests the need to be cautious in directly attributing the results to a system.
3.2 Relationships of soil C indicators with agronomic and pedoclimatic variables
Principal component analysis was conducted where first and second PCs explained 32 % and 17 % of the variance in the data, respectively. Based on the PCA, soil C indicators and the measures of SOC quality (HI and OI) were closely associated with the cropping system, MAP, and organic amendments, and were negatively associated with MAT (Fig. 6), suggesting a higher value for soil C indicators under cooler temperatures. Although precipitation and organic amendments did not explain a large amount of variance in our dataset (Table 1), the PCA demonstrated that the soil C indicators increased with an increase in precipitation (Fig. 6). It is important to note that PCA and variance component analysis differ in both the statistical structure and objectives, which perhaps led to differences in the results between both approaches. For instance, variance analysis evaluates the independent effect of each predictor variable on soil C indicators, whereas PCA simultaneously assesses the covariance among the multiple soil C indicators. Climate has been a key determinant of soil C (Jenny, 1941). The interactions among the soil microbes, crop residues, and plant root exudates mainly control the influence of climatic variables on soil C (Schmidt et al., 2011). Our results of high values of soil C indicators with an increase in MAP and decrease in MAT were consistent with studies conducted in North America (Burke et al., 1989; Liptzin et al., 2022) and globally (Jobbágy and Jackson, 2000). While relationships of soil C indicators with temperature and precipitation were consistent with expectations, it was surprising to see an effect given the relative minimal differences within the province. In Ontario agricultural zones, MAT varies by only 1 °C, and MAP by approx. 100 mm. Given current climate change predictions, these results have powerful implications for C sequestration and soil functioning under future climate conditions.
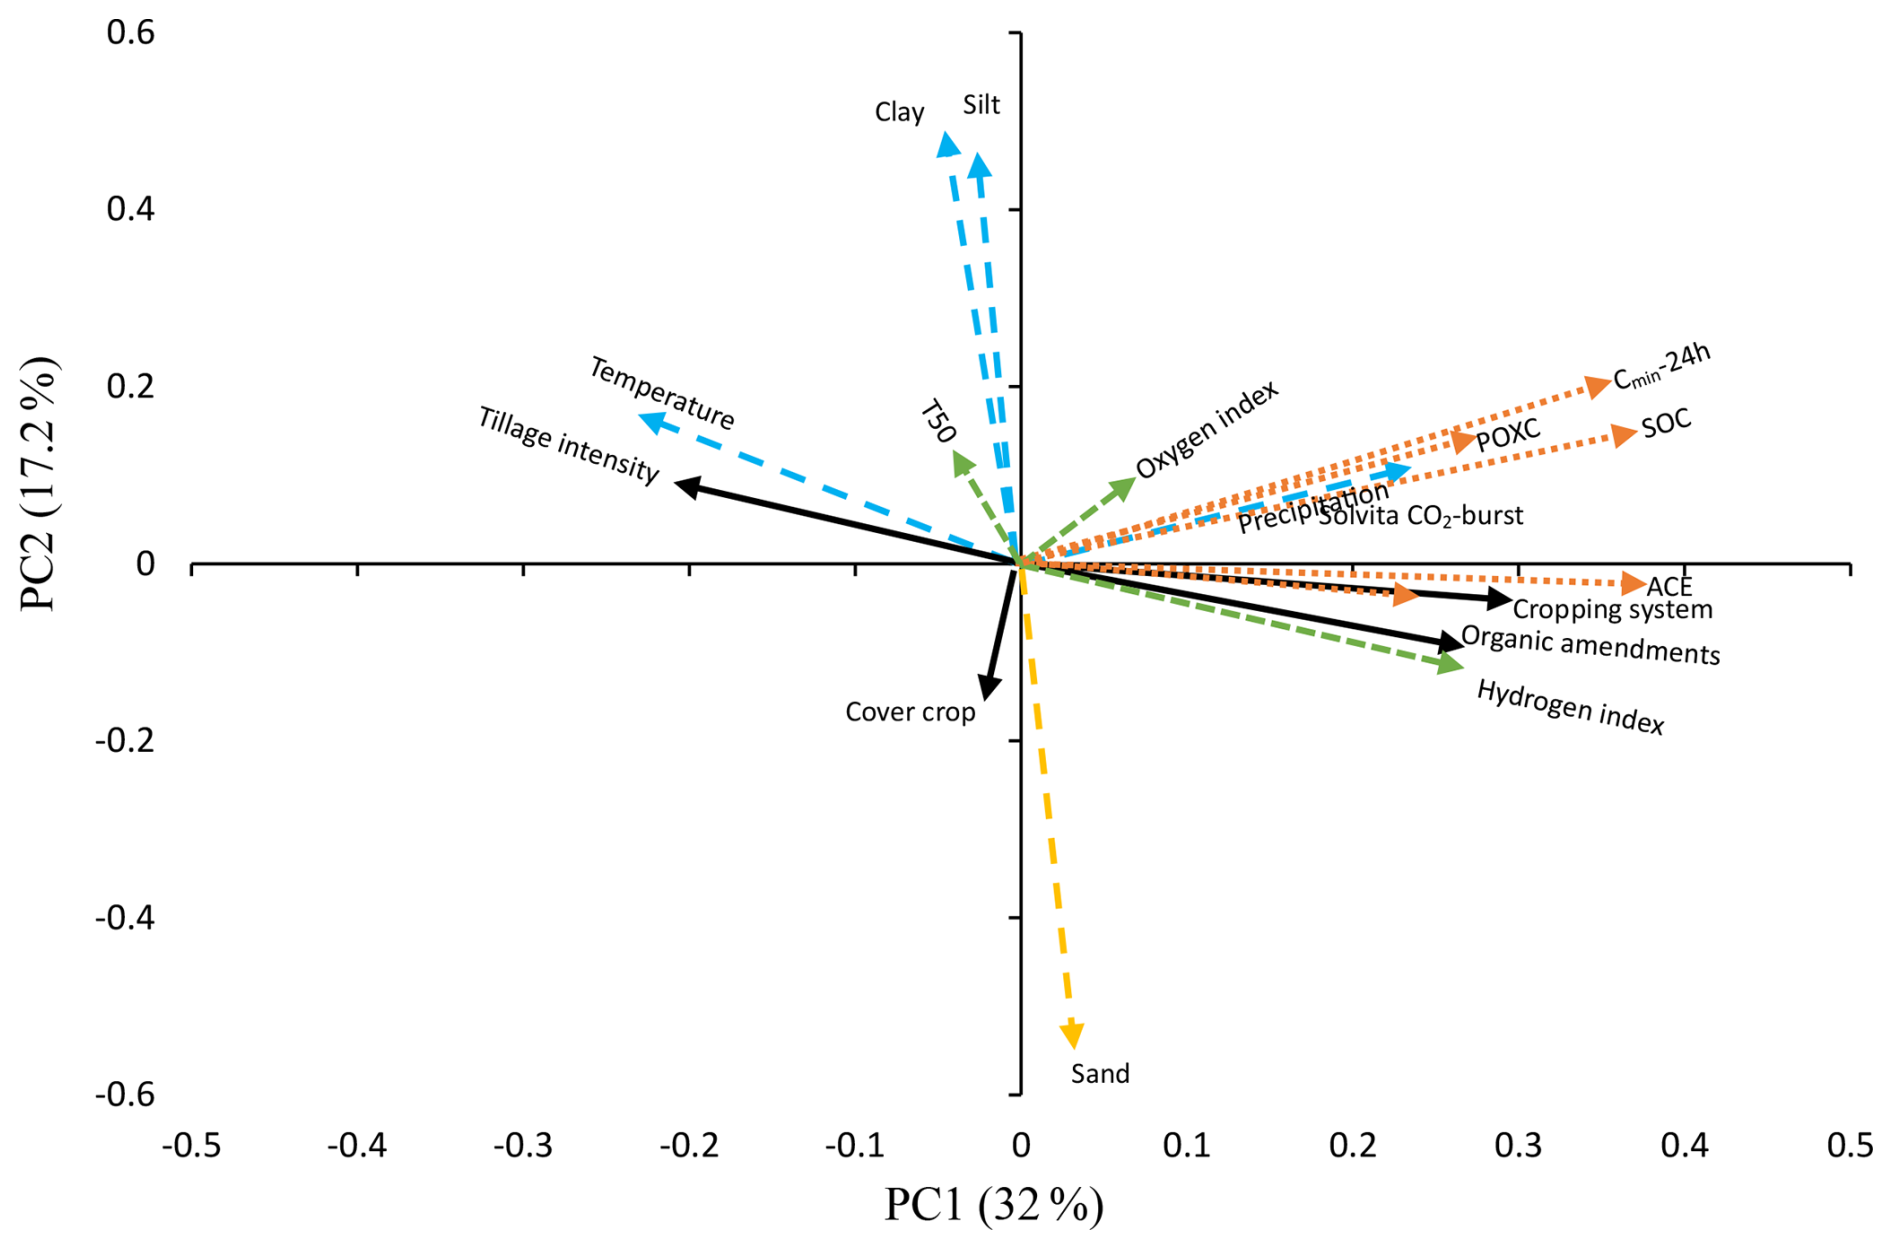
Figure 6Principal component analysis (PCA) demonstrating relationships between site characteristics (blue dash-line vectors), management practices (black solid-line vectors), soil C indicators (orange dash-line vectors), and programmed pyrolysis parameters (green dash-line vectors) sampled in the Ontario Topsoil Sampling Project from 2019 (n=151). ACE = autoclaved citrate extractable protein index; Cmin-96h = 96 h carbon mineralization; POXC = permanganate oxidizable carbon; SOC = soil organic carbon; and Solvita CO2-burst = 24 h soil respiration test.
Furthermore, silt and clay content were clustered together in PCA on one side of the second axis whereas sand content was positioned on the opposite side of the second axis (Fig. 6). This result was consistent with the well-established associations between soil C dynamics and soil texture where soils rich in clay content have higher C retention capacity than coarse textured soil (von Lützow et al., 2006). Accordingly, the positive loading displayed by the clay and silt rich soils on the second axis corresponds to greater values of soil C indicators observed in our study. Although important, the relationship between soil texture and soil C indicators (particularly POXC and respiration) has not been explored enough in the literature (Nunes et al., 2020; Sinsabaugh et al., 2008).
Soil C indicators and HI were negatively associated with tillage intensity on the first PC axis (Fig. 6). Increase in tillage intensity reduces soil C (mainly the topsoil C) by increasing the mineralization of soil organic matter, disrupting the soil structure, and decreasing soil microbial populations and communities (Nunes et al., 2020). Therefore, adopting reduced or minimum tillage practices might contribute to building soil C and help to mitigate the negative impacts of climate change. Numerically greater SOC concentration observed with reducing tillage intensity in our study suggests the potential of the sustainable land use management practices on sequestering C, reducing CO2 emissions, and mitigating the global warming effect (Melland et al., 2017) and greenhouse gas emissions (Mangalassery et al., 2014).
Except POXC in fine-textured soils, we did not find a significant effect of tillage intensity on soil C indicators (Tables 2 and S5). It is important to note that in our study, the participants were asked to choose one of the tillage intensity categories, which might have caused a variability in the recorded data (i.e. descriptive terms and actual disturbance on the farm) and might not be a true reflection of tillage intensity over the long-term. Moreover, the producer interpretation of the tillage intensity categories could have added uncertainty. Additionally, cover crops were negatively associated with soil C indicators (Fig. 6) but explained <5 % of the variance in the dataset (Table 1) confirming a very small response of soil C indicators to cover crops (Table S6). It is not entirely clear but might be attributed to a smaller number of observations with cover crops in our study (n=55). The cover crop effects on soil C indicators are largely dependent on the cover crop management factors such as type of cover crop species grown, frequency and duration of cover cropping, planting date, and termination time of cover crops (Blanco-Canqui et al., 2015). Due to the unavailability of the cover crop management factors in our study, the interpretation of cover crop effect is challenging but clearly demonstrates that other management factors (cropping system and tillage system) have a greater effect on soil C indicators.
Table 4Pearson correlation coefficients (r) among soil C indicators sampled in the Ontario Topsoil Sampling Project from 2019 to 2022.
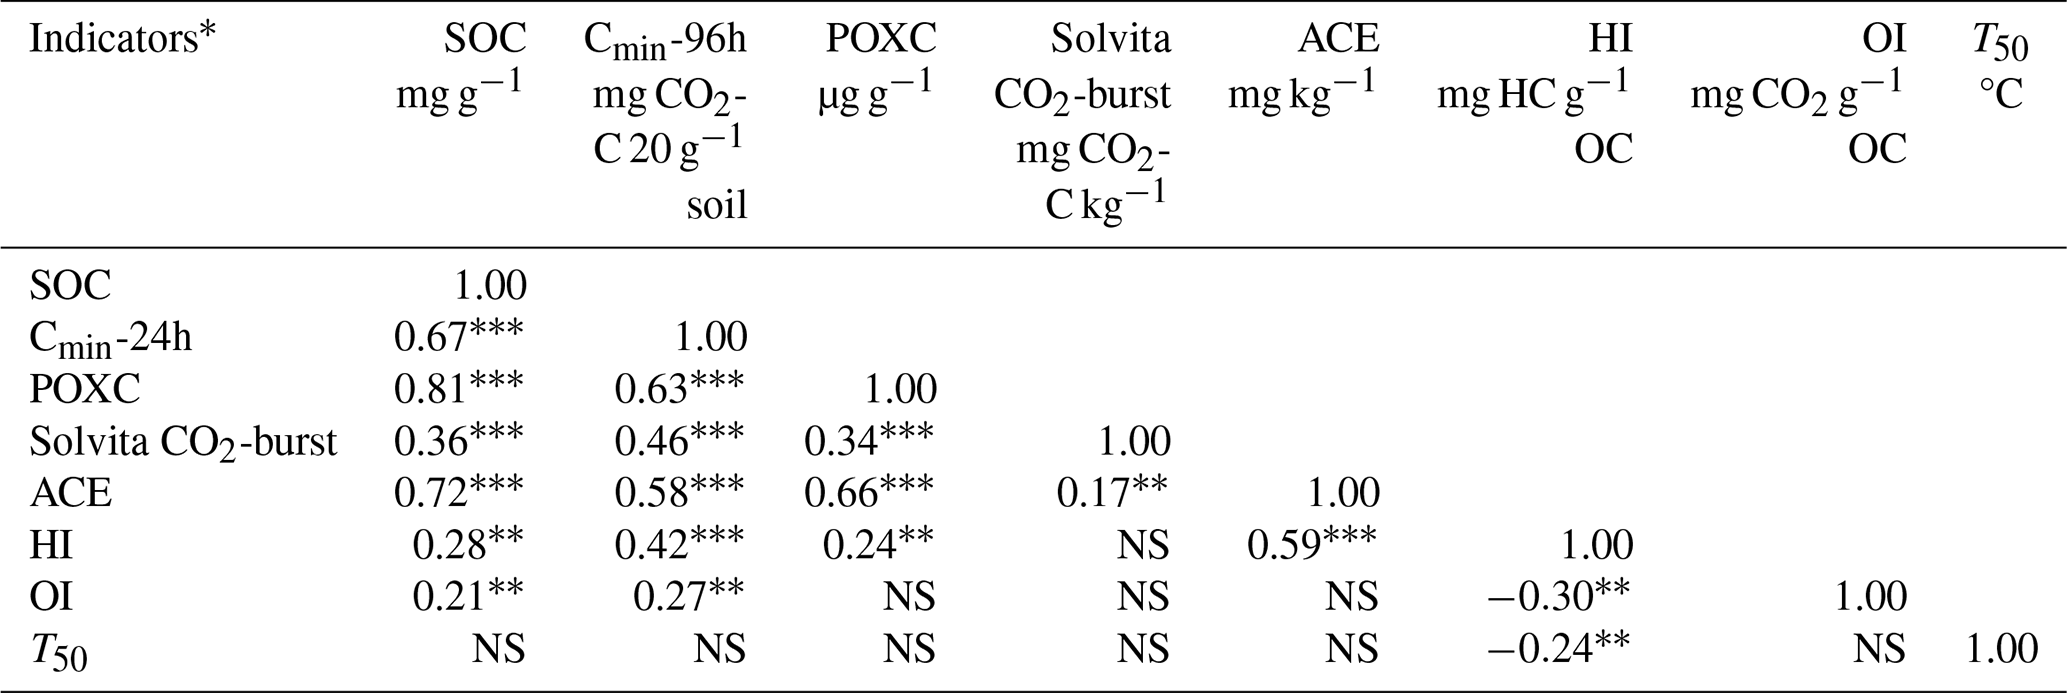
SOC = soil organic carbon; Cmin-96h = 96 h carbon mineralization; POXC = permanganate oxidizable carbon; Solvita CO2-burst = 24 h soil respiration test; ACE = autoclaved citrate extractable protein index; HI = Hydrogen Index; OI = Oxygen Index; and NS = Non-significant. n=1490 for soil organic C; n=1017 for Cmin-96; n=1413 for POXC; n=768 for Solvita CO2-burst; n=151 for ACE, HI, OI, T50. * All indicators were log-transformed prior to analysis. indicates statistical significance at P<0.05 and P<0.0001, respectively.
3.3 Relationships among the soil C indicators
To better understand associations among soil C indicators, correlation analysis was conducted on the soil C indicators and the indicators characterizing the chemical composition of soil organic matter (Table 4). Interestingly, despite having a range of soil textural classes and cropping system categories, strong positive significant relationships were observed among the soil C indicators (Table 4). Among the indicators, SOC and POXC had the strongest positive relationship (r=0.81), which was consistent with Liptzin et al. (2022) and Culman et al. (2012). Consistent with Amsili et al. (2021) and Nunes et al. (2020), our results confirm that an increase in SOC positively impacts the soil microbial activity (as demonstrated by Solvita CO2-burst and Cmin-96h) and the quality of soil organic matter (as demonstrated by POXC and ACE). Significant moderate negative associations ( to −0.35) were observed between HI and OI, HI and T50 (Table 4). Consistent with Mesgar et al. (2024), our results suggest that the indicators representing the labile components of soil organic matter such as HI were negatively associated with OI (an indicator of resistant pool of soil organic matter) and T50. We also observed that the indicators defining the stable and labile pools of soil C via the thermal analysis had a positive relationship with the soil C indicators such as SOC and C mineralization (Table 4). The correlation analysis also confirmed that the easily decomposable component of soil C (e.g., HI) was closely related to the labile indicators of soil C such as soil respiration and ACE (Table 4). The positive association of ACE with HI confirms that H-rich aliphatic C and protein like N compounds are concomitantly present in fresh organic matter and are co-metabolized by the soil microbes during the early stages of organic matter decomposition. Collectively, these results confirm the efficacy and applicability of the programmed pyrolysis method as a valuable tool to study the biochemical composition and decomposition potential of soil C.
This study focused on understanding the key drivers of soil C quality and stability in agricultural production systems at a landscape scale. To the best of our knowledge, this is the first study to evaluate the agronomic and pedoclimatic effects on the measures of soil C quality and C stability (particularly with the pyrolysis approach) in North America at the landscape scale. Our results revealed that soil textural classes and cropping system had a strong influence on both quality and stability of soil C indicators evaluated in this study. The cropping system differences on soil C are mainly related to the quantity and quality of residue C inputs, which in turn are primarily dependent on the cropping system, cover crops, tillage intensity, and organic amendments. Among the cropping systems, we found a greater concentration of soil C in forage and perennial cropping systems than the annual grain and vegetable systems. Likewise, forage cropping systems had a greater preservation of labile components while orchards had a more stable pool of soil C. Our results, therefore, confirmed that agricultural management-induced factors play a crucial role in understanding the chemical composition of soil organic matter. The indicators representing the labile pools of soil C (such as POXC and Cmin-96h) were positively correlated with the parameters indicating readily decomposable fractions of soil C (i.e., HI).
Furthermore, all indicators had a positive association with precipitation and a negative relationship with temperature suggesting an increase in the indicator values at cool and wet conditions despite low differences in values. Increase in the tillage intensity also negatively impacted the soil C indicators. Overall, the management-induced differences in soil C indicators in our study imply the benefits of adopting sustainable agricultural practices on building soil C, reducing CO2 emissions, and mitigating the negative effects of global climate change. While the findings of our study suggest a significant impact of agronomic and pedoclimatic variables on the soil C, it is important to note that the results of this study pertain only to the topsoil. It is possible that the same trends or effects on soil C quality and stability might not be observed at the deeper soil depths; hence, suggesting a need for future research. Additionally, tillage intensity categories in our study were based on subjective producer descriptions and lacked standardized metrics such as tillage depth, number of passes which might have introduced a potential bias in the interpretation of study results. The small sample sizes of cover crops (n=55) and orchards (n=33) limit the generalizability of results for these management practices. Future studies should employ more standardized tillage measurements and ensure a more balanced sample sizes across the agronomic management categories to improve the robustness of study results.
Data will be made available upon request but is not available in an online repository to protect the privacy of the participants in this project.
The supplementary tables and figures related to this article are attached along with the manuscript text. The supplement related to this article is available online at https://doi.org/10.5194/soil-12-583-2026-supplement.
IC: writing, data analysis, data interpretation and presentation, and editing the manuscript; DD: data organization and curation, reviewing and editing the manuscript; AW: funding acquisition, supervising, reviewing, and editing the manuscript; LVE: funding acquisition, supervising, reviewing, and editing the manuscript.
The contact author has declared that none of the authors has any competing interests.
Publisher's note: Copernicus Publications remains neutral with regard to jurisdictional claims made in the text, published maps, institutional affiliations, or any other geographical representation in this paper. The authors bear the ultimate responsibility for providing appropriate place names. Views expressed in the text are those of the authors and do not necessarily reflect the views of the publisher.
Authors are grateful to the financial support provided by Ontario Ministry of Agriculture, Food and Agribusiness (OMAFA) and the Ontario Agri-Food Innovation Alliance, a collaboration between the Government of Ontario and the University of Guelph. We would like to thank the undergraduate student Jane Bellefleur who conducted the lab analysis for ACE.
This research has been supported by the Ministry of Agriculture, Food and Agribusiness and the Ontario Agri-Food Innovation Alliance.
This paper was edited by Cornelia Rumpel and reviewed by Marie-Liesse Aubertin and one anonymous referee.
Adhikari, K. and Hartemink, A.: Soil organic carbon increases under intensive agriculture in the Central Sands, Wisconsin, USA, Geoderma Reg., 10, 115-125, https://doi.org/10.1016/j.geodrs.2017.07.003, 2017.
Agnihotri, R., Sharma, M. P., Prakash, A., Ramesh, A., Bhattacharya, S., Patra, A. K., Manna, M. C., Kurganova, I., and Kuzyakov, Y.: Glycoproteins of arbuscular mycorrhiza for soil carbon sequestration: Review of mechanisms and control, Sci. Total Environ., 806, 150571, https://doi.org/10.1016/j.scitotenv.2021.150571, 2022.
Amsili, J. P., van Es, H. M., and Schindelbeck, R. R.: Cropping system and soil texture shape soil health outcomes and scoring functions, Soil Secur., 4, 100012, https://doi.org/10.1016/j.soisec.2021.100012, 2021.
Angon, P. B., Anjum, N., Akter, M. M., Shreejana, K. C, Suma, R. P., and Sadia J.: An Overview of the Impact of Tillage and Cropping Systems on Soil Health in Agricultural Practices, Adv. Agric., 2023, 8861216, https://doi.org/10.1155/2023/8861216, 2023.
Balota, E. L., Colozzi Filho, A., Andrade, D. S., and Dick, R. P.: Long-term tillage and crop rotation effects on microbial biomass and C and N mineralization in a Brazilian Oxisol, Soil Till. Res., 77, 137–145, https://doi.org/10.1016/j.still.2003.12.003, 2004.
Blanco-Canqui, H., Shaver, T. M., Lindquist, J. L., Shapiro, C. A., Elmore, R. W., Francis, C. A., and Hergert, G. W.: Cover crops and ecosystem services: Insights from studies in temperate soils, Agron. J., 107, 2449–2474, https://doi.org/10.2134/agronj15.0086, 2015.
Brinton, W.: Soil CO2 respiration: official Solvita instructions (CO2-burst), SOP 2019 rev. 1 (DCR models 701.2), in: Method update, replaces version SOP 2019 and SOP 2016/1 (DCR model 700.6), Woods End Laboratories Inc., Mt. Vernon, ME, https://solvita.com/wp-content/uploads/woocommerce_uploads/2017/03/Solvita-Soil-CO2-Respiration_SOP2019_Rev1.pdf (last access: 8 November 2023), 2019.
Bünemann, E. K., Bongiorno, G., Bai, Z., Creamer, R. E., Deyn, G. D., de Goede, R., Fleskens, L., Geissen, V., Kuyper, T. W., Mader, P., Pulleman, M., Sukkel, W., van Groenigen, J. W., and Brussaard, L.: Soil quality – a critical review, Soil Biol. Biochem., 120, 105–125, https://doi.org/10.1016/j.soilbio.2018.01.030, 2018.
Burke, I. C., Yonker, C. M., Parton, W. J., Cole, C. V., Flach, K., and Schimel, D. S.: Texture, climate, and cultivation effects on soil organic matter content in US grassland soils, Soil Sci. Soc. Am. J., 53, 800–805, https://doi.org/10.2136/sssaj1989.03615995005300030029x, 1989.
Carrie, J., Sanei, H., and Stern, G.: Standardisation of Rock–Eval pyrolysis for the analysis of recent sediments and soils, Org. Geochem., 46, 38–53, https://doi.org/10.1016/j.orggeochem.2012.01.011, 2012.
Chahal, I. and Van Eerd, L. L.: Cover crop and crop residue removal effects on temporal dynamics of soil carbon and nitrogen in a temperate, humid climate, PLoS One, 15, e0235665, https://doi.org/10.1371/journal.pone.0235665, 2020.
Chahal, I., Hooker, D. C., Deen, B., Janovicek, K., and Van Eerd, L. L.: Long-term effects of crop rotation, tillage, and fertilizer nitrogen on soil health indicators and crop productivity in a temperate climate, Soil Till. Res., 213, 105–121, https://doi.org/10.1016/j.still.2021.105121, 2021.
Chahal, I., Saurette, D., and Van Eerd, L.: Soil texture influences on soil health scoring functions in Ontario agricultural soils: a possible framework towards a provincial soil health test, Can. J. Soil Sci., 103, 152–163, https://doi.org/10.1139/cjss-2021-0145, 2023.
Chahal, I., Amsili, J. P., Saurette, D. D., Bower, J. A., Gillespie, A. W., van Es, H. M. V., and Van Eerd, L. L.: Soil organic carbon to clay ratio in different pedoclimatic and agronomic conditions in northeastern North America, Geoderma Reg., 39, e00893, https://doi.org/10.1016/j.geodrs.2024.e00893, 2024.
Congreves, K. A., Hayes, A., Verhallen, E. A., and Van Eerd, L. L.: Long-term impact of tillage and crop rotation on soil health at four temperate agroecosystems, Soil Till. Res., 152, 17–28, https://doi.org/10.1016/j.still.2015.03.012, 2015.
Cotrufo, M. F., Wallenstein, M. D., Boot, C. M., Denef, K., and Paul, E.: The microbial efficiency-matrix stabilization (mems) framework integrates plant litter decomposition with soil organic matter stabilization: do labile plant inputs form stable soil organic matter?, Global Change Biol., 19, 988–995, https://doi.org/10.1111/gcb.12113, 2013.
Culman, S. W., Snapp, S. S., Freeman, M. A., Schipanski, M. E., Beniston, J., Lal, R., Drinkwater, L. E., Franzluebbers, A. J., Glover, J. D., Grandy, A. S., Lee, J., Six, J., Maul, J. E., Mirksy, S. B., Spargo, J. T., and Wander, M. M.: Permanganate oxidizable carbon reflects a processed soil fraction that is sensitive to management, Soil Sci. Soc. Am. J., 76, 494–504, https://doi.org/10.2136/sssaj2011.0286, 2012.
Culman, S. W., Snapp, S. S., Green, J. M., and Gentry, L. E.: Short- and long-term labile soil carbon and nitrogen dynamics reflect management and predict corn agronomic performance, Agron. J., 105, 493–502, https://doi.org/10.2134/agronj2012.0382, 2013.
Datta, A., Mandal, B., Badole, S., Krishna Chaitanya, A., Majumder, S. P., Padhan, D., Basak, N., Barman, A., Kundu, R., and Narkhede, W. N.: Interrelationship of biomass yield, carbon input, aggregation, carbon pools and its sequestration in Vertisols under long-term sorghum-wheat cropping system in semi-arid tropics, Soil Till. Res., 184, 164–175, https://doi.org/10.1016/J.STILL.2018.07.004, 2018.
Ding, G., Liu, X., Herbert, S., Novak, J., Amarasiriwardena, D., and Xing, B.: Effect of cover crop management on soil organic matter, Geoderma, 130, 229–239, https://doi.org/10.1016/j.geoderma.2005.01.019, 2006.
Gillespie, A. W., Sanei, H., Diochon, A., Ellert, B. H., Regier, T. Z., Chevrier, D., Dynes, J. J., Tarnocai, C., and Gregorich, E. G.: Perennially and annually frozen soil carbon differ in their susceptibility to decomposition: Analysis of subarctic earth hummocks by bioassay, XANES and pyrolysis, Soil Biol. Biochem., 68, 106–116, https://doi.org/10.1016/j.soilbio.2013.09.021, 2014.
Gregorich, E. G., Gillespie, A. W., Beare, M. H., Curtin, D., Sanei, H., and Yanni, S. F.: Evaluating biodegradability of soil organic matter by its thermal stability and chemical composition, Soil Biol. Biochem., 91, 182–191, https://doi.org/10.1016/j.soilbio.2015.08.032, 2015.
Haney, R. L., Brinton, W. H., and Evans, E.: Estimating soil carbon, nitrogen, and phosphorus mineralization from short-term carbon dioxide respiration, Commun. Soil Sci. Plant Anal., 39, 2706–2720, https://doi.org/10.1080/00103620802358862, 2008.
Jenny, H.: Factors of Soil Formation: A System of Quantitative Pedology, Dover Publications, New York, p. 281, https://doi.org/10.2307/211491, 1941.
Jobbágy, E. G. and Jackson, R. B.: The Vertical Distribution of Soil Organic Carbon and Its Relation to Climate and Vegetation, Ecol. Appl., 10, 423–436, https://doi.org/10.1890/1051-0761(2000)010[0423:TVDOSO]2.0.CO;2, 2000.
King, A. E. and Blesh, J.: Crop rotations for increased soil carbon: perenniality as a guiding principle, Ecol. Appl., 28, 249–261, https://doi.org/10.1002/eap.1648, 2018.
Krom, M. D. and Berner, R. A.: A rapid method for the determination of organic and carbonate carbon in geological samples, J. Sediment. Petrol., 53, 660–663, https://doi.org/10.1306/212F8260-2B24-11D7-8648000102C1865D, 1983.
Lafargue, E., Marquis, F., and Pillot, D.: Rock-Eval 6 applications in hydrocarbon exploration, production, and soil contamination studies, Revue de l'Institut Francais Du Petrole, 53, 421–437, https://doi.org/10.2516/ogst:1998036, 1998.
Lal, R.: Soil health and carbon management, Food Energy Secur., 5, 212–222, https://doi.org/10.1002/fes3.96, 2016.
Liptzin, D., Norris, C. E., Cappellazzi, S. B., Mac Bean, G., Cope, M., Greub, K. L., and Honeycutt, C. W.: An evaluation of carbon indicators of soil health in long-term agricultural experiments, Soil Biol. Biochem., 172, 108708, https://doi.org/10.1016/j.soilbio.2022.108708, 2022.
Mangalassery, S., Sjogersten, S., Sparkes, D. L., Sturrock, C. J., Craigon, J., and Mooney, S. J.: To what extent can zero tillage lead to a reduction in greenhouse gas emissions from temperate soils?, Sci. Rep., 4, 4586, https://doi.org/10.1038/srep04586, 2014.
McDaniel, M. D. and Grandy, A. S.: Soil microbial biomass and function are altered by 12 years of crop rotation, SOIL, 2, 583–599, https://doi.org/10.5194/soil-2-583-2016, 2016.
Melland, A. R., Antille, L., and Dang, Y. P.: Effects of strategic tillage on short-term erosion, nutrient loss in runoff and greenhouse gas emissions, Soil Res., 55, 201–214, https://doi.org/10.1071/SR16136, 2017.
Mesgar, M., Voroney, R. P., Lo, A., Ardakani, O. H., and Gillespie, A. W.: Chemical composition and thermal stability of topsoil organic carbon: Influence of cropping system and tillage practices, Eur. J. Soil Sci., 75, e13459, https://doi.org/10.1111/ejss.13459, 2024.
Minasny, B. and McBratney, A. B.: A Conditioned Latin Hypercube Method for Sampling in the Presence of Ancillary Information, Comp. Geosci., 32, 1378–1388, https://doi.org/10.1016/j.cageo.2005.12.009, 2006.
Moebius-Clune, B. N., Moebius-Clune, D. J., Gugino, B. K., Idowu, O. J., Schindelbeck, R. R., Ristow, A. J., van Es, H. M., Thies, J. E., Shayler, H. A., McBride, M. B., Kurtz, K. S. M., Wolfe, D. W., and Abawi, G. S.: Comprehensive assessment of soil health, in: The Cornell Framework Manual, 3rd Edn., Cornell University, Ithaca, NY, https://www.css.cornell.edu/extension/soil-health/manual.pdf (last access: 7 November 2023), 2016.
Norris, C. E. and Congreves, K. A.: Alternative management practices improve soil health indices in intensive vegetable cropping systems: a review, Front. Environ. Sci., 6, 50, https://doi.org/10.3389/fenvs.2018.00050, 2018.
Nunes, M. R., Karlen, D. L., and Moorman, T. B.: Tillage intensity effects on soil structure indicators – a us meta-analysis, Sustainability, 12, 2071, https://doi.org/10.3390/su12052071, 2020.
Nunes, M. R., Veum, K. S., Parker, P. A., Holan, S. H., Karlen, D. L., Amsili, J. P., Van Es, H. M., Wills, S. A., Seybold, C. A., and Moorman, T. B.: The soil health assessment protocol and evaluation applied to soil organic carbon, Soil Sci. Soc. Am. J., 85, 1196–1213, https://doi.org/10.1002/saj2.20244, 2021.
Parton, W. J., Stewart, J. W. B., and Cole, C. V.: Dynamics of C, N, P and S in grassland soils: a model, Biogeochemistry, 5, 109–131, https://doi.org/10.1007/BF02180320, 1988.
Peltre, C., Fernandez, J. M., Craine, J. M., and Plante, A. F.: Relationships between biological and thermal indices of soil organic matter stability differ with soil organic carbon level, Sci. Soc. Am. J., 77, 2020–2028, https://doi.org/10.2136/sssaj2013.02.0081, 2013.
Poeplau, C. and Don, A.: Carbon Sequestration in Agricultural Soils via Cultivation of Cover Crops – A Meta-Analysis, Agr. Ecosyst. Environ., 200, 33–41, https://doi.org/10.1016/j.agee.2014.10.024, 2015.
Presley, D. R., Ransom, M. D., Kluitenberg, G. J., and Finnell, P. R.: Effects of Thirty Years of Irrigation on the Genesis and Morphology of Two Semiarid Soils in Kansas, Sci. Soc. Am. J., 68, 1916–1926, https://doi.org/10.2136/sssaj2004.1916, 2004.
Saenger, A., Cécillon, L., Sebag, D., and Brun, J.-J.: Soil organic carbon quantity, chemistry and thermal stability in a mountainous landscape: A Rock–Eval pyrolysis survey, Org. Geochem., 54, 101–114, https://doi.org/10.1016/j.orggeochem.2012.10.008, 2013.
Schindelbeck, R. R., Moebius-Clune, B. N., Moebius-Clune, D. J., Kurtz, K. S., and van Es, H. M.: Cornell University Comprehensive Assessment of Soil Health Laboratory Standard Operating Procedures, Cornell University, 31–38, http://bit.ly/SoilHealthSOPs (last access: 7 November 2023), 2016.
Schmidt, M., Torn, M., Abiven, S., Dittmar, T., Guggenberger, G., Janssens, I., Kleber, M., Kögel-Knabner, I., Lehmann, J., Manning, D., Nannipieri, P., Rasse, D., Weiner, S., and Trumbore, S.: Persistence of soil organic matter as an ecosystem property, Nature, 478, 49–56, https://doi.org/10.1038/nature10386, 2011.
Sebag, D., Verrecchia, E. P., Cécillon, L., Adatte, T., Albrecht, R., Aubert, M., Bureau, F., Cailleau, G., Copard, Y., Decaens, T., Disnar, J.-R., Hetényi, M., Nyilas, T., and Trombino, L.: Dynamics of soil organic matter based on new Rock-Eval indices, Geoderma, 284, 185–203, https://doi.org/10.1016/j.geoderma.2016.08.025, 2016.
Sheldrick, B. H. and Wang, C.: Particle size distribution, in: Soil sampling and methods of analysis, edited by: Carter, M. R., Canadian Society of Soil Science, Lewis Publishers, 499–507, ISBN 978-0-87371-861-5, 1993.
Simkovic, I., Feketeova, Z., and Svobodova, L.: Microbial and thermal indices of organic matter stability in lowland soils with variable texture, Geoderma Reg., 36, e00753, https://doi.org/10.1016/j.geodrs.2023.e00753, 2025.
Sinsabaugh, R. L., Lauber, C. L., Weintraub, M. N., Ahmed, B., Allison, S. D., Crenshaw, C., Contosta, A. R., Cusack, D., Frey, S., Gallo, M. E., Gartner, T. B., Hobbie, S. E., Holland, K., Keeler, B. L., Powers, J. S., Stursova, M., Takacs-Vesbach, C., Waldrop, M. P., Wallenstein, M. D., Zak, D. R., and Zeglin, L. H.: Stoichiometry of soil enzyme activity at global scale, Ecol. Lett., 11, 1252–1264, https://doi.org/10.1111/j.1461-0248.2008.01245.x, 2008.
Six, J., Conant, R. T., Paul, E. A., and Paustian, K.: Stabilization mechanisms of soil organic matter: Implications for C-saturation of soils, Plant Soil, 241, 155–176, https://doi.org/10.1023/A:1016125726789, 2002.
Skjemstad, J. O. and Baldock, J. A.: Total and organic carbon, in: Soil Sampling and Methods of Analysis, edited by: Carter, M. R. and Gregorich, E. G., CRC Press, Boca Raton, FL, 225–237, https://doi.org/10.1201/9781420005271-29, 2008.
Soon, Y. K., Arshad, M. A., Haq, A., and Lupwayi, N.: The influence of 12 years of tillage and crop rotation on total and labile organic carbon in a sandy loam soil, Soil Till. Res., 95, 38–46, https://doi.org/10.1016/j.still.2006.10.009, 2007.
Soucémarianadin, L., Cécillon, L., Chenu, C., Baudin, F., Nicolas, M., Girardin, C., and Barré, P.: Is Rock-Eval 6 thermal analysis a good indicator of soil organic carbon lability? – A method-comparison study in forest soils, Soil Biol. Biochem., 117, 108–116, https://doi.org/10.1016/j.soilbio.2017.10.025, 2018.
Stoner, S., Trumbore, S. E., González-Pérez, J. A., Schrumpf, M., Sierra, C. A., Hoyt, A. M., Chadwick, O., and Doetterl, S.: Relating mineral–organic matter stabilization mechanisms to carbon quality and age distributions using ramped thermal analysis, Philos. Trans. A Math. Phys. Eng. Sci., 381, 20230139, https://doi.org/10.1098/rsta.2023.0139, 2023.
Sun, F., Coulibaly, F. M., Cheviron, N., Mougin, C., Hedde, M., Maron, P., Recous, S., Trap, J., Cécile, V., and Chauvat, M.: The multi-year effect of different agroecological practice on soil nematodes and soil respiration, Plant Soil, 490, 109–124, https://doi.org/10.21203/rs.3.rs-2154623/v1, 2023.
Viaud, V., Angers, D. A., Parnaudeau, V., Morvan, T., and Aubry, S. M.: Response of organic matter to reduced tillage and animal manure in a temperate loamy soil: Response of soil organic matter to tillage and manure application, Soil Use Manage., 27, 84–93, https://doi.org/10.1111/j.1475-2743.2010.00314.x, 2011.
von Lützow, M., Kogel-Knabner, I., Ekschmitt, K., Matzner, E., Guggenberger, G., Marschner, B., and Flessa, H.: Stabilization of organic matter in temperate soils: mechanisms and their relevance under different soil conditions – a review, Eur. J. Soil Sci., 57, 426–445, https://doi.org/10.1111/j.1365-2389.2006.00809.x, 2006.