the Creative Commons Attribution 4.0 License.
the Creative Commons Attribution 4.0 License.
 | 04 May 2026
Destabilization of buried carbon under changing moisture regimes
Manisha Dolui
Abbygail R. McMurtry
Stephanie Chacon
Joseph A. Mason
Laura M. Phillips
Erika Marin-Spiotta
Marie-Anne de Graaff
Asmeret A. Berhe
Teamrat A. Ghezzehei
Paleosols formed by the burial of topsoil during landscape evolution can sequester substantial amounts of soil organic carbon (SOC) over millennia due to protection from surface disturbances. We investigated the moisture sensitivity of buried SOC storage in the Brady paleosol, a loess-derived soil in Nebraska, USA, where historical aeolian deposition during the Pleistocene–Holocene transition buried soils up to 6 m deep. Topsoils from erosional (up to 1.8 m depth) and burial (up to 5.8 m depth) transects were incubated under two moisture regimes – continuous wetting (60 % water-holding capacity) and repeated drying–rewetting – to assess soil organic matter (SOM) vulnerability to changing hydrologic conditions.
SOC decomposition rates modeled from CO2 fluxes were consistently higher in erosional than burial settings, with surface re-exposure of Brady soils enhancing microbial accessibility and destabilization. A two-pool model showed that >96 % of SOC was stored in a slow-cycling pool, particularly in deeply buried soils where stabilization was linked to mineral association, fine particles, and Ca-mediated flocculation. However, this pool decomposed more rapidly in shallower Brady soils (higher turnover rate relative to buried soil), reflecting increased microbial responsiveness to surface-driven processes.
Drying–rewetting cycles caused greater C losses from Brady soils than continuous wetting, despite the dominance of the slow pool and depletion of labile C. These cycles also accelerated fast pool decay in modern soils and erosional transects, whereas burial dampened variability in Brady soils. Although continuous wetting increased overall decay in burial transects during the incubation period, wet–dry cycles destabilized the slow pool, which may result in greater long-term C loss. Together, these results underscore the importance of burial depth, geomorphic context, and moisture regime in shaping the long-term vulnerability of ancient SOC under climate change.
- Article
(4055 KB) - Full-text XML
- BibTeX
- EndNote


Global temperatures have risen by 1 °C since the industrial era due to anthropogenic CO2 emissions, confirming human-driven climate change (IPCC, 2018). Alongside warming, precipitation regimes are shifting – marked by increased frequency and intensity of wetting and drying events, especially in more arid ecosystems. These hydrologic fluctuations can destabilize long-stored soil organic carbon (SOC) by disrupting aggregates, increasing dissolution and solute mobility, and stimulating microbial decomposition (Berhe et al., 2012; Min et al., 2020; Hicks Pries et al., 2023). While limiting warming to below 2 °C remains critical, mitigation via emissions reductions alone may be insufficient. Preserving or enhancing terrestrial carbon sinks, especially soils, offers a complementary pathway for climate stabilization.
Soil organic matter (SOM) encompasses the full suite of organic compounds in soil, including living biomass, particulate debris, and mineral-associated organic molecules. SOC refers specifically to the carbon fraction of SOM and is the metric used throughout this study to quantify carbon stocks and fluxes. While many studies examine topsoil carbon dynamics, whole-soil responses to changes in climate have rarely been tested (Hicks Pries et al., 2017). Subsoils hold nearly half of global SOC stocks (Jobbagy and Jackson, 2000) and this deep-soil carbon may be more sensitive to varying environmental conditions than surface soil (Min et al., 2020). Organic inputs reach subsoils via leaching of dissolved organic carbon and vertical transport of litter by bioturbation. SOC in deeper horizons typically features low carbon to nitrogen (C:N) ratios and long mean residence times, suggesting advanced microbial processing and relative stability (Rumpel and Kögel-Knabner, 2011). In contrast, topsoils buried by aeolian or alluvial deposition often retain legacy carbon signatures reflecting past vegetation and climate (Marin-Spiotta et al., 2014), diverging from modern surface soils. These buried soils have historically been isolated from near-surface conditions, including temperature and moisture fluctuations. Previous research supports this isolation effect: for instance, Chaopricha and Marín-Spiotta (2014) found negligible CO2 fluxes from Brady Soil collected from 4 m below the modern surface when no water was added, indicating extremely limited microbial activity under such dry, oxygen-poor conditions.
The stability of buried SOC, however, depends entirely on continued isolation from surface conditions – an assumption increasingly at odds with landscape dynamics across the Great Plains. Accelerated gully erosion, agricultural tillage, and more intense precipitation events are progressively exhuming paleosols that remained protected for millennia (Mason et al., 2008; Jacobs and Mason, 2007; Thaler et al., 2021). Yet the decomposition response of this ancient carbon to re-exposure remains poorly constrained. Will millennia-old SOC decompose rapidly once oxygen and moisture access is restored, or do the same properties that enabled its long-term preservation – fine texture, mineral associations, chemical recalcitrance – confer lasting resistance? This uncertainty carries substantial implications for carbon-climate feedbacks: if re-exposed paleosol carbon proves vulnerable to decomposition, ongoing erosion across loess landscapes could convert a long-term carbon sink into an unaccounted source.
Subsurface environments typically have limited oxygen, C inputs, and water availability, all of which constrain microbial activity and promote long-term SOC persistence (Soong et al., 2021). However, this protection may be compromised under climate change scenarios involving increased rainfall, warming, and surface disturbance (Fontaine et al., 2007; Gao et al., 2020; Hicks Pries et al., 2023). While burial isolates SOM from decomposers, enhancing its stability (Berhe et al., 2007; Stacy et al., 2015; Berhe et al., 2008), soil erosion, root intrusion, and hydrologic shifts can re-expose previously protected SOM. While erosion may remove C, the exposure of fresh relatively unweathered parent material can increase photosynthate additions due to the rejuvenation of rock-derived nutrients (Berhe et al., 2018). Given the global extent of geomorphic disturbance and the potential for reactivated decomposition, buried soils may represent an extensive but under-characterized carbon pool whose long-term persistence is uncertain (Chaopricha and Marín-Spiotta, 2014; Szymanski, 2021; Pal et al., 2023).
SOM decomposition is mediated by geomorphic and geochemical controls. Soil texture, mineralogy, and ionic composition regulate organo–mineral associations and microbial accessibility. Mineral surfaces – particularly clays and metal oxides – can stabilize SOM through sorption and aggregation, while spatial inaccessibility and microsite heterogeneity further constrain decomposition (Marin-Spiotta et al., 2011; Schmidt et al., 2011; Lawrence et al., 2015). Thermal transformation of buried SOM into condensed aromatic compounds can also enhance resistance to decay. Recent findings from Dolui et al. (2026b) link persistent SOM turnover in buried soils to fine textures, higher conductivity, and strengthened organo–mineral bonding, consistent with evidence that mineral-associated and physically protected pools dominate long-term persistence (Slessarev et al., 2022). However, these stabilizing mechanisms weaken with erosional exposure, as disruption of aggregates, increased oxygen availability, and shifts in moisture regimes enhance microbial activity. In addition, exposure promotes priming effects through fresh organic matter inputs, accelerating the decomposition of previously protected SOM (McMurtry et al., 2024; Lawrence et al., 2021) and increasing its vulnerability to loss.
Soil moisture dynamics are central to SOM persistence. Wetting and drying–rewetting cycles can destabilize aggregates, increase dissolved organic carbon leaching, and stimulate mineral-associated OM loss (Berhe et al., 2012; Neff and Asner, 2001; Li et al., 2023). Moisture influences microbial processes by modulating water potential, oxygen diffusion, and solute transport (Chowdhury et al., 2011; Davidson et al., 2012). Texture controls water retention during drying, while aggregate structure governs accessibility under saturated conditions (Or and Tuller, 1999; Ghezzehei et al., 2019).
In surface soils, especially in semi-arid and Mediterranean systems, drying–rewetting cycles produce strong mineralization pulses (Miller et al., 2005; Zhu and Cheng, 2013). Such cycles break down aggregates and release labile SOM, stimulating priming effects (Najera et al., 2020). Soils with broader pore-size distributions may retain water longer, sustaining microbial activity and potentially increasing cumulative SOM loss (Goebel et al., 2005). The effects of increased rainfall also depend on seasonal timing; for instance, winter precipitation can enhance subsoil C storage more than spring rain due to deeper translocation of carbon (Wahab et al., 2025).
As soils dry, physical and chemical processes can strengthen OM–mineral interactions. Solute precipitation, matric tension, and shifts toward stronger bonding (e.g., inner-sphere complexes) promote greater SOM–mineral affinity (Kaiser et al., 2015; Kemper et al., 1987; Kang and Xing, 2008). Reorientation of amphiphilic compounds on mineral surfaces can increase hydrophobicity (Horne and McIntosh, 2000), potentially misleading assessments of SOM stability under drier conditions.
CO2 efflux in subsoils is shaped by physical constraints – lower porosity, higher bulk density, and greater water-filled pore space – which suppress microbial respiration after rewetting (Min et al., 2020; Hill et al., 1985; Beare et al., 2009; Schrumpf et al., 2013). Subsurface microbial communities are often dominated by drought-tolerant fungi (Bird and Torn, 2006), and experience fewer moisture and temperature fluctuations than surface soils (Rumpel and Kögel-Knabner, 2011). Microbial “resistance” to drying manifests as reduced respiration during dry-down, while “resilience” describes rapid respiration rebound after rewetting (Leizeaga et al., 2021; Griffiths and Philippot, 2013). Soils with frequent drying–rewetting history tend to support more resilient microbial communities (Fierer and Schimel, 2003; Steenwerth et al., 2005).
In semi-arid systems, soil inorganic carbon (SIC) also contributes to carbon dynamics. SIC accumulates at depth through carbonate dissolution–precipitation cycles (Sharififar et al., 2023; Batool et al., 2024; Cotrufo and Lavallee, 2025). This is seen in the Brady Soil, a late Pleistocene paleosol buried by loess ca. 13 000–10 000 years ago in the Great Plains of the US (Jacobs and Mason, 2007; McDowell et al., 2022). SIC interacts with SOC via aggregation and mineral associations but can be mobilized through leaching under increased moisture conditions (Naorem et al., 2022; Liu et al., 2018; Tsypin and Macpherson, 2012).
Despite growing interest in buried SOM, moisture-driven decomposition patterns across landforms remain unclear. This study investigates the sensitivity of modern and buried SOM to moisture inputs under erosional and burial geomorphic conditions in the Brady Soil. According to the U.S. National Climate Assessment (2018), the Central Great Plains region of Nebraska is projected to warm by 3.5–9.5 °C, with annual precipitation increasing by 2.5 cm. Erosion driven by agriculture, grazing, wind, and rainfall threatens to re-expose buried SOM to surface conditions.
We conducted a laboratory incubation using soils collected near Wauneta, Nebraska, to compare CO2 efflux under continuous wetting versus drying–rewetting regimes. The area's semi-arid climate with seasonal moisture variability provides a relevant setting to test SOM responses to hydrologic fluctuations. Our hypotheses were: (i) Brady SOM is more stable and decomposes more slowly than modern SOM as reduced moisture and oxygen availability limit decomposition of SOM due to isolation from the soil surface; (ii) buried SOM in erosional settings is more vulnerable to loss due to exposure of previously protected SOM to surface conditions and mixing with modern carbon; and (iii) wetting will stimulate CO2 release from previously buried soils as a result of increased substrate availability due to enhanced dissolution, solute transport, microbial decomposition, and/or aggregate disruption. By evaluating the interactions between moisture, geomorphology, and SOM dynamics, we aim to improve predictions of carbon stability under future climate and land-use change.
2.1 Site and sampling
The field site is situated near Wauneta, within the loess tablelands of southeastern Nebraska, USA ( N, W; see Fig. 1). The region experienced reduced loess input during the terminal Pleistocene and early Holocene (13–10 ka) that permitted soil formation, leading to the development of the Brady Soil. Subsequent aridification renewed dust flux, resulting in its burial by younger loess (Johnson et al., 2007; Mason et al., 2008). Additional loess accumulation throughout the Holocene preserved weaker paleosols formed during intermittent burial pauses (Mason et al., 2003; Miao et al., 2007). Recognized as a key paleoenvironmental and stratigraphic unit, the Brady Soil is regionally traceable across Nebraska, northeastern Colorado, and northern Kansas (Johnson and Willey, 2000).
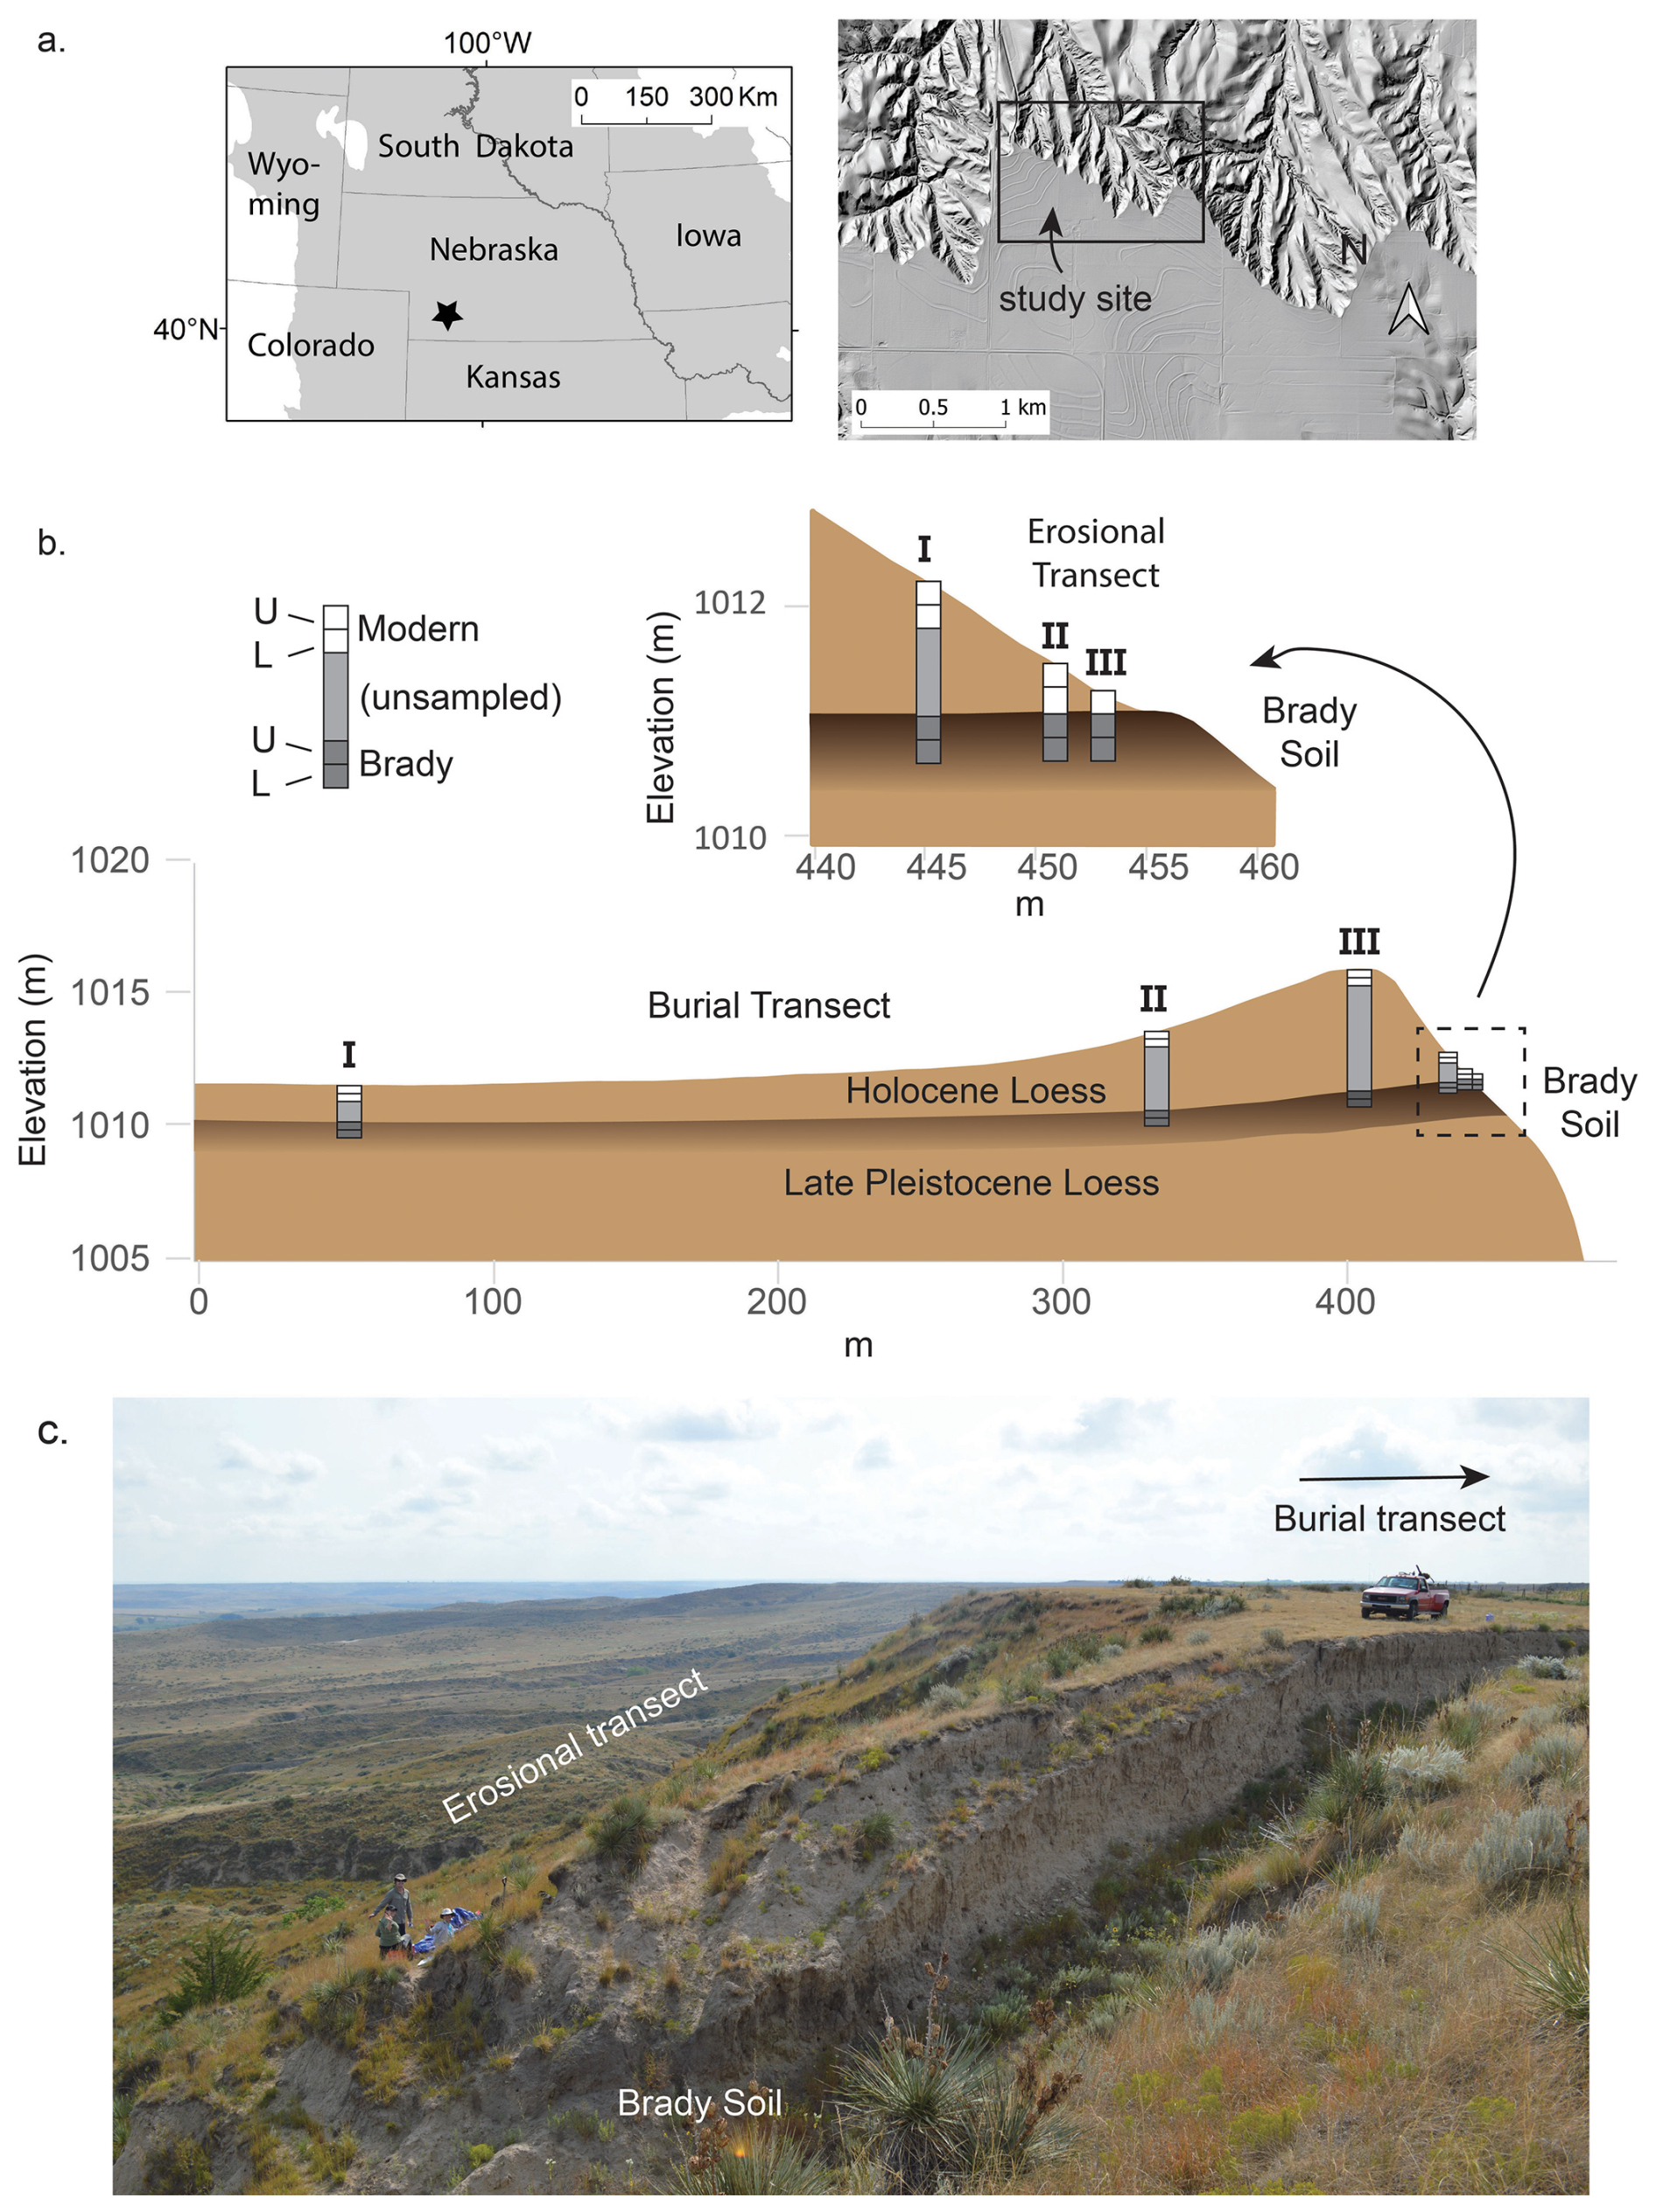
Figure 1Study site location, stratigraphy, and sampling scheme. (a) Location of the study site within the Great Plains ecoregion (grayshade) and shaded relief map illustrating topographic setting of study site. (b) Vertical cross-sections illustrating the sampling scheme relative to modern land surface topography, the Brady Soil, and loess above and below it at study site. Weakly developed horizons of modern soil and paleosols within the Holocene loess (Miao et al., 2007) not shown. Details based on one pair of burial and erosional transects but representative of all three. (c) Photo illustrating topography and native grassland vegetation at one pair of transects. Truck is near deepest profile (III) on burial transect; other burial transect points are not visible. Brady Soil is exposed in an old roadcut in foreground; erosional transect is located on intact slope beyond roadcut. Figure adapted from Dolui et al. (2026b).
The area is characterized by broad, flat uplands and sharply incised edges, providing natural windows into stratified soil profiles. Loess cover above the Brady Soil tapers in a downwind direction across the summits where it is thickest, producing burial transects of variable thickness. The local climate is semi-arid, with an average annual temperature of 9.7 °C and ca. 495 mm of precipitation, concentrated during the summer months, with occasional snow in winter. Natural vegetation includes a mix of C3 and C4 grasses, replaced by cropland on many level surfaces today, but remaining at the study site and on steeper terrain in general.
Brady Soil exposures are visible in actively eroding margins, gullies, and roadside cuts. Prior investigations, including coring and field surveys, confirm its continuity beneath the summit landform (Jacobs and Mason, 2004; Marin-Spiotta et al., 2014; Mason et al., 2008). Surface soils developed in Holocene loess are weakly developed and light-colored, typically classified as Mollisols, Inceptisols, or Entisols. Although different in age, modern and buried soils share similar parent material and mineralogy due to the region’s limited weathering intensity. Brady A horizons (Ab) are identified by their dark grayish brown coloration (Munsell 10YR3/2 to 10YR4/2) and silt loam texture, generally overlying Bk or Bw horizons (Szymanski, 2021; Jacobs and Mason, 2007; McDowell et al., 2022).
Sampling was conducted in 2016 and 2017 across two geomorphic settings: burial transects (where the Brady Soil is deeply buried beneath Holocene loess) and erosional transects (where the Brady Soil is exposed or shallowly buried due to hillslope erosion). Within each setting, three replicate transects were established. We collected samples at three depths relative to the soil surface from each of the transects per setting (details in Fig. 1). Sampling stratigraphy relative to the present land surface was categorized using Roman numerals (Appendix, Table A1). At each transect position, samples were collected from (1) the modern soil surface (0–30 cm), (2) the subsurface modern soil (30–60 cm, where present), and (3) the upper Brady paleosol horizon (0–30 cm into the Ab horizon, at variable depth below the modern surface depending on burial thickness). All samples were analyzed for physicochemical properties, but only samples from the 0–30 cm depth intervals were used for incubation experiments. Table A1 provides the specific sampling depths from the soil surface for each transect position. A Giddings probe (10.2 or 8.9 cm diameter) with plastic liners was used for intact sampling in burial settings, while soil pits were dug for erosional profiles. Complete methods are described in Szymanski (2021).
2.2 Soil chemical and physical analyses
General soil physical and chemical properties were determined by standard soil analytical methods, as described in detail in Dolui et al. (2026b) and Szymanski (2021). Briefly, soil pH and electrical conductivity (EC) of soil samples were determined in 1:2 water extracts using a SevenExcellence multiparameter benchtop meter (Mettler Toledo, United States). Total carbon was determined by dry combustion using an ECS 4010 elemental combustion analyzer (Costech Analytical Technologies, Inc., USA); inorganic carbon was removed by acidification with 1 M HCl prior to TOC determination. Exchangeable base cations (Ca2+, Mg2+, Na+ and K+) were were quantified by ICP-OES (Optima 5300 DV Spectrometer, Perkin-Elmer, Germany) following ammonium acetate extraction (buffered to pH 7). Sodium adsorption ratio (SAR) was determined by dividing concentration of Na in soil extract by the square root of half of sum of Ca and Mg concentrations (Dolui et al., 2026a). Particle size distribution was determined using the pipette method for clay (<2 µm) and laser diffraction (Mastersizer 2000 particle size analyzer, Malvern Panalytical, UK) for silt and sand fractions. Radiocarbon (14C) analyses of bulk soil samples were conducted to determine the age and turnover time of carbon in both modern and buried soils. Samples were pre-treated, combusted, and then measured by accelerator mass spectrometry using an FN accelerator mass spectrometer (Van de Graaff, US) at the center for accelerator mass spectrometry at Lawrence Livermore National Laboratory. The Δ14C results were used in a homogeneous, open-system, steady-state soil carbon decomposition model to estimate carbon turnover times (Dolui et al., 2026b) which were averaged for the three replicate transects.
2.3 Incubation experiments
The incubation experiment was set up to determine the effect of continuous wetting and drying–rewetting on SOC fluxes using soils that were collected from the upper layer of modern and Brady Soil samples at burial and erosional transect types. To isolate the effects of moisture, roots >2 mm were removed by sieving and manual sorting. Samples from 0–30 cm horizon depth from different transect numbers were homogenized (so that they had only unique paleostatus, transect type and burial/erosional degree). Two types of water addition experiments were conducted: continuous wet and drying–rewetting. Two sub-samples were taken from each composite to perform biological replicates of each incubation experiment, such that there was a total number of 24 individual incubation vessels.
2.3.1 Experimental setup
The incubation experiments were conducted in 8 oz mason jars. Soil water holding capacity (WHC) was pre-determined by tensiometry (using pressure plates with an applied pressure of −33 kPa) and soil moisture content was monitored on a mass-basis by weighing soils weekly during the incubation. The treatments included (i) continuous wet – soils maintained at 60 % WHC throughout the experiment and (ii) drying–rewetting cycles – soils were dried, then rewetted to 60 % WHC. Treatment durations differed by experimental objective. The continuous wet incubation (225 d) was designed to capture the full trajectory of decomposition, enabling robust fitting of two-pool decay models that partition SOC into fast- and slow-cycling fractions (turnover times on the scale of days and centuries, respectively). The wet-dry treatment (56 d, 8 cycles of 7 d drying followed by rewetting) was designed to assess cumulative effects of repeated moisture pulses over a timeframe comparable to a growing season. For direct comparison between treatments, we modeled CO2 loss over equivalent 49 d windows and compared decay parameters derived from each treatment's full duration. Each treatment had two biological replicates (sub-samples derived from a single composite of replicate transects per soil type), and control soils were maintained at 5 % WHC.
Previously homogenized soils were sub-sampled and added to jars at an equivalent of 30 ± 0.5 g dry mass. After adding a predetermined amount of ultra-pure water (18.2 MΩ cm), the jars were kept at room temperature (ca. 25 °C), matching the average summer soil temperature (when most precipitation occurs) at the site (UNL Soil Temperature Data). Jars were sealed with lids fitted with rubber septa for headspace gas collection, and silicone gel was applied around the septa to prevent gas leakage.
In the continuous wet experiment, soils were maintained at 60 % WHC and sealed until sampling. On average, water loss was 0.01 mL d−1, ranging from 0.005 to 0.02 mL d−1. Water was added after gas sampling to avoid inducing the Birch effect. After each sampling, lids were left open for one hour to allow CO2 equilibration with ambient air.
In the drying–rewetting experiment, soils were rewetted every 7 d by slowly adding Milli-Q water to reach 60 % WHC. After water addition, jars were sealed, and headspace gas was sampled 6 h later to capture Birch effect emissions. Soils were then dried to 5 % WHC over the course of 2–3 d by removing the lids and incubating at ca. 25 °C; respiration was not measured during this period.
2.3.2 Sampling schedule and CO2 analysis
In the continuous wet experiment, headspace gas samples for CO2 analysis were collected on days 1, 3, 5, 7, 11, 16, 27, 55, 82, 114, 151, and 225. After each sampling, jar lids were opened for one hour to equilibrate with ambient air.
In the drying–rewetting experiment, jars were sealed for 6 h after water addition, and headspace gas was sampled on days 1, 7, 21, 28, 35, 42, and 49 to evaluate the Birch effect. Control samples were collected on the same days for both experiments.
Evolved CO2 concentrations were analyzed using a Shimadzu 2014 gas chromatograph (Kyoto, Japan) with a thermal conductivity detector at UC Merced and an LI-830 infrared gas analyzer (IRGA) at Lawrence Livermore National Laboratory (LLNL).
2.4 Statistical analyses
All statistical analyses were performed using CRAN-R 4.5.0 (R Core Team, 2025). Soil-respired CO2 measurements from incubation experiments were averaged across two biological replicates per treatment. Control samples were represented by single measurements due to sample constraints. Accordingly, statistical comparisons involving controls were interpreted with caution.
The concentration of soil-respired CO2 was expressed as the mass of C respired per unit mass of SOC, calculated as:
For the continuously wet incubation, cumulative respiration was calculated by summing CO2 fluxes over the 225 d experiment. Two-pool first-order decay models were fitted to cumulative respiration data according to:
where is the cumulative mass of C (µg) respired by day t, C0 denotes TOC, ff and fs represent the fast- and slow-cycling fractions of SOC (with ), and kf and ks are the corresponding decay rate constants. Models were fitted using non-linear least-squares optimization with the minpack.lm package (Elzhov et al., 2023).
For the wet-dry cycling incubation, cumulative respiration was calculated by summing CO2 fluxes over wetting periods only, assuming negligible respiration during drying phases (Chaopricha and Marín-Spiotta, 2014). The effective incubation time (t) was approximated as the cumulative duration of wetting events (2 d over a 49 d experiment). Two-pool decay models were initially fitted following the same approach as for the continuously wet incubation.
Preliminary model fits indicated that the fast-cycling pool contributed negligibly to respiration during wet-dry cycling (slow : fast pool ratio ), consistent with a functionally homogeneous system. Consequently, one-pool first-order decay models were also fitted for both incubation treatments:
where k represents the single-pool decomposition rate constant.
The effects of transect type, paleostatus, degree of burial or exposure, and their interactions on SOM decomposition parameters (decay rates and pool sizes) were evaluated using linear mixed-effects models, treating biological replicates as a random effect (controls excluded). These analyses were conducted using the nlme (Pinheiro et al., 2024) and emmeans (Lenth, 2024) packages. Significant differences among factor levels were assessed using pairwise Sidak-adjusted comparisons. For the wet-dry cycling experiment, similar models were applied to analyze daily CO2 pulse responses.
Total CO2 losses during wet-dry cycling (49 d) were compared to modeled CO2 losses over an equivalent duration under continuous wetting using linear mixed-effects models with paleostatus, transect type, and degree of burial or exposure as fixed effects and replicate as a random effect. Marginal means and pairwise comparisons were used to contrast incubation treatments. For control samples, paleostatus and transect type were treated as fixed effects and degree of burial or exposure as a random effect. Despite limited replication, the large magnitude of difference between control and treatment fluxes (>45-fold) indicates that moisture addition, rather than incubation artifacts, drove observed respiration patterns.
Mean cumulative CO2 losses between control and treatment groups were further compared using a Welch test following confirmation of unequal variances via a Bartlett test, implemented in the stats package (RStudio Team, 2019). Linear mixed-effects models were also used to evaluate the effects of transect type and paleostatus on cumulative CO2 losses in control samples, with degree of burial or exposure treated as a random effect.
Multiple linear regression (MLR) was used to quantify the influence of soil physicochemical properties (soil pH, EC, TOC and TIC contents, SAR, texture, and exchangeable base cations) on modeled SOM decomposition parameters. For the continuously wet incubation, MLR models were applied to fast- and slow-pool decay rates and slow-pool fraction sizes derived from two-pool models. For the wet–dry cycling incubation, MLR analyses were conducted on decomposition rates derived from one-pool models. Model selection followed stepwise forward and backward procedures, prioritizing parsimony based on Akaike Information Criterion (AIC) values using the MASS package (Venables and Ripley, 2002). Model coefficients, intercepts, R2, and root mean squared error (RMSE) were calculated using the stats package. Pairwise Pearson correlation matrices were generated to visualize relationships among soil properties and SOM decomposition parameters using the stats and ggplot2 packages (RStudio Team, 2019).
3.1 General soil properties
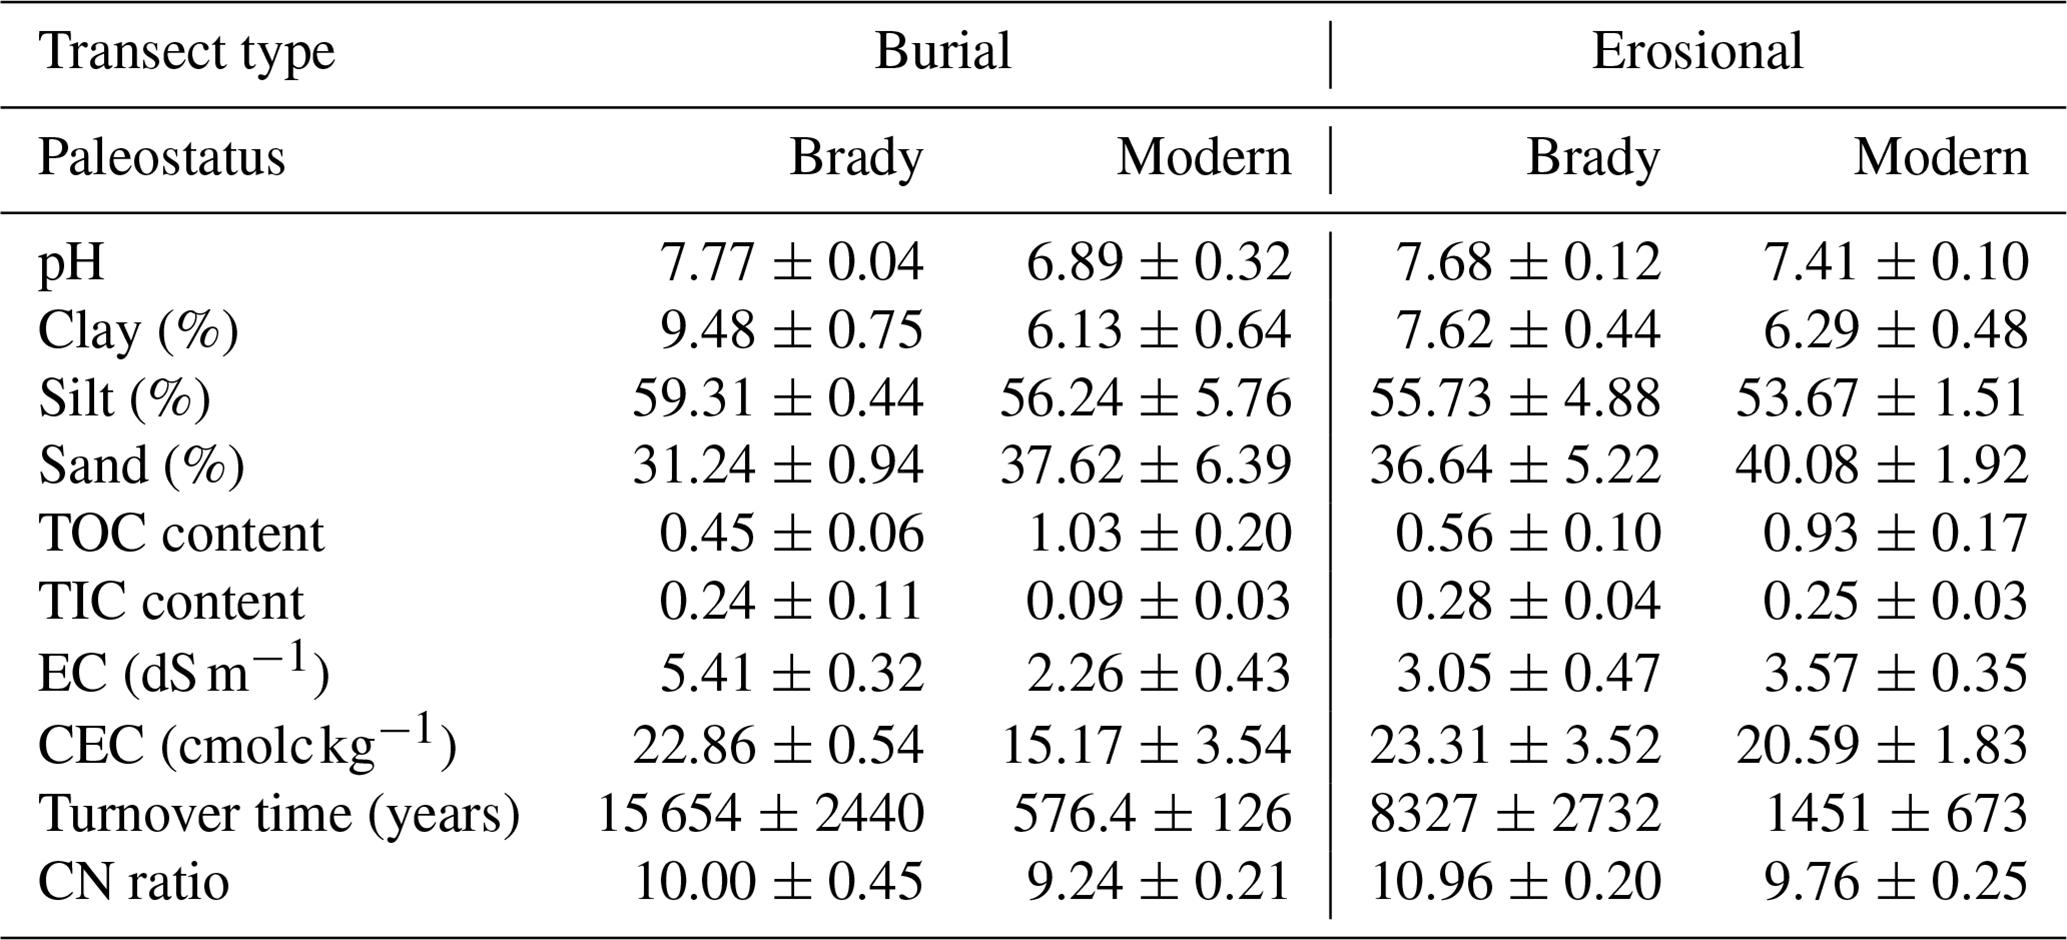
The physicochemical properties of soils used in the incubation experiment are shown in Table 1. The soils were relatively alkaline (pH ranging from 6.89 to 7.77), especially the Brady Soil (pH>7.6). The clay, silt and sand content placed the soils in the texture class category of silt loam. Total organic carbon was higher in modern soils due to active biomass inputs, while inorganic carbon content was higher in the Brady Soil due to carbonate formation (Dolui et al., 2026b). The Brady soil of the burial transect was classified as saline (mean EC of 5.41 dS m−1) and the CEC of soils was moderately high, ranging from 15.17–23.31 cmolc kg−1 and indicating the presence of higher activity clays. The turnover time of bulk soils as derived from radiocarbon-based models, was much greater in the Brady Soil (8327–15 654 years) compared to modern soils (576.4–1451 years), confirming the long-term stability of SOM in the paleosol (Dolui et al., 2026b). The mean CN ratio in both Brady and modern soils was relatively low (ca. 10), indicating a sufficient supply of N for plant growth and microbial activity.
Table 1General physicochemical (mean ± standard deviation) of soils used in the incubation experiment, grouped by transect type and paleostatus.
3.2 Effects of continuous wetting on soil CO2 efflux
Cumulative C lost from soils via respiration of CO2 during the continuously wet incubation are shown in Fig. 2. Raw incubation data and figures of merit of statistical comparative tests are available online at DOI: https://doi.org/10.17632/fjw646gpyf.1 (Nel, 2025).
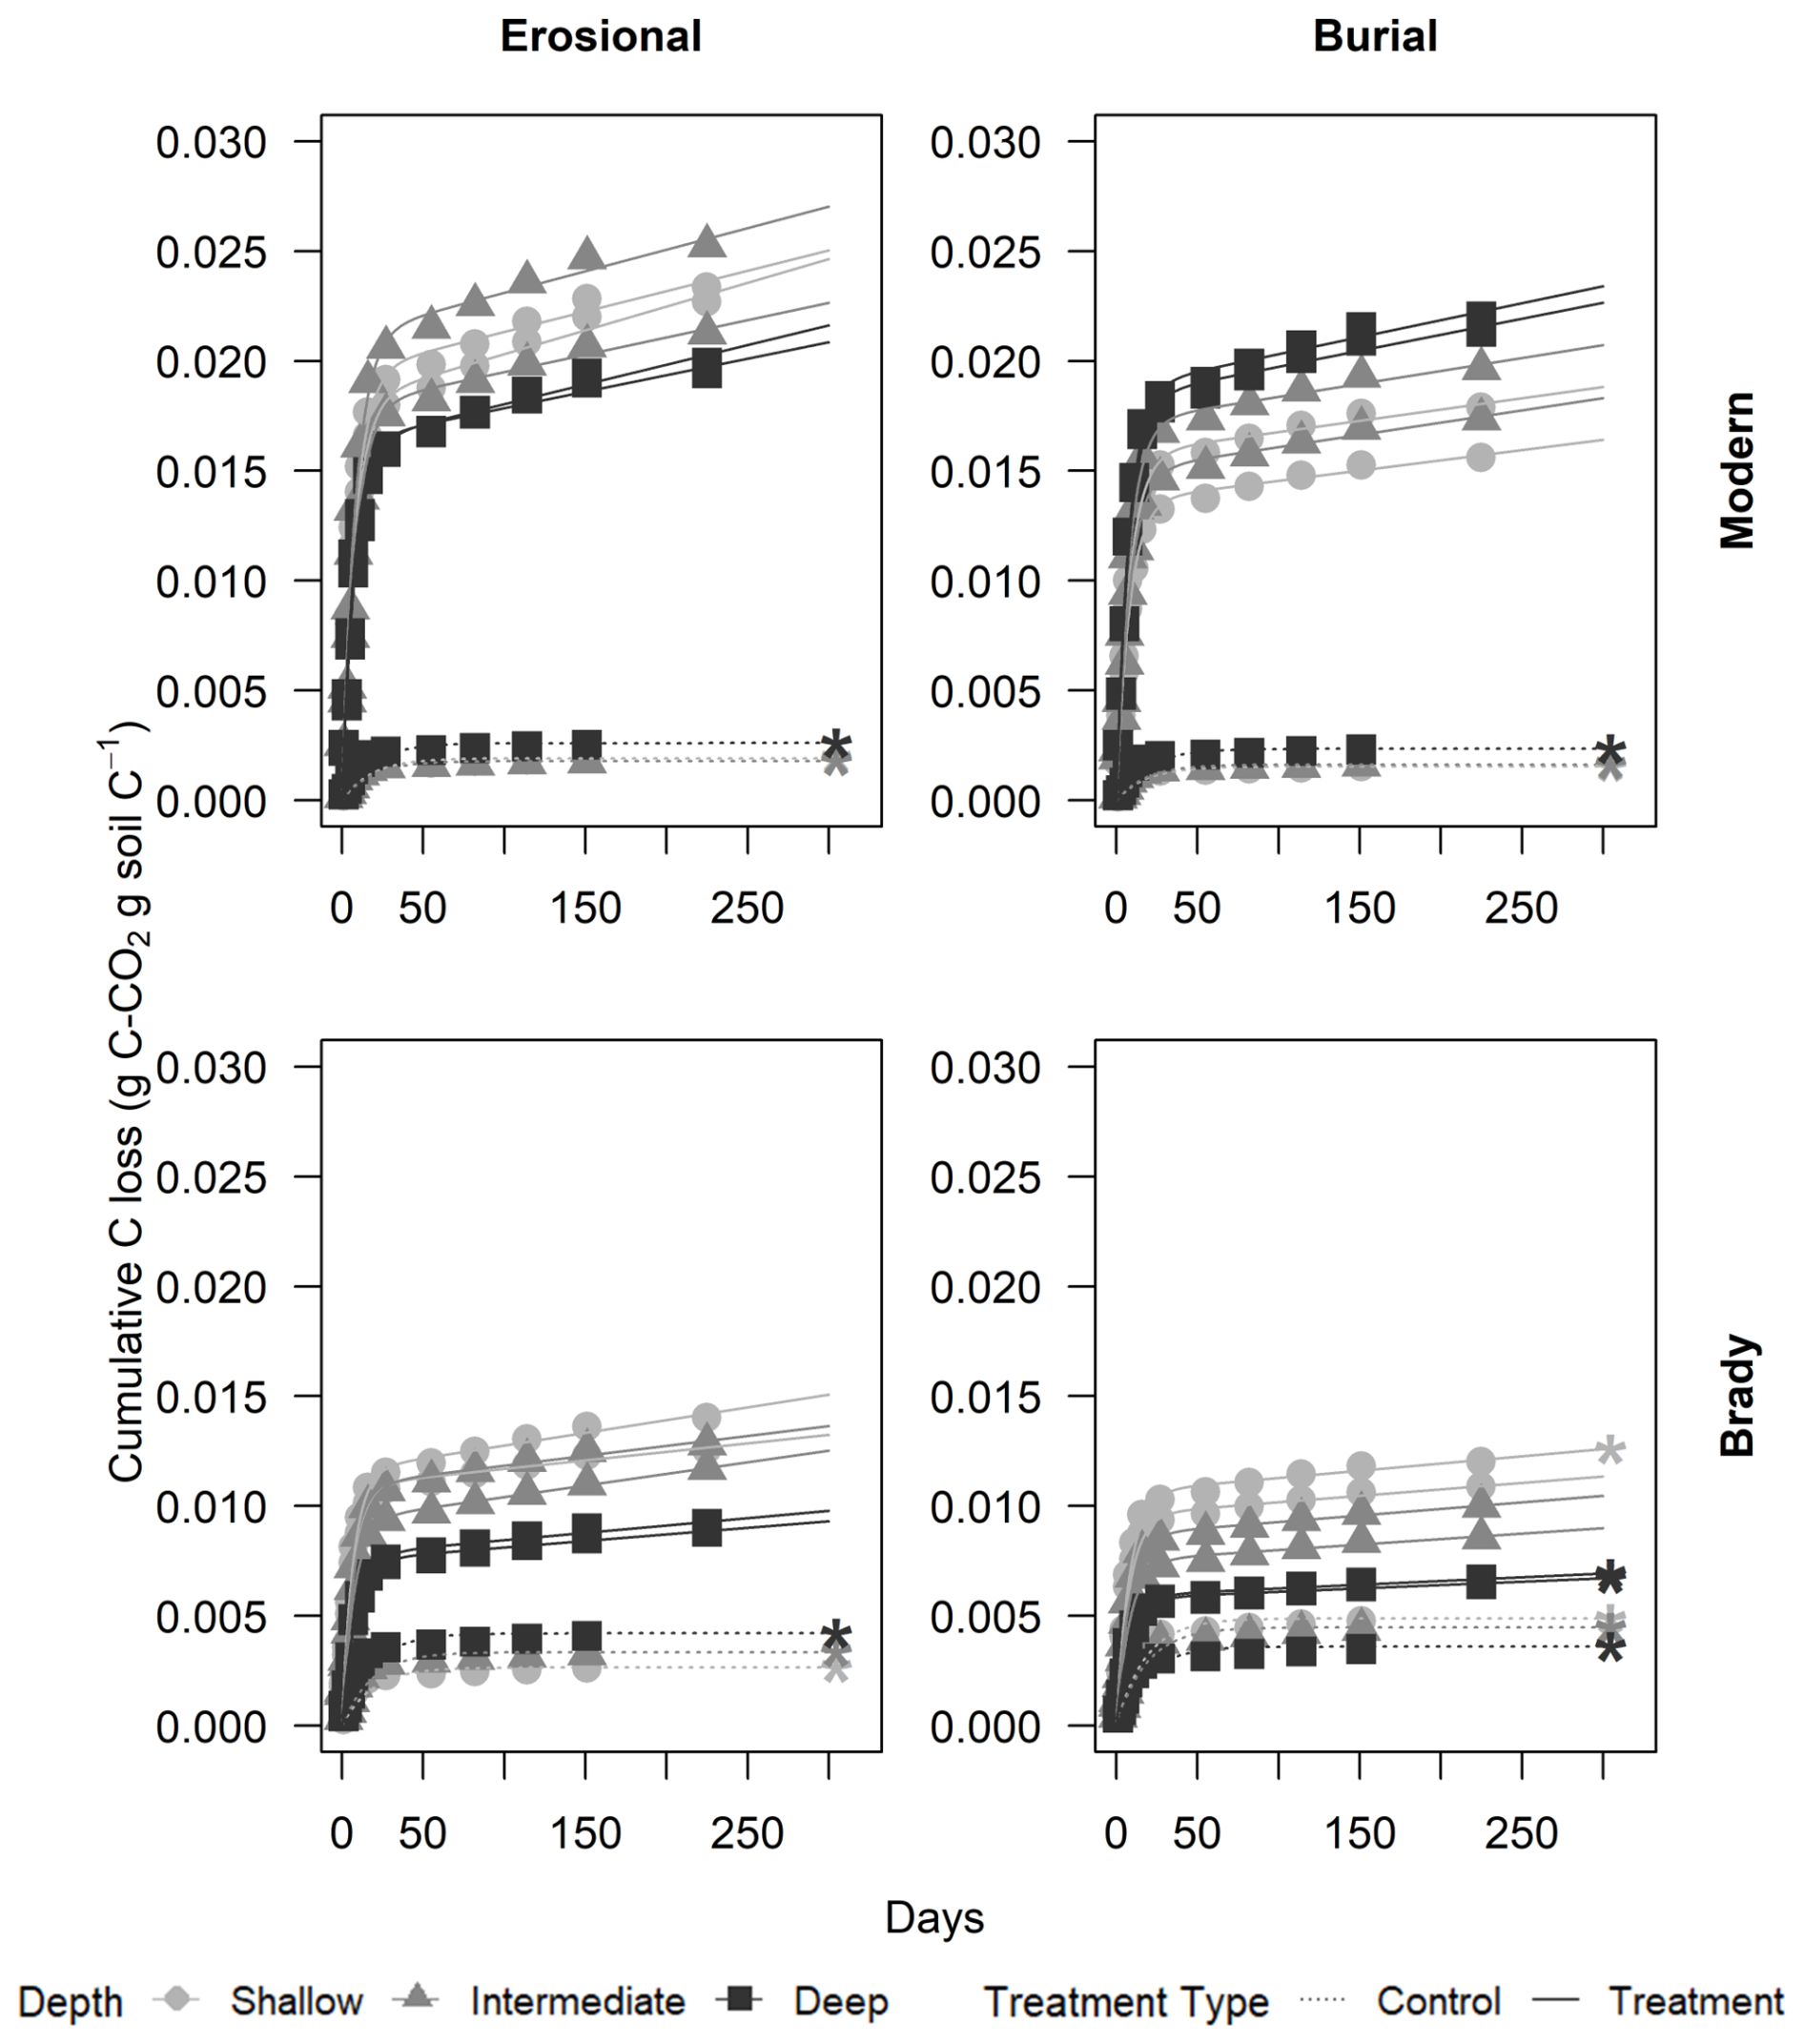
Figure 2Cumulative respiratory CO2 from modern and Brady Soil sampled from three depths representing varying degrees of burial/erosional exposure (two technical replicates each). In burial transects, Shallow → Intermediate → Deep corresponds to burial degrees I → II → III. In erosional transects, this relationship is reversed, with Shallow → Intermediate → Deep corresponding to exposure degrees III → II → I. Soils were maintained at a constant moisture content of 60 % water holding capacity (WHC). Lines depict a two-pool first-order decay model, fitted using a non-linear least-squares function. The dotted line represents the control (5 % WHC).
In the continuous wet soil treatment group, modern soils evolved significantly higher CO2 (mean of 30.6 mg CO2-C g C−1) compared to Brady Soil (mean of 15.9 ± 2.39 mg CO2-C g C−1) after 225 d of incubation (p<0.01). Soils of the erosional transect type had greater cumulative C loss (mean of 29.3 mg CO2-C g C−1) compared to the burial transect (mean of 17.3 ± 2.39 mg CO2-C g C−1, p<0.01). However, the difference between cumulative C losses of erosional vs. burial transect types was not significant at the greatest degree of burial and lowest degree of erosion.
Modern soil in the erosional transect had significantly higher cumulative C losses (mean of 35.9 mg CO2-C g C−1) than modern soil of the burial transect (mean of 25.3 mg CO2-C g C−1, p<0.05). Similarly, Brady Soil of the erosional transect had significantly higher cumulative C losses (mean of 22.6 mg CO2-C g C−1) compared to the burial transect (mean of 9.28 mg CO2-C g C−1, p<0.05).
The Brady soil with an intermediate degree of erosion had higher cumulative CO2 loss (mean of 33.2 mg CO2-C g C−1) compared to Brady Soil of the lowest and highest degrees of erosion, while the Brady soil with the greatest degree of burial had the lowest cumulative CO2 loss (mean of 4.14 mg CO2-C g C−1, differences not significant). For Brady soil of the burial transect, the magnitude of cumulative CO2 efflux among different degrees of burial was in the order of I > II > III, whereas in the erosional transect, cumulative CO2 efflux among different degrees of erosion was II > III > I.
The cumulative CO2 evolution of 60 % WHC continuous wet experiments (mean of 23.3 mg CO2-C g C−1) was significantly greater than control soils maintained at 5 % WHC (mean of 0.478 mg CO2-C g C−1, p<0.001). Among the control soils, Brady Soil of the burial transect had significantly greater C losses (mean of 0.561 mg CO2-C g C−1) compared to modern soils (mean of 0.253 ± 0.0683 mg CO2-C g C−1, p<0.05), but C losses in modern and Brady Soil were more similar in the erosional transect (mean of 0.254 and 0.444 mg CO2-C g C−1 for modern and Brady Soil respectively, n.s.).
Significance of differences in cumulative CO2 losses among degree of burial/exposure for control samples could not be tested due to lack of replication, but we report observed differences. Among the burial transect control soils, Brady soil with the lowest degree of burial produced the greatest cumulative CO2 loss, while modern soil collected from the intermediate degree of burial soil produced the least cumulative CO2 loss. Among the erosional transect control soils, the most CO2 was evolved in the Brady soils with intermediate erosion, and the lowest CO2 was evolved in the modern soil collected from the lowest degree of burial.
3.3 Effect of drying and rewetting on soil CO2 efflux
Daily C lost from soils via respiration of CO2 during the dry-rewetting incubation are shown in Fig. A1 and cumulative C losses are shown in Fig. 3. Soil respiration data from the dry-rewetting incubation are available online at DOI: https://doi.org/10.17632/fjw646gpyf.1 (Nel, 2025).
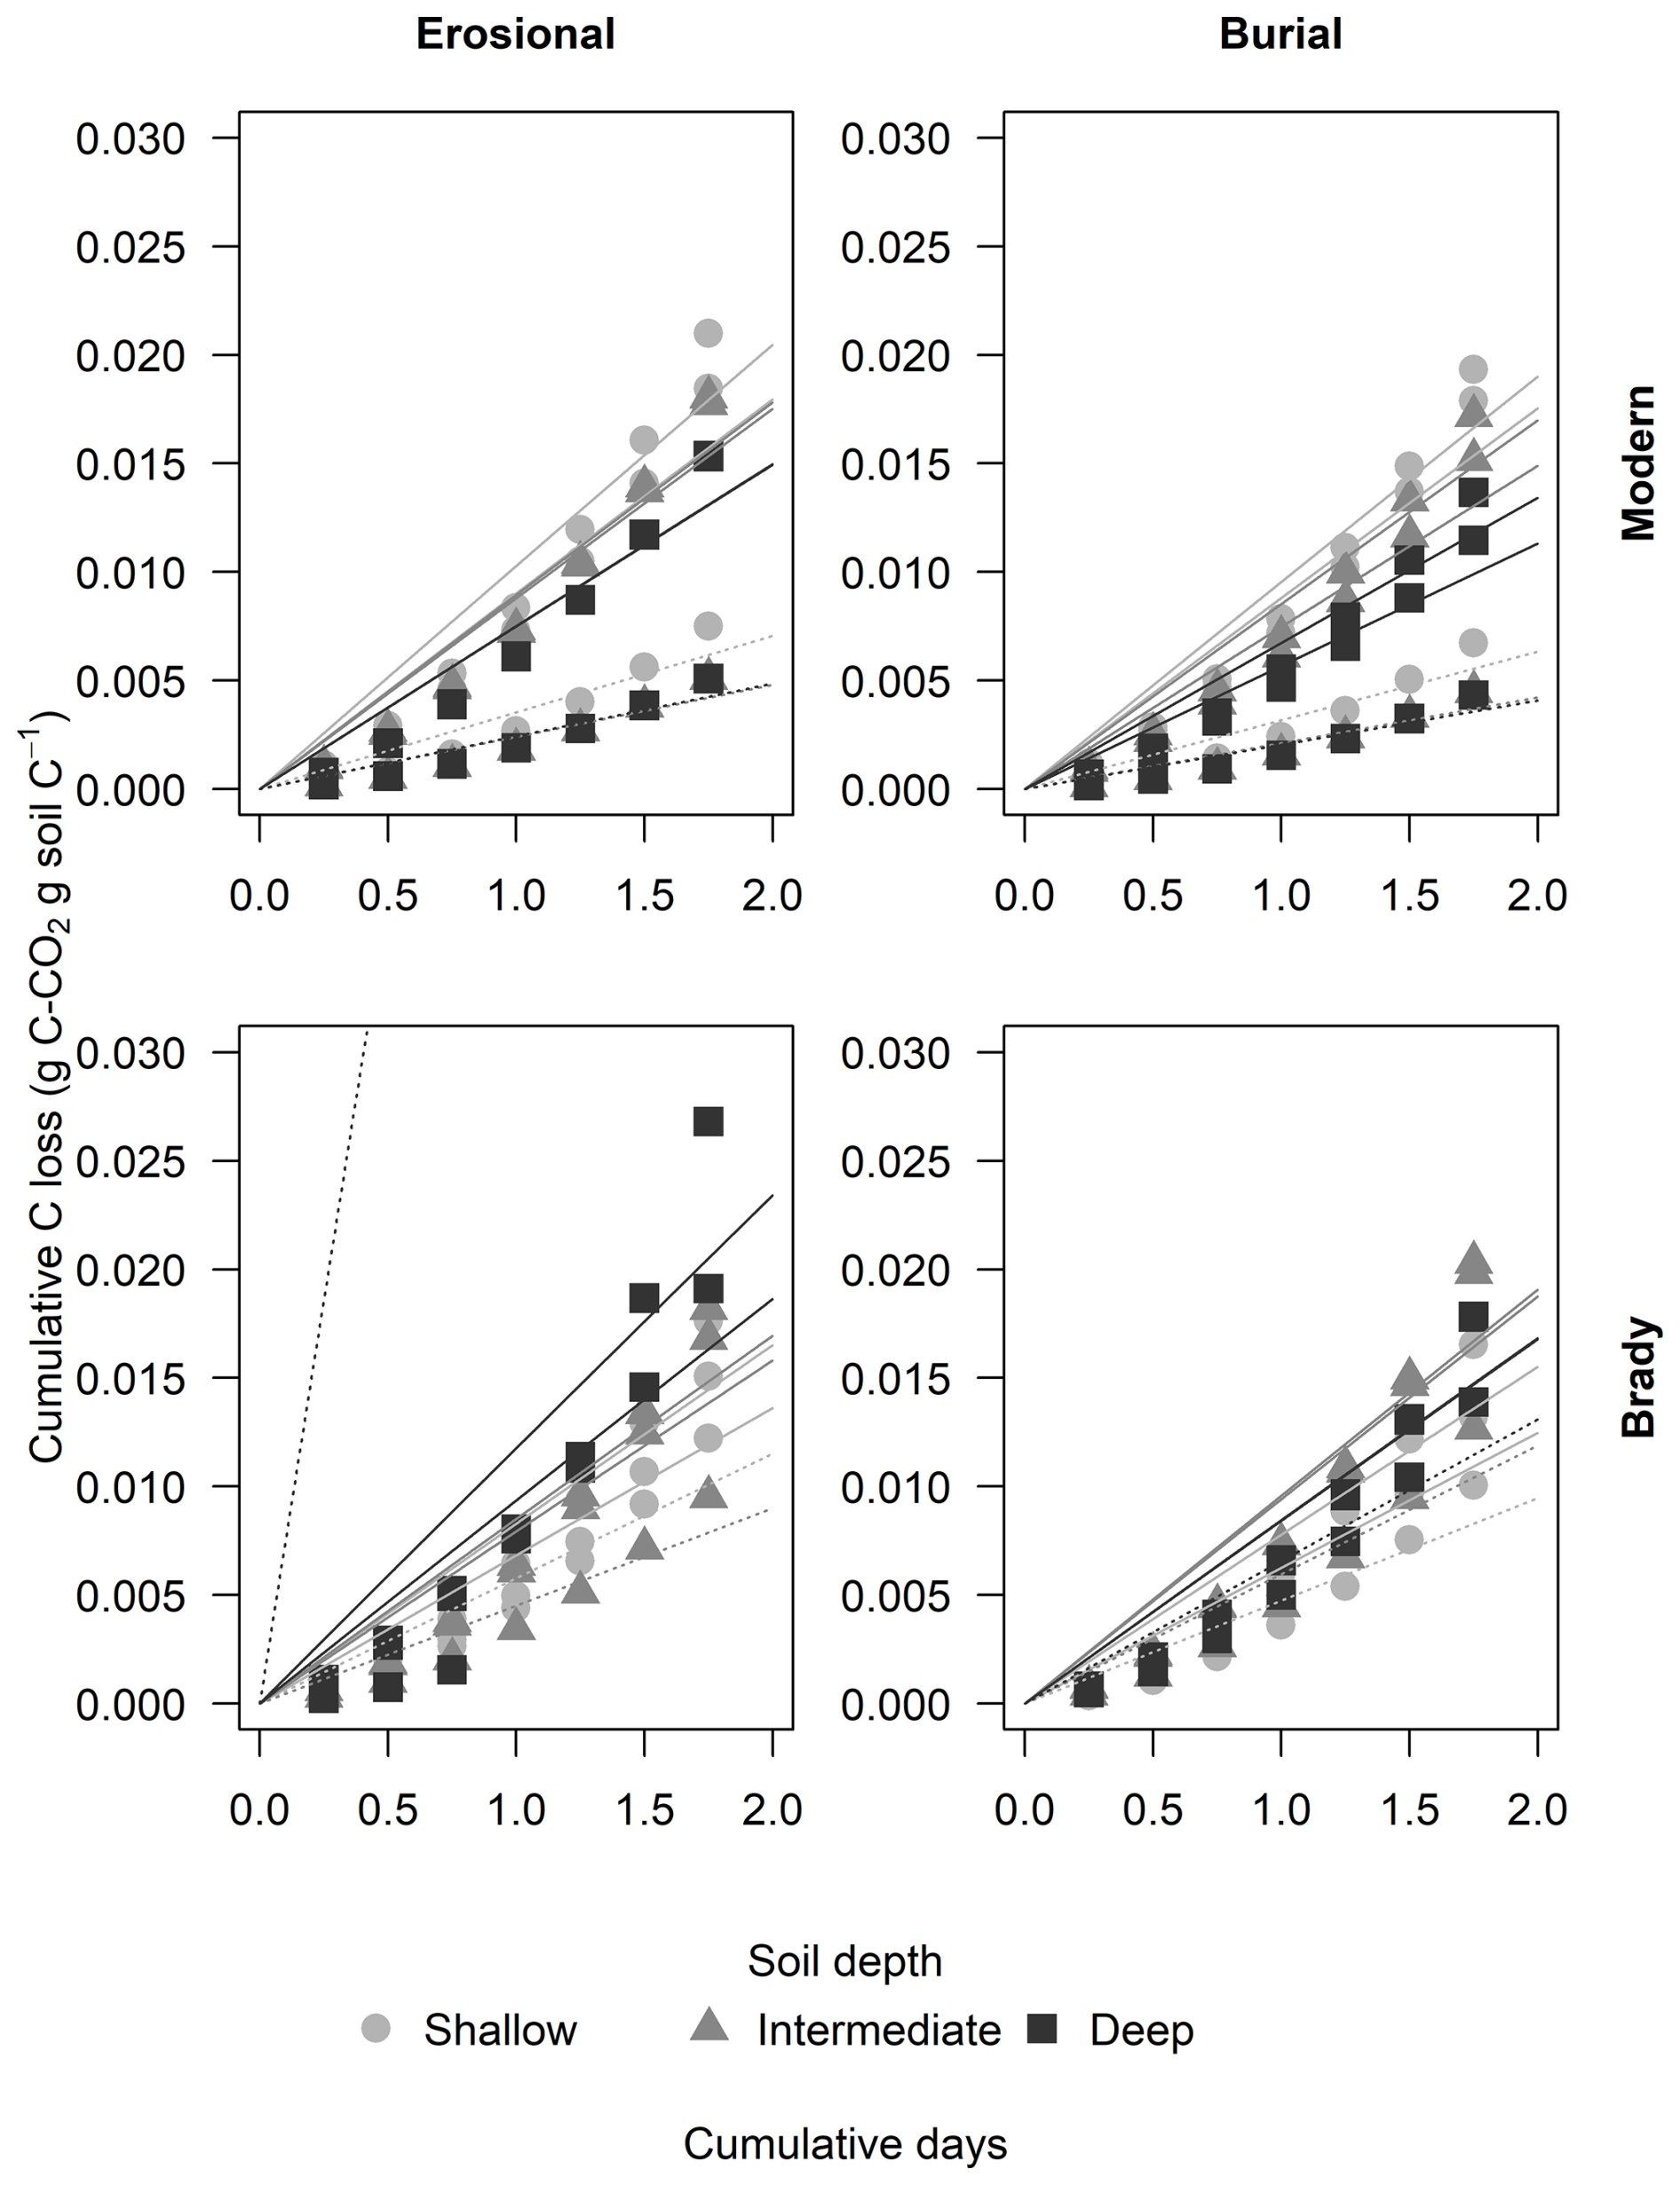
Figure 3Cumulative respiratory CO2 flux from modern and Brady Soil sampled from three depths representing varying degrees of burial/erosional exposure (two technical replicates each). In burial transects, Shallow → Intermediate → Deep corresponds to burial degrees I → II → III. In erosional transects, this relationship is reversed, with Shallow → Intermediate → Deep corresponding to exposure degrees III → II → I. Soils were wetted to a moisture content of 60 % water holding capacity (WHC) and allowed to dry to 5 % WHC. Lines depict a one-pool first-order decay model, fitted using a non-linear least-squares funtcion. The dotted line represents the control (constant 5 % WHC); one control Brady soil sample of the erosional transect had an outlier point not shown due to scale. Asterisks (*) indicate control samples maintained at 5 % WHC.
The largest respiration fluxes were produced on the first day, with significantly greater cumulative CO2 loss from modern soils (mean of 0.920 mg CO2-C g C−1) compared to Brady Soil (mean of 0.729 ± 0.034 mg CO2-C g C−1, p<0.01), but the reverse was observed at the greatest degree of burial. Respiration pulses declined over time for all soils. Control soils had a lower d−1 pulse CO2 (mean of 0.295 mg CO2-C g C−1) compared to the dry-rewetting treatment (mean of 0.824 mg CO2-C g C−1, p<0.001), but there was no significant difference between the cumulative CO2 loss from control (21.9 mg CO2-C g C−1) and treatments (17.5 mg CO2-C g C−1) by the final day of incubation.
After 49 d of incubation under wet-dry cycles, the Brady Soil from both the burial and the erosional transects emitted significantly more cumulative CO2 (0.0183 g CO2-C g C−1) than Brady Soil incubated under continuously wet conditions (0.009 ± 0.0005 g CO2-C g C−1, p<0.001). However, there was no significant difference between cumulative CO2 loss in modern soils incubated under wet-dry cycles versus continuous wet conditions.
The order of magnitude of total CO2 emission after 49 d followed the order erosional modern > erosional Brady > burial modern > burial Brady. Soils of the erosional transect (mean of 18.3 mg CO2-C g C−1) had significantly greater cumulative CO2 loss compared to the burial transect (mean of 16.7 ± 0.643 mg CO2-C g C−1, p<0.01). Modern soil had significantly greater cumulative CO2 loss (mean of 16.7 mg CO2-C g C−1) than Brady Soil (mean of 18.3 ± 0.390 mg CO2-C g C−1, p<0.001), but the difference was not significant at the intermediate degree of erosion. Modern soil with the highest degree of erosion emitted significantly more cumulative CO2 (19.2 mg CO2-C g C−1) than modern soil with the greatest degree of burial (13.9 mg CO2-C g C−1, p<0.05). However, the opposite was observed in Brady Soil, where that with the greatest degree of burial emitted more cumulative CO2 (15.6 mg CO2-C g C−1) compared to the soil with the greatest degree of erosion (20.4 mg CO2-C g C−1, p<0.05). Among the control soils, although Brady Soil emitted more cumulative CO2 than modern soil, there was no significant difference. This was likely due to large variation of the depth-pooled samples (in absence of control replicates), as a result of the much larger CO2 loss from Brady Soil of the erosional transect with the lowest degree of erosion compared to other samples.
3.4 Decay rates and fraction sizes of soil organic matter pools
The decomposition rate of the slow pool and size of the fast pool under continuous wetting is shown in Fig. 4 and the decomposition rate of SOM (single pool) under wet-dry cycles is shown in Fig. 5. Statistical figures of merit of linear mixed-effects models are available online at DOI: https://doi.org/10.17632/fjw646gpyf.1 (Nel, 2025).
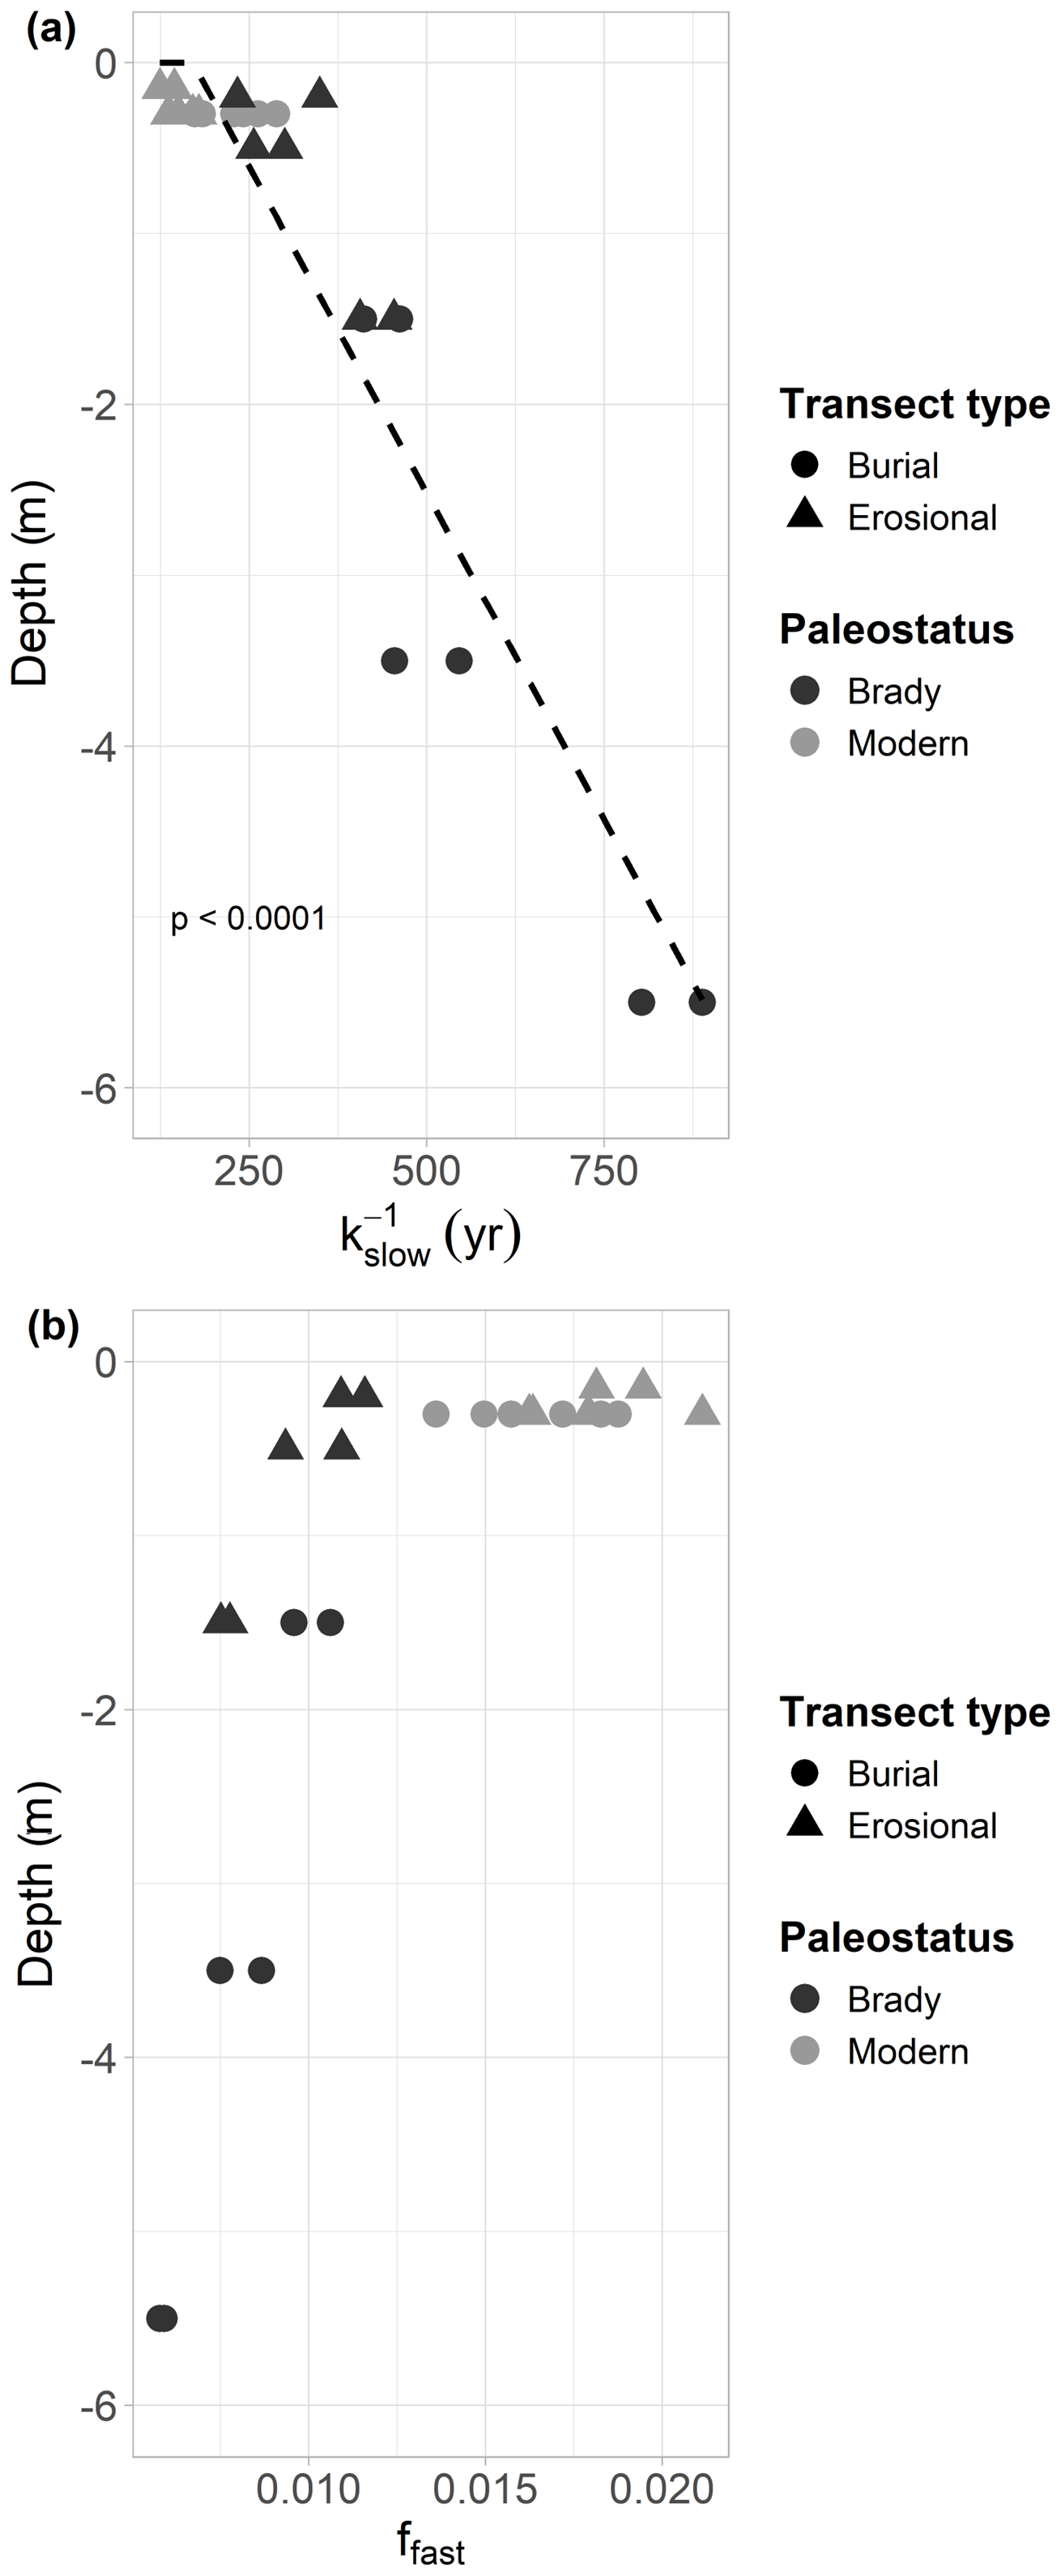
Figure 4Decay constant of the slow cycling pool of modern and Brady soils at different depths (from the soil surface), incubated under continuously wet conditions. Samples collected from burial and erosional transect types. Dotted line indicates exponential decay. Panel (b) indicates the size of the fast-cycling pool at different depths (from the soil surface) of the modern and Brady soils in burial and erosional transect types.
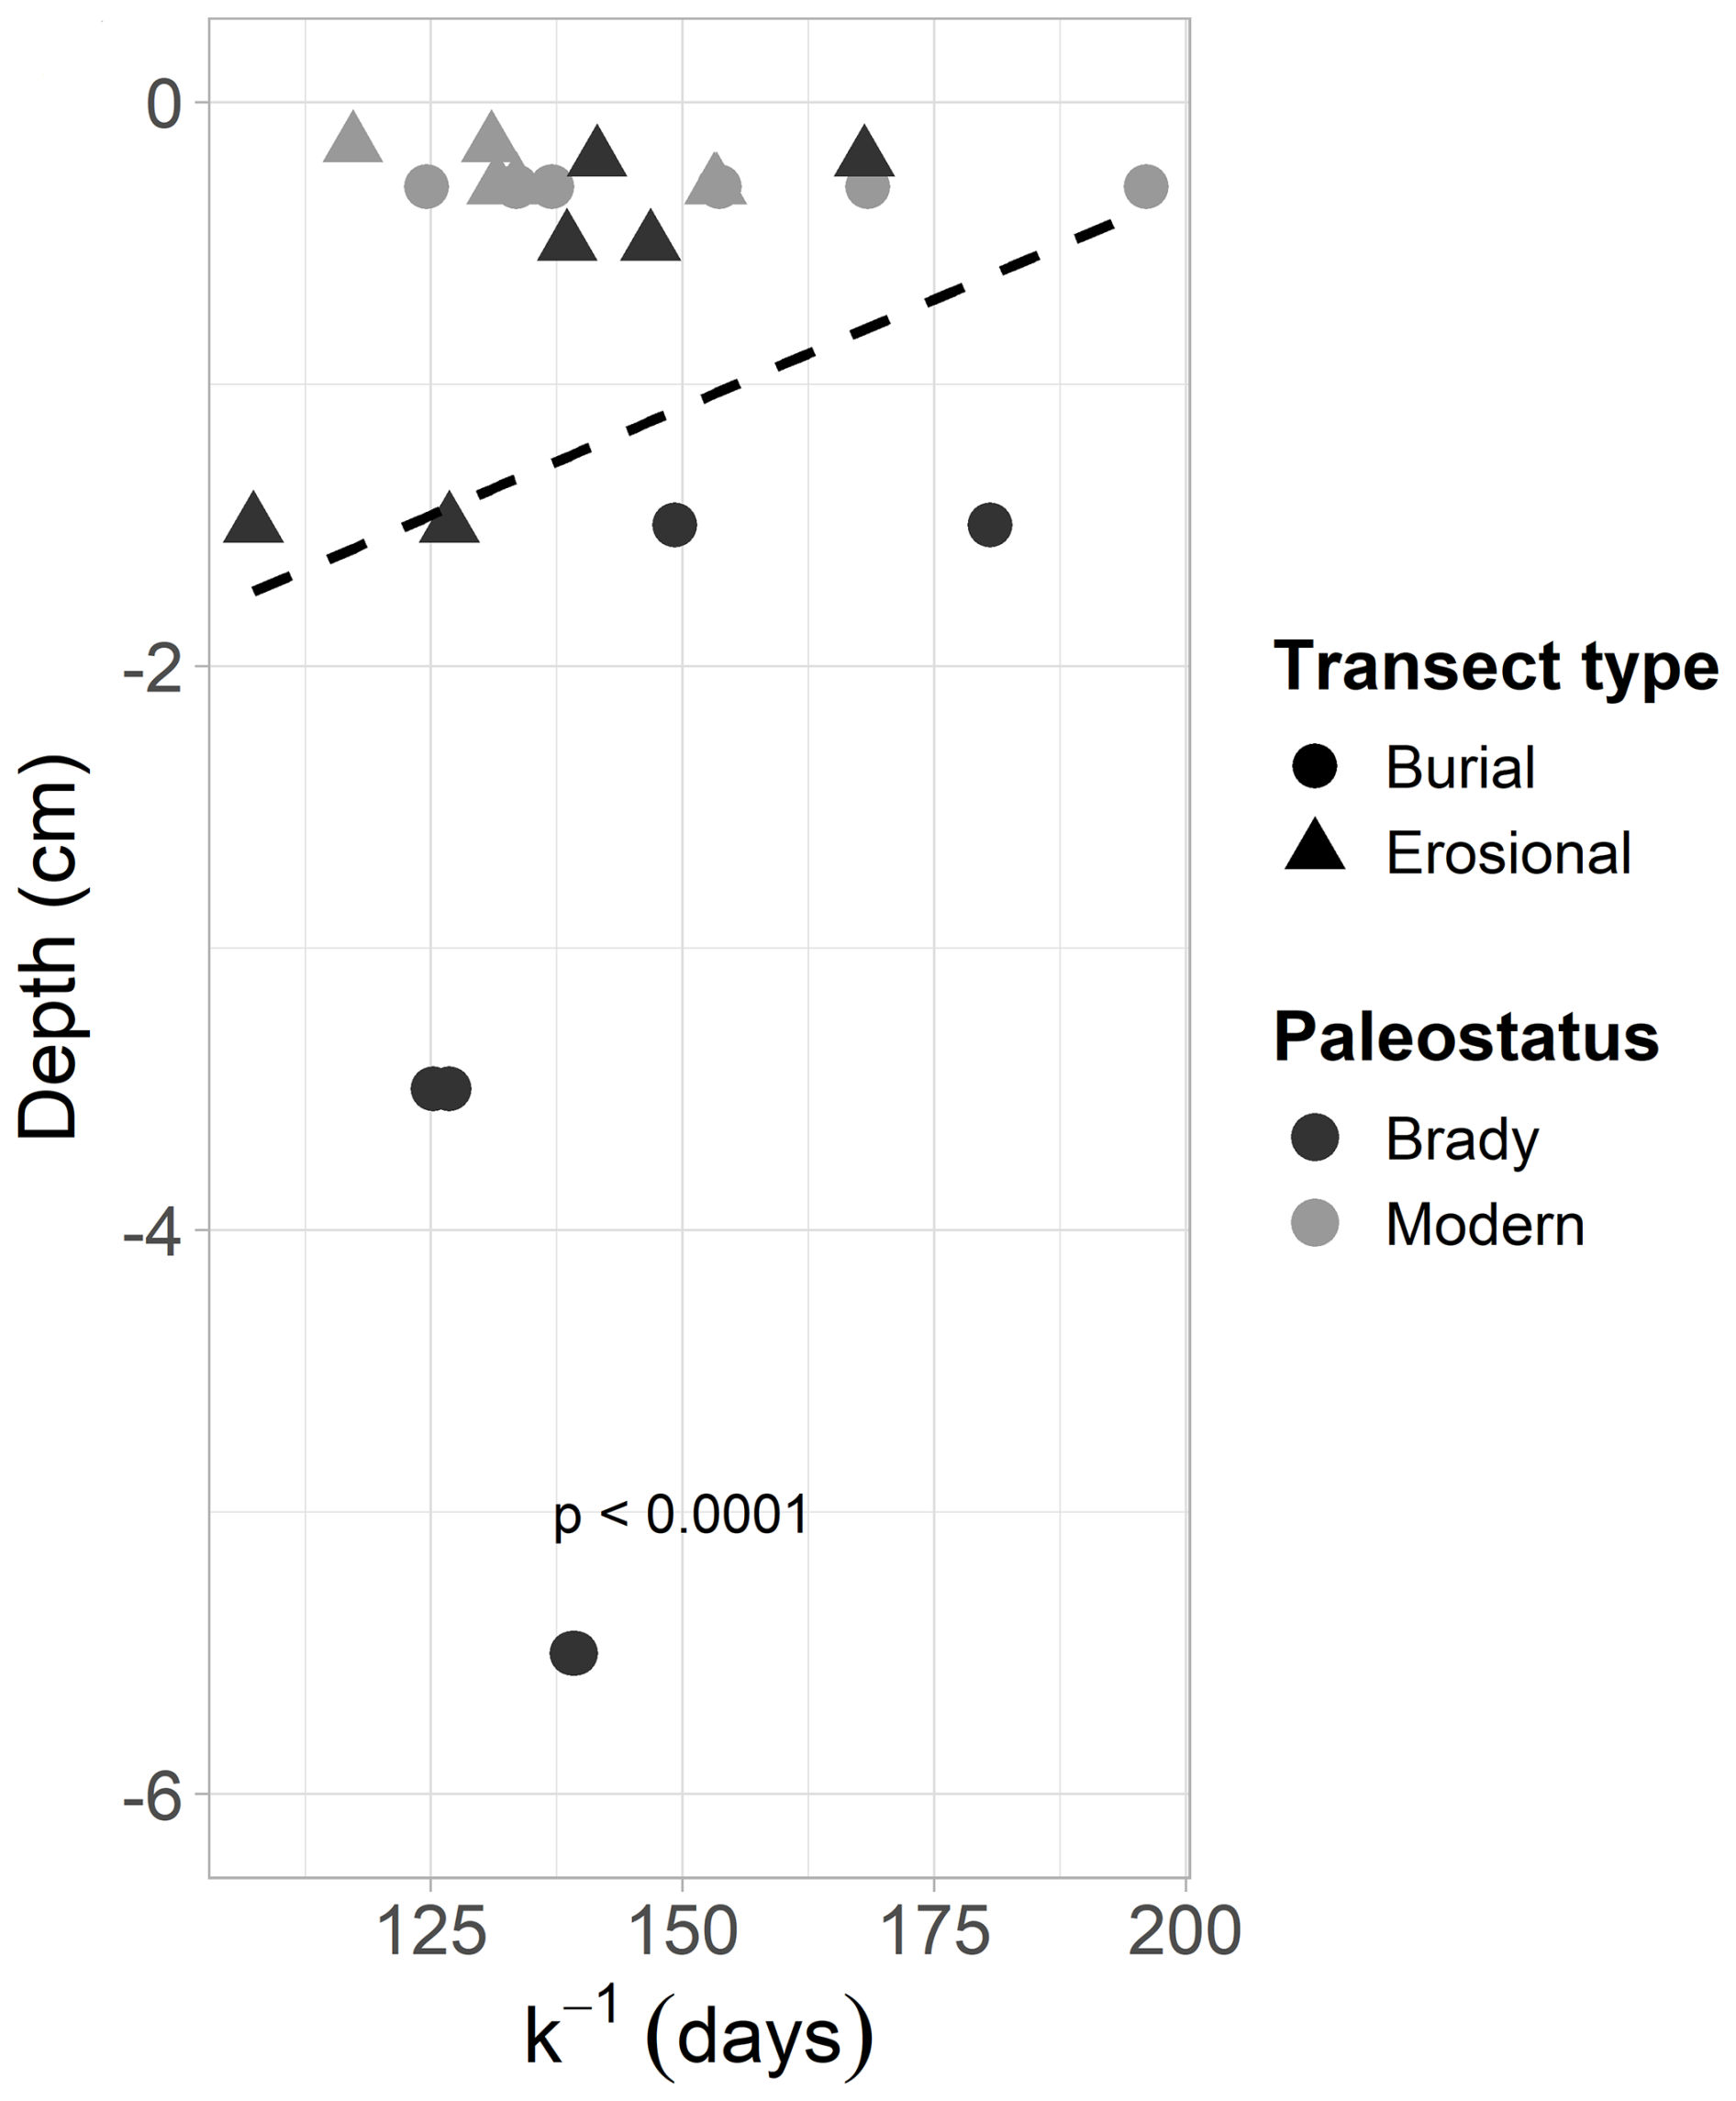
Figure 5Decay constant of the slow cycling pool of modern and Brady soils at different depths (from the soil surface), incubated under wet-dry cycling conditions. Samples collected from burial and erosional transect types. Dotted line indicates exponential decay.
The slow-cycling SOM pool under continuous wetting decayed ca. 2000 times more slowly than the fast-cycling pool, with a significantly lower mean decay rate in the burial transect ( d−1 i.e., 315 years turnover time, henceforth referred to as TOT) compared to the erosional transect ( ± d−1 i.e., 201 years TOT, p<0.01). Thus, higher decay rates correspond to faster (shorter) turnover times throughout this section. The mean decay rate of the slow-cycling SOM pool of Brady Soil ( d−1 i.e., 399 years TOT) was significantly lower than that of modern soil ( d−1 ± , i.e., 178 years TOT, p<0.001). The mean decay rate of the slow-cycling SOM pool of modern soil in the burial transect was significantly greater at the greatest degree of burial ( d−1 i.e., 178 years TOT), compared to the lowest degree of burial ( d−1 i.e., 275 years TOT, p<0.05).
The mean decay rate of the fast-cycling SOM pool of the erosional transect (0.130 d−1 i.e., 7.68 d TOT) under continuous wetting was significantly higher (i.e., faster turnover) than that of the burial transect (0.126 ± 0.001 d−1 i.e., 7.96 d TOT, p<0.05). The mean decay rate of the fast-cycling SOM pool of Brady Soil in the erosional transect was significantly greater at the greatest degree of erosion (0.144 d−1 i.e., 6.96 d TOT) compared to the lowest degree of erosion (0.121 d−1 i.e., 8.25 d TOT, p<0.01).
The decay rate of SOM (one-pool model) under wet-dry cycles did not differ significantly among soils of different paleostatus or transect type. In the two-pool model, the decay rate of the slow-cycling SOM pool under wet-dry cycles was significantly higher in the erosional transect (0.007 d−1 i.e., 129 d TOT) compared to the burial transect (0.009 ± .0002 d−1 i.e., 117 d TOT, p<0.05), indicating faster SOM turnover where decay rates were higher. The decay rate of the fast-cycling SOM pool in the burial transect was significantly higher in modern soil (8.11 ± 1.94 d−1 i.e., 0.123 d TOT) compared to Brady soil (0.558 d−1 i.e., 1.79 d TOT).
The slow-cycling pools of both modern and Brady Soil under continuous wetting contained a much greater proportion of total SOC (>96 %) than the fast-cycling pool. The fraction size of the fast-cycling pool relative to the slow-cycling pool under continuous wetting was significantly greater in the erosional transect (0.014) compared to the burial transect (0.012 ± 0.0003, p<0.01) and significantly greater in modern soils (0.0173) compared to Brady Soil (0.009 ± 0.0003, p<0.001). The fraction size of the fast and slow pools tended to 0 and 1.0 respectively in all soils under wet-dry cycling, nullifying the statistical comparison results among soils of different paleostatus and transect types.
3.5 Decay rates and fraction sizes of soil organic matter pools in continuous wet versus wet-dry experiment
A summary of SOM decomposition model parameters (one-pool and two-pool) of the continuously wet and wet-dry cycling experiments is shown in Table 2. Statistical figures of merit of linear mixed-effects models are available online at DOI: https://doi.org/10.17632/fjw646gpyf.1 (Nel, 2025).
Table 2Soil organic matter (SOM) decomposition parameters (decay rate k of one-pool model, decay rates of fast- (kfast) and slow-cycling (kslow) SOM pools, and fraction sizes of fast (ffast) and slow (fslow) pools, grouped by experiment, transect type, and paleostatus.
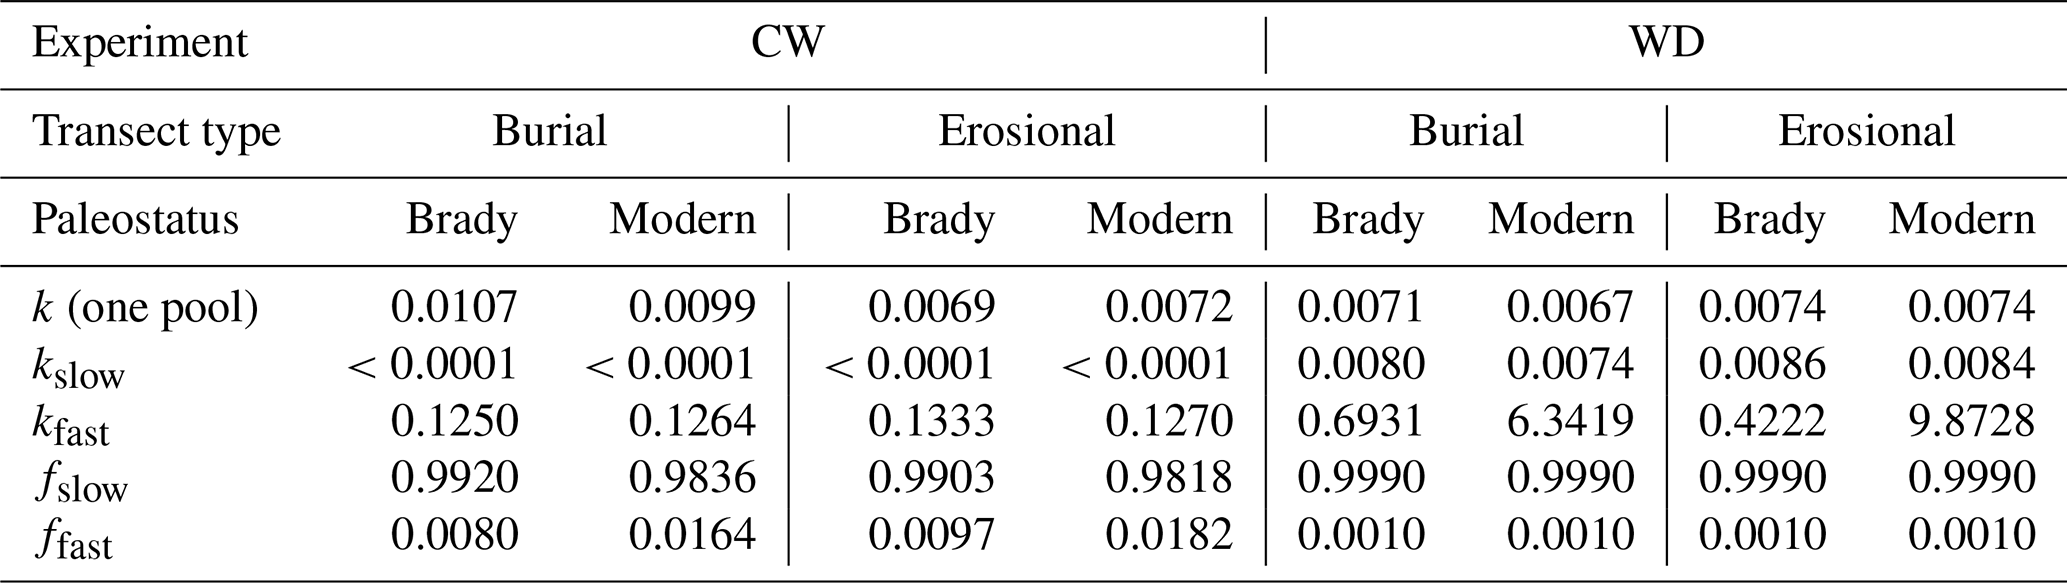
With the one-pool models, the continuously wet soils had a significantly higher decay rate (0.00865 d−1 i.e., 116 d TOT) compared to the wet-dry cycles (0.00714 d−1 i.e., 140 d TOT, p<0.01), indicating faster turnover under continuous wetting. In the burial transect, the one-pool decay constant of the continuous wet experiment was significantly higher (0.0103 d−1 i.e., 97.4 d TOT) than that of the wet-dry cycling experiment (0.00690 d−1 i.e., 145 d TOT, p<0.001). However, there was no significant difference between the decay constant of the continuous wet and wet-dry experiments in erosional transects. These trends were observed in both Brady and modern soils.
Among the control soils with one-pool models, the continuous wet experiment had a significantly higher decay rate (0.0376 d−1 i.e., 26.6 d TOT) compared to the wet-dry cycling experiment (0.00146 d−1 i.e., 179 d TOT, p<0.001), again meaning faster decomposition under continuous wetting. This was true in both burial (continuous wet k=0.0374 d−1 i.e., 26.7 d TOT and wet-dry k=0.00372 i.e., 268 d TOT) and erosional (k=0.0377 d−1 i.e., 26.5 d TOT and wet-dry k=0.00746 d−1 i.e., 134 d TOT) transects, as well as Brady (continuous wet k=0.0376 d−1 i.e., 26.6 d TOT and wet-dry k=0.00871 d−1 i.e., 115 d TOT) and modern (continuous wet k=0.0375 d−1 i.e., 26.7 d TOT and wet-dry k=0.00248 d−1 i.e., 404 d TOT) soils.
With the two-pool models, the decay rate of the slow-cycling SOM pool in the continuously wet experiment was significantly lower ( d−1 i.e., 246 years TOT) than that of the wet-dry cycling experiment (0.00812 d−1 i.e., 123 d TOT, p<0.001), reflecting faster turnover in the wet-dry treatments. This was true in both Brady (continuously wet d−1 i.e., 399 years TOT, wet-dry k=0.0083 d−1 i.e., 120 d TOT) and modern (continuously wet d−1 i.e., 178 years TOT, wet-dry k=0.00793 d−1 i.e., 126 d TOT) soils, as well as both burial (continuously wet d−1 i.e., 316 years TOT, wet-dry k=0.00773 d−1 i.e., 129 d TOT) and erosional (continuously wet d−1 i.e., 202 years TOT, wet-dry k=0.0085 d−1 i.e., 118 d TOT) transects, and at all degrees of burial and erosional exposure.
The decay rate of the fast-cycling SOM pool in modern soil was significantly higher in the wet-dry cycling experiment (8.11 d−1 i.e., 0.123 d TOT) compared to the continuously wet experiment (0.127 d−1 i.e., 7.89 d TOT, p<0.001), indicating a much faster turnover response to rewetting. The decay rate of the fast-cycling pool in the erosional transect was also significantly higher in the wet-dry cycling experiment (5.148 d−1 i.e., 0.194 d TOT) compared to the continuously wet experiment (0.130 d−1 i.e., 7.68 d TOT). Separating these effects by degree of erosional exposure revealed that the significance of the difference between the fast pool decay rate in modern soils was more evident at the intermediate and lowest degree of erosion. The decay rate of the fast-cycling SOM pool did not differ significantly between continuously wet and wet-dry cycling experiments in Brady soils or in the burial transect.
Among the control soils with two-pool models, the continuous wet experiment had significantly lower slow pool decay rate ( d−1 i.e., 274 000 years TOT) compared to the wet-dry cycling experiment (k=0.005 d−1 i.e., 200 d TOT, p<0.01), again corresponding to much faster turnover in the wet-dry treatments. This was true in both the burial and erosional transects, modern and Brady Soil and at all degrees of erosion and burial.
In contrast to the main soil dataset described above, the decay rate of the fast-cycling SOM pool of control Brady Soil was significantly higher in the wet-dry cycling experiment (0.0556 d−1 i.e., 18.0 d TOT) compared to the continuously wet experiment (10.3 d−1 i.e., 0.0971 d TOT). This was true in both burial and erosional transects. In modern control soils, however, there was no significant difference between decay rates of fast-cycling SOM in continuously wet versus wet-dry cycling experiments.
The fraction size of the slow-cycling SOM pool in the wet-dry cycling experiment was significantly larger (0.999) than that of the continuously wet experiment (0.987, p<0.001) – this was true for both Brady and modern soils, across erosional and burial transects and at all degrees of erosion and burial. It follows that the fraction size of the fast-cycling SOM pool in wet-dry cycling experiments was significantly smaller (0.001) than that of the continuously wet experiment (0.0131, p<0.001) for soils of all transect types, paleostatus groups and degrees of erosion and burial. There was no significantly difference between fraction sizes of the slow-cycling SOM pool among the controls of the wet-dry cycling and continuously wet experiment; the fast-cycling pool was also similar among control soils of the two experiments.
3.6 Relationships between soil properties and carbon dynamics
The true versus predicted values MLR models for prediction of decomposition rates of the fast- and slow-cycling pools as well as the fraction size of the slow pool are shown in the Appendix, Fig. A2. A matrix showing the correlation between these variables is given in Fig. 6. The intercept, coefficients of explanatory variables, RMSE and R2 of the best-performing MLR models, are summarized in Table 3 and the full equations are in the Appendix (Multiple linear regression equations).
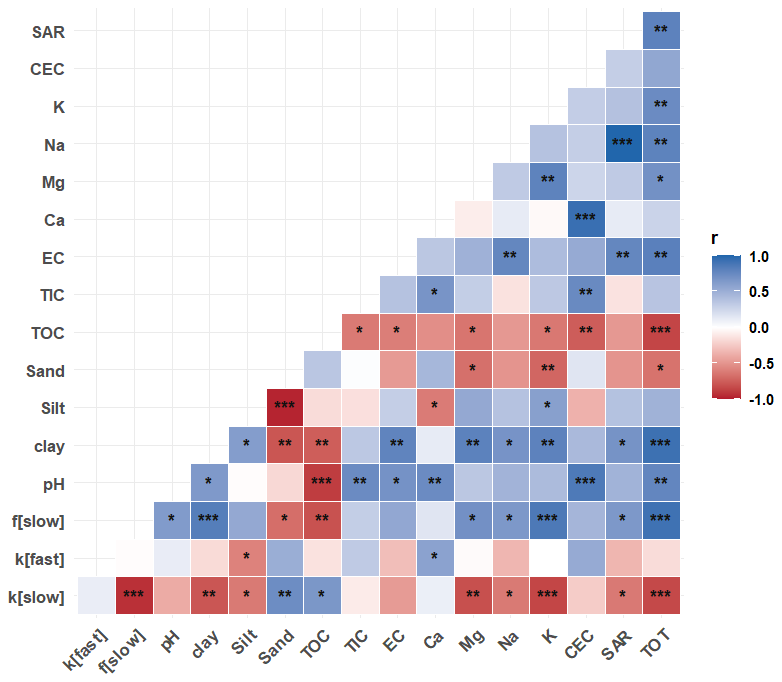
Figure 6Correlation between soil physicochemical properties and modeled soil organic matter decomposition parameters (decay constant, k, and fraction of C in slow pool, f) for fast- and slow-cycling pools in modern and Brady soils incubated under continuously wet conditions. Decomposition parameters were obtained by multiple linear regression across burial and erosional transects. The statistical significance of each correlation is denoted by asterisks ( for p<0.001, for p<0.01, ∗ for p<0.05).
Table 3Summary of multiple linear regression models showing key positive (+) and negative (−) predictors of model parameters (proportions of fast and slow cycling fractions of TOC, i.e., ff and fs and the corresponding decay rate constants kf and ks), model performance (R2), and root mean square error (RMSE).
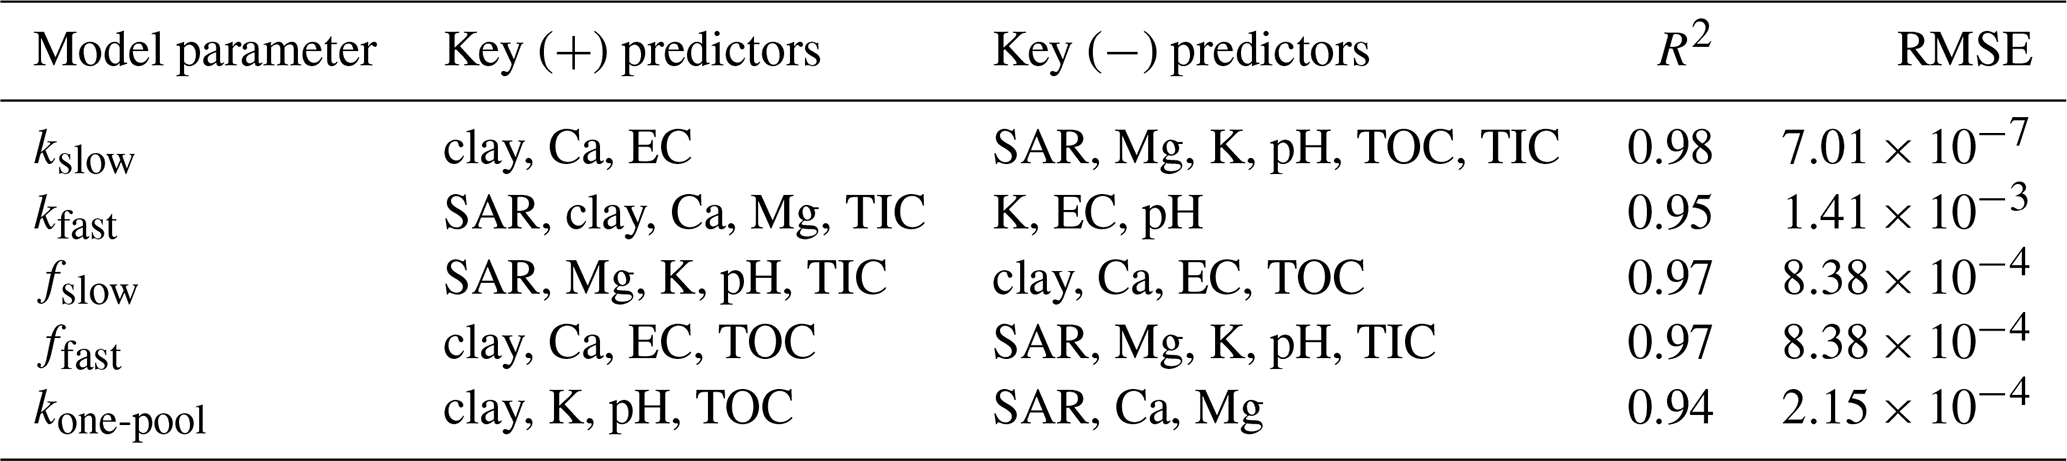
The MLR models for prediction of decay rates of SOM under continuous wetting had better model fit (R2>0.80) compared to those for predictions of SOM pool fraction size (R2=0.44). From the MLR equations, we deduce that soil properties with the greatest coefficients had the most important effects on the SOM decay rate and fraction size model parameters. While SAR increased the rate of decay and decreased the size of the of the slow pool, an opposite trend is observed in the fast pool.
TOC and pH also increased the decay rate of the fast-cycling SOM pool under continuous wetting, while the slow pool decay rate decreased with increasing TIC. TOC and TIC increased the fraction size of the slow pool at the expense of fraction size of the fast pool. When considering effects of these factors individually, SAR, TOC, TIC and pH did not have significant correlation with SOM decomposition parameters (Fig. 6). However, exchangeable Mg and K content were significantly correlated with the decay rate of the fast (negative correlation) and slow (positive correlation) pools (Fig. 6).
The true versus predicted values MLR models for prediction of the decomposition rate of SOM (one-pool system) under wet-dry cycles are shown in the Appendix, Fig. A3. A matrix showing the correlation between these variables is given in Appendix, Fig. A4.
The intercept, coefficients of explanatory variables, RMSE and R2 of the best-performing MLR model for prediction of the decay rate, are given summarized in Table 3 and the full equation is in the Appendix (Multiple linear regression equations).
SAR decreased the decay rate of SOM under wet-dry cycles. Clay and TOC content increased the decay rate of SOM. Exchangeable Ca, Mg content decreased the decay rates of both pools. Considering these parameters individually (correlation coefficients) revealed a weak correlation with k. Therefore MLR, where k is modeled as a function of all predictors together, demonstrates that the combination of these variables explained most variance, while no single predictor explained much variance on its own.
4.1 Stabilization of soil organic matter by burial
While our study characterizes decomposition dynamics using respirometry and radiocarbon-based modeling, we did not directly measure the molecular mechanisms responsible for differential SOC stability. Specifically, we did not quantify the chemical composition of mineral-associated organic matter, the nature of organo–mineral bonds, or microbial community composition. As a result, the mechanistic interpretations presented here are necessarily indirect.
The interpretations proposed in this study build on prior molecular and fractionation-based analyses conducted on the same soils and geomorphic transects (Marin-Spiotta et al., 2014; Dolui et al., 2026b). That work documented enhanced mineral association and cation-mediated stabilization in buried profiles. Rather than repeating those analyses, the present study extends this framework by quantifying how these stabilization contexts translate into differences in SOC turnover rates and pool structure under contrasting moisture regimes.
Brady Soil subjected to continuous wetting exhibited lower cumulative CO2 evolution than modern soils across both erosional and burial transects (Fig. 2; Appendix Fig. 3). This pattern indicates reduced microbial mineralization in buried paleosols relative to surface soils under sustained moisture availability.
Multiple mechanisms may contribute to this enhanced stability, although their relative importance cannot be resolved with the current dataset. Previous work at this site reported elevated exchangeable Ca2+ concentrations in Brady soils and linked Ca-mediated flocculation to increased aggregate stability (Dolui et al., 2026a). Our results are consistent with this interpretation. Specifically, Ca concentration was a positive predictor of slow-pool size in the MLR model. However, we did not directly measure aggregation or flocculation processes. As a result, the pathway linking Ca availability to reduced decomposition remains uncertain. Reduced decay could arise from physical protection within aggregates, reduced microbial access to substrates, or changes in solute diffusivity (Six et al., 2002). Within the scope of this study, Ca2+ therefore emerges as a statistically robust predictor of SOC pool structure, rather than a resolved mechanistic driver.
The potential contribution of pyrogenic carbon to SOC persistence in Brady soils is supported by prior molecular analyses from this site. These analyses identified condensed aromatic compounds consistent with fire-derived inputs (Marin-Spiotta et al., 2014). Pyrogenic carbon was not quantified in the present study, and its direct influence on decomposition rates cannot be evaluated here. Nonetheless, its documented persistence provides important context for interpreting the slow-cycling SOC pool observed in Brady soils. Our results are therefore compatible with a stabilization legacy established during Brady Soil formation, rather than evidence of an active pyrogenic control on contemporary decomposition.
Modern soils exhibited a slightly larger relative size of the fast-cycling SOM pool than Brady soils, which likely reflects recent organic inputs. Direct comparison of decay parameters further highlights differences in SOM persistence between soil types (Fig. 4). The slow-cycling pool in Brady soils from the most erosional transect had significantly lower decay rates under continuous wetting than the corresponding pool in modern soils. This provides clear evidence of greater SOM persistence in the paleosol.
Across all treatments, the slow pool decayed approximately 2000 times more slowly than the fast pool (Appendix, Fig. A2). The slow-cycling pool of the Brady Soil exhibited a turnover time (TOTs) of approximately 399 years, whereas the slow-cycling pool of modern soil exhibited a TOT of approximately 178 years. The MLR models further showed a negative relationship between slow-pool decay rate (kslow) and both total inorganic carbon (TIC) and exchangeable Mg2+ (Eq. A1). Although CaCO3 cementation was not pronounced, positive correlations between TOC, TIC, and Ca in Brady soils from erosional transects (Dolui et al., 2026a) suggest that carbonate-associated phases may contribute to stabilization where shallow wetting promotes near-surface carbonate precipitation.
The association between finer texture and reduced SOC decomposition observed in this study aligns with established theory linking clay-rich soils to enhanced mineral-associated organic matter formation (Six et al., 2002). Clay content was a significant predictor of slow-pool dynamics in the MLR models, indicating that particle size exerts a first-order control on SOC accessibility. However, because mineral surface chemistry and sorption energetics were not resolved, texture is interpreted here as a proxy for stabilization potential rather than as a direct mechanistic control, given the complexity of detangling texture and mineralogical controls (Rasmussen et al., 2018).
The slow-cycling SOM pool dominated total soil C, accounting for more than 96 % of SOC (Fig. 4b). The size of this pool increased with increasing TOC and TIC (Eq. A1) and was accompanied by a corresponding decline in the fast-cycling pool. The fast pool consistently represented a larger fraction of total SOC in modern soils than in Brady soils, and in erosional transects than in burial transects. Together, these patterns indicate stronger stabilization in buried paleosols and underscore the central role of the slow-cycling pool in long-term SOC persistence.
Apparent relationships between sodium adsorption ratio (SAR), exchangeable cations, decay rates, and pool sizes in the MLR models (Eqs. A1–A4; Fig. 6) should be interpreted cautiously. These correlations may reflect shared depth-dependent trends rather than direct mechanistic links. Both TOC and microbial biomass typically decline with depth (Fierer and Schimel, 2003; Xiang et al., 2008), which contributes to reduced respiration in deeper Brady soils. At the same time, Na tends to accumulate at depth through leaching (Dolui et al., 2026a), with accumulation depth depending on precipitation and soil water status.
4.2 Destabilization of SOM by erosion and moisture variability
Greater cumulative C loss from shallower soils, combined with a smaller fast-cycling SOM pool and a significantly higher slow-pool decay rate in erosional Brady soils compared to burial Brady soils (Fig. 4a), highlights the destabilizing effect of surface exposure. This pattern indicates that erosion weakens burial-associated protection.
CO2 pulses during the initial phase of wet–dry cycling were larger in erosional transects than in burial transects (Fig. A1). These pulses suggest enhanced mineralization in Brady soils closer to the surface. One likely explanation is priming by root exudates and fresh organic inputs, amplified by bioturbation (Pausch et al., 2016; McMurtry et al., 2024). This interpretation is supported by higher fraction modern values in erosional Brady soils relative to burial Brady soils, as well as by convergence of slow-pool fraction modern values toward those of modern soils (Dolui et al., 2026b).
Enhanced decomposition in shallower Brady soils likely reflects both legacy exposure and contemporary environmental conditions. Shallower positions experience more frequent wetting and greater oxygen diffusion, which can prime microbial communities for rapid response following rewetting. Separating long-term exposure effects from ongoing environmental controls would require experimental manipulation of burial depth, which represents an important avenue for future research.
In the wet–dry experiment, erosion effects were further expressed in decay dynamics. Slow pools decayed faster in erosional transects than in burial transects, whereas fast pools decomposed more rapidly in modern soils than in Brady soils. The fraction of the slow pool was smaller under continuous wetting than under wet–dry cycling, indicating greater allocation to slow-cycling carbon under variable moisture. However, the slow pool also exhibited substantially higher decay rates under wet–dry cycling. This suggests that apparent stabilization under variable moisture is transient and may be offset over time by depletion of passive C reserves.
The accelerated decay of slow-pool SOC under drying–rewetting cycles demonstrates that burial-associated protection is not absolute, even for millennially persistent carbon. Potential mechanisms include aggregate disruption, increased solute transport, or shifts in microbial accessibility. While the present study cannot resolve these pathways, it clearly documents the outcome: enhanced decomposition of previously slow-cycling SOC under moisture variability.
Moisture variability also amplified turnover of the fast-cycling pool. Decay rates of the fast pool increased under wet–dry cycling, particularly in modern soils and erosional transects. This pattern supports the interpretation that fresh organic inputs and surface exposure accelerate labile C turnover under fluctuating moisture. The MLR model reinforces this interpretation by revealing a positive relationship between TOC and fast-pool decay rate (Eq. A4). In contrast, the absence of strong moisture effects in Brady soils suggests that burial dampens moisture-driven variability in labile C decomposition.
McDowell et al. (2022) simulated soil hydrology for the Brady Soil, overlying loess, and modern soil using measured hydraulic properties and regional weather data from 2009–2019. Modeled water contents remained low and relatively constant below 1.5 m depth from the surface, including within the Brady Soil, with only rare deep wetting events following major rainfall. Paleoclimate reconstructions indicate that the depth of frequent wetting would have been even shallower during drier-than-modern periods over the past 10 000 years (Miao et al., 2007). Together, these results suggest that prolonged dry conditions played a major role in OC sequestration where the Brady Soil is deeply buried, whereas erosion and increased moisture variability could promote renewed C loss.
Geomorphic position integrates multiple stabilization controls by regulating burial depth, moisture exposure, oxygen availability, and the persistence of mineral–organic associations. In this sense, geomorphic context operates as a higher-order constraint that modulates how chemical and physical stabilization mechanisms are expressed through time. This aligns with conceptual frameworks suggesting that spatial patterns of soil organic carbon (SOC) are fundamentally shaped by the interplay between biological cycling and geomorphic processes like erosion and deposition (Yoo et al., 2006). Furthermore, topography acts as a primary control on SOC distribution by mediating local microclimate and the lateral transport of soil material across mantled landscapes (Patton et al., 2019). These findings challenge the common assumption in soil carbon modeling that geomorphic context can be neglected when parameterizing decomposition rates. Recent evidence underscores that geomorphic settings not only dictate the abundance of SOC but also the persistence of specific carbon pools, particularly in erosional landscapes where geomorphic history defines the vulnerability of buried carbon (Hunter et al., 2024). Our results show that erosional exposure accelerates slow-pool decay under continuous wetting, and that wet–dry cycling destabilizes slow-pool carbon regardless of landscape position. For Earth system models that treat subsoil carbon as a passive reservoir, these dynamics represent a substantial and underappreciated vulnerability. Accurately predicting SOC responses to changing precipitation regimes therefore requires explicit consideration of burial depth and exposure history, which are rarely incorporated into current modeling frameworks.
When interpreted alongside prior molecular- and fractionation-based analyses from this site (Marin-Spiotta et al., 2014; Dolui et al., 2026a, b), our results suggest that long-term SOC persistence in Brady soils arises from the convergence of mineral association, cation-mediated stabilization, and limited environmental exposure. The present study extends this framework by demonstrating that these stabilization contexts remain vulnerable to hydrologic perturbation and geomorphic re-exposure. Although this study does not resolve molecular-scale mechanisms directly, it demonstrates that decomposition parameters derived from incubation and radiocarbon modeling are highly sensitive to landscape history – an effect that must be accounted for even when detailed chemical data are unavailable.
Our study demonstrates that SOC decomposition is strongly shaped by soil moisture regime and landscape position, with modern and Brady soils responding differently to continuous wetting versus drying–rewetting cycles. Water availability exerted disproportionate effects in erosional settings where surface exposure enhanced substrate diffusivity, highlighting the destabilizing role of re-exposure and moisture fluctuations.
Drying–rewetting cycles led to greater C losses from Brady soils than continuous wetting, despite modeling results indicating dominance of the slow pool and depletion of labile C. This treatment also accelerated fast pool decay in modern soils and erosional transects, while burial dampened such variability in Brady soils. Fraction sizes shifted accordingly: wet–dry cycles increased the proportion of the slow pool and reduced the fast pool fraction, suggesting redistribution of SOC toward more stabilized forms under fluctuating moisture.
Depth further constrained SOM persistence, with slow pool decay constants declining with increasing degree of burial in Brady soils from burial transects. Faster turnover in shallow layers reflects greater microbial accessibility and responsiveness to surface-driven processes, underscoring the importance of geomorphic context – transect type, degree of burial, and soil structure – over intrinsic SOM chemistry.
Comparisons across models showed that continuous wetting accelerated overall decay, particularly in burial transects, while wet–dry cycles disproportionately destabilized the slow pool that dominates SOC. This dual effect – rapid labile C turnover under moisture fluctuations coupled with erosion of long-lived SOM persistence – points to heightened vulnerability of buried carbon under future precipitation variability.
Overall, the fate of ancient soil carbon under climate change will depend on both its burial history and prevailing moisture regime. Integrating these contrasting controls on fast- and slow-cycling pools into Earth system models is essential for improving predictions of soil carbon vulnerability and climate feedback.
Table A1Absolute sampling depth intervals i.e., depth from soil surface (standard deviation in brackets for n=3) of modern (surface) and Brady (burial) soils along two types of transects, where degrees of burial or exposure increase from degrees I to III. Table adapted from Dolui et al. (2026b).
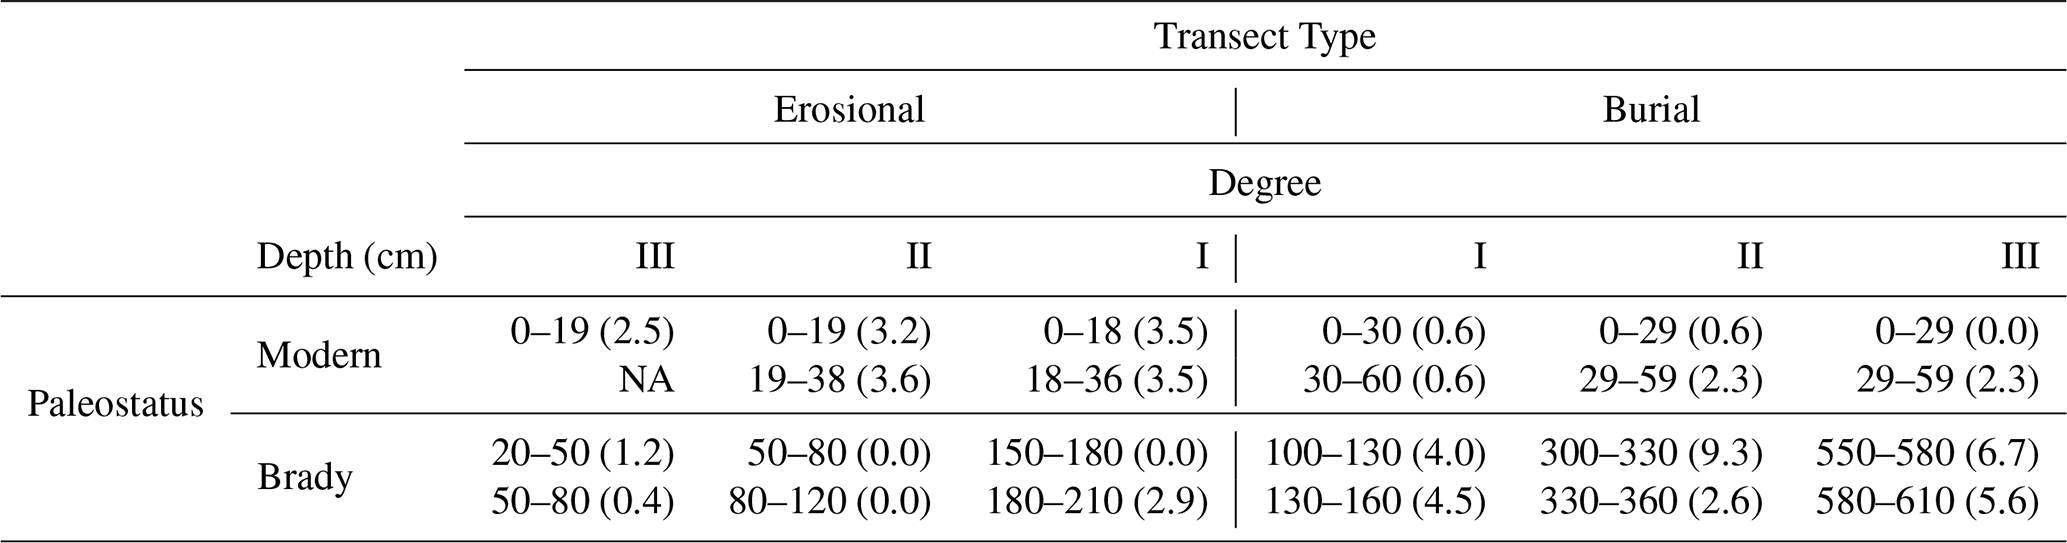
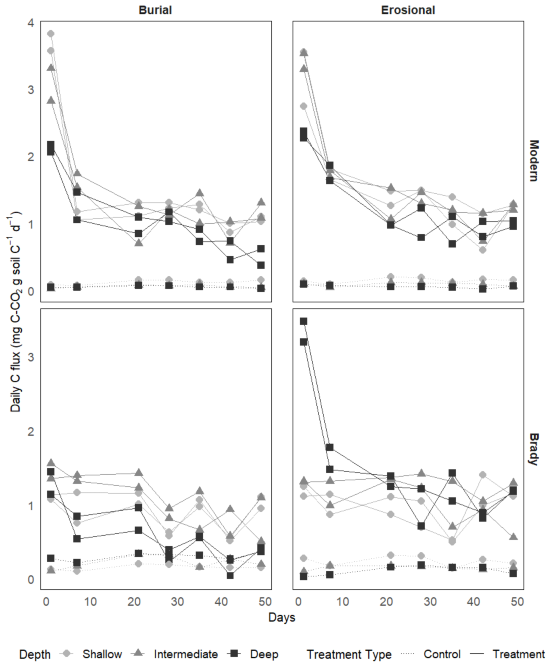
Figure A1Daily respiratory CO2 flux from modern and Brady Soil sampled from three depths representing varying degrees of burial/erosional exposure (two technical replicates each). In burial transects, Shallow → Intermediate → Deep corresponds to burial degrees I → II → III. In erosional transects, this relationship is reversed, with Shallow → Intermediate → Deep corresponding to exposure degrees III → II → I. Soils were wetted to a moisture content of 60 % water holding capacity (WHC) and allowed to dry to 5 % WHC. The dotted line represents the control (constant 5 % WHC).
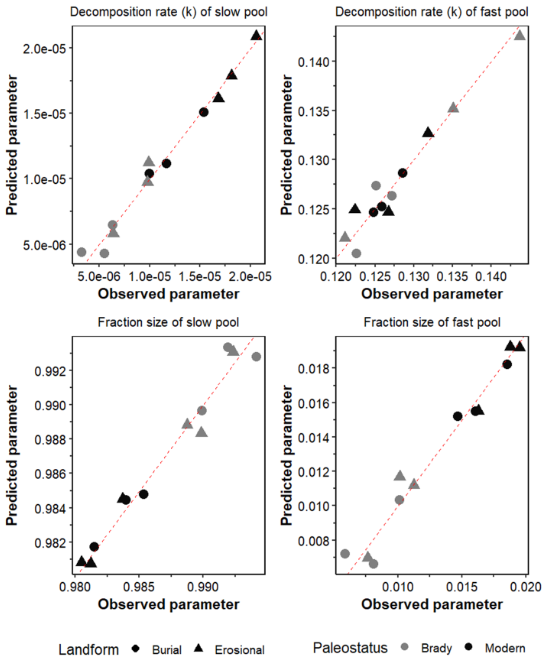
Figure A2True versus predicted soil organic matter decomposition parameters (decay constant, k, and fraction of C in slow pool, f) for fast- and slow-cycling pools in modern and Brady soils incubated under continuously wet conditions. These parameters were obtained by multiple linear regression across burial and erosional transects. Red dotted line represents y=x.
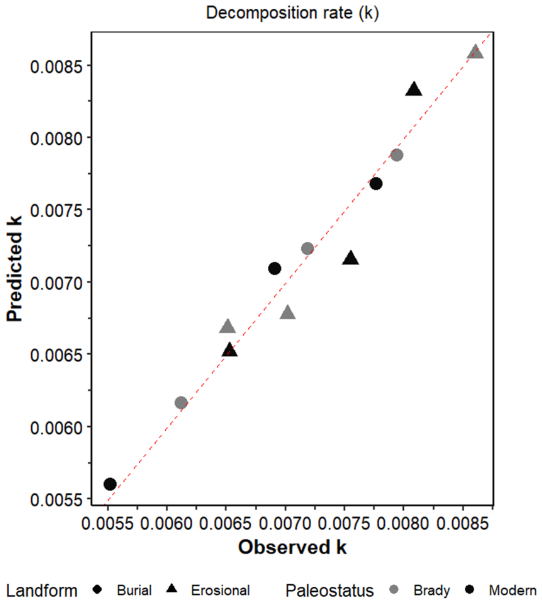
Figure A3True versus predicted soil organic matter decay constant, k) in modern and Brady soils incubated under wet-dry cycling conditions. These parameters were obtained by multiple linear regression across burial and erosional transects. Red dotted line represents y=x.
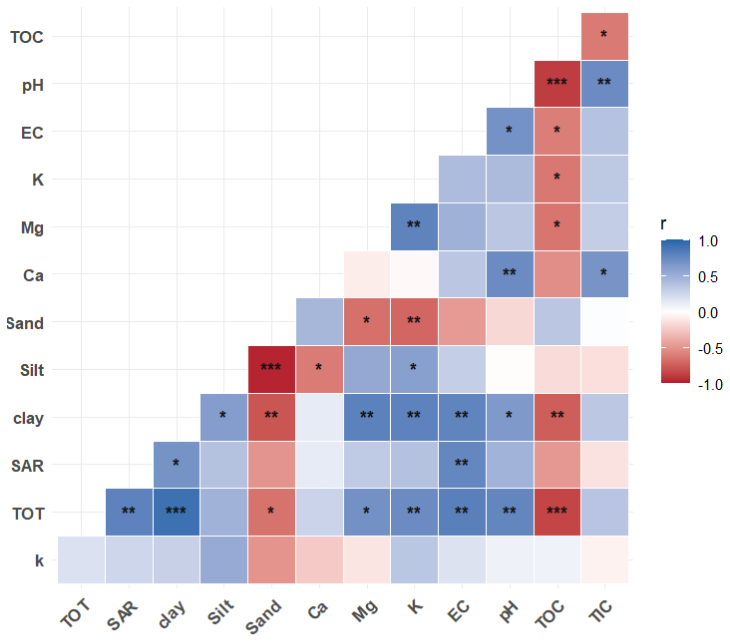
Figure A4Correlation between soil physicochemical properties and modeled soil organic matter decomposition parameters (decay constant, k, and fraction of C in slow pool, f) for fast- and slow-cycling pools in modern and Brady soils incubated under wet-dry cycles. Decomposition parameters were obtained by multiple linear regression across burial and erosional transects. The statistical significance of each correlation is denoted by asterisks ( for p<0.001, for p<0.01, ∗ for p<0.05).
Multiple linear regression equations
Full dataset for soil incubation and statistical analyses are available at https://doi.org/10.17632/fjw646gpyf.1 (Nel, 2025).
All authors contributed to the study conception and design. Material preparation, data collection, and analysis were performed by Manisha Dolui, Teneille Nel, Abbygail R. McMurtry, Stephanie Chacon, Laura M. Phillips, Teamrat Ghezzehei, Joseph A. Mason, Erika Marin-Spiotta, Marie-Anne de Graaff and Asmeret Asefaw Berhe. The first draft of the manuscript was written by Manisha Dolui and Teneille Nel. All authors commented on previous versions of the manuscript and approved the final manuscript.
The contact author has declared that none of the authors has any competing interests.
Publisher's note: Copernicus Publications remains neutral with regard to jurisdictional claims made in the text, published maps, institutional affiliations, or any other geographical representation in this paper. The authors bear the ultimate responsibility for providing appropriate place names. Views expressed in the text are those of the authors and do not necessarily reflect the views of the publisher.
We acknowledge financial support for this work from the National Science Foundation (EAR awards 1623814, 1623810, and 1623812) and the Ted and Jan Falasco Endowment, fellowships and grants awarded by the Graduate Division at the University of California, Merced (UCM), and the UCM Environmental Systems Graduate Group. We are grateful to Dr. Sora Kim and Dr. Robin Trayler for their support at the UCM Stable Isotope Lab. We also thank R. and D. Whiting for providing access to the Wauneta, Nebraska, field sites. ChatGPT was used for language editing and sentence refinement and the authors take full responsibility for the output.
This work was supported by the National Science Foundation (EAR awards 1623814, 1623810, and 1623812), the University of California, Merced, and the Ted and Jan Falasco Endowment.
This paper was edited by Katerina Georgiou and reviewed by three anonymous referees.
Batool, M., Cihacek, L. J., and Alghamdi, R. S.: Soil Inorganic Carbon Formation and the Sequestration of Secondary Carbonates in Global Carbon Pools: A Review, Soil Systems, 8, 15, https://doi.org/10.3390/soilsystems8010015, 2024. a
Beare, M., Gregorich, E., and St-Georges, P.: Compaction effects on CO2 and N2O production during drying and rewetting of soil, Soil Biol. Biochem., 41, 611–621, https://doi.org/10.1016/j.soilbio.2008.12.024, 2009. a
Berhe, A. A., Harte, J., Harden, J. W., and Torn, M. S.: The Significance of the Erosion-induced Terrestrial Carbon Sink, BioScience, 57, 337–346, https://doi.org/10.1641/B570408, 2007. a
Berhe, A. A., Harden, J. W., Torn, M. S., and Harte, J.: Linking soil organic matter dynamics and erosion-induced terrestrial carbon sequestration at different landform positions, J. Geophys. Res.-Biogeo., 113, https://doi.org/10.1029/2008JG000751, 2008. a
Berhe, A. A., Suttle, K. B., Burton, S. D., and Banfield, J. F.: Contingency in the direction and mechanics of soil organic matter responses to increased rainfall, Plant Soil, 358, 371–383, https://doi.org/10.1007/s11104-012-1156-0, 2012. a, b
Berhe, A. A., Barnes, R. T., Six, J., and Marín-Spiotta, E.: Role of Soil Erosion in Biogeochemical Cycling of Essential Elements: Carbon, Nitrogen, and Phosphorus, Annu. Rev. Earth Pl. Sc., 46, 521–548, https://doi.org/10.1146/annurev-earth-082517-010018, 2018. a
Bird, J. A. and Torn, M. S.: Fine Roots vs. Needles: A Comparison of 13C and 15N Dynamics in a Ponderosa Pine Forest Soil, Biogeochemistry, 79, 361–382, https://doi.org/10.1007/s10533-005-5632-y, 2006. a
Chaopricha, N. T. and Marín-Spiotta, E.: Soil burial contributes to deep soil organic carbon storage, Soil Biol. Biochem., 69, 251–264, https://doi.org/10.1016/j.soilbio.2013.11.011, 2014. a, b
Chaopricha, N. T. and Marín-Spiotta, E.: Soil burial contributes to deep soil organic carbon storage, Soil Biol. Biochem., 69, 251–264, https://doi.org/10.1016/j.soilbio.2013.11.011, 2014. a
Chowdhury, N., Marschner, P., and Burns, R. G.: Soil microbial activity and community composition: Impact of changes in matric and osmotic potential, Soil Biol. Biochem., 43, 1229–1236, https://doi.org/10.1016/j.soilbio.2011.02.012, 2011. a
Cotrufo, M. F. and Lavallee, J. M.: Incorporating aridity in soil carbon stewardship frameworks, Nat. Clim. Change, 15, 240–242, https://doi.org/10.1038/s41558-025-02270-9, 2025. a
Davidson, E. A., Samanta, S., Caramori, S. S., and Savage, K.: The Dual Arrhenius and Michaelis–Menten kinetics model for decomposition of soil organic matter at hourly to seasonal time scales, Global Change Biol., 18, 371–384, https://doi.org/10.1111/j.1365-2486.2011.02546.x, 2012. a
Dolui, M., Nel, T., Chacon, S., Phillips, L. M., McMurtry, A. R., Moreland, K., McFarlane, K., Mason, J. A., Marin-Spiotta, E., de Graaff, M., Ghezzehei, T., and Berhe, A. A.: Soil Organic Matter Stabilization by Polyvalent Cations in a Buried Alkaline Soil, J. Geophys. Res.-Biogeo., 131, https://doi.org/10.1029/2025JG009241, 2026a. a, b, c, d, e
Dolui, M., Nel, T., Phillips, L. M., McMurtry, A. R., Moreland, K., Tfaily, M., McFarlane, K., Mason, J. A., Marin-Spiotta, E., de Graaff, M.-A., Ghezzehei, T., and Berhe, A. A.: Composition and persistence of soil organic matter along eroding and depositional transects in buried vs. modern soil layers: A case of the Brady paleosol at Wauneta, Nebraska, Geoderma, 465, 117660, https://doi.org/10.1016/j.geoderma.2025.117660, 2026b. a, b, c, d, e, f, g, h, i, j
Elzhov, T., Mullen, K., Spiess, A., and Bolker, B.: minpack.lm: R Interface to the Levenberg-Marquardt Nonlinear Least-Squares Algorithm Found in MINPACK, Plus Support for Bounds, https://CRAN.R-project.org/package=minpack.lm (last access: 26 March 2026), 2023. a
Fierer, N. and Schimel, J. P.: A Proposed Mechanism for the Pulse in Carbon Dioxide Production Commonly Observed Following the Rapid Rewetting of a Dry Soil, Soil Sci. Soc. Am. J., 67, 798, https://doi.org/10.2136/sssaj2003.0798, 2003. a, b
Fontaine, S., Barot, S., Barré, P., Bdioui, N., Mary, B., and Rumpel, C.: Stability of organic carbon in deep soil layers controlled by fresh carbon supply, Nature, 450, 277–280, https://doi.org/10.1038/nature06275, 2007. a
Gao, X., Huang, R., Li, J., Wang, C., Lan, T., Li, Q., Deng, O., Tao, Q., and Zeng, M.: Temperature induces soil organic carbon mineralization in urban park green spaces, Chengdu, southwestern China: Effects of planting years and vegetation types, Urban For. Urban Gree., 54, 126761, https://doi.org/10.1016/j.ufug.2020.126761, 2020. a
Ghezzehei, T. A., Sulman, B., Arnold, C. L., Bogie, N. A., and Berhe, A. A.: On the role of soil water retention characteristic on aerobic microbial respiration, Biogeosciences, 16, 1187–1209, https://doi.org/10.5194/bg-16-1187-2019, 2019. a
Goebel, M.-O., Bachmann, J., Woche, S. K., and Fischer, W. R.: Soil wettability, aggregate stability, and the decomposition of soil organic matter, Geoderma, 128, 80–93, https://doi.org/10.1016/j.geoderma.2004.12.016, 2005. a
Griffiths, B. S. and Philippot, L.: Insights into the resistance and resilience of the soil microbial community, FEMS Microbiol. Rev., 37, 112–129, https://doi.org/10.1111/j.1574-6976.2012.00343.x, 2013. a
Hicks Pries, C. E., Castanha, C., Porras, R. C., and Torn, M. S.: The whole-soil carbon flux in response to warming, Science, 355, 1420–1423, https://doi.org/10.1126/science.aal1319, 2017. a
Hicks Pries, C. E., Ryals, R., Zhu, B., Min, K., Cooper, A., Goldsmith, S., Pett-Ridge, J., Torn, M., and Berhe, A. A.: The Deep Soil Organic Carbon Response to Global Change, Annu. Rev. Ecol. Evol. S., 54, 375–401, https://doi.org/10.1146/annurev-ecolsys-102320-085332, 2023. a, b
Hill, R. L., Horton, R., and Cruse, R. M.: Tillage Effects on Soil Water Retention and Pore Size Distribution of Two Mollisols, Soil Sci. Soc. Am. J., 49, 1264–1270, https://doi.org/10.2136/sssaj1985.03615995004900050039x, 1985. a
Horne, D. and McIntosh, J.: Hydrophobic compounds in sands in New Zealand–extraction, characterisation and proposed mechanisms for repellency expression, J. Hydrol., 231–232, 35–46, https://doi.org/10.1016/S0022-1694(00)00181-5, 2000. a
Hunter, B. D., Roering, J. J., Silva, L. C. R., and Moreland, K. C.: Geomorphic controls on the abundance and persistence of soil organic carbon pools in erosional landscapes, Nat. Geosci., 17, 151–157, https://doi.org/10.1038/s41561-023-01365-2, 2024. a
IPCC: Global Warming of 1.5 °C, in: An IPCC Special Report on the impacts of global warming of 1.5 °C above pre-industrial levels and related global greenhouse gas emission pathways, in the context of strengthening the global response to the threat of climate change, edited by: Masson-Delmotte, V., Zhai, P., Pörtner, H.-O., Roberts, D., Skea, J., Shukla, P., Pirani, A., Moufouma-Okia, W., Péan, C., Pidcock, R., Connors, S., Matthews, J., Chen, Y., Zhou, X., Gomis, M., Lonnoy, E., Maycock, T., Tignor, M., and Waterfield, T., Intergovernmental Panel on Climate Change, https://doi.org/10.1038/291285a0, 2018. a
Jacobs, P. M. and Mason, J. A.: Paleopedology of soils in thick Holocene loess, Nebraska, USA, Rev. Mex. Cienc. Geol., 21, 54–70, 2004. a
Jacobs, P. M. and Mason, J. A.: Late Quaternary climate change, loess sedimentation, and soil profile development in the central Great Plains: A pedosedimentary model, Geol. Soc. Am. Bull., 119, 462–475, https://doi.org/10.1130/B25868.1, 2007. a, b, c
Jobbagy, E. G. and Jackson, R. B.: The Vertical Distribution of Soil Organic Carbon and Its Relation to Climate and Vegetation, Ecol. Appl., 10, 423–436, 2000. a
Johnson, W. C. and Willey, K. L.: Isotopic and rock magnetic expression of environmental change at the Pleistocene–Holocene transition in the central Great Plains, Quatern. Int., 67, 89–106, https://doi.org/10.1016/S1040-6182(00)00011-2, 2000. a
Johnson, W. C., Willey, K. L., Mason, J. A., and May, D. W.: Stratigraphy and environmental reconstruction at the middle Wisconsinan Gilman Canyon formation type locality, Buzzard's Roost, southwestern Nebraska, USA, Quaternary Res., 67, 474–486, https://doi.org/10.1016/j.yqres.2007.01.011, 2007. a
Kaiser, M., Kleber, M., and Berhe, A. A.: How air-drying and rewetting modify soil organic matter characteristics: An assessment to improve data interpretation and inference, Soil Biol. Biochem., 80, 324–340, https://doi.org/10.1016/j.soilbio.2014.10.018, 2015. a
Kang, S. and Xing, B.: Humic Acid Fractionation upon Sequential Adsorption onto Goethite, Langmuir, 24, 2525–2531, https://doi.org/10.1021/la702914q, 2008. a
Kemper, W. D., Rosenau, R. C., and Dexter, A. R.: Cohesion Development in Disrupted Soils as Affected by Clay and Organic Matter Content and Temperature, Soil Sci. Soc. Am. J., 51, 860–867, https://doi.org/10.2136/sssaj1987.03615995005100040004x, 1987. a
Lawrence, C. R., Harden, J. W., Xu, X., Schulz, M. S., and Trumbore, S. E.: Long-term controls on soil organic carbon with depth and time: A case study from the Cowlitz River Chronosequence, WA, USA, Geoderma, 247–248, 73–87, https://doi.org/10.1016/j.geoderma.2015.02.005, 2015. a
Lawrence, C. R., Schulz, M. S., Masiello, C. A., Chadwick, O. A., and Harden, J. W.: The trajectory of soil development and its relationship to soil carbon dynamics, Geoderma, 403, 115378, https://doi.org/10.1016/j.geoderma.2021.115378, 2021. a
Leizeaga, A., Hicks, L. C., Manoharan, L., Hawkes, C. V., and Rousk, J.: Drought legacy affects microbial community trait distributions related to moisture along a savannah grassland precipitation gradient, J. Ecol., 109, 3195–3210, https://doi.org/10.1111/1365-2745.13550, 2021. a
Lenth, R. V.: emmeans: Estimated Marginal Means, aka Least-Squares Means, https://CRAN.R-project.org/package=emmeans (last access: 26 March 2026), 2024. a
Li, Q., Hu, W., Li, L., and Li, Y.: Interactions between organic matter and Fe oxides at soil micro-interfaces: Quantification, associations, and influencing factors, Sci. Total Environ., 855, 158710, https://doi.org/10.1016/j.scitotenv.2022.158710, 2023. a
Liu, T., Wang, L., Feng, X., Zhang, J., Ma, T., Wang, X., and Liu, Z.: Comparing soil carbon loss through respiration and leaching under extreme precipitation events in arid and semiarid grasslands, Biogeosciences, 15, 1627–1641, https://doi.org/10.5194/bg-15-1627-2018, 2018. a
Marin-Spiotta, E., Chadwick, O. A., Kramer, M., and Carbone, M. S.: Carbon delivery to deep mineral horizons in Hawaiian rain forest soils, J. Geophys. Res., 116, G03011, https://doi.org/10.1029/2010JG001587, 2011. a
Marin-Spiotta, E., Chaopricha, N. T., Plante, A. F., Diefendorf, A. F., Mueller, C. W., Grandy, A. S., and Mason, J. A.: Long-term stabilization of deep soil carbon by fire and burial during early Holocene climate change, Nat. Geosci., 7, 428–432, https://doi.org/10.1038/ngeo2169, 2014. a, b, c, d, e
Mason, J. A., Jacobs, P. M., Hanson, P. R., Miao, X., and Goble, R. J.: Sources and paleoclimatic significance of Holocene Bignell Loess, central Great Plains, USA, Quaternary Res., 60, 330–339, https://doi.org/10.1016/j.yqres.2003.07.005, 2003. a
Mason, J. A., Miao, X., Hanson, P. R., Johnson, W. C., Jacobs, P. M., and Goble, R. J.: Loess record of the Pleistocene–Holocene transition on the northern and central Great Plains, USA, Quaternary Sci. Rev., 27, 1772–1783, https://doi.org/10.1016/j.quascirev.2008.07.004, 2008. a, b, c
McDowell, T. M., Mason, J. A., Vo, T., and Marín-Spiotta, E.: Hydrology of a semiarid loess–paleosol sequence, and implications for buried soil connection to the modern climate, plant-available moisture, and loess tableland persistence, J. Geophys. Res.-Earth, 127, https://doi.org/10.1029/2022JF006800, 2022. a, b
McDowell, T. M., Mason, J. A., Vo, T., and Marin-Spiotta, E.: Hydrology of a Semiarid Loess-Paleosol Sequence, and Implications for Buried Soil Connection to the Modern Climate, Plant-Available Moisture, and Loess Tableland Persistence, J. Geophys. Res.-Earth, 127, https://doi.org/10.1029/2022JF006800, 2022. a
McMurtry, A. R., Kasmerchak, C. S., Vaughan, E. A., Dolui, M., Phillips, L. M., Mueller, C. W., Pett-Ridge, J., Berhe, A. A., Mason, J. A., Marín-Spiotta, E., and de Graaff, M.-A.: Getting to the root of the problem: Soil carbon and microbial responses to root inputs within a buried paleosol along an eroding hillslope in southwestern Nebraska, USA, Soil Biol. Biochem., 198, 109549, https://doi.org/10.1016/j.soilbio.2024.109549, 2024. a, b
Miao, X., Mason, J. A., Swinehart, J. B., Loope, D. B., Hanson, P. R., Goble, R. J., and Liu, X.: A 10 000 year record of dune activity, dust storms, and severe drought in the central Great Plains, Geology, 35, 119, https://doi.org/10.1130/G23133A.1, 2007. a, b
Miller, A., Schimel, J., Meixner, T., Sickman, J., and Melack, J.: Episodic rewetting enhances carbon and nitrogen release from chaparral soils, Soil Biol. Biochem., 37, 2195–2204, https://doi.org/10.1016/j.soilbio.2005.03.021, 2005. a
Min, K., Berhe, A. A., Khoi, C. M., van Asperen, H., Gillabel, J., and Six, J.: Differential effects of wetting and drying on soil CO2 concentration and flux in near-surface vs. deep soil layers, Biogeochemistry, 148, 255–269, https://doi.org/10.1007/s10533-020-00658-7, 2020. a, b, c
Najera, F., Dippold, M. A., Boy, J., Seguel, O., Koester, M., Stock, S., Merino, C., Kuzyakov, Y., and Matus, F.: Effects of drying/rewetting on soil aggregate dynamics and implications for organic matter turnover, Biol. Fert. Soils, 56, 893–905, https://doi.org/10.1007/s00374-020-01469-6, 2020. a
Naorem, A., Jayaraman, S., Dalal, R. C., Patra, A., Rao, C. S., and Lal, R.: Soil Inorganic Carbon as a Potential Sink in Carbon Storage in Dryland Soils – A Review, Agriculture, 12, 1256, https://doi.org/10.3390/agriculture12081256, 2022. a
Neff, J. C. and Asner, G. P.: Dissolved Organic Carbon in Terrestrial Ecosystems: Synthesis and a Model, Ecosystems, 4, 29–48, https://doi.org/10.1007/s100210000058, 2001. a
Nel, T.: Dolui_dataset2, Mendeley Data [data set], https://doi.org/10.17632/fjw646gpyf.1, 2025. a, b, c, d, e
Or, D. and Tuller, M.: Liquid retention and interfacial area in variably saturated porous media: Upscaling from single-pore to sample-scale model, Water Resour. Res., 35, 3591–3605, https://doi.org/10.1029/1999WR900262, 1999. a
Pal, S. C., Chakrabortty, R., Towfiqul Islam, A. R. M., Roy, P., Chowdhuri, I., Saha, A., Islam, A., Costache, R., and Alam, E.: Land use and climate change-induced soil erosion mapping in a sub-tropical environment, Geomat. Nat. Haz. Risk, 14, https://doi.org/10.1080/19475705.2023.2270129, 2023. a
Patton, N. R., Lohse, K. A., Seyfried, M. S., Godsey, S. E., and Parsons, S. B.: Topographic controls of soil organic carbon on soil-mantled landscapes, Sci. Rep.-UK, 9, 6390, https://doi.org/10.1038/s41598-019-42556-5, 2019. a
Pausch, J., Loeppmann, S., Kühnel, A., Forbush, K., Kuzyakov, Y., and Cheng, W.: Rhizosphere priming of barley with and without root hairs, Soil Biol. Biochem., 100, 74–82, https://doi.org/10.1016/j.soilbio.2016.05.009, 2016. a
Pinheiro, J., Bates, D., DebRoy, S., Sarkar, D., and R Core Team: nlme: Linear and Nonlinear Mixed Effects Models, https://CRAN.R-project.org/package=nlme (last access: 26 March 2026), 2024. a
R Core Team: R: A Language and Environment for Statistical Computing, https://www.r-project.org/ (last access: 26 March 2026), 2025. a
Rasmussen, C., Heckman, K., Wieder, W. R., Keiluweit, M., Lawrence, C. R., Berhe, A. A., Blankinship, J. C., Crow, S. E., Druhan, J. L., Hicks Pries, C. E., Marin-Spiotta, E., Plante, A. F., Schädel, C., Schimel, J. P., Sierra, C. A., Thompson, A., and Wagai, R.: Beyond clay: towards an improved set of variables for predicting soil organic matter content, Biogeochemistry, 137, 297–306, https://doi.org/10.1007/s10533-018-0424-3, 2018. a
RStudio Team: RStudio: Integrated Development for R, RStudio, http://www.rstudio.com/ (last access: 26 March 2026), 2019. a, b
Rumpel, C. and Kögel-Knabner, I.: Deep soil organic matter – a key but poorly understood component of terrestrial C cycle, Plant Soil, 338, 143–158, https://doi.org/10.1007/s11104-010-0391-5, 2011. a, b
Schmidt, M. W. I., Torn, M. S., Abiven, S., Dittmar, T., Guggenberger, G., Janssens, I. A., Kleber, M., Kögel-Knabner, I., Lehmann, J., Manning, D. A. C., Nannipieri, P., Rasse, D. P., Weiner, S., and Trumbore, S. E.: Persistence of soil organic matter as an ecosystem property, Nature, 478, 49–56, https://doi.org/10.1038/nature10386, 2011. a
Schrumpf, M., Kaiser, K., Guggenberger, G., Persson, T., Kögel-Knabner, I., and Schulze, E.-D.: Storage and stability of organic carbon in soils as related to depth, occlusion within aggregates, and attachment to minerals, Biogeosciences, 10, 1675–1691, https://doi.org/10.5194/bg-10-1675-2013, 2013. a
Sharififar, A., Minasny, B., Arrouays, D., Boulonne, L., Chevallier, T., van Deventer, P., Field, D. J., Gomez, C., Jang, H.-J., Jeon, S.-H., Koch, J., McBratney, A. B., Malone, B. P., Marchant, B. P., Martin, M. P., Monger, C., Munera-Echeverri, J.-L., Padarian, J., Pfeiffer, M., Richer-de Forges, A. C., Saby, N. P., Singh, K., Song, X.-D., Zamanian, K., Zhang, G.-L., and van Zijl, G.: Soil inorganic carbon, the other and equally important soil carbon pool: Distribution, controlling factors, and the impact of climate change, Adv. Agron., 178, 165–231, https://doi.org/10.1016/bs.agron.2022.11.005, 2023. a
Six, J., Conant, R., Paul, E., and Paustian, K.: Review: Stabilization Mechanisms of Soil Organic Matter: Implications for C-Saturation of Soils, Plant Soil, 241, 155–176, 2002. a, b
Slessarev, E. W., Chadwick, O. A., Sokol, N. W., Nuccio, E. E., and Pett-Ridge, J.: Rock weathering controls the potential for soil carbon storage at a continental scale, Biogeochemistry, 157, 1–13, https://doi.org/10.1007/s10533-021-00859-8, 2022. a
Soong, J. L., Castanha, C., Hicks Pries, C. E., Ofiti, N., Porras, R. C., Riley, W. J., Schmidt, M. W., and Torn, M. S.: Five years of whole-soil warming led to loss of subsoil carbon stocks and increased CO2 efflux, Science Advances, 7, https://doi.org/10.1126/sciadv.abd1343, 2021. a
Stacy, E. M., Hart, S. C., Hunsaker, C. T., Johnson, D. W., and Berhe, A. A.: Soil carbon and nitrogen erosion in forested catchments: implications for erosion-induced terrestrial carbon sequestration, Biogeosciences, 12, 4861–4874, https://doi.org/10.5194/bg-12-4861-2015, 2015. a
Steenwerth, K., Jackson, L., Calderon, F., Scow, K., and Rolston, D.: Response of microbial community composition and activity in agricultural and grassland soils after a simulated rainfall, Soil Biol. Biochem., 37, 2249–2262, https://doi.org/10.1016/j.soilbio.2005.02.038, 2005. a
Szymanski, L. M.: Spatial Distribution and Long-Term Persistence of Ancient Carbon in Buried Soils and Its Vulnerability to Landscape Disturbance, PhD thesis, University of Wisconsin-Madison, Madison, 2021. a, b, c, d
Thaler, E. A., Larsen, I. J., and Yu, Q.: The extent of soil loss across the US Corn Belt, P. Natl. Acad. Sci. USA, 118, https://doi.org/10.1073/pnas.1922375118, 2021. a
Tsypin, M. and Macpherson, G.: The effect of precipitation events on inorganic carbon in soil and shallow groundwater, Konza Prairie LTER Site, NE Kansas, USA, Appl. Geochem., 27, 2356–2369, https://doi.org/10.1016/j.apgeochem.2012.07.008, 2012. a
Venables, W. N. and Ripley, B. D.: MASS (Modern Applied Statistics with S), https://CRAN.R-project.org/package=MASS (last access: 26 March 2026), 2002. a
Wahab, L. M., Kim, S. L., and Berhe, A. A.: Carbon and nitrogen dynamics in subsoils after 20 years of added precipitation in a Mediterranean grassland, Biogeosciences, 22, 3915–3930, https://doi.org/10.5194/bg-22-3915-2025, 2025. a
Xiang, S.-R., Doyle, A., Holden, P. A., and Schimel, J. P.: Drying and rewetting effects on C and N mineralization and microbial activity in surface and subsurface California grassland soils, Soil Biol. Biochem., 40, 2281–2289, https://doi.org/10.1016/j.soilbio.2008.05.004, 2008. a
Yoo, K., Amundson, R., Heimsath, A. M., and Dietrich, W. E.: Spatial patterns of soil organic carbon on hillslopes: Integrating geomorphic processes and the biological C cycle, Geoderma, 130, 47–65, https://doi.org/10.1016/j.geoderma.2005.01.008, 2006. a
Zhu, B. and Cheng, W.: Impacts of drying–wetting cycles on rhizosphere respiration and soil organic matter decomposition, Soil Biol. Biochem., 63, 89–96, https://doi.org/10.1016/j.soilbio.2013.03.027, 2013. a