the Creative Commons Attribution 4.0 License.
the Creative Commons Attribution 4.0 License.
 | 27 Apr 2026
Prediction of peat properties from transmission mid-infrared spectra
Henning Teickner
Klaus-Holger Knorr
A better understanding of peatland dynamics requires more data on more peat properties than provided by existing databases. These data needs may be addressed with resource-efficient measurement tools, such as models that predict peat properties from mid-infrared spectra (MIRS). High-quality spectral prediction models are already used for mineral soils, but similar developments for peatland-focused research lag behind. Here, we present transmission-MIRS prediction models for peat that are openly available, easy to use, include quality checks to assess prediction quality, and propagate prediction errors. The models target element contents (C, N, H, O, P, S, K, Ca, Si, Ti), element ratios (, , ), isotope values (δ13C, δ15N), physical properties (bulk density, loss on ignition (LOI), macroporosity, non-macroporosity, volume fraction of solids, hydraulic conductivity, specific heat capacity, dry thermal conductivity), thermodynamic properties (Gibbs free energy of formation ()), and nominal oxidation state of carbon (NOSC). They are representative for a more diverse set of peat samples than currently existing peat-only models while having a competitive predictive accuracy. Relatively accurate predictions can be made, for example, for many element contents (C, N, O, S, Si, Ca, , , , bulk density, and LOI). Many of these properties are not predicted by existing high-quality prediction models focusing on mineral soils. For some of the target variables, high-quality prediction models focused on mineral soils exist. These models may be more accurate, but reported predictive accuracies are not directly comparable because the training data is imbalanced in the number of organic versus mineral soil samples. We suggest that some soil properties are easier to predict for peat, whereas others are easier to predict for mineral soils, emphasizing that we need new approaches to meaningfully compare prediction errors of spectral models computed on datasets with variable amounts of organic soil samples. Our tests also indicate that replacing δ13C and δ15N measurements with MIRS models probably is unlikely to be feasible due to large prediction errors. Future studies should address the lack of open training and validation data for some peat properties (O, H, NOSC, , LOI, , ), the lack of mineral-rich peat samples, and improve and standardize model validation and comparison for models trained on data with very different proportions of peat soils. This study is a step to catch up with high quality standards set by models for mineral soils and provides models for several peat properties for which we could not find descriptions of previous models in the literature. By filling data gaps in the Peatland Mid-Infrared Database, we make a step towards providing the data required to better understand peatland dynamics.
- Article
(2403 KB) - Full-text XML
-
Supplement
(6520 KB) - BibTeX
- EndNote


Northern peatlands are projected to both become a larger sink and source for greenhouse gases (Frolking et al., 2011; Qiu et al., 2022). However, these projections have large uncertainties: They range from an estimated net emission of 0.2 to an estimated net carbon sequestration of 0.1 Pg C yr−1 (Qiu et al., 2022). Also peatland C stock estimates are highly uncertain, ranging from ∼ 270 to 1045 Pg (Yu, 2012; Nichols and Peteet, 2019). Some fraction of this uncertainty is caused by a lack of knowledge on processes, their incomplete representation in models (Loisel et al., 2021; Qiu et al., 2022), a high spatial variability of peat properties (Frolking et al., 2011; Loisel et al., 2014, 2017; Normand et al., 2021; Qiu et al., 2022), and a lack of systematic data collections.
More data on peat properties would help reduce errors in estimating peat stocks and greenhouse gas emission from peatlands. Such data could be used to interpret and compare individual peat cores, quantify global peat properties at high spatial resolution, constrain parameter estimates in peatland models, and test peatland models and hypotheses on peatland processes (Loisel et al., 2014). Existing databases on global and regional peat properties partly address these needs (Zoltai et al., 2000; Charman et al., 2013; Loisel et al., 2014; Treat et al., 2016; Gallego-Sala et al., 2018; Leifeld et al., 2020). However, they still have large gaps in terms of spatial coverage (e.g. Loisel et al., 2017) and the peat properties considered. For example, one of the largest database on peat properties (Loisel et al., 2014) contains peat ages, bulk densities, C and N contents, but other peat properties, such as nutrient contents, hydraulic properties, and availability of labile organic matter also play a pivotal role in peatland models (e.g., Yu et al., 2001; Bauer, 2004; Frolking et al., 2010; Baird et al., 2012; Mahdiyasa et al., 2022; Qiu et al., 2022) and are not part of this database. Even though similar databases exist for such data, they are much smaller, containing not only fewer samples, but also covering smaller geographical areas (e.g., Liu and Lennartz, 2019; O'Connor et al., 2020).
A major obstacle towards addressing these limitations is that data collection is difficult in practice: Collection and analysis of peat cores are costly and resource limitations constrain both the number of peat samples collected and the set of peat properties measured. Examples for such resource limitations are restricted access to measurement devices, lack of funding, lack of time, or simply the fact that the amount of peat in a given sample is limited; this makes it difficult to measure all peat properties at high spatio-temporal resolution (e.g., Zaccone et al., 2018).
An approach to address this problem has been developed for mineral soils: Soil spectroscopy combined with spectral prediction models can reduce the time and cost of the measurements of diverse soil properties at an accuracy partly competitive to traditional measurement methods (Viscarra Rossel et al., 2008; Nocita et al., 2015; Hartmann and Nopmanee, 2019; Sanderman et al., 2020). This approach requires comparatively few sample preprocessing steps and only one infrared spectrum needs to be measured to predict soil properties as diverse as carbon content, bulk density, and pH value (e.g., Nocita et al., 2015; Dangal et al., 2019). In addition, spectral prediction models can be combined with pedotransfer functions to predict soil properties which are only rarely measured together with spectra (e.g., McBratney et al., 2006). In case of peat, this would be in particular useful to predict peat hydraulic and thermal properties since these are rarely measured together with spectra (e.g., Teickner et al., 2025a). Within the last years, databases, modeling approaches, and user interfaces have been improved to an extent that many traditional measurements can be replaced or supplemented at a trade-off for accuracy that is acceptable for some applications (e.g., Shepherd et al., 2022; Hengl et al., 2021).
Even though aforementioned databases and models also comprise peat, peat soils are still underrepresented in prediction models (even the largest databases contain no more than several hundred to 1000 samples which may be classified as peat based on their C content, see for example Sanderman et al., 2020; Helfenstein et al., 2021; Hengl et al., 2021). Moreover, existing mineral soil databases target soil properties linked to agriculture and forestry. Peatland research often targets stocks, indicators for peat degradation, and modeling ecosystem processes and for this requires additional soil properties, for example loss on ignition, total sulfur contents, stable isotope abundances, and porosity. Finally, many existing studies use different spectroscopic measurement techniques and spectral ranges (transmission mid-infrared spectroscopy, visible and near-infrared spectroscopy, or mid-infrared diffuse reflectance spectroscopy). In summary, existing spectral libraries and prediction services can be very useful to predict some peat properties (e.g., C, N content, bulk density) with some spectral data, but there still is a need for complementary spectral libraries and prediction models dedicated to the specific questions and approaches of peatland research.
There are many spectral prediction models exclusively for peat, but these are still in an early phase of development in comparison to those for mineral soils (Downey and Byrne, 1986; Bergner and Albano, 1993; McTiernan et al., 1998; Chapman et al., 2001; Ludwig et al., 2006; Rinnan and Rinnan, 2007; Artz et al., 2008; Terhoeven-Urselmans et al., 2008; Lang et al., 2009; Laiho et al., 2014; Hayes et al., 2015; Pérez-Rodríguez et al., 2016; Hodgkins et al., 2018; Straková et al., 2020; Helfenstein et al., 2021; Teickner et al., 2022). Major limitations in comparison to state of the art studies for mineral soils are the following: First, many of the computed models are probably unrepresentative for many new samples and likely have low reliability and predictive accuracy because they were computed with samples from only few peat cores (e.g., McTiernan et al., 1998; Chapman et al., 2001). Second, even though there exist many prediction models, there are some often used peat properties for which no prediction models for peat have been developed yet (e.g., some nutrient contents, C and N isotope values, peat hydraulic, thermal and thermodynamic properties). Third, several newer and important concepts in state of the art mineral soil studies have not yet been applied in the development of prediction models for peat: prediction domains (Wadoux et al., 2021; see also Sanderman et al., 2020 and Shepherd et al., 2022 for some recent examples), propagation of prediction errors (e.g., Viscarra Rossel et al., 2008; Shepherd et al., 2022; Padarian et al., 2022), open accessibility of model data and code (Hengl et al., 2021; Shepherd et al., 2022), and software that allows non-experts to generate predictions and check their reliability (Hengl et al., 2021; Shepherd et al., 2022). We will discuss each of these concepts in turn.
The prediction domain (sometimes referred to as calibration space, predictor space, or feature space) is the range of the spectra for which a model has been computed and validated (Wadoux et al., 2021). If a new spectrum is outside this range, a prediction model may still produce accurate predictions, but there is no guaranty for this because the model was not trained and tested on such extreme samples. Checking whether a new spectrum is within the prediction domain is therefore a first rule of thumb to decide whether to trust predictions and their uncertainties (e.g., Shepherd et al., 2022).
Many studies which use spectral prediction models to analyze peat ignore prediction errors. This can lead to overly confident inferences (e.g., Hodgkins et al., 2018; Moore et al., 2019; Baysinger et al., 2022). Prediction models should propagate errors, such that they can be appropriately included in subsequent analyses. Computing prediction errors is both a matter of developing statistical approaches which allow to compute reliable estimates of prediction errors and of software which allows scientists to easily access prediction errors.
Making raw spectra and code for spectral preprocessing and computation of models accessible is one of the largest current efforts in the development of spectral prediction models for mineral soils (Hengl et al., 2021; Shepherd et al., 2022). This allows others to use, to criticize, and to improve prediction models. The advantages therefore are improved reliability, more engagement between developers and users of models, and faster, more efficient, improvement of models. In contrast, only few of the peatland models we are aware of are openly accessible, including the underlying data (Hodgkins et al., 2018; Teickner et al., 2021, 2022; Teickner and Knorr, 2022a).
Finally, recent projects target the development of estimation services to allow non-experts to easily generate predictions (Shepherd et al., 2022). These estimation services are web applications which estimate soil properties based on spectra you have uploaded, while taking care of spectral preprocessing and reliability checks in the background (e.g., whether spectra are within the prediction domain) (Shepherd et al., 2022). Ultimately, this makes spectral prediction models widely accessible to scientists who can then quickly fill existing data gaps.
To summarize, spectral prediction models for mineral soils currently have higher quality standards than existing models for peat, and are openly accessible and easier to use. Our study aims to develop spectral prediction models for many peat properties relevant in peatland research, which use transmission mid-infrared spectra and meet quality standards set by models for mineral soils. More specifically, we want to:
-
Develop openly available spectral prediction models for many peat properties relevant in peatland research.
-
Provide prediction domains for all these models as reliability check for predictions.
-
Propagate errors from data (only for ) and parameters (all target variables) to predictions.
-
Fill data gaps in the pmird database, one of the largest open databases focusing on peat and mid-infrared spectra (Teickner et al., 2025a), to support peatland research.
To this end, we computed spectral prediction models for element contents (C, H, N, O, P, S, K, Ca, Si, Ti), element ratios (, , ), isotope values (δ13C, δ15N), physical properties (bulk density (BD), loss on ignition (LOI) macroporosity, non-macroporosity, volume fraction of solids, saturated hydraulic conductivity (Ks), specific heat capacity (cp), dry thermal conductivity (KT)), standard Gibbs free energy of formation (), and nominal oxidation state of C (NOSC) (Masiello et al., 2008). To our knowledge, our study is the first test to compute prediction models for some of these variables (O, K, Ca, Si, Ti contents, , , δ13C, δ15N, , NOSC, LOI). The models were computed and validated with data from one of the largest open accessible peat spectral libraries (Teickner et al., 2025a) which makes them representative for more diverse peat samples than most existing models that focus on peat. While some of our models may only generate approximate predictions (especially δ13C and δ15N), many have prediction errors small enough to be useful in diverse applications.
Bayesian data analysis was used to propagate errors from model parameters and data (where measurement errors are known) to predictions. We made the models openly accessible via the R packages irpeatmodels (Teickner, 2025b) and irpeat (Teickner and Hodgkins, 2025). For all computed models and those already implemented in both packages, we also computed prediction domains. Finally, we extended irpeat to allow making predictions with a few lines of code, where spectral preprocessing and basic checks for the reliability of predictions are performed in the background.
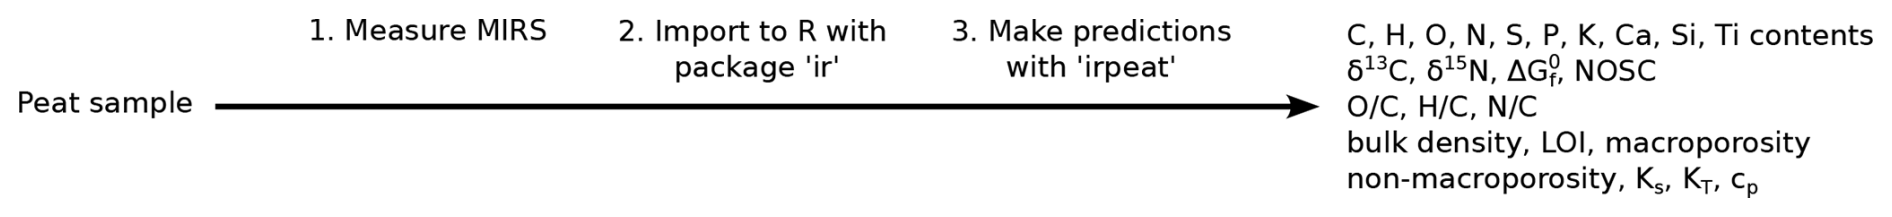
The models can be used to estimate peat properties in a workflow as shown in Fig. 1. We demonstrate the usefulness of the models and the workflow to fill gaps in databases by predicting these peat properties for samples in the pmird database. This makes pmird to one of the largest open access collections of, for example, peat element contents (C, H, O, N, P, S, K, Ca, Si, Ti) and thermodynamic properties ().
2.1 Target variables
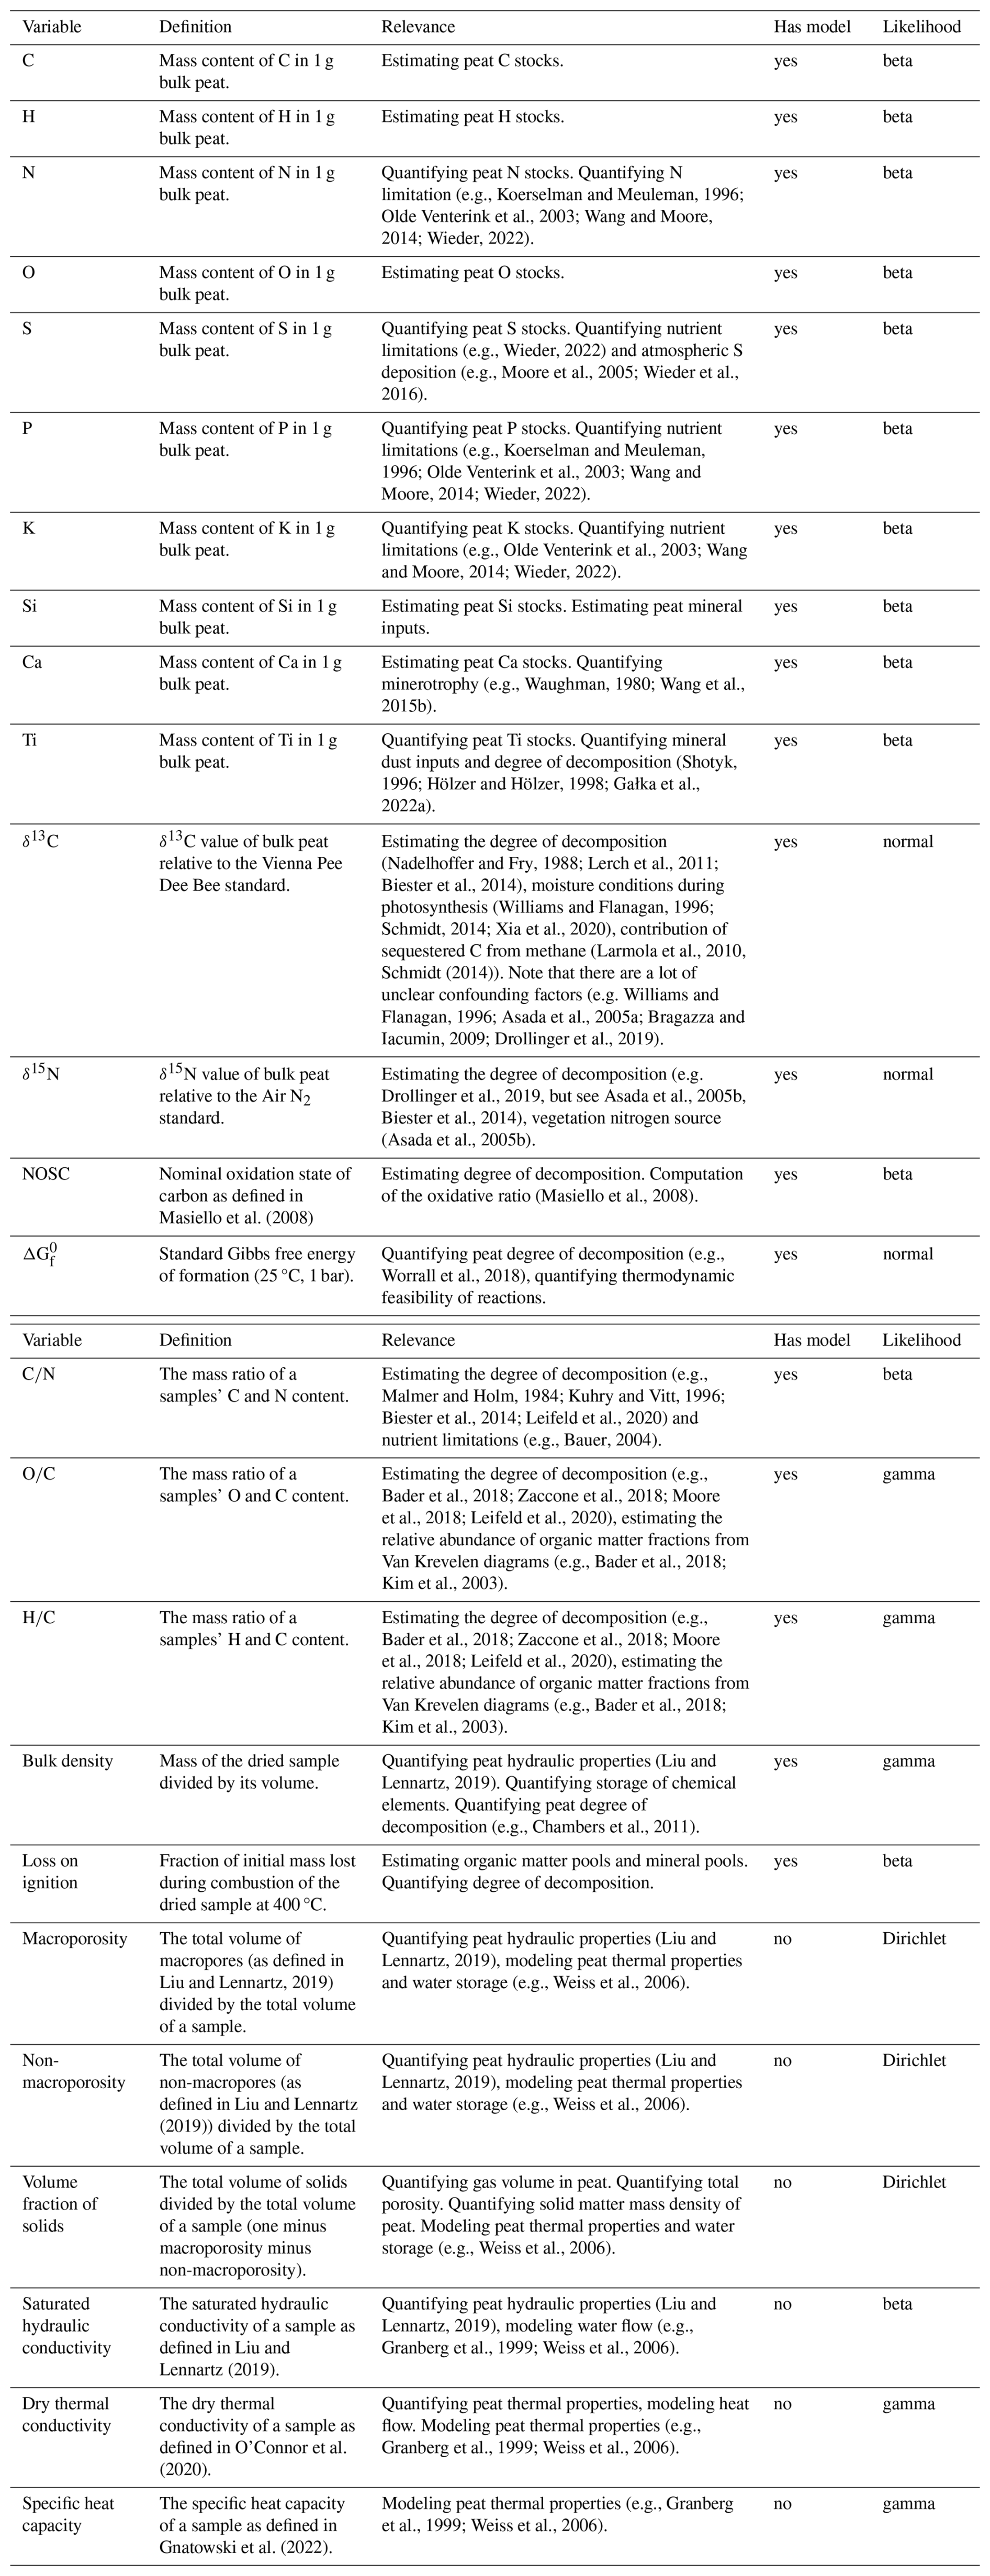
Table 1 summarizes the peat properties (target variables) for which we computed models. The variables were selected because they can be used to understand and quantify important processes in peatlands and because many of them cannot be predicted with existing models (e.g., Sanderman et al., 2020; Shepherd et al., 2022).
(e.g., Koerselman and Meuleman, 1996; Olde Venterink et al., 2003; Wang and Moore, 2014; Wieder, 2022)(e.g., Wieder, 2022)(e.g., Moore et al., 2005; Wieder et al., 2016)(e.g., Koerselman and Meuleman, 1996; Olde Venterink et al., 2003; Wang and Moore, 2014; Wieder, 2022)(e.g., Olde Venterink et al., 2003; Wang and Moore, 2014; Wieder, 2022)(e.g., Waughman, 1980; Wang et al., 2015b)(Shotyk, 1996; Hölzer and Hölzer, 1998; Gałka et al., 2022a)(Nadelhoffer and Fry, 1988; Lerch et al., 2011; Biester et al., 2014)(Williams and Flanagan, 1996; Schmidt, 2014; Xia et al., 2020)(Larmola et al., 2010, )Schmidt (2014)(e.g. Williams and Flanagan, 1996; Asada et al., 2005a; Bragazza and Iacumin, 2009; Drollinger et al., 2019)Drollinger et al., 2019Asada et al., 2005bBiester et al., 2014(Asada et al., 2005b)Masiello et al. (2008)(Masiello et al., 2008)(e.g., Worrall et al., 2018)(e.g., Malmer and Holm, 1984; Kuhry and Vitt, 1996; Biester et al., 2014; Leifeld et al., 2020)(e.g., Bauer, 2004)(e.g., Bader et al., 2018; Zaccone et al., 2018; Moore et al., 2018; Leifeld et al., 2020)Bader et al., 2018; Kim et al., 2003(e.g., Bader et al., 2018; Zaccone et al., 2018; Moore et al., 2018; Leifeld et al., 2020)Bader et al., 2018; Kim et al., 2003(Liu and Lennartz, 2019)(e.g., Chambers et al., 2011)Liu and Lennartz, 2019(Liu and Lennartz, 2019)(e.g., Weiss et al., 2006)Liu and Lennartz (2019)(Liu and Lennartz, 2019)(e.g., Weiss et al., 2006)(e.g., Weiss et al., 2006)Liu and Lennartz (2019)(Liu and Lennartz, 2019)(e.g., Granberg et al., 1999; Weiss et al., 2006)O'Connor et al. (2020)(e.g., Granberg et al., 1999; Weiss et al., 2006)Gnatowski et al. (2022)(e.g., Granberg et al., 1999; Weiss et al., 2006)Table 1Overview on the peat properties for which we computed prediction models. “Has model” indicates whether we computed a spectral prediction model for the target variable (“yes”) or a pedotransfer function which uses bulk density or N content to predict the variable (“no”). “Likelihood” is the likelihood used in the prediction model for each target variable (see Sect. 2.4).
2.2 Data sources
The prediction models were computed with a subset of the pmird database (Teickner et al., 2025a; Münchberger, 2019; Münchberger et al., 2019; Schuster et al., 2022; Drollinger et al., 2019, 2020; Agethen and Knorr, 2018; Kendall, 2020; Harris et al., 2023; Harris and Olefeldt, 2023; Pelletier et al., 2017; Teickner et al., 2021, 2022; Broder et al., 2012; Hömberg, 2014; Diaconu et al., 2020; Gałka et al., 2022b, a; Boothroyd et al., 2021; Worrall, 2021; Reuter et al., 2019a, b, 2020; Moore et al., 2005; Turunen et al., 2004). The pmird database is a heterogeneous collection of infrared spectra and other chemical and physical properties of peat, peat forming vegetation, and dissolved organic matter (DOM) compiled from previous studies. For many peat variables, the database has data from several different sites and covers global gradients of conditions under which peat is formed. This makes the models more representative for many peat properties than existing models (Bergner and Albano, 1993; Chapman et al., 2001; Artz et al., 2008; Helfenstein et al., 2021). The spectra that we used are mid-infrared spectra measured in transmission mode on dried and ground peat pressed to pellets together with potassium bromide. Details on the measurement devices and other measurement metadata are summarized, for each model, in Table S1 in the Supplement. C and N, O, H, and some of the S contents were measured with combustion elemental analyzers. Contents of all other chemical elements and of the remaining S measurements were measured using wavelength-dispersive X-ray spectrometry on peat pellets pressed from dried and milled material. Isotope values were measured with isotope ratio mass spectrometry coupled to the elemental analyzers used in the respective studies. Bulk density was measured from known dimensions of peat layers cut from cores and dry masses. Loss on ignition was measured by combustion. Details on analytical methods for individual studies may be found in the metadata stored in the pmird database.
We did not use spectra that were classified as already baseline corrected in the pmird database (Teickner et al., 2025b), except for those from dataset 13 where we checked that the corrected spectra are similar to the result of our procedure here, to avoid that differences in preprocessing would decrease the predictive accuracy of the models. The pmird database contains a comparatively small number of vegetation and dissolved organic matter (DOM) samples and we therefore do not consider our models applicable to DOM or vegetation in general, except for Sphagnum which forms the bulk undecomposed peat material in bogs. Since DOM can have spectral properties different from peat, we did not include DOM samples in our models. Except for some cores, the peat is from ombrotrophic bogs, and peat with larger mineral contents and fen peat is thus underrepresented. An overview on the geographical distribution of the peat cores used to train and test each model is given in Table S2.
The pmird database does not contain data for saturated hydraulic conductivity, total porosity, macroporosity, volume fraction of solids, specific heat capacity, and dry thermal conductivity for samples with MIRS (Teickner et al., 2025a). For these variables, we used modified versions of models from Liu and Lennartz (2019), Liu et al. (2020), Gnatowski et al. (2022), and O'Connor et al. (2020) to predict these variables from bulk density or N content. These models are described in Sect. S1. As suggested in previous studies (e.g., McBratney et al., 2006), these models (also known as pedotransfer functions) can be used with bulk density and N contents predicted from MIRS to predict these physical peat properties, whereby all relevant errors are propagated.
The pmird database also does not contain estimates. We predicted from element contents (at least C, H, N, O) using modified versions of the models from Thornton (1917), Patel and Erickson (1981), and Battley (1999) for the enthalpy of combustion and the entropy of formation, as described in Popovic (2019). These models are described in Sect. S2.
2.3 Spectral preprocessing
All computations for this manuscript were made in R 4.3.0 (R Core Team, 2022). For each of the target variables, except the physical peat properties mentioned in the previous section, we computed three spectral prediction models. The three models use differently preprocessed spectra (no derivative, first derivative, second derivative spectra), but otherwise were computed in the same way. All spectral preprocessing was done with the ir package (Teickner, 2022). To harmonize the spectra, we interpolated them to unit wavenumber resolution and clipped them to the range 650 to 4000 cm−1. Next, we conducted an atmospheric correction of water vapor and CO2 artifacts using the approach suggested in Perez-Guaita et al. (2013). First, we subtracted a baseline created from a Savitzky-Golay smoothed version of the spectra where regions with strong CO2 peaks (645 to 695 cm−1 and 2230 to 2410 cm−1) (Wallace and NIST Mass Spectrometry Data Center, 1997) were linearly interpolated and then we used CO2 and water vapor spectra from the pmird R package (Teickner, 2025a) (see also Teickner et al., 2025b) to perform the atmospheric correction as described in Perez-Guaita et al. (2013). Due to differences in devices and measurement conditions, this procedure attenuated CO2 artifacts, but did not remove them completely. Thereafter, the corrected spectra were baseline corrected using a convex hull procedure (Beleites and Sergo, 2021), normalized using the signal normal variate (SNV), the three versions of derivative spectra were computed, and all spectra were binned with a bin width of 10 cm−1 to reduce the number of redundant predictor variables and reduce possible wavenumber shifts between measurements from different devices. Finally, we excluded intensities from 2250 to 2400 cm−1, to avoid that remaining CO2 peaks confound predictions.
2.4 Prediction models
We used normal, gamma, and beta distributions as likelihoods (Table 1) and used Bayesian statistics to compute all prediction models. All models were computed with brms (Bürkner, 2018), using a logit (beta regression), log (gamma regression) or identity link function (normal regression), assuming a constant shape parameter (beta, gamma) or standard deviation (normal), using a normal prior for the intercept, gamma priors for the shape parameter or standard deviation, and regularized horseshoe priors (Piironen and Vehtari, 2017a, b) for the slopes (for each predictor variable). The regularized horseshoe prior shrinks coefficients to zero except where they are strongly related to the response variable, conditional on other predictors. To reduce overfitting, we defined a large amount of shrinkage, by assuming that 5 of the 321 predictor variables have non-zero coefficients (Piironen and Vehtari, 2017b). The regularized horseshoe prior can lead to a complex posterior geometry that is difficult to sample from even with efficient sampling algorithms and to run most of the models without divergent transitions, we had to increase the degrees of freedom of the student-t distribution of the horseshoe prior from 1 to 3 or 4. This reduced the number of divergent transitions, but also leads to less regularization (deviation from the horseshoe shape) (Piironen and Vehtari, 2017b) which may lead to overfitting and less interpretable model coefficients. In our case, less regularization was not a critical limitation because our aim was not to interpret model coefficients, but to optimize predictive accuracy, and because our model validation did not indicate overfitting (Table 2).
The posterior distributions were estimated with Markov Chain Monte Carlo (MCMC) sampling with Stan (Stan Development Team, 2021), using 4 chains, 3000 warmup iterations and 2000 sampling iterations per chain. Chains were initialized with pathfinder (Zhang et al., 2022). Maximum Monte Carlo standard errors (Vehtari et al., 2021) for predictions of the target variables by the best models (see the next section) for each target variable are shown in Table 2. As mentioned above, some models had divergent transitions, but at least one model per target variable did not and we only evaluate and interpret models without divergent transitions. The largest rank-normalized for model parameters was 1.01, indicating convergence of the chains (Vehtari et al., 2021).
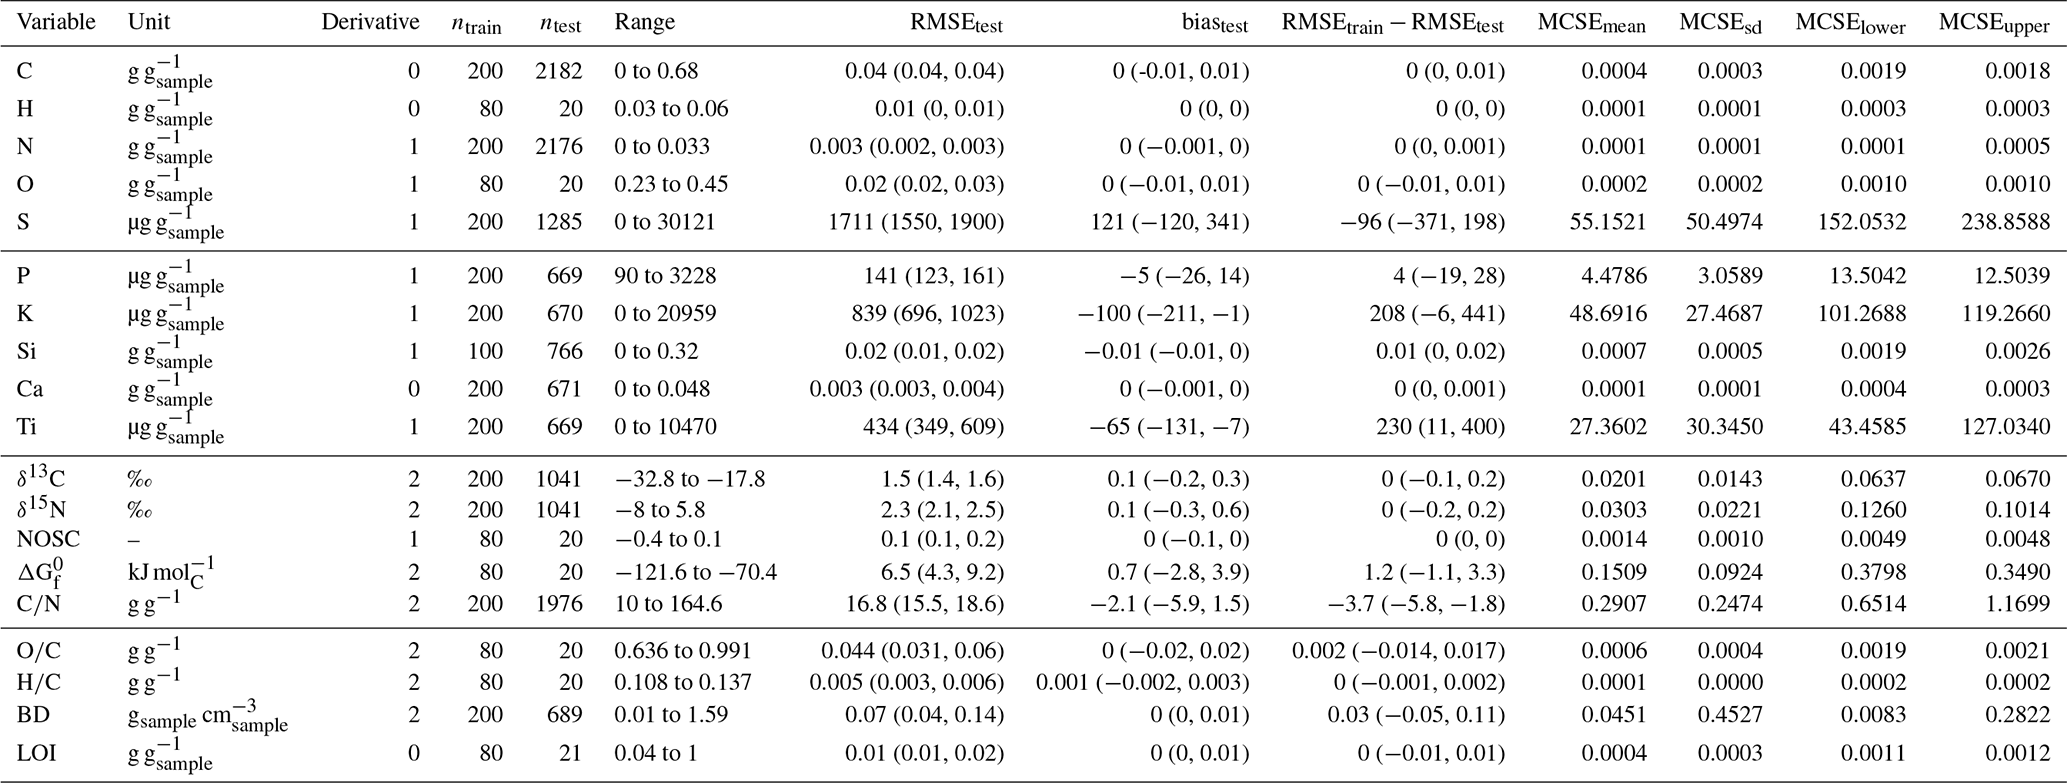
Table 2Overview on the predictive properties of the best models for each target variable. “Unit” is the measurement unit for all numeric variables. “Derivative” indicates which derivative of the spectra was used in the model. “ntrain” and “ntest” are training and testing sample sizes. “RMSEtest” is the root mean square error computed for the test data. “biastest” is the average difference between predictions and measurements. “RMSEtrain−RMSEtest” is the difference between the training RMSE and the testing RMSE (RMSEtest). “MCSEmean”, “MCSEsd”, “MCSElower”, and “MCSEupper” are maximum estimated Monte Carlo standard errors for the average, standard deviation, lower, and upper 95 % prediction interval for predicted values across the training and testing data. “BD” is bulk density and “LOI” is loss on ignition.
2.5 Model validation and data filtering
We used the Kennard–Stone algorithm as implemented in the prospectr package (Stevens and Ramirez-Lopez, 2013) to split the observations for each target variable into a training and a testing dataset, using the euclidean distance between the underived preprocessed spectra. The number of observations assigned to the training dataset was defined as , where n is the number of available observations for a target variable and nmax=200. Observations that were not part of the training data were used for model testing. All models for the same target variables use the same observations for training and testing such that the models are comparable.
This procedure was chosen because our aim is to develop prediction models that are applicable to as diverse peat samples as possible, that is, to compute one prediction model with maximum prediction domain (the value ranges covered by all predictor variables) (Wadoux et al., 2021) and smallest possible prediction error across this prediction domain. The Kennard–Stone algorithm maximizes the distance between spectra covered by the training data and therefore selects a diverse training data set.
An ideal test of the prediction models would use test data that covers the whole spectral range of the training data and is independent of the training data, which in the case of peat samples are samples from different peatland sites. We had to deviate from this ideal because of the heterogeneity of the pmird data. In particular, because there are only few samples from few peatland sites with large carbonate or silicate contents, it would have been possible with independent observations either only to test the models over a much smaller range of spectral variation if only independent test data would have been used, or to test the predictive accuracy for spectral conditions the model was not trained on. In the first case, we would risk overfitting in the untested spectral range, and in the second case, the predictive accuracy would be underestimated due to extrapolation. Therefore, as an alternative, we did not separate observations from the same cores or sites when defining training and test data. This allowed us to test the models across a much larger spectral range within their prediction domains. For many target variables, the overfitting risk should be small because both the training and the test data have samples from many different sites.
To compare models, we used the expected log predictive density (ELPD) (e.g., Vehtari et al., 2017) computed on the test data. Model evaluation was performed with the loo package (Vehtari et al., 2019). Following rules of thumb (Sivula et al., 2022), we assumed models to have equivalent predictive performance (according to the capability of our evaluation) when the difference of their ELPD (ΔELPD) is smaller than 4, and otherwise when ΔELPD is larger than two times its standard error (using normal approximation for ΔELPD). Models with divergent transitions were not considered during model evaluation. To give an easier to interpret performance metric, we also computed the root mean square error (RMSE).
We do not interpret model coefficients and how this may reflect causal links between molecular structures and target variables (1) because our model coefficients are not intended to estimate causal effects, (2) because it is very likely that they do not represent causal effects, and (3) because specific wavenumbers cannot be assigned unambiguously to molecular structures (e.g., Stuart, 2004). For those interested in model coefficients, we show a plot of the model coefficients with the best model for each target variable and a table listing possible assignments to molecular structures for coefficients with a posterior probability of being larger than 0 of at least 90 % or a posterior probability of being smaller than 0 of at least 90 % in Sect. S5.
2.6 Prediction domains
A regression model interpolates a target variable within the range of predictor values – the prediction domain (Wadoux et al., 2021). If such a model is used for prediction with new data that are outside the prediction domain, it is unclear how large prediction errors are, particularly for models with high dimensional prediction domain, such as spectral prediction models. Consequently, it should be checked that new data are within the prediction domain of the model (e.g., Roberts et al., 2017), even though this is no guaranty for accurate predictions.
For this reason, we computed the training prediction domain (Wadoux et al., 2021) for each model as the range of the predictor variable values across all training samples (training prediction domain), and a prediction domain for the test samples (test prediction domain) for each model as the range of predictor variable values across all testing samples. When samples are outside the prediction domain, predictions may be less reliable than estimated by the model validation.
The difference between testing and training prediction domain shows where the models need further testing. The difference between training (or testing) prediction domain and the prediction domain formed by all relevant spectra in the pmird database indicates whether the model covers the spectral variability in the pmird database, as approximation of the spectral variability of peat in general, and therefore indicates where additional data can improve the models.
When making predictions with the models, irpeat checks whether the input data are within the testing or training prediction domain. This is a safety device to avoid a misuse of models and it provides information for those who want to improve our models.
This test of MIRS against prediction domains is only a first test because even spectra within the prediction domain may have spectral properties and values for the predicted peat property that are different from the training or test data. With a large enough training and test dataset, such edge cases become more and more unlikely. Additional checks to be provided by future studies are based on a list of error sources identified through targeted tests of the models against such possible edge cases.
2.7 Testing the influence of confounding factors
Based on previous experience in the interpretation of peat MIRS and on the peaks caused by silicates, carbonates, amides, carbohydrates, aromatics, and lipids (Stuart, 2004; Tatzber et al., 2007; Parikh et al., 2014), we suggest that the main gradients in peat chemistry that control spectral variation are (1) the content of silicates, (2) the content of carbonates, (3) the initial vegetation composition that controls differences in the initial content of amides, carbohydrates, and aromatics, and (4) the degree of decomposition, which increases the relative contents of amides, lipids, and aromatics, and decreases the overall content of carbohydrates (e.g., Cocozza et al., 2003). Previous studies suggest that differences in amide contents and silicates can bias predictions (Broder et al., 2012; Teickner and Knorr, 2022b) and similar effects are likely for carbonates, because carbonates cause dominant peaks that overlap with peaks caused by aromatics and amides (Tatzber et al., 2007) and because large carbonate contents usually indicate higher pH values and therefore shifts in carboxyl peaks due to deprotonation (Ellerbrock and Gerke, 2021). To test for such confounding factors, we plotted model residuals versus Ca, Si, and N measured for the same samples (residuals were not plotted for samples where Ca, Si, and N, respectively, were not measured).
2.8 Filling data gaps in the pmird database
To fill data gaps in the pmird database, we used the best models for each target variable (Table 2) to predict missing values, including prediction errors as samples from the posterior predictive distribution, for the target variables where samples have MIRS. These predictions are stored in a published data table. Moreover, we created two additional data tables that indicate, for each prediction, whether the MIRS is in the training or testing prediction domain for the respective model. We restricted gap filling to peat and litter samples with absorbance-FT-MIR spectra. In contrast to the model development, we included spectra that may have already been baseline corrected, since the prediction domains can be used to screen spectra that are not similar to the data used to train and test the models. For variables that can be predicted without MIRS if other data are available (e.g., C, H, O, N, bulk density) with the additional models developed here (, saturated hydraulic conductivity, total porosity, macroporosity, volume fraction of solids, specific heat capacity, and dry thermal conductivity) or previously published models (NOSC, , , ), we created an additional data table with predictions without MIRS. For , we required C, H, O, and N contents to be measured for this; contents of other elements were included if available and otherwise the contents were set to 0 g g−1 when computing .
We developed spectral prediction models for many peat properties relevant in peatland research. In the next subsections, we evaluate these models in terms of their prediction errors estimated on test data, in terms of confounding factors, and in terms of how much of the spectral variation in the pmird database is covered by the models (prediction domains). Where other models for the same target variable are available, we compare prediction errors of our models to that from other studies. Our models are openly available via the irpeatmodels package, functions to use them are available from the irpeat package, and we show how to use these packages. Finally, to provide data that can be useful for future research, we summarize the gap-filling of the pmird database.
3.1 Predictive accuracy
The predictive accuracy for the best models for each target variable is summarized in Table 2 and plots of measured versus predicted values are shown in Fig. 2. Estimates for the predictive accuracy are both worse and better than that of previously published models using spectra in the visible, near infrared or mid-infrared range (Fig. 3), but these estimates are not directly comparable because of different modeling approaches and differences in the variability of data used to train and test the models. Studies that use large databases can use modeling approaches that require more training data but may outperform linear models, such as cubist (Hengl et al., 2021; Sanderman et al., 2020). Another reason for differences in the predictive accuracy is the chemical diversity of the training and testing data. For example, one reason for the better predictive accuracy for C contents, N contents, and reported in Chapman et al. (2001) certainly is that samples are from one site only which leads to less confounding between predictors and C content. Similarly, data from Terhoeven-Urselmans et al. (2008), Bergner and Albano (1993), and Artz et al. (2008) also cover smaller gradients in peat properties than the pmird database, in particular no peat with large mineral fractions (Fig. 3).
Not only differences in the range of chemical properties, but also the distribution of observations along chemical gradients can lead to differences in estimated predictive accuracies. For example, models from Sanderman et al. (2020) and Hengl et al. (2021) for C and N contents have a better predictive accuracy and were computed with many peat samples, but the majority of observations is from mineral soils with small C and N contents. It has been repeatedly observed that prediction errors are larger for larger C contents than for smaller C contents (Dangal et al., 2019; Helfenstein et al., 2021). These heterogeneous prediction errors are probably caused by two factors: Firstly, spectra of mineral soil have prominent mineral peaks which allow a more accurate estimation of small C contents, whereas at large OM contents there is a much more complex and diverse pattern of peaks caused by organic matter molecular structures. Secondly, whenever a variable is positive and the majority of values is small, prediction errors are smaller due to the positivity constraint (e.g., Bellon-Maurel et al., 2010). This does not only explain worse estimated predictive accuracy of our models for C and N, but can also explain why our model for bulk density has a better estimated predictive accuracy than models from Sanderman et al. (2020) and Hengl et al. (2021) because the majority of the peat samples have a small bulk density and the positivity constraint therefore implies smaller prediction errors. A last reason for a better predictive accuracy is outlier removal in previous studies not based on specific theoretical considerations (Terhoeven-Urselmans et al., 2008; Sanderman et al., 2020). We did not remove outliers here because we wanted to develop prediction models that are applicable to a diverse range of peat samples, while outlier removal may lead to better predictive accuracy for peat samples with specific chemical properties. Overall, the modeling approach and data properties of our studies are most directly comparable to Helfenstein et al. (2021), who focused on C contents, and here, our model performs similarly well.
In summary, our models have a roughly similar or better predictive performance for some variables as have previous studies focusing exclusively on peat samples. Albeit direct comparison of prediction errors to high-quality models computed with large spectral libraries is not possible in terms of peat, it is very likely that the predictive accuracy for peat properties could be improved with more flexible modeling approaches, such as localization (e.g., Viscarra Rossel et al., 2024; Helfenstein et al., 2021) or different machine learning algorithms, which would however, in many cases, require more balanced data and, for some variables, more data in general.
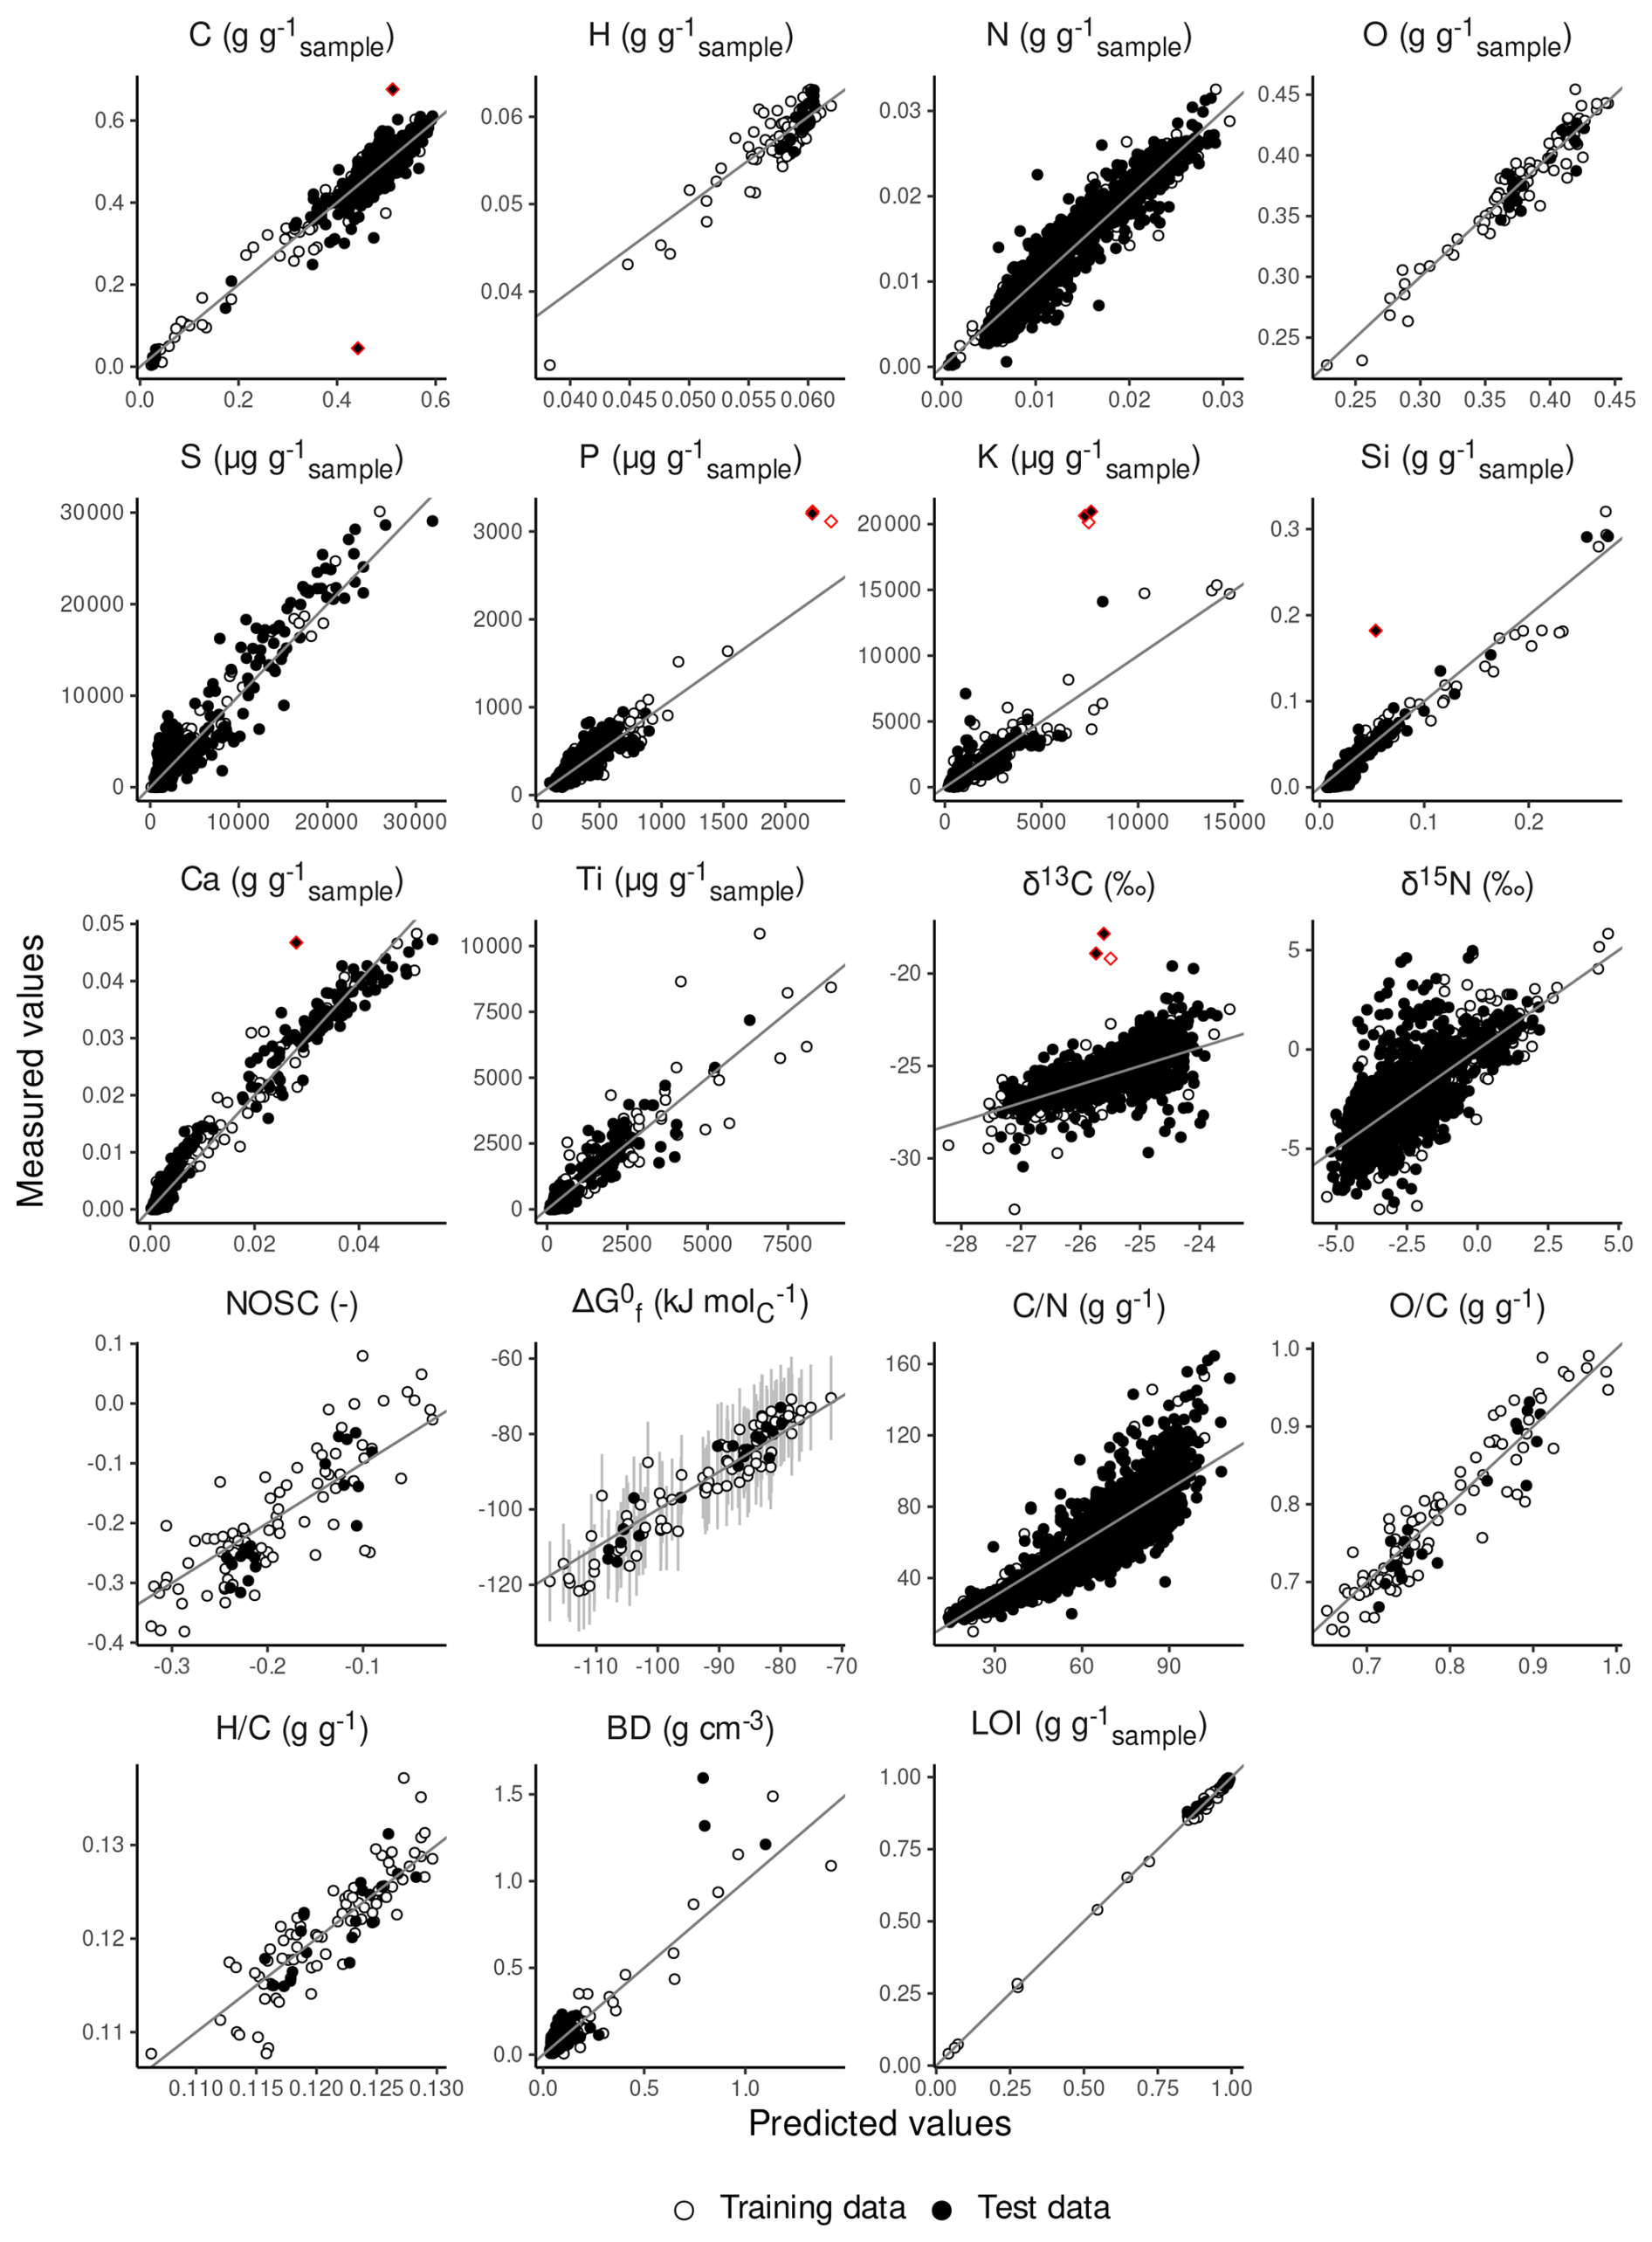
Figure 2Measured versus fitted and predicted values for all target variables. For , standard errors of prediction estimated by the auxiliary model (Sect. S2) are shown as error bars. Diamond-shaped points with red borders are outliers (discussed in the text).
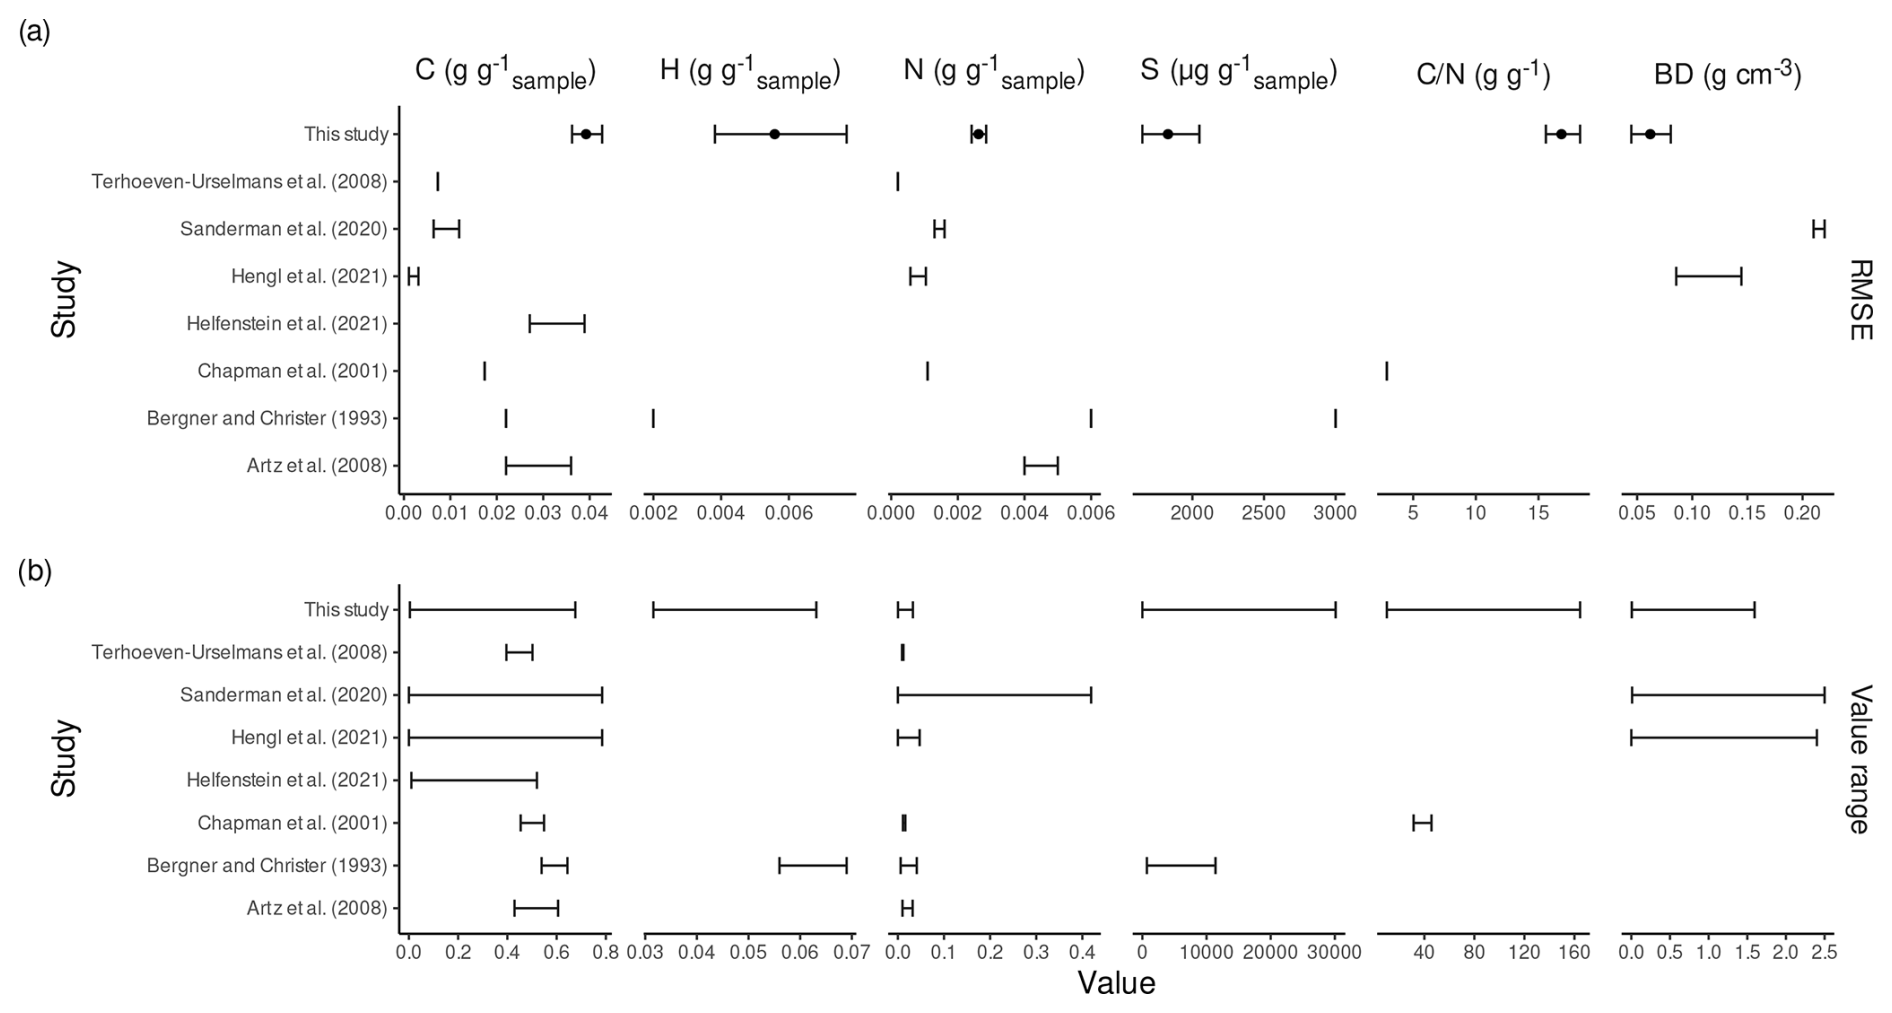
Figure 3RMSE for test data from the best models compared to RMSE for test data from other studies (a) and ranges of target variable values in the training data for the models (b). In (a), points are average values and error bars 95 % confidence intervals for individual models (our models) or the ranges of average RMSE for different strata of the data, where different analyses were performed. When studies report only one point estimate, this point estimate is shown was vertical tic. In (b), error bars are ranges for target variable values in the training data.
3.2 Outliers and confounding factors
There are some interesting patterns in the plots of measured versus predicted values (Fig. 2): For C, there are two outliers, one with a measured C content >0.6 g g−1 and one with a measured C content <0.1 g g−1 (Fig. S20). A peat sample with >0.6 gC g−1 should be decomposed because litter initially has large O and H contents that cause small relative C contents and because preferential decomposition of organic matter fractions with large O and H contents (carbohydrates, phenols) leads to a relative accumulation of C (Schellekens et al., 2015; Moore et al., 2018; Leifeld et al., 2020), but the spectrum does not have pronounced aromatic or lipid peaks one would expect for a peat sample with such high C content (Fig. S20). A peat sample with <0.1 gC g−1 must have a comparatively large mineral content because undecomposed peat forming litter has much larger C contents, yet the spectrum does not have typical silicate peaks (Fig. S20). We therefore assume that either the C measurements in the pmird database are not correct for these two measurements or that spectra were incorrectly assigned to these samples. For H, the plot indicates overestimation for smaller H contents and underestimation for larger H contents. Samples with smaller H contents have larger Si contents (Fig. S18) which suggests that predictions are confounded by silicate peaks.
For P and K, several samples with the largest measured P and K contents have relatively large prediction errors. These samples are Juncus effusus samples from a short-term NPK fertilization experiment with high nutrient loads (Agethen and Knorr, 2018). While it appears that the models can predict P and K contents reasonably well for these samples, more samples would be required to evaluate whether the model overfits to spectral characteristics of J. effusus litter (Fig. S20) rather than spectral characteristics for high P contents in vegetation.
For Si, there are several samples with larger Si content for which the model overestimates Si contents, besides the four samples with maximum Si content for which the model underestimates Si contents. The overestimated samples have a large Ca content and the underestimated do not (Fig. S16). Presence of carbonates therefore biases predictions of Si contents, even though this bias seems to be small for the training data. The one observation marked as outlier in Fig. 2 may be a measurement error of Si contents or erroneously assigned spectrum to this sample because the sample does not have typical characteristics for silicate rich peat, such as a pronounced peak around 1100 cm−1 and peaks around 1900 cm−1 (Fig. S20) (Parikh et al., 2014).
For S, larger Ca contents do not bias predictions, but they increase the residual variance indicating, similarly to Si, that peaks caused by carbonates confound predictions (Figs. 2, S16). One reason for the difficulty to predict S contents here is that samples in the data with large S contents also contain large Ca contents, but only some samples with large Ca content have carbonate peaks. Samples with large carbonate peaks probably are influenced by groundwater with relative high pH value under which calcite can precipitate with sufficiently high Ca2+ concentrations. In contrast, samples with large Ca contents, but without carbonate peaks probably have Ca2+ bound to carboxyl groups, which leads to a small carboxyl peak (around 1730 cm−1) and a more pronounced peak around 1640 cm−1 which has contributions by carboxylates (Ellerbrock and Gerke, 2021) (Fig. S19).
It is interesting that prediction of other variables (e.g., C, N, K, P, Ti, bulk density) is possible without such bias. Since the majority of samples with large Ca contents (ca. >15 000 µg g−1) are from cores from one permafrost peatland site, this may be due to overfitting, indicating that more peat MIRS from carbonate rich samples need to be published to improve development and testing of transmission-MIR prediction models for carbonate-rich peat.
Ti is the only target variable for which the training RMSE is significantly larger than the testing RMSE (Table 2). This indicates that Ti contents were more variable in the training data than in the testing data. Since Ti is unlikely to cause detectable peaks in peat MIRS, prediction of Ti concentrations probably relies mainly on a similar atmospheric deposition across the analyzed peatlands and residual enrichment as peat is lost due to decomposition or fires. That even small Ti concentrations can be estimated from MIRS therefore supports application of Ti concentrations as decomposition indicator, even though the model also suggests that there are other sources of variation. In fact, the most useful application of the models may not be the accurate prediction of Ti contents, but the detection of conditions where Ti concentrations are controlled by other factors than residual enrichment from decomposition. Such conditions can be detected by comparing predictions of the model to Ti measurements.
The models for δ13C and δ15N have prediction errors much too large for most current applications of such isotope measurements. C and N isotope values are controlled by many different processes that can easily lead to a large variation in δ13C and δ15N values despite similar spectral properties. For δ13C, these factors are differences in δ13C signatures of assimilated CO2 due to isotope fractionation (Williams and Flanagan, 1996; Hobbie and Werner, 2004), the Suess effect (Keeling, 1979), and differences in the fraction of CO2 assimilated from methanotrophy (Larmola et al., 2010; Schmidt, 2014). For δ15N, these factors are different pathways via which N is assimilated by peat forming vegetation (Asada et al., 2005b) and the opposite effects of isotope fractionation (Nadelhoffer and Fry, 1988; Lerch et al., 2011; Asada et al., 2005a; Alewell et al., 2011) and enrichment of OM fractions with negative δ13C values during aerobic decomposition (Bowling et al., 2008; Xia et al., 2020), which agrees with weak correlations of δ15N values with peat decompostion indicators (Broder et al., 2012; Biester et al., 2014; Mathijssen et al., 2019; Serk et al., 2022). It may therefore be the case that δ13C and δ15N measurements cannot be estimated accurately with MIRS prediction models. However, many of the δ13C and δ15N measurements in the pmird database do not correct for blank effects (Teickner et al., 2025b), which biases δ13C and δ15N values proportionally to the C and N mass (Langel and Dyckmans, 2017). According to blank corrections for other projects, this bias has a magnitude of ca. 0.2 ‰ to 0.5 ‰ (depending on the sample C mass) for δ13C and a magnitude of ca. 0.2 ‰ to 1 ‰ (depending on the sample N mass) for δ15N. This is only a fraction of the estimated RMSE (Table 2) and we therefore currently assume that unbiased measurements would still result in large prediction errors relative to measurements of δ13C and δ15N. For δ15N, the contribution of this bias is certainly larger than for δ13C. A factor that contributes to the large prediction errors therefore are biased measurements due to uncorrected blank effects.
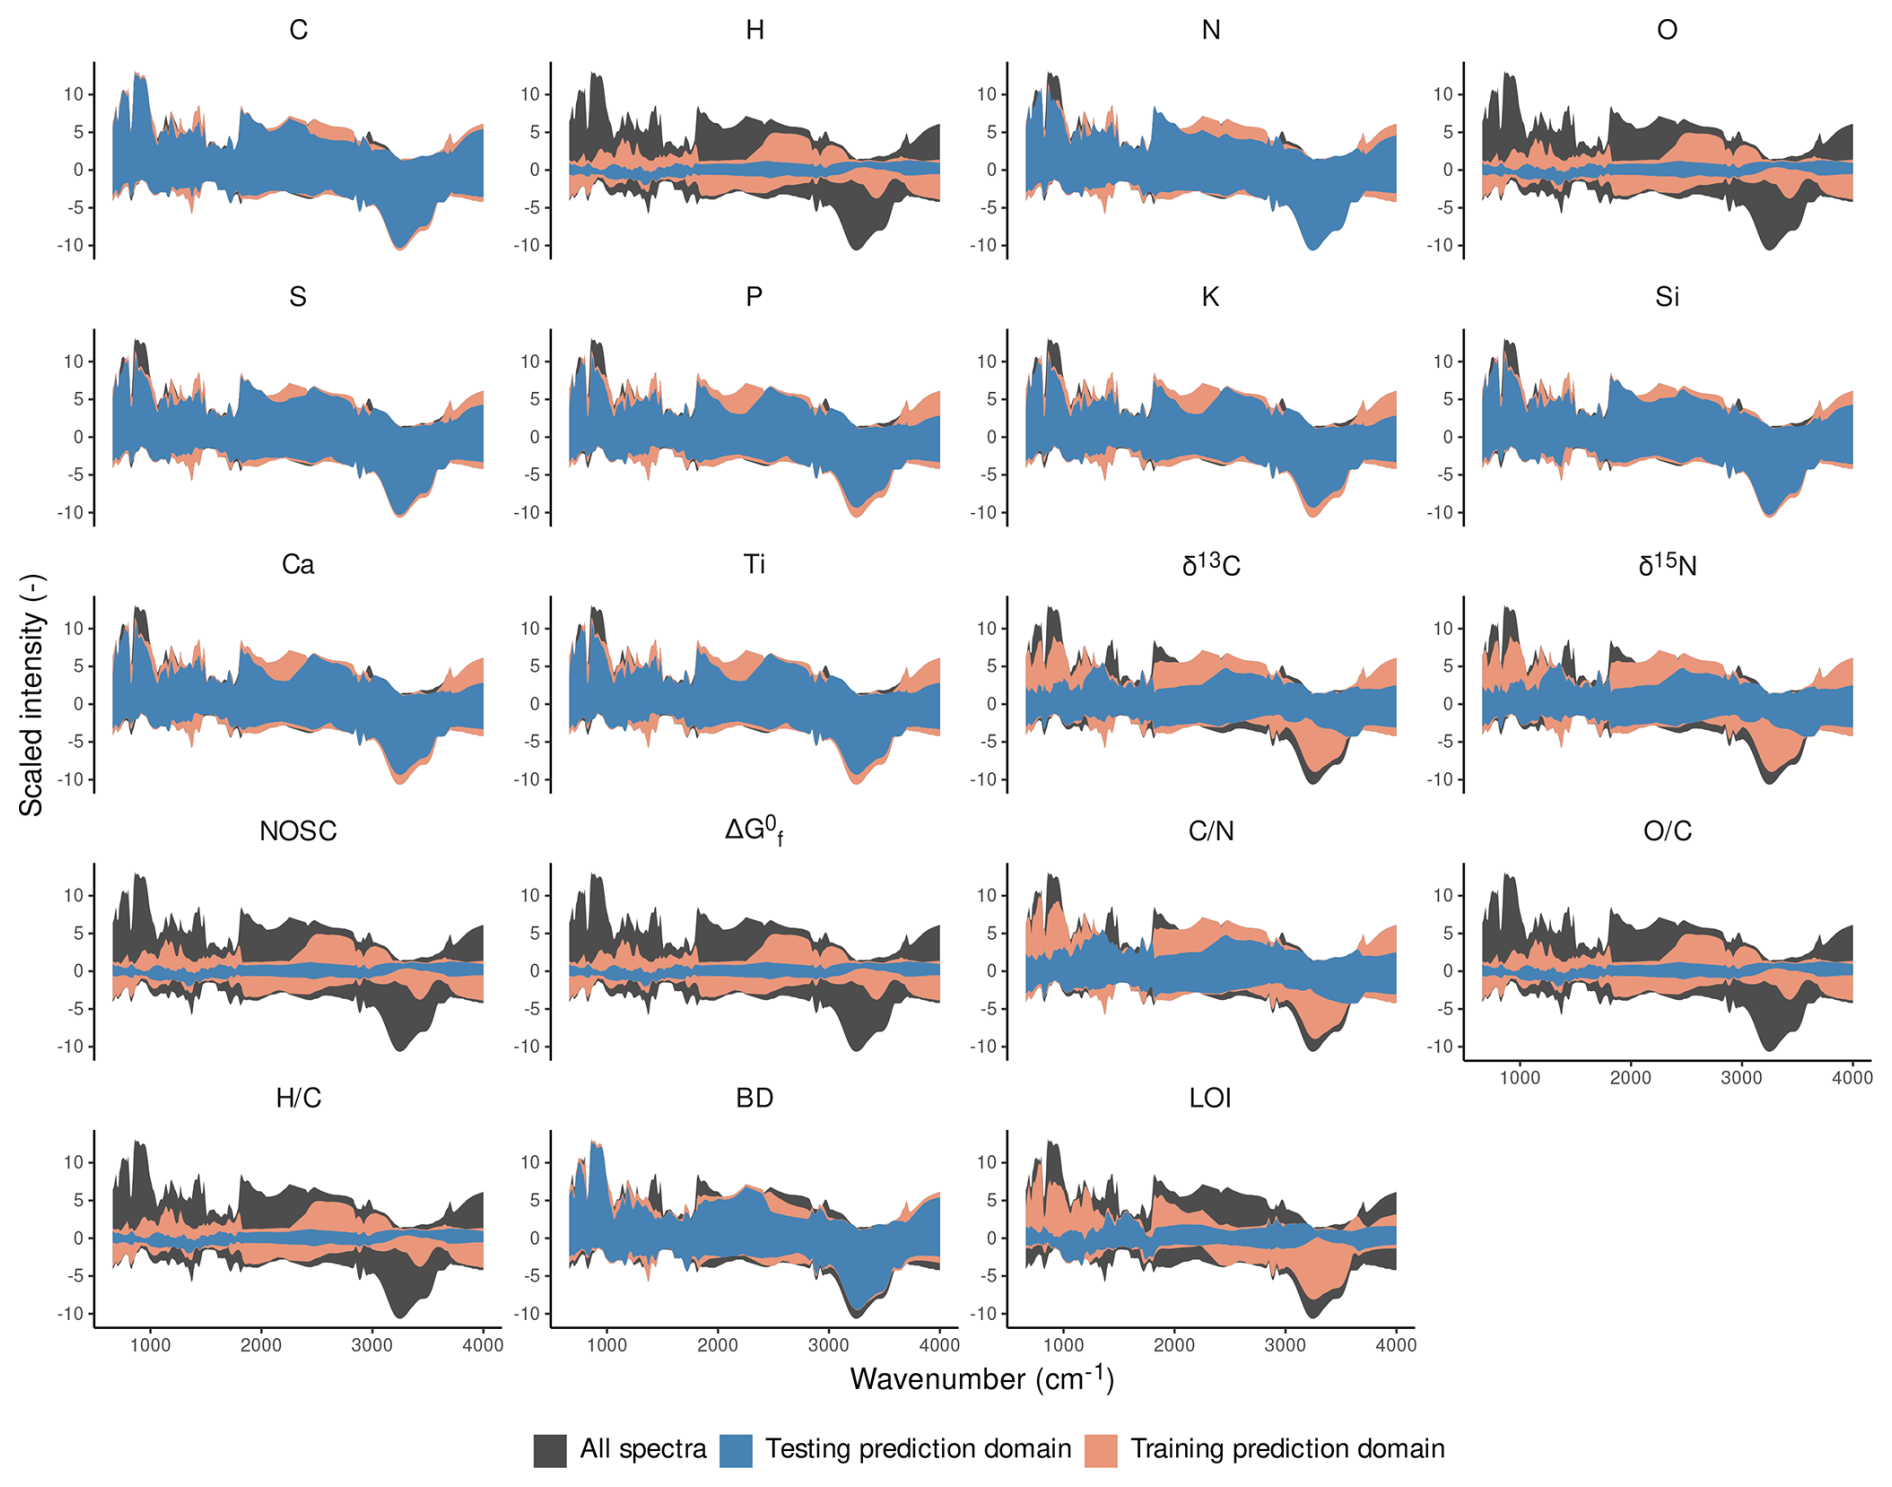
Figure 4Prediction domains of the best model for each target variable. The training and testing prediction domains are created from the maximum and minimum intensity values at each wavenumber of the preprocessed spectra across the training or test data. The shaded region “All spectra” is formed in the same way, but with all data that were used for model development. For this plot, to allow easier comparison of prediction domains between target variables, the spectra were all preprocessed and scaled in the same way (zero derivative spectra, scaling of intensities as for C).
For , prediction errors are larger for samples with larger . Two factors probably contribute to this pattern: Firstly, large values imply small N contents and at large values, very small changes in N contents cause large changes in values. Such slight changes in N contents probably cause only small changes in peak intensities that are not easy to detect in MIRS and hence not easy to predict. Secondly, some of the samples with large values have large silicate contents (Fig. S18). The large differences in spectra between undecomposed Sphagnum peat and mineral-rich peat very likely confounds linear relations present in peat without large mineral contents.
To summarize, for many variables, accurate predictions are possible with the models developed here, whereby the accuracy needed will of course depend on the specific purpose of the analysis. The models for δ13C and δ15N are probably not accurate enough for any analysis of isotope values, even if blank effects are corrected. Besides silicates and nitrogen, calcium – either in the form of carbonates or in the form of Ca2+ bound to carboxylates – is an important contributor to spectral variability in peat samples and makes it difficult to predict S, Si, and Ca contents, at least with the modeling approach used here. Since the pmird database contains Ca-rich samples only from few sites, future tests of the models with additional Ca-rich peat samples would be useful.
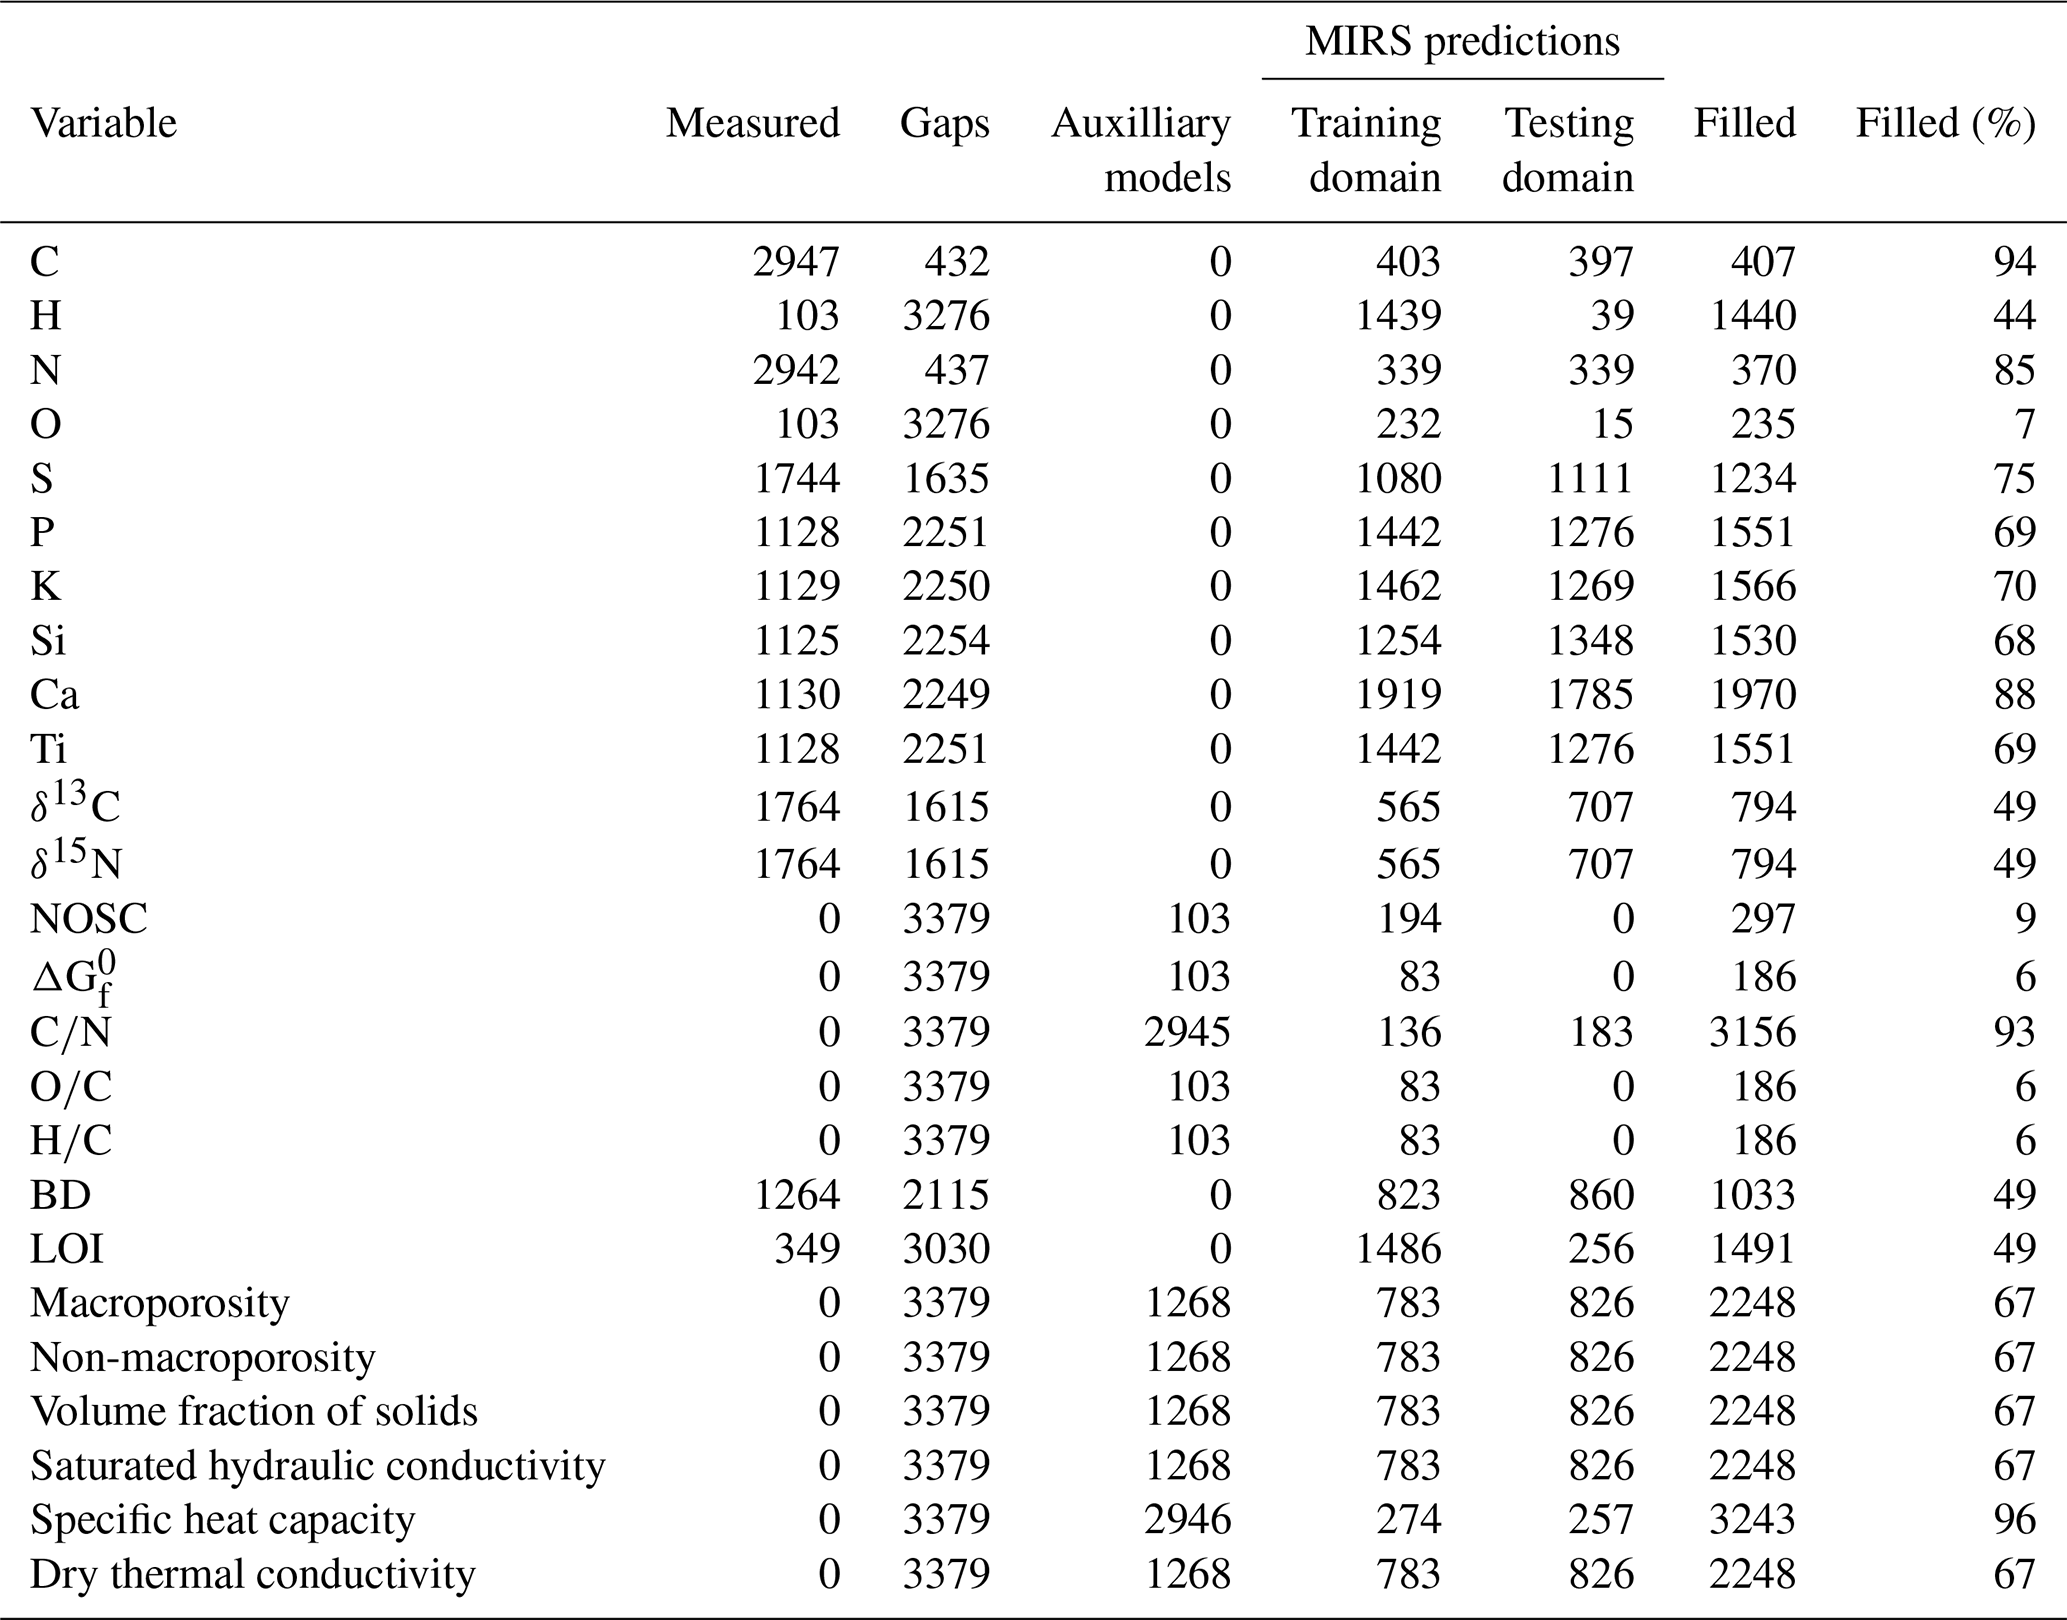
Table 3Summary of gap filling the pmird database. For each variable, the table shows the number of measured values (no gap filling needed) (“Measured”), the number of gaps (“Gaps”), the number of gaps that can be filled with the pedotransfer functions (with bulk density or N measurements), with the auxiliary model for (with element contents), or with formulas for element ratios and NOSC (with element contents) (“Auxiliary models”), the number of gaps that can be filled with MIRS predictions, where spectra are in the training or in the testing prediction domain (“Training domain” and “Testing domain”; some spectra are in both prediction domains and then are counted twice), the number of gaps that could be filled in total (“Filled”), and the fraction of gaps that could be filled (“Filled (%)”). In total, there were 3379 samples with spectra for each target variable.
3.3 Prediction domains
A comparison of training and testing prediction domains for our models shows that the testing prediction domains covers only a small fraction of the training prediction domain for H, O, NOSC, , , , , and LOI (Fig. 4). For these peat properties, only few samples were left for model testing and we could therefore not test the predictive accuracy of the models for some parts of the training prediction domain. Future studies should test these blind spots. The difference between testing and training prediction domain can be used to identify samples useful to test the models in the future. Similarly, the difference between the training prediction domain and the domain formed from all spectra identifies samples that would be useful additions to the training data if the target variable would be measured for these samples. For example, for H, O, NOSC, , , , and there is a lack of mineral-rich samples in both the training and testing data, whereas for LOI there are mineral-rich samples in the training data, but not enough mineral-rich samples were left for model testing (Fig. 4). The prediction domains are available from the irpeatmodels package.
3.4 Filling gaps in the pmird database
Table 3 summarizes the results of our gap filling. Even though we filled all gaps with MIRS predictions, predictions that are outside the training and testing prediction domain may be unreliable and therefore we consider all observations for which the spectra is neither inside the training nor the testing prediction domain as unfilled gaps for our evaluation here.
Since the pmird database contains many bulk density and N measurements, but no measurements for porosity, hydraulic conductivity, specific heat capacity, and thermal conductivity, many missing values could be estimated with the pedotransfer functions and the remaining gaps filled with MIRS-predicted bulk density and N. Similarly, a large fraction of fillable gaps for element contents could be imputed, except for H and O for which training and testing prediction domains cover a smaller fraction of the spectral variability. Much fewer gaps could be filled for O, NOSC and than for H because of differences in the preprocessing for these models: the models for H uses underived spectra, whereas the models for O, NOSC and use first or second derivative spectra, where high frequency features are more emphasized and therefore many spectra are not within the prediction domains (Table 2). For observations, where spectra are outside the prediction domain only because a few of the variables exceed the prediction domain boundaries by small values are still reliable; the amount of useful predictions is therefore probably underestimated. Compared with existing databases (Zoltai et al., 2000; Charman et al., 2013; Loisel et al., 2014; Treat et al., 2016; Gallego-Sala et al., 2018; Leifeld et al., 2020), this makes the gap-filled pmird database one of the largest available data sources for contents of many elements, hydraulic and thermal properties, and peat chemistry, in particular NOSC, and . The gap filling predictions are available from Zenodo (Teickner and Knorr, 2025a).
3.5 Implementation of the models in the irpeatmodels and irpeat R packages
The models can be used with R by installing the irpeat (Teickner, 2025a) and irpeatmodels (Teickner, 2025b) packages. The irpeatmodels package contains the models itself and irpeat contains functions to interact with the models. This design was chosen to account for faster development cycles for code to interact with the models and code for other functions of the irpeat package and also to account for size limitations for software packages in online repositories.
Our aim was to develop transmission-MIRS prediction models for peat with the quality standards of state of the art prediction models for mineral soils. We have developed models for element contents (C, N, H, O, P, S, K, Ti), element ratios (, , ), isotope values (δ13C, δ15N), physical properties (bulk density, macroporosity, non-macroporosity, hydraulic conductivity, specific heat capacity, dry thermal conductivity), Gibbs free energy of formation (), and nominal oxidation state of carbon (NOSC) of bog peat with data from the pmird database, one of the largest spectral databases available for peat soils. The models have predictive accuracies comparable to or better than existing models for peat, while covering a more diverse range of peat spectral chemistry. All models are available via the R packages irpeat and irpeatmodels. irpeat automatically propagates prediction errors and flags predictions where spectra are outside the prediction domain of the models.
A limitation to be addressed in future studies is that more diverse test data and, for some variables, more training data are required to reduce prediction errors and cover more representative chemical gradients of peat, in particular for O and H contents, NOSC and , and peat samples with larger silicate, carbonate, and, in general, mineral contents. This would also make it possible to use more flexible modeling approaches, such as localization or different machine learning algorithms, which could reduce prediction errors. Moreover, it is recommendable to replace pedotransfer functions for peat hydrological and thermal properties by spectral prediction models to reduce prediction errors.
Our model evaluation lets us draw the following conclusions: First, transmission-MIRS probably are not suitable to predict peat δ13C and δ15N very precisely and we attribute this mainly to the diversity of processes that control δ13C and δ15N and their contrasting effects. Second, a comparison to existing models for mineral soils suggests that we need more targeted approaches to meaningfully compare the predictive accuracy of models evaluated on databases with contrasting fractions of organic versus mineral soil samples.
Finally, we used our models to fill gaps in the pmird database, making it one of the largest databases for many peat properties such as hydraulic properties, Ti, O, H, and P contents, NOSC, and . This illustrates that the models represent a first step to provide the data required to quantify diverse peat properties at high spatial resolutions which will in particular be useful to estimate and test process models.
Data and code to reproduce this manuscript are available from https://doi.org/10.5281/zenodo.17209177 (Teickner and Knorr, 2025b). The data used in this study are from the pmird database (https://doi.org/10.5281/zenodo.17092587, Teickner et al., 2025a), Wang et al. (2015a), Liu and Lennartz (2019), O'Connor et al. (2020), Gnatowski et al. (2022), from several studies (Helgeson, 1978; Wagman et al., 1982; Shock, 1993; Dale et al., 1997; Richard and Helgeson, 1998; Helgeson et al., 1998; Richard, 2001; LaRowe and Helgeson, 2006a, b; Helgeson et al., 2009; LaRowe and Dick, 2012) included in the OBIGT database (Dick, 2019), from Linstrom (1997), and Battley (1999). The models computed in this study are available in the irpeatmodels package (https://doi.org/10.5281/zenodo.17187912, Teickner, 2025b) and can be used with the irpeat package (https://doi.org/10.5281/zenodo.17200517, Teickner and Hodgkins, 2025). The gap-filled subsets of the pmird database are available from https://doi.org/10.5281/zenodo.17187559 (Teickner and Knorr, 2025a).
The supplement related to this article is available online at https://doi.org/10.5194/soil-12-497-2026-supplement.
HT: Conceptualization, methodology, software, validation, formal analysis, investigation, data curation, writing – original draft, visualization, project administration. KHK: supervision, funding acquisition, writing – review & editing.
The contact author has declared that neither of the authors has any competing interests.
Publisher's note: Copernicus Publications remains neutral with regard to jurisdictional claims made in the text, published maps, institutional affiliations, or any other geographical representation in this paper. The authors bear the ultimate responsibility for providing appropriate place names. Views expressed in the text are those of the authors and do not necessarily reflect the views of the publisher.
This research has been supported by the Deutsche Forschungsgemeinschaft (grant nos. KN 929/23-1 and PE 1632/18-1).
This open-access publication was funded by the University of Münster.
This paper was edited by Nicolas P. A. Saby and reviewed by two anonymous referees.
Agethen, S. and Knorr, K.-H.: Juncus Effusus Mono-Stands in Restored Cutover Peat Bogs – Analysis of Litter Quality, Controls of Anaerobic Decomposition, and the Risk of Secondary Carbon Loss, Soil Biol. Biochem., 117, 139–152, https://doi.org/10.1016/j.soilbio.2017.11.020, 2018. a, b
Alewell, C., Giesler, R., Klaminder, J., Leifeld, J., and Rollog, M.: Stable carbon isotopes as indicators for environmental change in palsa peats, Biogeosciences, 8, 1769–1778, https://doi.org/10.5194/bg-8-1769-2011, 2011. a
Artz, R. R., Chapman, S. J., Jean Robertson, A., Potts, J. M., Laggoun-Défarge, F., Gogo, S., Comont, L., Disnar, J.-R., and Francez, A.-J.: FTIR Spectroscopy Can Be Used as a Screening Tool for Organic Matter Quality in Regenerating Cutover Peatlands, Soil Biol. Biochem., 40, 515–527, https://doi.org/10.1016/j.soilbio.2007.09.019, 2008. a, b, c
Asada, T., Warner, B., and Aravena, R.: Effects of the Early Stage of Decomposition on Change in Carbon and Nitrogen Isotopes in Sphagnum Litter, J. Plant Interact., 1, 229–237, https://doi.org/10.1080/17429140601056766, 2005a. a, b
Asada, T., Warner, B. G., and Aravena, R.: Nitrogen Isotope Signature Variability in Plant Species from Open Peatland, Aquat. Bot., 82, 297–307, https://doi.org/10.1016/j.aquabot.2005.05.005, 2005b. a, b, c
Bader, C., Müller, M., Schulin, R., and Leifeld, J.: Peat decomposability in managed organic soils in relation to land use, organic matter composition and temperature, Biogeosciences, 15, 703–719, https://doi.org/10.5194/bg-15-703-2018, 2018. a, b, c, d
Baird, A. J., Morris, P. J., and Belyea, L. R.: The DigiBog Peatland Development Model 1: Rationale, Conceptual Model, and Hydrological Basis, Ecohydrology, 5, 242–255, https://doi.org/10.1002/eco.230, 2012. a
Battley, E. H.: An Empirical Method for Estimating the Entropy of Formation and the Absolute Entropy of Dried Microbial Biomass for Use in Studies on the Thermodynamics of Microbial Growth, Thermochim. Acta, 326, 7–15, https://doi.org/10.1016/S0040-6031(98)00584-X, 1999. a, b
Bauer, I. E.: Modelling Effects of Litter Quality and Environment on Peat Accumulation over Different Time-Scales: Peat Accumulation over Different Time-Scales, J. Ecol., 92, 661–674, https://doi.org/10.1111/j.0022-0477.2004.00905.x, 2004. a, b
Baysinger, M. R., Wilson, R. M., Hanson, P. J., Kostka, J. E., and Chanton, J. P.: Compositional Stability of Peat in Ecosystem-Scale Warming Mesocosms, PLOS ONE, 17, e0263994, https://doi.org/10.1371/journal.pone.0263994, 2022. a
Beleites, C. and Sergo, V.: hyperSpec: A Package to Handle Hyperspectral Data Sets in R, Comprehensive R Archive Network (CRAN) [code], https://doi.org/10.32614/CRAN.package.hyperSpec, 2021. a
Bellon-Maurel, V., Fernandez-Ahumada, E., Palagos, B., Roger, J.-M., and McBratney, A.: Critical Review of Chemometric Indicators Commonly Used for Assessing the Quality of the Prediction of Soil Attributes by NIR Spectroscopy, TRAC-Trend. Anal. Chem., 29, 1073–1081, https://doi.org/10.1016/j.trac.2010.05.006, 2010. a
Bergner, K. and Albano, C.: Thermal Analysis of Peat, Anal. Chem., 65, 204–208, https://doi.org/10.1021/ac00051a003, 1993. a, b, c
Biester, H., Knorr, K.-H., Schellekens, J., Basler, A., and Hermanns, Y.-M.: Comparison of different methods to determine the degree of peat decomposition in peat bogs, Biogeosciences, 11, 2691–2707, https://doi.org/10.5194/bg-11-2691-2014, 2014. a, b, c, d
Boothroyd, I. M., Worrall, F., Moody, C. S., Clay, G. D., Abbott, G. D., and Rose, R.: Sulfur Constraints on the Carbon Cycle of a Blanket Bog Peatland, J. Geophys. Res.-Biogeo., 126, https://doi.org/10.1029/2021JG006435, 2021. a
Bowling, D. R., Pataki, D. E., and Randerson, J. T.: Carbon Isotopes in Terrestrial Ecosystem Pools and CO2 Fluxes, New Phytol., 178, 24–40, https://doi.org/10.1111/j.1469-8137.2007.02342.x, 2008. a
Bragazza, L. and Iacumin, P.: Seasonal Variation in Carbon Isotopic Composition of Bog Plant Litter during 3 Years of Field Decomposition, Biol. Fert. Soils, 46, 73–77, https://doi.org/10.1007/s00374-009-0406-7, 2009. a
Broder, T., Blodau, C., Biester, H., and Knorr, K. H.: Peat decomposition records in three pristine ombrotrophic bogs in southern Patagonia, Biogeosciences, 9, 1479–1491, https://doi.org/10.5194/bg-9-1479-2012, 2012. a, b, c
Bürkner, P.-C.: Advanced Bayesian Multilevel Modeling with the R Package brms, The R Journal, 10, 395–411, https://doi.org/10.32614/RJ-2018-017, 2018. a
Chambers, F. M., Beilman, D. W., and Yu, Z.: Methods for Determining Peat Humification and for Quantifying Peat Bulk Density, Organic Matter and Carbon Content for Palaeostudies of Climate and Peatland Carbon Dynamics, Mires Peat, 10, 1–10, 2011. a
Chapman, S., Campbell, C., Fraser, A., and Puri, G.: FTIR Spectroscopy of Peat in and Bordering Scots Pine Woodland: Relationship with Chemical and Biological Properties, Soil Biol. Biochem., 33, 1193–1200, https://doi.org/10.1016/S0038-0717(01)00023-2, 2001. a, b, c, d
Charman, D. J., Beilman, D. W., Blaauw, M., Booth, R. K., Brewer, S., Chambers, F. M., Christen, J. A., Gallego-Sala, A., Harrison, S. P., Hughes, P. D. M., Jackson, S. T., Korhola, A., Mauquoy, D., Mitchell, F. J. G., Prentice, I. C., van der Linden, M., De Vleeschouwer, F., Yu, Z. C., Alm, J., Bauer, I. E., Corish, Y. M. C., Garneau, M., Hohl, V., Huang, Y., Karofeld, E., Le Roux, G., Loisel, J., Moschen, R., Nichols, J. E., Nieminen, T. M., MacDonald, G. M., Phadtare, N. R., Rausch, N., Sillasoo, Ü., Swindles, G. T., Tuittila, E.-S., Ukonmaanaho, L., Väliranta, M., van Bellen, S., van Geel, B., Vitt, D. H., and Zhao, Y.: Climate-related changes in peatland carbon accumulation during the last millennium, Biogeosciences, 10, 929–944, https://doi.org/10.5194/bg-10-929-2013, 2013. a, b
Cocozza, C., D'Orazio, V., Miano, T. M., and Shotyk, W.: Characterization of Solid and Aqueous Phases of a Peat Bog Profile Using Molecular Fluorescence Spectroscopy, ESR and FT-IR, and Comparison with Physical Properties, Org. Geochem., 34, 49–60, https://doi.org/10.1016/S0146-6380(02)00208-5, 2003. a
Dale, J., Shock, E., Macleod, G., Aplin, A., and Larter, S.: Standard Partial Molal Properties of Aqueous Alkylphenols at High Pressures and Temperatures, Geochim. Cosmochim. Ac., 61, 4017–4024, https://doi.org/10.1016/S0016-7037(97)00212-3, 1997. a
Dangal, S., Sanderman, J., Wills, S., and Ramirez-Lopez, L.: Accurate and Precise Prediction of Soil Properties from a Large Mid-Infrared Spectral Library, Soil Systems, 3, 11, https://doi.org/10.3390/soilsystems3010011, 2019. a, b
Diaconu, A.-C., Tanţău, I., Knorr, K.-H., Borken, W., Feurdean, A., Panait, A., and Gałka, M.: A Multi-Proxy Analysis of Hydroclimate Trends in an Ombrotrophic Bog over the Last Millennium in the Eastern Carpathians of Romania, Palaeogeogr. Palaeocl., 538, 109390, https://doi.org/10.1016/j.palaeo.2019.109390, 2020. a
Dick, J. M.: CHNOSZ: Thermodynamic Calculations and Diagrams for Geochemistry, Front. Earth Sci., 7, 180, https://doi.org/10.3389/feart.2019.00180, 2019. a
Downey, G. and Byrne, P.: Prediction of Moisture and Bulk Density in Milled Peat by near Infrared Reflectance, J. Sci. Food Agr., 37, 231–238, https://doi.org/10.1002/jsfa.2740370306, 1986. a
Drollinger, S., Kuzyakov, Y., and Glatzel, S.: Effects of Peat Decomposition on δ13C and δ15N Depth Profiles of Alpine Bogs, CATENA, 178, 1–10, https://doi.org/10.1016/j.catena.2019.02.027, 2019. a, b, c
Drollinger, S., Knorr, K.-H., Knierzinger, W., and Glatzel, S.: Peat Decomposition Proxies of Alpine Bogs along a Degradation Gradient, Geoderma, 369, 114331, https://doi.org/10.1016/j.geoderma.2020.114331, 2020. a
Ellerbrock, R. H. and Gerke, H. H.: FTIR Spectral Band Shifts Explained by OM–Cation Interactions, J. Plant Nutr. Soil Sc., 184, 388–397, https://doi.org/10.1002/jpln.202100056, 2021. a, b
Frolking, S., Roulet, N. T., Tuittila, E., Bubier, J. L., Quillet, A., Talbot, J., and Richard, P. J. H.: A new model of Holocene peatland net primary production, decomposition, water balance, and peat accumulation, Earth Syst. Dynam., 1, 1–21, https://doi.org/10.5194/esd-1-1-2010, 2010. a
Frolking, S., Talbot, J., Jones, M. C., Treat, C. C., Kauffman, J. B., Tuittila, E.-S., and Roulet, N.: Peatlands in the Earth's 21st Century Climate System, Environ. Rev., 19, 371–396, https://doi.org/10.1139/a11-014, 2011. a, b
Gałka, M., Diaconu, A.-C., Feurdean, A., Loisel, J., Teickner, H., Broder, T., and Knorr, K.-H.: Relations of Fire, Palaeohydrology, Vegetation Succession, and Carbon Accumulation, as Reconstructed from a Mountain Bog in the Harz Mountains (Germany) during the Last 6200 Years, Geoderma, 424, 115991, https://doi.org/10.1016/j.geoderma.2022.115991, 2022a. a, b
Gałka, M., Hölzer, A., Feurdean, A., Loisel, J., Teickner, H., Diaconu, A.-C., Szal, M., Broder, T., and Knorr, K.-H.: Insight into the Factors of Mountain Bog and Forest Development in the Schwarzwald Mts.: Implications for Ecological Restoration, Ecol. Indic., 140, 109039, https://doi.org/10.1016/j.ecolind.2022.109039, 2022b. a
Gallego-Sala, A. V., Charman, D. J., Brewer, S., Page, S. E., Prentice, I. C., Friedlingstein, P., Moreton, S., Amesbury, M. J., Beilman, D. W., Björck, S., Blyakharchuk, T., Bochicchio, C., Booth, R. K., Bunbury, J., Camill, P., Carless, D., Chimner, R. A., Clifford, M., Cressey, E., Courtney-Mustaphi, C., De Vleeschouwer, F., de Jong, R., Fialkiewicz-Koziel, B., Finkelstein, S. A., Garneau, M., Githumbi, E., Hribjlan, J., Holmquist, J., Hughes, P. D. M., Jones, C., Jones, M. C., Karofeld, E., Klein, E. S., Kokfelt, U., Korhola, A., Lacourse, T., Le Roux, G., Lamentowicz, M., Large, D., Lavoie, M., Loisel, J., Mackay, H., MacDonald, G. M., Makila, M., Magnan, G., Marchant, R., Marcisz, K., Martínez Cortizas, A., Massa, C., Mathijssen, P., Mauquoy, D., Mighall, T., Mitchell, F. J. G., Moss, P., Nichols, J., Oksanen, P. O., Orme, L., Packalen, M. S., Robinson, S., Roland, T. P., Sanderson, N. K., Sannel, A. B. K., Silva-Sánchez, N., Steinberg, N., Swindles, G. T., Turner, T. E., Uglow, J., Väliranta, M., van Bellen, S., van der Linden, M., van Geel, B., Wang, G., Yu, Z., Zaragoza-Castells, J., and Zhao, Y.: Latitudinal Limits to the Predicted Increase of the Peatland Carbon Sink with Warming, Nat. Clim. Change, 8, 907–913, https://doi.org/10.1038/s41558-018-0271-1, 2018. a, b
Gnatowski, T., Ostrowska-Ligęza, E., Kechavarzi, C., Kurzawski, G., and Szatyłowicz, J.: Heat Capacity of Drained Peat Soils, Appl. Sci., 12, 1579, https://doi.org/10.3390/app12031579, 2022. a, b, c
Granberg, G., Grip, H., Löfvenius, M. O., Sundh, I., Svensson, B. H., and Nilsson, M.: A Simple Model for Simulation of Water Content, Soil Frost, and Soil Temperatures in Boreal Mixed Mires, Water Resour. Res., 35, 3771–3782, https://doi.org/10.1029/1999WR900216, 1999. a, b, c
Harris, L. and Olefeldt, D.: Permafrost Thaw Causes Large Carbon Loss in Boreal Peatlands While Changes to Peat Quality Are Limited, DRYAD [data set], https://doi.org/10.5061/DRYAD.47D7WM3KK, 2023. a
Harris, L. I., Olefeldt, D., Pelletier, N., Blodau, C., Knorr, K.-H., Talbot, J., Heffernan, L., and Turetsky, M.: Permafrost Thaw Causes Large Carbon Loss in Boreal Peatlands While Changes to Peat Quality Are Limited, Glob. Change Biol., 29, gcb.16894, https://doi.org/10.1111/gcb.16894, 2023. a
Hartmann, C. and Nopmanee, S.: Global Soil Laboratory Assessment, 2018 Online Survey, Tech. rep., Food and Agriculture Organization of the United Nations, Rome, ISBN 978-92-5-131988-8, https://www.fao.org/3/ca7091en/CA7091EN.pdf (last access: 18 October 2022), 2019. a
Hayes, D., Hayes, M., and Leahy, J.: Analysis of the Lignocellulosic Components of Peat Samples with Development of near Infrared Spectroscopy Models for Rapid Quantitative Predictions, Fuel, 150, 261–268, https://doi.org/10.1016/j.fuel.2015.01.094, 2015. a
Helfenstein, A., Baumann, P., Viscarra Rossel, R., Gubler, A., Oechslin, S., and Six, J.: Quantifying soil carbon in temperate peatlands using a mid-IR soil spectral library, SOIL, 7, 193–215, https://doi.org/10.5194/soil-7-193-2021, 2021. a, b, c, d, e, f
Helgeson, H. C.: Summary and Critique of the Thermodynamic Properties of Rock-Forming Minerals, Kline Geology Laboratory Yale University, New Haven, https://earth.geology.yale.edu/~ajs/1978/ajs_278A_1.pdf/1.pdf (last access: 1 April 2026), 1978. a
Helgeson, H. C., Owens, C. E., Knox, A. M., and Richard, L.: Calculation of the Standard Molal Thermodynamic Properties of Crystalline, Liquid, and Gas Organic Molecules at High Temperatures and Pressures, Geochim. Cosmochim. Ac., 62, 985–1081, https://doi.org/10.1016/S0016-7037(97)00219-6, 1998. a
Helgeson, H. C., Richard, L., McKenzie, W. F., Norton, D. L., and Schmitt, A.: A Chemical and Thermodynamic Model of Oil Generation in Hydrocarbon Source Rocks, Geochim. Cosmochim. Ac., 73, 594–695, https://doi.org/10.1016/j.gca.2008.03.004, 2009. a
Hengl, T., Sanderman, J., and Parente, L.: Open Soil Spectral Library (Training Data and Calibration Models), Zenodo [data set], https://doi.org/10.5281/zenodo.5759693, 2021. a, b, c, d, e, f, g, h
Hobbie, E. A. and Werner, R. A.: Intramolecular, Compound-specific, and Bulk Carbon Isotope Patterns in C3 and C4 Plants: A Review and Synthesis, New Phytol., 161, 371–385, https://doi.org/10.1111/j.1469-8137.2004.00970.x, 2004. a
Hodgkins, S. B., Richardson, C. J., Dommain, R., Wang, H., Glaser, P. H., Verbeke, B., Winkler, B. R., Cobb, A. R., Rich, V. I., Missilmani, M., Flanagan, N., Ho, M., Hoyt, A. M., Harvey, C. F., Vining, S. R., Hough, M. A., Moore, T. R., Richard, P. J. H., De La Cruz, F. B., Toufaily, J., Hamdan, R., Cooper, W. T., and Chanton, J. P.: Tropical Peatland Carbon Storage Linked to Global Latitudinal Trends in Peat Recalcitrance, Nat. Commun., 9, 3640, https://doi.org/10.1038/s41467-018-06050-2, 2018. a, b, c
Hölzer, A. and Hölzer, A.: Silicon and Titanium in Peat Profiles as Indicators of Human Impact, The Holocene, 8, 685–696, https://doi.org/10.1191/095968398670694506, 1998. a
Hömberg, A.: Geochemische Charakterisierung von Mooren der Changbai Mountains, Bachelor thesis, Münster, Münster, 2014. a
Keeling, C. D.: The Suess Effect: 13Carbon-14Carbon Interrelations, Environ. Int., 2, 229–300, https://doi.org/10.1016/0160-4120(79)90005-9, 1979. a
Kendall, R. A.: Microbial and Substrate Decomposition Factors in Commercially Extracted Peatlands in Canada, Master's thesis, McGill University, Montréal, https://escholarship.mcgill.ca/concern/theses/gh93h442s (last access: 19 October 2021), 2020. a
Kim, S., Kramer, R. W., and Hatcher, P. G.: Graphical Method for Analysis of Ultrahigh-Resolution Broadband Mass Spectra of Natural Organic Matter, the van Krevelen Diagram, Anal. Chem., 75, 5336–5344, https://doi.org/10.1021/ac034415p, 2003. a, b
Koerselman, W. and Meuleman, A. F. M.: The Vegetation N:P Ratio: A New Tool to Detect the Nature of Nutrient Limitation, J. Appl. Ecol., 33, 1441–1450, 1996. a, b
Kuhry, P. and Vitt, D. H.: Fossil Carbon/Nitrogen Ratios as a Measure of Peat Decomposition, Ecology, 77, 271–275, https://doi.org/10.2307/2265676, 1996. a
Laiho, R., Bhuiyan, R., Straková, P., Mäkiranta, P., Badorek, T., and Penttilä, T.: Modified Ingrowth Core Method plus Infrared Calibration Models for Estimating Fine Root Production in Peatlands, Plant Soil, 385, 311–327, https://doi.org/10.1007/s11104-014-2225-3, 2014. a
Lang, S. I., Cornelissen, J. H. C., Klahn, T., van Logtestijn, R. S. P., Broekman, R., Schweikert, W., and Aerts, R.: An Experimental Comparison of Chemical Traits and Litter Decomposition Rates in a Diverse Range of Subarctic Bryophyte, Lichen and Vascular Plant Species, J. Ecol., 97, 886–900, https://doi.org/10.1111/j.1365-2745.2009.01538.x, 2009. a
Langel, R. and Dyckmans, J.: A Closer Look into the Nitrogen Blank in Elemental Analyser/Isotope Ratio Mass Spectrometry Measurements, Rapid Commun. Mass Sp., 31, 2051–2055, https://doi.org/10.1002/rcm.7999, 2017. a
Larmola, T., Tuittila, E.-S., Tur, M., and Yrj, K.: The Role of Sphagnum Mosses in the Methane Cycling of a Boreal Mire, Ecology, 91, 2356–2365, https://www.jstor.org/stable/27860800 (last access: 25 April 2022), 2010. a, b
LaRowe, D. E. and Dick, J. M.: Calculation of the Standard Molal Thermodynamic Properties of Crystalline Peptides, Geochim. Cosmochim. Ac., 80, 70–91, https://doi.org/10.1016/j.gca.2011.11.041, 2012. a
LaRowe, D. E. and Helgeson, H. C.: Biomolecules in Hydrothermal Systems: Calculation of the Standard Molal Thermodynamic Properties of Nucleic-Acid Bases, Nucleosides, and Nucleotides at Elevated Temperatures and Pressures, Geochim. Cosmochim. Ac., 70, 4680–4724, https://doi.org/10.1016/j.gca.2006.04.010, 2006a. a
LaRowe, D. E. and Helgeson, H. C.: The Energetics of Metabolism in Hydrothermal Systems: Calculation of the Standard Molal Thermodynamic Properties of Magnesium-Complexed Adenosine Nucleotides and NAD and NADP at Elevated Temperatures and Pressures, Thermochim. Acta, 448, 82–106, https://doi.org/10.1016/j.tca.2006.06.008, 2006b. a
Leifeld, J., Klein, K., and Wüst-Galley, C.: Soil Organic Matter Stoichiometry as Indicator for Peatland Degradation, Sci. Rep., 10, 7634, https://doi.org/10.1038/s41598-020-64275-y, 2020. a, b, c, d, e, f
Lerch, T. Z., Nunan, N., Dignac, M.-F., Chenu, C., and Mariotti, A.: Variations in Microbial Isotopic Fractionation during Soil Organic Matter Decomposition, Biogeochemistry, 106, 5–21, https://doi.org/10.1007/s10533-010-9432-7, 2011. a, b
Linstrom, P.: NIST Chemistry WebBook, NIST Standard Reference Database 69, https://doi.org/10.18434/T4D303, 1997. a
Liu, H. and Lennartz, B.: Hydraulic Properties of Peat Soils along a Bulk Density Gradient-A Meta Study, Hydrol. Process., 33, 101–114, https://doi.org/10.1002/hyp.13314, 2019. a, b, c, d, e, f, g, h, i, j
Liu, H., Price, J., Rezanezhad, F., and Lennartz, B.: Centennial-scale Shifts in Hydrophysical Properties of Peat Induced by Drainage, Water Resour. Res., 56, https://doi.org/10.1029/2020WR027538, 2020. a
Loisel, J., Yu, Z., Beilman, D. W., Camill, P., Alm, J., Amesbury, M. J., Anderson, D., Andersson, S., Bochicchio, C., Barber, K., Belyea, L. R., Bunbury, J., Chambers, F. M., Charman, D. J., De Vleeschouwer, F., Fiałkiewicz-Kozieł, B., Finkelstein, S. A., Gałka, M., Garneau, M., Hammarlund, D., Hinchcliffe, W., Holmquist, J., Hughes, P., Jones, M. C., Klein, E. S., Kokfelt, U., Korhola, A., Kuhry, P., Lamarre, A., Lamentowicz, M., Large, D., Lavoie, M., MacDonald, G., Magnan, G., Mäkilä, M., Mallon, G., Mathijssen, P., Mauquoy, D., McCarroll, J., Moore, T. R., Nichols, J., O'Reilly, B., Oksanen, P., Packalen, M., Peteet, D., Richard, P. J., Robinson, S., Ronkainen, T., Rundgren, M., Sannel, A. B. K., Tarnocai, C., Thom, T., Tuittila, E.-S., Turetsky, M., Väliranta, M., van der Linden, M., van Geel, B., van Bellen, S., Vitt, D., Zhao, Y., and Zhou, W.: A Database and Synthesis of Northern Peatland Soil Properties and Holocene Carbon and Nitrogen Accumulation, The Holocene, 24, 1028–1042, https://doi.org/10.1177/0959683614538073, 2014. a, b, c, d, e
Loisel, J., van Bellen, S., Pelletier, L., Talbot, J., Hugelius, G., Karran, D., Yu, Z., Nichols, J., and Holmquist, J.: Insights and Issues with Estimating Northern Peatland Carbon Stocks and Fluxes since the Last Glacial Maximum, Earth-Sci. Rev., 165, 59–80, https://doi.org/10.1016/j.earscirev.2016.12.001, 2017. a, b
Loisel, J., Gallego-Sala, A. V., Amesbury, M. J., Magnan, G., Anshari, G., Beilman, D. W., Benavides, J. C., Blewett, J., Camill, P., Charman, D. J., Chawchai, S., Hedgpeth, A., Kleinen, T., Korhola, A., Large, D., Mansilla, C. A., Müller, J., van Bellen, S., West, J. B., Yu, Z., Bubier, J. L., Garneau, M., Moore, T., Sannel, A. B. K., Page, S., Väliranta, M., Bechtold, M., Brovkin, V., Cole, L. E. S., Chanton, J. P., Christensen, T. R., Davies, M. A., De Vleeschouwer, F., Finkelstein, S. A., Frolking, S., Gałka, M., Gandois, L., Girkin, N., Harris, L. I., Heinemeyer, A., Hoyt, A. M., Jones, M. C., Joos, F., Juutinen, S., Kaiser, K., Lacourse, T., Lamentowicz, M., Larmola, T., Leifeld, J., Lohila, A., Milner, A. M., Minkkinen, K., Moss, P., Naafs, B. D. A., Nichols, J., O'Donnell, J., Payne, R., Philben, M., Piilo, S., Quillet, A., Ratnayake, A. S., Roland, T. P., Sjögersten, S., Sonnentag, O., Swindles, G. T., Swinnen, W., Talbot, J., Treat, C., Valach, A. C., and Wu, J.: Expert Assessment of Future Vulnerability of the Global Peatland Carbon Sink, Nat. Clim. Change, 11, 70–77, https://doi.org/10.1038/s41558-020-00944-0, 2021. a
Ludwig, B., Schmilewski, G., and Terhoeven-Urselmans, T.: Use of near Infrared Spectroscopy to Predict Chemical Parameters and Phytotoxicity of Peats and Growing Media, Sci. Hortic., 109, 86–91, https://doi.org/10.1016/j.scienta.2006.02.020, 2006. a
Mahdiyasa, A. W., Large, D. J., Muljadi, B. P., Icardi, M., and Triantafyllou, S.: MPeat – A Fully Coupled Mechanical-ecohydrological Model of Peatland Development, Ecohydrology, 15, https://doi.org/10.1002/eco.2361, 2022. a
Malmer, N. and Holm, E.: Variation in the C/N-quotient of Peat in Relation to Decomposition Rate and Age Determination with 210Pb, Oikos, 43, 171, https://doi.org/10.2307/3544766, 1984. a
Masiello, C. A., Gallagher, M. E., Randerson, J. T., Deco, R. M., and Chadwick, O. A.: Evaluating Two Experimental Approaches for Measuring Ecosystem Carbon Oxidation State and Oxidative Ratio, J. Geophys. Res., 113, G03010, https://doi.org/10.1029/2007JG000534, 2008. a, b, c
Mathijssen, P. J., Gałka, M., Borken, W., and Knorr, K.-H.: Plant Communities Control Long Term Carbon Accumulation and Biogeochemical Gradients in a Patagonian Bog, Sci. Total Environ., 684, 670–681, https://doi.org/10.1016/j.scitotenv.2019.05.310, 2019. a
McBratney, A. B., Minasny, B., and Viscarra Rossel, R.: Spectral Soil Analysis and Inference Systems: A Powerful Combination for Solving the Soil Data Crisis, Geoderma, 136, 272–278, https://doi.org/10.1016/j.geoderma.2006.03.051, 2006. a, b
McTiernan, K. B., Garnett, M. H., Mauquoy, D., Ineson, P., and Coûteaux, M.-M.: Use of Near-Infrared Reflectance Spectroscopy (NIRS) in Palaeoecological Studies of Peat, The Holocene, 8, 729–740, https://doi.org/10.1191/095968398673885510, 1998. a, b
Moore, T., Blodau, C., Turunen, J., Roulet, N. T., and Richard, P. J. H.: Patterns of Nitrogen and Sulfur Accumulation and Retention in Ombrotrophic Bogs, Eastern Canada, Glob. Change Biol., 11, 356–367, https://doi.org/10.1111/j.1365-2486.2004.00882.x, 2005. a, b
Moore, T. R., Large, D., Talbot, J., Wang, M., and Riley, J. L.: The Stoichiometry of Carbon, Hydrogen, and Oxygen in Peat, J. Geophys. Res.-Biogeo., 123, 3101–3110, https://doi.org/10.1029/2018JG004574, 2018. a, b, c
Moore, T. R., Knorr, K.-H., Thompson, L., Roy, C., and Bubier, J. L.: The Effect of Long-Term Fertilization on Peat in an Ombrotrophic Bog, Geoderma, 343, 176–186, https://doi.org/10.1016/j.geoderma.2019.02.034, 2019. a
Münchberger, W.: Past and Present Carbon Dynamics in Contrasting South Patagonian Bog Ecosystems, PhD thesis, University Münster, Münster, https://repositorium.uni-muenster.de/document/miami/47b241cc-192d-4ec2-9a91-d85b7f6ca78d/diss_muenchberger.pdf (last access: 13 October 2021), 2019. a
Münchberger, W., Knorr, K.-H., Blodau, C., Pancotto, V. A., and Kleinebecker, T.: Zero to moderate methane emissions in a densely rooted, pristine Patagonian bog – biogeochemical controls as revealed from isotopic evidence, Biogeosciences, 16, 541–559, https://doi.org/10.5194/bg-16-541-2019, 2019. a
Nadelhoffer, K. J. and Fry, B.: Controls on Natural Nitrogen-15 and Carbon-13 Abundances in Forest Soil Organic Matter, Soil Sci. Soc. Am. J., 52, 1633–1640, https://doi.org/10.2136/sssaj1988.03615995005200060024x, 1988. a, b
Nichols, J. E. and Peteet, D. M.: Rapid Expansion of Northern Peatlands and Doubled Estimate of Carbon Storage, Nat. Geosci., 12, 917–921, https://doi.org/10.1038/s41561-019-0454-z, 2019. a
Nocita, M., Stevens, A., van Wesemael, B., Aitkenhead, M., Bachmann, M., Barthès, B., Ben Dor, E., Brown, D. J., Clairotte, M., Csorba, A., Dardenne, P., Demattê, J. A., Genot, V., Guerrero, C., Knadel, M., Montanarella, L., Noon, C., Ramirez-Lopez, L., Robertson, J., Sakai, H., Soriano-Disla, J. M., Shepherd, K. D., Stenberg, B., Towett, E. K., Vargas, R., and Wetterlind, J.: Soil Spectroscopy: An Alternative to Wet Chemistry for Soil Monitoring, in: Advances in Agronomy, vol. 132, 139–159, Elsevier, ISBN 978-0-12-802135-4, https://doi.org/10.1016/bs.agron.2015.02.002, 2015. a, b
Normand, A. E., Turner, B. L., Lamit, L. J., Smith, A. N., Baiser, B., Clark, M. W., Hazlett, C., Kane, E. S., Lilleskov, E., Long, J. R., Grover, S. P., and Reddy, K. R.: Organic Matter Chemistry Drives Carbon Dioxide Production of Peatlands, Geophys. Res. Lett., 48, https://doi.org/10.1029/2021GL093392, 2021. a
O'Connor, M. T., Cardenas, M. B., Ferencz, S. B., Wu, Y., Neilson, B. T., Chen, J., and Kling, G. W.: Empirical Models for Predicting Water and Heat Flow Properties of Permafrost Soils, Geophys. Res. Lett., 47, e2020GL087646, https://doi.org/10.1029/2020GL087646, 2020. a, b, c, d
Olde Venterink, H., Wassen, M. J., Verkroost, A. W. M., and De Ruiter, P. C.: Species Richness-Productivity Patterns Differ between N-, P-, and K-limited Wetlands, Ecology, 84, 2191–2199, https://doi.org/10.1890/01-0639, 2003. a, b, c
Padarian, J., Minasny, B., and McBratney, A.: Assessing the Uncertainty of Deep Learning Soil Spectral Models Using Monte Carlo Dropout, Geoderma, 425, 116063, https://doi.org/10.1016/j.geoderma.2022.116063, 2022. a
Parikh, S. J., Goyne, K. W., Margenot, A. J., Mukome, F. N., and Calderón, F. J.: Soil Chemical Insights Provided through Vibrational Spectroscopy, in: Advances in Agronomy, vol. 126, 148 pp., Elsevier, ISBN 978-0-12-800132-5, https://doi.org/10.1016/B978-0-12-800132-5.00001-8, 2014. a, b
Patel, S. A. and Erickson, L. E.: Estimation of Heats of Combustion of Biomass from Elemental Analysis Using Available Electron Concepts, Biotechnol. Bioeng., 23, 2051–2067, https://doi.org/10.1002/bit.260230910, 1981. a
Pelletier, N., Talbot, J., Olefeldt, D., Turetsky, M., Blodau, C., Sonnentag, O., and Quinton, W. L.: Influence of Holocene Permafrost Aggradation and Thaw on the Paleoecology and Carbon Storage of a Peatland Complex in Northwestern Canada, The Holocene, 27, 1391–1405, https://doi.org/10.1177/0959683617693899, 2017. a
Perez-Guaita, D., Kuligowski, J., Quintás, G., Garrigues, S., and de la Guardia, M.: Atmospheric Compensation in Fourier Transform Infrared (FT-IR) Spectra of Clinical Samples, Appl. Spectrosc., 67, 1339–1342, https://doi.org/10.1366/13-07159, 2013. a, b
Pérez-Rodríguez, M., Horák-Terra, I., Rodríguez-Lado, L., and Martínez Cortizas, A.: Modelling Mercury Accumulation in Minerogenic Peat Combining FTIR-ATR Spectroscopy and Partial Least Squares (PLS), Spectrochim. Acta A, 168, 65–72, https://doi.org/10.1016/j.saa.2016.05.052, 2016. a
Piironen, J. and Vehtari, A.: Sparsity Information and Regularization in the Horseshoe and Other Shrinkage Priors, Electron. J. Stat., 11, https://doi.org/10.1214/17-EJS1337SI, 2017a. a
Piironen, J. and Vehtari, A.: On the Hyperprior Choice for the Global Shrinkage Parameter in the Horseshoe Prior, arXiv [preprint], https://doi.org/10.48550/arXiv.1610.05559, 2017b. a, b, c
Popovic, M.: Thermodynamic Properties of Microorganisms: Determination and Analysis of Enthalpy, Entropy, and Gibbs Free Energy of Biomass, Cells and Colonies of 32 Microorganism Species, Heliyon, 5, e01950, https://doi.org/10.1016/j.heliyon.2019.e01950, 2019. a
Qiu, C., Ciais, P., Zhu, D., Guenet, B., Chang, J., Chaudhary, N., Kleinen, T., Li, X., Müller, J., Xi, Y., Zhang, W., Ballantyne, A., Brewer, S. C., Brovkin, V., Charman, D. J., Gustafson, A., Gallego-Sala, A. V., Gasser, T., Holden, J., Joos, F., Kwon, M. J., Lauerwald, R., Miller, P. A., Peng, S., Page, S., Smith, B., Stocker, B. D., Sannel, A. B. K., Salmon, E., Schurgers, G., Shurpali, N. J., Wårlind, D., and Westermann, S.: A Strong Mitigation Scenario Maintains Climate Neutrality of Northern Peatlands, One Earth, 5, 86–97, https://doi.org/10.1016/j.oneear.2021.12.008, 2022. a, b, c, d, e
R Core Team: R: A Language and Environment for Statistical Computing, Vienna, Austria, https://www.R-project.org/ (last access: 18 January 2024), 2022. a
Reuter, H., Gensel, J., Elvert, M., and Zak, D.: Infrared Spectra (FTIR) of Phragmites Australis Litter, Initial and after Anoxic Decomposition in Three Wetland Substrates, PANGAEA [data set], https://doi.org/10.1594/PANGAEA.902069, 2019a. a
Reuter, H., Gensel, J., Elvert, M., and Zak, D.: CuO Lignin, and Bulk Decomposition Data of a 75-Day Anoxic Phragmites Australis Litter Decomposition Experiment in Soil Substrates from Three Northeast German Wetlands, PANGAEA [data set], https://doi.org/10.1594/PANGAEA.902176, 2019b. a
Reuter, H., Gensel, J., Elvert, M., and Zak, D.: Evidence for preferential protein depolymerization in wetland soils in response to external nitrogen availability provided by a novel FTIR routine, Biogeosciences, 17, 499–514, https://doi.org/10.5194/bg-17-499-2020, 2020. a
Richard, L.: Calculation of the standard molal thermodynamic properties as a function of temperature and pressure of some geochemically important organic sulfur compounds, Geochim. Cosmochim. Ac., 65, 3827–3877, https://doi.org/10.1016/S0016-7037(01)00761-X, 2001. a
Richard, L. and Helgeson, H. C.: Calculation of the Thermodynamic Properties at Elevated Temperatures and Pressures of Saturated and Aromatic High Molecular Weight Solid and Liquid Hydrocarbons in Kerogen, Bitumen, Petroleum, and Other Organic Matter of Biogeochemical Interest, Geochim. Cosmochim. Ac., 62, 3591–3636, https://doi.org/10.1016/S0016-7037(97)00345-1, 1998. a
Rinnan, R. and Rinnan, Å.: Application of near Infrared Reflectance (NIR) and Fluorescence Spectroscopy to Analysis of Microbiological and Chemical Properties of Arctic Soil, Soil Biol. Biochem., 39, 1664–1673, https://doi.org/10.1016/j.soilbio.2007.01.022, 2007. a
Roberts, D. R., Bahn, V., Ciuti, S., Boyce, M. S., Elith, J., Guillera-Arroita, G., Hauenstein, S., Lahoz-Monfort, J. J., Schröder, B., Thuiller, W., Warton, D. I., Wintle, B. A., Hartig, F., and Dormann, C. F.: Cross-Validation Strategies for Data with Temporal, Spatial, Hierarchical, or Phylogenetic Structure, Ecography, 40, 913–929, https://doi.org/10.1111/ecog.02881, 2017. a
Sanderman, J., Savage, K., and Dangal, S. R.: Mid-infrared Spectroscopy for Prediction of Soil Health Indicators in the United States, Soil Sci. Soc. Am. J., 84, 251–261, https://doi.org/10.1002/saj2.20009, 2020. a, b, c, d, e, f, g, h
Schellekens, J., Bindler, R., Martínez-Cortizas, A., McClymont, E. L., Abbott, G. D., Biester, H., Pontevedra-Pombal, X., and Buurman, P.: Preferential Degradation of Polyphenols from Sphagnum – 4-Isopropenylphenol as a Proxy for Past Hydrological Conditions in Sphagnum-Dominated Peat, Geochim. Cosmochim. Ac., 150, 74–89, https://doi.org/10.1016/j.gca.2014.12.003, 2015. a
Schmidt, S. R.: Sphagnum in a Changing World: From the Landscape to the Isotope Scale, Tech. rep., University Hamburg, https://ediss.sub.uni-hamburg.de/handle/ediss/5382 (last access: 15 July 2021), 2014. a, b, c
Schuster, W., Knorr, K.-H., Blodau, C., Gałka, M., Borken, W., Pancotto, V. A., and Kleinebecker, T.: Control of Carbon and Nitrogen Accumulation by Vegetation in Pristine Bogs of Southern Patagonia, Sci. Total Environ., 810, 151293, https://doi.org/10.1016/j.scitotenv.2021.151293, 2022. a
Serk, H., Nilsson, M. B., Figueira, J., Krüger, J. P., Leifeld, J., Alewell, C., and Schleucher, J.: Organo-Chemical Characterisation of Peat Decomposition Reveals Preferential Degradation of Hemicelluloses as Main Cause for Organic Matter Loss in the Acrotelm, SSRN [preprint], https://doi.org/10.2139/ssrn.4051383, 2022. a
Shepherd, K. D., Ferguson, R., Hoover, D., van Egmond, F., Sanderman, J., and Ge, Y.: A Global Soil Spectral Calibration Library and Estimation Service, Soil Security, 7, 100061, https://doi.org/10.1016/j.soisec.2022.100061, 2022. a, b, c, d, e, f, g, h, i, j
Shock, E. L.: Hydrothermal Dehydration of Aqueous Organic Compounds, Geochim. Cosmochim. Ac., 57, 3341–3349, https://doi.org/10.1016/0016-7037(93)90542-5, 1993. a
Shotyk, W.: Peat Bog Archives of Atmospheric Metal Deposition: Geochemical Evaluation of Peat Profiles, Natural Variations in Metal Concentrations, and Metal Enrichment Factors, Environ. Rev., 4, 149–183, https://doi.org/10.1139/a96-010, 1996. a
Sivula, T., Magnusson, M., Matamoros, A. A., and Vehtari, A.: Uncertainty in Bayesian Leave-One-out Cross-Validation Based Model Comparison, arXiv [preprint], https://doi.org/10.48550/arXiv.2008.10296, 2022. a
Stan Development Team: Stan Modeling Language Users Guide and Reference Manual, version 2.36.0, https://mc-stan.org/ (last access: 3 April 2026), 2021. a
Stevens, A. and Ramirez-Lopez, L.: prospectr: Miscellaneous Functions for Processing and Sample Selection of Spectroscopic Data, Comprehensive R Archive Network (CRAN) [code], https://doi.org/10.32614/CRAN.package.prospectr, 2013. a
Straková, P., Larmola, T., Andrés, J., Ilola, N., Launiainen, P., Edwards, K., Minkkinen, K., and Laiho, R.: Quantification of Plant Root Species Composition in Peatlands Using FTIR Spectroscopy, Front. Plant Sci., 11, 597, https://doi.org/10.3389/fpls.2020.00597, 2020. a
Stuart, B. H.: Infrared Spectroscopy: Fundamentals and Applications, Analytical Techniques in the Sciences, John Wiley & Sons, Ltd, Chichester, UK, ISBN 978-0-470-01114-0 978-0-470-85428-0, https://doi.org/10.1002/0470011149, 2004. a, b
Tatzber, M., Stemmer, M., Spiegel, H., Katzlberger, C., Haberhauer, G., and Gerzabek, M. H.: An Alternative Method to Measure Carbonate in Soils by FT-IR Spectroscopy, Environ. Chem. Lett., 5, 9–12, https://doi.org/10.1007/s10311-006-0079-5, 2007. a, b
Teickner, H.: ir: Functions to Handle and Preprocess Infrared Spectra, Comprehensive R Archive Network (CRAN) [code], https://doi.org/10.32614/CRAN.package.ir, 2022. a
Teickner, H.: pmird: R interface to the Peatland Mid-infrared Database, Zenodo [code], https://doi.org/10.5281/zenodo.19397082, 2025a. a, b
Teickner, H.: irpeatmodels: Mid-infrared Prediction Models for Peat, Zenodo [code], https://doi.org/10.5281/zenodo.17187912, 2025b. a, b, c
Teickner, H. and Hodgkins, S.: irpeat 0.3.0: Functions to Analyze Mid-Infrared Spectra of Peat Samples, Zenodo [code], https://doi.org/10.5281/zenodo.17200517, 2025. a, b
Teickner, H. and Knorr, K.-H.: hklmirs: Reproducible Research Compendium for “Improving Models to Predict Holocellulose and Klason Lignin Contents for Peat Soil Organic Matter with Mid-Infrared Spectra” and “Comment on Hodgkins et al. (2018): Predicting Absolute Holocellulose and Klason Lignin Contents for Peat Remains Challenging”, Zenodo [code], https://doi.org/10.5281/zenodo.6935424, 2022a. a
Teickner, H. and Knorr, K.-H.: Improving models to predict holocellulose and Klason lignin contents for peat soil organic matter with mid-infrared spectra, SOIL, 8, 699–715, https://doi.org/10.5194/soil-8-699-2022, 2022b. a
Teickner, H. and Knorr, K.-H.: Gap-Filled Subset of the Peatland Mid-Infrared Database (1.0.0), Zenodo [data set], https://doi.org/10.5281/zenodo.17187559, 2025a. a, b
Teickner, H. and Knorr, K.-H.: Compendium of R Code and Data for “Prediction of Peat Properties from Transmission Mid-Infrared Spectra”, Zenodo [code, data set], https://doi.org/10.5281/zenodo.17209177, 2025b. a
Teickner, H., Gao, C., and Knorr, K.-H.: Reproducible Research Compendium with R Code and Data for: “Electrochemical Properties of Peat Particulate Organic Matter on a Global Scale: Relation to Peat Chemistry and Degree of Decomposition”, Zenodo [code, data set], https://doi.org/10.5281/zenodo.5792970, 2021. a, b
Teickner, H., Gao, C., and Knorr, K.-H.: Electrochemical Properties of Peat Particulate Organic Matter on a Global Scale: Relation to Peat Chemistry and Degree of Decomposition, Global Biogeochem. Cy., 36, e2021GB007160, https://doi.org/10.1029/2021GB007160, 2022. a, b, c
Teickner, H., Agethen, S., Berger, S., Boelsen, R. I., Borken, W., Bragazza, L., Broder, T., De La Cruz, F. B., Diaconu, A.-C., Dise, N. B., Drollinger, S., Estop-Aragonés, C., Gałka, M., Martí, M., Glatzel, S., Groß, J., Harris, L., Heffernan, L., Hodgkins, S. B., Hömberg-Grandjean, A., Hoppe, H., Kleinebecker, T., Knierzinger, W., Liu, H., Mathijssen, P. J., Mollmann, C., Schuster, W., Närtker, L., Olefeldt, D., Pancotto, V., Pelletier, N., Reuter, H., Robroek, B., Svensson, B., Talbot, J., Thompson, L., Worrall, F., Yu, Z.-G., and Knorr, K.-H.: Peatland Mid-Infrared Database (1.0.0), Zenodo [data set], https://doi.org/10.5281/zenodo.17092587, 2025a. a, b, c, d, e, f
Teickner, H., Agethen, S., Berger, S., Boelsen, R. I., Borken, W., Bragazza, L., Broder, T., De La Cruz, F. B., Diaconu, A.-C., Dise, N. B., Drollinger, S., Estop-Aragonés, C., Gałka, M., Martí Generó, M., Glatzel, S., Groß, J., Harris, L., Heffernan, L., Hodgkins, S. B., Hömberg-Grandjean, A., Hoppe, H., Knierzinger, W., Liu, H., Mathijssen, P. J. H., Mollmann, C., Schuster, W., Närtker, L., Olefeldt, D., Pancotto, V., Pelletier, N., Reuter, H., Robroek, B., Svensson, B., Talbot, J., Thompson, L. M., Worrall, F., Yu, Z.-G., and Knorr, K.-H.: Peatland Mid-Infrared Database 1.0.0, EarthArXiv [preprint], https://doi.org/10.31223/X51450, 2025b. a, b, c
Terhoeven-Urselmans, T., Bruns, C., Schmilewski, G., and Ludwig, B.: Quality Assessment of Growing Media with Near-Infrared Spectroscopy: Chemical Characteristics and Plant Assays, Eur. J. Hortic. Sci., 73, 28–36, 2008. a, b, c
Thornton, W.: XV. The Relation of Oxygen to the Heat of Combustion of Organic Compounds, The London, Edinburgh, and Dublin Philosophical Magazine and Journal of Science, 33, 196–203, https://doi.org/10.1080/14786440208635627, 1917. a
Treat, C. C., Jones, M. C., Brosius, L. S., Grosse, G., and Walter Anthony, K. M.: Radiocarbon dates of peatland initiation across the northern high latitudes, PANGAEA [data set], https://doi.org/10.1594/PANGAEA.864101, 2016. a, b
Turunen, J., Roulet, N. T., Moore, T. R., and Richard, P. J. H.: Nitrogen Deposition and Increased Carbon Accumulation in Ombrotrophic Peatlands in Eastern Canada: N Deposition and Peat Accumulation, Global Biogeochem. Cy., 18, https://doi.org/10.1029/2003GB002154, 2004. a
Vehtari, A., Gelman, A., and Gabry, J.: Practical Bayesian Model Evaluation Using Leave-One-out Cross-Validation and WAIC, Stat. Comput., 27, 1413–1432, https://doi.org/10.1007/s11222-016-9696-4, 2017. a
Vehtari, A., Gabry, J., Magnusson, M., Yao, Y., Bürkner, P.-C., Paananen, T., Gelman, A., Goodrich, B., and Piironen, J.: loo: Efficient Leave-One-out Cross-Validation and WAIC for Bayesian Models, Comprehensive R Archive Network (CRAN) [code], https://doi.org/10.32614/CRAN.package.loo, 2019. a
Vehtari, A., Gelman, A., Simpson, D., Carpenter, B., and Bürkner, P.-C.: Rank-Normalization, Folding, and Localization: An Improved for Assessing Convergence of MCMC (with Discussion), Bayesian Anal., 16, 667–718, https://doi.org/10.1214/20-BA1221, 2021. a, b
Viscarra Rossel, R. A., Jeon, Y. S., Odeh, I. O. A., and McBratney, A. B.: Using a Legacy Soil Sample to Develop a Mid-IR Spectral Library, Soil Res., 46, https://doi.org/10.1071/SR07099, 2008. a, b
Viscarra Rossel, R. A., Shen, Z., Ramirez Lopez, L., Behrens, T., Shi, Z., Wetterlind, J., Sudduth, K. A., Stenberg, B., Guerrero, C., Gholizadeh, A., Ben-Dor, E., St Luce, M., and Orellano, C.: An Imperative for Soil Spectroscopic Modelling Is to Think Global but Fit Local with Transfer Learning, Earth-Sci. Rev., 254, 104797, https://doi.org/10.1016/j.earscirev.2024.104797, 2024. a
Wadoux, A. M.-C., Malone, B., Minasny, B., Fajardo, M., and McBratney, A. B.: Soil Spectral Inference with R: Analysing Digital Soil Spectra Using the R Programming Environment, Progress in Soil Science, Springer International Publishing, Cham, ISBN 978-3-030-64896-1, https://doi.org/10.1007/978-3-030-64896-1, 2021. a, b, c, d, e
Wagman, D. D., Evans, W. H., Parker, V. B., Schumm, R. H., and Halow, I.: The NBS Tables of Chemical Thermodynamic Properties. Selected Values for Inorganic and C1 and C2 Organic Substances in SI Units, Tech. rep., National Bureau of Standards, Washington D.C., https://srd.nist.gov/JPCRD/jpcrdS2Vol11.pdf (last access: 14 November 2022), 1982. a
Wallace, W. E. and NIST Mass Spectrometry Data Center: Infrared Spectra, in: NIST Chemistry WebBook, NIST Standard Reference Database 69, National Institute of Standards and Technology, Gaithersburg MD, https://doi.org/10.18434/T4D303, 1997. a
Wang, G., Ju, Y., Yan, Z., and Li, Q.: Pore Structure Characteristics of Coal-Bearing Shale Using Fluid Invasion Methods: A Case Study in the Huainan–Huaibei Coalfield in China, Marine and Petroleum Geology, 62, 1–13, https://doi.org/10.1016/j.marpetgeo.2015.01.001, 2015a. a
Wang, M. and Moore, T. R.: Carbon, Nitrogen, Phosphorus, and Potassium Stoichiometry in an Ombrotrophic Peatland Reflects Plant Functional Type, Ecosystems, 17, 673–684, https://doi.org/10.1007/s10021-014-9752-x, 2014. a, b, c
Wang, M., Moore, T. R., Talbot, J., and Riley, J. L.: The Stoichiometry of Carbon and Nutrients in Peat Formation: C and Nutrients in Peat, Global Biogeochem. Cy., 29, 113–121, https://doi.org/10.1002/2014GB005000, 2015b. a
Waughman, G. J.: Chemical Aspects of the Ecology of Some South German Peatlands, J. Ecol., 68, 1025, https://doi.org/10.2307/2259473, 1980. a
Weiss, R., Shurpali, N. J., Sallantaus, T., Laiho, R., Laine, J., and Alm, J.: Simulation of Water Table Level and Peat Temperatures in Boreal Peatlands, Ecol. Model., 192, 441–456, https://doi.org/10.1016/j.ecolmodel.2005.07.016, 2006. a, b, c, d, e, f
Wieder, R. K.: Element Stoichiometry and Nutrient Limitation in Bog Plant and Lichen Species, Biogeochemistry, 160, 355–379, https://doi.org/10.1007/s10533-022-00968-y, 2022. a, b, c, d
Wieder, R. K., Vile, M. A., Albright, C. M., Scott, K. D., Vitt, D. H., Quinn, J. C., and Burke-Scoll, M.: Effects of Altered Atmospheric Nutrient Deposition from Alberta Oil Sands Development on Sphagnum Fuscum Growth and C, N and S Accumulation in Peat, Biogeochemistry, 129, 1–19, https://doi.org/10.1007/s10533-016-0216-6, 2016. a
Williams, T. G. and Flanagan, L. B.: Effect of Changes in Water Content on Photosynthesis, Transpiration and Discrimination against 13CO2 and C18O16O in Pleurozium and Sphagnum, Oecologia, 108, 38–46, https://doi.org/10.1007/BF00333212, 1996. a, b, c
Worrall, F.: Sulphur Constraints on the Carbon Cycle of a Blanket Bog Peatland, Durham University Research Data Repository [data set], https://doi.org/10.15128/R2PK02C9794, 2021. a
Worrall, F., Moody, C. S., Clay, G. D., Burt, T. P., Kettridge, N., and Rose, R.: Thermodynamic Control of the Carbon Budget of a Peatland, J. Geophys. Res.-Biogeo., 123, 1863–1878, https://doi.org/10.1029/2017JG003996, 2018. a
Xia, Z., Zheng, Y., Stelling, J. M., Loisel, J., Huang, Y., and Yu, Z.: Environmental Controls on the Carbon and Water (H and O) Isotopes in Peatland Sphagnum Mosses, Geochim. Cosmochim. Ac., 277, 265–284, https://doi.org/10.1016/j.gca.2020.03.034, 2020. a, b
Yu, Z., Campbell, I. D., Vitt, D. H., and Apps, M. J.: Modelling Long-Term Peatland Dynamics. I. Concepts, Review, and Proposed Design, Ecol. Model., 145, 197–210, https://doi.org/10.1016/S0304-3800(01)00391-X, 2001. a
Yu, Z. C.: Northern peatland carbon stocks and dynamics: a review, Biogeosciences, 9, 4071–4085, https://doi.org/10.5194/bg-9-4071-2012, 2012. a
Zaccone, C., Plaza, C., Ciavatta, C., Miano, T. M., and Shotyk, W.: Advances in the Determination of Humification Degree in Peat since Achard (1786): Applications in Geochemical and Paleoenvironmental Studies, Earth-Sci. Rev., 185, 163–178, https://doi.org/10.1016/j.earscirev.2018.05.017, 2018. a, b, c
Zhang, L., Carpenter, B., Gelman, A., and Vehtari, A.: Pathfinder: Parallel Quasi-Newton Variational Inference, J. Mach. Learn. Res., 23, 1–49, 2022. a
Zoltai, S. C., Siltanen, R. M., and Johnson, J. D.: A Wetland Data Base for the Western Boreal, Subarctic, and Arctic Regions of Canada, Tech. rep., https://ostrnrcan-dostrncan.canada.ca/handle/1845/236673 (last access: 22 October 2022), 2000. a, b