the Creative Commons Attribution 4.0 License.
the Creative Commons Attribution 4.0 License.
 | 17 Apr 2026
Proglacial wetlands: an overlooked CO2 sink within recently deglaciated landscapes
Sigrid van Grinsven
Noortje E. M. Janssen
Collin van Rooij
Ruben Peters
Arnaud Temme
Glacial retreat has uncovered vast landmasses in the European Alps over the last 150 years. Soil formation in these areas is likely slow due to low temperatures, lack of moisture, and short growing seasons. Previous studies have however focused solely on dry soils, omitting any water saturated locations. Our research shows that these water saturated locations are key locations of daytime CO2 uptake and have a significant role in carbon storage in the proglacial valley, despite their small surface area (<5 %). Loss-on-ignition analyses showed certain wetland soils contained up to 85 % carbon, suggesting these wetlands can become peatlands over time, storing large amounts of carbon. CO2 flux measurements showed atmospheric CO2 uptake in wetlands of all measured ages, even as young as 5 years after deglaciation. As little moss or plant cover was generally observed at locations < 50 years, the autotrophic microbial community likely plays an important role in these young systems. Non-saturated locations showed a much larger variation in daytime CO2 fluxes, with both emission and uptake of CO2 being observed across ages. Overall, our research shows that wetlands are hotspots of biological activity and pedogenic processes in proglacial areas and should therefore receive more attention in proglacial research.
- Article
(12794 KB) - Full-text XML
-
Supplement
(341 KB) - BibTeX
- EndNote


Proglacial valleys or glacial forefields form where glaciers have retreated. Since 1850, 60 % of glacier volume in the European Alps has been lost, and many small glaciers will disappear completely in the next decades (Cannone et al., 2008). Owing to prolonged glacial scouring, the newly revealed surfaces are typically composed of bedrock or glacial deposits, with no evidence of prior soil development. Over time, these surfaces are colonized by microbes, mosses and vascular plants and show soil development. Proglacial areas can be used for space-for-time studies, where the soil age is calculated from glacial retreat maps. The age information of these so-called chronosequences can be used to study natural processes over time without the need for experiments and incubations.
The buildup of organic carbon in proglacial soils is a net result of in- and outfluxes of particulate, dissolved and gaseous carbon compounds. Previous studies on soil carbon along proglacial chronosequences have focussed primarily on the particulate and dissolved contributions (e.g. Eckmeier et al., 2013; Egli et al., 2010; Smittenberg et al., 2012). Studies on gaseous carbon fluxes have predominantly focussed on aquatic systems inside proglacial valleys (e.g. Huang et al., 2025; St Pierre et al., 2019) and are geared towards research on methane rather than CO2.
Gaseous carbon fluxes consist predominantly of CO2 in these young soils, as methane and volatile carbon compounds are only produced in significant quantities in more developed soils. The one previous study on proglacial CO2 fluxes that we are aware of, reports CO2 effluxes from soil respiration (Guelland et al., 2013a). Soils can however also take up atmospheric CO2. The majority of CO2 uptake by soils is a biological process, performed by microbial and plant communities. These consume atmospheric CO2 either via photosynthetic or chemoautotrophic pathways and form cell biomass or other carbon compounds, which over time contribute to the formation of soil carbon.
What determines the CO2 uptake rates in proglacial soils is not well understood. Several factors may limit effective carbon metabolisms in both the microbial and plant communities, such as macro- and micronutrient limitations, temperature, light exposure, physical disturbances, and water availability. Often, several of these factors are lumped together in the soil age. What exactly contributes to the soil age being an explanatory factor, and whether this holds for different locations within a proglacial valley, is often not further explored, nor is the interaction with CO2 uptake rates. Recent work on proglacial areas and their carbon cycling has predominantly been focussed on Asian glacier regions (Khan et al., 2023; Li et al., 2022) or Arctic regions (Kleber et al., 2025; Tian et al., 2023), which however have a different climatic regime than the European Alps. We therefore aim to enhance the knowledge on European alpine proglacial regions. Furthermore, we sampled both water-saturated and non-saturated (dry) soils in proglacial areas. Up to now, proglacial wetlands have been ignored or purposely left out of any proglacial soil dataset, because water-influenced soils were considered too disturbed to be taken into a chronosequence approach. We however show that proglacial wetlands are hotspots of atmospheric CO2 uptake and carbon storage and that trends with age can be observed for both wetland and dry soil locations.
Given the well documented glacial retreat in the proglacial area of the Bachfallenferner (Fig. 1) (Raup et al., 2007), each location in this area can be given an age via linear interpolation between recorded glacial extents, making it particularly suitable for a space-for-time study approach like was used here. For clarity, we use the word “soil” for the surface material at each location, also for undeveloped deposits without signs of pedogenesis. “Dry” is used for each location that is not water-saturated, regardless of its water content. Younger soil locations are generally characterized by a lack of vascular plant and moss cover, whereas the older locations have a lush appearance with abundant grasses and other plants (Fig. B1). The first moss coverage is already observed in the first decade, although the percentage surface cover remains low (Fig. B2). Grasses and other plants appear from ca. 50 years onwards (Fig. B2). A similar pattern is observed in other proglacial areas (Bernasconi et al., 2011), although some regions show the development of a rich vascular plant cover much earlier (Burga, 1999; Li et al., 2022).
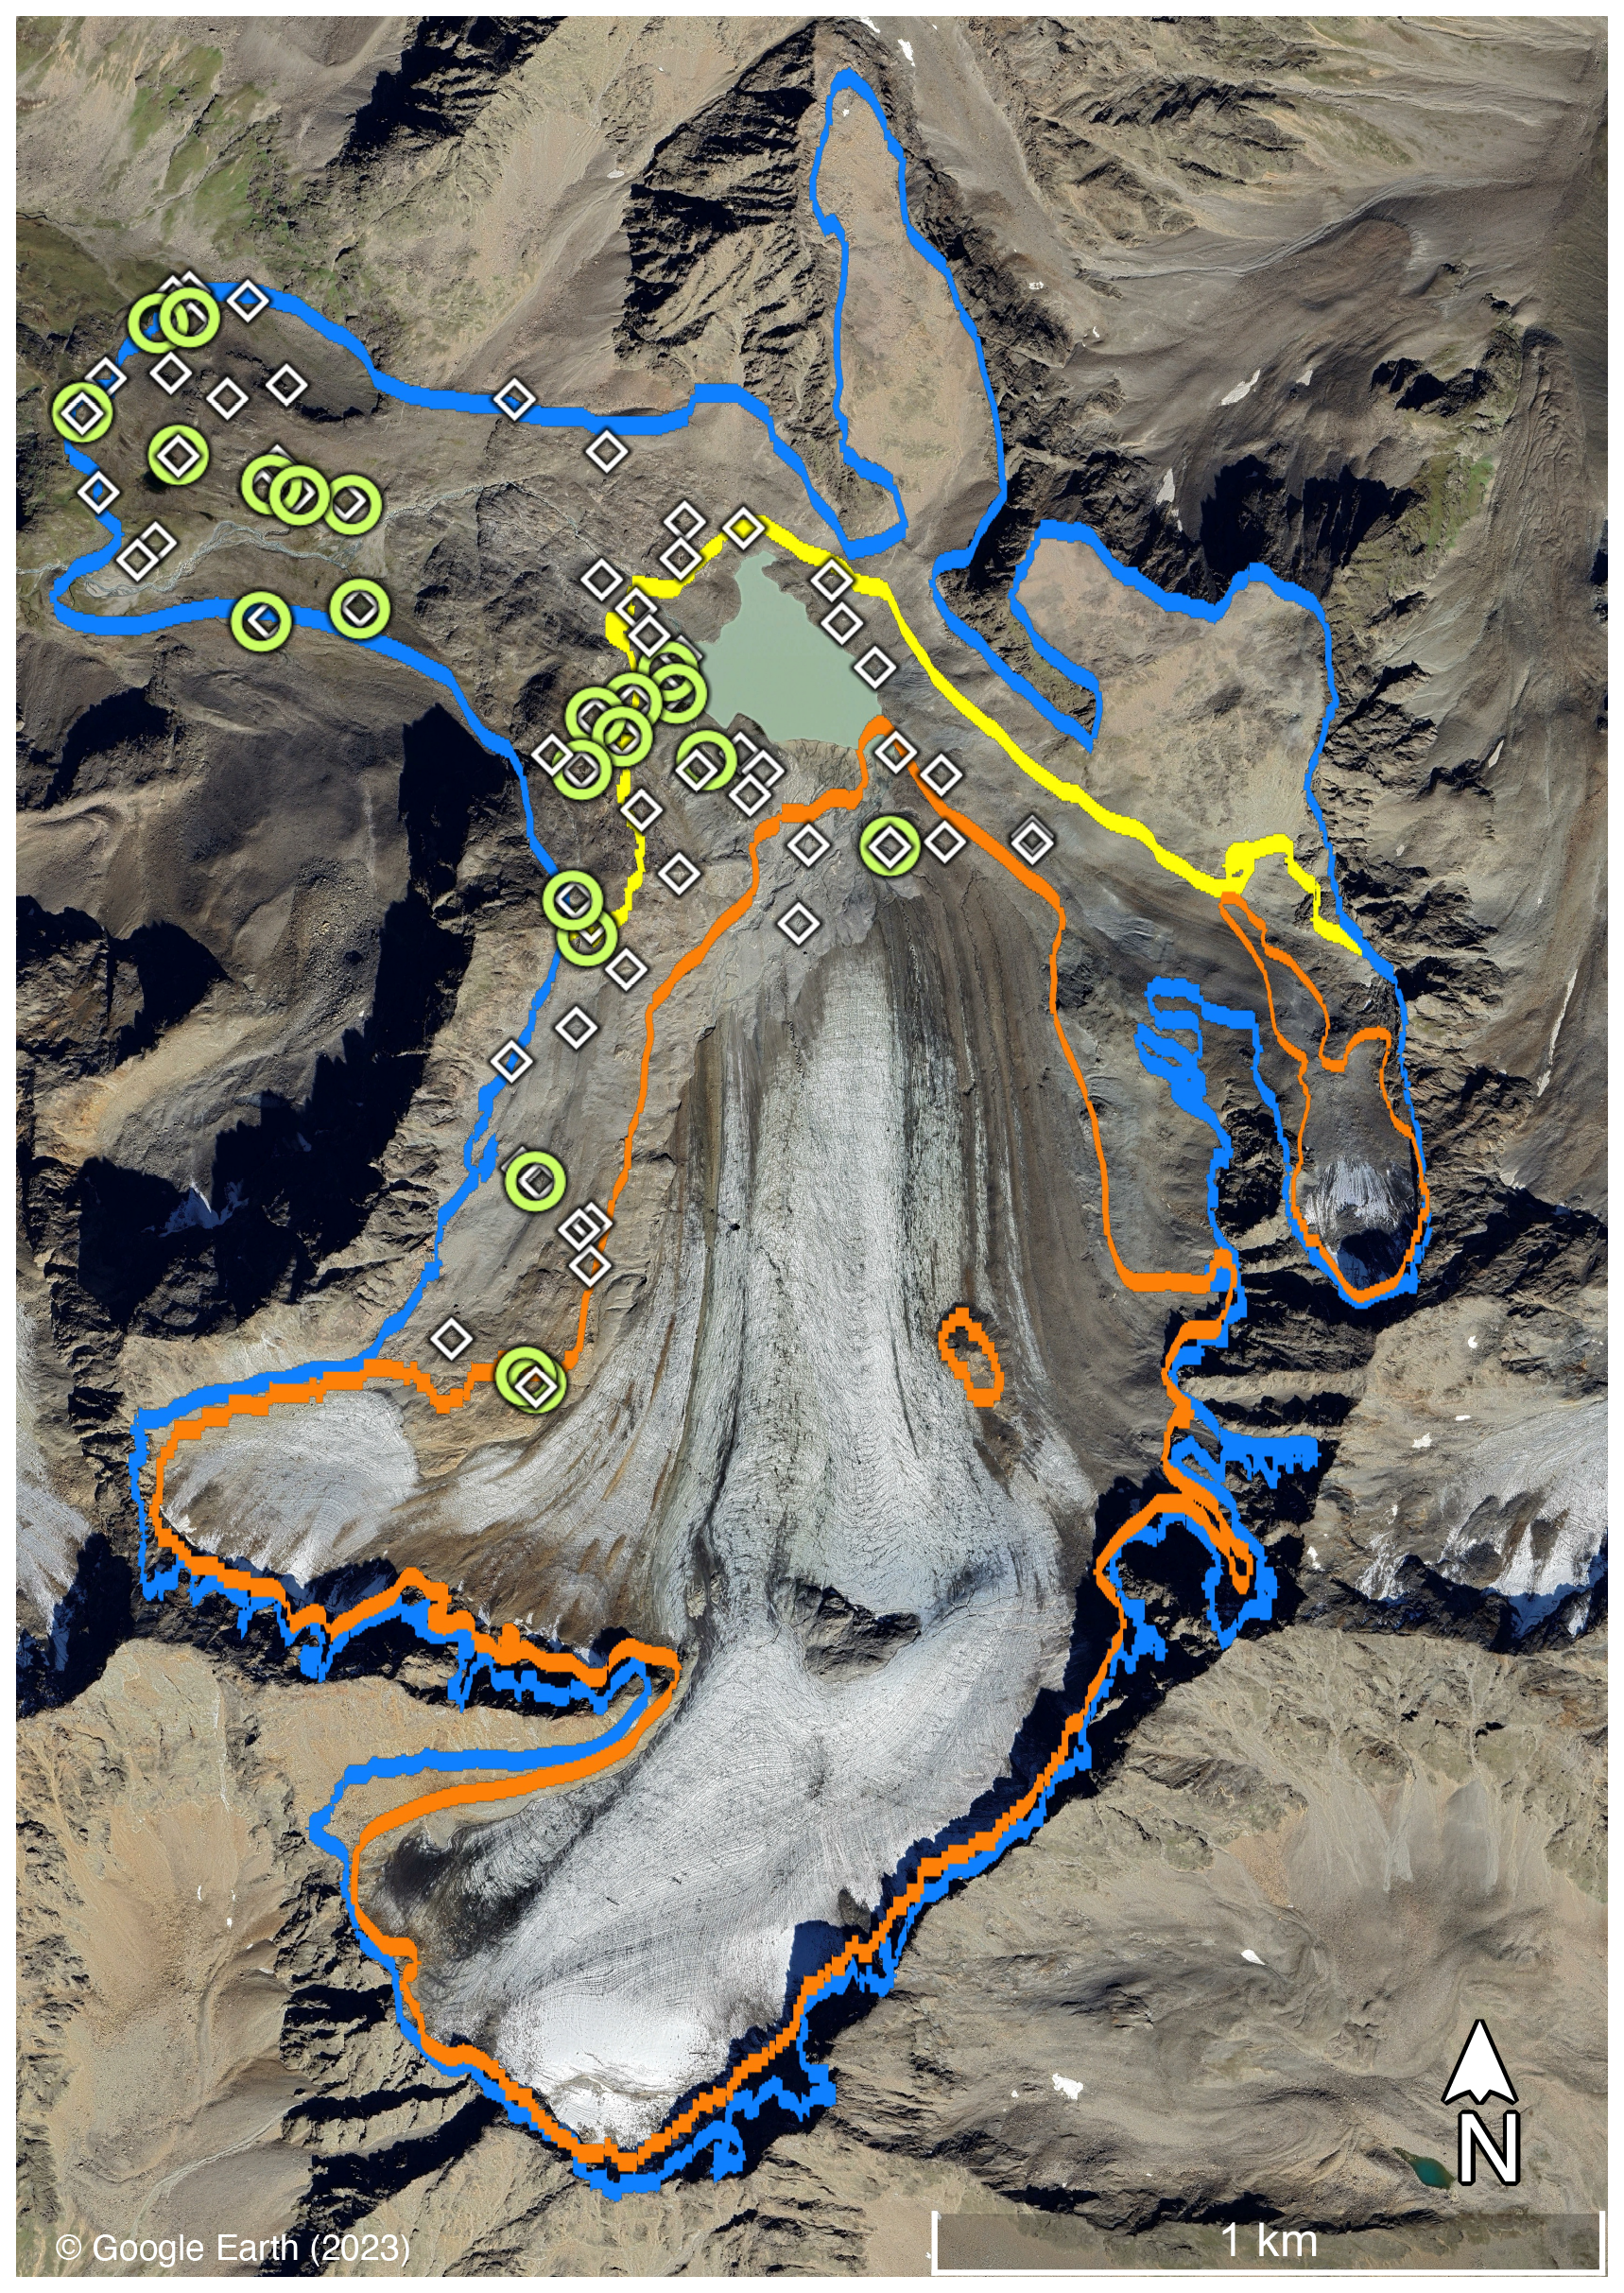
Figure 1Map of the proglacial area of the Bachfallenferner glacier, Austria. Glacial outlines of the years 1850 (blue), 1969 (yellow), and 2015 (orange) are shown. The yellow outline overlaps with the blue outline on the southern part of the glacier. More outlines are available (Global Land Ice Measurements from Space (GLIMS) dataset; GLIMS Consortium, 2005) but not included in the figure. Soil and wetland sampling locations are indicated with white diamonds and green circles, respectively. Geographic coordinates at the centre of the image are 47.0737° N, 11.0769° E. Background imagery from Google Earth ©, imagery date 8 September 2023.
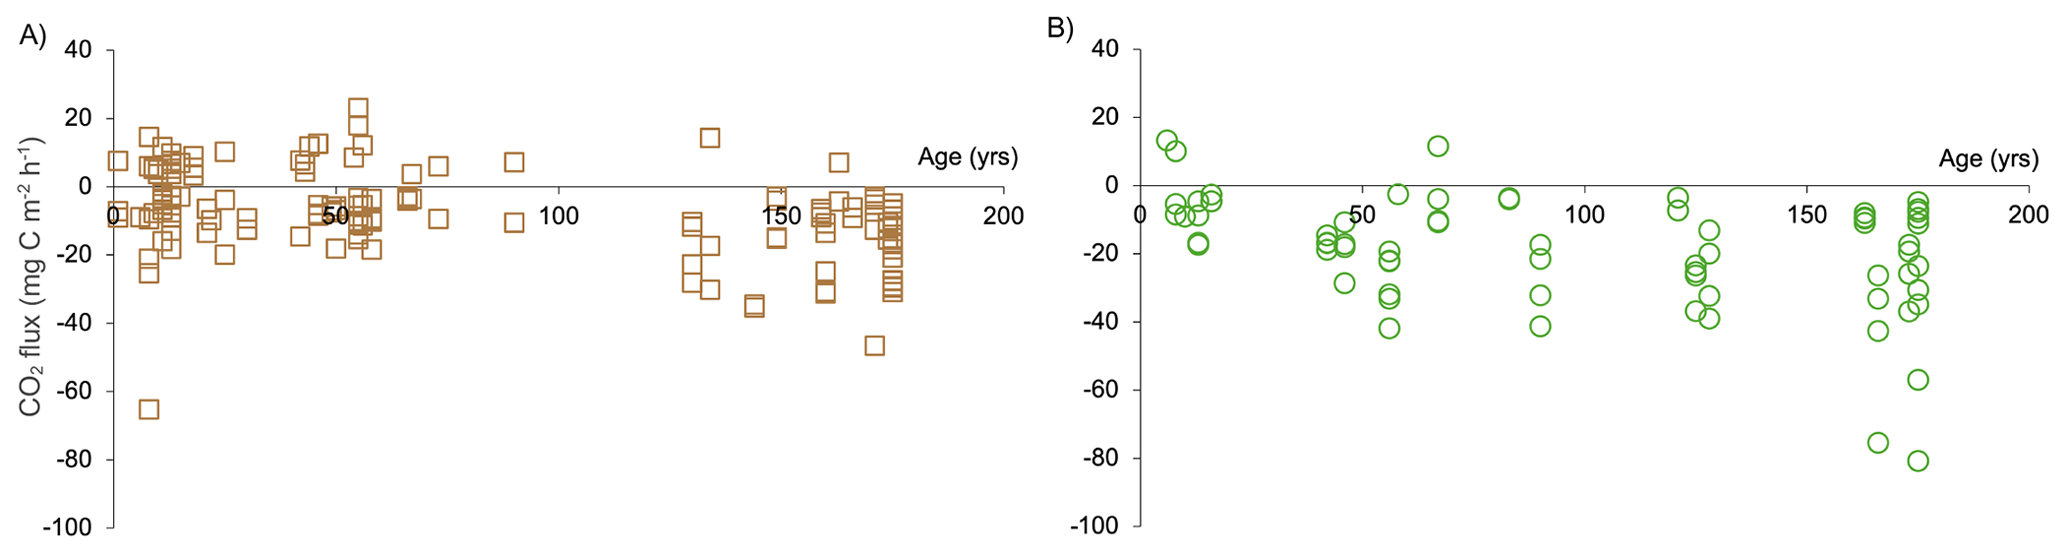
Figure 2Daytime CO2 fluxes of the proglacial soils (a) and wetlands (b), plotted against age. Positive (>0) fluxes indicate emissions to the atmosphere, negative (<0) fluxes indicate atmospheric CO2 uptake. Fluxes were upscaled to per hour values, for details see Appendices (Material and methods).
In this study, we sampled and measured in both dry and water-saturated (wetland) locations. Previous work on carbon and/or CO2 cycling in proglacial areas has been focussed on either streams and lakes (e.g. Huang et al., 2025; St Pierre et al., 2019; Yan et al., 2023) or on dry soils (e.g. Bernasconi et al., 2011; Egli et al., 2010). Generally, the presence or absence of wetlands in the proglacial valley is not mentioned, although Bernasconi et al. (2011) very briefly mention they observed groundwater seepage in sampling locations that have a higher clay content than the average. Given the high input of glacial meltwater, snowmelt, and precipitation, proglacial areas are very likely to contain and sustain wetlands, both near streams and in small, local depressions or groundwater seepage locations. Further research, preferably using remote sensing, is required to quantify the surface area of wetlands in proglacial areas and to upscale our findings. Our first estimate of the wetland surface area in the Bachfallenferner area is 2 %–5 % of the total proglacial area (including lakes and bedrock), but whether this is similar for other proglacial areas, has thus far not been investigated.
Microbial and/or plant communities can use atmospheric CO2 either via photosynthetic or chemoautotrophic pathways. We report CO2 uptake in most of the measured locations (Fig. 2). All our measurements, in both wet and dry soils, were done during daytime. In wetland locations, the net CO2 flux was negative (indicating uptake) in 95 % of the measurements. In the dry locations, 18 % of the fluxes were positive, mostly in soils up to 100 years old. In many soil locations in the proglacial area of the Bachfallenferner, the plant community is limited (<50 % plant surface in 60 % of the dry soil locations, and in 38 % of the wetland locations, Fig. B2). It is therefore likely that the soil microbial community plays a key role in the CO2 uptake. Earlier studies on the microbial community in proglacial environments showed that chemolithoautotrophy (non-light dependent CO2 uptake) was an important trait in the presented microbial communities (Tian et al., 2023). Research in very young deglaciated soils revealed that carbon fixating microbial genes could be found in soils directly after deglaciation (0 years old), with an increase in copy numbers within the first decade (Khan et al., 2023). However, other studies also showed that genes for heterotrophy (carbon cycling) were present in very young soils (Esperschütz et al., 2011), indicating that both carbon uptake and degradation can occur rapidly after glacial retreat. Soil moisture was one of the explanatory variables of the microbial community composition along the chronosequence investigated by Khan et al. (2023).
The positive net daytime CO2 fluxes (indicating CO2 emissions) that we observed predominantly in young dry soils are expected to be the result of microbial decomposition of soil carbon. Guelland et al. (2013a) found net CO2 emissions for each of their sampled locations within the Damma glacier proglacial area, despite the presence of plants only in their older sites. Soil respiration in young sites (<50 years) mainly had pre-aged, burned, allochthonous carbon as C-source, whereas the CO2 from older soils was the result of degradation of in situ produced carbon. The presence of old or allochthonous carbon would explain the CO2 emissions we also find in our youngest sites. Other's incubation studies with added plant litter showed decomposition occurred in soils of 10 years old, to the same extent as in 70- and 120-years old soils, thus indicating that a microbial community capable of the mineralisation of organic carbon is present within 10 years (Guelland et al., 2013b). We measure net CO2 uptake in older and in wet locations. CO2 production likely does occur in those locations but is masked by simultaneous CO2 uptake. To detangle the two, light/dark chamber studies and/or isotope measurements are required. Potentially, soil carbon can form complexes with weathered minerals in older soils, protecting it from degradation and lowering emission rates (Guelland et al., 2013a, b).
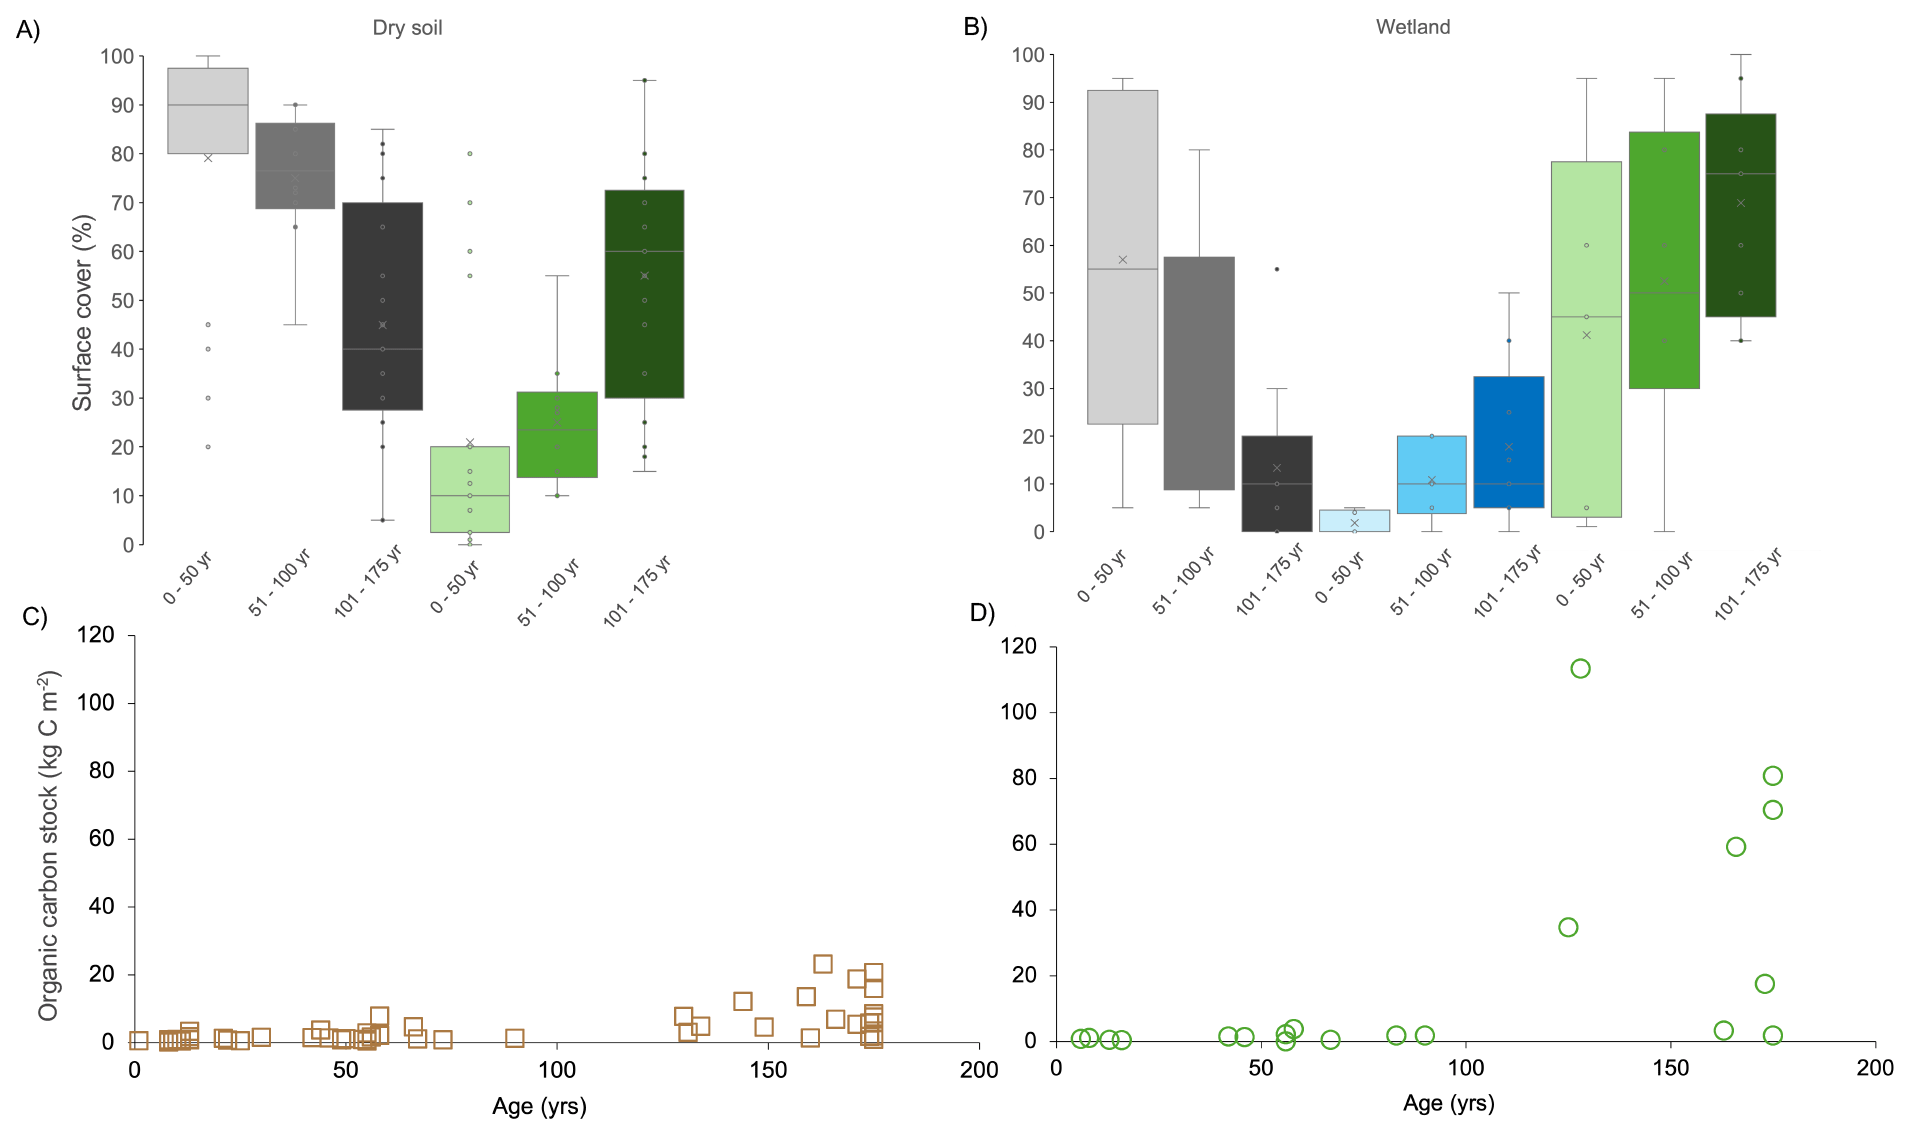
Figure 3Surface cover (in %) and organic carbon stocks (in kg C m−2) of the dry soils and wetlands. (a) and (b) show the surface cover grouped per age interval, with grey tones representing the surface cover of rock, stone and fine earth, green tones representing mosses and plants, and blue representing surface water (not present at dry soil). (c) and (d) show the organic carbon stocks, which were calculated as the cumulative stock of all soil horizons that were present, and are plotted against age.
Similarly to our results (Figs. 2 and 3), Egli et al. (2010) found a correlation (R2=0.51, p<0.05) of soil organic carbon content with age, with an apparent knickpoint around 50 years. However, their limited number of sampled locations younger than 50 years makes it difficult to accurately assess trends in the youngest soils. Temme et al. (2016) did not find a significant relationship between soil age and organic carbon content, but did observe the same divergence between soils > 50 and <50 years old, with the <50 years old soils containing no detectable organic carbon. We hypothesize that the difference between these two age groups is related to the contribution of vascular plants to the soil carbon stock. Our CO2 flux results show that carbon is taken up in part of our soils of <50 years, presumably by the microbial community. The uptake rate however increases when the plant surface cover increases (Figs. 2 and B2). Bernasconi et al. (2011) show that the microbial carbon content of their proglacial soils increased with age in the top 5 cm, showing that microbes do still contribute to soil organic matter in later stages, in addition to plant carbon inputs. Li et al. (2022) observed a linear increase in soil organic carbon content with age (0.13 %–1.3 % over a 90 years sequence), as well as a decrease in pH with age. We also observed a linear relationship between age and OC content (R2=0.40 for dry soil, R2=0.35 for wetland, Fig. 3) and age and pH (R2=0.41, p<0.001, Fig. B3). Interestingly, the soils measured in that study had a soil moisture content of 68 %–85 %, except for the youngest soil (40 %). Although not saturated, these soils are likely closer to our wetland sites than the dry soil locations within the Bachfallenferner proglacial area. The combined work of Smittenberg et al. (2012) and Guelland et al. (2013a) showed increasing carbon stocks with age in the Damma proglacial area, along with increased CO2 emissions, but no significant correlation between the two. They showed the presence of plants seemed to increase soil CO2 emissions due to enhanced root inputs, although the relationship seemed complex and dependent on several factors.
Besides the effect of age, we also see a clear distinction between wetland and dry locations. Wetland locations have significantly higher CO2 uptake rates (Fig. 2) than dry soils of the same age (p<0.001). They also become CO2 sinks much earlier: the majority of the wetlands is an atmospheric CO2 sink directly after glacial retreat, whereas the dry soils are often CO2 sources in the first 100 years (Fig. 2). In the oldest locations (170–175 years old), the CO2 uptake rates of the wetlands is on average 2.2 mM h−1, whereas it was 1.4 mM h−1 in dry soils. The carbon stock is very high in certain wetlands, but low in others (Fig. 3). Possibly, the time of carbon buildup in the wetland locations does not always correspond to the deglaciation age. Deposition or erosion of fine material in these wet sites may have “reset” the clock on soil carbon stock buildup. Several of the older wetland locations have up to 70–80 mass % carbon in the topsoil (data file publicly available), indicating that the wetlands could turn into peatlands over time. Plant communities appear earlier in wetlands than in dry soils and also cover a higher surface % (Figs. 3 and B2). However, also before vascular plant and moss communities are established, wetlands have a higher CO2 uptake rate. This supports the hypothesis that the microbial community is more abundant and/or active in proglacial wetlands compared to non-saturated soils. A higher water content can benefit the microbial community by an increased water and nutrient availability, due to enhanced (diffusive) transport. A study on litter decomposition in proglacial soils showed a positive correlation between microbial mineralisation of litter and the soil moisture content (Guelland et al., 2013b), suggesting a higher water content indeed promotes microbial activity, most likely not just the community responsible for remineralization, but also for CO2 uptake. In addition, our results show a correlation between the water and carbon content of the soils (R2=0.65, Fig. B4), not only for wetland but also for locations classified as dry soils. As no other studies on proglacial wetlands exist, we cannot compare this with previous findings. A study on wet locations just outside the terminal moraine of a proglacial area in New Zealand (Fewster et al., 2025) shows peat formation in saturated soils. Potentially, the wetlands we observe will turn into peatlands over time. The correlation we observe between water content and carbon stock is likely a result of enhanced plant and microbial activity (and therefore carbon uptake and storage fluxes) in wetter soils, but it should be noted that a higher carbon content also increases the water holding capacity of the soils, and the correlation is therefore likely explained by both biological and physical reasons.
Previous research on CO2 emissions from proglacial areas has strongly focussed on streams and lakes, which can emit CO2 that is either locally produced or CO2 that is transported along with (melt)water. Glacial runoff is known to transport methane (Du et al., 2022; Kleber et al., 2025), but an earlier study that measured the CO2 flux from glacial runoff water did not show consistent fluxes, as values fluctuated between uptake and emission of CO2 in the range of −20 to +20 mmol m−3 d−3 (Du et al., 2022). As we measure consistent uptake (95 % of wetland chambers showed a negative CO2 flux) of CO2 from our wetlands, we expect allochthonous aquatic CO2 inputs, which would lead to positive CO2 fluxes, to be limited.
Although trends in the CO2 flux and carbon storage with age,wetness and vegetation cover can clearly be observed, not all variation can be explained by these factors. We attempted to further explain the observed CO2 fluxes and carbon stocks with other environmental factors such as slope and the topographic wetness index. However, none of these increased the predicting value of our simple model (R2<0.4). A surprising apparent decoupling between carbon fluxes and soil characteristics was also observed by Guelland et al. (2013a), who attributed this to the high heterogeneity in proglacial areas. More research on proglacial systems would allow for better correlative studies and modelling on larger, combined datasets. The data of this study have been deposited in a public repository (see Methods) to encourage such future analyses.
Overall, our data indicate that proglacial wetland areas play an important role in CO2 uptake and carbon storage. Wetlands take up atmospheric carbon as early as 5 years after glacial retreat and can locally store more carbon than dry soils in their vicinity. Although wetlands occupy only a small proportion of the proglacial landscape, they appear to be disproportionately important for carbon sequestration. Despite this, they have been completely overlooked in previous proglacial research. The factors controlling soil carbon storage and CO2 fluxes in proglacial environments remain poorly understood, and no rate measurements during the night, or outside of the growing season, are available. Our limited dataset underscores the need for more comprehensive investigations in proglacial systems, which are rapidly expanding due to ongoing glacier retreat, and the need for a larger research focus on alpine wetland areas.
A1 Site description and selection of sampling locations
The Bachfallenferner proglacial area is located in Tyrol, Austria and is part of the Stubai Alps mountain range. Geologically, it is part of the Ötztal-Stubai Massif and characterized by metamorphic rock (paragneiss and mica schists) (Krainer, 2010). The proglacial area covers an altitude from 2920 m (next to the current glacier) to 2440 m. The current glacier is ca. 1.9 km long, has a ca. 1.45 km2 surface area, and reaches to a maximum altitude of 3100 m (status 2023). No climate station is available at the Bachfallenferner glacier, but the nearby (23 km distance) Pitztaler glacier has a permanent climate station at 2864 m a.s.l. The average daytime temperature at this station over the period 2020–2025 was −0.6 °C, with an average daytime temperature of 8.6 °C in the summer months (July, August). A consistent snow cover is generally observed from September/October to June (Geosphere Austria; Anon, 2026).
Sampling locations targeting dry soil were selected prior to the field campaign using conditioned Latin Hypercube sampling (Minasny and McBratney, 2006). We used this method to select sampling locations spatially randomly while also ensuring that the distribution of selected ancillary variables matches their distribution of the entire proglacial area. We used slope steepness (calculated using slope in ArcGIS 10.3) and the Topographic Wetness Index as ancillary variables.
Our sampling setup included both sloping and flat parts of the proglacial area, but excluded sites located directly within riverbeds or lakes, or those too steep to access safely. These assessments were made in the field. In the field, a second set of dry soil locations was added based on wetland locations. Each wetland location was accompanied by a soil location in close vicinity (5–10 m) to the wetland sampling location.
Wetland sampling locations were selected based on Google Earth imagery of 23 September 2021. We manually searched for locations that appeared to be wetlands. In the field, we visited each of these locations to confirm that these were indeed wetlands. If so, they were added to the sampling locations list. There were no exclusion criteria for wetlands, as we wanted to sample the entire range of different wetland characteristics. Wetlands were defined as water saturated locations with no more than 3 cm deep surface water and a surface water coverage of <50 %. If the water was deeper or occupied more surface area per m2, we classified the locations as ponds and therefore excluded them. Most locations did not have surface water coverage (see Fig. 3b). A rough estimation, based on manual polygon drawing in Google Earth (satellite imagery from June 2025), gave a surface area of ca. 15 000 m2 for wetlands, versus 1 013 000 m2 for the entire proglacial area (including lakes and bedrock covered areas, excluding the glacier), resulting in a rough estimate of 1.5 % wetland surface. As this is likely an underestimation, as not all wetlands can be recognized on satellite imagery, we settled on an estimate of 1 %–5 %.
A2 Determination of glacial retreat year and age
The year that the glacier retreated from each location in the current proglacial area was determined by linear interpolation between the glacial extents available from the GLIMS dataset, similarly to the method described in Temme and Lange (2014), complemented with the manually digitized extent in the year of measurement (2023). When the glacier readvanced, and then retreated again, we took the most recent retreat year, with entails the assumption that soil formation was completely reset by the temporary glacial scouring and transport.
A3 Soil sampling, site observations, and flux measurements
All described sampling locations were visited between 6 and 10 August 2023, between 10:00 and 17:00 LT. Soil sampling and flux measurements of a single location were done within 3 m distance of each other. Site and weather observations were noted for each location following a standardized protocol. Vegetation and surface cover descriptions were based on visual assessments. Pictures were taken of each deployment location for later verification where necessary.
Flux measurements were taken using a static chamber approach, similar as described by Bastviken et al. (2015), using CO2 mini loggers (SenseAir, Sweden). The sensors were activated in the morning, left running throughout the day, and shut down and read out in the evenings. They were set to record CO2 concentration (ppm), moisture (%) and temperature (°C) every 30 s. The sensors were not field calibrated, as only the linear decrease or increase was used in later analyses. The static chambers itself consisted of see-through plastic boxes with a volume of 22 L ( cm, Ikea Samla). Chambers were not covered to allow light penetration for photosynthesis and phototrophy. Pottery clay was used as a seal between the chamber and the soil, except for locations with surface water, where the chambers were placed directly on the wetland surface. Chambers were anchored down by placing rocks on top of the chambers to weigh them down. At each location, two chambers were deployed within 1–2 m distance and left for 10–20 min to measure, after which they were aired out and the measurements were repeated.
Soil sampling and horizon description were done with the use of a standardized questionnaire containing a subset of categories from the FAO guidelines for soil description. Soil samples of each soil horizon were taken with a soil knife and sampled into plastic zip bags, which were stored in the dark at ±10 °C until transport to the laboratory. If present, above ground biomass and larger rocks (>3 cm) were removed from the samples before they were placed in the sample bags. Roots, if present, were not removed. Wetlands were measured, sampled and described in an identical way to non-wetland locations.
A4 Determination CO2 flux from concentration data
CO2 fluxes were calculated from the CO2 concentrations measured over the 10–20 min chamber deployments. To prevent human bias in selecting datapoints for flux calculations, we created an R script that automatically determined the best fit linear regression, based on a minimum of 10 datapoints, representing 5 min (one measurement every 30 s). Flux measurements for which the highest linear regression had an R2<0.7, were excluded from the resulting flux table. All linear regression plots were manually checked to exclude obvious errors in the measurements. Note: when neither emission nor uptake occurs, the flux value is very close to zero. However, such low flux values rarely show up in the dataset since their nearly horizontal regression lines often had R2<0.7. After checks, 222 of 288 flux measurements (i.e. 77 %) were accepted. Their average R2 value was 0.90.
The resulting fluxes, in units of ppm CO2 h−1, were converted into mg C m−2 h−1, using an assumed value for air pressure inside the box (calculated using the elevation and the average temperature inside the chamber over the measurement interval), the box volume and ground surface area, as well as the molar mass of carbon. The location where the maximum 4 accepted flux measurements were done accounted for 70 % of the total variation between all flux measurements, and location is thus a significant predictor for the value of the flux (p<0.001).
A5 Carbon stock, pH and wetness analyses
All collected soil samples were processed within 2 weeks after collection. Field samples were weighed and then dried for 24 h at 105 °C, after which they were weighed again, to determine the gravimetric water content. The soil pH was measured on a mixture of 5 g of the dried fine earth fraction with 45 mL demineralized water. For determination of the soil organic matter content, dried soil was weighed, ashed at 550 °C for 4 h, and then weighed again. No root picking was done.
The carbon stock per location was calculated using the reported horizon depths and the carbon content per horizon, plus assumptions on the bulk density that are specified below. The horizon depth for the C-horizon was taken as 10 cm for each location. This is an underestimation at certain locations and may be an overestimation at some others. As we do not have accurate maximum depths, we however use this 10 cm to ensure that the C horizon has an equal contribution to the carbon stock of each location. An exception are the locations where no sample from the C horizon is collected, and only the shallower horizons were considered for the calculation of the organic carbon stock. These locations are marked in Table S2 as having less than 10 cm horizon depth.
To calculate the carbon stock per m2, we further used the approach of Poeplau et al. (2017) which accounts for the rock fraction as we reported for each of the field samples. The measured organic matter contents of the fine earth fraction were first multiplied with the stoichiometric fraction (0.58) to get to the organic carbon content. Then, they were multiplied with the fine earth fraction, assuming a soil bulk density of 1500 kg m−3 for the fine earth material, following known bulk densities of proglacial soils (Bockheim and Munroe, 2014; Mavris et al., 2010). It was necessary to make an assumption for bulk density because the loose but rocky material precluded sampling using rings of known volume. Soil density was not corrected for organic matter content as earlier studies in proglacial areas showed no significant relationship between soil density and organic matter content (Mavris et al., 2010).
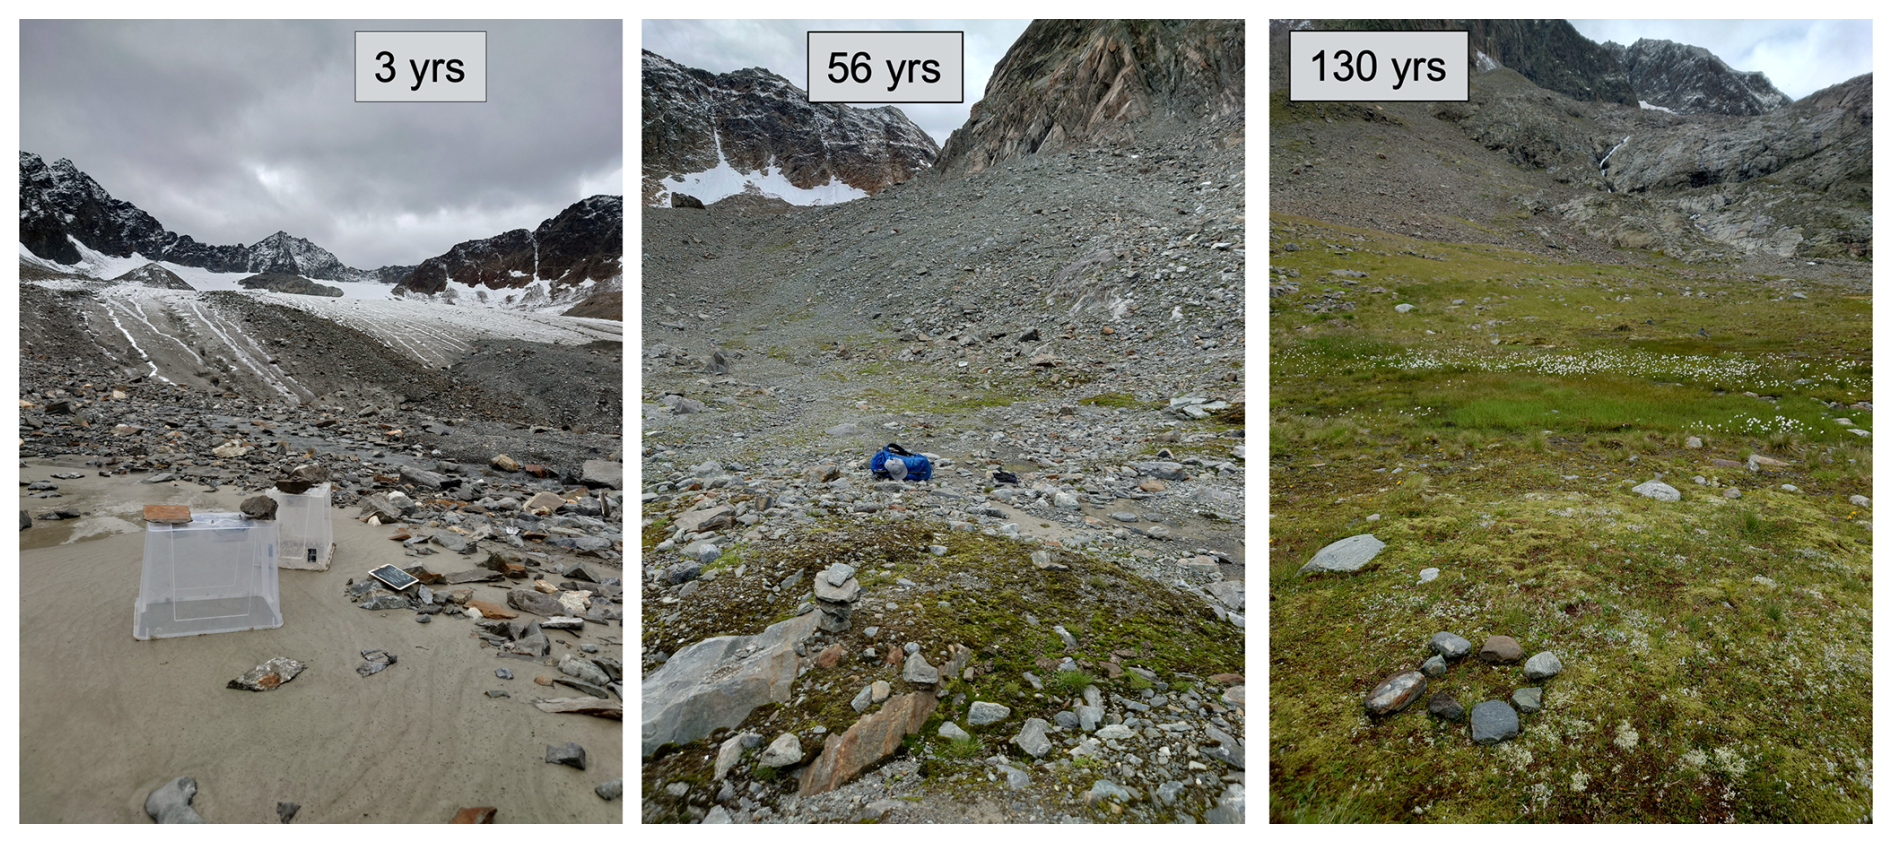
Figure B1Wetland locations (in the foreground of the photos) and dry soil (seen in the center (3 and 56 years) or background (130 years) of the photos) with time since glacial retreat (age) in the Bachfallenferner proglacial area. The right photo (130 years) also shows a small pond, with grass, in the centre of the photo.
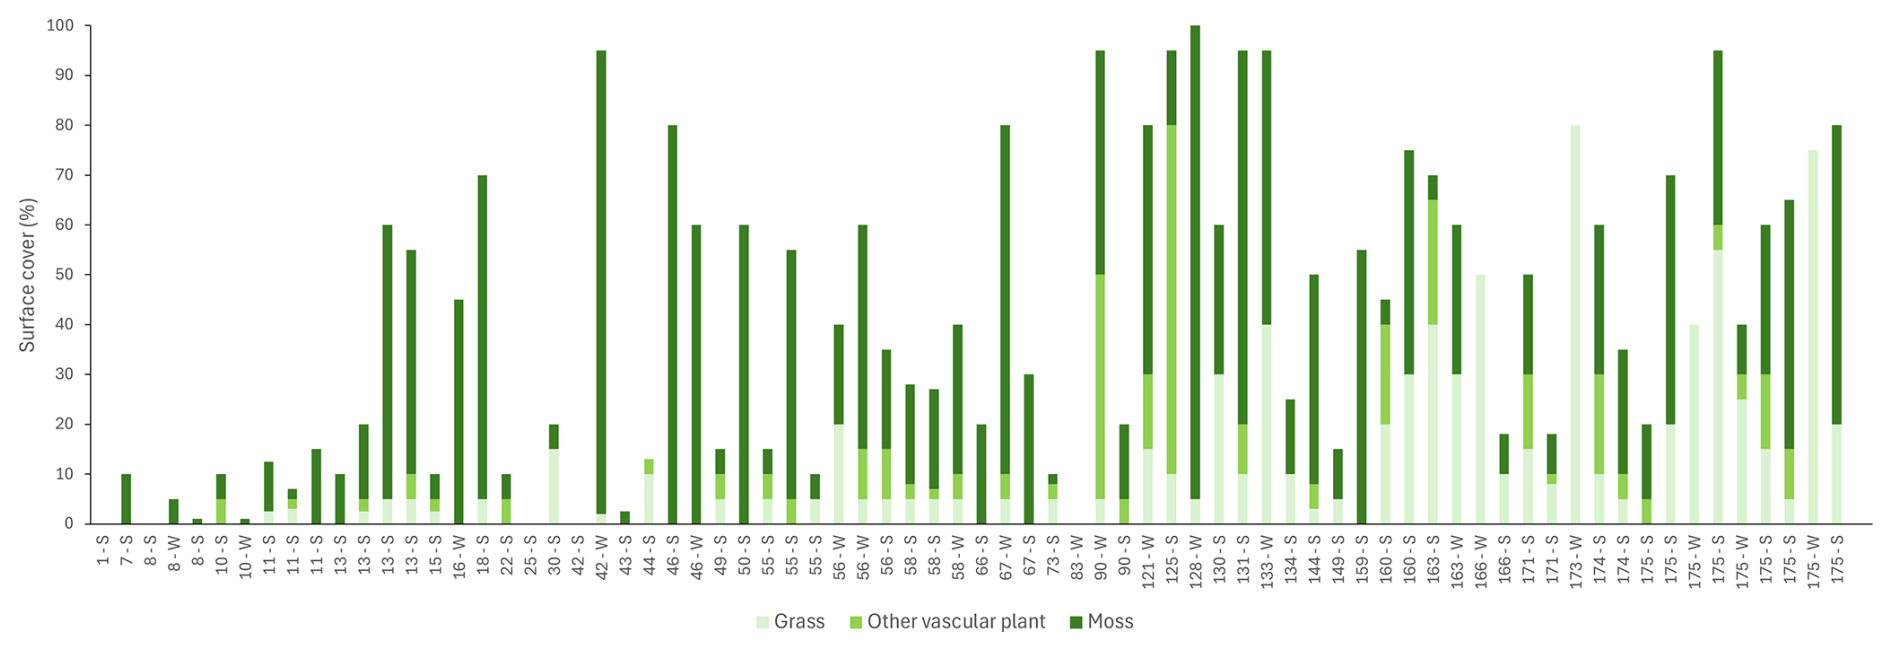
Figure B2Surface cover (in %) of grass, other vascular plants, and moss as observed at each location. The label on the x axis indicates the age in years and the type of location (S: soil, W: wetland).
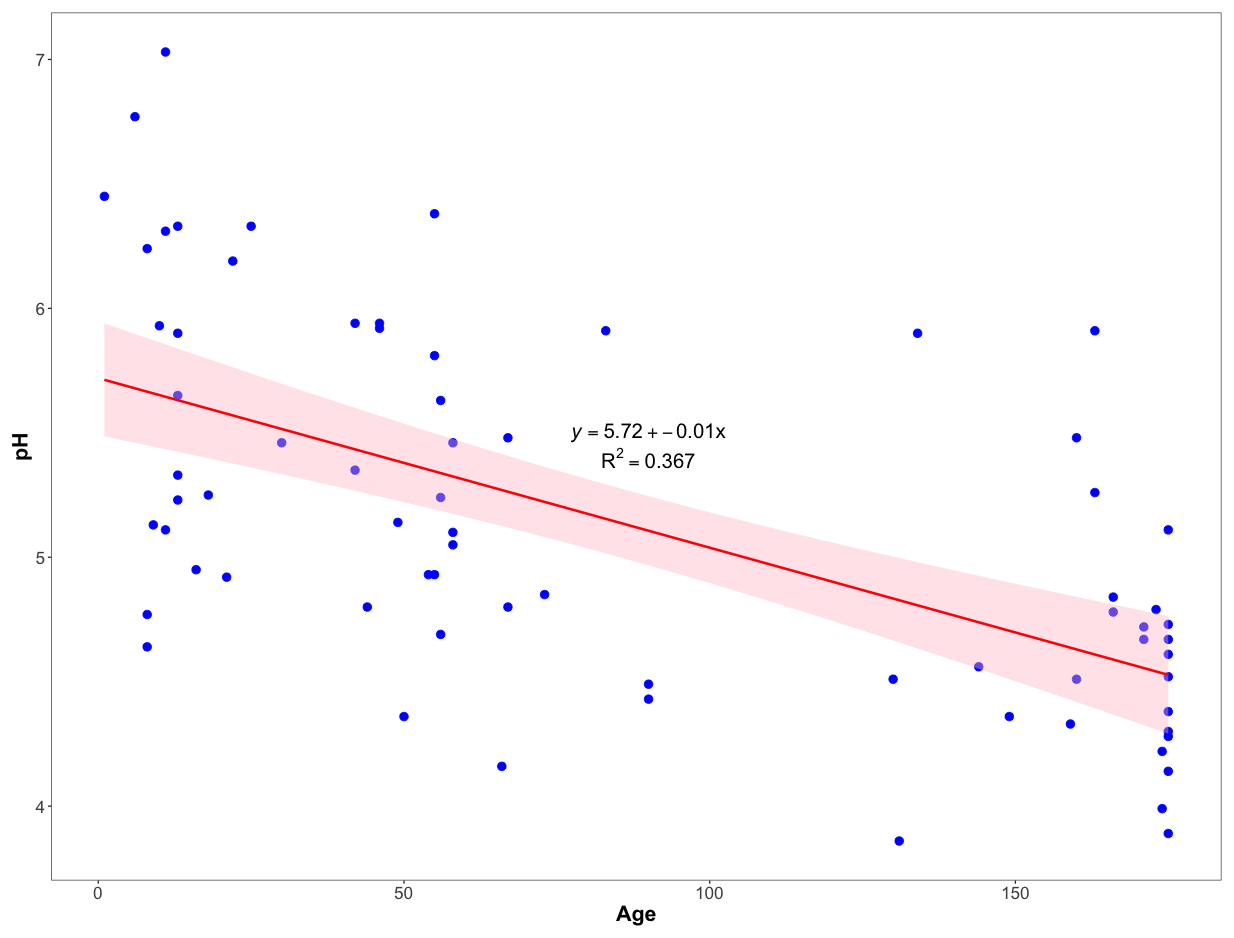
Figure B3Correlation between age and pH for the topsoil of all locations (wetland and soil) in the Bachfallenferner proglacial area. The shaded area represents the 95 % confidence interval.
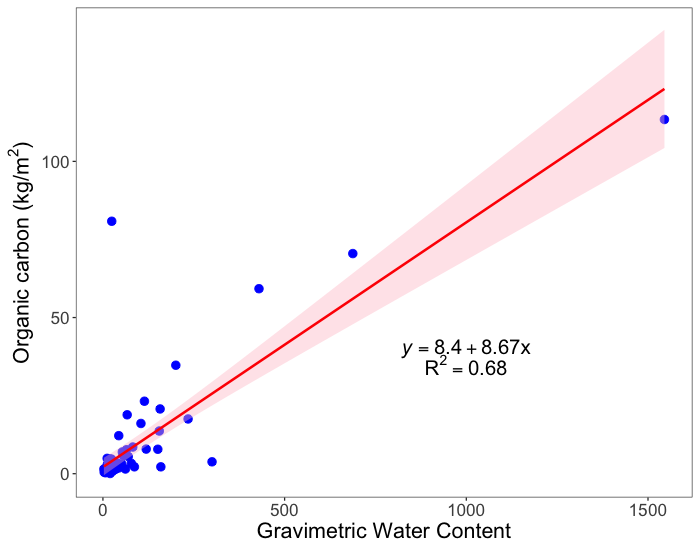
Figure B4Correlation between the gravimetric water content and organic carbon stock for the topsoil of all locations. The shaded area represents the 95 % confidence interval.
All data generated and used for this study is openly available in the Zenodo repository under https://doi.org/10.5281/zenodo.18662442 (van Grinsven, 2026).
The supplement related to this article is available online at https://doi.org/10.5194/soil-12-441-2026-supplement.
SvG and AT designed the sampling campaign and setups, with the help of NJ and CvR. AT and NJ created the CO2 loggers and chambers. Fieldwork was performed by CvR, RP, and NJ, with the help of AT and SvG. Scripts for data analysis were created by NJ and RP with help from AT. Glacial extent modelling was done by RP and CvR. Laboratory work was done by CvR and RP. Data analysis was done by SvG. The manuscript was written by SvG with revisions by AT, NJ, CvR and RP.
The contact author has declared that none of the authors has any competing interests.
Publisher's note: Copernicus Publications remains neutral with regard to jurisdictional claims made in the text, published maps, institutional affiliations, or any other geographical representation in this paper. The authors bear the ultimate responsibility for providing appropriate place names. Views expressed in the text are those of the authors and do not necessarily reflect the views of the publisher.
We would like to thank the personal of the Winnebachseehütte, especially Michi Riml for their help, flexibility and kindness. We thank the Wageningen Soil lab for the use of their facilities. We thank BayFOR for providing initial funding to enhance international collaborations, which have contributed to the realization of this research.
This paper was edited by Ember Morrissey and Jeanette Whitaker and reviewed by Peter Finke and one anonymous referee.
Anon: Geosphere Austria, https://doi.org/10.60669/923n-p390, 2026.
Bastviken, D., Sundgren, I., Natchimuthu, S., Reyier, H., and Gälfalk, M.: Technical Note: Cost-efficient approaches to measure carbon dioxide (CO2) fluxes and concentrations in terrestrial and aquatic environments using mini loggers, Biogeosciences, 12, 3849–3859, https://doi.org/10.5194/bg-12-3849-2015, 2015.
Bernasconi, S. M., Bauder, A., Bourdon, B., Brunner, I., Bünemann, E., Chris, I., Derungs, N., Edwards, P., Farinotti, D., Frey, B., Frossard, E., Furrer, G., Gierga, M., Göransson, H., Gülland, K., Hagedorn, F., Hajdas, I., Hindshaw, R., Ivy-Ochs, S., Jansa, J., Jonas, T., Kiczka, M., Kretzschmar, R., Lemarchand, E., Luster, J., Magnusson, J., Mitchell, E. A. D., Venterink, H. O., Plötze, M., Reynolds, B., Smittenberg, R. H., Stähli, M., Tamburini, F., Tipper, E. T., Wacker, L., Welc, M., Wiederhold, J. G., Zeyer, J., Zimmermann, S., and Zumsteg, A.: Chemical and Biological Gradients along the Damma Glacier Soil Chronosequence, Switzerland, Vadose Zone J., 10, 867–883, https://doi.org/10.2136/vzj2010.0129, 2011.
Bockheim, J. G. and Munroe, J. S.: Organic carbon pools and genesis of alpine soils with permafrost: A review, Arct. Antarct. Alp. Res., 46, 987–1006, https://doi.org/10.1657/1938-4246-46.4.987, 2014.
Burga, C. A.: Vegetation development on the glacier forefield Morteratsch (Switzerland), Appl. Veg. Sci., 2, 17–24, https://doi.org/10.2307/1478877, 1999.
Cannone, N., Diolaiuti, G., Guglielmin, M., and Smiraglia, C.: Accelerating climate change impacts on alpine glacier forefield ecosystems in the European Alps, Ecol. Appl., 18, 637–648, https://doi.org/10.1890/07-1188.1, 2008.
Du, Z. H., Wang, L., Wei, Z. Q., Liu, J. F., Lin, P. L., Lin, J. H., Li, Y. Z., Jin, Z. Z., Chen, J. Z., Wang, X. X., Qin, X., and Xiao, C. D.: CH4 and CO2 observations from a melting high mountain glacier, Laohugou Glacier No. 12, Adv. Clim. Change Res., 13, 146–155, https://doi.org/10.1016/J.ACCRE.2021.11.007, 2022.
Eckmeier, E., Mavris, C., Krebs, R., Pichler, B., and Eg, M.: Black carbon contributes to organic matter in young soils in the Morteratsch proglacial area (Switzerland), Biogeosciences, 10, 1265–1274, https://doi.org/10.5194/bg-10-1265-2013, 2013.
Egli, M., Mavris, C., Mirabella, A., and Giaccai, D.: Soil organic matter formation along a chronosequence in the Morteratsch proglacial area (Upper Engadine, Switzerland), Catena, 82, 61–69, https://doi.org/10.1016/J.CATENA.2010.05.001, 2010.
Esperschütz, J., Pérez-de-Mora, A., Schreiner, K., Welzl, G., Buegger, F., Zeyer, J., Hagedorn, F., Munch, J. C., and Schloter, M.: Microbial food web dynamics along a soil chronosequence of a glacier forefield, Biogeosciences, 8, 3283–3294, https://doi.org/10.5194/bg-8-3283-2011, 2011.
Fewster, R. E., Swindles, G. T., Carrivick, J. L., Gałka, M., Roland, T. P., McKeown, M., Sutherland, J. L., Tweed, F., Mullan, D., Graham, C., Gallego-Sala, A., and Morris, P. J.: Climate Warming and Deglaciation Drive New Peat Formation in the Southern Alps, Aotearoa/New Zealand, Geophys. Res. Lett., 52, https://doi.org/10.1029/2024GL113786, 2025.
GLIMS Consortium: GLIMS Glacier Database, Version 1, NASA National Snow and Ice Data Center Distributed Active Archive Center [data set], https://doi.org/10.7265/N5V98602, 2005.
Guelland, K., Hagedorn, F., Smittenberg, R. H., Göransson, H., Bernasconi, S. M., Hajdas, I., and Kretzschmar, R.: Evolution of carbon fluxes during initial soil formation along the forefield of Damma glacier, Switzerland, Biogeochemistry, 113, 545–561, https://doi.org/10.1007/s10533-012-9785-1, 2013a.
Guelland, K., Esperschütz, J., Bornhauser, D., Bernasconi, S. M., Kretzschmar, R., and Hagedorn, F.: Mineralisation and leaching of C from 13C labelled plant litter along an initial soil chronosequence of a glacier forefield, Soil Biol. Biochem., 57, 237–247, https://doi.org/10.1016/J.SOILBIO.2012.07.002, 2013b.
Huang, M., Mu, G., Mai, F., Zhou, Y., Li, X., Yang, Q., Shao, B., Wang, J., and Tong, Y.: Methane cycling in typical emerging proglacial lakes on the Tibetan Plateau: Insights into the metabolic mechanisms mediated by microorganisms, Water Res., 280, 123533, https://doi.org/10.1016/J.WATRES.2025.123533, 2025.
Khan, A., Kong, W., Khan, S., and Nawab, J.: Community succession and drivers of CO2-fixing microbes in recently deglaciated soils on the Tibetan Plateau, J. Soils Sediments, 23, 1901–1912, https://doi.org/10.1007/s11368-023-03446-6, 2023.
Kleber, G. E., Magerl, L., Turchyn, A. V., Schloemer, S., Trimmer, M., Zhu, Y., and Hodson, A.: Proglacial methane emissions driven by meltwater and groundwater flushing in a high-Arctic glacial catchment, Biogeosciences, 22, 659–674, https://doi.org/10.5194/bg-22-659-2025, 2025.
Krainer, K.: Geologie und Geomorphologie von Obergurgl und Umgebung – Publikationen Alpine Forschungsstelle Obergurgl, 31–52, https://www.zobodat.at/publikation_volumes.php?id=47550 (last access: 15 August 2025), 2010.
Li, D., Bao, Q., Zhao, M., Xia, F., and Wang, X.: Methane dynamics in the Hailuogou Glacier forefield, Southwest China, Environ. Res., 214, 113767, https://doi.org/10.1016/J.ENVRES.2022.113767, 2022.
Mavris, C., Egli, M., Plötze, M., Blum, J. D., Mirabella, A., Giaccai, D., and Haeberli, W.: Initial stages of weathering and soil formation in the Morteratsch proglacial area (Upper Engadine, Switzerland), Geoderma, 155, 359–371, https://doi.org/10.1016/j.geoderma.2009.12.019, 2010.
Minasny, B. and McBratney, A. B.: A conditioned Latin hypercube method for sampling in the presence of ancillary information, Comput. Geosci., 32, 1378–1388, https://doi.org/10.1016/J.CAGEO.2005.12.009, 2006.
Poeplau, C., Vos, C., and Don, A.: Soil organic carbon stocks are systematically overestimated by misuse of the parameters bulk density and rock fragment content, SOIL, 3, 61–66, https://doi.org/10.5194/SOIL-3-61-2017, 2017.
Raup, B., Racoviteanu, A., Khalsa, S. J. S., Helm, C., Armstrong, R., and Arnaud, Y.: The GLIMS geospatial glacier database: A new tool for studying glacier change, Global Planet. Change, 56, 101–110, https://doi.org/10.1016/J.GLOPLACHA.2006.07.018, 2007.
Smittenberg, R. H., Gierga, M., Göransson, H., Christl, I., Farinotti, D., and Bernasconi, S. M.: Climate-sensitive ecosystem carbon dynamics along the soil chronosequence of the Damma glacier forefield, Switzerland, Global Change Biol., 18, 1941–1955, https://doi.org/10.1111/j.1365-2486.2012.02654.x, 2012.
St Pierre, K. A., St Louis, V. L., Schiff, S. L., Lehnherr, I., Dainard, P. G., Gardner, A. S., Aukes, P. J. K., and Sharp, M. J.: Proglacial freshwaters are significant and previously unrecognized sinks of atmospheric CO2, P. Natl. Acad. Sci. USA, 116, 17690–17695, https://doi.org/10.1073/pnas.1904241116, 2019.
Temme, A. J. A. M. and Lange, K.: Pro-glacial soil variability and geomorphic activity – the case of three Swiss valleys, Earth Surf. Proc. Land., 39, 1492–1499, https://doi.org/10.1002/esp.3553, 2014.
Temme, A. J. A. M., Heckmann, T., and Harlaar, P.: Silent play in a loud theatre – Dominantly time-dependent soil development in the geomorphically active proglacial area of the Gepatsch glacier, Austria, Catena, 147, 40–50, https://doi.org/10.1016/J.CATENA.2016.06.042, 2016.
Tian, C., Lv, Y., Yang, Z., Zhang, R., Zhu, Z., Ma, H., Li, J., and Zhang, Y.: Microbial Community Structure and Metabolic Potential at the Initial Stage of Soil Development of the Glacial Forefields in Svalbard, Microb. Ecol., 86, 933–946, https://doi.org/10.1007/s00248-022-02116-3, 2023.
van Grinsven, S.: Proglacial wetlands: an overlooked CO2 sink within recently deglaciated landscapes, Zenodo [data set], https://doi.org/10.5281/zenodo.18662442, 2026.
Yan, F., Du, Z., Pu, T., Xu, Q., Wang, L., Ma, R., Zhang, C., Yu, Z., Li, C., and Kang, S.: Isotopic composition and emission characteristics of CO2 and CH4 in glacial lakes of the Tibetan Plateau, Environ. Res. Lett., 18, 094025, https://doi.org/10.1088/1748-9326/ACEB7B, 2023.