the Creative Commons Attribution 4.0 License.
the Creative Commons Attribution 4.0 License.
 | 17 Mar 2026
Mapping the fertosphere's phosphorus availability distribution in a field trial using a novel diffusive gradients in thin-films (fDGT) technique
Casey L. Doolette
Euan Smith
Ehsan Tavakkoli
Lukas van Zwieten
Brigid A. McKenna
Peter M. Kopittke
Enzo Lombi
Phosphorus (P) is limiting to crop growth worldwide and optimising P fertiliser use is essential for maintaining crop productivity and avoiding negative environmental impacts. To achieve this, a thorough understanding of the chemistry and potential plant availability of P fertilisers in soil is required, particularly the chemistry in the region of soil surrounding the fertiliser granules i.e. the fertosphere. The diffusive gradients in thin-films (DGT) technique is commonly used to estimate potentially bioavailable nutrient concentrations and the distribution of nutrients in the environment, including for P. This method correlates strongly to plant available nutrients because it mimics plant nutrient uptake by acting as an infinite sink. The technique has been used to obtain two-dimensional (2D) images of labile P concentrations or P fluxes in soil using X-ray fluorescence microscopy (XFM) and laser ablation (LA) ICP-MS in laboratory settings. Conventional DGTs are tedious to prepare and difficult to deploy at a scale (10 s of cm2) relevant to field scale observations. We recently developed a DGT with a gel-free binding layer that addresses these limitations. This innovative design is robust and simplifies preparation and analysis, making it ideal for field deployment. Here, we describe the details of the design of this novel field DGT (fDGT) device and evaluate its effectiveness in assessing the spatial availability of P from different fertilizer sources in a barley field trial in calcareous soil. Using X-ray fluorescence microscopy (XFM) analysis of DGT binding layers, we demonstrate that there are distinct reaction zones along the P fertiliser band in the field, and that differences between P treatments can be visualised and quantified using this novel fDGT. We believe this is the first report of two-dimensional spatially resolved mapping of P bioavailability obtained in situ (field) at the fertiliser band scale in a dryland cropping system. This approach provides a foundation for expanded use of field-deployable DGTs in studying macronutrient dynamics and supports the development of more efficient, site-specific fertiliser strategies to improve P use efficiency in agricultural systems. As the next step, we propose to further develop and refine this fDGT device and to make it applicable for other macro and/or nutrients. This will ultimately support research that aims to assist farmers by enhancing fertiliser use efficiency.
- Article
(1394 KB) - Full-text XML
- BibTeX
- EndNote


Phosphorus (P) is an essential nutrient that plays a key role in global crop production, and consequently, phosphate fertilisers are required to replenish this element in agricultural soils. The amount of P reserves are finite even though estimates of when these reserves will be exhausted are variable (e.g. Mcdowell et al., 2024). Nevertheless, it is well established that P reserves are not homogeneously distributed, and the bulk of such reserves occur in only a few countries, with potential geopolitical issues. Our previous work indicates that application of fertiliser P to soils accounts for 94 % of the total P added to the Earth-system (Kopittke et al., 2021) and given that the P biogeochemical cycle has been identified as exceeding its planetary boundary due to anthropogenic perturbation through agriculture (Richardson et al., 2023), it is essential that P fertilisers use is optimised. However, the agronomic P use efficiency (PUE) of current fertilisers is very low: only 5 %–25 % of P applied is taken up by crops in the year of application (Johnston and Poulton, 2019).
Improvement in PUE requires a thorough understanding of the chemistry of P fertilisers in soils as well as of the availability of this element to crops. A number of techniques have been developed and applied to understand the chemistry of P in soil with direct assessment of P speciation through various techniques such as solid phase 31P nuclear magnetic resonance (NMR, Wang and Nielsen, 2020) and X-ray absorption spectroscopy (XAS, Van Der Bom et al., 2022). Similarly, the assessment of P availability in soil has taken advantage of progress made in the assessment of contaminants' bioavailability in aquatic systems through the use of passive in situ sampling devices such as the diffusive gradients in thin films (DGT) technique (Davison and Zhang, 1994). The DGT device consists of three layers; a protective filter membrane in contact with the soil, a diffusive hydrogel that the analyte (in this case P) must cross, and a binding layer that acts as an infinite sink for the analyte, mimicking the plant's uptake. The binding layer induces a diffusive flux of the analyte toward the device with the analyte being resupplied to the soil solution by the solid phase. DGT has been shown to perform better than conventional chemical extractions to predict plant responses to available P across soil types (Mason et al., 2008, 2010). All of the in situ methods mentioned above have the advantage of requiring minimal to no sample preparation and hence prevent the issues limiting more common techniques such as chemical extractions (ex situ), which are often operationally defined and prone to create artefacts (Kar et al., 2011). Furthermore, the in situ techniques mentioned above, such as XAS and DGT, can be coupled with imaging techniques such as laser ablation inductively coupled plasma mass spectrometry (LA-ICP-MS) or X-ray fluorescence microscopy (XFM) to assess the chemistry and distribution of available P in two dimensions (Van Der Bom et al., 2022). This is particularly important when the aim of a study is to understand the behaviour of fertilisers in soils. This is because P fertilisers are commonly applied as granules in bands that are spaced according to the crop. This results in a highly heterogeneous P distribution in soil; very high P concentrations in the band and a gradient across the fertosphere (the volume of soil surrounding a fertiliser granule) into the bulk soil. However, most published research has been based on “bulk” studies where reactions are investigated only at one or a few P concentrations and mostly using indirect chemical extraction methods. In studies assessing bulk soils, soil is generally amended with ground (powdered) fertilisers or reagent-grade chemicals at a few fixed P concentrations. This creates a homogenous system, resulting in uniformity of P chemical speciation and availability throughout the soil. Such experimental conditions are not representative of conditions in the field and therefore hinder the understanding of the fate of P fertilisers in soil. Indeed, our previous work has shown that the concentration of P in the soil forms a steep gradient from the volume of soil directly in contact with the fertiliser granule (e.g. >10 000 mg P kg−1) to background concentrations only a few centimetres away (e.g. Lombi et al., 2004, 2005). This steep concentration gradient also results in changes to relative P availability due to different concentration-dependent mechanisms (e.g. sorption vs. precipitation, Lombi et al., 2005). Recently, DGT in combination with mapping techniques such as laser ablation inductively coupled plasma mass spectrometry (LA-ICPMS) or X-ray fluorescence microscopy (XFM) have been employed to assess P availability in two dimensions (Hummel et al., 2021; Moens et al., 2024; Santner et al., 2010). However, these techniques have been utilised almost exclusively in laboratory or pot experiments to avoid the challenges linked to the significant soil heterogeneity under field conditions. This implies that the results obtained in laboratory and pot trials may not be representative of what occurs under field conditions.
While DGTs are routinely used to predict available P in field-collected soils, their in-field application in agronomic field trials has been limited to paddy fields. In this case, DGT devices used for sediment analyses have been deployed to understand the availability of nutrients and contaminants across the water sediment interface most notably in rice fields. For instance, the potential and limitations of standard sediment DGT devices has been explored by (Fang et al., 2018) who investigated the availability of metal(loid)s and sulfur in paddy soils. To the best of our knowledge, such an approach has not been used to investigate the availability of P from fertilisers in field trials of major crops, excluding rice, and specifically not in any dryland cropping systems. Furthermore, the commercially available standard sediment DGT devices (18 mm×150 mm in size) are designed to study redox-driven reactions across the sediment-water interface and not to investigate nutrient availability along fertiliser bands for which larger DGT devices are needed. Part of the issue is related to the difficulty in preparing large and robust gels that can be deployed in non-flooded soils under field conditions, as large binding layers are difficult to prepare, deploy and analyse (Doolette et al., 2022). However, we have recently developed a DGT with a gel-free binding layer that overcomes these limitations being it very robust and easy to prepare and analyse, making it ideal for field deployment (Moens et al., 2024). Here, we report the design of a novel field DGT (fDGT) device and its evaluation for visualising and assessing the spatial availability of P from different fertiliser sources in a barley field trial for the first time.
2.1 Design and assembly of the fDGT
For the fDGT, the binding layer used was specifically designed for P mapping by XFM as described previously (Moens et al., 2024). Briefly, titanium dioxide-based Metsorb® (MetsorbTM HMRP5, Graver Technologies) with particle size of 5 µm was applied to a single sided Kapton adhesive tape (polyimide backing with acrylic adhesive, TAPE FILM AMBER in., 3M) using a cosmetic-grade brush. This results in a gel-free binding layer that is extremely robust and does not shrink upon drying prior to analyses – a problem common for most binding layers (Doolette et al., 2022). Critically, both the acrylic adhesive and the Ti-based resin do not interfere with the X-ray fluorescence signal of P at the K-edge fluorescence line, ensuring compatibility with XFM analysis. The diffusive layer was a 500 µm bis-acrylamide hydrogel, prepared as described by (Arias et al., 2021). Both the binding and diffusive layers were 105 mm×75 mm in size. The fDGT was assembled by placing the binding layer in a recess (0.5 mm) of a 3D printed backing plate (Vero Clear resin). The diffusive layer was then placed on the binding layer (i.e. in contact with the titanium dioxide-based binding agent) and covered with a polyethersulphone (PES) filter (0.45 µm pore size). The assembly was firmly fixed using a single sided adhesive tape (Fig. 1a) and stored in storage containers with moist paper towel for transport to the field site in a refrigerated portable container. Prior to deployment in the field, the fDGT assembly described above was mounted on a 3D printed polylactic acid (PLA) plunger using double-sided adhesive tape and mounted in a support casing (also 3D printed PLA; Fig. 1b).
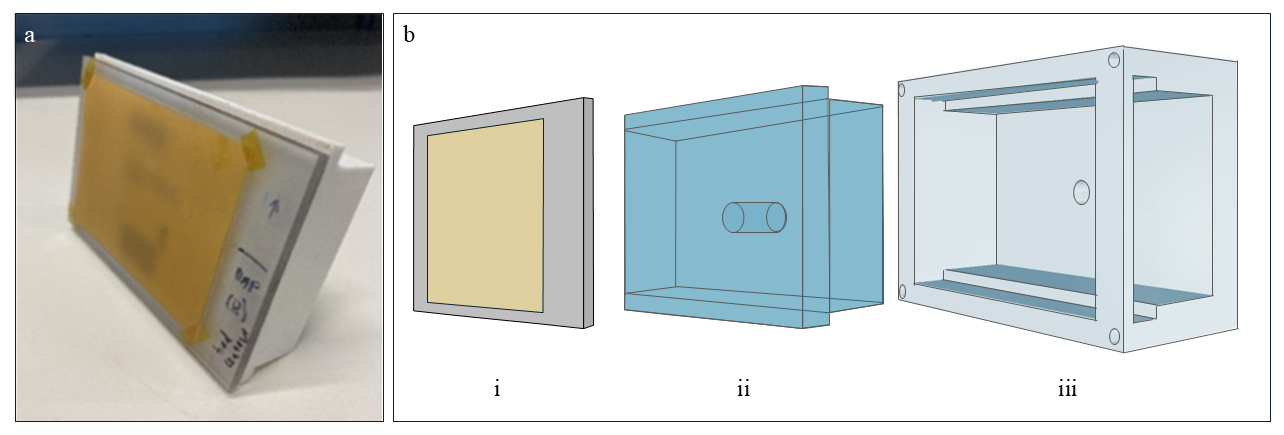
Figure 1(a) Photograph of the binding layer mounted in the recess of the backing plate and installed on the plunger and (b) the 3D printed prepared backing plate (i), plunger (ii) and support casing (iii) which housed (i) and (ii). Note, a hole is visible on the back of the casing where an M12 bolt is inserted to ensure contact of the DGT with the soil).
2.2 Field trial and fDGT deployment
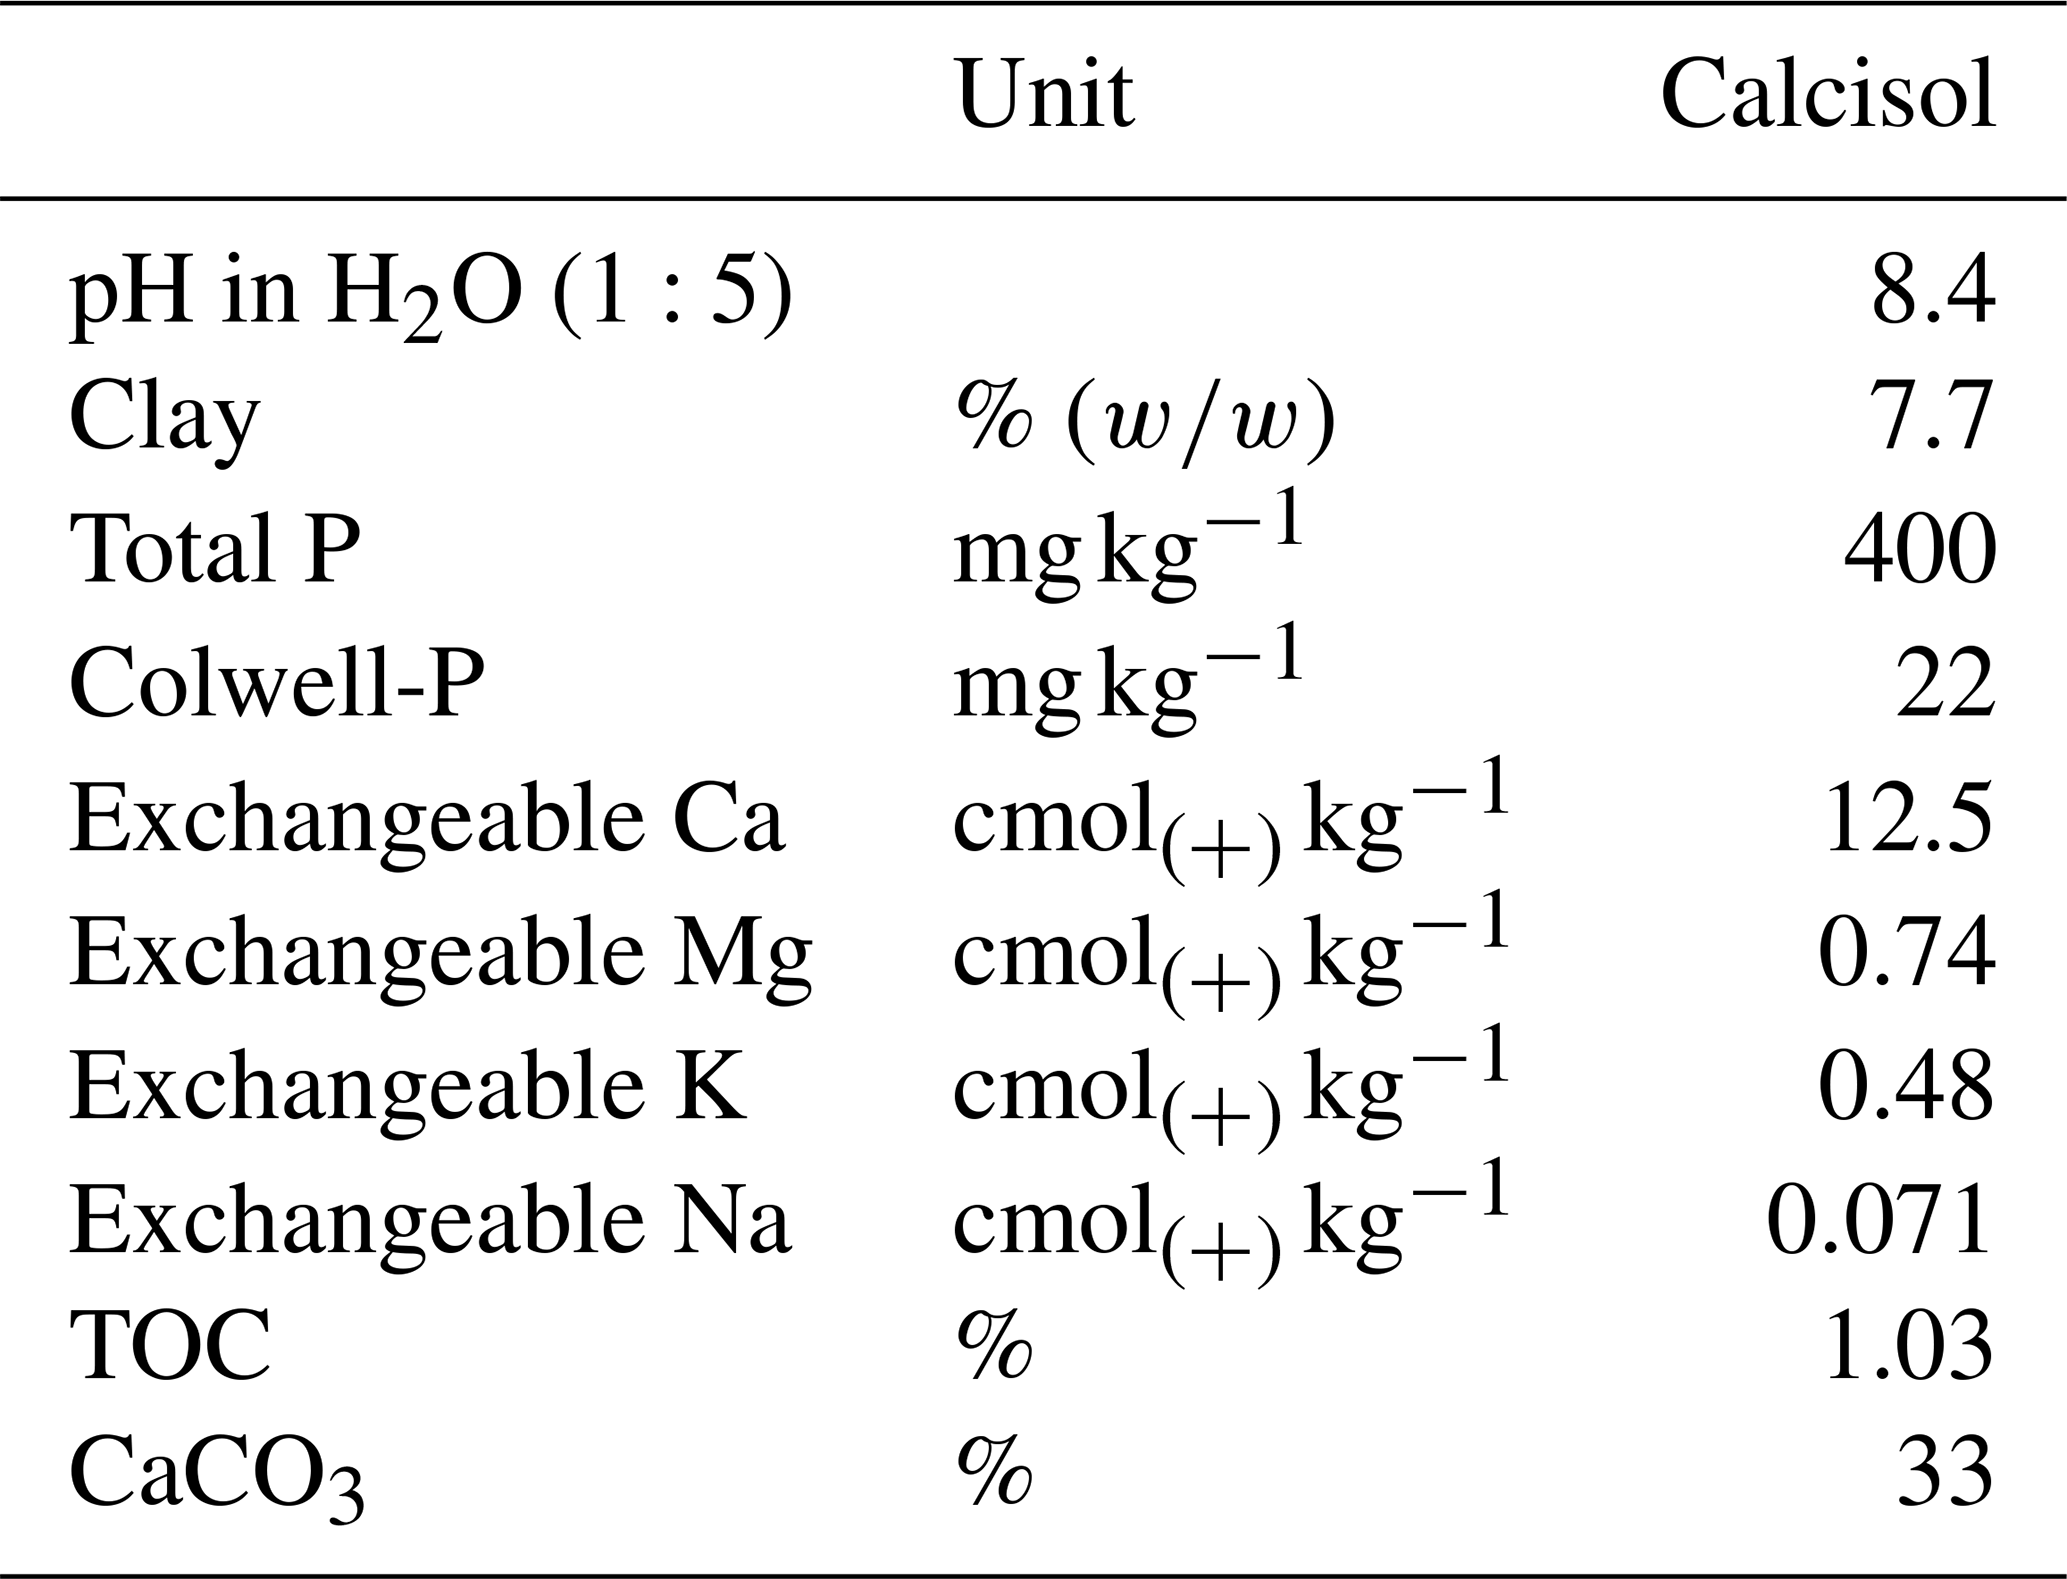
A field trial was conducted near Poochera on the Eyre Peninsula (South Australia, 32.7436° S, 134.9020° E) on a Calcisol classified according to the World Reference Base for Soil Resources (WRB). The soil characteristics are reported in Table 1. Soil pH and EC were determined in a 1:5 soil : water suspension; total P was determined by inductively coupled plasma-optical emission spectroscopy (ICP-OES) after digestion in aqua regia using NIST® SRM 2710a Montana Soil as the reference material; total organic carbon (TOC) was determined by Dumas combustion; exchangeable cations were extracted using 1 M ammonium chloride at pH 7 and analysed using ICP-OES; presence of carbonates was determined by titration (Rayment and Lyons, 2011). Soil P status was assessed using bicarbonate-extractable P, Colwell-P (Colwell, 1963).
The field trial consisted of four replicated microplots (1 m×1 m in a randomised block design) with the following treatments: diammonium P [DAP, [NH4]2HPO4] at a rate of 10 kg P ha−1 (this is the typical P fertilisation rate in the district); DAP at a rate of 20 kg P ha−1; DAP at 10 kg P ha−1 plus an engineered biochar supplying 10 kg P ha−1. The engineered biochar was prepared using a commercial rotary kiln by pyrolyzing cereal straw at 450 °C with a residence time of 30 min. The resulting biochar was then activated with phosphoric acid to obtain a P concentration of 5 % (), before being pelletised in a press wheel pelletizer using commercially available binders.
The fertilisers were manually placed at a depth of 5 cm in three rows per plot at a distance of 25 cm between rows. Then, 3 cm of soil was placed on top of the fertiliser bands and barley seeds (cv Maximus CL) were placed in bands directly above the fertiliser bands at a rate of 50 kg seeds ha−1. The plots were then sprayed with Trifluralin (1.5 L ha−1), Glyphosate (1.5 L ha−1) and Diuron (400 L ha−1).
2.3 fDGT deployment, plant and soil analyses
Five weeks post-sowing, fDGT devices were assembled as described above and deployed in the field. This period was chosen to coincide with early season crop growth, when adequate P supply is critical for maximising yield (Grant et al., 2001). The day before fDGT deployment, the plots were watered (10 L m−2) to ensure sufficient moisture for fDGT deployment. Before fDGT deployment, a section of the central row in each treatment, 20 cm in length, was selected and the above ground plant biomass harvested for further analyses by cutting shoots 2 cm from the surface. Two stainless steel plates (20 cm×15 cm), with a cutting edge, were inserted vertically in the soil with one plate positioned flush with the base of the barley plants and the other plate positioned in the middle of the interrow to facilitate the excavation of a trench. Note, the shorter edge of the plate (15 cm) was pushed vertically into the soil. Following excavation of the trench, a clean vertical soil face was created by removing the metal plate positioned near the barley row. The soil face was then moistened with a spray bottle containing deionised water and the fDGT unit put in position. Once in position, excavated soil was packed around the fDGT to keep the unit deployed in the correct position. The top of the fDGT was level with the soil surface and held against the soil face. Once the trench was approximately refilled with compacted soil, the head of the bolt on the back of the support case was exposed and a socket was placed on the bolt head. The socket was then turned to push the plunger forward, ensuring that the face of the fDGT was in contact with the soil face. Extra soil was then added to fully backfill the trench and ensure that the fDGT remained in position. Soil temperature at a depth of ∼5 cm was recorded at both the time of deployment and retrieval using a digital thermometer inserted into the soil. A thermometer was inserted into the soil to a depth of approximately 5 cm and the temperature of the soil recorded when the fDGT units were deployed and removed. The fDGT were deployed for 48 h. The removal of the deployed fDGT units from the soil followed a reversal of the installation process. The fDGT were then disassembled in the field and the binding layer, still attached to the backing plate, positioned in a transport container for subsequent XFM analysis.
Soil samples were collected in-row at depths of 0–4 and 4–6 cm (three replicates per plot). The soils were air dried, sieved to <2 mm and the pH and Colwell-P measured following the procedures detailed in the previous section. The barley shoots collected prior to fDGT deployment were counted, washed with deionised water and oven dried at 80° until constant weight (48 h) and dry biomass recorded. Ground plant samples (0.5 g) were placed in microwave Teflon™ vessels and pre-digested overnight in 10 mL of concentrated (70 %) HNO3. Samples were then digested in a microwave (CEM Mars 6™ Microwave Digestion System) with Tomato Leaves NIST 1573a used as the Certified Reference Material (CRM). The digestates were then diluted with Milli-Q water before analysis (Agilent 8800 Triple Quadrupole ICP-MS).
2.4 XFM analysis
The X-ray fluorescence mapping was performed at the XFM beamline of the Australian Synchrotron (ANSTO) in Melbourne, Victoria (Howard et al., 2020). Samples were analysed at the microprobe end-station with a Vortex EM fluorescence detector, which allows detection of photons with energies above approximately 1.6 keV. The binding layers were mounted in the opening of a Perspex sample mount using double-sided tape. The photon energy of the incident X-ray beam was set at 4.8 keV using a Si(111) monochromator and the beam size at the sample was 2 µm×10 µm (horizontal × vertical). The binding layers of two replicates per treatment were scanned with the horizontal axis in continuous motion but with discrete vertical steps resulting in elemental maps with a resolution of 100 µm×100 µm pixels. The transit time per pixel was set at 33.3 ms px−1. To improve sensitivity, a continuous flow of helium was applied through the collimator of the Vortex to reduce Ar fluorescence and reduce sorption of the fluorescence signal from the sample by air. To allow for quantitative analysis, the detector response was calibrated using metal foil standards at the start of the beamtime. The P fluorescence spectra were analysed, and elemental P loadings on the binding layer were quantified and visualized using GeoPIXE (Howard et al., 2020; Ryan, 2000). Phosphorus concentrations on the binding layer were converted to 2D maps of labile P concentrations (Cp in µg P L−1) as previously described (Moens et al., 2024).
2.5 Statistical analyses
Analyses of statistical differences between treatments, for both plant and soil analyses, were performed using analysis of variance (ANOVA) and paired t-tests where differences between treatments were determined at the 5 % significance level using Fisher's Protected L.S.D. All analyses were performed using the software package GraphPad Prism version 10.0.2.
3.1 Plant and soil analyses
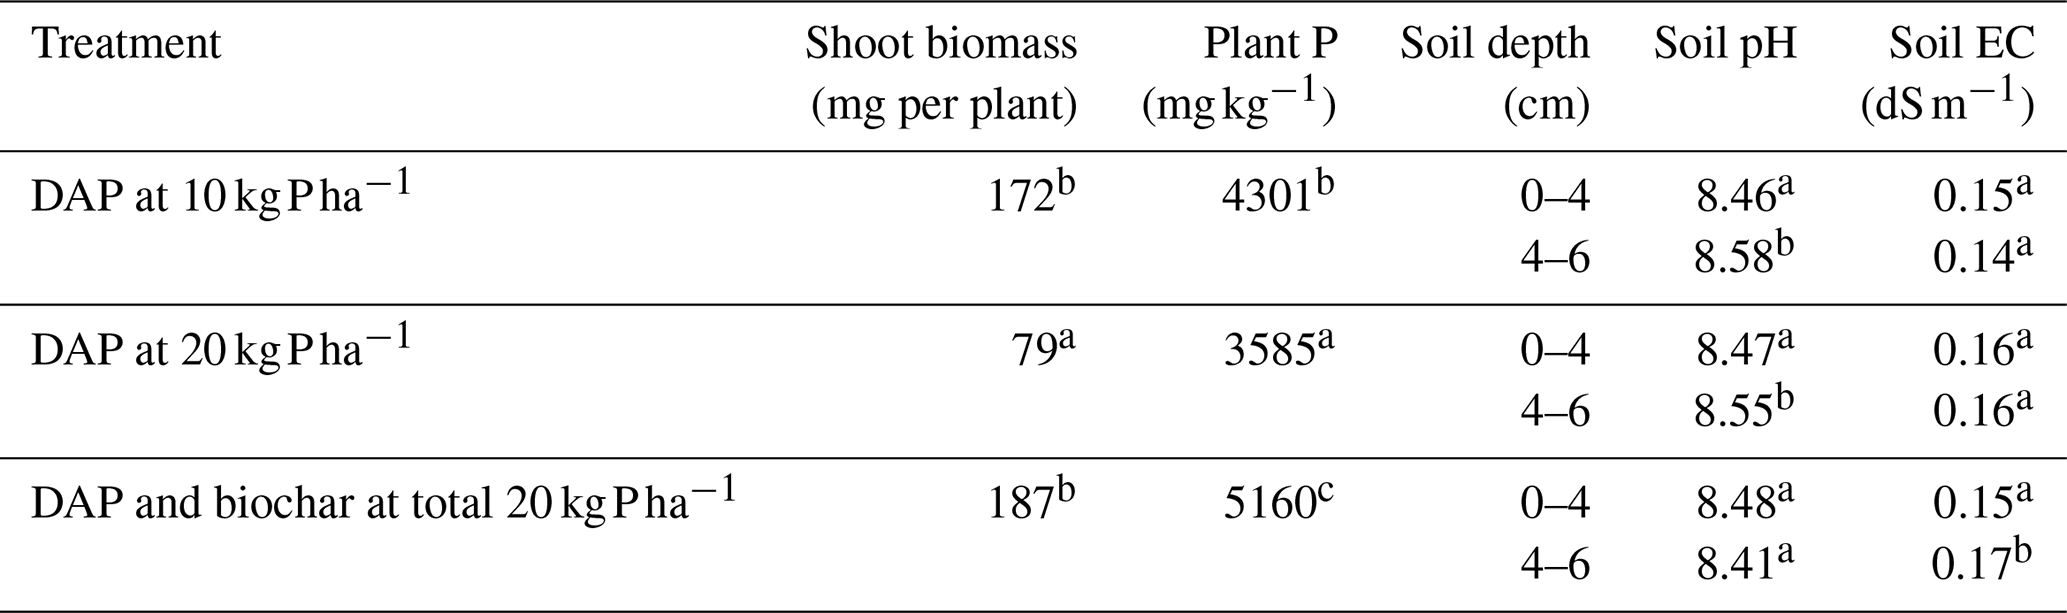
Recoveries of the two reference materials following acid digestion were within acceptable ranges, with 94 ± 1.2 % for the plant CRM, and 92 ± 0.9 % for the soil SRM confirming analytical accuracy. The shoots of barley plants were collected 5 weeks after sowing and their P content are reported in Table 2. The results indicate that plant shoot biomass and P content were significantly lower when DAP was applied at the higher rate (20 kgP ha−1). Banded application of P fertilisers a few centimetres below the seeds is considered the optimal strategy in highly P-fixing soils, such as the calcareous soil at the field site used here (Sleight et al., 1984). The lower biomass at the higher DAP rate, is possibly due to ammonia/ammonium () toxicity; a known issue when ammoniacal fertilisers are banded in the vicinity of seeds (Pan et al., 2016). A review of the literature in relation to ammonia/ammonium-induced plant toxicity, caused by fertilisers with a high N:P ratio, shows that nutrient uptake, root proliferation and plant biomass can be reduced when accumulate (Sica et al., 2025). This could have been exacerbated by the low rainfall recorded in the first 5 weeks of growth. Soil pH and EC were minimally impacted by the fertiliser application, but the localised effects in the fertosphere may have been masked due to the bulk sampling and homogenisation of the soils.
Table 2Shoot biomass and average P concentration of shoots after 5 weeks of growth, soil pH and EC above the fertiliser zone (0–4 cm depth) and in the fertiliser zone (4–6 cm depth). Numbers in the same column followed by different letters are statistically significant (p<0.05). Between 5–8 plants (n) were harvested from a 20 cm length of each row per plot.
The total P concentrations in the 0–4 cm soil layer fractions were similar in all treatments (p>0.05) and also not significantly different (p>0.05) to the P concentration in the 4–6 cm sample of the low-rate DAP treatment (Fig. 2a). In contrast, both treatments receiving 20 kg P ha−1 (DAP and DAP + biochar) exhibited significantly elevated total P concentration (p=0.001) at 4–6 cm depth, corresponding to the fertiliser band. These results for total P concentrations were mirrored by the Colwell-extractable P measurements (Fig. 2b), which were significantly higher only in the two high-P treatments. However, considerable variability was observed in the samples even though 12 individual samples were analysed per treatment (three replicate samples for each of the four treatment replicates). Furthermore, even though the Colwell P for the two treatments supplying a large dose of P are above the critical soil test values (34 mg kg−1), it should be noted that this soil test is poorly correlated with the yield of cereal crops in calcareous soils (Speirs et al., 2013). Consequently, reliance on conventional extractants may underestimate spatial heterogeneity in P availability and misrepresent plant-accessible pools under field conditions.
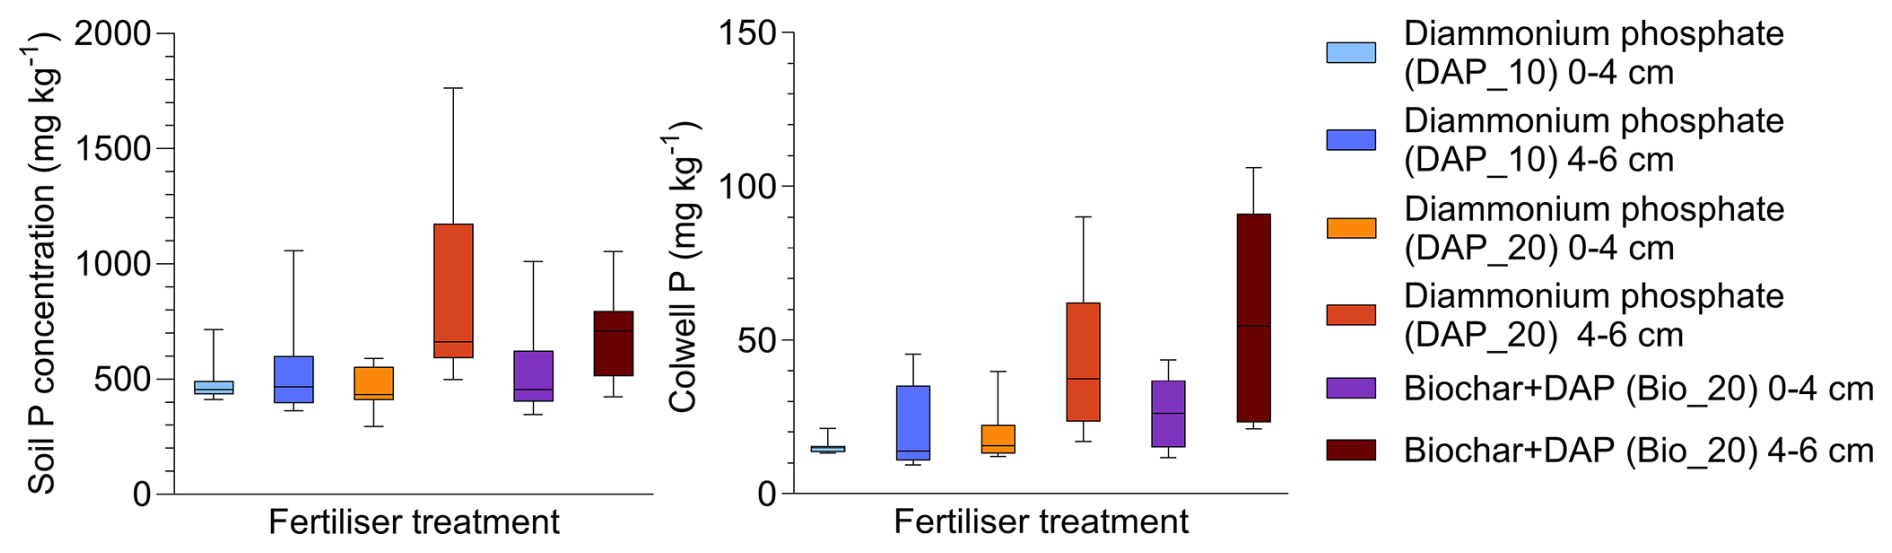
Figure 2Total P and Colwell P as a function of fertiliser treatment and sample depth (note that P fertiliser was placed 5 cm below the soil surface). Where diammonium phosphate is applied at 10 kg P ha−1 (DAP_10) “DAP_20” is applied at double the rate (i.e. 20 kg P ha−1) and Biochar + DAP is a combination of both materials applied at a total rate of 20 kg P ha−1.
3.2 Visualisation of P availability
Elemental maps of P obtained by XFM analyses of the fDGT binding layers are reported in Fig. 3a. These maps show a significant variability along the horizontal axis (i.e. along the fertiliser band) consistent with the granular nature of the fertiliser applied (Fig. 3a). It should be also noted that due to the 90° geometry of the Vortex detector used for XFM, the effective mapping area was limited to 37 mm×70 mm (W × H). Nevertheless, it is apparent that a substantial difference in P availability between the treatments exist. When the data are averaged along the horizontal axis, it is possible to assess the average P availability, as measured by DGT (CP), as a function of depth (Fig. 3b). These results indicate that CP for the DAP applied at 10 kg ha−1 is much lower than for the other two treatments. Also, the DAP + Biochar treatment shows larger P bioavailability compared to DAP at the same P rate. The CP availability profile along the soil depth indicates that P diffuses and remains available to a distance of 10–15 mm from the depth of application (i.e. 50 mm), indicating limited vertical diffusion. This result is similar to what has been observed under laboratory conditions by Moens et al. (2024), who reported that DAP diffused and remained available to a distance of 12.5 mm from the point of fertiliser application. The CP values in the current field study are significantly lower than those reported by Moens et al. (2024) but this may be due to the fact that Moens et al. used a Petri dish set up with limited depth (i.e. the system is not fully three-dimensional being 90 mm in diameter and 15 mm in depth), while in the field P would have diffused freely in every direction with the fertosphere resulting in a spherical system. In addition, there is more likely to have been greater fertiliser dissolution in the Petri dish experiment as the soil was maintained at 80 % maximum water holding capacity (MWHC) for the duration of the fertiliser incubation, this is in contrast with the field experiment where soils were not maintained at a specific WHC.
The shape of the P availability profile also indicates the presence of three distinct P reaction zones within the fertosphere. In the innermost zone (approximately 0–5 mm from the point of application), a P availability plateau can be observed this is characteristic of the fertosphere zone closest to the fertiliser granules where the P sorption capacity is saturated and precipitation reactions control P availability (Hedley and Mclaughlin, 2005). In this specific soil, these are most likely Ca-phosphates (Lombi et al., 2006). Further away from this plateau, P availability decreases rapidly (5–10 mm from the fertiliser granules) due to a progressive decrease in diffusion of P. In this transition zone, precipitation reactions becomes progressively less dominant and adsorption reactions increase in importance (Benbi and Gilkes, 1987). A third zone can also be identified, 10–20 mm from the fertiliser granule, where P availability progressively and slowly decreases. In this zone, the soil solution is not supersaturated, and the sorption capacity controls P availability. To the best of our knowledge, this is the first time that these distinct reaction zones, previously described using laboratory experiments (Benbi and Gilkes, 1987), have been visualised and confirmed under field conditions. This mechanistic knowledge of how fertilisers behave in the field can be used to drive improvements in management practices and fertiliser formulations, ultimately increasing fertiliser nutrient use efficiency (Lombi et al., 2025). In contrast to the bulk soil, the fertosphere is likely to also have steep gradients for soil pH and EC which can influence nutrient availability. Therefore, by better understanding these spatial differences, agronomic practices could be improved by developing fertiliser formulations with a more sustained nutrient supply, in turn reducing precipitation and fixation reactions, and by optimising the placement of fertilisers (Lombi et al., 2025). For example, for this fertiliser–soil combination (i.e. DAP granules in a calcareous soil), if seeds are placed ≤5 mm from the fertiliser, primary roots would be exposed to the highest concentration of available P, but increasing the application rate of P may not be beneficial as the P availability plateau has been reached. In addition, although sorption reactions dominate further away from the granule, vertical spacing between fertiliser and seed bands should not exceed 20 mm due to the limited vertical diffusion of P. We believe that the capacity of fDGT coupled with XFM to resolve such spatial patterns under field conditions provides a powerful tool for refining our understanding of P dynamics in situ and validating mechanistic models of fertiliser behaviour in soil.
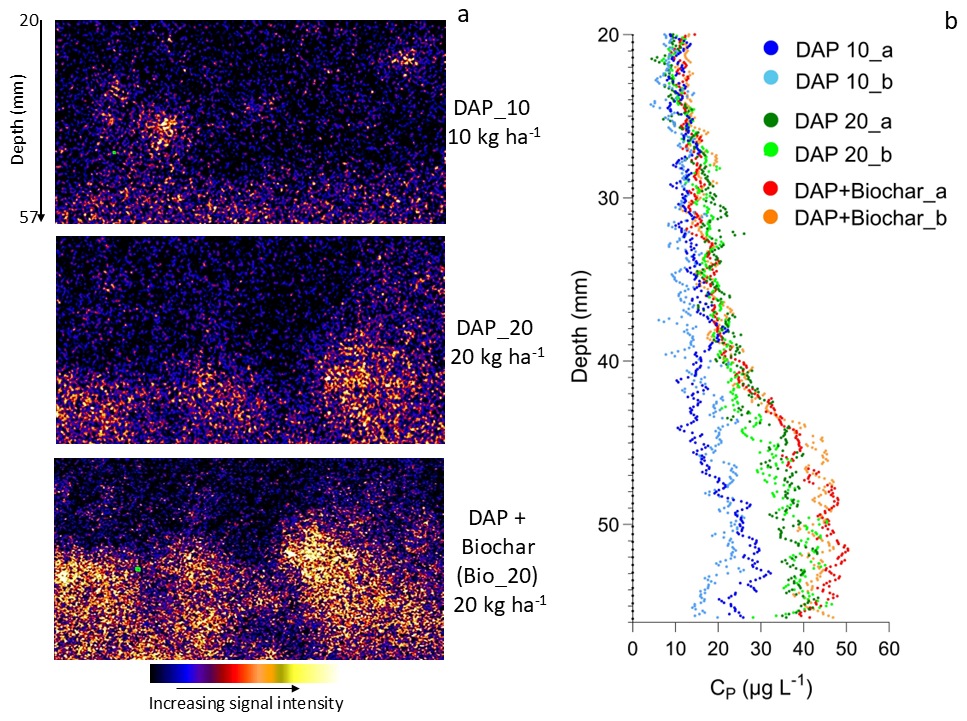
Figure 3Two dimensional P diffusion images measured using field-deployed DGT in combination with X-ray fluorescence microscopy (XFM) analysis where (a) are P XFM images of the DGT binding layers collected from the diammonium phosphate treatment where P was applied at 10 kg ha−1 (DAP_10), DAP_20 is DAP applied at 20 kg ha−1 and the Biochar + DAP treatment (Bio_20) delivered a combined 20 kg P ha−1; and (b) labile P concentrations (Cp, P µg P L−1) calculated as a function of depth for the three fertiliser treatment tested (DAP_10, DAP_20, DAP + Biochar); obtained by averaging the 2D XFM maps across the horizontal axis i.e. each coloured point in (b) is the average of the Cp values in a horizontal transect across the gel. Data from two DGT replicates per treatment were collected i.e. “a” and “b”. “Depth” is the distance from the soil surface.
Increasing P use efficiency is essential for ensuring the economic and environmental sustainability of agricultural practices. This requires a better understanding of how P fertilisers react in soil and in particular, in the fertosphere. Our current knowledge has benefitted from the development of a number of analytical approaches that allow us to better understand the reaction products controlling availability of different fertiliser formulations in different soils. For instance, elemental availability mapping (by DGT) and speciation techniques (such as XAS) have allowed us to better define plant availability and understand the sorption and precipitation processes controlling P availability (Van Der Bom et al., 2022). However, the application of these novel techniques has been limited to controlled laboratory experiments and simplified systems, with the need to ascertain lab-to-field transferability of the results obtained. The development of easier to handle and more robust DGT system such as those using ceramic-based diffusive layers (Xie et al., 2021) or membrane-based binding layers (Moens et al., 2024; Huang et al., 2016) make it feasible to conduct field-based measurements as those reported here. Here, we describe, for the first time, the field application of large DGT devices to visualise the potential availability of P fertilisers. This approach could be used to assess how agronomic practices (i.e. fertiliser placement, co-application of nutrients etc.) influence P availability in different soils or the behaviour of novel fertiliser formulations such of those derived from waste materials (Hernandez-Mora et al., 2024). Ultimately, this technique could lead to improved prodAuuctivity and more sustainable use of P fertilizers. By bridging the gap between laboratory insights and field relevance, the application of spatially resolved DGT tools holds considerable promise for supporting more efficient, site-specific, and sustainable use of phosphorus fertilisers in agricultural systems.
The underlying data used in this article is available upon request directly to the authors. Currently the data is not publicly access-able as it contains specific location information related to private property.
EL and PMK acquired the funding for this work. EL, CLD, ES conceptualised the research goals. LvZ and ET provided resources for the field trial. EL, ES and CLD performed the experiments and collected and analysed the study data. BAM collected the study data. EL and CLD prepared the manuscript with contributions and editing from all co-authors.
The contact author has declared that none of the authors has any competing interests.
Publisher's note: Copernicus Publications remains neutral with regard to jurisdictional claims made in the text, published maps, institutional affiliations, or any other geographical representation in this paper. The authors bear the ultimate responsibility for providing appropriate place names. Views expressed in the text are those of the authors and do not necessarily reflect the views of the publisher.
We thank Nigel Wilhelm and Brian Dzoma (South Australian Research and Development Institute, SARDI) for facilitating the microplot field trial. This research was performed on the XFM beamline at the Australian Synchrotron, part of ANSTO.
This research has been supported by the Grains Research and Development Corporation (grant no. Project USA1910-001RTX).
This paper was edited by Rafael Clemente and reviewed by two anonymous referees.
Arias, D. M., Teasdale, P. R., Doolette, C. L., Lombi, E., Farquhar, S., and Huang, J.: Development and evaluation of a new colorimetric DGT technique for the 2D visualisation of labile phosphate in soils, Chemosphere, 269, https://doi.org/10.1016/j.chemosphere.2020.128704, 2021.
Benbi, D. K. and Gilkes, R. J.: The movement into soil of P from superphosphate grains and its availability to plants, Fertilizer Research, 12, 21–36, https://doi.org/10.1007/BF01049418, 1987.
Colwell, J.: The estimation of the phosphorus fertilizer requirements of wheat in southern New South Wales by soil analysis, Aust. J. Exp. Agr., 3, 190–197, 1963.
Davison, W. and Zhang, H.: In situspeciation measurements of trace components in natural waters using thin-film gels, Nature, 367, 546–548, https://doi.org/10.1038/367546a0, 1994.
Doolette, C. L., Howard, D. L., Afshar, N., Kewish, C. M., Paterson, D. J., Huang, J., Wagner, S., Santner, J., Wenzel, W. W., Raimondo, T., De Vries Van Leeuwen, A. T., Hou, L., Van Der Bom, F., Weng, H., Kopittke, P. M., and Lombi, E.: Tandem Probe Analysis Mode for Synchrotron XFM: Doubling Throughput Capacity, Analytical Chemistry, 94, 4584–4593, https://doi.org/10.1021/acs.analchem.1c04255, 2022.
Fang, W., Williams, P. N., Fang, X., Amoah-Antwi, C., Yin, D., Li, G., Ma, L. Q., and Luo, J.: Field-Scale Heterogeneity and Geochemical Regulation of Arsenic, Iron, Lead, and Sulfur Bioavailability in Paddy Soil, Environmental Science and Technology, 52, 12098–12107, https://doi.org/10.1021/acs.est.8b01947, 2018.
Grant, C. A., Flaten, D. N., Tomasiewicz, D. J., and Sheppard, S. C.: The importance of early season phosphorus nutrition, Canadian Journal of Plant Science, 81, 211–224, https://doi.org/10.4141/P00-093, 2001.
Hedley, M. and McLaughlin, M.: Reactions of phosphate fertilizers and by-products in soils, in: Phosphorus: Agriculture and the Environment, 181–252, https://doi.org/10.2134/agronmonogr46.c7, 2005.
Hernandez-Mora, A., Duboc, O., Lombi, E., Bünemann, E. K., Ylivainio, K., Symanczik, S., Delgado, A., Abu Zahra, N., Nikama, J., Zuin, L., Doolette, C. L., Eigner, H., and Santner, J.: Fertilization efficiency of thirty marketed and experimental recycled phosphorus fertilizers, Journal of Cleaner Production, 467, 142957, https://doi.org/10.1016/j.jclepro.2024.142957, 2024.
Howard, D. L., Jonge, M. D., Afshar, N., Ryan, C. G., Kirkham, R., Reinhardt, J., Kewish, C. M., McKinlay, J., Walsh, A., Divitcos, J., Basten, N., Adamson, L., Fiala, T., Sammut, L., and Paterson, D. J.: The XFM beamline at the Australian Synchrotron, Journal of Synchrotron Radiation, 27, 1447–1458, https://doi.org/10.1107/S1600577520010152, 2020.
Huang, J., Bennett, W. W., Welsh, D. T., and Teasdale, P. R.: Determining time-weighted average concentrations of nitrate and ammonium in freshwaters using DGT with ion exchange membrane-based binding layers, Environmental Science: Processes & Impacts, 18, 1530–1539, https://doi.org/10.1039/C6EM00260A, 2016.
Hummel, C., Boitt, G., Santner, J., Lehto, N. J., Condron, L., and Wenzel, W. W.: Co-occurring increased phosphatase activity and labile P depletion in the rhizosphere of Lupinus angustifolius assessed with a novel, combined 2D-imaging approach, Soil Biology and Biochemistry, 153, https://doi.org/10.1016/j.soilbio.2020.107963, 2021.
Johnston, A. E. and Poulton, P. R.: Phosphorus in agriculture: A review of results from 175 years of research at Rothamsted, UK, Journal of Environmental Quality, 48, 1133–1144, https://doi.org/10.2134/jeq2019.02.0078, 2019.
Kar, G., Hundal, L. S., Schoenau, J. J., and Peak, D.: Direct chemical speciation of P in sequential chemical extraction residues using P K-edge X-ray absorption near-edge structure spectroscopy, Soil Science, 176, 589–595, https://doi.org/10.1097/SS.0b013e31823939a3, 2011.
Kopittke, P. M., Menzies, N. W., Dalal, R. C., McKenna, B. A., Husted, S., Wang, P., and Lombi, E.: The role of soil in defining planetary boundaries and the safe operating space for humanity, Environment International, 146, https://doi.org/10.1016/j.envint.2020.106245, 2021.
Lombi, E., McLaughlin, M. J., Johnston, C., Armstrong, R. D., and Holloway, R. E.: Mobility and lability of phosphorus from granular and fluid monoammonium phosphate differs in a calcareous soil, Soil Science Society of America Journal, 68, 682–689, https://doi.org/10.2136/sssaj2004.6820, 2004.
Lombi, E., McLaughlin, M. J., Johnston, C., Armstrong, R. D., and Holloway, R. E.: Mobility, solubility and lability of fluid and granular forms of P fertiliser in calcareous and non-calcareous soils under laboratory conditions, Plant and Soil, 25–34, https://doi.org/10.1007/s11104-004-0558-z, 2005.
Lombi, E., Scheckel, K. G., Armstrong, R. D., Forrester, S., Cutler, J. N., and Paterson, D.: Speciation and distribution of phosphorus in a fertilized soil: A synchrotron-based investigation, Soil Science Society of America Journal, 70, 2038–2048, https://doi.org/10.2136/sssaj2006.0051, 2006.
Lombi, E., Doolette, C. L., Coqui da Silva, R., McKenna, B. A., and Kopittke, P. A.: Unveiling chemical gradients in the fertosphere: A paradigm shift to enhance fertilizer efficiency and decrease the environmental impact of overfertilisation, Environmental Science and Technology, 59, 14853–14861, https://doi.org/10.1021/acs.est.5c04757, 2025.
Mason, S., Hamon, R., Zhang, H., and Anderson, J.: Investigating chemical constraints to the measurement of phosphorus in soils using diffusive gradients in thin films (DGT) and resin methods, Talanta, 74, 779–787, https://doi.org/10.1016/j.talanta.2007.07.005, 2008.
Mason, S., McNeill, A., McLaughlin, M. J., and Zhang, H.: Prediction of wheat response to an application of phosphorus under field conditions using diffusive gradients in thin-films (DGT) and extraction methods, Plant and Soil, 337, 243–258, https://doi.org/10.1007/s11104-010-0521-0, 2010.
McDowell, R. W., Pletnyakov, P., and Haygarth, P. M.: Phosphorus applications adjusted to optimal crop yields can help sustain global phosphorus reserves, Nature Food, 5, 332–339, https://doi.org/10.1038/s43016-024-00952-9, 2024.
Moens, C., Lombi, E., Howard, D. L., Wagner, S., Payne, J. L., Kopittke, P. M., and Doolette, C. L.: Mapping Phosphorus Availability in Soil at a Large Scale and High Resolution Using Novel Diffusive Gradients in Thin Films Designed for X-ray Fluorescence Microscopy, Environmental Science and Technology, 58, 440–448, https://doi.org/10.1021/acs.est.3c06237, 2024.
Pan, W. L., Madsen, I. J., Bolton, R. P., Graves, L., and Sistrunk, T.: Ammonia/Ammonium Toxicity Root Symptoms Induced by Inorganic and Organic Fertilizers and Placement, Agronomy Journal, 108, 2485–2492, https://doi.org/10.2134/agronj2016.02.0122, 2016.
Rayment, G. E. and Lyons, D. J.: Soil chemical methods: Australasia (Vol. 3), CSIRO, 2011.
Richardson, K., Steffen, W., Lucht, W., Bendtsen, J., Cornell, S. E., Donges, J. F., Drüke, M., Fetzer, I., Bala, G., von Bloh, W., Feulner, G., Fiedler, S., Gerten, D., Gleeson, T., Hofmann, M., Huiskamp, W., Kummu, M., Mohan, C., Nogués-Bravo, D., Petri, S., Porkka, M., Rahmstorf, S., Schaphoff, S., Thonicke, K., Tobian, A., Virkki, V., Wang-Erlandsson, L., Weber, L., and Rockström, J.: Earth beyond six of nine planetary boundaries, Science Advances, 9, https://doi.org/10.1126/sciadv.adh2458, 2023.
Ryan, C. G.: Quantitative trace element imaging using PIXE and the nuclear microprobe, International Journal of Imaging Systems and Technology, 11, 219–230, https://doi.org/10.1002/ima.1007, 2000.
Santner, J., Prohaska, T., Luo, J., and Zhang, H.: Ferrihydrite containing gel for chemical imaging of labile phosphate species in sediments and soils using diffusive gradients in thin films, Analytical Chemistry, 82, 7668–7674, https://doi.org/10.1021/ac101450j, 2010.
Sica, P., Sitzmann, T. J., Müller-Stöver, D., and Magid, J.: Strategic placement of mineral and biobased fertilizers for optimizing phosphorus use efficiency: A comprehensive review, Soil Use and Management, 41, e70039, https://doi.org/10.1111/sum.70039, 2025.
Sleight, D. M., Sander, D. H., and Peterson, G. A.: Effect of fertilizer phosphorus placement on the availability of phosphours, Soil Science Society of America Journal, 48, 336–340, 1984.
Speirs, S. D., Scott, B. J., Moody, P. W., and Mason, S. D.: Soil phosphorus tests II: A comparison of soil test–crop response relationships for different soil tests and wheat, Crop and Pasture Science, 64, 469–479, https://doi.org/10.1071/CP13111, 2013.
van der Bom, F. J. T., Kopittke, P. M., Raymond, N. S., Sekine, R., Lombi, E., Mueller, C. W., and Doolette, C. L.: Methods for assessing laterally-resolved distribution, speciation and bioavailability of phosphorus in soils, Reviews in Environmental Science and Biotechnology, 21, 53–74, https://doi.org/10.1007/s11157-021-09602-z, 2022.
Wang, Q. and Nielsen, U. G.: Applications of solid-state NMR spectroscopy in environmental science, Solid State Nuclear Magnetic Resonance, 110, https://doi.org/10.1016/j.ssnmr.2020.101698, 2020.
Xie, H., Dong, Y., Chen, J., Wang, X., and Fu, M.: Development and evaluation of a ceramic diffusive layer based DGT technique for measuring organic micropollutants in seawaters, Environment International, 156, 106653, https://doi.org/10.1016/j.envint.2021.106653, 2021.