the Creative Commons Attribution 4.0 License.
the Creative Commons Attribution 4.0 License.
 | 23 Feb 2026
Assessing the impact of rewetting agricultural fen peat soil via open drain damming: an agrogeophysical approach
Patrick Tuohy
Owen Fenton
Mark G. Healy
Hilary Pierce
Asaf Shnel
Eve Daly
Open drainage ditch (i.e., open drain) damming aims to raise the water table in agricultural grassland peat soils thereby reducing greenhouse gas (GHG) emissions. A current knowledge gap is how to examine the spatial and temporal effectiveness of such an action, i.e., assessing the behaviour of the water table in the adjoining field. To address this gap, at a drained agricultural grassland site with shallow fen peat soils (ranging from 0 to 2 m depth), water level in an open drain was raised by installing a dam. Associated changes to the water table depth (WTD) were monitored using two nests of dip-wells installed at two locations (Rewetted and Control areas) in the adjoining field. Soil profile volumetric water content (VWC) data were obtained in these two areas in addition to the temperature, salinity, pH, and electrical conductivity signature of the water in the open drain. These data were integrated with geophysical (electromagnetic induction (EMI)) survey data conducted in June and December. Results from the dip wells (located >20 m from dam) indicated that no measurable change in WTD occurred due to the dam installation, aligning with previous studies suggesting limited spatial influence in agricultural fen peat soils. VWC profiles, while consistent with peat physical properties, showed no deviation attributable to drain damming. The EMI results identified a distinct zone with electrical conductivity values similar to those of open drain water, suggesting localised water infiltration within ∼ 20 m of the dammed drain during summer. This spatial impact was less evident in December, likely due to increased precipitation and regional groundwater influence. This study demonstrates that EMI surveys, shown here in combination with other high-resolution data capture, can detect rewetting effects when combined with neural network clustering and Multi-Cluster Average Standard Deviation analysis, highlighting its value for rapid site assessment. Moreover, the results underscore the importance of survey timing, as June measurements provided clearer evidence of drain damming impact than the December measurements.
- Article
(3776 KB) - Full-text XML
- BibTeX
- EndNote


Organic, or peat, soils are recognised as important terrestrial stores of carbon (Page and Baird, 2016; Ramsar, 2018). Globally, these soils are estimated to be present on ∼ 3 % of the land surface (Xu et al., 2018; UNEP, 2022) and contain ∼ 30 % of terrestrial carbon (Minasny et al., 2023). These soils are present at many latitudes, from tropical to arctic, and are often divided into landscape descriptors (e.g., fen, wetland, raised bog, blanket bog (Fig. 1)), which are dependent on the local environment and soil-forming conditions (Lourenco et al., 2022). Peat soils form in anoxic waterlogged conditions, where the decay of plant material is slowed due to a lack of oxygen.
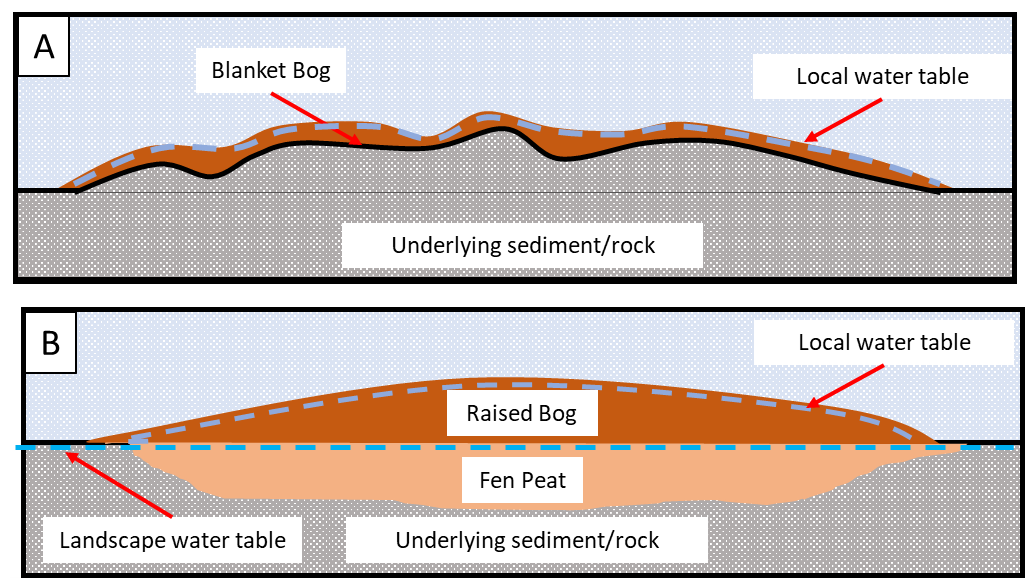
Figure 1Conceptual diagram of generalised peat soil types. (A) Blanket bog, typically found in highland/mountainous areas. (B) Fen peats underly raised bogs. Fen peat becomes exposed when raised bog is extracted/removed and are typically in contact with landscape water table dynamics (Minasny et al., 2023).
Peat soils have been extensively drained in Europe over the last century mainly due to their importance in energy production (Minasny et al., 2023) and conversion for use in agriculture and forestry (Fluet-Chouinard et al., 2023; Habib and Connolly, 2023). High levels of drainage (i.e., open drains and in-field pipe drains) and maintenance are required to effectively control the water table in peat soils over time (Tuohy et al., 2023). Effective drainage introduces oxygen to the soil and encourages the biological decay of plant material, which results in a release of carbon dioxide to the atmosphere (Koch et al., 2023; Lindsay, 2010). Globally, drained peatlands are estimated to account for ∼ 5 % of all anthropogenic greenhouse gas (GHG) emission (FAO, 2020). As such, international treaties, such as the Paris Agreement (UNFCCC, 2018) and the European Union Nature Restoration Law (EU, 2022), recognise the potential for peat soils as nature-based solutions for reducing GHG emissions (Strack et al., 2022).
Reintroducing water-saturated conditions is considered to be fundamental to efforts in reducing the emission of GHG from peat soils (Strack et al., 2022; Monteverde et al., 2022). The term “rewetting”, which is defined as the deliberate action of raising the water table closer to ground level in peat soils (Wilson et al., 2016), is considered the main tool through which this reduction can be achieved, and is often the main component of national strategies to reduce emissions from peat soils. In Ireland, the Climate Action Plan (DECC, 2024) seeks to reduce management intensity on 80 000 ha of agricultural grassland on drained organic soils by 2030. Reduced management intensity is an umbrella term for activities including abandoning drain maintenance, water table manipulation and “rewetting” by raising the water table to be, on average, within 30 cm of the ground level. Currently, rewetting is mainly achieved via the blocking or damming of open drains which often surround such fields.
Damming occurs by installing a man-made or earthen structure in the open drain to partially impede water discharge. The damming of open drains in blanket bogs, raised bogs, and fen peat is not a straight-forward or uniform practice, and the efficacy of the damming on both the water table and GHG emissions is not always as expected. For example, little is known about the spatial and temporal influence of damming open drains on nearby peat soils. A study in Norway (Stachowicz et al., 2025) analysed water table levels on three raised bogs where damming had taken place and found that the influence of these efforts extended 17.2 m into the surrounding peat soils on average. However, in Germany, a study on grassland fen peat soil found that drain damming had almost no influence on the water table levels (Heller et al., 2025), concluding that the low hydraulic conductivity of the peat resulted in minimal infiltration of dammed water into the surrounding soils.
Agricultural grassland peat soils tend to be fen peat. Fens are peat forming-systems that are different to bogs (i.e., raised or blanket) as they are fed by groundwater or moving surface water and can occur as isolated pockets of peat soil in river valleys, poorly drained basins, in hollows and beside open stretches of water (Fossitt and Heritage, 2000). They are often found around the edges, or what remains, of a raised bog (Gilet et al., 2024; Minasny et al., 2023). These soils represent small pockets of organic material that are connected with regional groundwater and the larger landscape (Fig. 1), making them difficult to rewet effectively. As rewetting is considered the means by which peat soil restoration may be achieved, an understanding of the spatial influence of the rewetting method being applied is of vital importance. This is particularly relevant to the agricultural industry, where only partial drain damming may serve as a compromise due to the need to balance agricultural productivity with restoration efforts (Tuohy et al., 2023).
Agrogeophysics (Garré et al., 2021) is an emerging discipline focused on the use of geophysics within precision agriculture (Monteiro et al., 2021). Electromagnetic Induction (EMI), which measures the electrical conductivity of the subsurface, is a proven method for soil characterisation (Doolittle and Brevik, 2014). Modern EMI instruments offer the means to analyse both the vertical and spatial distribution of soil properties (Everett and Chave, 2019), with field scale (∼ 1–10 ha) applications in mapping soil texture (Brogi et al., 2019; O'Leary et al., 2024), soil compaction (Romero-Ruiz et al., 2024), soil salinity (Koganti et al., 2018), and soil moisture (Huth and Poulton, 2007). EMI surveys have also been utilised in peat soils studies, identifying peat depth (Adetsu et al., 2024), peat layer properties (Altdorff et al., 2016) and the role of pore water content on electrical conductivity in peat soils (Henrion et al., 2024). The possibility of analysing EMI survey results in the temporal domain via multiple repeat surveys has allowed for the assessment of, for example, hydrological dynamics in agricultural settings (Blanchy et al., 2020; Moghadas et al., 2017), especially in areas where there is little change from other external sources (land management, soil textural changes) (Boaga, 2017), but has not been explored in the context of agricultural grassland peat soils and rewetting. Additionally, the combination of EMI data with machine learning unsupervised classification has allowed for a simplified interpretation of the results of EMI surveys, which allow non-expert users to take advantage of this survey method (O'Leary et al., 2024; von Hebel et al., 2018).
The aim of this study is to assess the spatial and temporal impact of drain damming on an agricultural grassland on a fen peat soil at field-scale in Ireland using two EMI surveys conducted during different hydrological conditions (June and December). The electrical properties of the water in an open drain on site was measured and compared to EMI survey results, with a view to identifying areas of the site where water had infiltrated from the dammed open drain. The geophysical methods presented in this study could similarly be applied to less instrumented agricultural fields or undergoing different rewetting methods (e.g., subsurface irrigation (Heller et al., 2025)). This may provide a tool, and reduce the overall cost, for both the mapping and monitoring of the rewetting process at field-scale (∼ ha). This is vital for both land managers and policy makers in assessing the impact of rewetting, and for reporting of GHG emissions and quantifying restoration efforts.
2.1 Site Description and in-situ measurements
The study site, identified as peat soil (O'Leary et al., 2025), is a grassland fen peat agricultural field (Fig. 2). It is located close to the town of Birr (53.09° N, 7.9° W) in County Offaly, Ireland. The exact site location is not given to protect the privacy of the landowner. Vegetation within the field is classified as “cultivated land” within the national landcover map (Tailte Éireann, 2023), however is a grassland, used for the intermittent grazing by cattle during the growing season. This site is part of a multi-site project (Teagasc, 2023) and was selected for this study as it is topographically flat and peat depth is typically uniform throughout, except for an area to the south of the site, where the peat is thinner. These factors limit the potential variation in measured geophysical signal to the hydrological conditions of the peat soil layer.
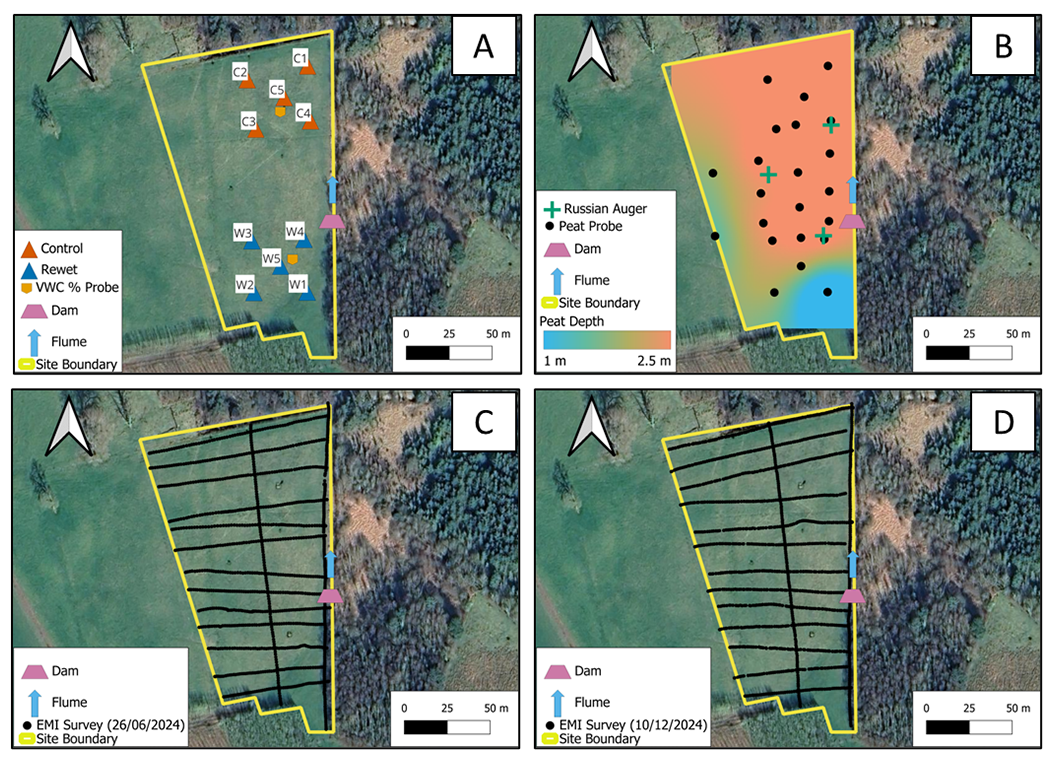
Figure 2Site description. (A) The site divided into C (Control) and W (Rewet) by the location of the dam and flume in the open drain. Dip-well nests are shown in each area, and VWC % probes are installed close to C5 and W5, (B) Locations of peat depth probe and Russian auger validation measurements and interpolated peat thickness map, (C) EMI survey points (26 June 2024), (D) EMI survey points (10 December 2024). Basemap: © Google Maps 2019.
The field is approximately 1.2 ha in size and flanked to the east and north by deep open drains (∼ 2 m deep and below the average Water Table Depth (WTD)). Several field drains were installed in the northern half of the site ca. 2020, which were unrelated to the commencement of this project. These consisted of trenches filled with stone aggregate and are visible on the surface. Prior to geophysical fieldwork undertaken in this study, this field has been instrumented with ten 2 m deep fully-screened dip-wells (Baird and Low, 2022) with Seametrics LevelSCOUT water table loggers (VanWalt, 2025a), and two 1.2 m deep gropoint probes (VanWalt, 2025b), measuring the percentage of water volume, or volumetric water content (VWC) in 0.15 m depth intervals, starting at the surface (Fig. 2A). A tipping bucket rain gauge is also located in this field to provide local rainfall. All data are recorded at 15 min intervals and stored in a database.
The peat depth at this site (Fig. 2B) was measured in a two-stage process via refusal of a peat probe (stopped by hard substrate) (VanWalt, 2023a) and validated by Russian auger (VanWalt, 2023b). Twenty-one locations were probed for peat depth and validated by three locations sampled by Russian auger. A peat thickness map has been interpolated to a 1×1 m grid using bSpline function in QGIS v 3.30 (Fig. 2B).
A dam and water flume were installed at this site on 29 March 2023 (Fig. 2), damming the water in the open drain to the south. This acts to divide the field into two experimental areas, Rewet (W) and Control (C), with a nest of dip-wells and a soil moisture probe in each area. The choice of location of the C dip wells (Fig. 2) was designed to act as a study “control” where no rise in WTD was expected due to rewetting. The W dip wells were specifically located upstream of the dam in an area of the site assumed to be affected by open drain damming.
Daily averaged WTD, VWC, and rainfall data were extracted, providing a snapshot of the in-situ measured hydrological conditions that coincides with the date of acquisition of geophysical data (see Sect. 2.2). The daily average WTD and VWC was calculated. Additionally, a Multi-Parameter probe (YSI, 2025) was used to measure temperature, salinity, pH, and electrical conductivity of the water in the open drain during the geophysical surveys. These measurements were taken from south of the dam (SD), between the dam and flume (ND), and north of the flume (NF) (Fig. 2).
2.2 Electromagnetic induction (EMI)
EMI is a geophysical method used to estimate subsurface apparent electrical conductivity (ECa) by inducing electromagnetic fields in the ground (Everett and Chave, 2019). ECa refers to a measurement of apparent electrical conductivity which, although sensitive to a particular depth, is affected by the soil through which the electromagnetic field passes. A transmitter coil (Tx) generates a primary magnetic field via an alternating current. This primary field induces electrical currents in conductive materials (i.e., soil) beneath the surface. These currents, in turn, produce a secondary magnetic field, which is detected by a receiver coil (Rx). The strength and phase shift of the secondary field, as measured at Rx, provides information on the electrical conductivity of the subsurface materials. The depth of investigation is controlled by the frequency of induced electromagnetic field, the orientation of Tx and Rx (vertical, horizontal, coplanar), the spacing between the transmitter coil (Tx) and the receiver coil (Rx), and the electrical conductivity of the subsurface.
Often EMI surveys are used for soil mapping and monitoring as they are lightweight, non-contact instruments which can easily be moved around a site, allowing for dense spatial data to be gathered (Boaga, 2017). Additionally, in recent years, the development of multi-coil/multi-frequency instruments has allowed for multiple depths to be investigated simultaneously during an EMI survey (Brogi et al., 2019). However, the need for high spatial and vertical resolution should align with the expected degree of variation of the intended target property in the subsurface. For this study using a multi-coil instrument to assess the expected vertical variation in electrical conductivity, the spatial resolution was chosen as a balance between the assumed area of impact of the drain damming of only several metres (Heller et al., 2025) and the required time and effort to acquire the data. Other EMI surveys have achieved a very high spatial resolution with ∼ 2 m line spacing (O'Leary et al., 2024; Adetsu et al., 2024) using quad bikes and sleds, however such resolution cannot be achieved without considerable manual effort in the absence of motorised vehicles.
A CMD Mini-Explorer (GF Instruments, 2023) was used to estimate the spatial and vertical distribution of ECa across this site. This instrument has a fixed frequency Tx coil and six Rx coils, spaced at 0.2, 0.33, 0.5, 0.72, 1.03 & 1.5 m, and was operated in “Hi” mode, or horizontal coplanar coil orientation, giving an estimated depth of investigation of 1.5× the coil spacing (McNeill, 1980). The CMD Mini-Explorer is factory calibrated and was mounted on a wooden sled and set to sample rate of 10 Hz. This sled was manually pulled by the operator and the 0.2 m coil data were removed due to noise. A Trimble R2 unit was also mounted on the sled, providing GNSS readings at 1 Hz sampling interval. The EMI surveys were conducted on 26 June and 10 December 2024. Both surveys consisted of distinct lines, two parallel and several perpendicular to the open drain (Fig. 2C, D).
Data processing, clustering, and Inversion
At the beginning of each survey day, the CMD was warmed up over a period of 30 min to ensure temperature stabilisation of the electronic components. The instrument was then set to record with and without the presence of the sled to provide a correction factor. No in-field calibrations were performed. Each survey line was acquired and processed as a separate data file. Processing of each data file included correction for the presence of the sled, resampling to 1 Hz, averaging of duplicate readings, application of a histogram filter (von Hebel et al., 2014) and a principle component analysis filter (Minsley et al., 2012), filtered based on the first principle component. The individual data files were then appended together into a single survey file.
In order to identify the spatial and vertical distribution of ECa across this site, clustering (Kaufman, 2005) was applied. Clustering is an unsupervised machine learning method to organise complex multi-dimension data into groups with similar characteristics and returns a single representative datapoint for each cluster (Wang et al., 2021). For this study, Self-Organising Maps (Kohonen, 2013), a neural network based clustering algorithm, and the Multi-Cluster Average Standard Deviation (MCASD) metric (O'Leary et al., 2023, 2024), developed for use on geospatial data, was used to determine the appropriate number of clusters for each EMI survey. MCASD tests the stability of the cluster centres over multiple clustering attempts. In order to derive the MCASD statistics, 1–20 clusters were assessed 100 times each. Processing and clustering of ECa data were performed in MATLAB 2024a.
Clustering returns a single representative ECa data point for each group. These ECa data can be converted to a 1D true vertical distribution of electrical conductivity (ECt) via a mathematical processing called inversion (Binley et al., 2015). This is a process which seeks to create a model of subsurface ECt that best describes the acquired ECa data. This is an iterative process where initially, an estimated 1D model of the subsurface ECt is provided. The Maxwell Equations (Everett and Chave, 2019) are then applied to this model to return the modelled ECa (forward modelling). These modelled ECa are compared to acquired ECa from the EMI survey by optimising the objective function (Sasaki, 2001). The ECt model is updated and the forward modelling performed again. This is repeated until the error between modelled and acquired ECa is minimised and an ECt model is produced.
In this study, the cluster centre ECa data are inverted using EM4SOIL (EMTOMO, 2013) to provide a representation of the vertical and spatial distribution of true electrical conductivity (ECt) within the study area. Each cluster centre was inverted using a 1D clustering algorithm, a damping factor of 0.10, the S2 inversion algorithm, and the full solution (FS) Maxwell equations for forward modelling.
3.1 In-situ measurements
3.1.1 Rainfall data
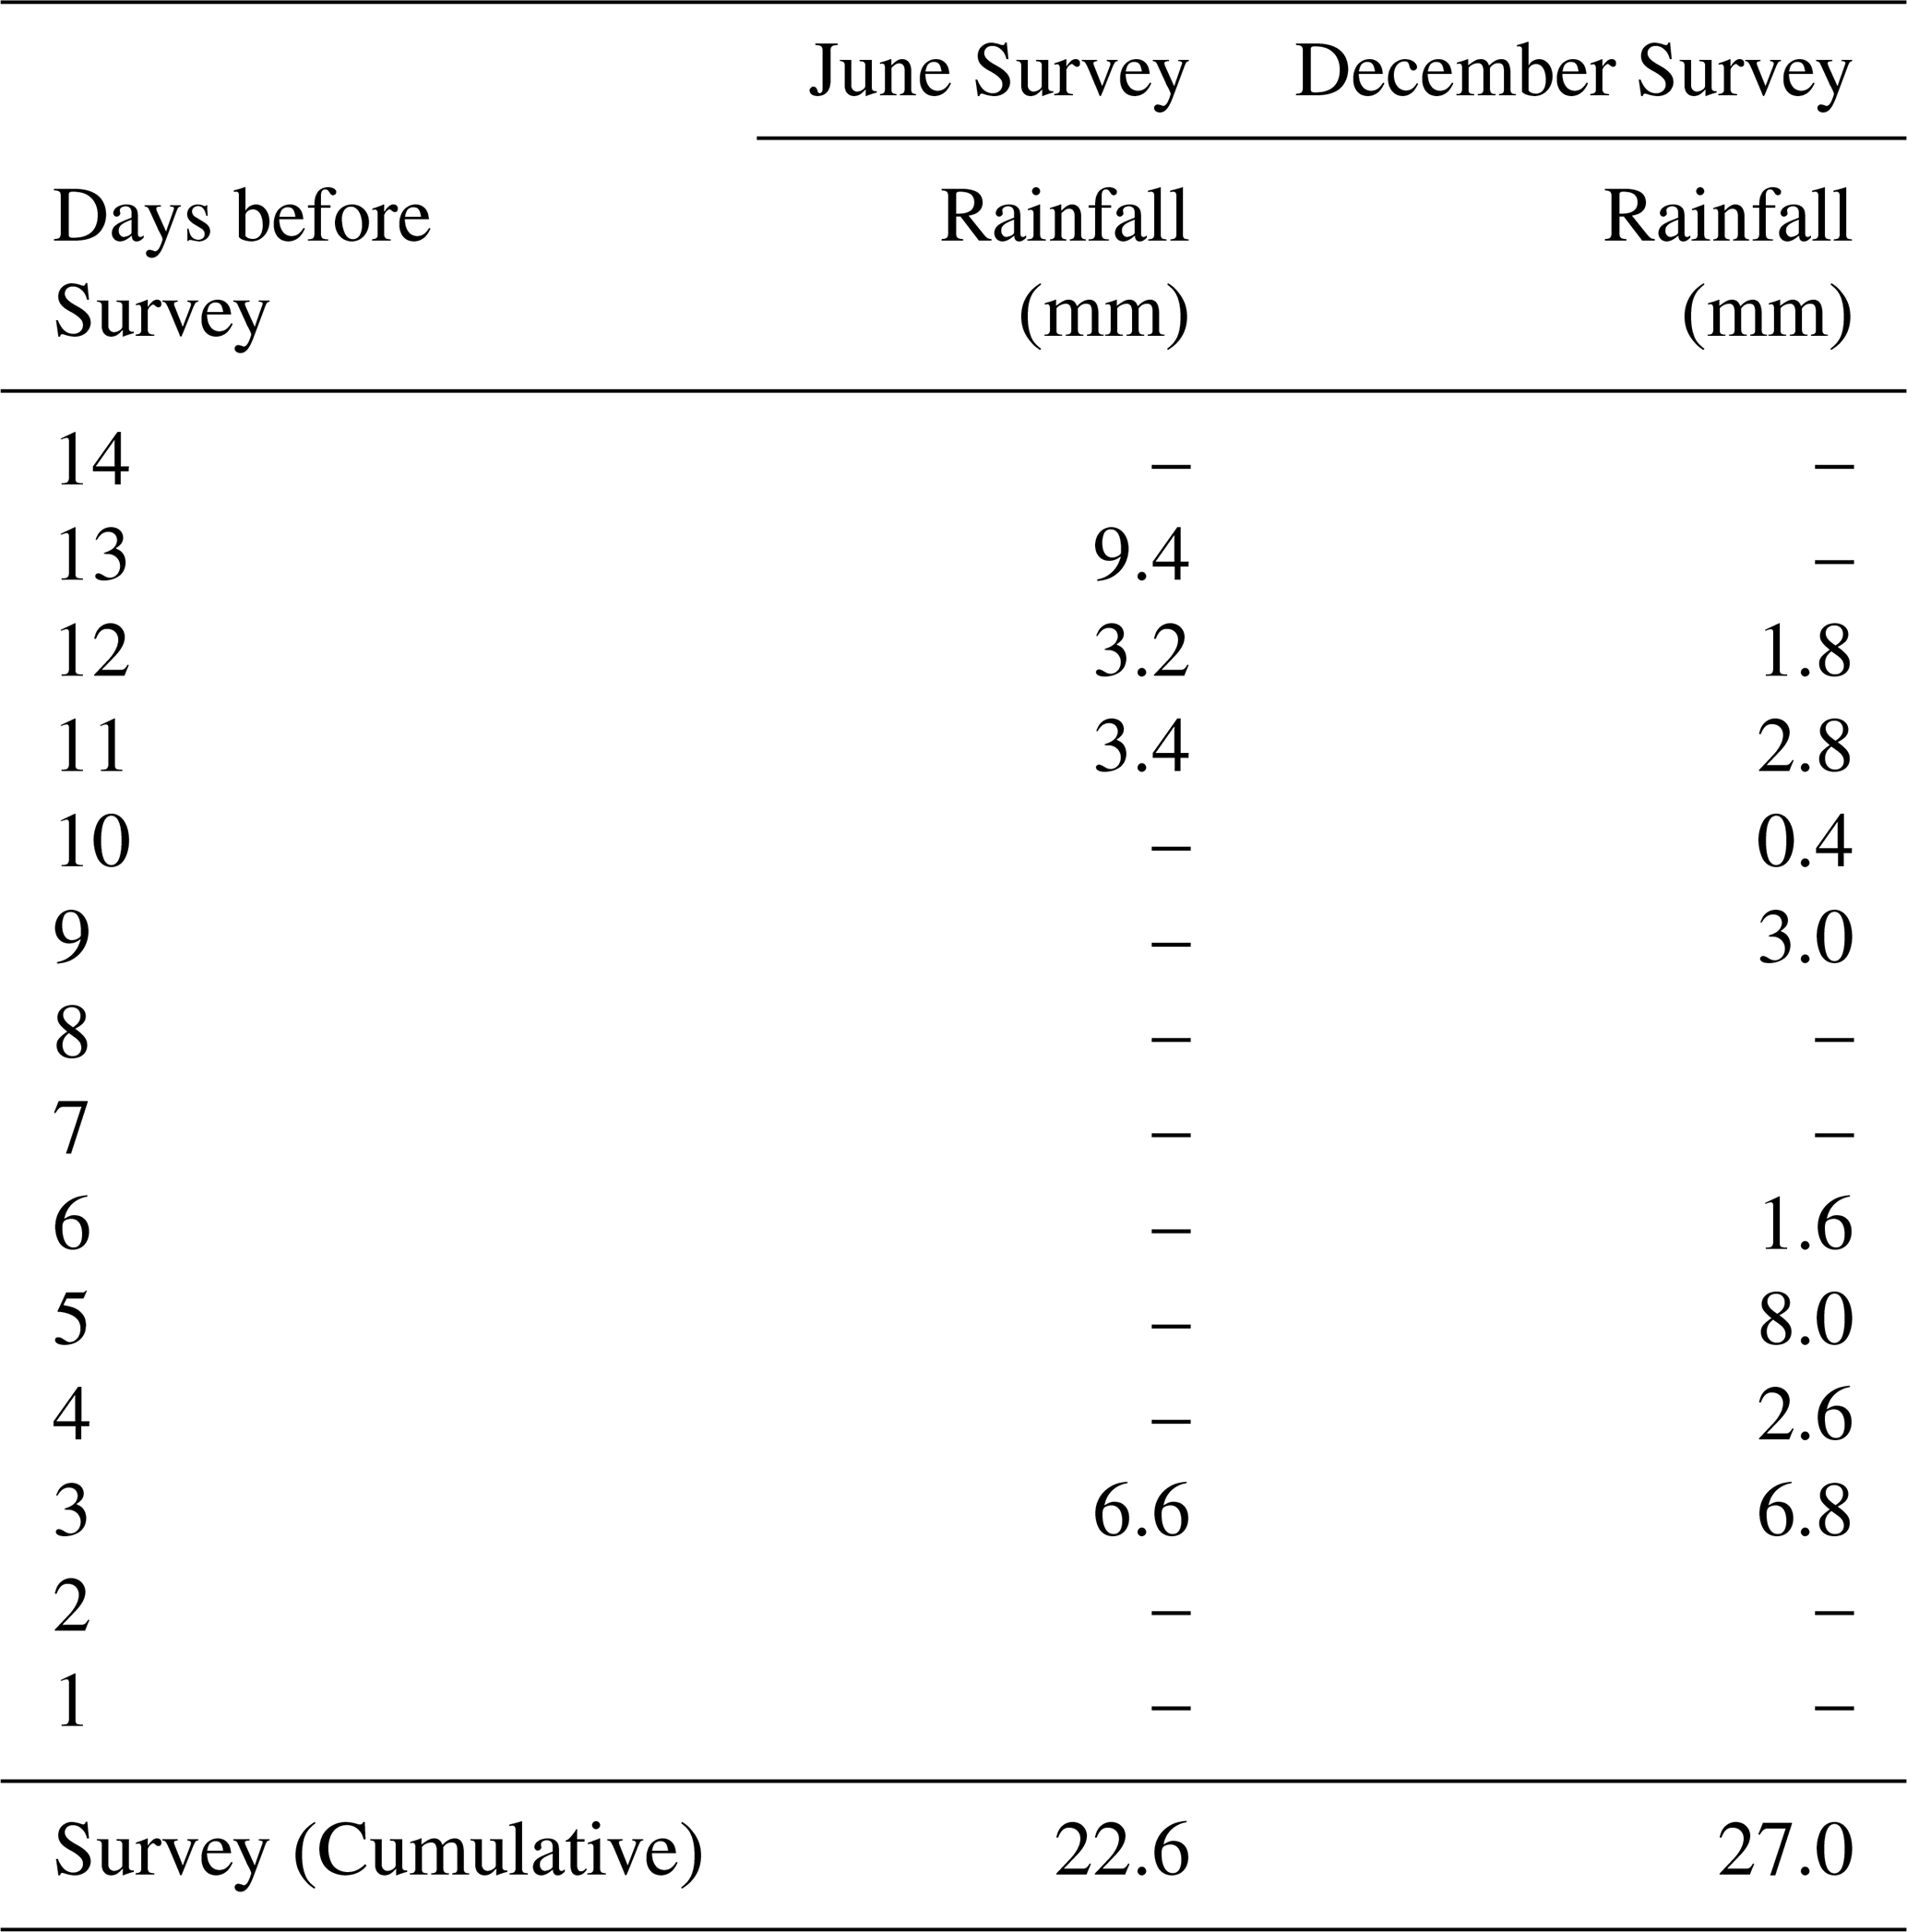
Generally, the meteorological condition in Ireland reported that the spring and summer were cool and dry (Met Eireann, 2024) and that autumn and winter were mild with below average rainfall (Met Eireann, 2025). Meteorological data from 14 d prior to each EMI survey (Table 1) show that the cumulative rainfall at both survey dates was not significantly different (∼ 5 mm), however the December survey had increased number of rainfall occurrences closer in time to the EMI survey, compared to June.
Table 1Recorded rainfall in two weeks prior to each EMI survey date.
3.1.2 WTD in Rewet(W) and Control (C) areas
The standard deviation of the 15 min interval recorded WTD for all dip-wells on 26 June 2024 (June) was between 0.1 and 0.6 cm and between 0.1 and 0.7 cm on 10 December 24 (December) confirming a temporally stable water table during acquisition, indicating that the daily mean WTD from each dip-well is appropriate for comparison with EMI survey results. Surface elevation data (Table 2) are taken from the point where the dip-well is at the surface and shows a standard deviation of ∼ 20 cm across this site, however it is noted that the control area has significantly less topographical variation than the rewetted area. This indicates the field is relatively flat and therefore topography is not considered in further analysis. Daily mean WTD data from each well during June and December dates (Table 2) indicate a spatially consistent WTD across this field (standard deviation ∼ 3 cm). The exception to this is W1, which shows a deeper WTD. This well is fully screened from the peat through to the underlying mineral subsoil, likely capturing a composite water level dominated by the substrate, rather than the peat layer and is therefore is removed from analysis. There is a difference in the WTD of 0.3 m in the peat layer (without W1) between the two dates with the water level 0.67 m below the surface during June survey and 0.37 m below the surface on the December survey. Finally, the Rewet (W) and Control (C) experimental areas of this site have very similar WTD (with W1 removed) during both June and December surveys, indicating that open drain damming is not affecting the WTD in the area where the W wells are placed.
Table 2Average surface elevation, perpendicular distance from open drain, daily and site average water table depth coincident with geophysical acquisition dates. Note W1 data is removed from analysis as it penetrates below the peat layer.
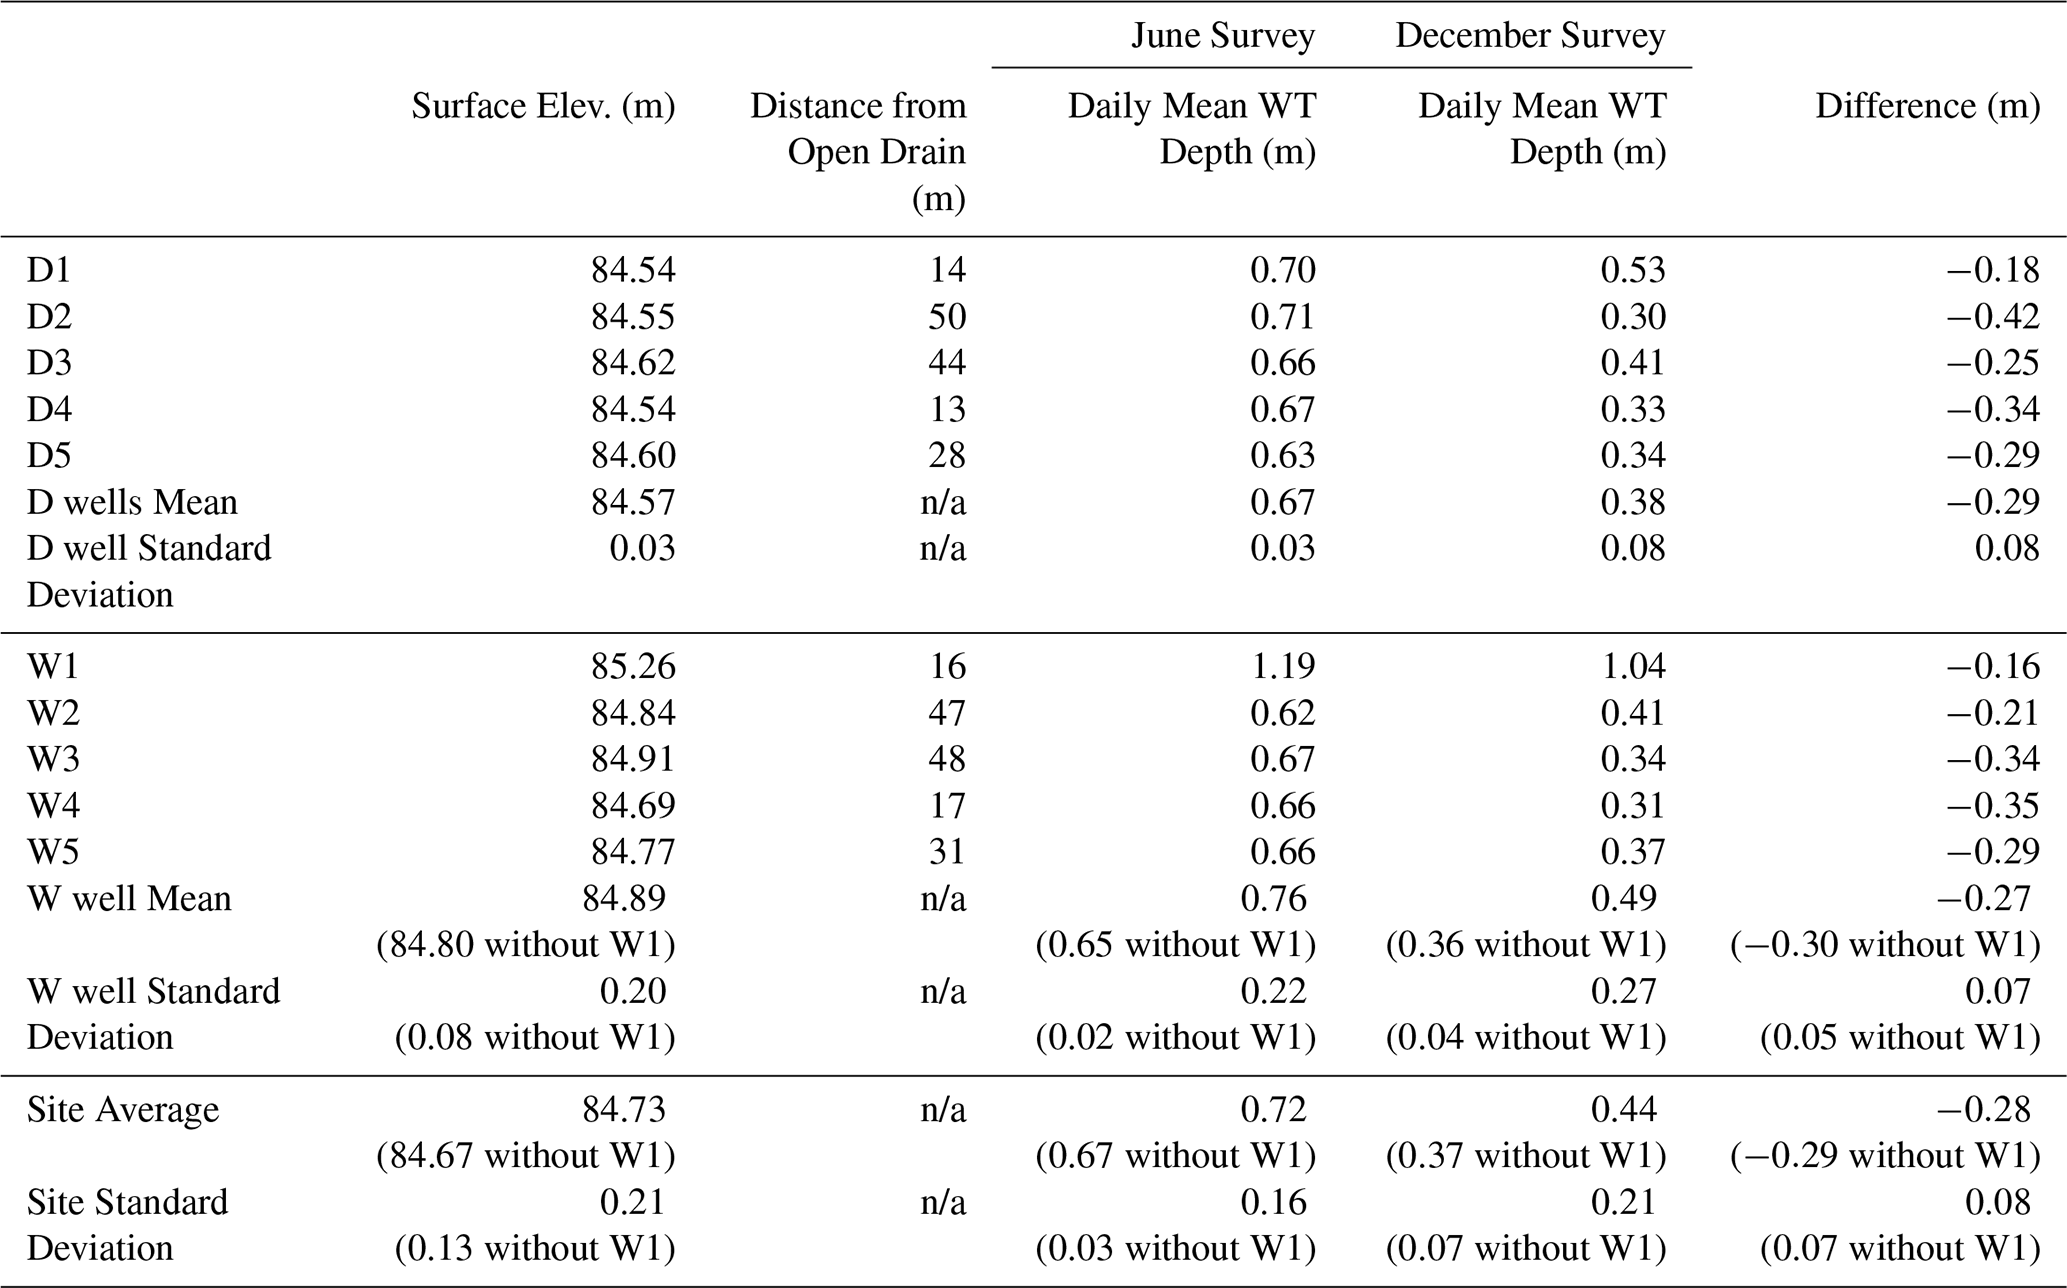
n/a – not applicable. Difference (m) relates to difference between June and December surveys.
3.1.3 Volumetric Water Content %
The standard deviation of 15 min recorded VWC measurements for both probes during the June survey was <1 % and <2.5 % on the December survey, confirming temporally stable soil moisture conditions during EMI acquisition and indicating that the daily mean VWC with depth from each probe is appropriate for comparison with EMI survey results. Full saturation of the peat soils is achieved and measured as an average VWC of 99.9 %, indicative of high porosity, low bulk density peat soils being fully saturated with water (Galvin, 1976).
The daily mean of the VWC data are plotted at 15 cm increments for each probe (Fig. 3), coinciding with EMI acquisition dates. These results are also plotted alongside the WTD for the peat soil layer for comparison. VWC from both June and December dates follow a similar trend, with both W and C sides reaching full saturation within 0.30–0.45 m depth on the June survey date. VWC in the C area shows a slight deeper full saturation (0.45–0.60 m) depth on the December survey date. Generally, the VWC has increased by ∼ 10 % on the December survey compared to June survey in both areas. The C area in the December survey shows a large decrease in VWC between 0.15 and 0.30 m (Fig. 3B). During the June survey, the site-averaged WTD is approx. 0.2 m below the depth of full saturation (0.30–0.45 m), whereas during the December survey, the WTD is similar to the depth of full saturation.
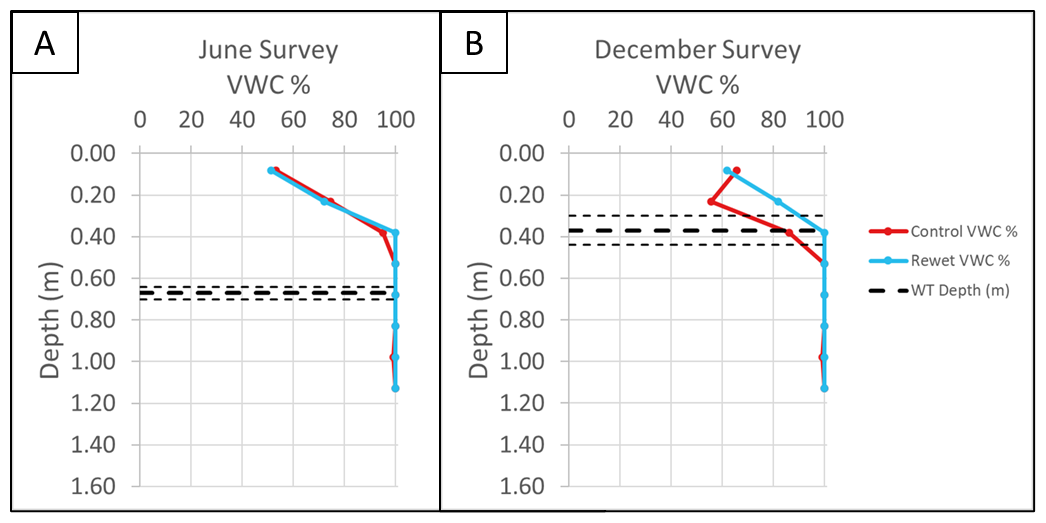
Figure 3(A) 26 June 2024 averaged volumetric water (VWC) content % vs. depth for the Rewet (W) and Control (C) zones. (B) 10 December 2024 averaged VWC % vs. depth for the W and C zones. Both (A) and (B) are shown with their respective site averaged and standard deviation of WTD. Note that full saturation refers to a reading of 99.9 % VWC indicative of a fully saturated peat soil.
3.2 Open drain water measurements
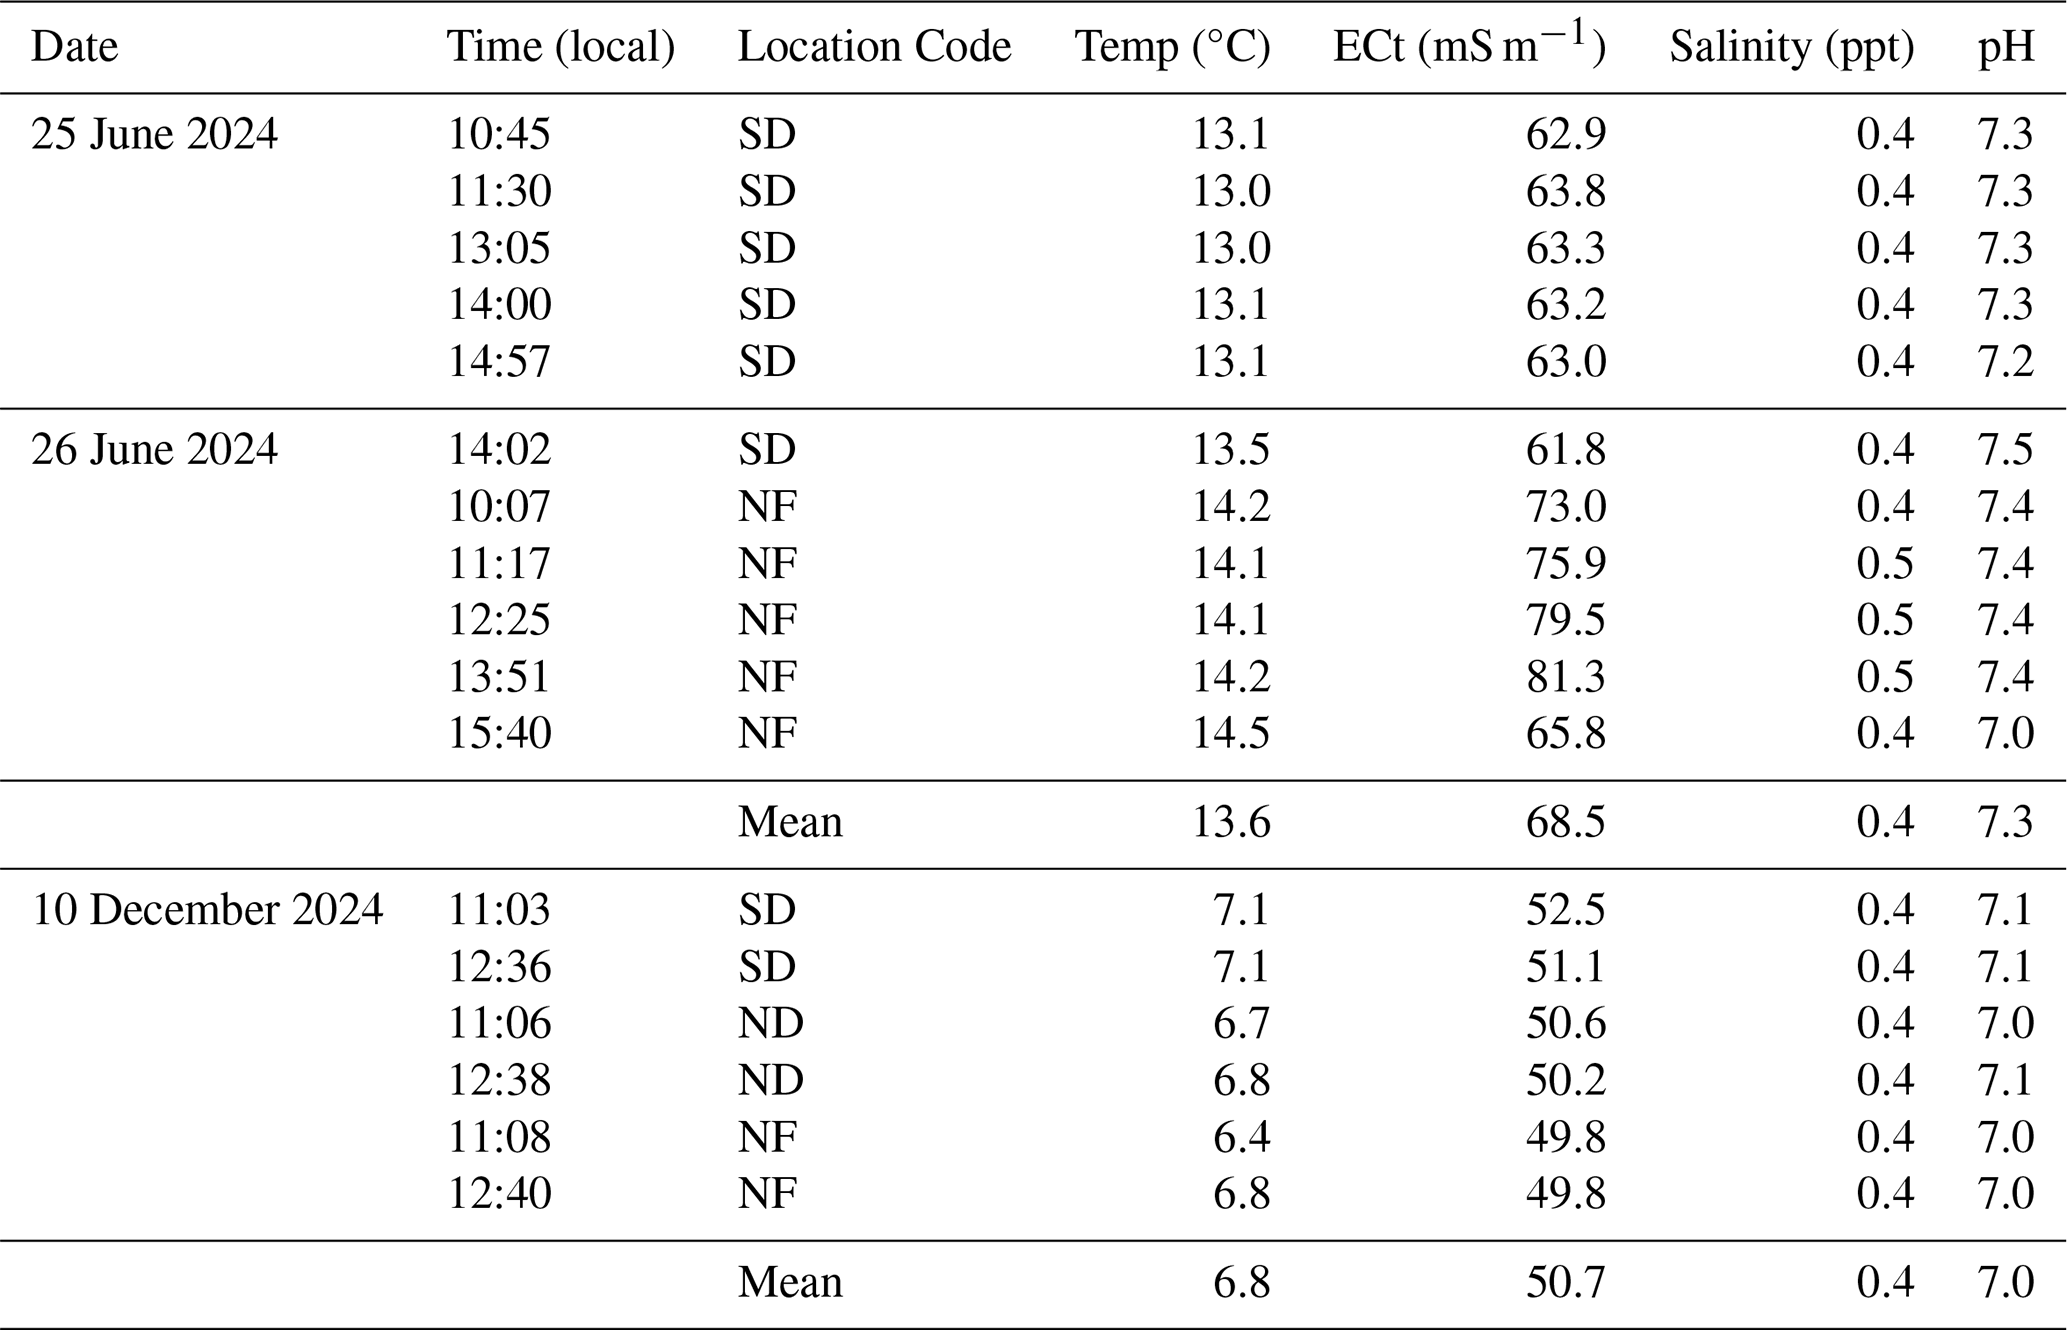
Multi-Parameter probe (YSI, 2025) measurement indicates that the electrical properties of the water in the open drain were stable during both EMI survey days (Table 3). The main difference in measurements in the open drain between EMI survey days are temperature and electrical conductivity (mS m−1). These readings show that the water temperature in the open drain during the December survey was ∼ 7 °C colder than the June survey. Similarly, electrical conductivity of the open drain water in December is ∼ 20 mS m−1 lower than during the June survey, most likely attributed to the temperature difference between the dates (Corwin and Lesch, 2005) along with any changes in the composition of the open drain water due to run-off upstream. This value was not corrected to a standard temperature in order to compare to the respective EMI survey. The other measured properties (salinity and pH) are similar for both June and December surveys.
Table 3Multi-Parameter probe results. Electrical Conductivity is measured in milli-Siemens per metre (mS m−1) SD = south of dam, NF = north of flume, SF = south of flume.
3.3 Electromagnetic induction
3.3.1 ECa
The processing flow (Sect. “Data processing, clustering, and Inversion”) was applied to five data layers for both EMI surveys and resulted in 1266 (June) and 1283 (December) distinct ECa measurements across the site (Fig. 4).
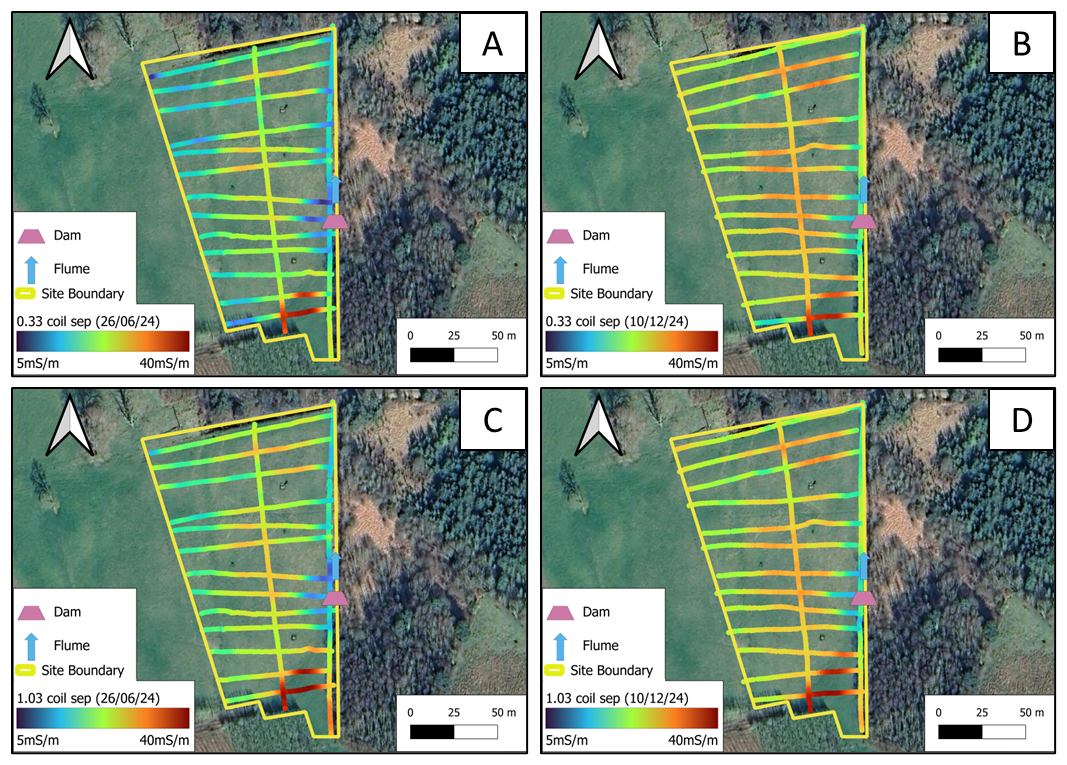
Figure 4Processed EMI ECa data from. (A) 26 June 2024 – 0.33 m coil separation (∼ 0.5 m depth, (B) 10 December 2024 – 0.33 m coil separation, (C) 26 June 2024 – 1.03 m coil separation (∼ 1.5 m depth), (D) 10 December 2024 – 1.03 m coil separation. Basemap © Google Maps 2019.
The EMI survey data show a general lowering of ECa from June to December surveys (similar to Multi-Parameter probe results). Spatial and vertical distribution patterns of ECa measurements are similar in both June and December surveys. An area of low ECa is present to the south of the site, which corresponds to reduced thickness of the peat soil layer (Fig. 2B). Both surveys also show the presence of relatively high ECa measurements in proximity to the installed dam and flume to the east of the site, although the contrast in ECa values is greater in the June compared to the December survey.
3.3.2 Clustering and Inversion
MCASD metrics indicated that five clusters were appropriate for both June and December EMI survey data (Fig. 5A, B). In both cases, a lower number of clusters (one to four) had lower MCASD stability metrics, indicating a good clustering solution. The 5-cluster result, and higher cluster number, resulted in large instability of the cluster centres indicating a poor clustering solution.
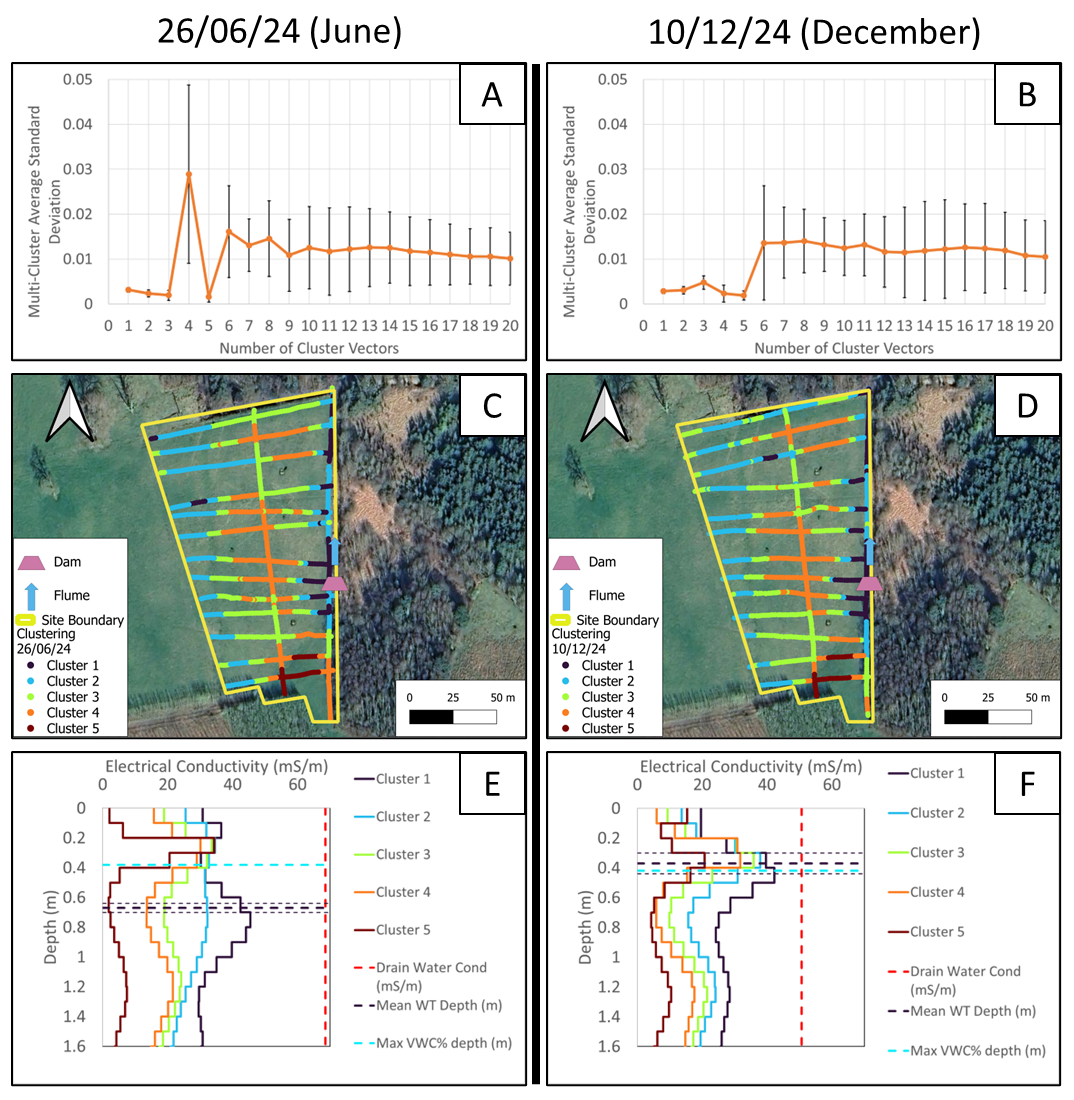
Figure 5Clustering and inversion results for summer (left) and winter (right) surveys. (A, B) MCASD graphs indicating the appropriate number of clusters. (C, D) Spatial distribution of clusters. (E, F) 1D inverted cluster centres including site averaged water table depth and VWC % max saturation depth. Basemap © Google Maps 2019.
The spatial distribution of the 5-cluster results for both survey days (Fig. 5C, D) is coloured to match the corresponding inverted cluster centre (Fig. 5E, F) and indicate areas of similar ECt. The spatial distribution of the clustered data is very similar on both survey dates, with cluster numbers from the June comparable to cluster numbers from the December survey. Cluster 5 (both June and December surveys) has good agreement with the area of thinner peat (Fig. 2B). Cluster 1 is located in the area of higher ECa noted in both June and December surveys close to the dam and flume (Fig. 4), which is considered the area affected by rewetting measures. Cluster 2 is located at the eastern and western edges of the site, with clusters 3 and 4 distributed through the middle of the site.
All cluster centre data were successfully inverted (Fig. 5E, F), with an average Root Mean Squared Error (RMSE) between acquired and forward modelled ECa of 0.15 mS m−1 (June survey) and 0.28 mS m−1 (December survey). Figure 5 illustrates the inverted cluster centre data alongside the site averaged peat soil WTD (from Table 2), depth of full saturation (from Fig. 3), and electrical conductivity of the open drain (from Table 3) for each survey date. Generally, the inverted clusters have a similar ECt in the top ∼ 0.40 m of the surface, during the respective survey dates. This corresponds to the depth where the soil is not fully saturated based on VWC results (Fig. 3). Below this depth, in the June survey, the WTD is relatively deep and there is large variation between the ECt across the clusters. In the December survey, with a relatively shallow WTD, this variation is reduced, resulting in more uniform vertical distribution of ECt across the clusters. Cluster 5 represents an area of thin peat and so is difficult to compare to the other cluster results. However, this cluster is comparable between the two survey dates. Below the depth of max saturation, the ECt results are very similar. Above this depth, there are significant differences in the ECt results, indicating a difference in the shallow peat soil electrical conductivity between survey dates. This seasonal variation is captured in all cluster centre results in this shallow area, above the depth of max saturation. On both survey dates, Cluster 1 ECt values are closer to the electrical conductivity values measured in the open drain (red dashed vertical line) compared to other cluster ECt values (Fig. 5E, F). This is particularly notable in the June survey data (Fig. 5E). Cluster 2 ECt results also appears to be notably different from the other clusters, particularly during the June survey, appearing as intermediate values between Cluster 1 and Clusters 3 and 4.
4.1 Water table depth
Low hydraulic conductivity of peat soils (Galvin, 1976) combined with the tendency for fen peats to be controlled by landscape water table dynamics, indicates that open drains have limited ability to effectively drain such grassland fen peat sites (Tuohy et al., 2023). It is therefore assumed that damming such open drains will also have limited spatial effect on rewetting. This is evident on this fen site by the WTD differences noted between survey dates in this study (Table 2), which appear to be controlled by landscape water table dynamics as opposed to any local water table control attempts (i.e., open drain and dam).
In this experiment, the individual locations of the dip wells were designed to act as a partial spatial assessment of open drain damming effect, whereby W wells closer to the dam were expected to be more affected than W wells further away. This experimental design also assumes the main drainage is taking place via direct discharge into the open drain. The WTD was stable across the study site during both the summer and winter survey dates (Table 2), with no indication that drain damming was affecting the WTD in the rewet area. The closest dip well to the open drain dam, taken to be the combined effect of the dam and flume installations, is well W4 (Fig. 2A) with a perpendicular distance of ∼ 17 m from the open drain, and a line-of-sight distance of ∼ 20 m from the dam and ∼ 30 m from the flume. A study on raised bogs from Norway concluded that the spatial influence of drain damming was 17.2 m (Stachowicz et al., 2025) and a study on agricultural fen peats from Germany concluded a more modest estimate of “a few metres” of spatial impact from drain dam due to low hydraulic conductivity of peat soils (Heller et al., 2025). Tuohy et al. (2023) undertook a review of various geographic, peat soil and drainage system combinations and conclude that the effective drainage is spatially constrained to within a few metres of the drain, which would infer a similar constraint when damming an open drain. The results shown here (Table 2) appear to agree with these findings with no spatial influence of drain damming evident in water table depths across the site during either the summer or winter survey dates.
4.2 Controls on Volumetric Water Content %
Peat soils have a very high porosity, low bulk density and tend to have high VWC (Galvin, 1976; Holden, 2005). The specific yield, or the amount of water expected to be stored as the WTD is lowered, for peat soils is also expected to be very high due to capillary action holding the water within the matrix of the peat soil (Galvin, 1976; Pierce et al., 2025). This can result in peat soils storing large quantities of water, even above the WTD (Holden, 2005; Price et al., 2003) and such an effect can be seen at this site, particularly during the summer survey date (Fig. 3).
During the June survey, both the W and C experimental areas of the site show similar VWC vertical profiles with depth, indicating no difference between these areas. During the December survey date, there is a general reduction in the VWC (∼ 10 %) for the C area VWC vertical profile compared to the W area (Fig. 3) and a sharp reduction in VWC at ∼ 0.20 m depth. While this result may be attributed to successful rewetting efforts, the WTD results (Table 2) do not support this conclusion. Therefore, it is assumed this result is due to WTD being close to the surface, allowing for the drainage of water via in-field drains, which are understood to be located ∼ 8 m from the location of the VWC probe, acting to lower the VWC in the C experimental area.
However, VWC, combined with WTD and meteorological information, may provide an insight into the success of a rewetting method. A study from Germany concluded that precipitation on drained/degraded fen peat soils had a greater influence on WTD compared to a rewetted fen peat (Ahmad et al., 2021), due to specific yield and water storage capacity differences. In this Irish example of a fen peat soil, there doesn't appear to be a difference in VWC, or WTD, between the W and C experimental areas when analysed here in a static manner. However, analysis of temporal dynamics and relationship between WTD, rainfall and VWC is needed.
4.3 Temporal EMI surveys with cluster guided Inversion
The use of EMI surveys, combined with clustering and MCASD, has provided a quick and data driven means to return an understanding of the ECt variation on this site, spatially, vertically, and temporally. This is often difficult to achieve on spatial EMI datasets due to the complexity in performing a full 3D inversion on EMI data (O'Leary et al., 2024) due to volume of data to be inverted and restrictions in performing in-field calibration of EMI instruments, with studies often opting to use ECa as the primary measurement (Brogi et al., 2019). ECa can give an indication of soil property variation spatially across a site (Fig. 4), however ECt are needed to study the vertical variation (Fig. 5). The use of representative 1D ECa data (cluster centres) simplifies the inversion process and still provides representative distribution of ECt across this site. This vertical variation can also be better understood by undertaking a repeat survey, such as done here. Physical properties of the soil, such as peat layer thickness and soil texture, are not expected to change from one survey to the other, and so any variation in the electrical conductivity may be attributed to hydrological changes within the subsurface (WTD or water content changes). While this would be particularly impactful for an EMI survey performed prior to and after dam installation, the methodology and results of this study effectively demonstrate the ability of temporal EMI surveys to identify areas of hydrological change. It should be noted that other soil characteristics which change on similar timescales, such as compaction, may influence temporal EMI survey results, however no evidence of additional influencing factors (e.g., iron, saline intrusion) are present in this study.
One of the assumptions of rewetting is that by damming the open drain water will infiltrate into the surrounding soils, effectively rewetting them (Heller et al., 2025). Therefore, it can be assumed that some physical properties of this open drain water will be present in the water content of these infiltrated soils, specifically electrical conductivity. In this study, the inclusion of the Multi-Parameter probe measurements of open drain water electrical conductivity (Table 3) has provided a constraint when interpretating EMI survey results, via a measured ECt for water which is assumed to have infiltrated into the soil. This value is compared to the inverted cluster centre ECt profiles to highlight which areas of the site are impacted by this infiltration. The inclusion of these data, or similar measurement of open drain water electrical conductivity should be included with using EMI measurements to determine the effect of drain damming on agricultural fen peat soils.
Observations from the EMI survey clustering and inversion results show that some impact is observed ∼ 20 m from the open drain immediately upstream of the installed dam and flume (Fig. 5). Although the spatial distribution of the cluster centres (Fig. 5C, D) show a very similar spatial pattern and indicate impact from drain damming on both surveys, the inverted cluster centres (Fig. 5E, F) are not similar. For example, in the June survey, Cluster 1 (Fig. 5E, F) is significantly different to the other cluster numbers, with ECt values at the depth of the mean water table to be closer to the measured electrical conductivity of the open drain (Table 3). During the June survey, the WTD in the field is deeper, thereby creating a large gradient between the in-field WTD position and the open drain water level. Water from the open drains infiltrates into the subsoil of the adjoining field, immediately around the dam and flume, resulting in electrical conductivity readings being closer to that of the water in the open drain. While this effect is still present in the December survey, it is not as obvious. This is due to the shallower WTD, and so less infiltration of the water in the open drain into the surrounding soils. This would result in the pore water content being proportionally more ground water influenced, resulting in the electrical conductivity (Henrion et al., 2024), of the peat soil layer to be more uniform in winter across the site, as observed in this study.
The inclusion of VWC data, and the subsequent comparison to WTD, can be used to constrain the interpretation of EMI survey results across a site as electrical conductivity is sensitive to water content. They provide an understanding of the hydrological status of peat soils at the time of the survey. EMI surveys can also be used to determine other peat soil characteristics, such as peat depth. Cluster 5 (Fig. 5), which is present in both June and December surveys, is linked to the area of thinner peat. The inclusion of the temporal element of this study allows for the identification of this cluster as one of little hydrological change between these survey dates, leading to focused analysis of this cluster. EMI surveys in combination with peat depth via probe campaigns should be done prior to any rewetting efforts as they can cover large areas quickly and can yield spatial information on peat soil characteristic changes.
EMI surveys, when combined with clustering and inversion, can provide a means to assess the impact of rewetting by assessing areas of high hydrological change through the inclusion of multiple repeat surveys. While the most intra-site variation is present during the June survey, when the water table is low, and the effect of infiltrated water from the open drain is evident, the temporal analysis highlights areas of hydrological change between seasons, which can be employed to help determine the optimum location for monitoring instruments, maximising the ability to monitor rewetting efforts over time.
This study demonstrates that EMI surveys can effectively assess spatial impacts of drain damming on agricultural fen peat soils. EMI results revealed localised infiltration from the dammed open drain within approximately 20 m, particularly during the summer survey, aided by the use of neural network clustering and Multi-Cluster Average Standard Deviation analysis. The EMI survey results were constrained by the presence of WTD, VWC, open drain water electrical conductivity, and peat depth information across this site. A significant observation from this study is the influence of seasonal timing on rewetting assessments. EMI surveys, conducted during deeper water table conditions, provided clearer evidence of drain damming impact compared to surveys where increased precipitation and regional groundwater dynamics masked localised effects. This emphasises that survey timing is crucial for detecting rewetting effects in peat soils. The results also highlight practical applications for rewetting projects. If performed prior to rewetting, EMI surveys can inform more effective placement of drain damming structures, maximising the potential impact. These surveys can also guide the strategic installation of dip wells for long-term monitoring, ensuring they are placed within zones most likely to experience hydrological change. Overall, this study demonstrates how combining geophysical methods with modern data analytics can provide rapid, spatially comprehensive assessments of rewetting impact. By illustrating the strengths of EMI for rewetting monitoring, this work supports the adoption of geophysical techniques in peatland restoration projects. More broadly, it contributes to improving the effectiveness of nature-based solutions for climate change mitigation and sustainable land management.
The code used in this article is available upon request directly to the authors. The code is not currently publicly access-able as it requires modification to make it suitable for general usage.
The underlying data used in this article is available upon request directly to the authors. Currently the data is not publicly access-able as it contains specific location information related to private property.
DO'L: Conceptualisation, Formal analysis, Methodology, Visualization, Writing – original draft preparation. AS: Data curation, Resources. PT: Funding acquisition, Project administration, Writing – review & editing. OF: Funding acquisition, Conceptualisation, Writing – review & editing. MH: Funding acquisition, Writing – review & editing. HP: Investigation, Writing – review & editing. ED: Conceptualization, Funding acquisition, Supervision, Writing – review & editing.
At least one of the (co-)authors is a guest member of the editorial board of SOIL for the special issue “Agrogeophysics: illuminating soil's hidden dimensions”. The peer-review process was guided by an independent editor, and the authors also have no other competing interests to declare.
Publisher's note: Copernicus Publications remains neutral with regard to jurisdictional claims made in the text, published maps, institutional affiliations, or any other geographical representation in this paper. While Copernicus Publications makes every effort to include appropriate place names, the final responsibility lies with the authors. Views expressed in the text are those of the authors and do not necessarily reflect the views of the publisher.
This article is part of the special issue “Agrogeophysics: illuminating soil's hidden dimensions”. It is not associated with a conference.
This article contains Irish Public Sector Data (Teagasc) licensed under a Creative Commons Attribution 4.0 International (CC BY 4.0) licence. Access to Local field sites data was provided by Teagasc. The authors wish to thank Asaf Shnel (Teagasc) for providing the Peat depth data, and the landowner for access to their agricultural land (ReWET site). All code is available via standard MATLAB © Deep Learning toolboxes.
This research has been supported by the Department of Agriculture, Food and the Marine, Ireland (grant no. 2021R454).
This paper was edited by Dongxue Zhao and reviewed by two anonymous referees.
Adetsu, D. V., Koganti, T., Petersen, R. J., Pedersen, J. B., Zak, D., Greve, M. H., and Beucher, A.: Sensor-based peat thickness mapping of a cultivated bog in Denmark, Geoderma, 452, 117091, https://doi.org/10.1016/j.geoderma.2024.117091, 2024.
Ahmad, S., Liu, H., Alam, S., Günther, A., Jurasinski, G., and Lennartz, B.: Meteorological Controls on Water Table Dynamics in Fen Peatlands Depend on Management Regimes, Frontiers in Earth Science, 9, https://doi.org/10.3389/feart.2021.630469, 2021.
Altdorff, D., Bechtold, M., Van Der Kruk, J., Vereecken, H., and Huisman, J. A.: Mapping peat layer properties with multi-coil offset electromagnetic induction and laser scanning elevation data, Geoderma, 261, 178–189, https://doi.org/10.1016/j.geoderma.2015.07.015, 2016.
Baird, A. J. and Low, R. G.: The water table: Its conceptual basis, its measurement and its usefulness as a hydrological variable, Hydrol. Process., 36, e14622, https://doi.org/10.1002/hyp.14622, 2022.
Binley, A., Hubbard, S., Huisman, J., Revil, A., Robinson, D., Singha, K., and Slater, L.: The emergence of hydrogeophysics for improved understanding of subsurface processes over multiple scales, Water Resources Research, 51, 3837–3866, https://doi.org/10.1002/2015WR017016, 2015.
Blanchy, G., Watts, C. W., Richards, J., Bussell, J., Huntenburg, K., Sparkes, D. L., Stalham, M., Hawkesford, M. J., Whalley, W. R., and Binley, A.: Time-lapse geophysical assessment of agricultural practices on soil moisture dynamics, Vadose Zone J., 19, e20080, https://doi.org/10.1002/vzj2.20080, 2020.
Boaga, J.: The use of FDEM in hydrogeophysics: A review, Journal of Applied Geophysics, 139, 36–46, https://doi.org/10.1016/j.jappgeo.2017.02.011, 2017.
Brogi, C., Huisman, J. A., Patzold, S., Von Hebel, C., Weihermuller, L., Kaufmann, M. S., Van Der Kruk, J., and Vereecken, H.: Large-scale soil mapping using multi-configuration EMI and supervised image classification, Geoderma, 335, 133–148, https://doi.org/10.1016/j.geoderma.2018.08.001, 2019.
Corwin, D. L. and Lesch, S. M.: Apparent soil electrical conductivity measurements in agriculture, Comput. Electron. Agr., 46, 11–43, https://doi.org/10.1016/j.compag.2004.10.005, 2005.
Department of Environment and Climate Change (DECC): Climate Action Plan 2024: https://www.gov.ie/en/publication/79659-climate-action-plan-2024/ (last access: 28 July 2024), 2024.
Doolittle, J. A. and Brevik, E. C.: The use of electromagnetic induction techniques in soils studies, Geoderma, 223, 33–45, https://doi.org/10.1016/j.geoderma.2014.01.027, 2014.
EMTOMO: EM4Soil: Software for Electromagnetic Tomography, http://www.emtomo.com/home/ (last access: 28 July 2023), 2013.
EU: Nature restoration law – For people, climate, and planet, Publications Office of the European Union, https://doi.org/10.2779/86148, 2022.
Everett, M. E. and Chave, A. D.: On the physical principles underlying electromagnetic induction, Geophysics, 84, W21–W32, https://doi.org/10.1190/geo2018-0232.1, 2019.
FAO: Peatland mapping and monitoring, FAO, Rome, Italy, 82 pp., https://doi.org/10.4060/ca8200en, 2020.
Fluet-Chouinard, E., Stocker, B. D., Zhang, Z., Malhotra, A., Melton, J. R., Poulter, B., Kaplan, J. O., Goldewijk, K. K., Siebert, S., Minayeva, T., Hugelius, G., Joosten, H., Barthelmes, A., Prigent, C., Aires, F., Hoyt, A. M., Davidson, N., Finlayson, C. M., Lehner, B., Jackson, R. B., and Mcintyre, P. B.: Extensive global wetland loss over the past three centuries, Nature, 614, 281–286, https://doi.org/10.1038/s41586-022-05572-6, 2023.
Fossitt, J. A. and Heritage, C.: A Guide to Habitats in Ireland, Heritage Council of Ireland series, Heritage Council/Chomhairle Oidhreachta, https://www.npws.ie/sites/default/files/publications/pdf/A Guide to Habitats in Ireland - Fossitt.pdf (last access: 2 December 2025), 2000.
Galvin, L. F.: Physical-Properties of Irish Peats, Irish J. Agr. Res., 15, 207–221, http://www.jstor.org/stable/25555820 (last access: 2 December 2025), 1976.
Garré, S., Hyndman, D., Mary, B., and Werban, U.: Geophysics conquering new territories: The rise of “agrogeophysics”, Vadose Zone J., 20, e20115, https://doi.org/10.1002/vzj2.20115, 2021.
GF Instruments: CMD Electromagnetic conductivity meter user manual V. 1.5 & 2.1: http://www.gfinstruments.cz/index.php?menu=gi&cont=cmd_ov, last access: 1 August 2023.
Gilet, L., Morley, T. R., Flynn, R., and Connolly, J.: An adaptive mapping framework for the management of peat soils: A new Irish peat soils map, Geoderma, 447, 116933, https://doi.org/10.1016/j.geoderma.2024.116933, 2024.
Habib, W. and Connolly, J.: A national-scale assessment of land use change in peatlands between 1989 and 2020 using Landsat data and Google Earth Engine – a case study of Ireland, Regional Environmental Change, 23, 124, https://doi.org/10.1007/s10113-023-02116-0, 2023.
Heller, S., Tiemeyer, B., Oehmke, W., Gatersleben, P., and Dettmann, U.: Wetter, but not wet enough – Limited greenhouse gas mitigation effects of subsurface irrigation and blocked ditches in an intensively cultivated grassland on fen peat, Agricultural and Forest Meteorology, 362, 110367, https://doi.org/10.1016/j.agrformet.2024.110367, 2025.
Henrion, M., Li, Y., Koganti, T., Bechtold, M., Jonard, F., Opfergelt, S., Vanacker, V., Van Oost, K., and Lambot, S.: Mapping and monitoring peatlands in the Belgian Hautes Fagnes: Insights from Ground-penetrating radar and Electromagnetic induction characterization, Geoderma Regional, 37, e00795, https://doi.org/10.1016/j.geodrs.2024.e00795, 2024.
Holden, J.: Peatland hydrology and carbon release: why small-scale process matters, Philosophical Transactions of the Royal Society A: Mathematical, Physical and Engineering Sciences, 363, 2891–2913, https://doi.org/10.1098/rsta.2005.1671, 2005.
Huth, N. I. and Poulton, P. L.: An electromagnetic induction method for monitoring variation in soil moisture in agroforestry systems, Aust. J. Soil Res., 45, 63–72, https://doi.org/10.1071/SR06093, 2007.
Kaufman, L.: Finding groups in data an introduction to cluster analysis, Wiley-Interscience, Hoboken, N.J., https://doi.org/10.1002/9780470316801, 2005.
Koch, J., Elsgaard, L., Greve, M. H., Gyldenkærne, S., Hermansen, C., Levin, G., Wu, S., and Stisen, S.: Water-table-driven greenhouse gas emission estimates guide peatland restoration at national scale, Biogeosciences, 20, 2387–2403, https://doi.org/10.5194/bg-20-2387-2023, 2023.
Koganti, T., Narjary, B., Zare, E., Pathan, A. L., Huang, J., and Triantafilis, J.: Quantitative mapping of soil salinity using the DUALEM-21S instrument and EM inversion software, Land Degrad. Dev., 29, 1768–1781, https://doi.org/10.1002/ldr.2973, 2018.
Kohonen, T.: Essentials of the self-organizing map, Neural Networks, 37, 52–65, https://doi.org/10.1016/j.neunet.2012.09.018, 2013.
Lindsay, R.: Peatbogs and carbon: a critical synthesis to inform policy developmentin oceanic peat bog conservation and restoration in the context of climate change, RSPB Scotland, https://www.iucn-uk-peatlandprogramme.org/sites/default/files/2024-03/Peatbogs_and_carbon.pdf (last access: 2 December 2025), 2010.
Lourenco, M., Fitchett, J. M., and Woodborne, S.: Peat definitions: A critical review, Progress in Physical Geography: Earth and Environment, https://doi.org/10.1177/03091333221118353, 2022.
McNeill, J. D.: Electromagnetic terrain conductivity measurement at low induction numbers, Geonics Technical Note TN-6, https://geonics.com/pdfs/technicalnotes/tn6.pdf (last access: 28 July 2024), 1980.
Met Eireann: Climate Statement for Summer 2024, https://www.met.ie/climate-statement-for-summer-2024 (last access: 28 July 2025), 2024.
Met Eireann: Climate Statement for Winter 2024/2025, https://www.met.ie/ga/climate-statement-for-winter-2024-2025 (last access: 28 July 2025), 2025.
Minasny, B., Adetsu, D. V., Aitkenhead, M., Artz, R. R. E., Baggaley, N., Barthelmes, A., Beucher, A., Caron, J., Conchedda, G., Connolly, J., Deragon, R., Evans, C., Fadnes, K., Fiantis, D., Gagkas, Z., Gilet, L., Gimona, A., Glatzel, S., Greve, M. H., Habib, W., Hergoualc'h, K., Hermansen, C., Kidd, D. B., Koganti, T., Kopansky, D., Large, D. J., Larmola, T., Lilly, A., Liu, H., Marcus, M., Middleton, M., Morrison, K., Petersen, R. J., Quaife, T., Rochefort, L., Rudiyanto, Toca, L., Tubiello, F. N., Weber, P. L., Weldon, S., Widyatmanti, W., Williamson, J., and Zak, D.: Mapping and monitoring peatland conditions from global to field scale, Biogeochemistry, https://doi.org/10.1007/s10533-023-01084-1, 2023.
Minsley, B. J., Smith, B. D., Hammack, R., Sams, J. I., and Veloski, G.: Calibration and filtering strategies for frequency domain electromagnetic data, Journal of Applied Geophysics, 80, 56–66, https://doi.org/10.1016/j.jappgeo.2012.01.008, 2012.
Moghadas, D., Jadoon, K. Z., and Mccabe, M. F.: Spatiotemporal monitoring of soil water content profiles in an irrigated field using probabilistic inversion of time-lapse EMI data, Advances in Water Resources, 110, 238–248, https://doi.org/10.1016/j.advwatres.2017.10.019, 2017.
Monteiro, A., Santos, S., and Gonçalves, P.: Precision Agriculture for Crop and Livestock Farming-Brief Review, Animals, https://doi.org/10.3390/ani11082345, 2021.
Monteverde, S., Healy, M. G., O'leary, D., Daly, E., and Callery, O.: Management and rehabilitation of peatlands: The role of water chemistry, hydrology, policy, and emerging monitoring methods to ensure informed decision making, Ecological Informatics, 69, 101638, https://doi.org/10.1016/j.ecoinf.2022.101638, 2022.
O'Leary, D., Brown, C., Healy, M. G., Regan, S., and Daly, E.: Observations of intra-peatland variability using multiple spatially coincident remotely sensed data sources and machine learning, Geoderma, 430, 116348, https://doi.org/10.1016/j.geoderma.2023.116348, 2023.
O'Leary, D., Brogi, C., Brown, C., Tuohy, P., and Daly, E.: Linking electromagnetic induction data to soil properties at field scale aided by neural network clustering, Frontiers in Soil Science, 4, https://doi.org/10.3389/fsoil.2024.1346028, 2024.
O'Leary, D., Brown, C., Hodgson, J., Connolly, J., Gilet, L., Tuohy, P., Fenton, O., and Daly, E.: Airborne radiometric data for digital soil mapping of peat at broad and local scales, Geoderma, 453, 117129, https://doi.org/10.1016/j.geoderma.2024.117129, 2025.
Page, S. E. and Baird, A. J.: Peatlands and Global Change: Response and Resilience, Annu. Rev. Env. Resour., 41, 35–57, https://doi.org/10.1146/annurev-environ-110615-085520, 2016.
Pierce, H., Fenton, O., Daly, E., Shnel, A., O'leary, D., Healy, M. G., and Tuohy, P.: Assessing localised rainfall and water table depth relationships in agricultural grassland peat soils, Science of The Total Environment, 994, 180074, https://doi.org/10.1016/j.scitotenv.2025.180074, 2025.
Price, J., Heathwaite, A., and Baird, A.: Hydrological processes in abandoned and restored peatlands: an overview of management approaches, Wetlands Ecology and Management, 11, 65–83, https://doi.org/10.1023/A:1022046409485, 2003.
Ramsar: Resolution XIII.13, Restoration of degraded peatlands to mitigate and adapt to climate change and enhance biodiversity and disaster risk, “Wetlands for a Sustainable Urban Future” Dubai, United Arab Emirates, 21–29 October 2018, 13th Meeting of the Conference of the Contracting Parties to the Ramsar Convention on Wetlands, https://redd.unfccc.int/uploads/2_230_xiii.13_peatland_restoration_e.pdf (last access: 2 December 2025), 2018.
Romero-Ruiz, A., O'leary, D., Daly, E., Tuohy, P., Milne, A., Coleman, K., and Whitmore, A. P.: An agrogeophysical modelling framework for the detection of soil compaction spatial variability due to grazing using field-scale electromagnetic induction data, Soil Use and Management, 40, e13039, https://doi.org/10.1111/sum.13039, 2024.
Sasaki, Y.: Full 3-D inversion of electromagnetic data on PC, Journal of Applied Geophysics, 46, 45–54, https://doi.org/10.1016/S0926-9851(00)00038-0, 2001.
Stachowicz, M., Lyngstad, A., Osuch, P., and Grygoruk, M.: Hydrological Response to Rewetting of Drained Peatlands – A Case Study of Three Raised Bogs in Norway, Land, https://doi.org/10.3390/land14010142, 2025.
Strack, M., Davidson, S. J., Hirano, T., and Dunn, C.: The Potential of Peatlands as Nature-Based Climate Solutions, Current Climate Change Reports, 8, 71–82, https://doi.org/10.1007/s40641-022-00183-9, 2022.
Tailte Éireann: National Land Cover Map: https://www.epa.ie/our-services/monitoring--assessment/assessment/mapping/national-land-cover-map/ (last access: 2 February 2025), 2023.
Teagasc: ReWET, https://sites.google.com/view/rewet (last access: 10 April 2024), 2023.
Tuohy, P., O' Sullivan, L., Bracken, C. J., and Fenton, O.: Drainage status of grassland peat soils in Ireland: Extent, efficacy and implications for GHG emissions and rewetting efforts, Journal of Environmental Management, 344, 118391, https://doi.org/10.1016/j.jenvman.2023.118391, 2023.
UNEP: Global Peatlands Assessment – The State of the World's Peatlands: Evidence for action toward the conservation, restoration, and sustainable management of peatlands. Main Report, United Nations Environment Programme, Nairobi, https://wedocs.unep.org/bitstream/handle/20.500.11822/41222/peatland_assessment.pdf?sequence=1&isAllowed=y (last access: 2 December 2025), 2022.
UNFCCC: The Paris Agreement, United Nations Framework Convention on Climate Change, https://unfccc.int/documents/184656 (last access: 2 December 2025), 2018.
VanWalt: Peat Probes, https://www.vanwalt.com/equipment/peat-probes/ (last access: 10 April 2024), 2023a.
VanWalt: Russian Auger, https://www.vanwalt.com/equipment/russian-peat-corer-set/ (last access: 1 July 2024), 2023b.
VanWalt: Seametrics LevelSCOUT Smart Sensor, https://www.vanwalt.com/equipment/levelscout/ (last access: 28 January 2025), 2025a.
VanWalt: GroPoint Profile, https://www.vanwalt.com/equipment/gropoint-profile/ (last access: 28 January 2025), 2025b.
Von Hebel, C., Rudolph, S., Mester, A., Huisman, J. A., Kumbhar, P., Vereecken, H., and Van Der Kruk, J.: Three-dimensional imaging of subsurface structural patterns using quantitative large-scale multiconfiguration electromagnetic induction data, Water Resources Research, 50, 2732–2748, https://doi.org/10.1002/2013WR014864, 2014.
Von Hebel, C., Matveeva, M., Verweij, E., Rademske, P., Kaufmann, M. S., Brogi, C., Vereecken, H., Rascher, U., and Van Der Kruk, J.: Understanding Soil and Plant Interaction by Combining Ground-Based Quantitative Electromagnetic Induction and Airborne Hyperspectral Data, Geophysical Research Letters, 45, 7571–7579, https://doi.org/10.1029/2018GL078658, 2018.
Wang, Y., Ksienzyk, A. K., Liu, M., and Brönner, M.: Multigeophysical data integration using cluster analysis: assisting geological mapping in Trøndelag, Mid-Norway, Geophys. J. Int., 225, 1142–1157, https://doi.org/10.1093/gji/ggaa571, 2021.
Wilson, D., Blain, D., Couwenberg, J., Evans, C. D., Murdiyarso, D., Page, S. E., Renou-Wilson, F., Rieley, J. O., Sirin, A., Strack, M., and Tuittila, E. S.: Greenhouse gas emission factors associated with rewetting of organic soils, Mires Peat, 17, https://doi.org/10.19189/MaP.2016.OMB.222, 2016.
Xu, J. R., Morris, P. J., Liu, J. G., and Holden, J.: PEATMAP: Refining estimates of global peatland distribution based on a meta-analysis, Catena, 160, 134–140, https://doi.org/10.1016/j.catena.2017.09.010, 2018.
YSI: Professional Plus (Pro Plus) Multiparameter Instrument, https://www.ysi.com/proplus?srsltid=AfmBOopf0n-IERY9OtOittyBYt746fkxso2VJyTuD18ARPECc9yi80zw (last access: 20 January 2025), 2025.