
the Creative Commons Attribution 4.0 License.
the Creative Commons Attribution 4.0 License.
 | 19 Nov 2026
Use of spatial embeddings in genosoil identification
Julio César Pachón Maldonado

José Padarian
Quentin Styc
Alex B. McBratney
Genosoils are minimally disturbed reference states within pedogenons, that is, soil units shaped by similar pedogenic processes within the Soil Security framework. They are central to assessing human impacts on soil functions, services, and resistance to threats. Large scale genosoil delineation currently relies on Human Modification Index (HMI) classifications, identifying areas where human modification is on the lower end of the spectrum. In intensively managed landscapes, there may be a lack of genosoils, presenting a problem in studying the condition of soil without a local reference state available. Because similar pedogenic processes may give rise to soils under the same pedogenon classification across geographically distant regions, non-local occurrences may provide an alternative source of reference information. Using the United Kingdom as a case study, we tested whether spatial embeddings (vectorised representations of land surface properties derived from satellite imagery) can detect genosoil signatures at 10 m resolution and whether these signatures can be transferred to regions with limited or absent local low-human-modification examples. We evaluated two satellite foundation-model embedding products, AlphaEarth and Tessera, across three contrasting pedogenons selected from the Global Pedogenon Map. Within each pedogenon, pixels with lower HMI values were generally more similar to the candidate genosoil reference, indicating that the embeddings capture a consistent reference signature in areas with low human modification. At the global scale, similarity to the UK genosoil was largely confined to biogeographically coherent regions. Cross-border substitution of local UK genosoil delineation was mostly limited, with meaningful partial recovery observed primarily in the highly modified agricultural pedogenon. These results indicate that satellite foundation-model embeddings can support higher-resolution genosoil delineation than is currently possible from global human modification products alone, extending the operational framework from 90 to 10 m.
- Article
(3900 KB) - Full-text XML
-
Supplement
(631 KB) - BibTeX
- EndNote


For over a century, the study of soil as a natural body within the landscape, pedology, has sought not only to describe soil properties but to explain their genesis and dynamics through the interaction of soil-forming factors (Richter and Yaalon, 2012; Richter et al., 2020). A contemporary manifestation of this genetic perspective is the concept of the “pedogenon”, a soil taxon defined not solely by morphology but also by quantitative representations of soil-forming factor proxies at a specific reference time (Román Dobarco et al., 2021a). In practice, a pedogenon groups all locations on Earth where the same combination of climate, parent material, topography, organisms, and time has shaped the soil in broadly similar ways. The pedogenon framework presupposes that relatively homogeneous soil-forming processes, operating over shared temporal scales, give rise to distinct soil entities with characteristic capacities and functional limits.
The development of the pedogenon reflects the broader evolution of pedology from 19th-century conceptions of soil as weathered rock or plant substrate to its modern understanding as an interdependent Earth system component emerging from interactions among the atmosphere, biosphere, lithosphere, and hydrosphere (Huggett, 2021). During the 20th century, the anthroposphere increasingly became a dominant soil-forming sphere (Richter, 2007; Dror et al., 2021), necessitating explicit consideration of human–soil interactions and their implications for soil function.
The Soil Security Assessment Framework (SSAF) was developed to quantify the impact humans have on the functions and services provided by soil, as well as changes in the ability to withstand threats to these functions and services. These measurements have been regularly performed across the natural sciences, but SSAF expands the analysis to include socio-economic and cultural factors as well (Evangelista et al., 2023). Central to SSAF is the distinction between pedogenon, genosoil, and phenosoil (Román Dobarco et al., 2021b). A pedogenon represents soils that share relatively uniform environmental covariates acting as indicators for soil-forming factors. A genosoil indicates the “least disturbed” or “reference” state within a pedogenon, reflecting its inherent functional potential and long-term trajectory, whereas phenosoils are anthropogenically altered expressions of the same soil-forming environment caused by different land management practices (Jang et al., 2023). In other words, a genosoil represents the soil as it would exist without significant human alteration, whereas a phenosoil reflects the same soil-forming setting after modification by agriculture, urbanisation, or other land uses. These distinctions are essential for understanding anthropogenic impacts on soil, and SSAF suggests that such studies first create a pedogenon map and then classify areas within each pedogenon as either geno- or phenosoil (Román Dobarco et al., 2023).
Beyond academic endeavours, the urgency of identifying genosoils is emphasised by the ongoing loss of rare and endemic soils (Bockheim, 2005). Amundson et al. (2003) defined rare soil in the United States as any soil series covering less than 1000 ha, and deemed it endangered if over half of its area has been lost to land disturbance. The unique information and functional memory found in these soils, along with their irreplaceable biodiversity, are gradually and irreversibly disappearing (Ibáñez et al., 2012; Dazzi and Papa, 2019). Given the universality of the anthropogenic driver, classifying pedogenons into their geno- and phenosoil components at the scales required for management remains a current research challenge.
Previous studies have delineated genosoils utilising disturbance proxies such as the Human Modification Index (HMI) and the Habitat Condition Assessment System (Román Dobarco et al., 2023; Francos et al., 2025a). These threshold-based methodologies offer a pragmatic means of identifying candidate minimally disturbed areas within pedogenons. In Australia, however, 32 pedogenon classes lacked genosoils, and an additional 218 contained less than 5 % of their area as genosoils (Román Dobarco et al., 2023). In Europe, Francos et al. (2025a) identified genosoils across all pedogenons employing the fifth percentile of HMI values within each pedogenon, acknowledging that small or heavily modified pedogenons may lack sufficient observations to establish a valid reference; in such cases, utilising the genosoil of the most similar pedogenon was proposed as an alternative. Building upon this foundation, embedding-based similarity analysis facilitates the characterisation of internal coherence among candidate genosoil areas and supports the spatial extension of representative reference signatures across the entire pedogenon extent.
Recent advances in geospatial artificial intelligence provide a complementary approach to surface characterisation. Foundation models are large neural networks pre-trained on extensive archives of satellite imagery that can process the spectral, temporal, and contextual information in Earth observation data and compress it into a fixed-length numerical vector, termed a spatial embedding, for each pixel on the ground. Pixels with similar embedding vectors share similar land-surface characteristics as observed by satellites, irrespective of their geographic separation. Unlike traditional spectral indices such as NDVI, which summarise a single vegetation property, spatial embeddings encode a broad range of surface attributes simultaneously. The specific content of each embedding depends on satellite inputs and the learning objectives of the foundation model. Embeddings do not directly measure soil properties; rather, they represent the observable surface state, primarily vegetation structure and land cover, at a given location and time.
Currently, two publicly accessible foundation models are AlphaEarth Foundations and Tessera. AlphaEarth produces 64-dimensional embeddings at a 10 m resolution from optical and radar satellite imagery targeting the reconstruction of elevation models, climate data, and other Earth system variables (Brown et al., 2025). Tessera generates 128-dimensional embeddings at a 10 m resolution through self-supervised learning on Sentinel-1 and Sentinel-2 time series, explicitly preserving spectral-temporal signals pertinent to land surface dynamics (Feng et al., 2025). Both products aim to provide annual global coverage, facilitating consistent surface-dynamic characterisation across regions and temporal scales, although Tessera's temporal coverage remains incomplete at the time of writing.
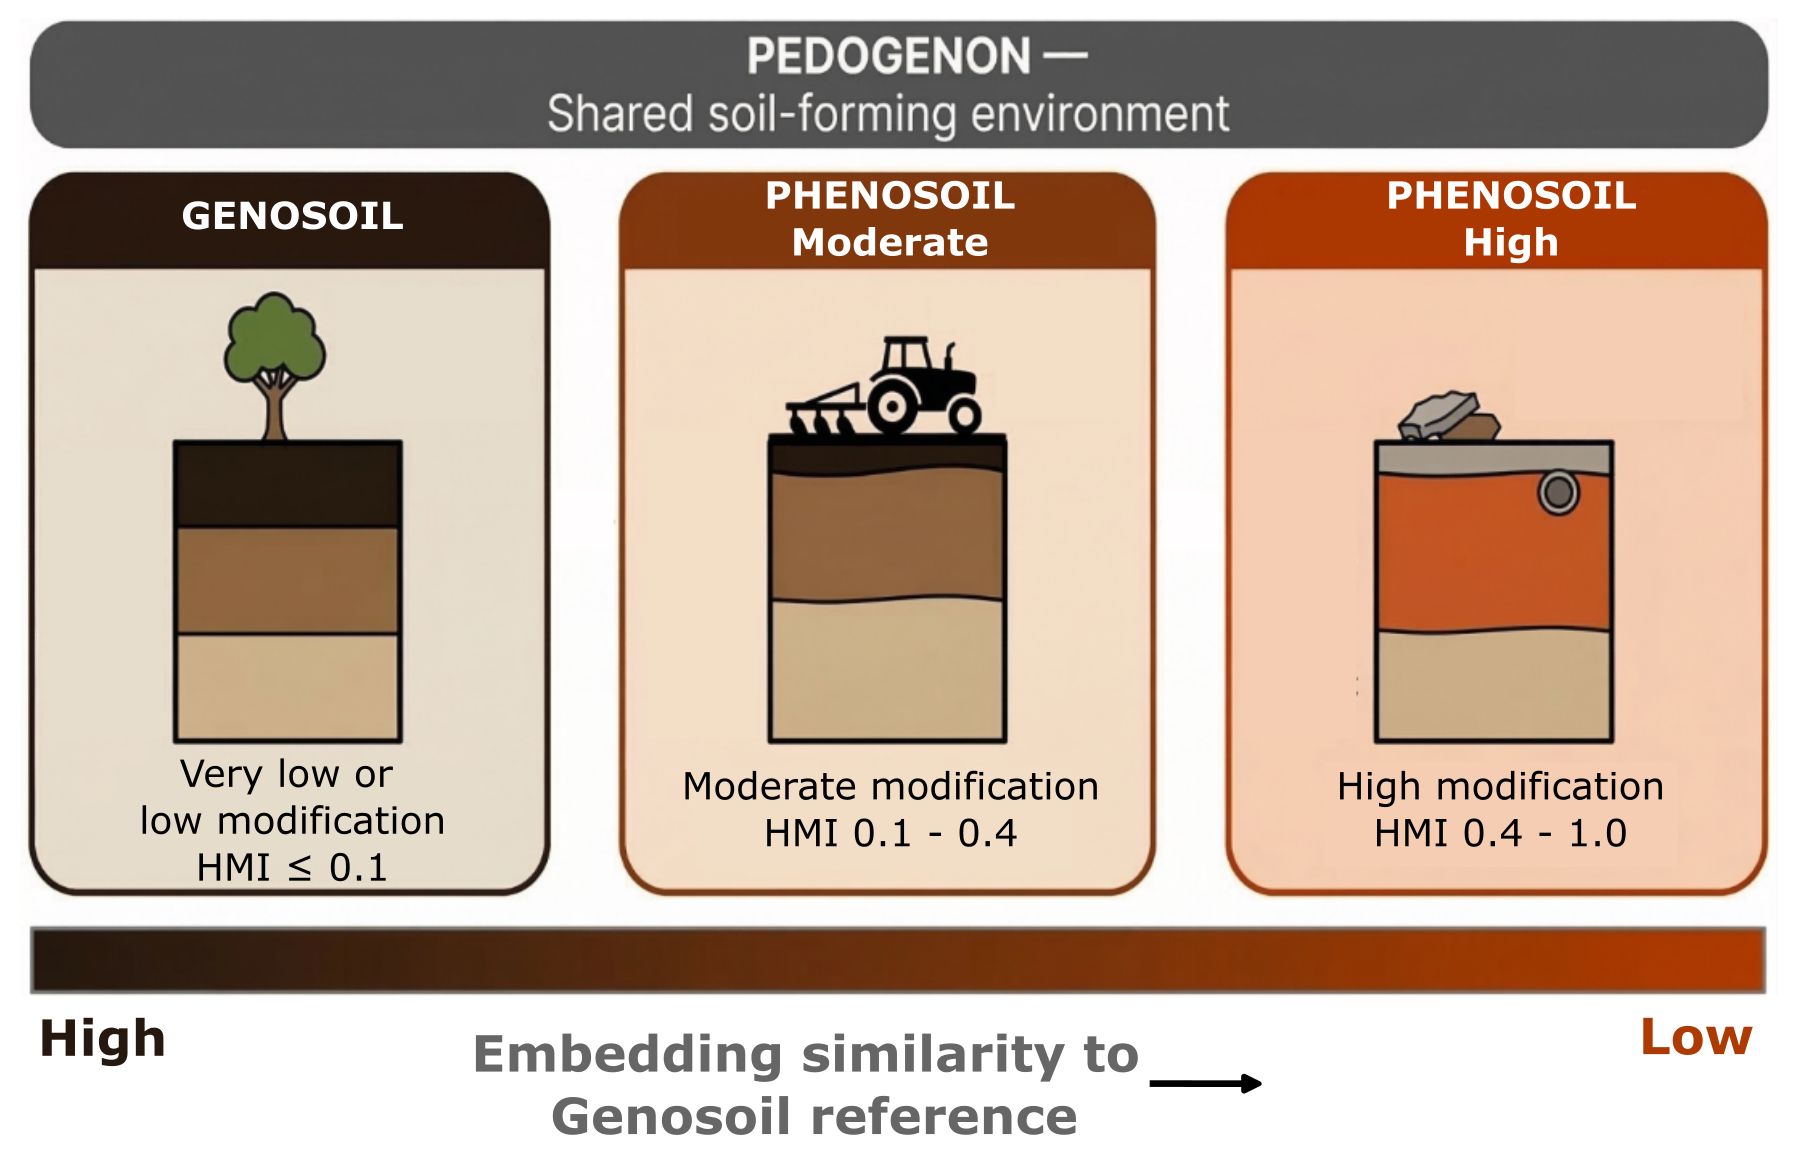
Figure 1Conceptual representation of how a single pedogenon, soil sharing similar soil-forming covariates, can display very different properties based on human management. Classes based on the Human Modification Index (HMI): genosoil combines very low and low-modification classes (HMI ≤ 0.10), while phenosoils span moderate (0.10 < HMI ≤ 0.40) and high/very high modification (0.40 < HMI ≤ 1.00). Highly modified soils will have embeddings that differ from the reference state, thus displaying lower similarity.
Spatial embeddings mainly represent vegetation communities and land cover observable in satellite imagery; they do not directly encode pedogenesis. It is hypothesised that within a pedogenon, genosoil areas share a characteristic embedding signature not because embeddings encode pedogenesis, but because they capture an aboveground vegetation community that develops on minimally disturbed soil potentially sharing characteristic features represented by the embeddings. A pedogenon with minimal human modification should support a vegetation assemblage characteristic of that soil-climate combination, resulting in a coherent and reproducible embedding signature. This signature can subsequently be employed to identify genosoil candidates at higher resolutions across the extent of the pedogenon, within the same temporal range. When a pedogenon lacks genosoil within a given region, embedding similarity may facilitate the cross-border transfer of genosoil references from regions where the pedogenon remains better preserved (Fig. 1). However, such transfer assumes that the vegetation-soil equilibrium remains consistent across the targeted geographic area.
This paper examines whether spatial embeddings are capable of capturing human modifications constrained by the pedogenon, thereby enabling the identification of candidate genosoils at a high resolution. Additionally, it investigates whether reference signatures can be transferred across geographic boundaries when local genosoil data are scarce or unavailable. The specific objectives are as follows:
-
Quantify whether candidate genosoil pixels within a pedogenon demonstrate greater embedding similarity to each other than to phenosoil pixels.
-
Determine whether a representative genosoil embedding can accurately identify analogous regions within the entire pedogenon extent.
-
Test whether candidate genosoil reference signatures derived in other countries can substitute for sparse local references and still identify plausible genosoil candidates.
-
Compare AlphaEarth and Tessera with regard to genosoil discrimination and the transferability of candidate genosoils on a global scale.
2.1 Study pedogenons
Three pedogenons were selected from the Global Pedogenon Map (GPM; Francos et al., 2025b; 6500 pedogenons globally) to exemplify contrasting pedogenic environments within the United Kingdom; as well as the spectrum of genosoil availability, ranging from extensively preserved to nearly extinct (Table 1; Fig. 2). The United Kingdom was selected as the case study due to the comprehensive temporal coverage (2017–2024) provided by Tessera at the commencement of the study.
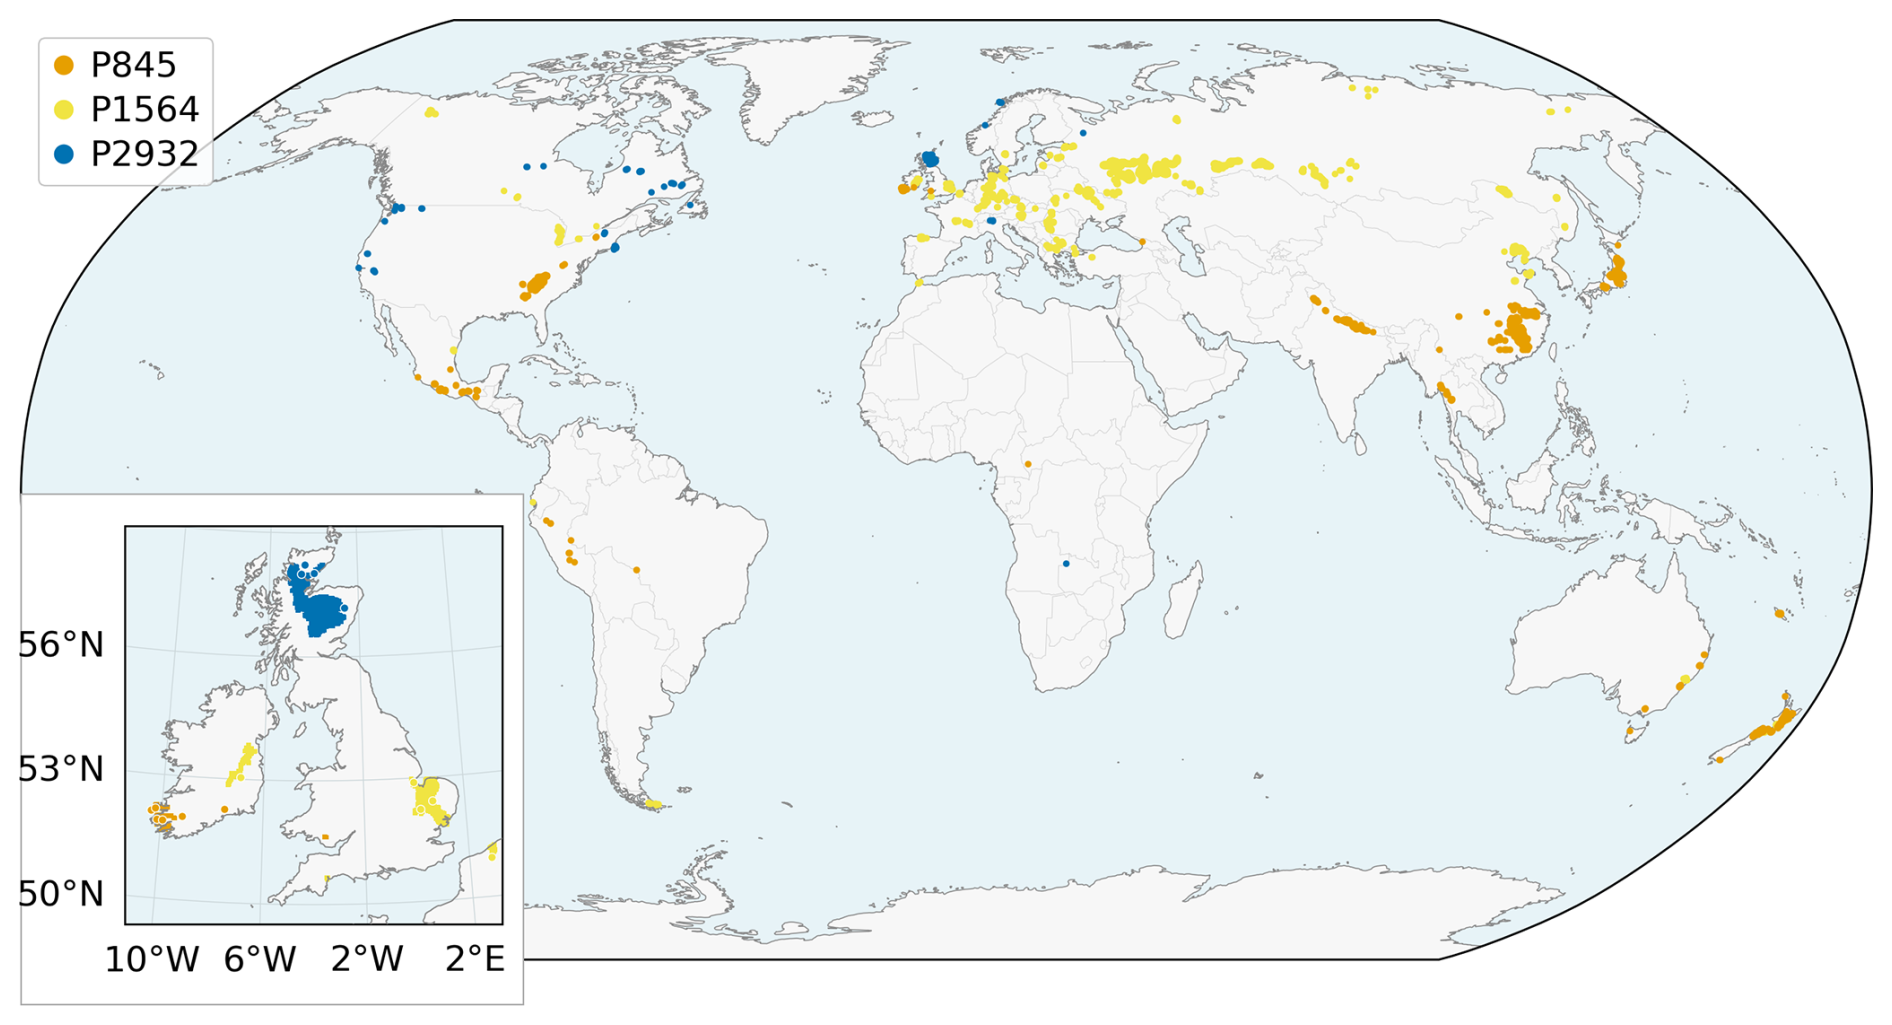
Figure 2Spatial location of the pedogenons selected around the world and in the UK (inset lower left).
Table 1Characteristics of the three study pedogenons. Last two columns are used for description purposes only. World Reference Base classes from the SoilGrids 250 m most-probable class raster (Hengl et al., 2017) across each pedogenon's global extent and are indicative rather than validated. USDA Soil Taxonomy Great Groups are from gSSURGO (Soil Survey Staff, 2026), which covers only the United States occurrence of each pedogenon.
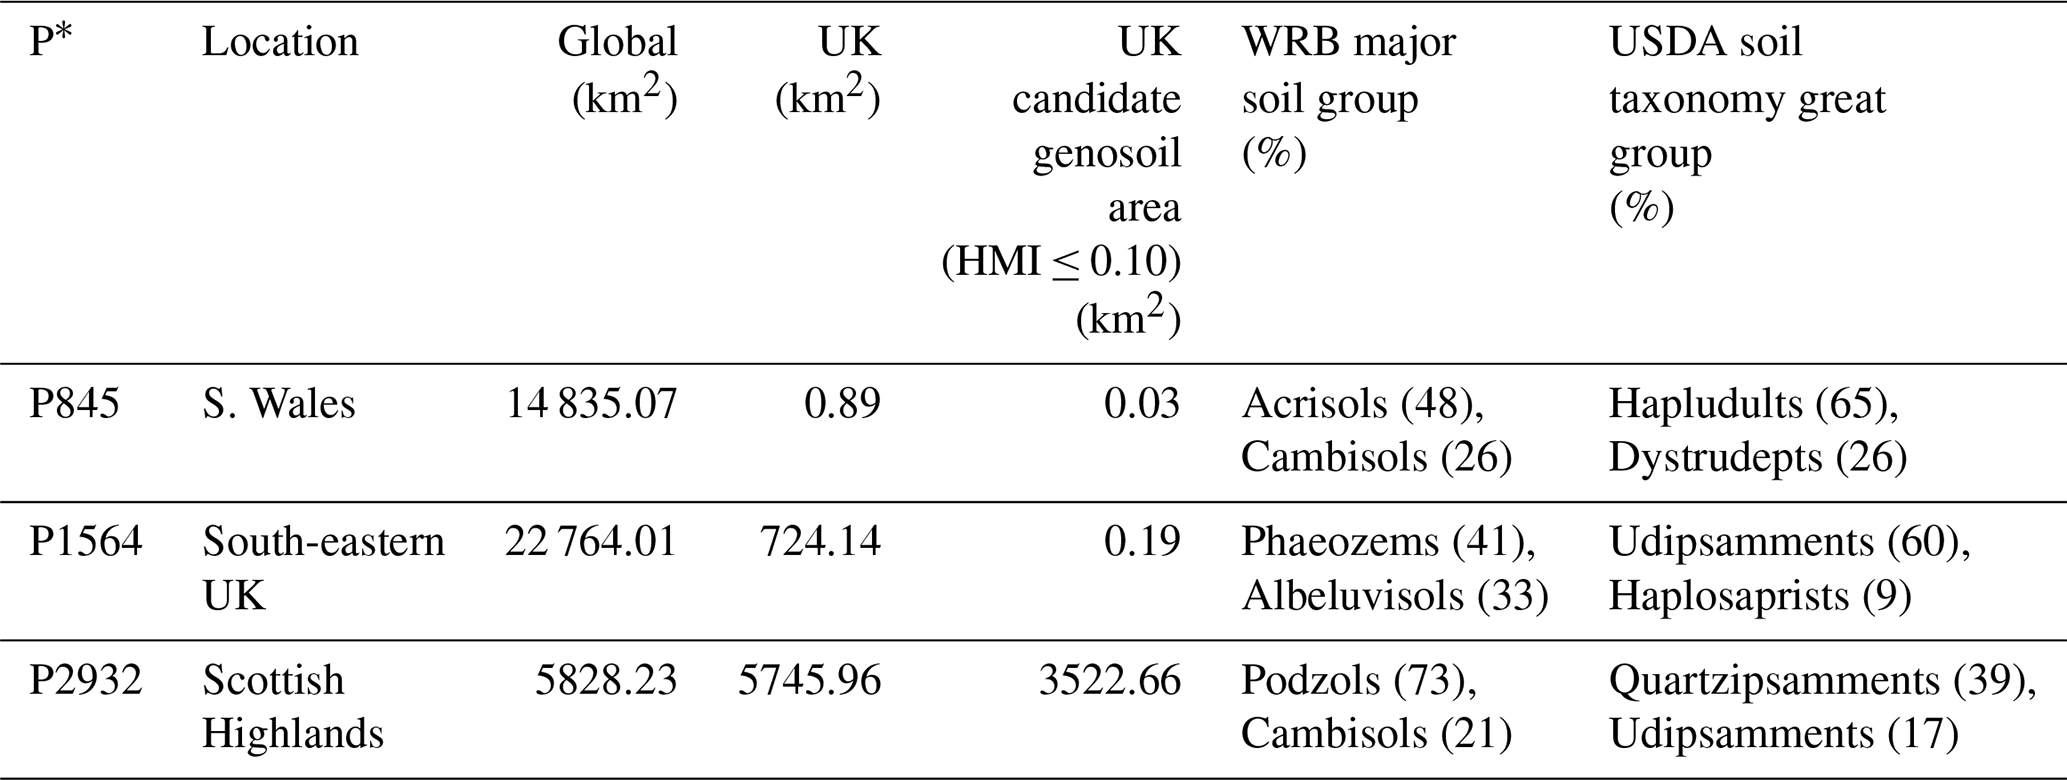
P* = Pedogenon.
Located in Southern Wales, pedogenon 845 (P845) is mainly associated with Acrisols (48 %). Its total global extent is 14 835.07 km2 with a Shannon H′ of 1.36, while its extent within the UK is 0.89 km2, having just 0.03 km2 HMI ≤ 0.10. Pedogenon 1564 (P1564), mainly found in Southeastern UK, is the most widely distributed pedogenon studied globally, with a total area of 22 764.01 km2 across the globe and 724.14 km2 within the UK. This pedogenon is mainly associated with Phaeozems (41 %) and Albeluvisols (33 %), with a Shannon H′ of 1.44. P1564 is greatly modified by agriculture, with only 0.19 km2 (0.03 % of the UK P1564 extent) exhibiting HMI values of 0.10 or less at the time of analysis. Pedogenon 2932 (P2932) is found in the Scottish Highlands within the UK and is predominantly associated with Podzols (73 %), displaying limited pedogenic diversity with a Shannon H′ of 0.73. It represents the most geographically restricted pedogenon among the three, encompassing 5828.23 km2 globally of which 5745.96 km2 occurs within the UK, and 3522.66 km2 HMI ≤ 0.10, around 61 % of the UK P2932 extent.
2.2 Spatial embeddings
Two publicly accessible 10 m spatial embeddings were utilised: AlphaEarth v1 (Brown et al., 2025), accessed via Google Earth Engine and exported in each tile's native UTM projection, and Tessera v1 (Feng et al., 2025), accessed with the Parquet-indexed GeoTessera retrieval library.
AlphaEarth consists of 64-dimensional embeddings at 10 m resolution derived from satellite imagery (Sentinel-1, Sentinel-2, and Landsat 8/9) and trained to reconstruct a diverse set of environmental data sources, including elevation, climate, and land cover (see Brown et al., 2025, Table S1 in the Supplement, for the complete list). Recent interpretability analyses of AlphaEarth embeddings across the contiguous United States (Rahman, 2026) have demonstrated that the 64 dimensions capture a wide range of environmental variables, reproducing temperature (R2=0.97) and elevation (R2=0.96), along with reconstructing 12 of 26 variables at R2>0.90. Conversely, anthropogenic variables such as nightlights and population density were less prominently reconstructed (R2=0.58 and R2=0.56 respectively). The same study reported an average inter-annual dimension stability of across all 64 dimensions (2017–2023), with 51 out of 64 dimensions exceeding . This suggests that the embeddings encode land-surface properties that are temporally stable, rather than transient seasonal signals.
Tessera provides 128-dimensional embeddings at a 10 m resolution, derived from Sentinel-1 and Sentinel-2 time series through self-supervised learning employing a Barlow Twins objective (Feng et al., 2025). Tessera's training methodology enforces temporal sampling invariance: two views of the same pixel are extracted from different random time windows within the same year, thereby promoting the model to learn representations that maintain stability across seasons. Unlike AlphaEarth, no climate or topographic data were used to develop Tessera either as input or reconstruction target.
Assessment and delineation of candidate genosoils with spatial embeddings used 2022 data in order to maintain temporal alignment with the Human Modification Index, for which 2022 was the most recent year used at the time of analysis (Theobald et al., 2025). For country comparisons and cross-border transfer, we also used 2022 AlphaEarth; however, Tessera country comparisons and foreign-reference transfers used the globally available 2024 product because 2022 data were not available globally at the time of analysis, including the 2024 UK reference and target embeddings used in these comparisons. Tessera reference populations were compared between 2022 and 2024 to assess the temporal differences across all three study pedogenons. AlphaEarth temporal variation was not assessed in this study.
Embeddings are not explicitly trained to represent soil properties. They capture the spectral and temporal co-evolution of biophysical land-surface traits over a calendar year. The pedological interpretation developed here is that, within a pedogenon and under low human modification, the characteristic vegetation–soil equilibrium produces a reproducible surface signal that the embedding encodes.
2.3 Genosoil delineation and reference embedding
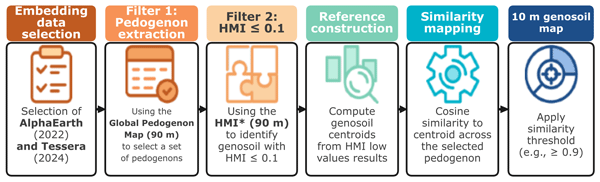
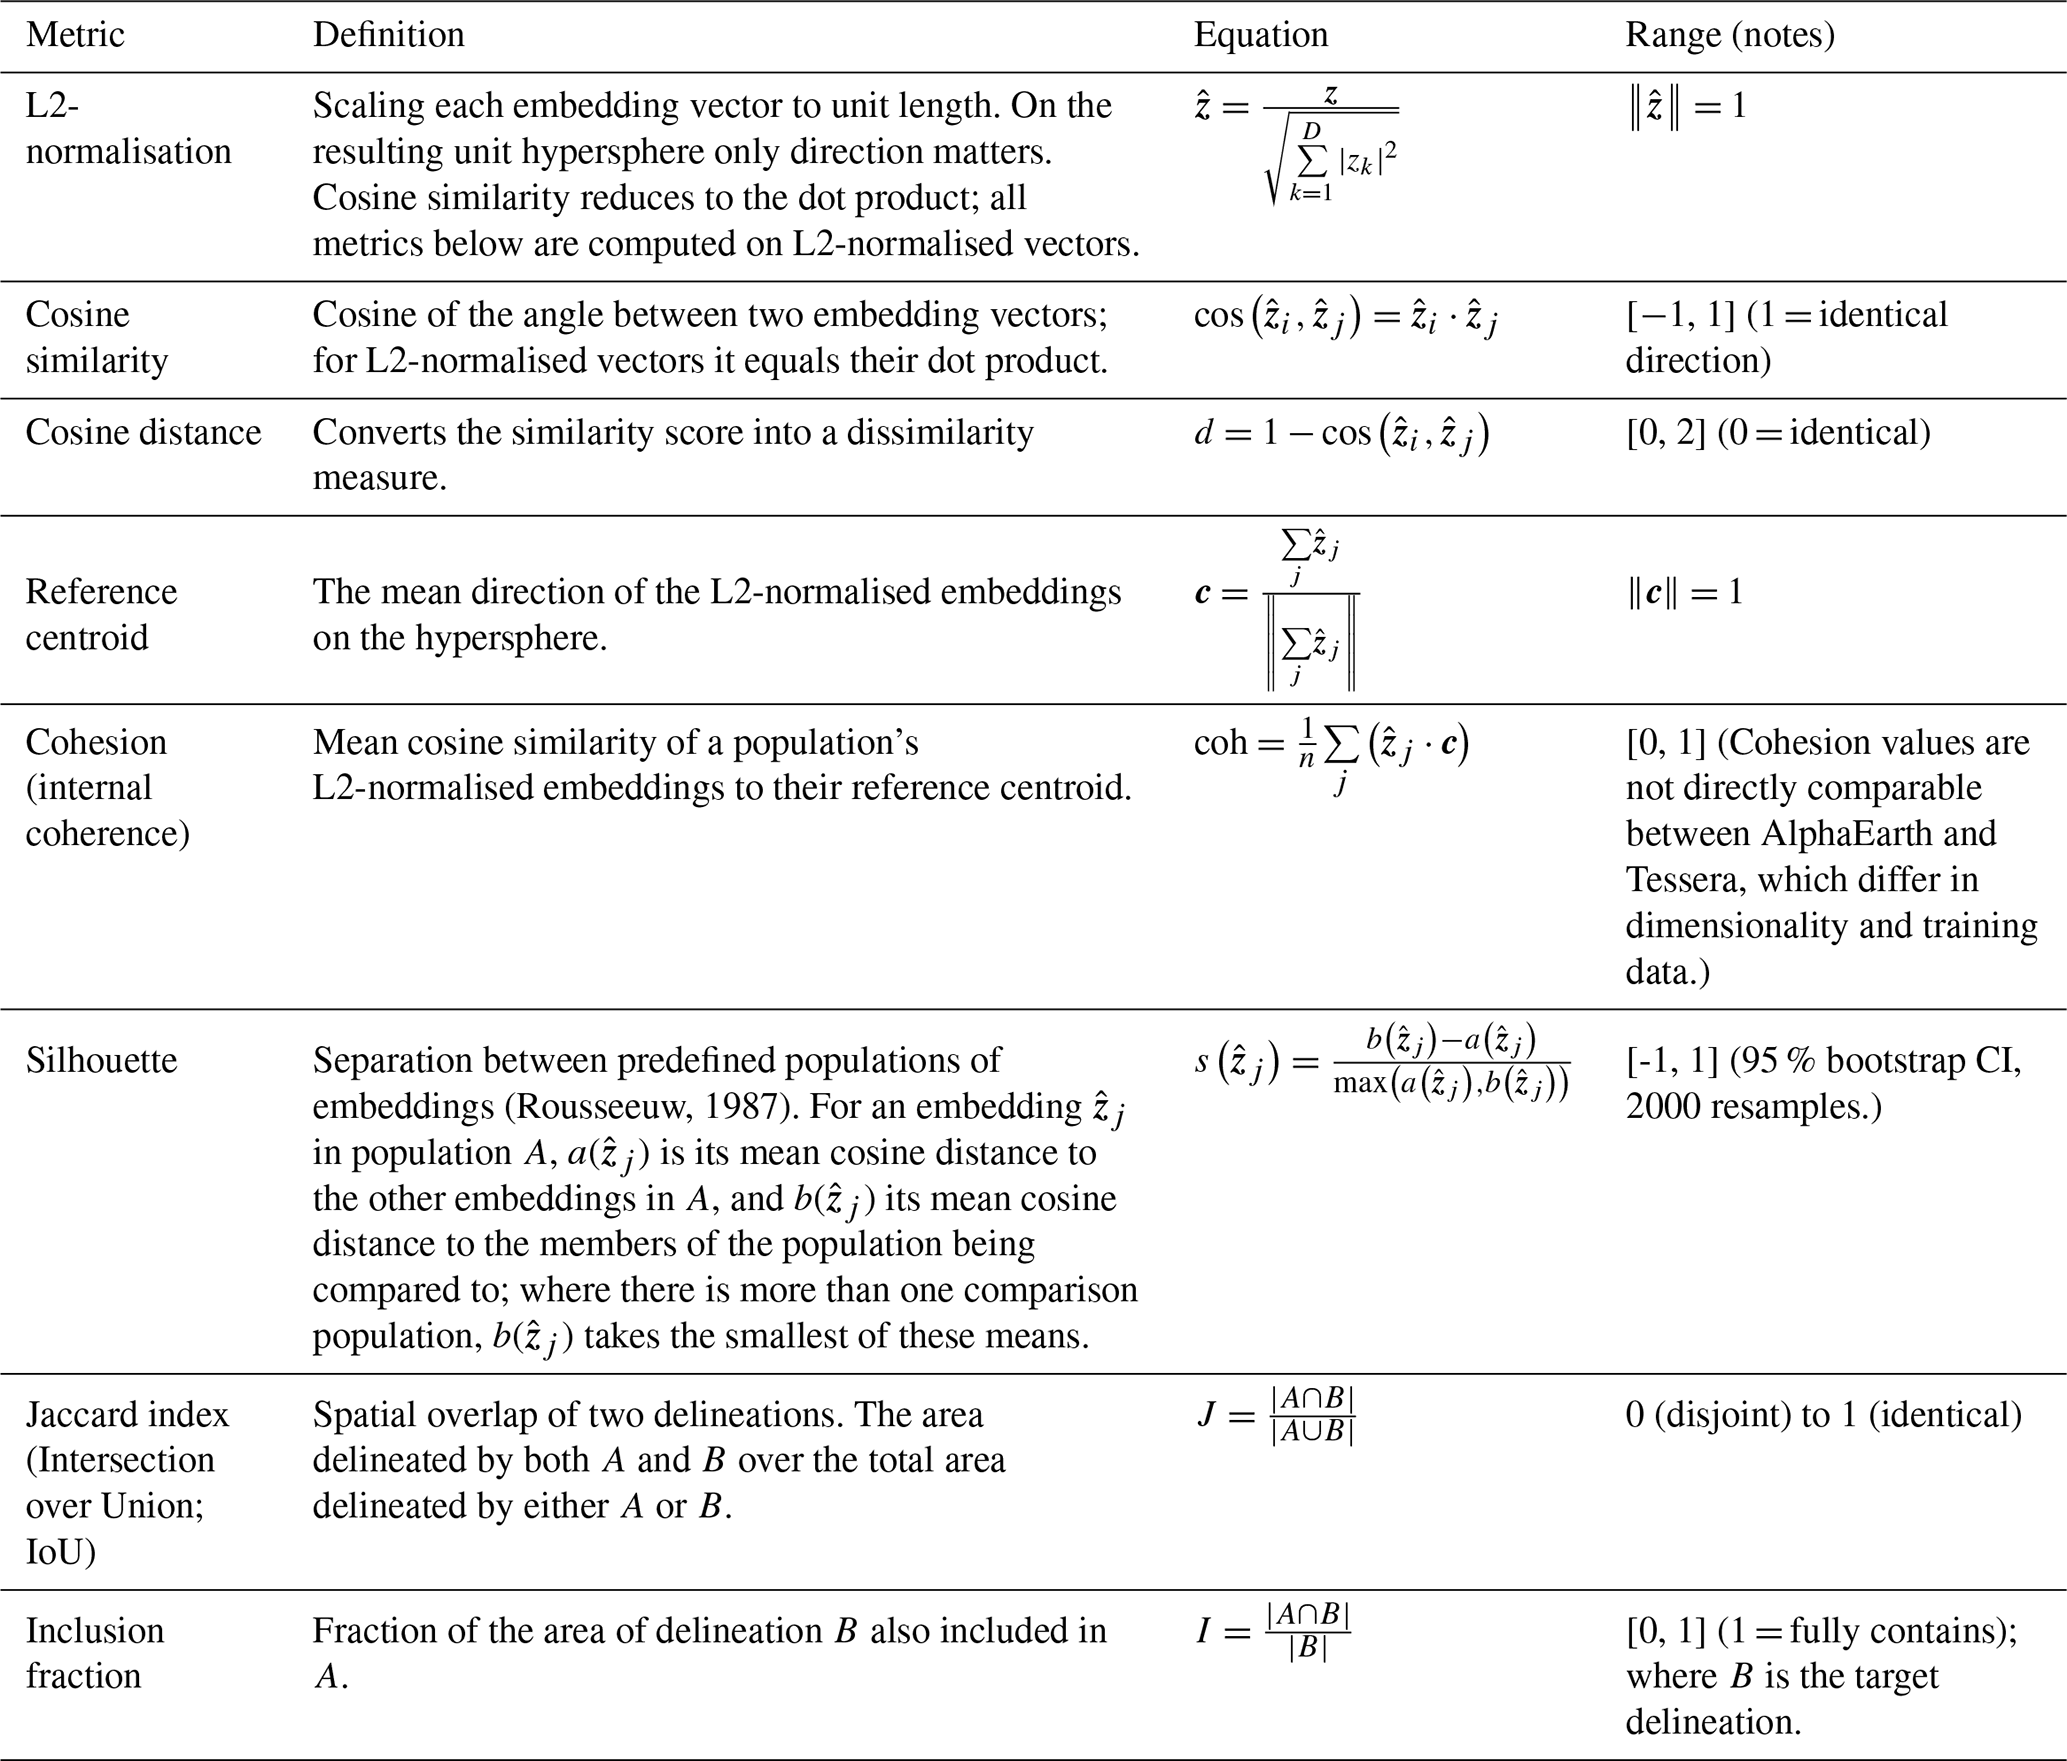
We applied the workflow in a simple sequence: identify low-HMI candidate pixels within each pedogenon, compute a representative embedding for that low-modification state, and map cosine similarity from every pedogenon pixel to that reference. Pixels with cosine similarity ≥ 0.90 were treated as highly congruent with the candidate genosoil reference, yielding a 10 m map of candidate genosoils per pedogenon (Fig. 3). Table 2 summarises the metrics used in this study.
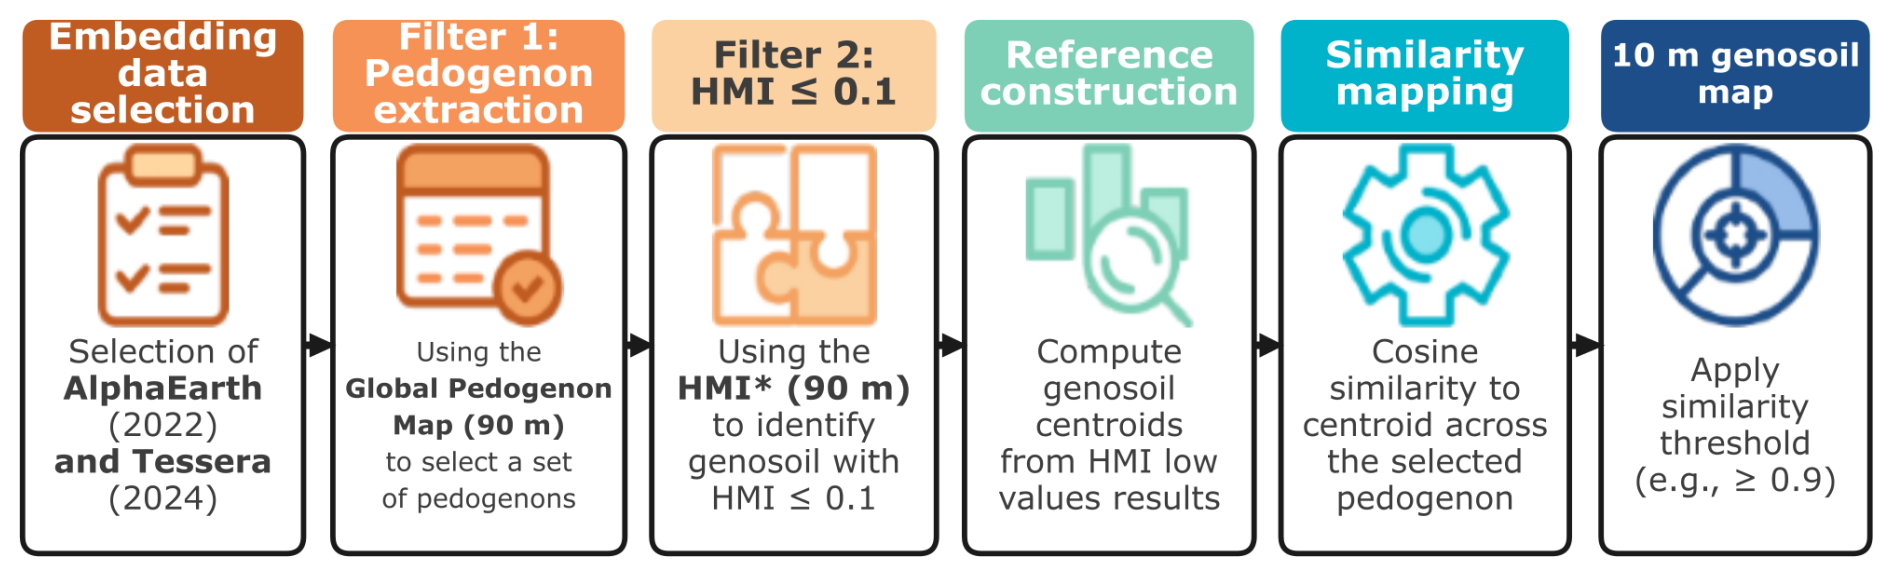
Figure 3Workflow for genosoil identification using spatial embeddings in this study. HMI = Human Modification Index.
Table 2Definitions of the similarity, separation and overlap metrics used throughout. Cohesion and the silhouette summarise the embeddings; the Jaccard index and the inclusion fraction summarise the spatial delineations those embeddings produce and are computed on an area basis.
The 2022 Human Modification Index (HMI; Theobald et al., 2020, 2025) quantifies cumulative human modification from 0 (unmodified) to 1 (fully modified) at 90 m resolution. For each of the three pedogenons, reference pixels were selected from valid 10 m embedding pixels whose centres corresponded to HMI ≤ 0.10 in the 90 m HMI map, following Styc et al. (2025) who combined “very low” and “low” modification categories; HMI ≤ 0.01 and 0.01 < HMI ≤ 0.10 respectively (Theobald et al., 2025). Stricter thresholds of HMI ≤ 0.01 and ≤0.05 left no reference pixels for either P845 or P1564 within the UK. Pedogenon classification was also assessed at embedding-pixel centres.
The candidate genosoil reference centroid of pedogenon i () was calculated for each country from the embedding vectors of its reference pixels (HMI ≤ 0.10): each vector was scaled to unit length, the vectors were averaged, and the mean was rescaled to unit length:
with zj being the unit-length embedding vector of the jth reference pixel and n the number of reference pixels in the country. This approach retains all candidate genosoil pixels, regardless of their extent, making it suitable for pedogenons with a sparse extent, such as P1564 in the UK. Genosoil internal coherence was quantified by cohesion, the mean cosine similarity of candidate genosoil pixels to the group centroid, which indicates how representative the reference embedding is of the reference population:
Since all embedding vectors are L2-normalised to unit length prior to analysis, the cosine similarity between any two vectors reduces to their dot product. Cohesion measures range from 0 (indicating no coherence) to 1 (indicating complete pixel uniformity with the centroid). Uncertainty in cohesion was assessed using 2000 bootstrap resamples of GPM cells, retaining all reference pixels within each resampled cell (Table S1). Since AlphaEarth and Tessera differ in dimensionality (64 and 128 dimensions) and in training data and objectives, cohesion values are not directly comparable between them.
Similarity maps were generated by calculating the cosine similarity between the candidate genosoil reference embedding and each pixel within the pedogenon extent. Given that all vectors are normalised to unit length, cosine similarity reduces to the dot product. Pixels with cosine similarity ≥ 0.90 to the reference centroid were treated as candidate genosoil. No cosine threshold is universally established and 0.90 was set as a conservative cutoff. Nonetheless, we also tested 0.85, 0.90 and 0.95 for both models and all three pedogenons. A comprehensive per-country analysis was performed to compute candidate genosoil centroids and related metrics for all countries where the pedogenon is present, thereby facilitating a systematic comparison of genosoil signature coherence and UK similarity across the entire global distribution. Cosine distance is defined as 1 minus the cosine similarity.
Spatial overlap between genosoil masks was quantified using the Jaccard index (intersection over union, IoU):
where A and B are areas of the candidate genosoils being compared.
Candidate genosoil maps retained each embedding product's original 10 m grid. Spatial agreement was measured from the intersection and union of the mapped areas, without resampling either candidate map. Pedogenon extent and HMI-defined candidate area were calculated using the GPM grid, sampling HMI values at cell centres. Areas were calculated on the WGS84 ellipsoid.
2.4 Global similarity analysis
For each country with candidate genosoil pixels meeting HMI ≤ 0.10, we calculated a reference centroid and its cohesion. Cohesion describes the internal consistency of a country's candidate genosoil population, whereas the centroid provides its representative embedding direction (Table S2).
Country-level transferability was then assessed by comparing each country's candidate genosoil centroid with that of the UK using cosine similarity (cosine-to-UK). Higher cosine-to-UK values indicate that a country's candidate genosoil signature is more similar to the UK reference for the same pedogenon.
To quantify how well candidate genosoil pixels were separated from a comparison group, we used the silhouette coefficient (Rousseeuw, 1987). Given two predefined clusters A and B, the silhouette score for each pixel in cluster A is:
where is the mean cosine distance from to all other members of cluster A, and is the mean cosine distance from to all members of cluster B. Values range from −1 to 1 where positive values indicate that is more similar to its own cluster than to the comparison group, zero indicates an equal boundary, and negative values indicate greater similarity to the comparison group.
The relationship between human modification and the candidate genosoil signature was assessed by comparing the reference centroid with the centroids of three progressively modified HMI classes within each country (0.1–0.2, 0.2–0.4, 0.4–1.0). Larger cosine distances indicate greater differences from the low-modification reference. To assess similarity across countries, we compared their candidate genosoil reference centroids within each pedogenon, identifying countries that could provide alternative reference populations where local candidate genosoils are scarce.
To evaluate cross-border substitution, the foreign reference centroids with the highest similarity to reference centroids within the UK were selected and those centroids were used in the analysis instead of the UK centroid within the corresponding UK pedogenon using the same cosine similarity threshold of 0.90. Foreign-derived and UK-derived candidate areas were compared on the same UK embedding grid.
To assess whether the candidate genosoil signature remained consistent between years, we compared Tessera embeddings at the same UK reference locations in 2022 and 2024, retaining locations with valid data in both years. We report the mean silhouette across both annual populations. Confidence intervals were estimated using 2000 bootstrap resamples of the GPM cells containing reference pixels in the Global Pedogenon Map. All embedding pixels within a selected cell were retained together, including their observations from both years. Where more than 256 GPM cells were available, 256 were selected at random; otherwise, all cells were included. The mean silhouette for the complete reference population is reported separately from the mean and 95 % confidence interval obtained from the sampled cells (Table 4).
2.5 Describing pedogenons
The soil taxonomic composition of each study pedogenon was characterised using two sources. WRB Reference Soil Groups were summarised from the SoilGrids 250 m global classification raster (Hengl et al., 2017; Table S4). USDA Soil Taxonomy great groups were derived from the Gridded Soil Survey Geographic database (gSSURGO; Soil Survey Staff, 2026), which provides coverage for the contiguous United States (Table S5). Shannon diversity indices (H′) were calculated based on WRB Reference Soil Group membership to assess pedogenic homogeneity within each pedogenon globally (Minasny et al., 2010). WRB raster summaries were used as descriptive spatial context rather than independent validation, as SoilGrids products share covariate inputs with the pedogenon map. The WRB soil profile records within the global occurrences of each pedogenon were also compiled to provide complementary taxonomic context (Table S6).
3.1 Mapping candidate genosoil at 10 m
The three pedogenons encompass the spectrum of genosoil availability, ranging from extensively preserved to nearly extinct. The degree of concordance among delineation methods varied accordingly (Table 3). Candidate genosoil extents varied based on the method used (Fig. 4).

Figure 4Candidate genosoil maps for pedogenon 845 (top row panels), 1564 (middle row panels), and 2932 (bottom row panels) using the 90 m Human Modification Index Map (left column panels), AlphaEarth reference embeddings (middle column) and Tessera reference embeddings (right column panels). Southwestern P1564 is shown in an inset; the UK overview locates the detailed views. Coloured footprints show pedogenon extent and dark grey shows candidate genosoil. Hollow circles indicate candidate locations for P1564.
Table 3Agreement among local candidate-genosoil delineations within the UK for pedogenons 845, 1564 and 2932. HMI genosoil candidate uses HMI ≤ 0.10; AlphaEarth and Tessera candidates use cosine similarity ≥ 0.90 to their respective 2022 UK reference centroids. IoU = Jaccard index (intersection over union).
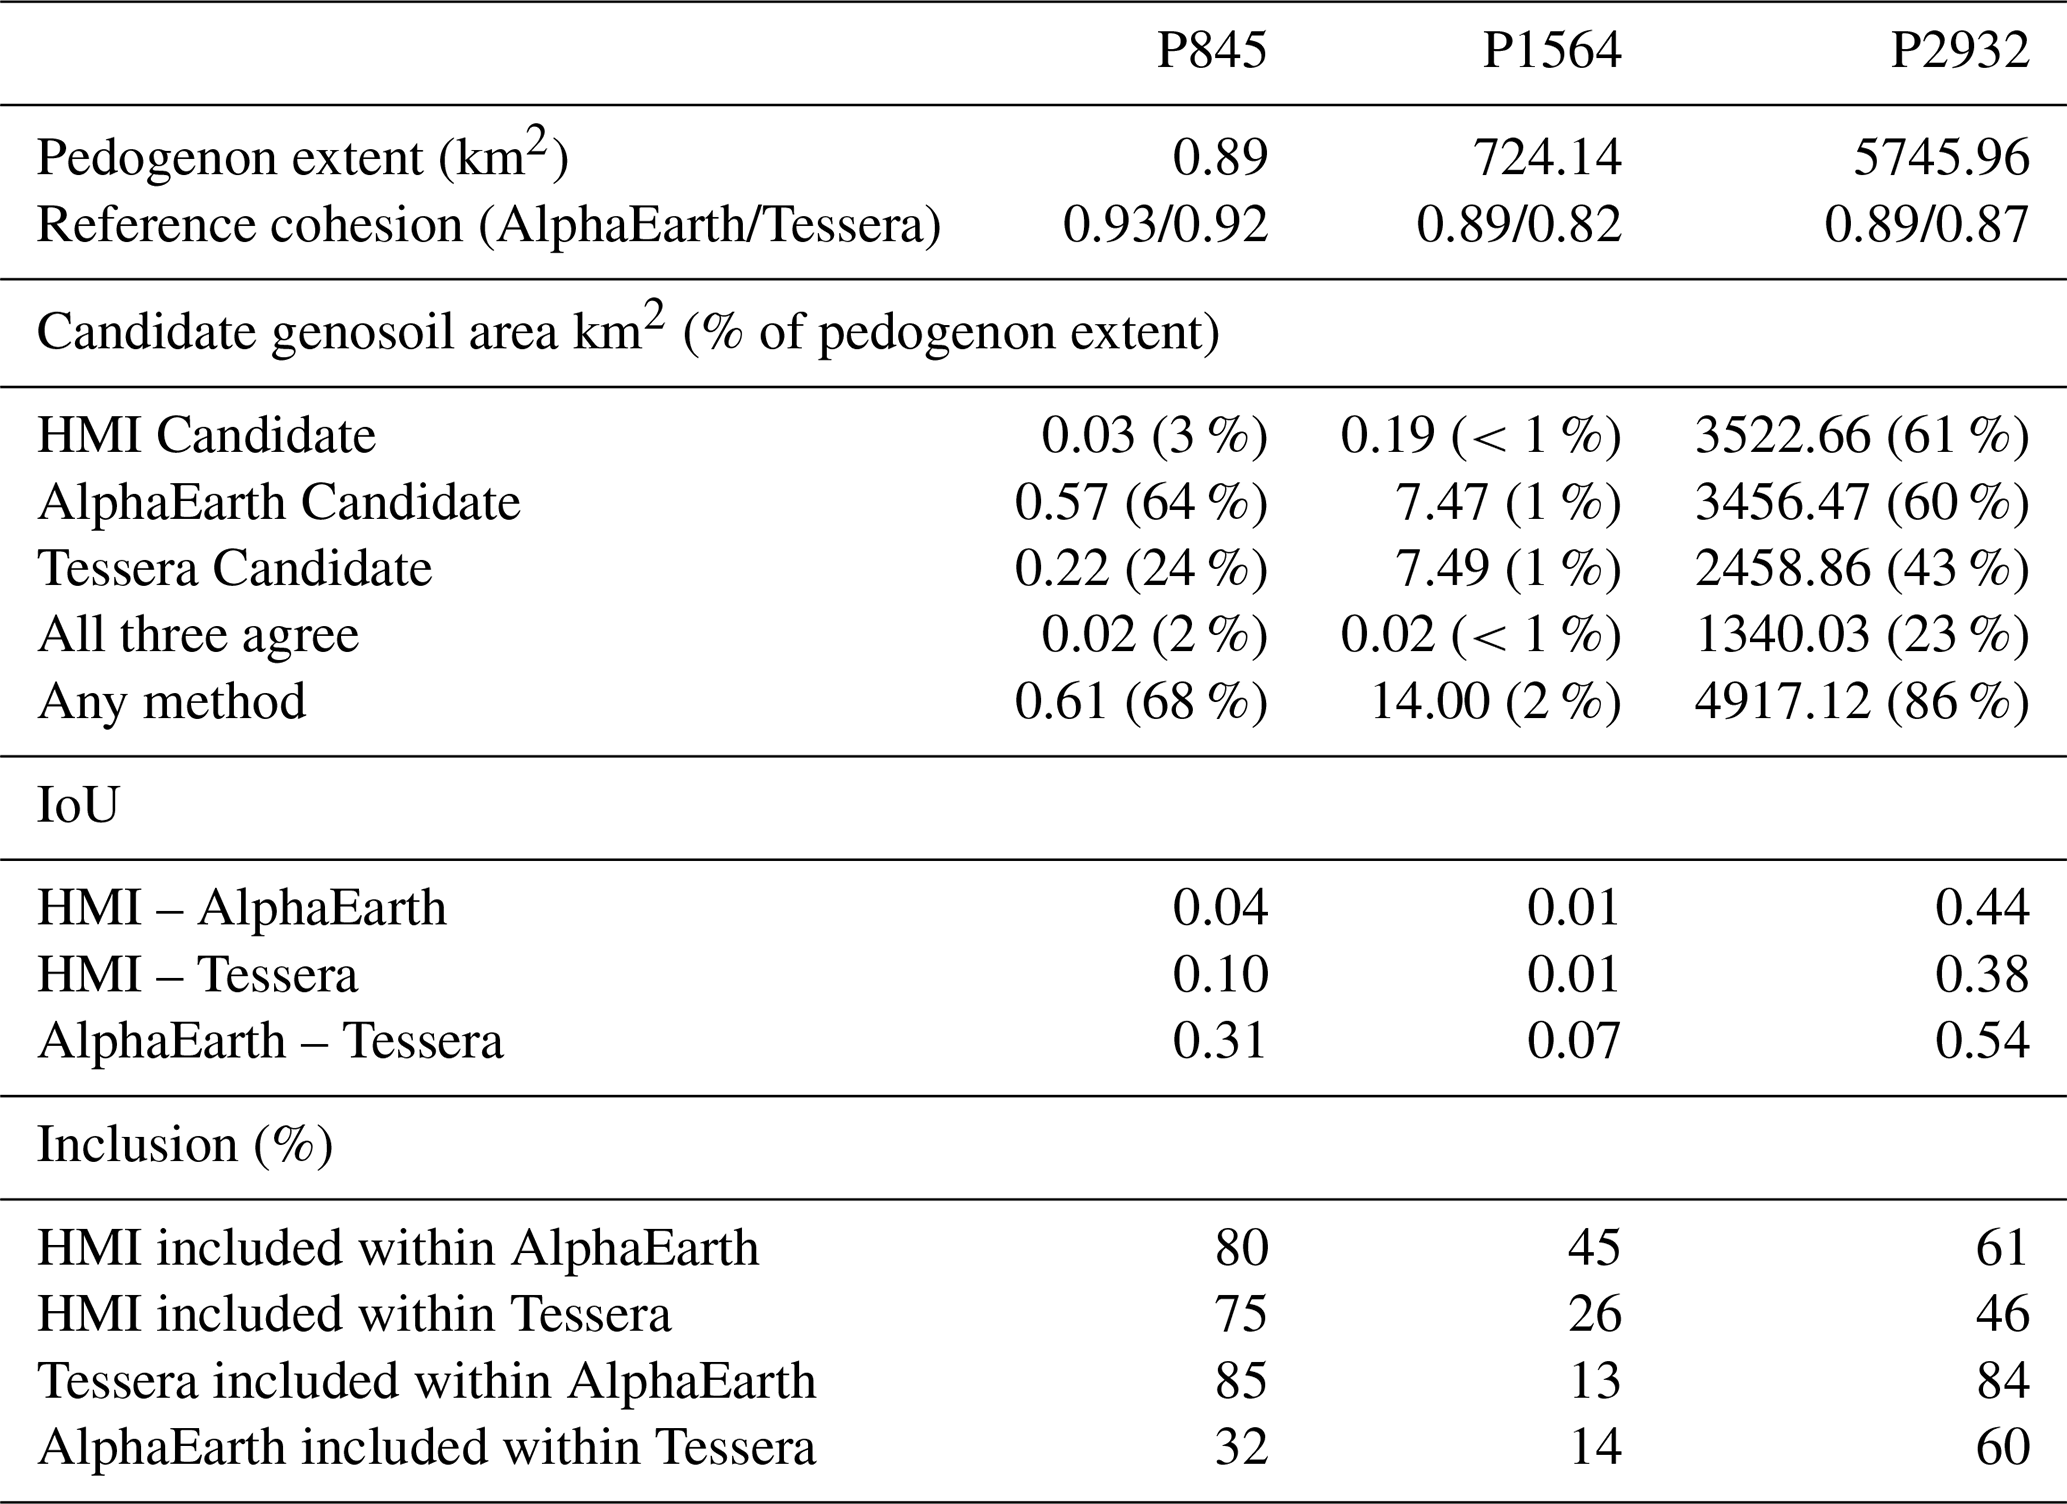
P845 (Southern Wales) occupied the smallest extent within the UK among the pedogenons studied, measuring 0.89 km2, with 0.03 km2 (3 %) at HMI ≤ 0.10. AlphaEarth classified 0.57 km2 (64 %) and Tessera 0.22 km2 (24 %) as candidate genosoil, with 85 % of Tessera's candidate area included within the AlphaEarth genosoil extent (Table 3). These areas corresponded to 5675 and 2183 native embedding pixels, respectively. Only six GPM cells met the HMI ≤ 0.10 criterion, highlighting the limited local reference support and motivating the investigation of candidate reference populations beyond the United Kingdom for soils of similar pedogenesis (Sect. 3.3).
P1564 (Southeastern UK) presented a different case. Only 0.19 km2 (<1 %) of its 724.14 km2 territory in the UK qualified as candidate genosoil according to the HMI criterion. This resulted in an exceedingly limited reference population from which to develop a genosoil embedding. AlphaEarth identified 7.47 km2 (1 %), while Tessera identified 7.49 km2 (1 %) as candidate genosoil, both greatly exceeding the HMI derived candidate genosoil area (Table 3). However, these delineations were almost entirely non-overlapping: their pairwise IoU was 0.07, with 13 % of Tessera candidate genosoil area within AlphaEarth's delineation. All three methods concurred on 0.02 km2. Despite this spatial disagreement, both models had reference centroids that were closer to low-modification than to higher-modification HMI classes (Sect. 3.2).
P2932 (Scottish Highlands) showed the broadest agreement between the disturbance proxy and the embedding-derived candidate genosoil area extents. Within its 5745.96 km2 UK extent, 3522.66 km2 (61 %) was classified as candidate based on HMI ≤ 0.10, compared to 3456.47 km2 (60 %) for AlphaEarth and 2458.86 km2 (43 %) for Tessera (Table 3). Consequently, AlphaEarth closely replicated the overall extent defined by HMI, whereas Tessera delineated a smaller subset. The highest pairwise overlap was observed between the two embedding products (IoU = 0.54), with Tessera predominantly nested within the AlphaEarth candidate genosoil area extent (84 % of Tessera candidate genosoil area also classified as candidate genosoil by AlphaEarth). All three methodologies converged on a common core of 1340.03 km2 (23 % of the pedogenon), while a total of 4917.12 km2 (86 %) was identified as candidate genosoil by at least one method. The remaining discrepancies suggest that a low HMI value does not necessarily guarantee a genosoil-like embedding signature, and vice versa, a genosoil-like surface may be present in areas exceeding the conventional HMI threshold.
AlphaEarth generated a larger candidate genosoil area extent than Tessera in two of the three pedogenons. Tessera's candidate area was largely included within AlphaEarth's delineation for P845 and P2932, whereas P1564 showed limited overlap despite producing similar candidate genosoil area extent. In regions where genosoil was prevalent, such as P2932, all three methods converged on a common core. Conversely, in areas where it was scarce, such as P1564, the embedding models extended the delineation well beyond the HMI input, exhibiting divergence in their spatial placement.
Genosoil candidate areas changed across the tested thresholds for both embedding products and the three pedogenons, indicating that delineations are sensitive to the choice of cosine similarity threshold (Table S7). For P2932, AlphaEarth delineated 98 % of the HMI-defined candidate area at 0.90, compared with 128 % at 0.85 and 13 % at 0.95. Tessera delineated 70 % of the HMI-defined candidate area at 0.90, compared with 118 % at 0.85 and 2 % at 0.95. At the 0.90 threshold, the maps are therefore a conservative prioritisation of candidates that would benefit from calibration against independently characterised soil profiles and land-use histories.
3.2 Modification gradient and embedding comparison
Across the 92 country–model profiles with at least two available modified HMI classes, 82 showed a higher distance in the highest available modified class than in the lowest, and 65 were non-decreasing across the available modified classes (Fig. 5). This indicates that, within a given pedogenon and country, the low-HMI candidate genosoil centroid defines a consistent local reference state in embedding space, from which progressively modified pixels tend to diverge.
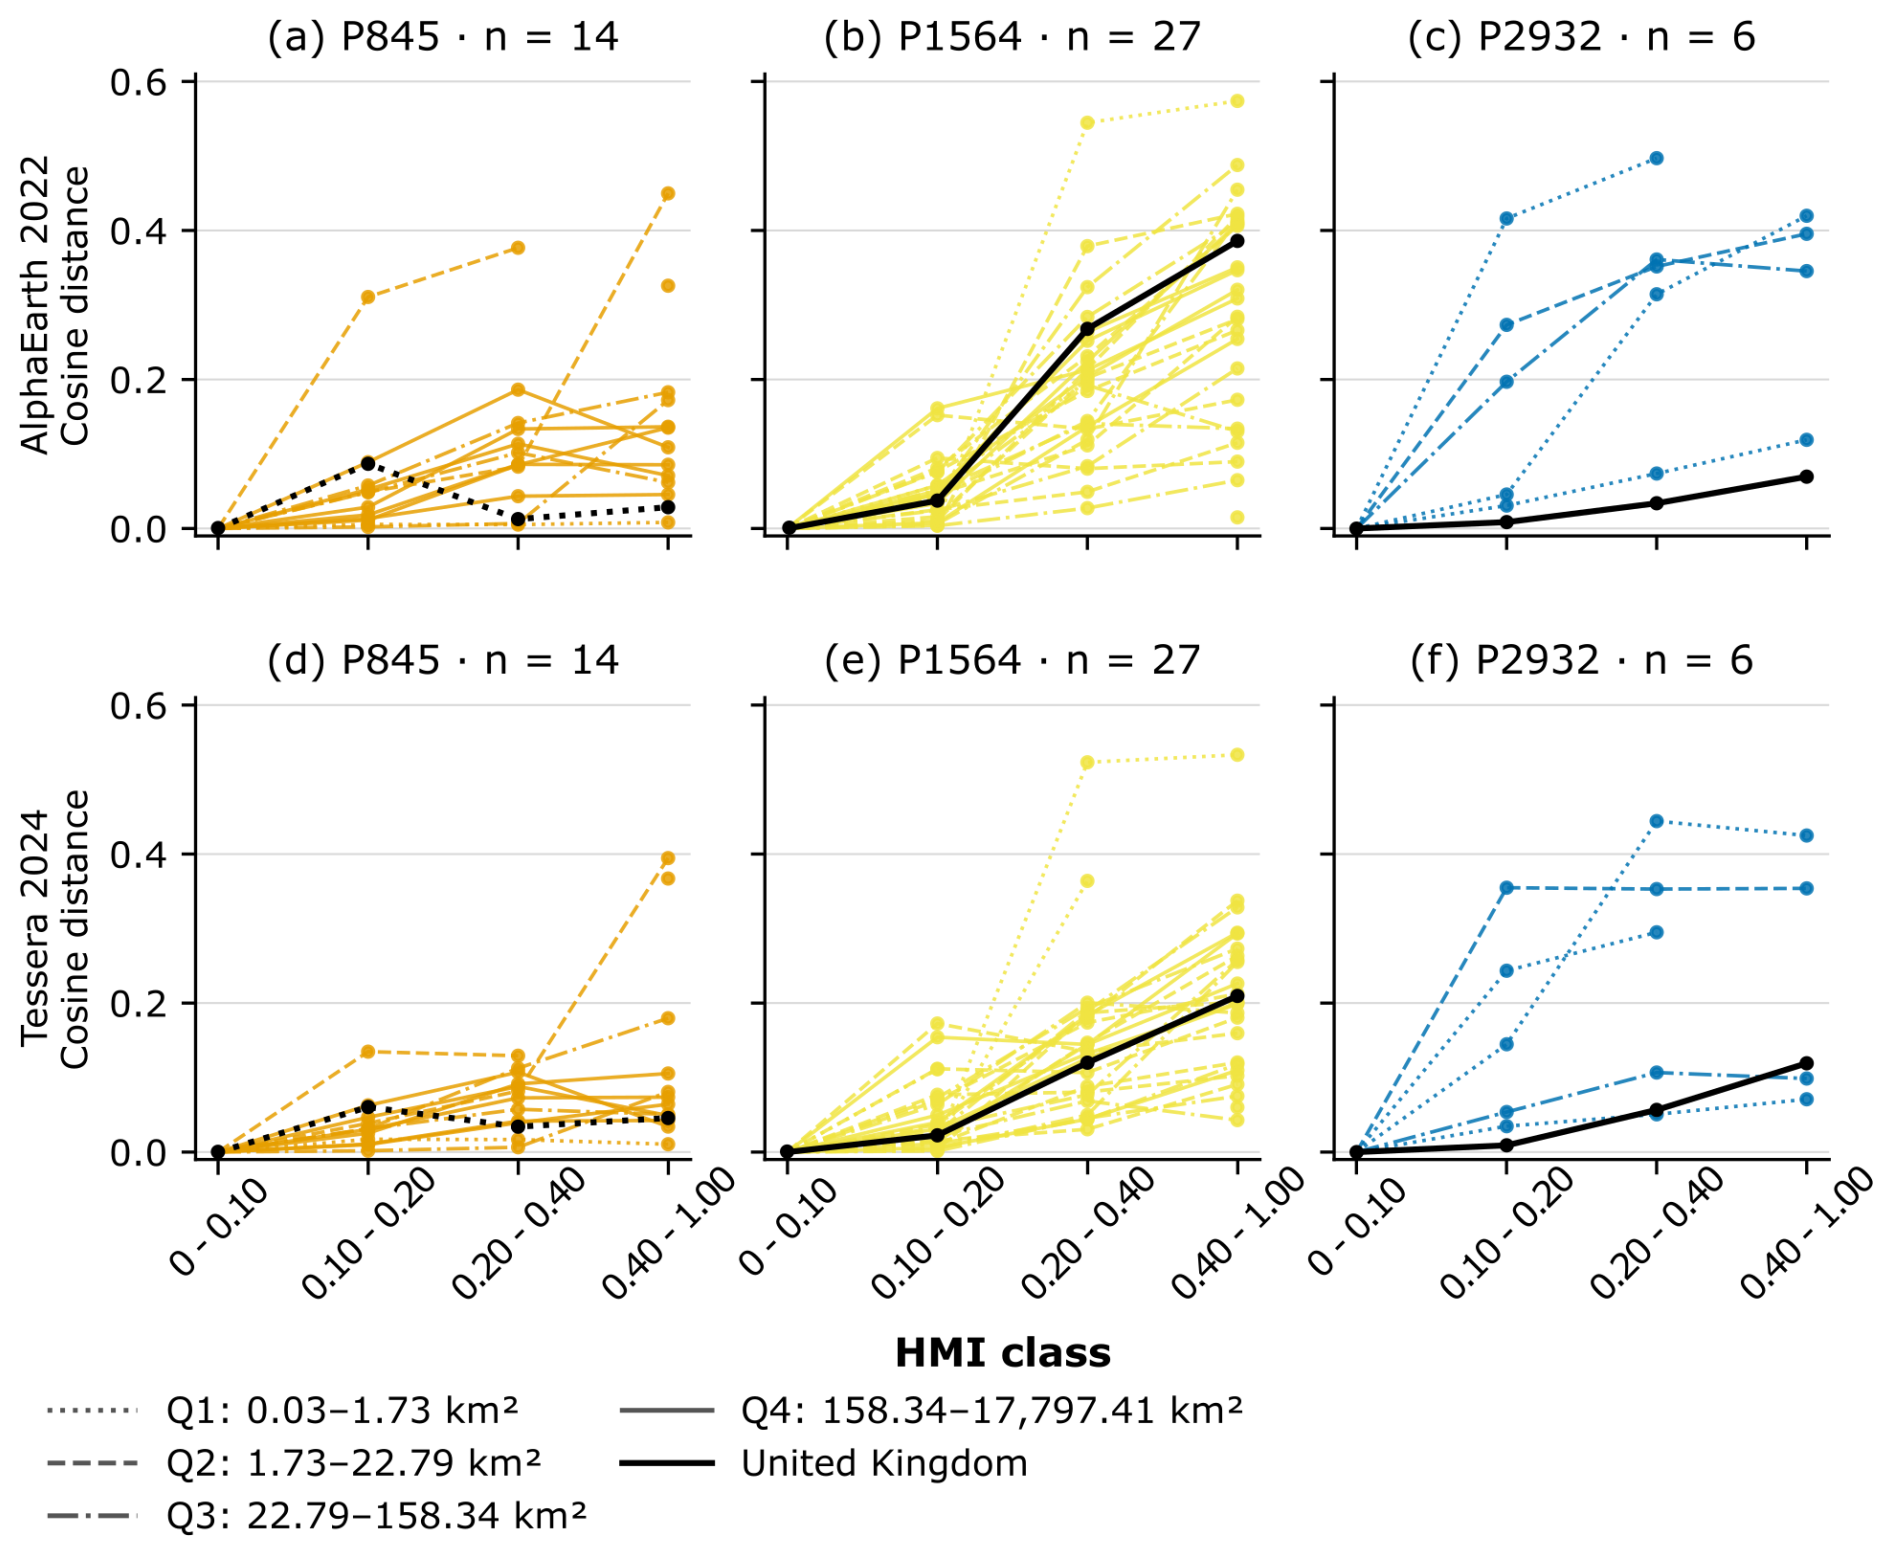
Figure 5Cosine distance between each modified HMI-class centroid and the corresponding country's candidate genosoil centroid. Panel n counts countries with a reference and at least one modified class. Countries listed in Table S2 but not shown either had no modified HMI classes (P845: Bolivia, Brazil, Georgia, Thailand; P1564: Argentina; P2932: Angola) or no HMI ≤ 0.10 reference (P1564: Belgium, France, Turkey).
P845 occurs in 18 countries (Table S2). Among the three study pedogenons, it exhibits the greatest variability in distance profiles across different countries, and the pattern observed is correspondingly less consistent than that of P1564. Within the UK, neither model showed a monotonic increase across modified classes, although reference cohesion remained high (0.93 for AlphaEarth; 0.92 for Tessera).
P1564 occurs in 31 countries, of which Belgium, France, and Turkey had no HMI ≤ 0.10 observed, and is the most extensively modified among the three studied pedogenons globally. Within the UK, only 0.19 km2 of its 724.14 km2 extent was classified as genosoil according to the HMI threshold, rendering it the most depleted local reference in the study (Table S2). Twenty-three nations have more than 1000 ha of P1564; including Belgium and France, which have no HMI defined candidate genosoil. In AlphaEarth and Tessera, 25 out of 27 country profiles with modified-bin data exhibited greater distances in the highest available modified class compared to the lowest modified class. In the UK, centroid-to-centroid cosine distance increased from 0.04 in the lowest modified class to 0.39 in the highest modified class for AlphaEarth, and from 0.02 to 0.21 for Tessera, indicating stronger separation of modification levels in AlphaEarth for this pedogenon.
P2932 occurs in seven countries, but only the UK and the USA exceed 1000 ha in pedogenon area (Table S2). Its distance gradient is weaker than that of P1564, which is consistent with soil properties that reduce development pressure and with the high proportion of UK extent remaining at HMI ≤ 0.10 (61 %; Table 3). In the UK, centroid-to-centroid cosine distance increased from 0.01 in the lowest modified class to 0.07 in the highest modified class for AlphaEarth, and from 0.01 to 0.12 for Tessera. Both models preserved the same rank ordering in the UK; however, Tessera demonstrated a larger overall dynamic range, indicating a more pronounced differentiation among the levels of modification within this pedogenon.
Together, these cross-country profiles support the use of a low-modification reference centroid within pedogenons. Across most analysed country–model profiles, centroids of more modified HMI classes were farther from their respective reference.
3.3 Cross-border genosoil embedding signal
Once the UK reference signatures were established, we compared them with candidate genosoil populations of the same pedogenon in other countries (Fig. 6). The purpose was not to redefine the UK reference but to identify external analogues, countries where the pedogenon may persist in a less modified state or where a larger candidate genosoil population provides independent corroboration of the reference signature.
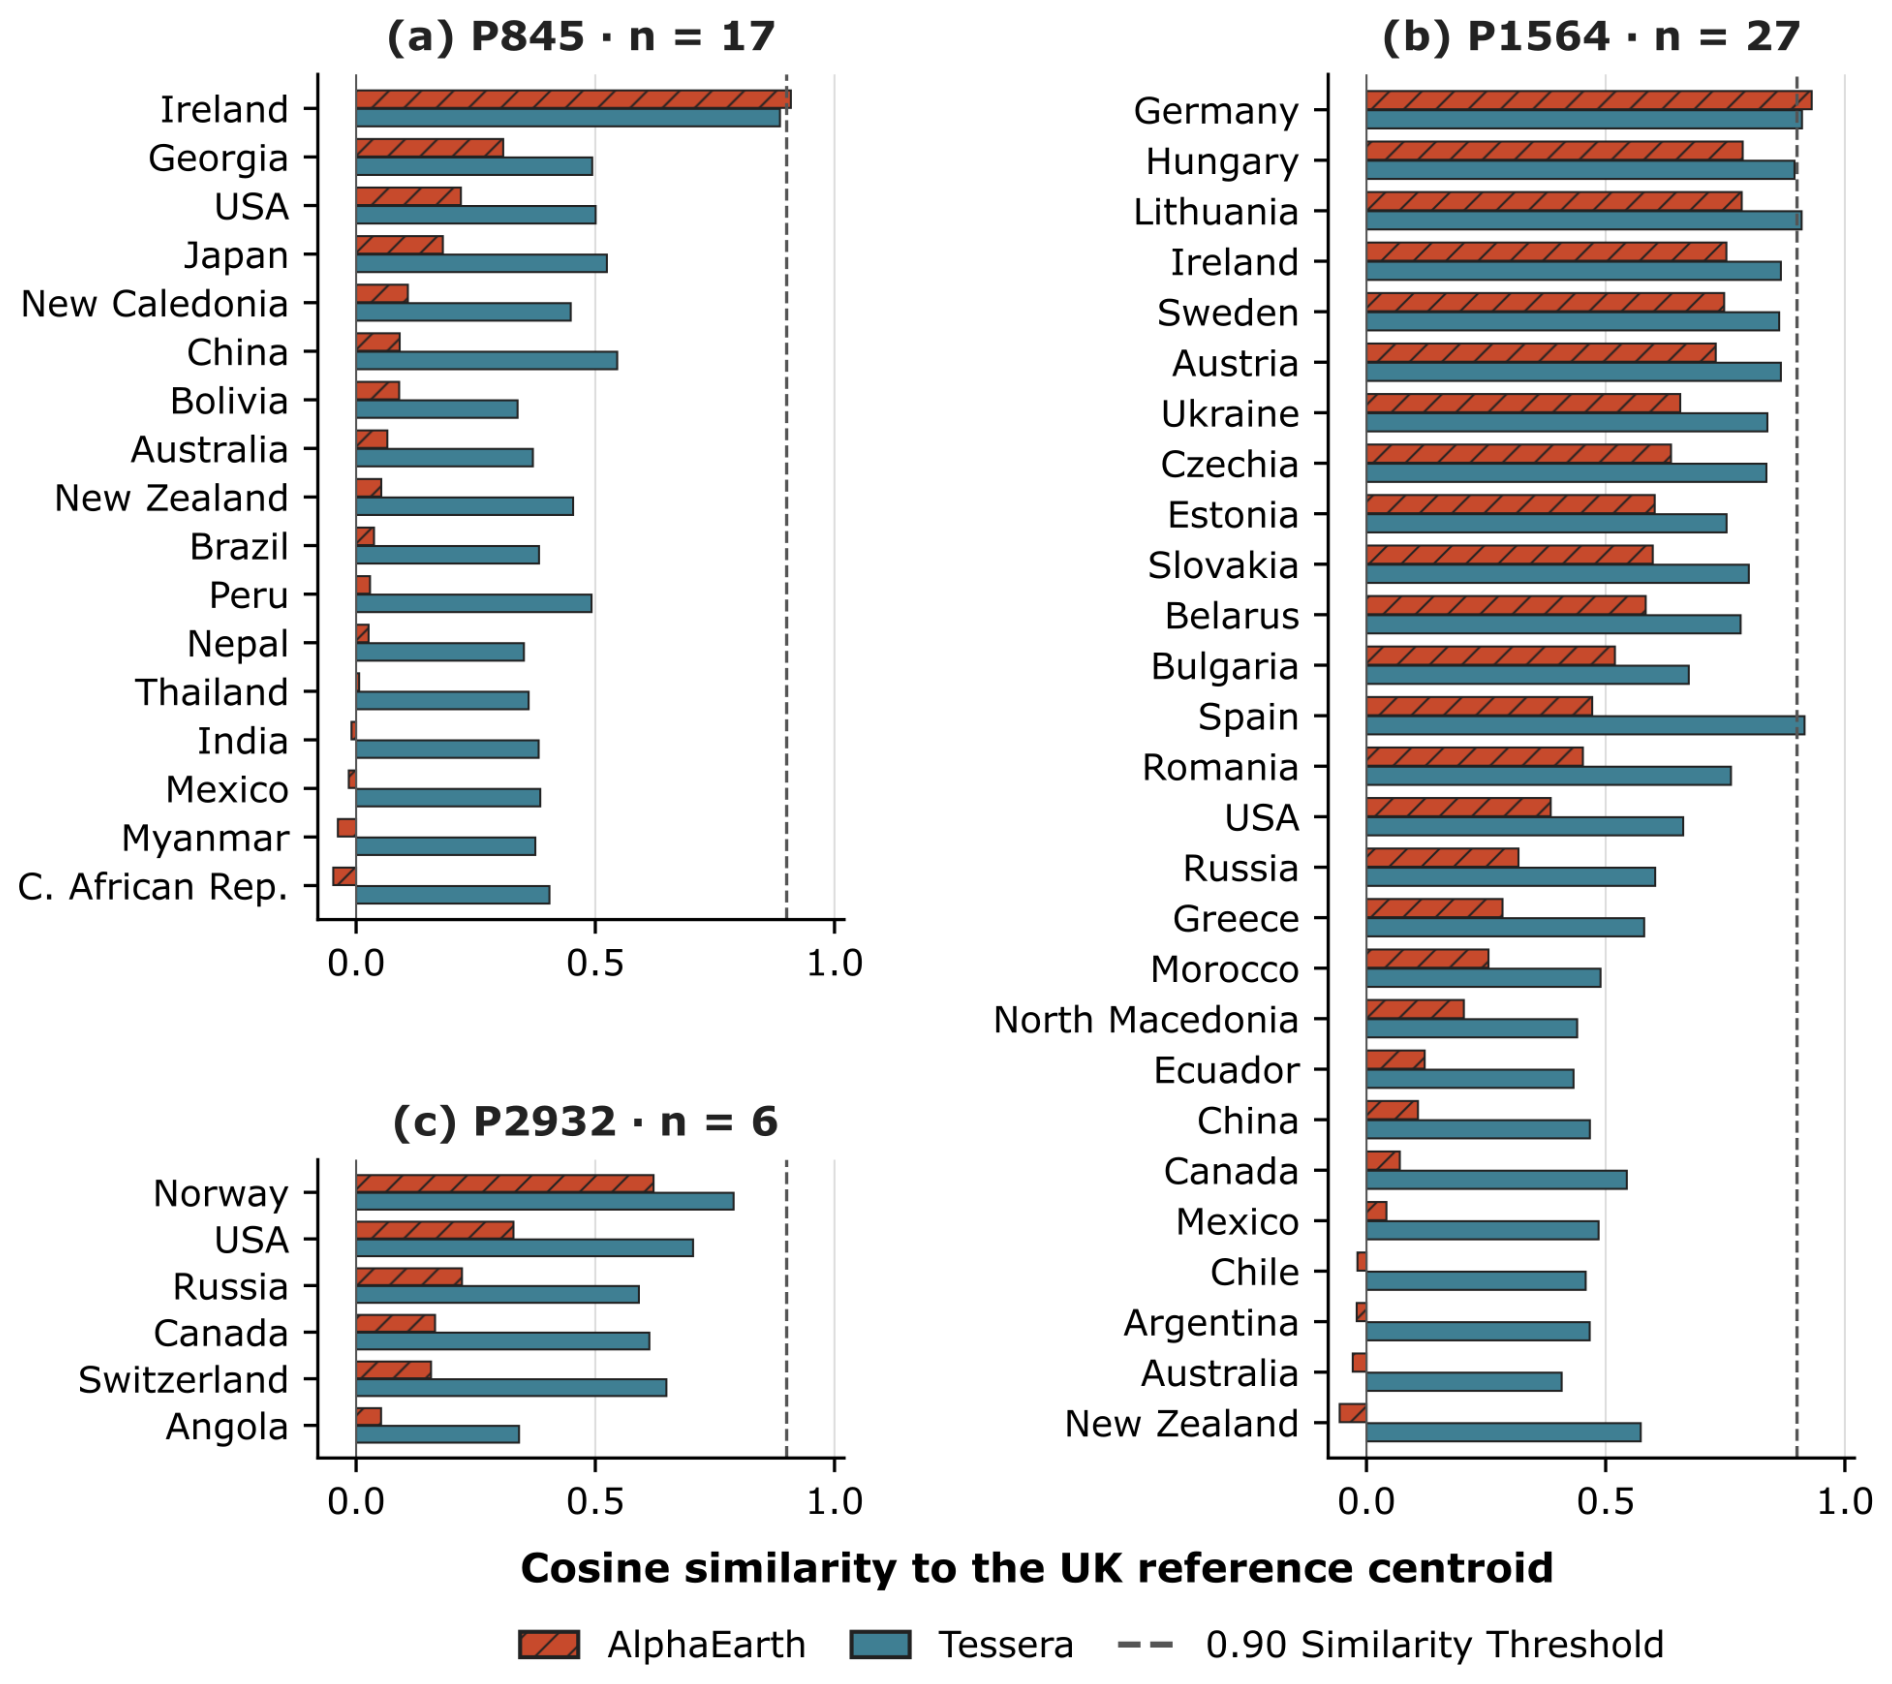
Figure 6Comparison of country-level candidate genosoil similarity to the United Kingdom reference centroid for the three study pedogenons under AlphaEarth (2022) and Tessera (2024). The bars represent the cosine similarity between each country's candidate genosoil centroid and the UK candidate genosoil centroid for the same pedogenon.
For P845, Ireland was identified as the most evident external analogue (cosine-to-UK = 0.91 AlphaEarth, 0.89 Tessera). Under AlphaEarth, the next most similar countries were Georgia (0.31), the United States (0.22), and Japan (0.18), demonstrating a decline in similarity beyond Ireland. Under Tessera, the differences were considerably less pronounced, with China (0.55), Japan (0.52), the United States (0.50), and Georgia (0.49) all maintaining moderate resemblance to the UK reference.
For P1564, this comparison produced the most practically valuable result. Despite the limited UK HMI candidate genosoil reference (0.19 km2), the embedding signature pointed clearly toward central and eastern Europe. Germany was identified as the most analogous AlphaEarth region (cosine similarity to UK = 0.93), followed by Hungary (0.79) and Lithuania (0.78). Under Tessera, Spain exhibited the highest similarity (0.92), with Germany and Lithuania closely following (both 0.91), and Hungary trailing slightly behind (0.89). The embedding signature predominantly pointed toward temperate Europe, with the strongest similarities concentrated in central, eastern, and certain western or southwestern European nations, depending on the model. Even in instances where UK genosoil is depleted, the embedding signature can point to countries potentially containing a more preserved analogue of the same pedogenon.
For P2932, the closest analogue was Norway (cosine-to-UK = 0.62 AlphaEarth, 0.79 Tessera), aligning with the shared boreal–Atlantic environmental setting. However, similarity dropped beyond Norway. Under AlphaEarth, the subsequent closest was the United States at 0.33, followed by Russia at 0.22, Canada at 0.16, Switzerland at 0.16, and Angola at 0.05. Tessera showed higher cosine similarities, with the United States at 0.70, Switzerland at 0.65, Canada at 0.61, Russia at 0.59, and Angola at 0.34. It is important to note that Norway's reference populations comprised only 146 AlphaEarth and 171 Tessera pixels, limiting the interpretation of this ranking.
In summary, these comparisons identify potential external reference analogues, with the strongest matches in temperate Europe for P1564, Norway for P2932, and Ireland for P845. Centroid similarity alone does not establish successful cross-border substitution, which is evaluated in Sect. 3.5. The country rankings reveal differences in selectivity between the two embedding products: AlphaEarth exhibits steeper declines beyond the nearest analogue, whereas Tessera maintains higher similarity across a wider geographic range.
3.4 Comparing AlphaEarth and Tessera
The cross-border analysis showed a complementary pattern: Tessera generally returned higher absolute similarity values between countries, compressing the difference between true analogues and distant non-analogues. This elevated global similarity floor means Tessera tolerates greater biogeographic distance for analogue searches but provides less discrimination between neighbouring countries. AlphaEarth offered sharper boundaries at the cost of lower absolute similarity at distance.
A plausible explanation for this contrast lies in the training objectives. During training, Tessera obtained two views of the same pixel drawn from different random time windows within the same calendar year (Feng et al., 2025). AlphaEarth's lower similarity to distant countries may reflect stronger discrimination of climate and relief, which were included as reconstruction targets (Brown et al., 2025); Tessera, trained on Sentinel-1 and Sentinel-2 time series (Feng et al., 2025), retained higher similarities across countries.
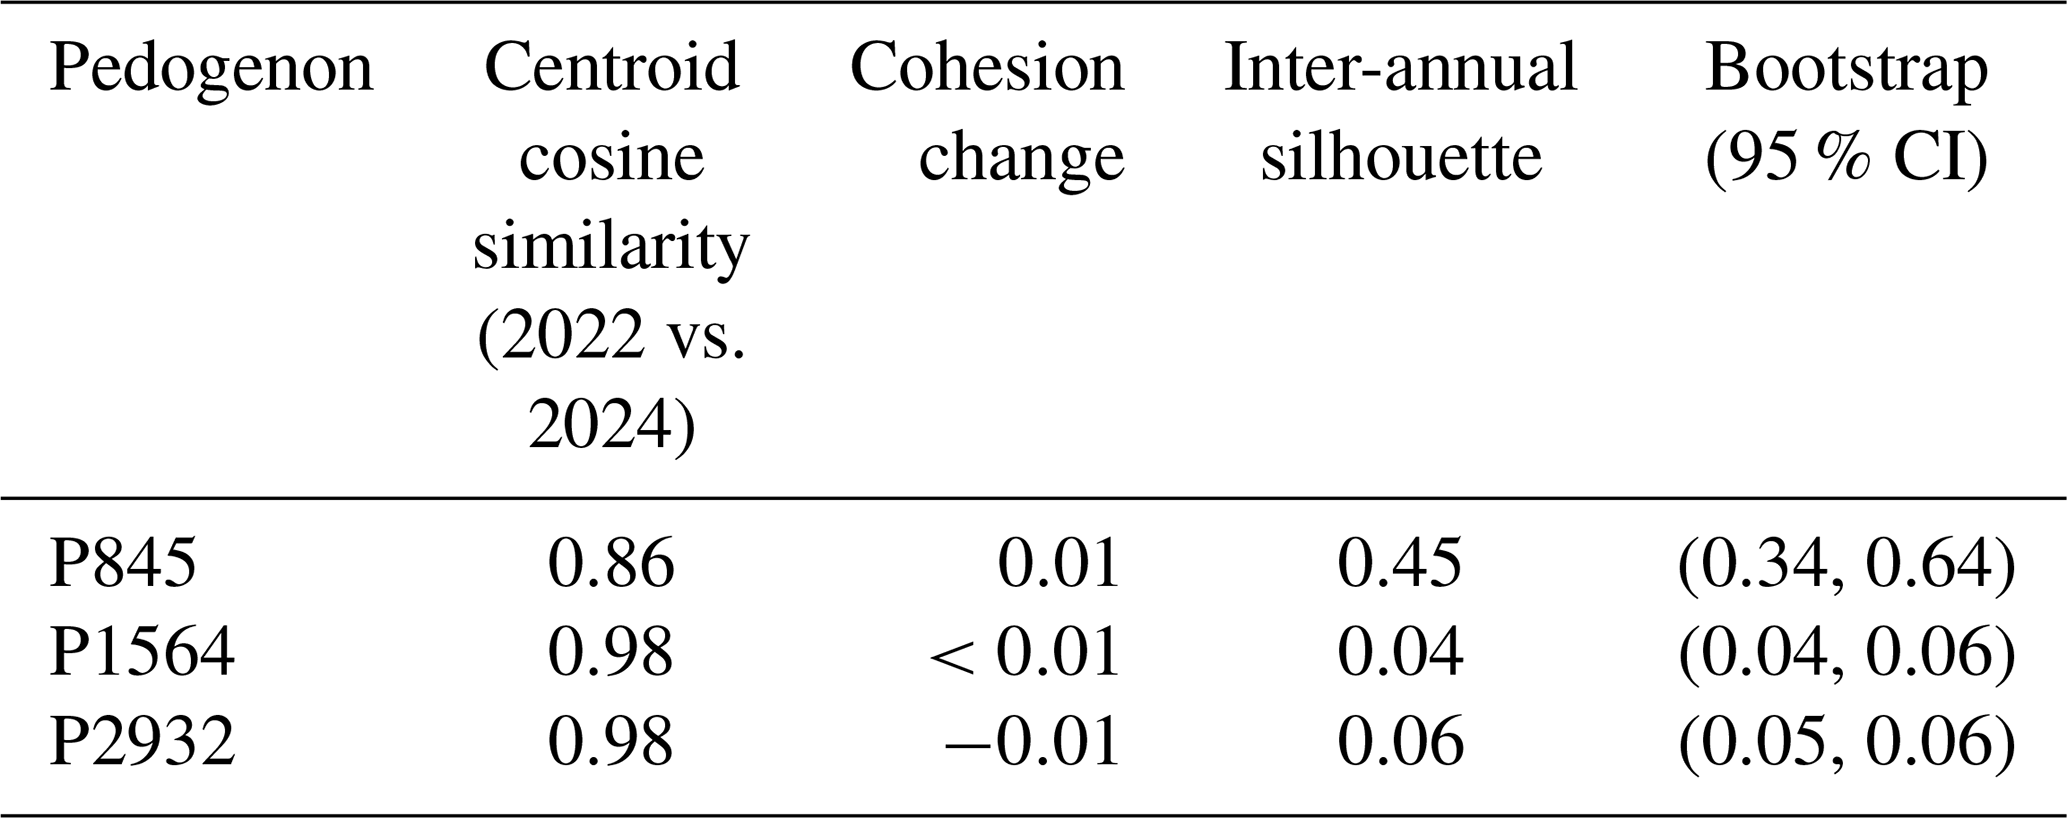
Because the cross-country Tessera comparison used the globally available 2024 product rather than 2022, temporal stability was assessed at matching UK low-HMI reference locations (Tables 4 and S3). Centroid cosine similarities between years were 0.86, 0.98 and 0.98, and mean silhouettes were 0.45, 0.04 and 0.06 for P845, P1564 and P2932, respectively. P845 therefore showed greater differences between years. Its small local reference population further supports investigating reference soils elsewhere.
Table 4Stability of Tessera embeddings at UK genosoil locations from 2022 to 2024 for pixels intersecting HMI ≤ 0.10. Centroid cosine similarity compares the 2022 and 2024 UK candidate genosoil centroids. Cohesion change is the difference in cohesion between 2024 and 2022. Higher mean silhouette values indicate greater separation between the annual embedding populations.
3.5 Cross-border candidate genosoil centroid
The preceding sections established two points. Firstly, embedding-derived genosoil maps can be generated from local low-HMI reference populations within each pedogenon. Secondly, the global comparison identified a limited number of countries whose candidate genosoil centroids were more similar to the UK reference than the rest of the pedogenon's worldwide distribution. The subsequent inquiry concerns whether these non-UK centroids can serve as practical substitutes in instances where the UK reference data are sparse or absent. This directly addresses the third objective of the study: assessing whether genosoil signatures can be transferred across political boundaries when local reference data are limited.
Using the strongest non-UK analogue identified for each pedogenon, we then tested whether the foreign-derived centroid reproduced the UK delineation (Table 5). Results indicate that substitution was limited rather than general. Two of the three pedogenons showed no meaningful transferability under either model, and the single informative positive case was P1564.
Table 5Cross-border substitution results for the strongest non-UK analogue of each pedogenon. Intersection, union and IoU compare the UK candidate genosoil areas delineated using the UK reference centroid (local) and the selected non-UK reference centroid (foreign-derived). Intersection is the area selected by both delineations; union is the area selected by either delineation; IoU is their intersection divided by their union. AlphaEarth uses 2022 data and Tessera uses 2024 data (see Sect. 2.2).
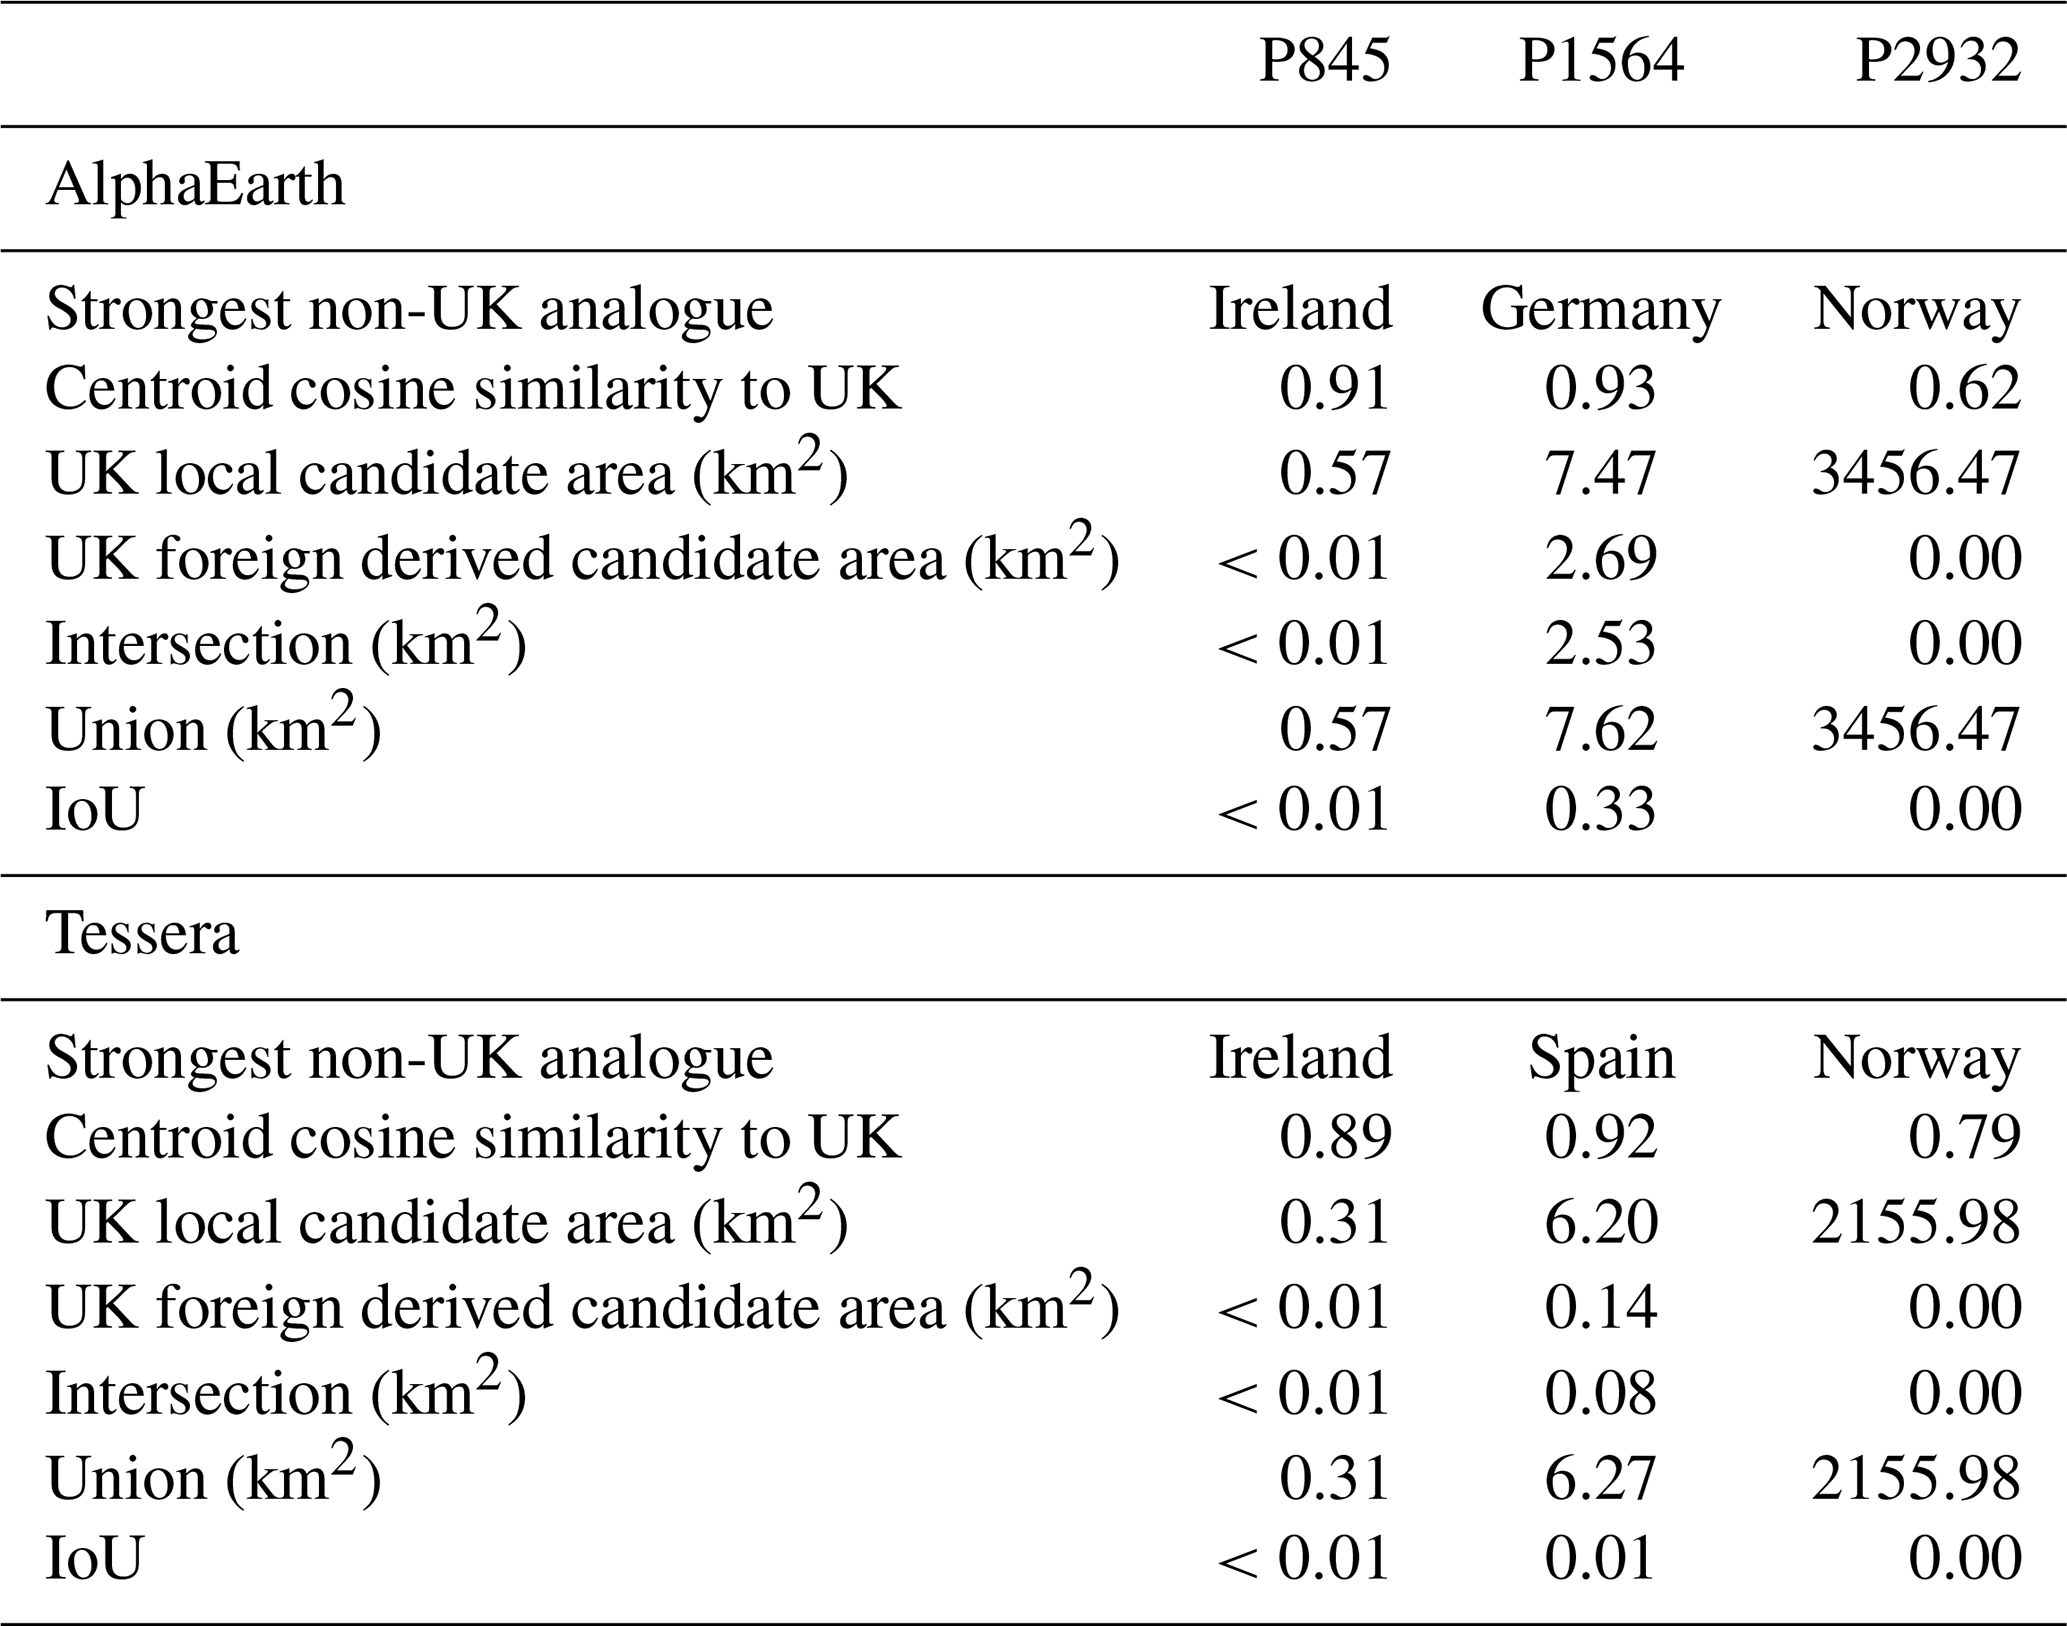
P1564 provides the clearest positive case because it is the most extensively modified agricultural pedogenon in the UK and retains almost no HMI-defined genosoil locally. Under AlphaEarth, Germany was the strongest external analogue (cosine-to-UK = 0.93), and the Germany-derived genosoil showed moderate overlap with the UK-derived extent (IoU = 0.33), recovering 2.53 km2 of overlapping candidate area despite the severe depletion of the UK reference population. Under Tessera, Spain rather than Germany was the strongest external analogue, although the difference was minimal (0.92 vs. 0.91). Substitution performance nevertheless remained weak: the Spain-derived Tessera centroid produced 0.14 km2 of UK genosoil extent, of which 0.08 km2 overlapped the UK-derived 2024 Tessera delineation (IoU = 0.01). P1564 therefore supports a cautious conclusion: where local genosoil has been strongly depleted, a biogeographically coherent external analogue may partially recover the local pattern.
P845 did not produce a viable substitute under either model. Although Ireland was the closest and most plausible external analogue, overlap with the UK-derived delineation for both AlphaEarth and Tessera was negligible.
P2932 also failed as a transfer case. Norway was the most comparable non-UK analogue; however, neither model produced a meaningful delineation of the UK substitute from the foreign centroid. For both AlphaEarth and Tessera, the foreign-derived mask within the UK was effectively absent, resulting in no meaningful overlap with the local UK delineation.
In summary, these findings indicate that cross-border substitution may be advantageous under specific conditions; however, it did not function as a widely applicable method within the current workflow and thresholds. Its value lies not in the complete replacement of local references but in the possibility of partial recovery in cases of severe local depletion, as demonstrated by P1564.
3.6 Interpretation and methodological limits
Soil properties can differ considerably even over short distances. The ideal foundation for genosoil delineation would be a global inventory of field-validated soil series or equivalent fine-grained soil bodies; however, such a dataset is currently unavailable at the necessary spatial coverage and resolution. The GPM addresses this gap by providing a covariate-driven, process-oriented spatial framework at 90 m resolution, without which the present analysis would not be possible. At the same time, our results indicate that a shared pedogenon label may still encompass very disparate soils, and fieldwork is needed to determine whether this reflects limitations of the pedogenon map, such as too few classes, need for more variables, or instead reflects anthropogenic modification that may be reversible if the pressure subsides but currently leads to very disparate soils. Time, one of the soil-forming factors, spans from extremely recent events such as landslides, to glaciation events tens of thousands of years ago, to highly stable soils that have developed over millions of years. Román Dobarco et al. (2021a) included the Weathering Intensity Index from airborne gamma-ray spectrometry across Australia to account for time; however, these data are not yet available globally. The pedogenic variable of time is therefore an important area of research to improve pedogenon maps.
The three case studies illustrate differences in mapped taxonomic diversity and embedding behaviour. P2932 demonstrates the lowest WRB diversity (; Podzols 73 %, Cambisols 21 %; Table S4), although its US reference populations were less cohesive than the UK populations (Table S2). Conversely, P1564 is taxonomically heterogeneous (; Table S4), and the similarity of its reference centroid to the UK is higher within temperate Europe than beyond this region. This interpretation requires caution because Hengl et al. (2017) reported map purity below 50 % for Phaeozems, something further emphasised by a classification discrepancy between SoilGrids and gSSURGO, which classifies the US occurrence of P1564 primarily as Udipsamments (Table S5). P845 (; Acrisols 48 %, Cambisols 26 %) illustrates the most notable case: the UK–Ireland genosoil relationship appears plausible given their shared Atlantic, mesic-thermic Acrisol environment; however, its global distribution extends to tropical and subtropical regions such as Japan, Nepal, China, and Peru, which together account for nearly 50 % of the global P845 extent. In these regions, Acrisols develop under monsoon and subtropical regimes, characterised by distinct weathering histories, vegetation assemblages, and land-use pressures. The embedding results corroborate this disjunction: most non-Atlantic countries showed low AlphaEarth cosine-to-UK values, although Georgia (0.31) and the United States (0.22) were above 0.20 (Table S2), indicating that the shared pedogenon label does not necessarily imply a transferable genosoil reference.
Limited transferability does not necessarily indicate a limitation of the GPM since these results may be due to land-use history, which can alter the present condition of a soil within the same pedogenon. Previous cultivation, drainage or plantation forestry can leave persistent changes in soil properties that are not apparent from present vegetation cover or a low HMI value. The land-cover comparison (Table S8) and satellite imagery (Fig. S1 in the Supplement) provide supporting context for selecting candidate reference areas, but historical information and field characterisation remain necessary to assess their suitability as genosoil references.
A further limitation is that the present workflow still depends on HMI to define the initial local reference population. This is operationally necessary because HMI remains the only globally available disturbance framework for genosoil delineation, but it also constrains the analysis to the assumptions and spatial grain of that proxy. The embeddings therefore are not yet being used to define genosoil independently; rather, they are being used to refine and extend an HMI-anchored reference. Future work should test whether embedding clustering, combined with ground validation and pedological interpretation, can identify coherent genosoil populations without relying exclusively on fixed HMI thresholds.
The delineation of genosoil in this study was based on the current globally available operational reference, the HMI. However, the results demonstrate that spatial embeddings can extend this framework beyond the limitations of HMI alone. At a resolution of 10 m, the embeddings did not merely reflect HMI classes; rather, they captured a reproducible surface-state signal within each pedogenon that was generally associated with lower levels of human modification and consistent local reference conditions. Even where genosoil availability was limited, the reference populations remained internally cohesive (Table S1), and within reference regions, the pixels with the lowest HMI values were typically the most similar to the candidate genosoil centroid. This suggests that spatial embeddings are more useful for identifying and ranking plausible genosoil candidates than for exact classification. Across the three case studies, similarity patterns followed biogeographic and pedological coherence more closely than pedogenon labels alone: P2932 remained largely boreal, P845 was concentrated in nearby European analogue regions, and P1564 linked the UK most strongly with temperate European analogue regions. The clearest positive example was P1564, in which severe local depletion still permitted partial recovery of the UK pattern, more distinctly under AlphaEarth than under Tessera. Conversely, cross-border substitution, as implemented here within the proposed workflow and thresholds, needs improvement, with two of the three pedogenons showing no meaningful replacement of the local delineation by non-local references.
The country analysis, in Table S2, also showed how scarce reference soils have become: P1564 retained no HMI-defined candidate genosoil in Belgium, France or Turkey, and less than 1 % of its area in nine further countries, including the UK and Germany. For such pedogenons, embedding-derived candidate populations may offer the only practical set of sites for field assessment, locally or in other countries, underlining the importance of this research.
Two steps follow directly from these results. First, the candidate populations identified here should be checked in the field: the method selects candidates, and only profile description can confirm that a low-modification surface signature corresponds to a minimally disturbed soil. Second, pedogenon products would benefit from integrating a covariate for time such as the Weathering Intensity Index; however, these datasets are not yet available globally. Operationally, the approach can identify candidate reference sites at 10 m needed to understand soil condition, in which soil measurements are interpreted against a minimally disturbed soil of similar pedogenesis.
The analysis code used in this study is archived on Zenodo and available at https://doi.org/10.5281/zenodo.19424156 (Pachón Maldonado et al., 2026).
Candidate genosoil 10 m products available on Zenodo (https://doi.org/10.5281/zenodo.19424156, Pachón Maldonado et al., 2026). AlphaEarth spatial embeddings: Brown et al. (2025). Tessera spatial embeddings: Feng et al. (2025). Global Pedogenon Map data: Francos et al. (2025b); data available at https://doi.org/10.5281/zenodo.15678953 (Francos et al., 2025c). Human Modification Index: Theobald et al. (2020, 2025).
The supplement related to this article is available online at https://doi.org/10.5194/soil-12-1213-2026-supplement.
JCPM: Conceptualisation, Data curation, Formal analysis, Investigation, Methodology, Project administration, Software, Visualisation, Writing – original draft, and Writing – review and editing. JP: Conceptualisation, Methodology, Supervision, and Writing – review and editing. QS: Writing – review and editing. AM: Funding acquisition, Resources, Supervision, and Writing – review and editing.
The contact author has declared that none of the authors has any competing interests.
Publisher's note: Copernicus Publications remains neutral with regard to jurisdictional claims made in the text, published maps, institutional affiliations, or any other geographical representation in this paper. The authors bear the ultimate responsibility for providing appropriate place names. Views expressed in the text are those of the authors and do not necessarily reflect the views of the publisher.
We gratefully acknowledge the use of Google Earth Engine for geospatial data processing and analysis. We thank the University of Sydney for the institutional and computing support that made this work possible. We also thank the Soil Security team for their support, discussion, and for fostering the collaborative research environment in which this study was developed.
Claude Opus 4.6 and 5.5, as well as GPT-5.5 were used for coding and workflow assistance. All scientific analyses, interpretations, claims, and final manuscript text were produced, verified, and approved by the authors.
This research was supported by the Australian Research Council Laureate Fellowship (grant no. FL210100054) on Soil Security, titled A Calculable Approach to Securing Australia's Soils.
This paper was edited by David G. Rossiter and reviewed by Marijn van der Meij and one anonymous referee.
Amundson, R., Guo, Y., and Gong, P.: Soil Diversity and Land Use in the United States, Ecosystems, 6, 470–482, https://doi.org/10.1007/s10021-002-0160-2, 2003.
Bockheim, J. G.: Soil endemism and its relation to soil formation theory, Geoderma, 129, 109–124, https://doi.org/10.1016/j.geoderma.2004.12.044, 2005.
Brown, C. F., Kazmierski, M. R., Pasquarella, V. J., Rucklidge, W. J., Samsikova, M., Zhang, C., Shelhamer, E., Lahera, E., Wiles, O., Ilyushchenko, S., Gorelick, N., Zhang, L. L., Alj, S., Schechter, E., Askay, S., Guinan, O., Moore, R., Boukouvalas, A., and Kohli, P.: AlphaEarth Foundations: An embedding field model for accurate and efficient global mapping from sparse label data, arXiv [preprint], arXiv:2507.22291, https://doi.org/10.48550/arXiv.2507.22291, 2025.
Dazzi, C. and Papa, G. L.: Soil genetic erosion: New conceptual developments in soil security, Int. Soil Water Conserv. Res., 7, 317–324, https://doi.org/10.1016/j.iswcr.2019.08.001, 2019.
Dror, I., Yaron, B., and Berkowitz, B.: The human impact on all soil-forming factors during the anthropocene, ACS Environ. Au, 2, 11–19, https://doi.org/10.1021/acsenvironau.1c00010, 2021.
Evangelista, S. J., Field, D. J., McBratney, A. B., Minasny, B., Ng, W., Padarian, J., Román Dobarco, M., and Wadoux, A. M. J.-C.: A proposal for the assessment of soil security: Soil functions, soil services and threats to soil, Soil Security, 10, 100086, https://doi.org/10.1016/j.soisec.2023.100086, 2023.
Feng, Z., Atzberger, C., Jaffer, S., Knezevic, J., Sormunen, S., Young, R., Lisaius, M. C., Immitzer, M., Jackson, T., Ball, J., Coomes, D. A., Madhavapeddy, A., Blake, A., and Keshav, S.: TESSERA: Temporal Embeddings of Surface Spectra for Earth Representation and Analysis, arXiv [preprint], arXiv:2506.20380, https://doi.org/10.48550/arXiv.2506.20380, 2025.
Francos, N., Jayasekara, T., Ng, W., Sharififar, A., Styc, Q., Watt, D. J., and McBratney, A.: Delineating Genosoils and Phenosoils in Europe Using the Global Pedogenon Map, Eur. J. Soil Sci., 76, e70249, https://doi.org/10.1111/ejss.70249, 2025a.
Francos, N., Sharififar, A., Flynn, T., Styc, Q., Evangelista, S. J., Padarian, J., Ng, W., Field, D. J., Minasny, B., and McBratney, A. B.: The global pedogenon map: Combining and spatialising the factors of soil formation, Geoderma, 460, 117462, https://doi.org/10.1016/j.geoderma.2025.117462, 2025b.
Francos, N., Sharififar, A., Flynn, T., Styc, Q., Evangelista, S. J., Padarian, J., Ng, W., Field, D., Minasny, B., and McBratney, A.: The Global Pedogenon Map: Combining and Spatialising the Factors of Soil Formation, Zenodo [data set], https://doi.org/10.5281/zenodo.15678953, 2025c.
Hengl, T., Mendes de Jesus, J., Heuvelink, G. B. M., Ruiperez Gonzalez, M., Kilibarda, M., Blagotić, A., Shangguan, W., Wright, M. N., Geng, X., Bauer-Marschallinger, B., Guevara, M. A., Vargas, R., MacMillan, R. A., Batjes, N. H., Leenaars, J. G. B., Ribeiro, E., Wheeler, I., Mantel, S., and Kempen, B.: SoilGrids250m: Global gridded soil information based on machine learning, PLOS ONE, 12, e0169748, https://doi.org/10.1371/journal.pone.0169748, 2017.
Huggett, R. J.: Soil as a System, in: Hydrogeology, Chemical Weathering, and Soil Formation, edited by: Hunt, A., Egli, M., and Faybishenko, B., Wiley, Hoboken, NJ, 1–20, https://doi.org/10.1002/9781119563952.ch1, 2021.
Ibáñez, J. J., Krasilnikov, P. V., and Saldaña, A.: Archive and refugia of soil organisms: applying a pedodiversity framework for the conservation of biological and non-biological heritages, J. Appl. Ecol., 49, 1267–1277, https://doi.org/10.1111/j.1365-2664.2012.02213.x, 2012.
Jang, H. J., Dobarco, M. R., Minasny, B., Campusano, J. P., and McBratney, A.: Assessing human impacts on soil organic carbon change in the Lower Namoi Valley, Australia, Anthropocene, 43, 100393, https://doi.org/10.1016/j.ancene.2023.100393, 2023.
Minasny, B., McBratney, A. B., and Hartemink, A. E.: Global pedodiversity, taxonomic distance, and the World Reference Base, Geoderma, 155, 132–139, https://doi.org/10.1016/j.geoderma.2009.04.024, 2010.
Pachón Maldonado, J. C., Padarian, J., Styc, Q., and McBratney, A.: Use of Spatial Embeddings in Genosoil Identification: analysis code and UK candidate genosoil maps, Zenodo [code and data set], https://doi.org/10.5281/zenodo.19424156, 2026.
Rahman, M.: Physically Interpretable AlphaEarth Foundation Model Embeddings Enable LLM-Based Land Surface Intelligence, arXiv [preprint], arXiv:2602.10354, https://doi.org/10.48550/arXiv.2602.10354, 2026.
Richter, D. de B.: Humanity's transformation of Earth's soil: Pedology's new frontier, Soil Sci., 172, 957–967, https://doi.org/10.1097/ss.0b013e3181586bb7, 2007.
Richter, D. de B. and Yaalon, D. H.: “The changing model of soil” revisited, Soil Sci. Soc. Am. J., 76, 766–778, https://doi.org/10.2136/sssaj2011.0407, 2012.
Richter, D. de B., Eppes, M. C., Austin, J. C., Bacon, A. R., Billings, S. A., Brecheisen, Z., Ferguson, T. A., Markewitz, D., Pachon, J., Schroeder, P. A., and Wade, A. M.: Soil production and the soil geomorphology legacy of Grove Karl Gilbert, Soil Sci. Soc. Am. J., 84, 1–20, https://doi.org/10.1002/saj2.20030, 2020.
Román Dobarco, M., McBratney, A., Minasny, B., and Malone, B.: A modelling framework for pedogenon mapping, Geoderma, 393, 115012, https://doi.org/10.1016/j.geoderma.2021.115012, 2021a.
Román Dobarco, M., McBratney, A., Minasny, B., and Malone, B.: A framework to assess changes in soil condition and capability over large areas, Soil Secur., 4, 100011, https://doi.org/10.1016/j.soisec.2021.100011, 2021b.
Román Dobarco, M., Padarian Campusano, J., McBratney, A. B., Malone, B., and Minasny, B.: Genosoil and phenosoil mapping in continental Australia is essential for soil security, Soil Secur., 13, 100108, https://doi.org/10.1016/j.soisec.2023.100108, 2023.
Rousseeuw, P. J.: Silhouettes: a graphical aid to the interpretation and validation of cluster analysis, J. Comput. Appl. Math., 20, 53–65, https://doi.org/10.1016/0377-0427(87)90125-7, 1987.
Soil Survey Staff: Gridded Soil Survey Geographic (gSSURGO) Database for the Conterminous United States, FY2026 release, United States Department of Agriculture, Natural Resources Conservation Service [data set], https://nrcs.app.box.com/v/soils (last access: 8 September 2026), 2026.
Styc, Q., Minasny, B., Jang, H. J., and McBratney, A.: Modelling soil organic carbon dynamics at the continental extent using pedogenon mapping, Eur. J. Soil Sci., 76, e70070, https://doi.org/10.1111/ejss.70070, 2025.
Theobald, D. M., Kennedy, C., Chen, B., Oakleaf, J., Baruch-Mordo, S., and Kiesecker, J.: Earth transformed: detailed mapping of global human modification from 1990 to 2017, Earth Syst. Sci. Data, 12, 1953–1972, https://doi.org/10.5194/essd-12-1953-2020, 2020.
Theobald, D. M., Oakleaf, J. R., Moncrieff, G., Voigt, M., Kiesecker, J., and Kennedy, C. M.: Global extent and change in human modification of terrestrial ecosystems from 1990 to 2022, Sci. Data, 12, 606, https://doi.org/10.1038/s41597-025-04892-2, 2025.