
the Creative Commons Attribution 4.0 License.
the Creative Commons Attribution 4.0 License.
 | 08 Dec 2025
The potential of reed canary grass and the importance of field heterogeneity for reducing GHG emissions in a rewetting fen peatland
Andres F. Rodriguez

Johannes W. M. Pullens
Jesper R. Christiansen
Klaus S. Larsen
Poul E. Lærke
Rewetting drained peatlands can reduce CO2 emissions but prevents traditional agriculture. Crop production under rewetted conditions may continue with flood-tolerant crops in paludiculture, but its effects on greenhouse gas (GHG) emissions compared to rewetting without further management are largely unknown. This study was conducted between 2021 and 2022 on a fen peatland in central Denmark established with Phalaris arundinacea L. (Reed Canary Grass) in 2018. Three harvest/fertilization management treatments (0, 2, and 5-cut) were applied with the 2-cut and 5-cut treatments receiving 200 kg N ha−1 yr−1 in equal split doses, whereas the 0-cut remained unfertilized. Measurements of CO2 and CH4 emissions were conducted biweekly under four different light intensities using a manual chamber connected to a gas analyzer. Although the mean annual water table depth (WTD) was −8 cm, indicating a rather wet peatland, the site remained a CO2 source with a mean net ecosystem C balance (NECB) of 6.6 t C ha−1 yr−1 across treatments. Methane emissions averaged 90 kg CH4-C ha−1 yr−1, equivalent to 11.7 % of NECB given as CO2 equivalents. Results showed that management marginally increased biomass production reflected by more negative gross primary productivity (GPP) in 2-cut and 5-cut compared to 0-cut. No significant treatment effect was found on NECB due to field heterogeneity reflected by differences in pore water nutrient concentrations and WTD dynamics among the studied blocks, with higher Reco corresponding to blocks where higher pore water nutrient concentrations were observed. The results indicated that GHG emissions might potentially be reduced when the biomass is harvested from the more productive peatland area in comparison with no management, whereas on the less productive area it might be beneficial to leave the biomass unmanaged. Model simulation of ecosystem respiration (Reco) using WTD data of high temporal resolution captured the variability better as compared to the use of mean annual WTD, which underestimated Reco by 18 % on average compared to the hourly WTD model. Data on pore water chemistry further improved statistical linear models of CO2 fluxes using soil temperature (Ts), WTD, ratio vegetation index (RVI) and photosynthetic active radiation (PAR) as explanatory variables. Overall, from a climate perspective the study supported biomass production compared to no management activity in rewetted fertile peatlands.
- Article
(6665 KB) - Full-text XML
- BibTeX
- EndNote


Peatlands are an essential component of the global carbon (C) cycle. Covering only 3 % of the terrestrial surface they store ∼ 600 Gt of C, equivalent to 30 % of the global soil C pool and exceeding the C stored in vegetation by ∼ 150 Gt (Yu et al., 2010; Scharlemann et al., 2014; Erb et al., 2018; Leifeld and Menichetti, 2018). Northern temperate peatlands can be classified as bogs or fens and store 21.9 Gt C (Leifeld and Menichetti, 2018). While bogs are rain fed and nutrient poor, fens receive drain and ground water from the upland and occasionally from the streams under flooding conditions, making them minerotrophic with a pH close to neutral because the incoming waters carry minerals released from surrounding soils and sediments. Under high nutrient concentrations, fens are dominated by grasses and sedges such as Phragmites sp. and Cladium sp. (Page and Baird, 2016; Kreyling et al., 2021).
Peatland drainage creates aerobic conditions leading to peat mineralization, and consequently soil C is emitted as CO2 to the atmosphere (Page and Baird, 2016), and dissolved C and nitrogen (N) compounds are leached from the soil (Cabezas et al., 2012; Liu et al., 2019). Emissions from drained peatlands are estimated globally to 785 Mt CO2 equivalents and the water table is considered the main controlling factor (Zhong et al., 2020; Evans et al., 2021) with higher water tables resulting in lower CO2 emissions (Tiemeyer et al., 2020; Evans et al., 2021; Koch et al., 2023). However, other factors such as soil temperature (Ts), vegetation, and nutrient status may also affect CO2 emissions from drained peat soils (Wilson et al., 2016; Rigney et al., 2018; Bockermann et al., 2024). While rewetting reduces CO2 emissions, it may also lead to increased CH4 emissions (Wilson et al., 2016; Zhong et al., 2020; Darusman et al., 2023). The CO2/CH4 emission trade-off depends on the water table, the origin of the water (bog/fen), type of vegetation (Rigney et al., 2018; Purre et al., 2019), its nutrient status (Wilson et al., 2016; Tiemeyer et al., 2020), as well as gradual changes in the microbial community following rewetting (Putkinen et al., 2018; Hemes et al., 2019; Emsens et al., 2020; Urbanova and Bárta, 2020); However, even considering temporary increases in CH4 emissions, peatland rewetting and restoration leads to the reestablishment of the C sink function of these ecosystems (Leifeld et al., 2019; Loisel and Gallego-Sala, 2022). Upon drainage, degradation of peat soils is manifested by increases in peat bulk density (Liu et al., 2019; Loisel and Gallego-Sala, 2022), and peat chemistry changes leading to decreasing C : N ratio, humic compounds, and polyphenols, while dissolved organic C (DOC) and N (DON) increase, these changes in peat chemistry may in turn enhance organic matter mineralization (Cabezas et al., 2012; Liu et al., 2019; Zak et al., 2019), and the release of nutrients along with higher bacterial and fungal activity increases CO2 emissions (AminiTabrizi et al., 2022; Song et al., 2022).
The importance of peatlands for C storage and GHG emission mitigation, as well as other environmental services, has sparked an interest in peatland restoration with focus on rewetting (Page and Baird, 2016; Andersen et al., 2017). Rewetting can be achieved through different ways depending on the land use in the peatland after raising the water table. Peatlands have often been rewetted without altering the already established plant community or with the attempt to reestablish the native plant community. Paludiculture has been suggested as an alternative land use, enabling continued agricultural biomass production on the rewetted peatlands under low or high management intensity (Tanneberger et al., 2020; Ziegler, 2020). Paludiculture is expected to reduce CO2 emissions due to the water-saturated conditions of the peat soils (Ren et al., 2019; Tanneberger et al., 2020; De Jong et al., 2021) while producing biomass for renewable energy such as biogas production (Dragoni et al., 2017; Ren et al., 2019; Hartung et al., 2020) or insulation material that can be used as a green alternative in the building industry (De Jong et al., 2021). Paludiculture may also have the potential to remove excess nutrients from rewetted peatlands by nutrient removal with the harvested biomass (Giannini et al., 2017; Vroom et al., 2018; Geurts et al., 2020).
Large variation in quantified annual GHG emission from different land use of rewetted peatlands including paludiculture have been reported and further studies are needed to establish emission factors accordingly (Bianchi et al., 2021). It is well accepted that GHGs from rewetted peatlands are influenced by their nutrient content and water table level, reflected by IPCC Tier 1 emissions factors (Wilson et al., 2016). Mean annual water table depth has also been used to predict the net ecosystem carbon balance (NECB), but much uncertainty remains (Tiemeyer et al., 2020; Evans et al., 2021; Koch et al., 2023). The complexity and temporal resolution of gap filling models can also influence the NECB estimates (Karki et al., 2019; Liu et al., 2022) and it is highly uncertain how different management practices, water table dynamics during the year, and nutrient status affect annual emission budgets. Consequently, the objectives of this study were to: (1) determine the NECB of Phalaris arundinacea L. (reed canary grass; RCG) production under three harvest and fertilization management regimes during the third year after establishment in a fen peatland with shallow WTD, (2) assess model performances in gap filling biweekly measurements of ecosystem respiration (Reco) and gross primary productivity (GPP), and (3) investigate the relation of soil water chemistry with Reco and GPP. We hypothesized that, (a) fertilization and harvest of RCG would increase C emissions compared to no RCG management, (b) use of high-temporal frequency data on water table depth (WTD) would improve model prediction of ecosystem respiration (Reco), and (c) knowledge on soil pore water chemistry would improve explanation of C fluxes.
2.1 Study area
This study was conducted from May 2021 to May 2022 at a riparian fen peatland located in the Nørreå valley, Vejrumbro, Central Jutland, Denmark (56°26′15.3′′ N, 9°32′44.1′′ E) (Fig. 1). The site was drained in the 1930s and used for agriculture predominantly under grassland rotation and grazing. The field became gradually wetter because of land subsidence, and the water level was largely controlled by the Nørreå stream, located at the southern border of the peatland (Malinowski et al., 2015). After 2018, maintenance of the drainage ditches stopped and the mean annual WTD gradually increased during the following years reaching −8 cm during the study year (18 May 2021 to 17 May 2022), with a minimum of −35 cm in the summer and a maximum of 8 cm in the winter across the experimental blocks (Fig. 2A). The mean air temperature and total precipitation during the study year, measured at the Foulumgard meteorological station (Danish Meteorological Institute), located 6 km from the study site, were 9 °C and 709 mm, respectively. The peat layer at the study site has an average depth of 2 m, covering up to 10 m of gyttja (Mashhadi et al., 2024). The physicochemical characteristics of the peat at the study area were measured for the top 1 m of the soil as part of a previous study by Nielsen et al. (2023b). Table 1 shows the peat characteristics for the four studied blocks.
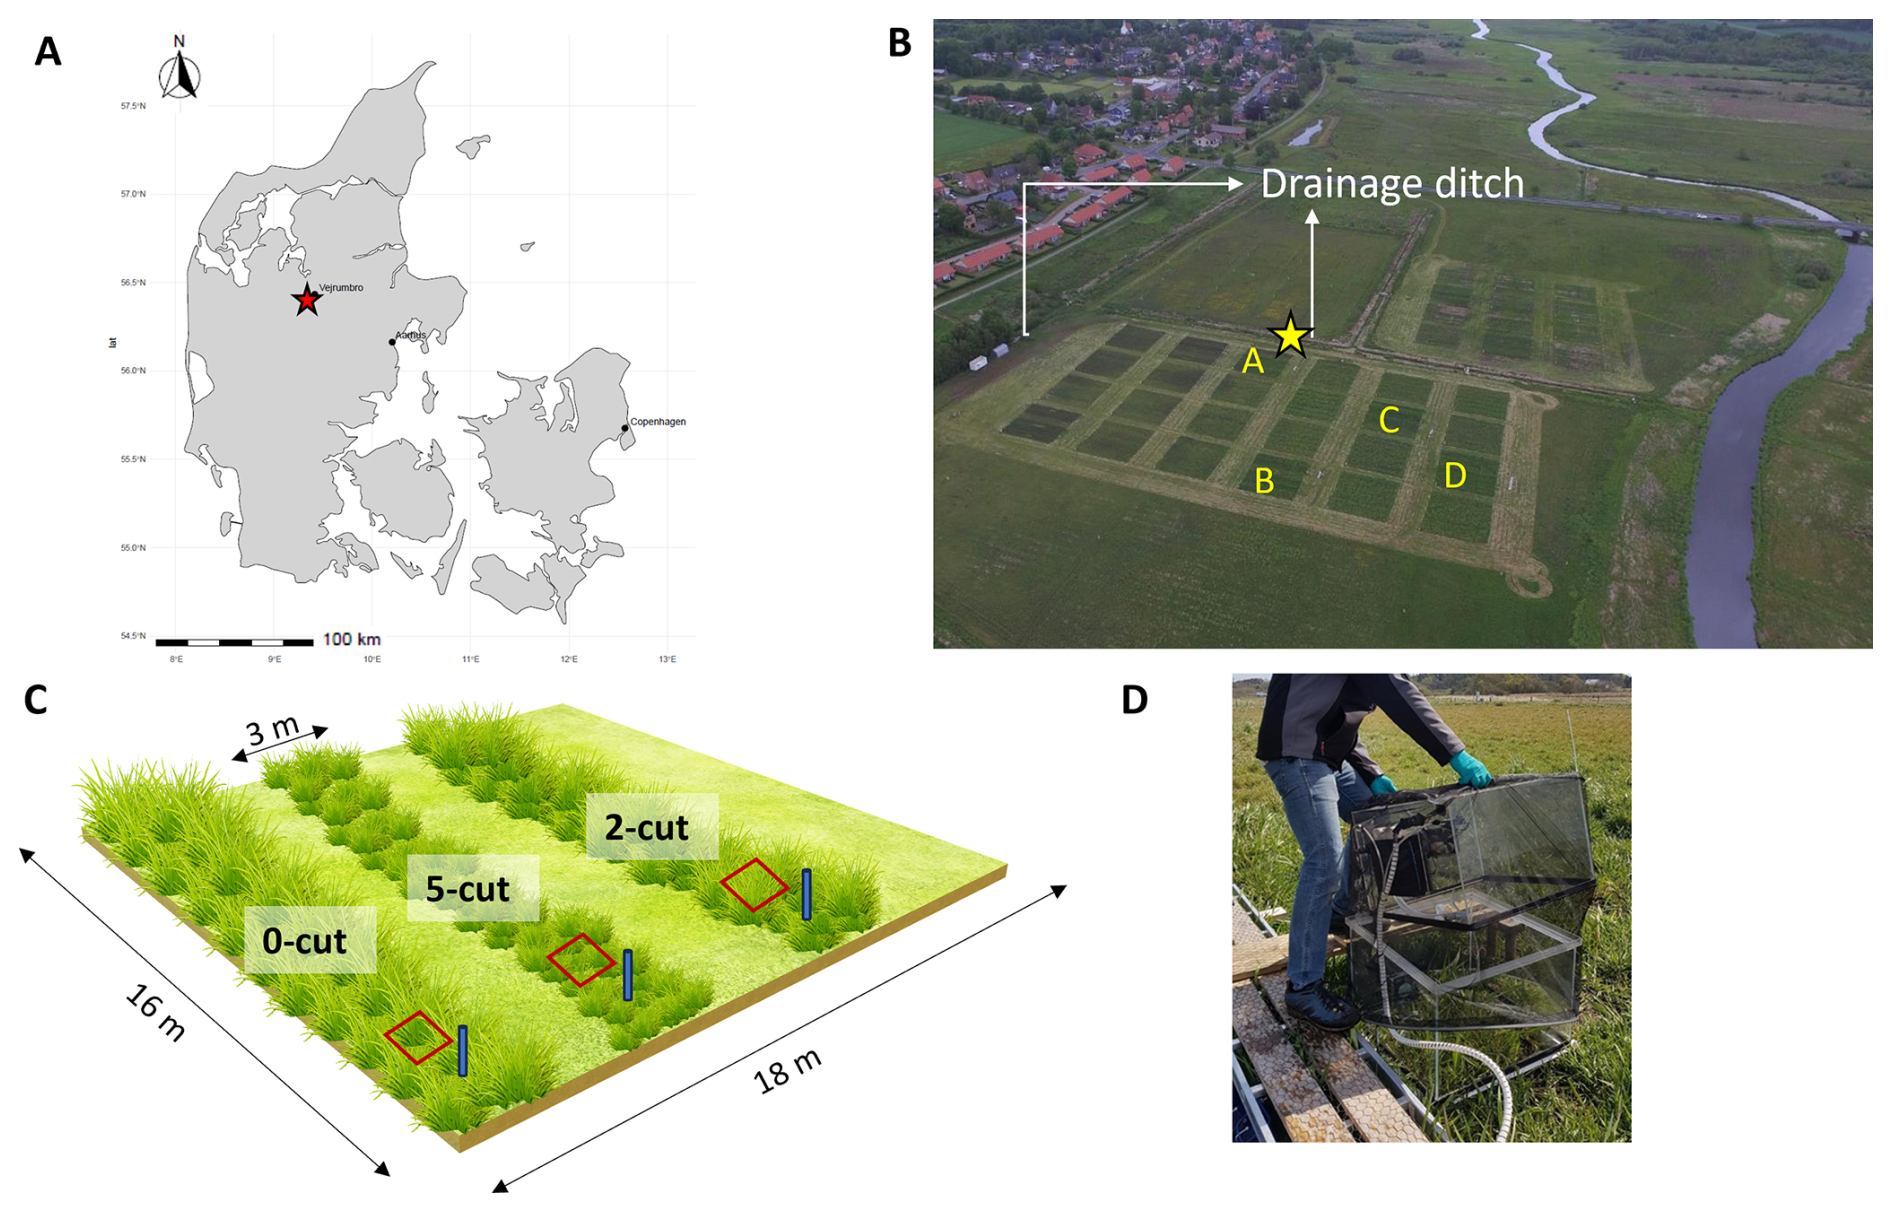
Figure 1(A) Map of Denmark, red star indicates the study site location; (B) aerial photograph of study site, letters indicate the four studied blocks, and yellow star indicates where the ditch water samples were taken from; (C) diagram of one of the blocks showing the three randomized harvest treatment plots (0-cut, 2-cut, and 5-cut) and the location of collars (red squares) and piezometers (blue cylinders); D, transparent chamber with shroud used for gas measurements.

Figure 2Panel (A) presents water table depth (WTD) across the experimental blocks as measured in each block with intervals of 2–3 weeks at the study site from October 2018 to April 2021 and every hour from May 2021 until May 2022 (red square). Panel (B) presents the hourly WTD shown in the red square as the mean of each block with different colors.
Table 1Soil physicochemical characteristics across 0–100 cm depth in the four studied blocks (A–D).
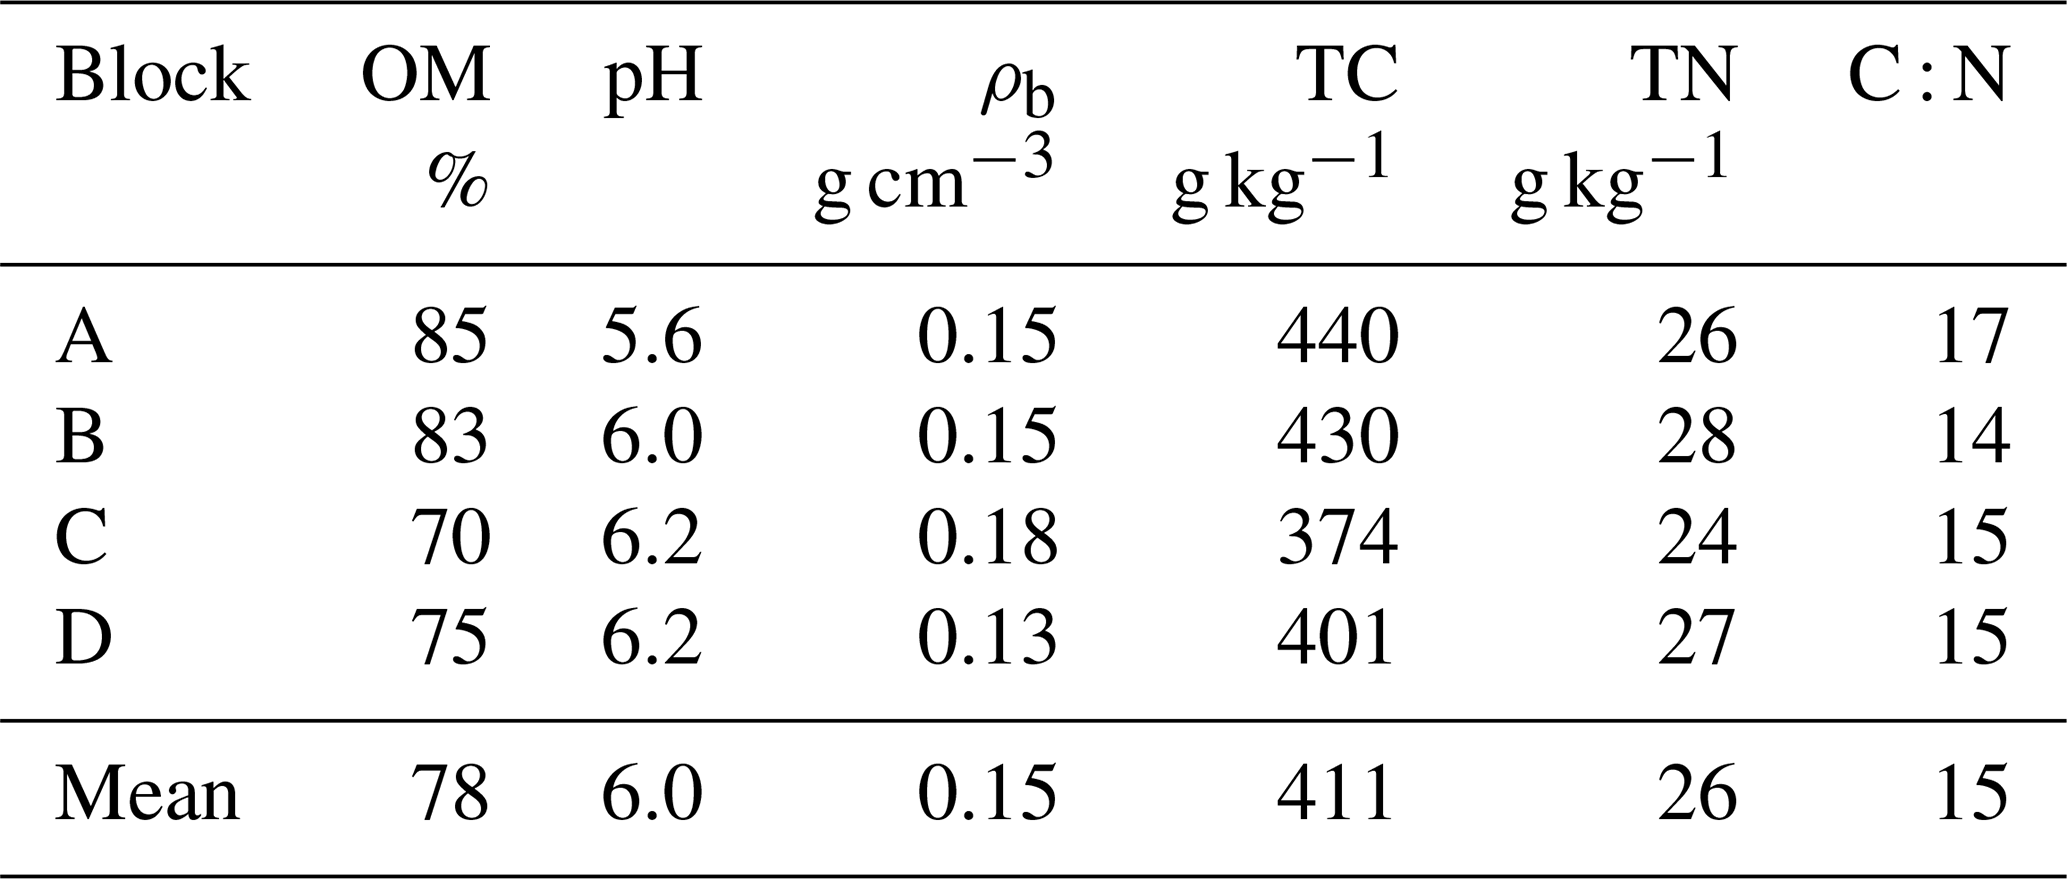
OM, organic matter; ρb, bulk density; TC, total C; TN, total N; C : N, carbon to nitrogen ratio.
2.2 Experimental design
Four blocks (indicated by A, B, C and D on Fig. 1B) were established with RCG,cultivar Lipaula in 2018 as part of a larger field experiment. Each block had six randomly placed plots with six different harvest and fertilization treatments whereof only three (0-cut, 2-cut, 5-cut; referring to the number of harvest events applied) were used for this study. Thus, the experimental design of this study, which is the same as Nielsen et al. (2024), consists of four replicate blocks, each with three harvest/fertilization treatments. Harvest and fertilization dates are shown in Fig. 3. The harvested plots were fertilized with 200 kg N ha−1 and 178 kg K ha−1 in total, given as NPK 18-0-16 in equal split doses. Thus, the 2-cut and the 5-cut received 100 and 40 kg N ha−1 for each cut, respectively, while the 0-cut did not receive any fertilizer. The dimensions of the blocks and plots were (16×18 m), and (16×3 m), respectively (Fig. 1C). Further details of the experimental design can be found in Nielsen et al. (2021). At each plot, one 55×55 cm collar was installed to 10 cm depth to facilitate closed, non-steady-state chamber measurements of net CO2 and CH4 fluxes. A piezometer with a screen from 5 to 100 cm soil depth was installed 10–20 cm away from the collar at each plot for soil water sampling. Ts at 5 cm soil depth and WTD were measured continuously at hourly intervals using Ts dataloggers (HOBO Pendant temperature/light 64K data logger; Onset Corporation, Massachusetts, USA), and Leveloggers (Levelogger 5 Junior; Solinst Canada Ltd, Ontario, Canada), respectively. Perforated gauge tubes for the leveloggers sealed with lids and soil temperature loggers were installed in 2020 inside the collars at each plot.
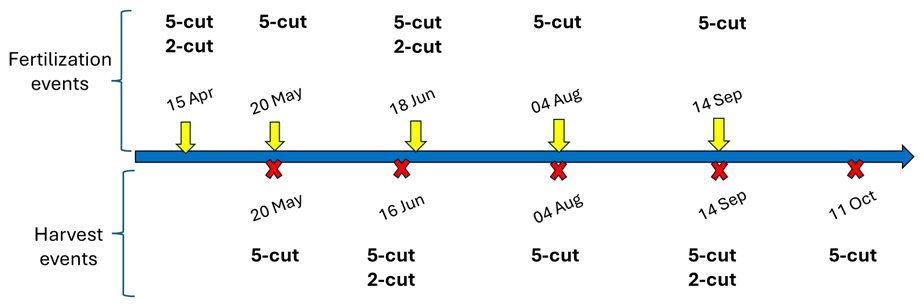
Figure 3Timeline of fertilization and harvest events applied to the 2-cut and 5-cut harvest treatments during 2021–2022.
2.3 Net carbon dioxide and methane flux measurements
The CO2 and CH4 measurements were performed biweekly ± one week between 10:00 a.m. and 03:00 p.m. CET on days of predominantly clear sky conditions from 28 May 2021 to 14 June 2022. A total of 26 campaign measurements were undertaken. Fluxes were measured using a fully transparent chamber (60 cm × 60 cm × 41 cm) made of Plexiglass and equipped inside with a photosynthetic active radiation (PAR) sensor (190-SA; Li-Cor Inc., Lincoln, NE, USA), a temperature sensor, and an air mixing fan. Further details of the chamber design and how the temperature was controlled during operation can be found in Elsgaard et al. (2012). The chamber was connected to an LGR-ICOS™ GLA131-GGA microportable gas analyzer (ABB Ltd.), which simultaneously measured water vapor corrected CO2 and CH4 (i.e., dry fractions) at 1 Hz resolution. Chamber deployment was 120 s per measurement. All data were stored using a Campbell CR1000X data logger (Campbell Sci. Logan, UT, USA) with the same timestamp. In order to fit the RCG inside the chamber during growth, a chamber extension with the same dimensions as the measurement chamber was used during all measuring campaigns, i.e. total chamber height with the extension was 82 cm. Measurements were conducted during constant PAR conditions, when possible, by timing measurements such that changing cloud conditions were avoided. For each campaign and at each soil collar, fluxes were measured corresponding to four PAR levels by using net shrouds and an opaque cover as described by Kandel et al. (2017). This resulted in four flux measurements, one under fully transparent conditions which corresponded to net ecosystem exchange (NEE), a second under ca. 50 % blocked PAR, a third under ca. 75 % blocked PAR, and a fourth under 100 % blocked PAR equivalent to Reco. Between PAR levels plants were given one minute to adapt to the new PAR conditions while the chamber was lifted on one side, allowing air circulation and bringing CO2 and CH4 concentrations to atmospheric levels.
All fluxes were calculated using the Flux package 0.3-0.1 (Jurasinski et al., 2022) in R (R Core Team, 2023, R version 4.3.0). Inspection of fluxes revealed that fluxes were mostly linear, and flux rates were therefore calculated based on linear regression. For low CO2 fluxes (< 100 mg CO2 m−2 h−1), fluxes with an R2<0.6 and a normalized root mean square error (NRMSE) >0.1 were removed, while for high CO2 fluxes (>100 mg CO2 m−2 h−1), fluxes with an R2<0.9 and a NRMSE > 0.1 were identified and the PAR and CO2 flux were manually inspected. If sudden changes in the PAR occurred during the 2 min measurement period or if the flux curve indicated a possible leakage, flux data were discarded. These criteria resulted in 3 % of the calculated CO2 fluxes being removed. In the case of CH4, ebullitions were excluded by using the fluxx function of the Flux package, which automatically detects and excludes rapid concentration fluctuations while calculating fluxes. The resulting calculated linear CH4 fluxes had R2 values higher than 0.9, therefore no fluxes were removed based on non-linearity. If a possible leakage was identified by negative or non-linear Reco fluxes, fluxes were removed, resulting in 1.6 % of the fluxes removed. For further calculations, only the CH4 fluxes measured under 100 % PAR blocked (opaque conditions) were used.
2.4 Biomass measurements
Spectral reflectance was measured in all collars biweekly at gas sampling days and before and after harvest events using a portable crop sensor (RapidSCAN CS-45; Holland Scientific Inc., Lincoln, NE, USA), which was held 30 cm above the canopy and horizontally rotated 45° while performing measurements to cover all vegetation inside the collar. Approximately 30 scans were taken per collar and their mean values were used to calculate the ratio vegetation index (RVI) as the ratio between the near-infrared and the red light reflectance. The RVI has been used as a proxy for photosynthetically active biomass and it has been used in photosynthesis and ecosystem respiration models (Kandel et al., 2017; Karki et al., 2019). Hourly RVI values were obtained by linearly interpolating biweekly RVI measurements, and used in GPP and Reco modelling. Fresh weight yield and dry matter content were determined by harvesting the biomass inside the collars at respective cuts and analyzed for total N and C with a Vario Max CN (Elementar Analysesysteme GmbH, Hanau, Germany). Dry matter yields (Table A1 in the Appendix) were multiplied by percentage C to obtain the yield in C ha−1 yr−1 as part of the C budget. The sum of yields from individual cuts per treatment was considered as the annual yield.
2.5 Gap filling models and annual budgets
The measured NEE CO2 fluxes were partitioned into GPP and Reco. The GPP was calculated for all PAR levels as NEE − Reco. From an atmospheric perspective we always consider Reco positive, and GPP negative while NEE can be either positive (ecosystem carbon source) or negative (ecosystem carbon sink). The net ecosystem carbon balance (NECB) was calculated as the sum of the NEE plus the harvested yields for the 2-cut and 5-cut treatments plus the CH4 emissions. For calculation of annual budgets, three models from previous studies (one for GPP and two for Reco, see below) were used. Additionally, a fourth model was developed based on a modification of the two selected Reco models. The GPP was modelled based on Karki et al. (2019) (model 1).
where GPP is in mg CO2 m−2 h−1, RVI is the ratio vegetation index, k is the PAR value at which GPP reaches 50 %, α is a fitted parameter, and FT is a linear temperature dependent function set to 0 when temperature °C and to 1 when temperature >10 °C (Kandel et al. 2017).
Reco was modelled based on Karki et al. (2019) with RVI and Ts as input variables (model 2), based on Rigney et al. (2018) with WTD and Ts as input variables (model 3), and with a new model, which included RVI, WTD and Ts as input variables (model 4).
where Reco is in mg CO2 m−2 h−1, RVI is the ratio vegetation index, WTD is the water table depth (cm), WTDmax is the maximum WTD (cm), t1, a, b, and c are fitted parameters, t1 has a lower limit set at 1, while all other fitted parameters are without upper and lower limits. T10 is the reference temperature set to 10 °C, T0 is the zero-respiration temperature set to −46 °C, and Ts is the soil temperature (°C) at 5 cm depth.
Each Reco model was fitted to data obtained biweekly using non-linear regression (non-least square) in R (R Core Team (2023), R version 4.3.0) for each plot independently. Annual CO2 budgets were calculated using the parameterized models, hourly Ts, WTD, and RVI. Model performance was evaluated by comparing the measured GPP and Reco with the modelled values using the following indices: Nash-Sutcliffe efficiency, which indicates how well the plot of observed versus simulated data fits the 1 : 1 line, with more accurate models having values closer to 1, corrected Akaike information criterion (AICc), normalized root mean square error, and R2 using the hydroGOF package in R (Zambrano-Bigiarini, 2020; https://github.com/hzambran/hydroGOF, last access: 2 December 2025). Based on these criteria, the best performing Reco model was used to calculate the annual CO2 budget. In addition, models of Reco (model 4) and GPP were parameterized by pooling data from all blocks and treatment plots. The CH4 emissions were modelled using model (5) (Karki et al., 2014).
Where WTD is the water table depth, Ts is the soil temperature at 5 cm depth, RVI is the ratio vegetation index, and d1, d2, d3, and d4 are fitted parameters.
We tested the sensitivity of the best performing Reco model (model 4) to the frequency of WTD data either using (a) hourly WTD, Ts, and RVI (b) annual mean WTD with hourly Ts and RVI, and (c) annual mean WTD, annual mean Ts, and hourly RVI.
2.6 Water chemistry
Soil pore water was collected biweekly at the same time as the gas campaigns and analyzed for total organic C (TOC), dissolved organic C (DOC), total nitrogen (TN), total dissolved nitrogen (TDN), nitrate-N, (NO3), ammonia-N (NH4), total P (TP), total dissolved P (TDP), Fe, pH, electrical conductivity (EC), and turbidity. Pore-water samples were collected immediately after each GHG measurement from the piezometers installed 20 cm from each GHG collar. Water samples were extracted with a syringe from a tube with the other end attached to an aquarium air stone (Air Stone Economy Cylinder 4×5 cm, Aquakoi/JV Trading Aps) placed 20 cm below the water table in each piezometer. An additional sample was collected from a ditch draining the peatland. A total of 13 samples were collected per campaign for a total of 338 samples. Upon collection, part of the sample was filtered using 0.45 µm pore size filter. The unfiltered samples were analyzed for pH and electrical conductivity (EC) following the Danish Standards DS287 and DS288, respectively, turbidity, TN following Best (1976), TP using the Danish Standard, DS291 photometric method (Dansk Standard, 2004), TOC using a total organic C analyzer (TOC-VCPH; Shimatzu Corporation, Kyoto, Japan), and Fe by ICP emission spectrometer (iCAP 6000 series; Thermo Fisher Scientific, Inc., Walthman, Massachusetts, USA). The filtered samples were analysed for DOC with a (TOC-VCPH; Shimatzu Corpotation, Kyoto, Japan), TDN and NO3 (Best, 1976), TDP by the Danish Standard, DS291 photometric method (Dansk Standard, 2004), and NH4 following Crooke and Simpson (1971).
2.7 Statistical analysis
Statistics were performed in R (R Core Team (2023), R version 4.3.0). Effects were considered significant if p value < 0.05. Normality assumptions were evaluated with Q-Q plots, histograms, and residual plots. Kruskal-Wallis tests were used to test the effect of harvest treatment and block on Reco, GPP, NEE, and NECB. Correlations and principal component analysis (PCA) were used to establish relationships between water chemistry parameters, Reco, GPP, NEE, Ts, RVI, PAR, WTD, and CH4.
ANOVA and Tukey tests were used to determine differences between water chemistry parameters among blocks and harvest treatments. The effects of each water chemistry parameter on Reco and GPP were tested with linear mixed models. Each water chemistry parameter was added one by one as a fixed factor to the base models shown below as models (5) and (6), and the performance of the model including each water chemistry parameter was compared to the base model. The Reco base model included WTD, Ts, and RVI as fixed factors and the measuring campaign and replicate block as random factors (model 6), while the GPP base model included PAR, Ts, and RVI as fixed factors and measuring campaign and replicate block as random factors (model 7).
Likelihood ratio tests were used to assess if the base models were significantly improved by adding a water chemistry parameter. If this was the case, the R2 and root mean square error (RMSE) were calculated. Outliers of the water chemistry data were identified as being larger than 3 times the standard deviation for each parameter independently excluding 1 % of the data from the analyses.
3.1 Carbon balance
Management had a marginally significant effect on GPP (Kruskal-wallis test; p value < 0.1; n: 12), with more negative GPP (larger CO2 uptake) in the 5-cut treatment ( t CO2-C ha−1 yr−1; mean ± SE) and least negative in the 0-cut treatment ( t CO2-C ha−1 yr−1) (Table 2). No significant effects of management on Reco (between 22.1±2.5 and 22.4±3.3 t CO2-C ha−1 yr−1; p value = 0.98) and NEE (between 2.2±0.5 and 6.9±2.2 t CO2-C ha−1 yr−1; p value = 0.22) were registered although the NEE of 0-cut was 4.6 t CO2-C ha−1 yr−1 higher than the two managed treatments on average. The 2-cut and 5-cut treatments gave similar annual biomass yields (4.0 ± 0.7 and 3.8 ± 0.2 t C ha−1 yr−1, respectively) leading to similar NECB for all treatments when the exported yields and CH4 were added to the NEE (between 6.1 ± 0.5 and 7.0 ± 2.2 t C ha−1 yr−1). Biomass yields of the 2-cut treatment were similar for both harvesting events, but much lower in block A compared to the other blocks, while for the 5-cut treatment yields peaked at the third harvest and were lowest at the fifth. There were less yield differences between blocks for the 5-cut treatment compared to the 2-cut treatment. Block D had the highest yields of both 2-cut and 5-cut treatments.
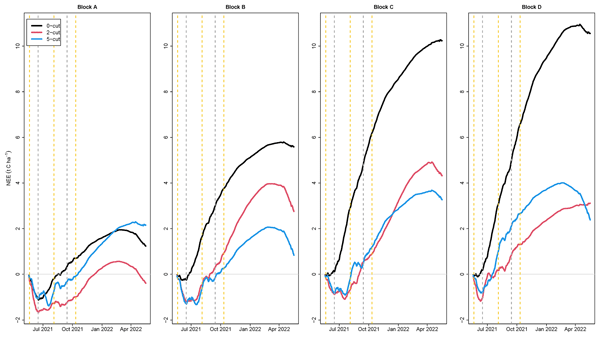
Although the experimental site looked rather uniform, large differences were found between blocks, especially for Reco and NEE, the latter with coefficients of variation of 0.56, 0.71, and 0.41, for the 0-cut, 2-cut, and 5-cut, respectively. The lowest Reco was registered in block A, followed by block B, and the highest Reco was in blocks C and D (p<0.05) (Table 2, Fig. 4). Differences in GPP between blocks were not significant despite lower CO2 uptake leading to lower biomass production in block A. No significant difference in NEE was observed between blocks because the higher Reco was accompanied by larger CO2 uptake (more negative GPP) and thus higher biomass production. Figure 5 shows that the cumulative NEE grew faster in blocks C and D than in blocks A and B leading to approximately eight times higher annual NEE in blocks C and D compared to block A for the 0-cut treatment. The NECB was marginally different (p value < 0.1) between blocks, with lowest NECB in block A, followed by block B, and highest in block C and D indicating that within field heterogeneity overrides treatments. However, the interaction between treatment and block indicated that harvest of biomass considerably reduced net CO2 emission in the more productive blocks (C and D) while little effect on NEE was seen for the less productive blocks (A and B) (Fig. 5).
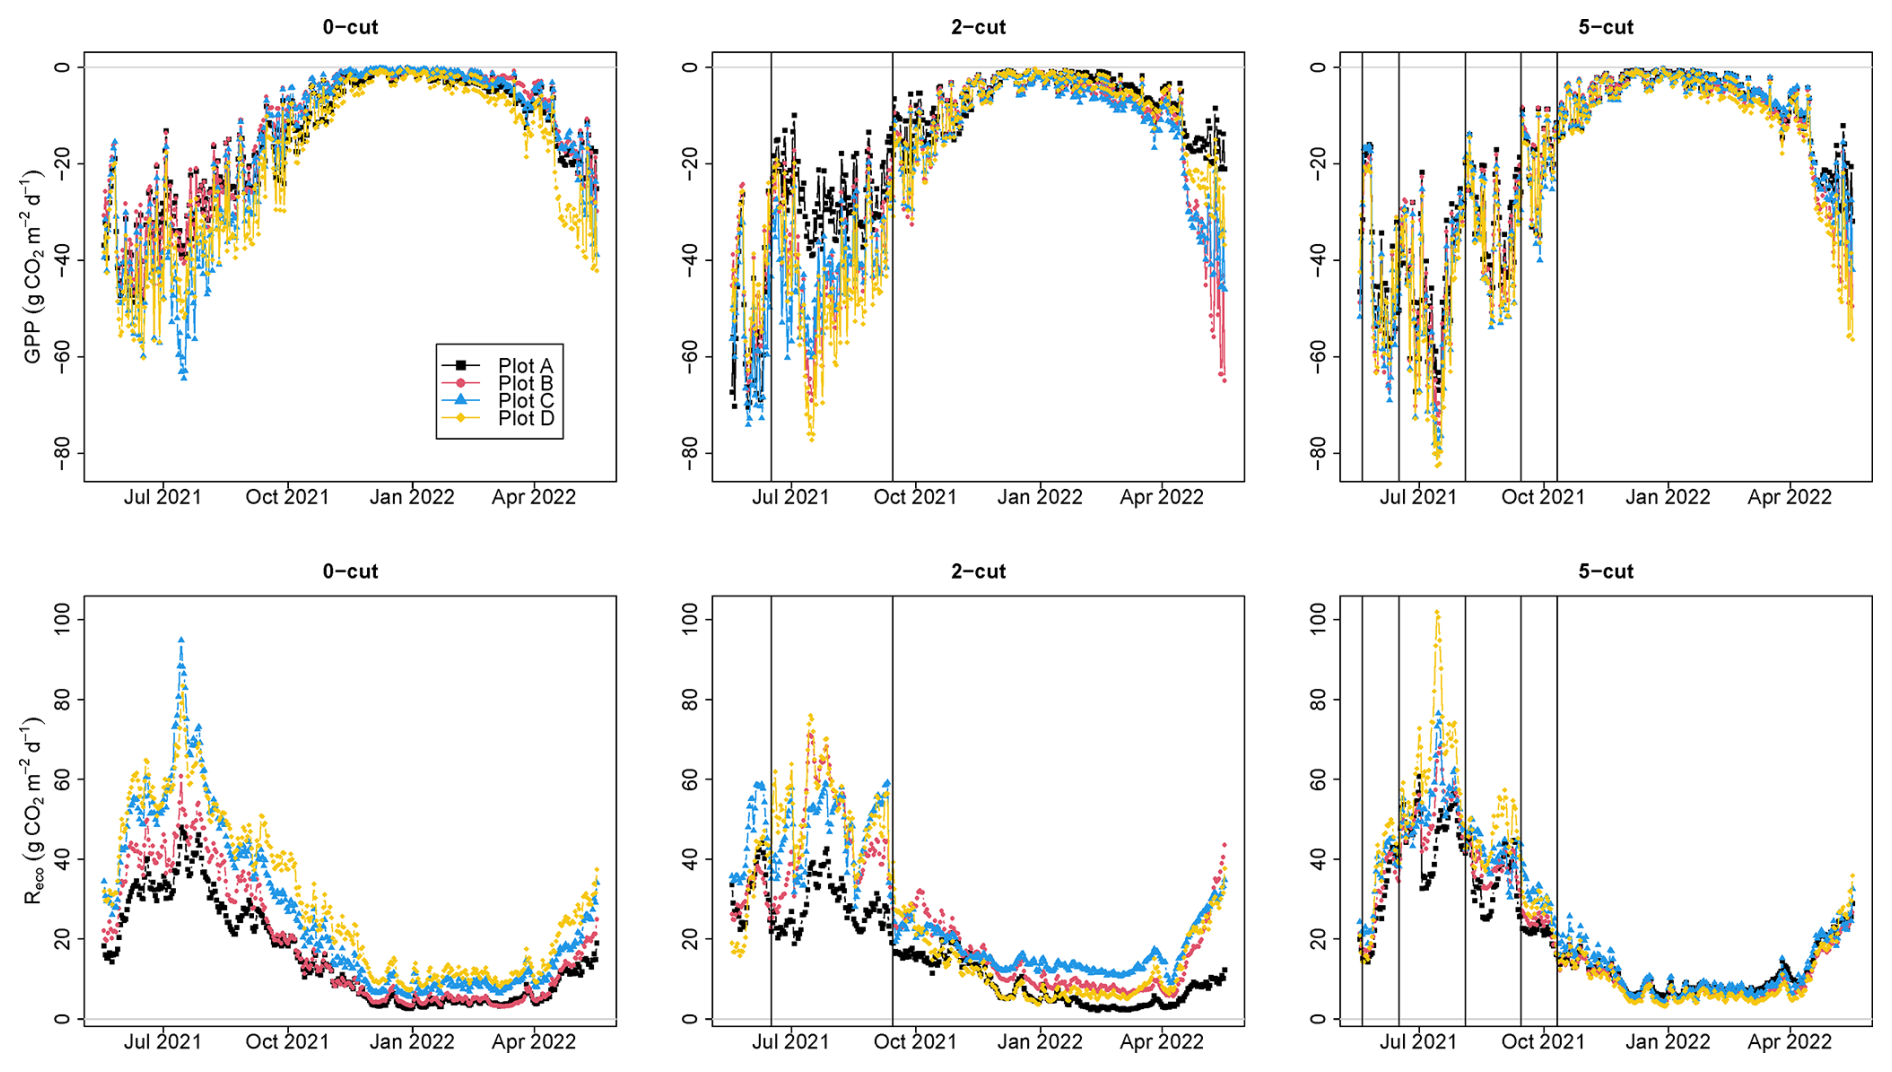
Figure 4Modelled daily gross primary productivity (GPP) (top) and ecosystem respiration (Reco) (bottom) for the three management treatments (0-cut, 2-cut, and 5-cut). Colors indicate the four block replicates. Vertical lines are harvesting events.
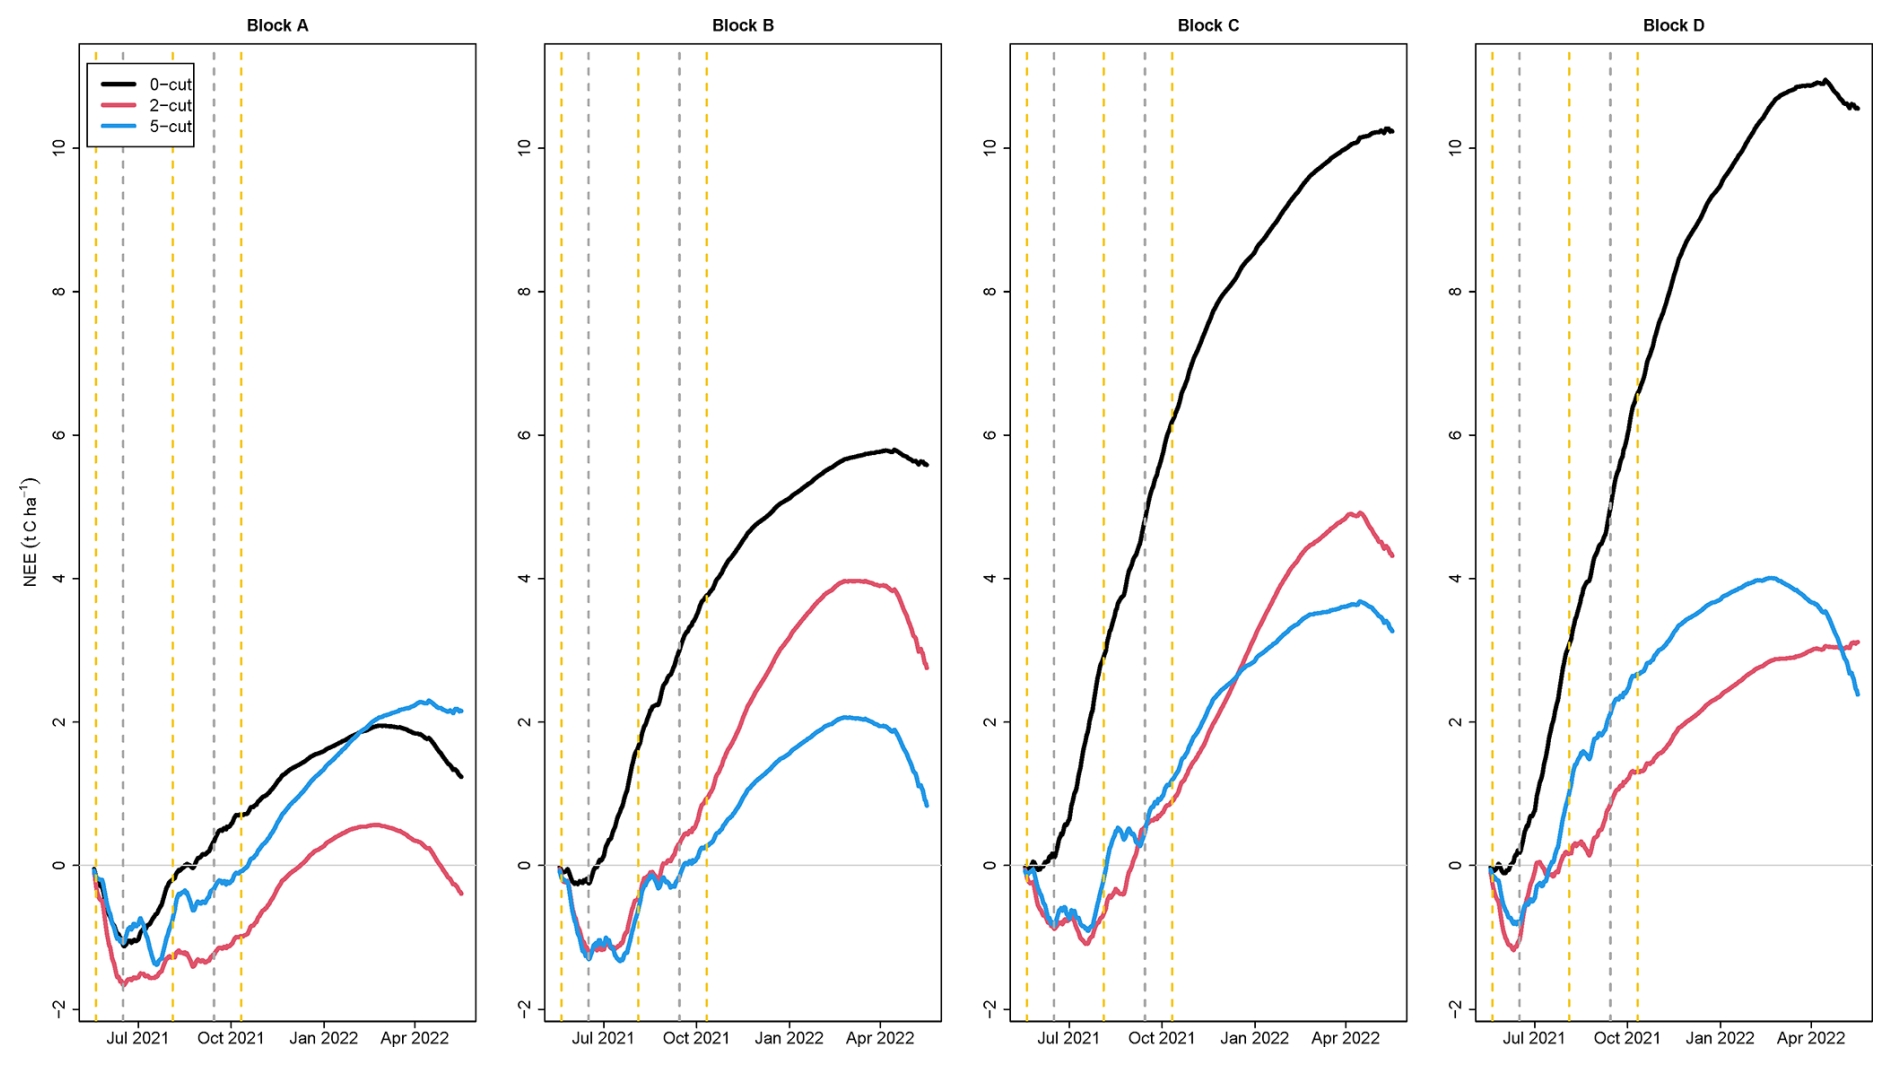
Figure 5Cumulative net ecosystem exchange for the four studied blocks and three harvest treatments. Black line is the 0-cut, red line is the 2-cut, and blue line is the 5-cut treatment. Vertical gray dashed lines are harvest events for only the 2-cut treatment while all vertical dashed lines are harvest events for both the 2-cut and 5-cut treatments.
Cumulated methane emissions averaged 90 kg CH4-C ha−1 yr−1 for the studied year and varied primarily by block with less emissions at block C and largest emissions at block A (Table 2 and Fig. A4 in the Appendix). Methane had no significant correlations with nutrients (Fig. A1), except NH4, which had a negative correlation with CH4. CH4 also had a positive correlation with Reco and Ts but no significant correlation with WTD.
Table 2Cumulated C emission for the four studied blocks and harvest treatments during the study year.
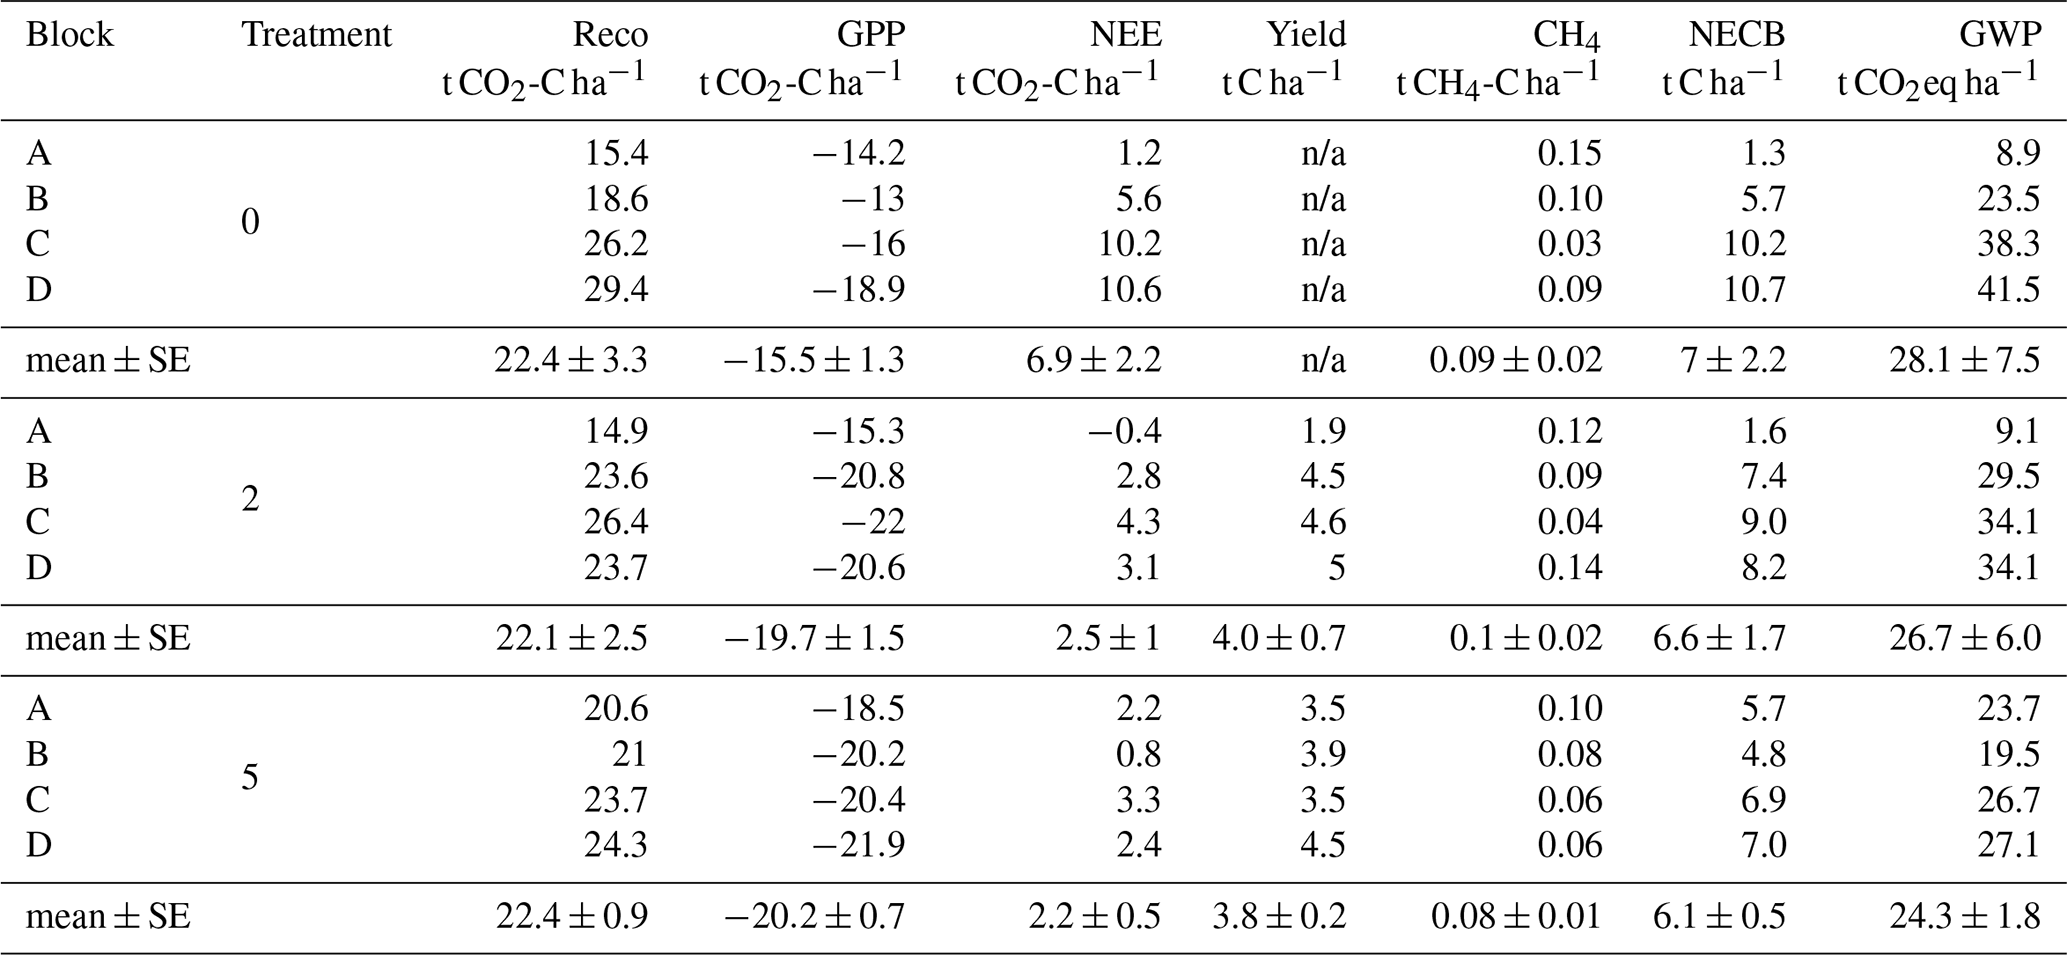
n/a not applicable. Reco is ecosystem respiration, GPP is gross primary productivity, NEE is net ecosystem exchange, NECB is net ecosystem carbon balance (NEE + yield + CH4), and GWP is the global warming potential (NECB + CH4) in CO2 equivalent units.
3.2 Model performance
Measured Reco was best described by model (4) in 11 out of the 12 studied plots based on the Nash-Sutcliffe model efficiency (NSE) and in 10 out of 12, based on the AICc (Table A3). The other calculated indices (R2, and NRMSE) also supported model (4) as the best overall performing model. Additional 1 : 1 plots of measured vs. modelled Reco for model (4) can be seen in Fig. A3. When WTD was excluded as seen in model (2) compared to model (4), the overall performance was reduced as indicated by lower NSE for most plots except for plot C 5-cut and plot D 0-cut (Table A3). Model (3), where RVI was excluded, had the lowest performance of the three tested models. In general, the 0-cut plots provided the best model performances (highest NSE), R2>0.9, and the lowest AICc, while the 2-cut and 5-cut plots had lower model performances (between 0.74 and 0.92 NSE). The performance results for the GPP models had R2 values that ranged between 0.81 and 0.96 (Table A3).
Reco was positively correlated with Ts and RVI, and negatively correlated with WTD (lower WTD = deeper water table). On the other hand, GPP was negatively correlated to Ts, RVI, and PAR, meaning that larger Ts, RVI, and PAR correlate to larger CO2 uptake. These expected relationships seen in the PCA plot (Fig. 6) and correlations statistics (Fig. A1) support why the variables in models (1)–(4) were selected and parameterized in this study. The fitted parameter values of the best performing Reco model and the GPP model varied between plots (Fig. A2). For the Reco model, the b parameter was near its maximum value in most plots, while for the GPP model, the k parameter was near its maximum in most plots.
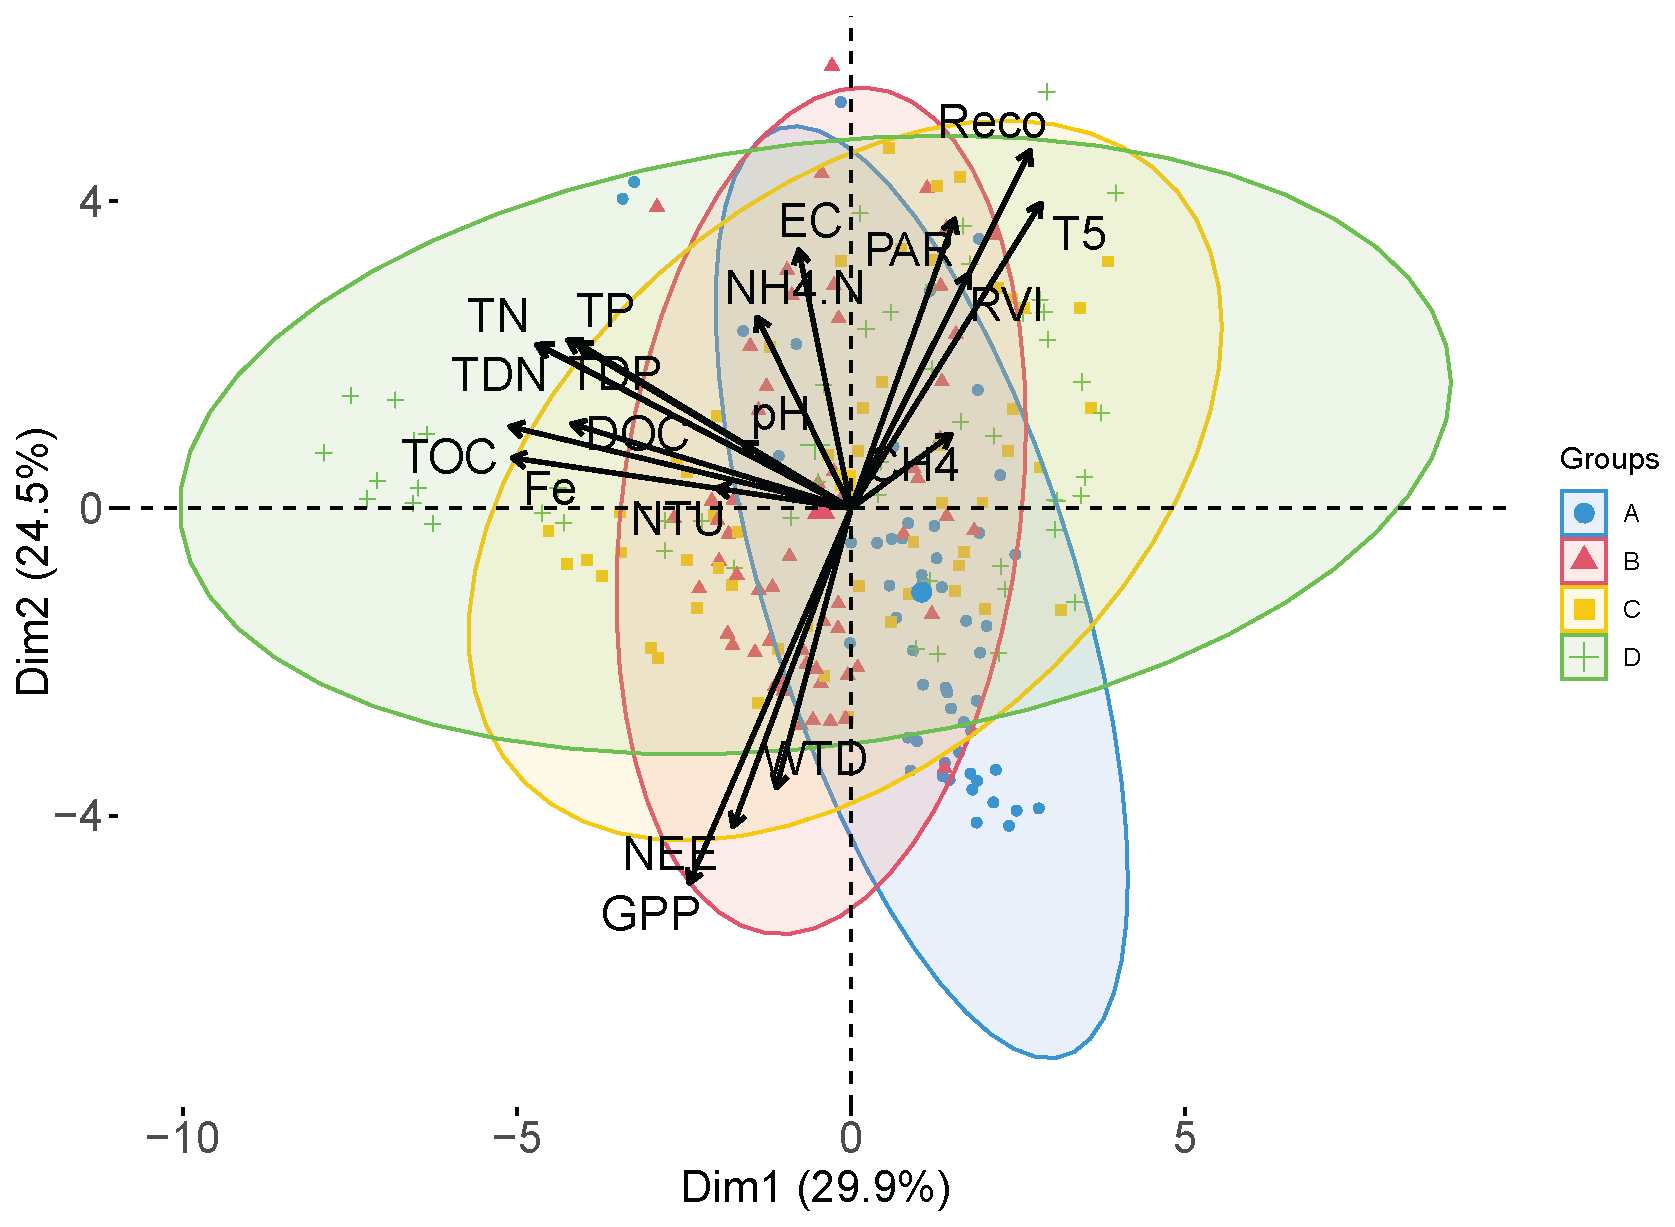
Figure 6Principal component analysis PC1 vs. PC2 plot. Variability explained by each PCA is the value in parenthesis. Colors represent the four studied blocks. Harvest treatments are combined.
3.3 Sensitivity analysis using WTD with different temporal resolution
Using annual mean WTD and Ts as input for model (4) instead of hourly values, underestimated Reco between 9 % to 26 % for all plots with an average of 18 % (Fig. 7) (Table A4). On the other hand, using the annual mean WTD along with hourly Ts generally followed similar trends in Reco as using hourly input data, but high emission events were slightly underestimated resulting in an underestimation that ranged between 0 % and 10 % with an average of 5 % for all plots when compared to the model that used hourly data (Fig. 7) (Table A4). If the Reco was calculated using annual mean WTD and annual mean Ts, or annual mean WTD along with hourly Ts, the C budget resulted in a total mean NECB of 2.7 and 5.4 t C ha−1 yr−1, respectively.
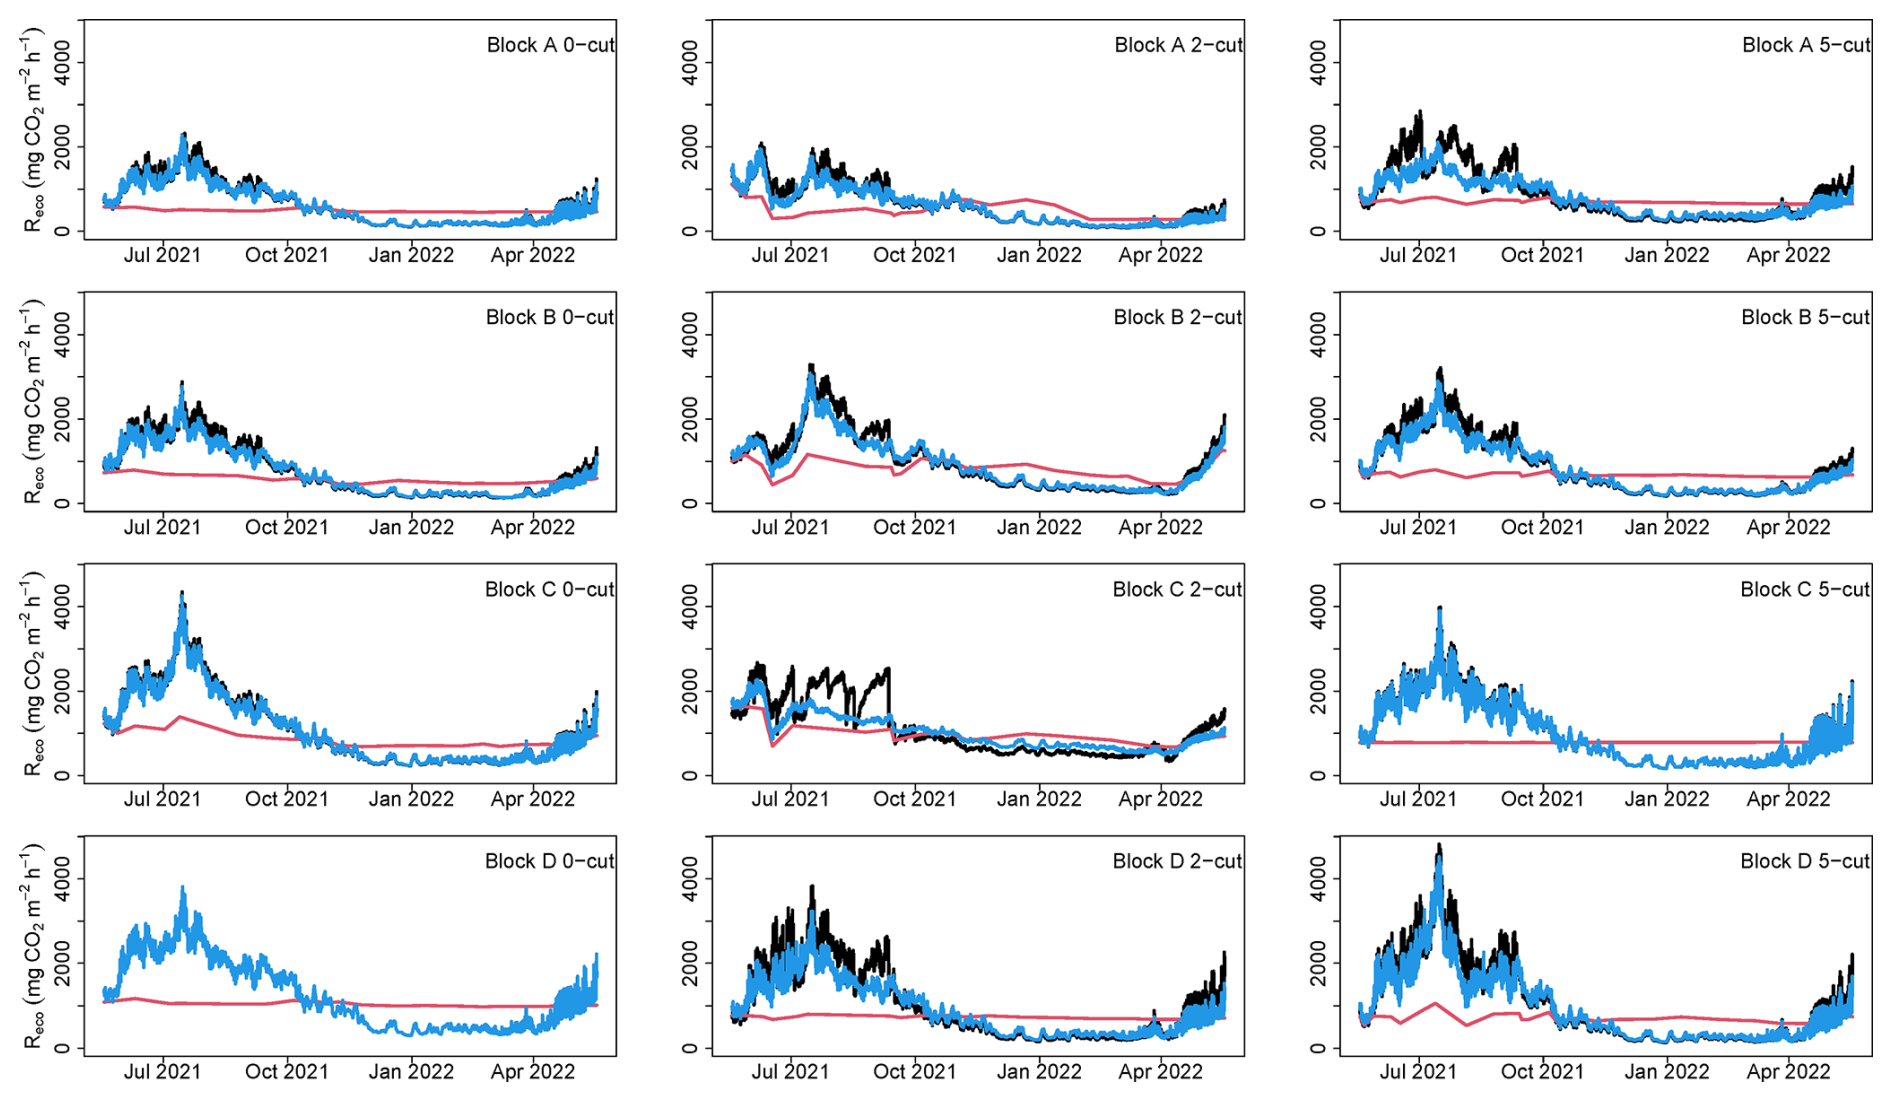
Figure 7Sensitivity of ecosystem respiration (Reco) modelled for all plots to the data frequency of water table depth (WTD). Black lines represent Reco modelled with hourly WTD, soil temperature (Ts), and RVI, blue line represents Reco modelled with mean annual WTD, hourly Ts, and hourly RVI, and red line represents Reco modelled with mean annual WTD, mean annual Ts, and hourly RVI.
3.4 Water chemistry
The PCA described in total 67.8 % of the variance in data by the first three principal components. PC1 and PC2 explained 29.9 % and 24.7 % of the variability in the data, respectively, while PC3 explained 13.4 % of the variability. The PC1 VS PC2 plot (Fig. 6) shows clustering of the data with block D and A having the largest difference. PC1 describes the pore water nutrients, which are positively correlated with each other, and significance of correlations are presented in Fig. A1. This shows that WTD had positive correlations with Fe, TOC and DOC and negative correlations with NH4 and TDP, while Ts had negative correlations with all nutrients except NH4 and TDP. Predominant correlations of nutrients with Reco were negative and positive with GPP and NEE, respectively.
Comparisons of water chemistry parameters between blocks indicated significant differences depending on type of nutrients. Generally, block (A) had the lowest nutrient concentrations, while block (D) had the highest nutrient concentrations, with the exception of DOC. The nutrient concentrations at the ditch appeared lower than the concentrations in the soil pore water at the blocks except for the TP and TDP (Table 3). Comparisons between harvest treatments showed that the 2 and 5-cut treatments had higher N and Fe concentrations than the 0-cut treatment, while there were no differences in other nutrients (Table 3). Additionally, the interaction between harvest treatment and block was significant for NH4, electrical conductivity, pH, and turbidity.
The linear mixed model (Model 6) indicated that all nutrient concentrations, except NH4, significantly improved the base Reco model, however the effect of TP, TDP, and pH also varied at plot level. For GPP, the addition of nutrient concentrations into the model did not improve the base models, however pH and EC improved model (7) with its effect varying at plot level. The magnitude of model improvement (higher R2 and lower RMSE) was larger for Reco than for GPP, however, in general the R2 and RMSE did not change considerably for all nutrients/parameters compared to the base models (Table A5).
Table 3Mean annual concentrations of water chemistry parameters at block A, B, C, and D, and treatments 0-cut, 2-cut, and 5-cut.

Total organic carbon (TOC), dissolved organic carbon (DOC), total nitrogen (TN), total dissolved nitrogen (TDN), ammonia (NH4-N), nitrate (NO3-N), total phosphorus (TP), total dissolved phosphorus (TDP), electrical conductivity (EC). Values are means ± standard error. N values are 78, 25, and 104 for the blocks, ditch, and treatments, respectively. Letters in parenthesis indicate significant differences between block (top) and harvest treatments (bottom). The ditch was not included in statistical comparisons. No comparisons were performed for NO3 due to insufficient data.
4.1 Carbon balance
4.1.1 Annual budgets
Comparison of results from this study to previous flux measurements on managed Danish peatlands presented by Koch et al. (2023) shows that the total mean CO2-C emissions (NEE + yield) from this study (6.5 t CO2-C ha−1 yr−1) are larger than emissions from other Danish organic soils under fertilization and similar WTD (between 0 and 2.5 t CO2-C ha−1 yr−1; Koch et al., 2023). Similarly, our total mean NECB (6.6 t C ha−1 yr−1) is larger than emissions from peatlands at similar WTD from both Germany (between −1.0 t C ha−1 yr−1 and 1.5 t C ha−1 yr−1; Tiemeyer et al., 2020) and the UK (between −2.0 t C ha−1 yr−1 and 0.8 t C ha−1 yr−1; Evans et al., 2021). Nielsen et al. (2024) reported the effect of management on GHG emissions from 2020 to 2021 at the same study site as reported here, and found a higher mean NECB of 9.4 t C ha−1 yr−1 at the slightly lower mean annual WTD of −10 cm. Although mean annual WTD increased only 2 cm, not maintaining the drainage ditches resulted in considerably higher WTD during summer 2021 envisaged by temporary flooded conditions. Higher WTD along with a reduction of WTD fluctuations as rewetting progresses (Karimi et al., 2024), could explain the lower NECB in 2021–2022 compared to 2020–2021 (Fig. 2A). Other studies have also shown a delay in reaching carbon neutral conditions despite drainage being stopped (Hemes et al., 2019; Kreyling et al., 2021). For the shallow annual mean WTD registered at our study site we expected lower CO2 emission according to IPCC Tier 1 emission factors. However, here Reco is likely driven by the dynamic interaction of a drop in WTD during summer coinciding with maximum Ts. This naturally stimulated CO2 production in the peat and together with plant respiration drove the high annual Reco (Fig. 4).
Mean CH4 emissions from this study were within the range of emissions from pristine and rewetted Danish and German peatlands reported by Koch et al. (2023) and Tiemeyer et al. (2020) (between 75 and 150 kg CH4-C ha−1 yr−1, approximately) and no treatment effect was apparent. We found that CH4 emissions contributed 11.7 % to total net mean NECB expressed as CO2eq, using global warming potential (GWP) = 27 for CH4 (Forster et al., 2021). Peatland rewetting is expected to reduce CO2 emissions while simultaneously increasing CH4 emissions (Abdalla et al., 2016; Darusman et al., 2023). Thus, further monitoring of CH4 emissions would be needed as rewetting progresses at the study site.
4.1.2 Management effect on CO2 emissions
Rewetted nutrient-rich fen peatlands have higher CO2 emissions compared to low-nutrient ones (Wilson et al., 2016). Management alternatives to reduce emissions from these sites are therefore needed in order to meet emission reduction targets. Paludiculture has been found to effectively reduce emissions from rewetted peatlands (Tanneberger et al., 2020; De Jong et al., 2021; Bockermann et al., 2024), but type of paludiculture crop seems important for the reduction potential (Lång et at., 2024). Our results showed that after three years of establishment and management of RCG at the study site, NECB was not significantly different compared to no management. These results support findings by Nielsen et al. (2024) who found no effect of management on GHG emissions during the second year (2020) after RCG establishment at the study site. The NECB assumes that all harvested biomass is converted to CO2 when removed from the field. However, if the biomass is considered as a resource potentially reducing the use of fossil fuels, comparison of NEE among treatments would also be a relevant measure. Based on NEE, we found a potential emission reduction of 4.5 and 4.7 t CO2-C ha−1 yr−1 for the 2 and 5-cut management strategies, respectively, in comparison to no management, but this difference was not significant because of large variation between treatment replicates especially for the 0-cut. Our NEE estimates were lower for all treatments compared to Nielsen et al. (2024). We attribute this reduction in net CO2 emissions not only to the reduction in biomass production but also to the rewetting process, which lowered heterotrophic peat mineralization.
A life cycle assessment of RCG on fen peatlands by Thers et al. (2023) showed that fuel consumption during harvesting can make up a considerable amount of GHG emissions associated to management. Since no considerable difference in yields were found between the 2-cut and 5-cut treatments, and a progressive decline was seen after the third harvest of the 5-cut treatment, we would recommend the 2-cut management for RCG in peatlands such as the study site to maximize harvest efficiency and to minimize disturbance to the peatland. Although yields of 2021 (8.9 and 8.6 t DM ha−1) (Table A1) were acceptable they were considerably lower compared to 2019 yields (15.6 and 14.9 t DM ha−1) (Nielsen et al., 2021) and to 2020 yields (12.7 and 13.8 t DM ha−1) (Nielsen et al., 2023a) for the 2-cut and the 5-cut, respectively. The amount of N removed in the harvested biomass was on average 206 kg N ha−1 and slightly lower in the 2-cut compared to the 5-cut (Table A2), therefore, the same amount of N applied as fertilizer was removed at harvest. However, we found generally higher concentrations of N forms in pore water at the 2 and 5-cut treatments compared to the 0-cut treatment. A complete assessment of the N balance would help to determine the full environmental benefit of RCG as paludiculture.
4.1.3 Paludiculture and potential CO2 mitigation
In the most productive blocks of the experiment, paludiculture seemed to accelerate the reducing effect of rewetting on CO2 emission. Higher Reco and marginally higher NECB were measured in blocks C and D, which in this study were also the areas with higher porewater nutrient concentrations compared to Reco and NECB measured in the block A. The difference in emissions between no harvest (0-cut) and harvest (2 or 5-cut) for the highly productive blocks (C and D) were on average 7.1 t CO2-C ha−1 yr−1 based on NEE and 2.7 t C ha−1 yr−1 based on NECB. However, in areas of less emissions (block A in this study), paludiculture would be less recommended because differences were not apparent for harvested and non-harvested plots and relatively small yields could be harvested as a biomass resource. These results stress the importance of acknowledging peatland heterogeneity in rewetting with paludiculture projects to maximize emission reductions.
4.2 Peatland heterogeneity
Even though the studied area was relatively small (3.9 ha) and appeared to be uniform, we found differences in CO2 emissions and porewater nutrients among the studied blocks. Peat chemistry data (Table 1) also indicated differences in pH, organic matter content, and TC among the studied blocks which might be related to the peat forming process. The peatland heterogeneity might have originated from differences in topography, groundwater flow, and vegetation variability, leading to variable rates of peat and C accumulation (Piilo et al., 2020), and Reco (Juszczak et al., 2013). which affected the pore water nutrient concentrations, microbial communities and GHG balance (Arsenault et al., 2019; Chroňáková et al., 2019; Kou et al., 2022). Mashhadi et al. (2024) found, at the same location where this study was conducted, an increasing degree of peat decomposition approaching the stream, therefore, higher nutrient concentrations in blocks closer to the stream could be explained by higher peat decomposition and organic matter mineralization at this area. Heterogeneity at the study site was also reflected by considerable variability in values of the fitted parameters of the Reco and GPP models (Fig. A2). Pooling all data to obtain field Reco and GPP models resulted in lower model efficiencies (Table A6) compared to the approach of modelling each plot separately and led to similar Reco, GPP, and NEE among treatments and blocks (Table A7).
4.3 Sensitivity of Reco prediction to temporal resolution of WTD
In previous studies, mean annual WTD have been used as the only predictor for NECB, but not without considerable variation in data points used to build these relationships (Tiemeyer et al., 2020; Evans et al., 2021; Koch et al., 2023). We found that information on Ts, RVI and PAR improved prediction as they have large impact on GPP and Reco. The other two models evaluated (models 2 and 3) also included Ts as explanatory variable. Temperature is a major soil respiration driver (Silvola et al., 1996; Lafleur et al., 2005; Rigney et al., 2018) as higher soil temperatures increase microbial activity and soil respiration but it depends also on water table and soil moisture (Silvola et al., 1996; Lafleur et al., 2005). Out of the three Reco models we tested, the combined model including RVI, WTD and Ts performed best (model 4). When Reco was estimated by models (2) or (3), where either RVI or WTD was omitted the annual Reco and thus NECB was underestimated by 8.9 % and 3.5 %, respectively. Therefore, model selection is important to accurately estimate CO2 emissions from peatlands.
In this study, Ts captured major trends in Reco. This can be seen by the importance of the fitted Ts parameter (b, model 4) (Fig. A2) and by results shown in Fig. 7, in which hourly Ts along with mean annual WTD captured most Reco trends, However, this model underestimated Reco by an average of 5 %, which would be equivalent to an NECB underestimation of 1.2 t C ha−1 yr−1 compared to the model with hourly WTD and hourly Ts. The use of mean annual WTD and mean annual Ts resulted in an even larger NECB underestimation (3.9 t C ha−1 yr−1) compared to the hourly model. This underestimation is due to the combined effect of lower WTD and higher Ts during summer on Reco, which is not captured when mean WTD and Ts are used. The model based on hourly WTD and Ts also improved simulation of Reco peaks (Figs. 8 and A2), which might be of great importance under extreme weather and climate change conditions. Juszczak et al. (2013) also found that the response of Reco to Ts can be influenced by WTD and that models including both WTD and Ts provide a better representation of Reco in heterogeneous peatlands. Emission factors derived from models based on annual mean WTD, such as those currently used for rewetted peatlands would underestimate Reco when applied to peatlands with fluctuating and lower WTD during the warm season. This is an important observation particularly for rewetted peatlands, which might take years to achieve hydrological stability (Kreyling et al., 2021). Improved CO2 modelling therefore requires information on fluctuating WTD possibly obtained from hydrological modelling if measurement data are unavailable.
4.4 Effect of nutrients in CO2 emissions
Positive correlations between porewater nutrients suggest common drivers for their release. Concentrations of dissolved organic matter components have been found to correlate with concentrations of metals in Canadian bogs (Bourbonniere, 2009). Peat mineralization has been found to be a major driver of nutrient release from drained peatlands (Cabezas et al., 2013; Haapalehto et al., 2014). Predominantly higher nutrient concentrations at the studied blocks compared to the ditch indicate differences between the pore water (measured at the plots) and the groundwater (measured at the ditch), suggesting that peat mineralization and fertilization are larger pore water nutrient sources compared to groundwater. Peat nutrient concentrations and pH have been found to be potential indicators for GHG emissions in rewetting peatlands (Nielsen et al., 2023b). We showed that the prediction of Reco was improved when soil pore water chemistry data were included in addition to WTD, RVI and Ts as fixed factors. Although, the magnitude of this improvement was small based on the R2 increase (between 0.004 and 0.015 depending on the pore water chemistry parameter), this indicated a relation between mineralization and porewater nutrients at the study site. The exact influence of nutrients on Reco should be further investigated. In this study we measured nutrient concentrations but not nutrient load, which is the total mass of a nutrient and can be more informative about the nutrient status of the peatland (Cabezas et al., 2013). Under higher (shallower) WTD, nutrient concentrations can be diluted (Griffiths et al., 2019). Positive correlations between WTD and TOC, DOC and Fe could be due to release of DOC accumulated under drained summer conditions and increase in Fe solubility under higher water tables (Haapalehto et al., 2014).
Previous studies have explored variability on water chemistry between and within peatlands (Bourbonniere, 2009; Wood et al., 2016; Arsenault et al., 2018; Griffiths et al., 2019). Nutrient concentrations in peatland's porewater are affected by several factors including water table depth, temperature, peat decomposition degree, and redox (Bourbonniere, 2009; Cabezas et al., 2013; Haapalehto et al., 2014; Wood et al., 2016); Furthermore, nutrient concentrations, base cations, and pH change upon peatland rewetting (Lundin et al., 2017). For this study, WTD was generally lower in blocks C and D (Fig. 2B). Malinowski et al. (2015) found that the area where block A is located is more responsive to changes in the stream water level due to its proximity to the drainage ditch, which might have caused the higher mean WTD in this block. Additionally, differences in mobile porosity at the study site might have made some areas more prone to be affected by changes in WTD than others (Mashhadi et al., 2024). Minor differences in WTD between the replicate blocks could have produced a different degree of exposure to incoming water sources. Nutrient concentrations in incoming water sources can in turn affect pore water nutrient concentrations (Bridgham and Richardson, 1993; Cabezas et al., 2013), which could have contributed to differences found between blocks, additionally, higher WTD in block A could explain lower nutrient concentrations due to dilution. The minor differences found in WTD might increase peat mineralization in drier blocks resulting in higher DOC and N concentrations (Arsenault et al., 2018; Haapalehto et al., 2014; Wood et al., 2016). Nutrient additions have been found to increase Reco in peat soils (Larmola et al., 2013). Higher mineralization and larger nutrient release from organic matter decomposition at lower WTD blocks could explain differences in CO2 emissions among replicate blocks as evidenced by higher mineralization and Reco found at blocks C and D. Higher plant productivity and fresh decomposable organic matter contributes to higher nutrient concentrations found in rewetted peatlands (Haapalehto et al., 2014), which could explain higher N concentrations found in blocks C and D. This is also supported by marginally higher NECB found in these blocks compared to blocks A and B (p<0.1). Nutrients released from the decomposing vegetation have been found to increase soil respiration and mineralization in high-nutrient peat soils (Larmola et al., 2013). A feedback mechanism by which higher mineralization and nutrient release enhances plant productivity, which in turn increases fresh organic matter inputs into the soil and further nutrient releases could drive high nutrient concentrations in poorly drained fen peatlands such as this one.
4.5 Considerations for the potential use of RCG harvested biomass
In order to reestablish the C sink function of rewetted peatlands, peat formation would need to be reestablished, however, reaching this state may take decades (Kreyling et al., 2021). Paludiculture provides an opportunity to achieve indirect GHG emission reductions by replacing fossil fuels, however, since harvested biomass C makes out a considerable amount of GHG emissions from cultivated RCG in fen peatlands because it is considered as a CO2 emission immediately after harvest according to IPCC guidelines (Thers et al., 2023), the end use of the harvested biomass is key to achieve the potential GHG mitigation. Reed canary grass grown in wet Danish fen peatlands was shown suitable for protein extraction as supplement in the diets of monogastric animals and side strips or all the harvested biomass could be used for biogas production thereby replacing fossil fuels (Kandel et al., 2013; Nielsen et al., 2021, 2023a). Since N2O was not measured in the present study, further information is needed to assess the extent of N2O contribution to GHG emissions given that N fertilization for RCG can increase N2O emissions in fen peatlands (Kandel et al., 2019), However, N2O emissions equivalent to 1.4 t CO2eq ha−1 yr−1 was previously reported at the study site without any difference between harvest and non-harvest treatments (Nielsen et al., 2024). The feasibility of using biomass from reed canary grass to offset fossil fuels would depend on the development of non-invasive harvesting techniques, the identification of viable and economically suitable uses for this biomass, and the establishment of markets and infrastructure for its processing.
We found that harvesting moderately fertilized RCG in the third production year did not increase net C emissions significantly in poorly drained fen peatlands compared to no management. Considering that the climate impact of rewetted sites under paludiculture depends on the fate of the harvested biomass, GHG emissions could be reduced elsewhere if this biomass is used to replace fossil fuels. When compared with emissions reported earlier for the second production year, the NECB was further reduced in the third production year as rewetting progressed. A main reason for no significant effect of management on NECB was the large differences between treatment replicates which could be partly related to different concentrations of nutrients in pore water and dynamics in WTD across the blocks. Considering this field heterogeneity, results indicated that harvest of the biomass could potentially reduce net C fluxes at nutrient rich areas, while at relatively nutrient poor areas it seemed more advantageous to leave the grass without management. Paludiculture and management of RCG in rewetting fen peatlands, therefore, offers an alternative that could be particularly beneficial in nutrient rich areas. We found that differences in annual NECB were highly influenced by Reco, and that Reco was best modelled by hourly data on RVI, WTD and Ts. The Reco was underestimated when mean annual WTD was used instead of hourly values, indicating that temporal variability in WTD should be considered in establishing emission factors for rewetted fen peatlands. Differences in porewater nutrient concentrations were able to further improve prediction of Reco based on a statistical model. As more nutrients could be related to higher CO2 emissions, we suggest a feedback mechanism driving the mineralization, nutrient release, biomass production and peatland heterogeneity. Further research and the establishment of infrastructure and markets for harvested biomass would improve the prospects of paludiculture in rewetted peatlands.
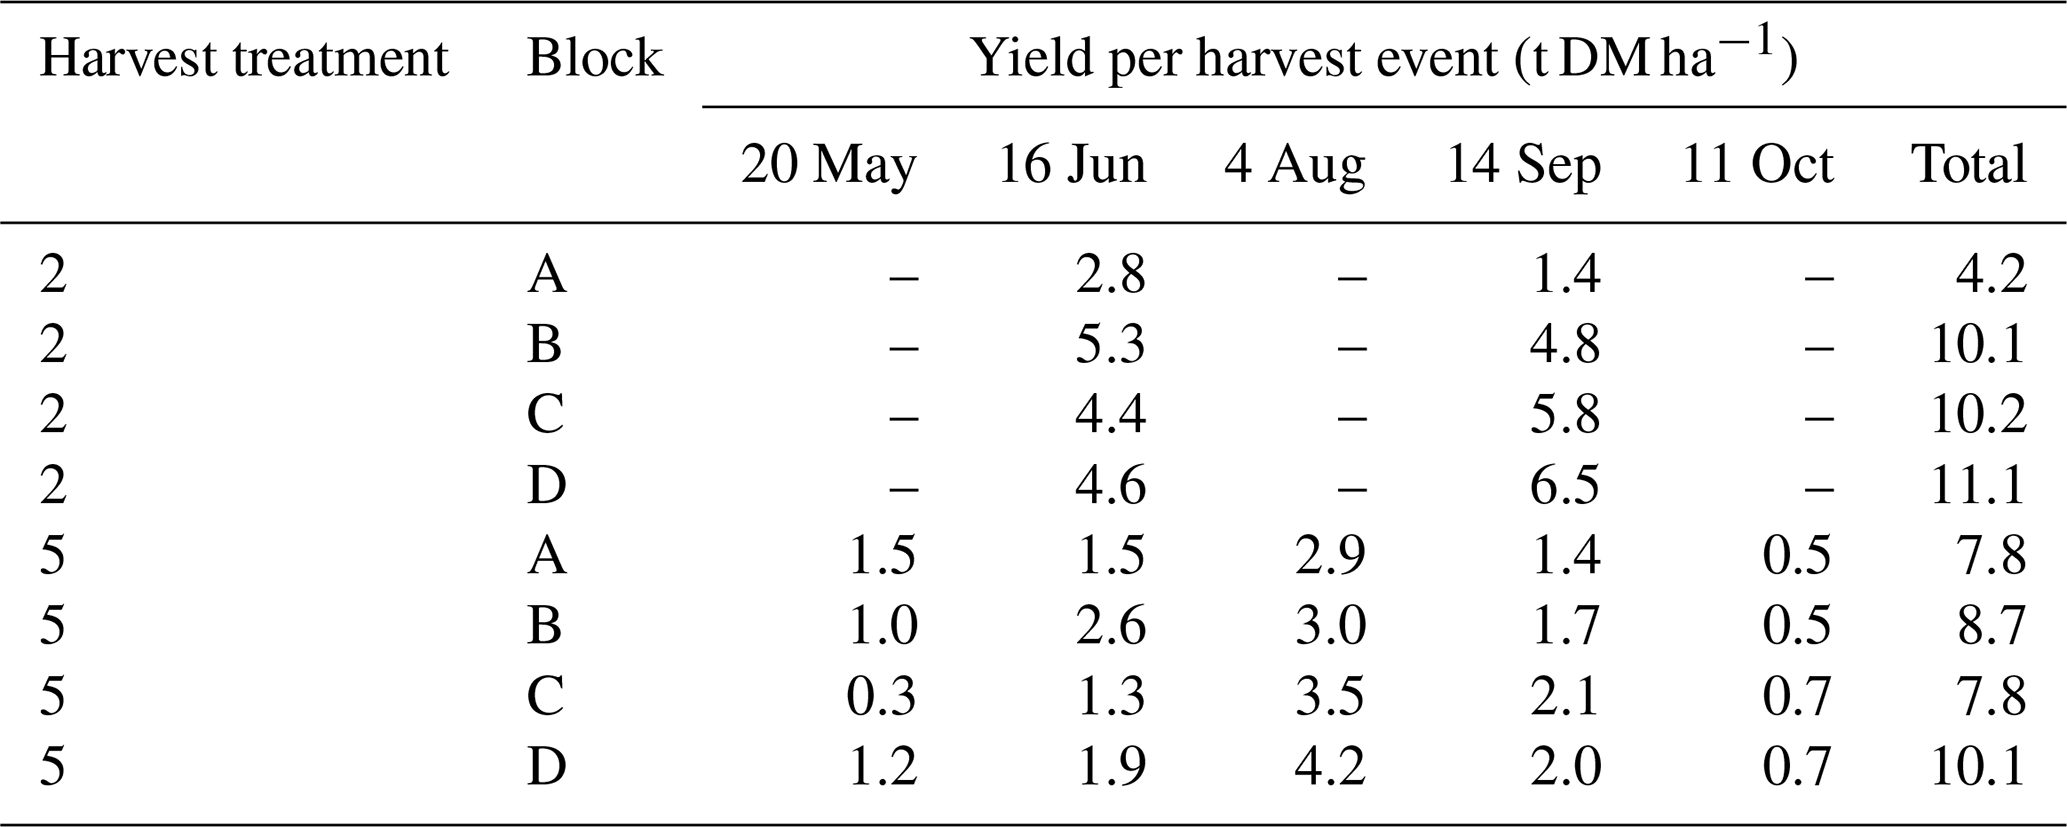

Table A3Model evaluation for GPP model (model 1), Reco models (models 2, 3, and 4), and CH4 model (model 5). Values are indexes of model performance for each block.
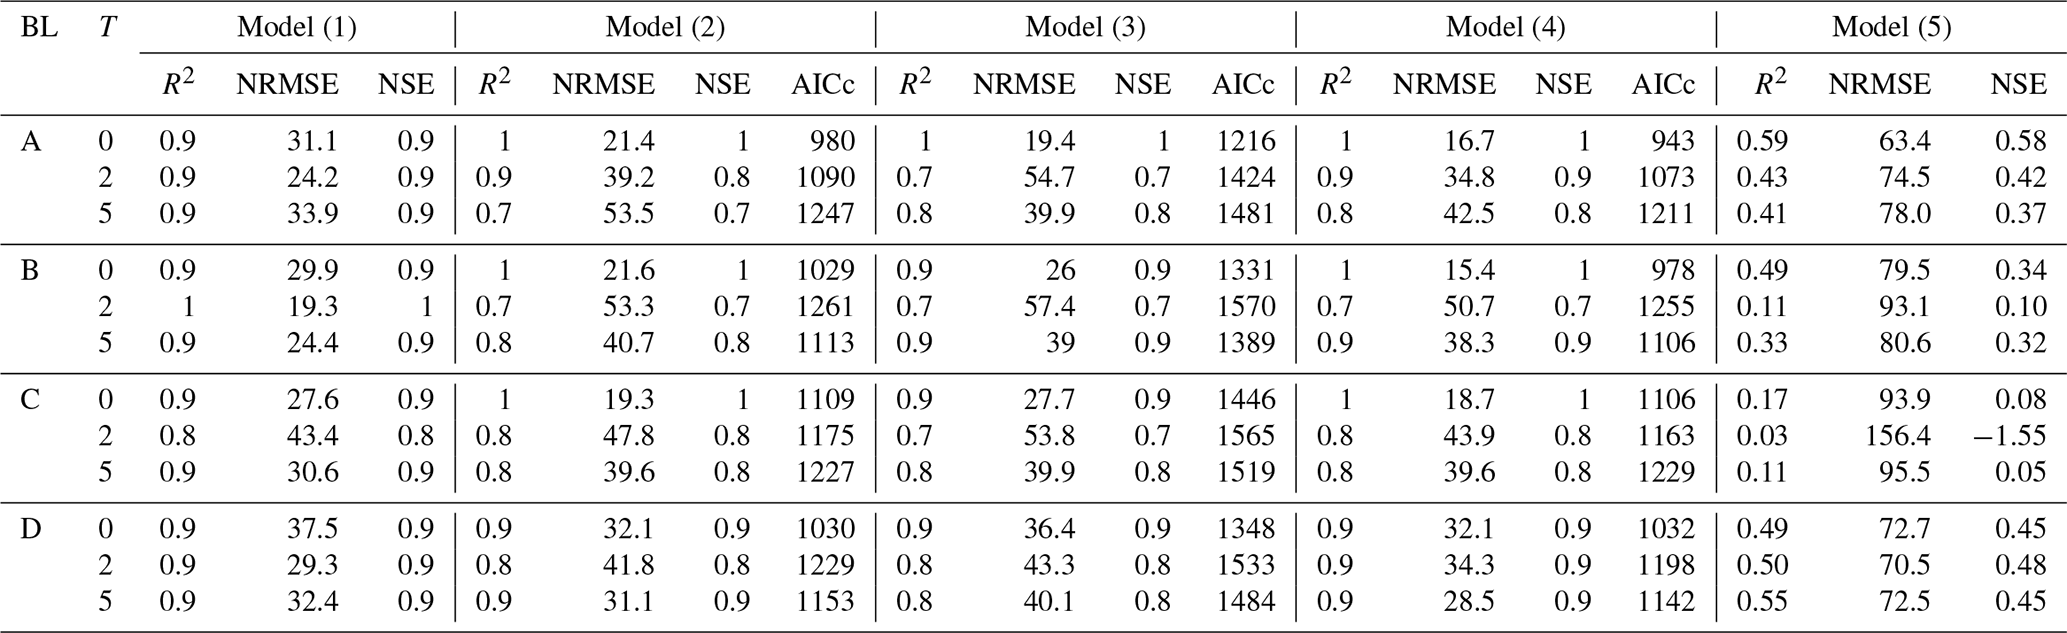
A, B, C, and D are the four block replicates (BL), 0, 2, and 5 are the three harvest treatments (T) at each block. The four indexes of model evaluation are: R2, normalized root mean square of error (NRMSE), Nash-Sutcliffe efficiency (NSE), and corrected Akaike Information Criteria (AICc).

Figure A1Pearson's correlations of water chemistry parameters, Ecosystem respiration (Reco), net ecosystem exchange (NEE), gross primary productivity (GPP), water table depth (WTD), soil temperature at 5 cm depth (T5), ammonia (NH4.N), total nitrogen (TN), total dissolved nitrogen (TDN), total phosphorus (TP), total dissolved phosphorus (TDP), total organic carbon (TOC), and dissolved organic carbon (DOC). * Significant at p<0.05, significant at significant at p<0.00.
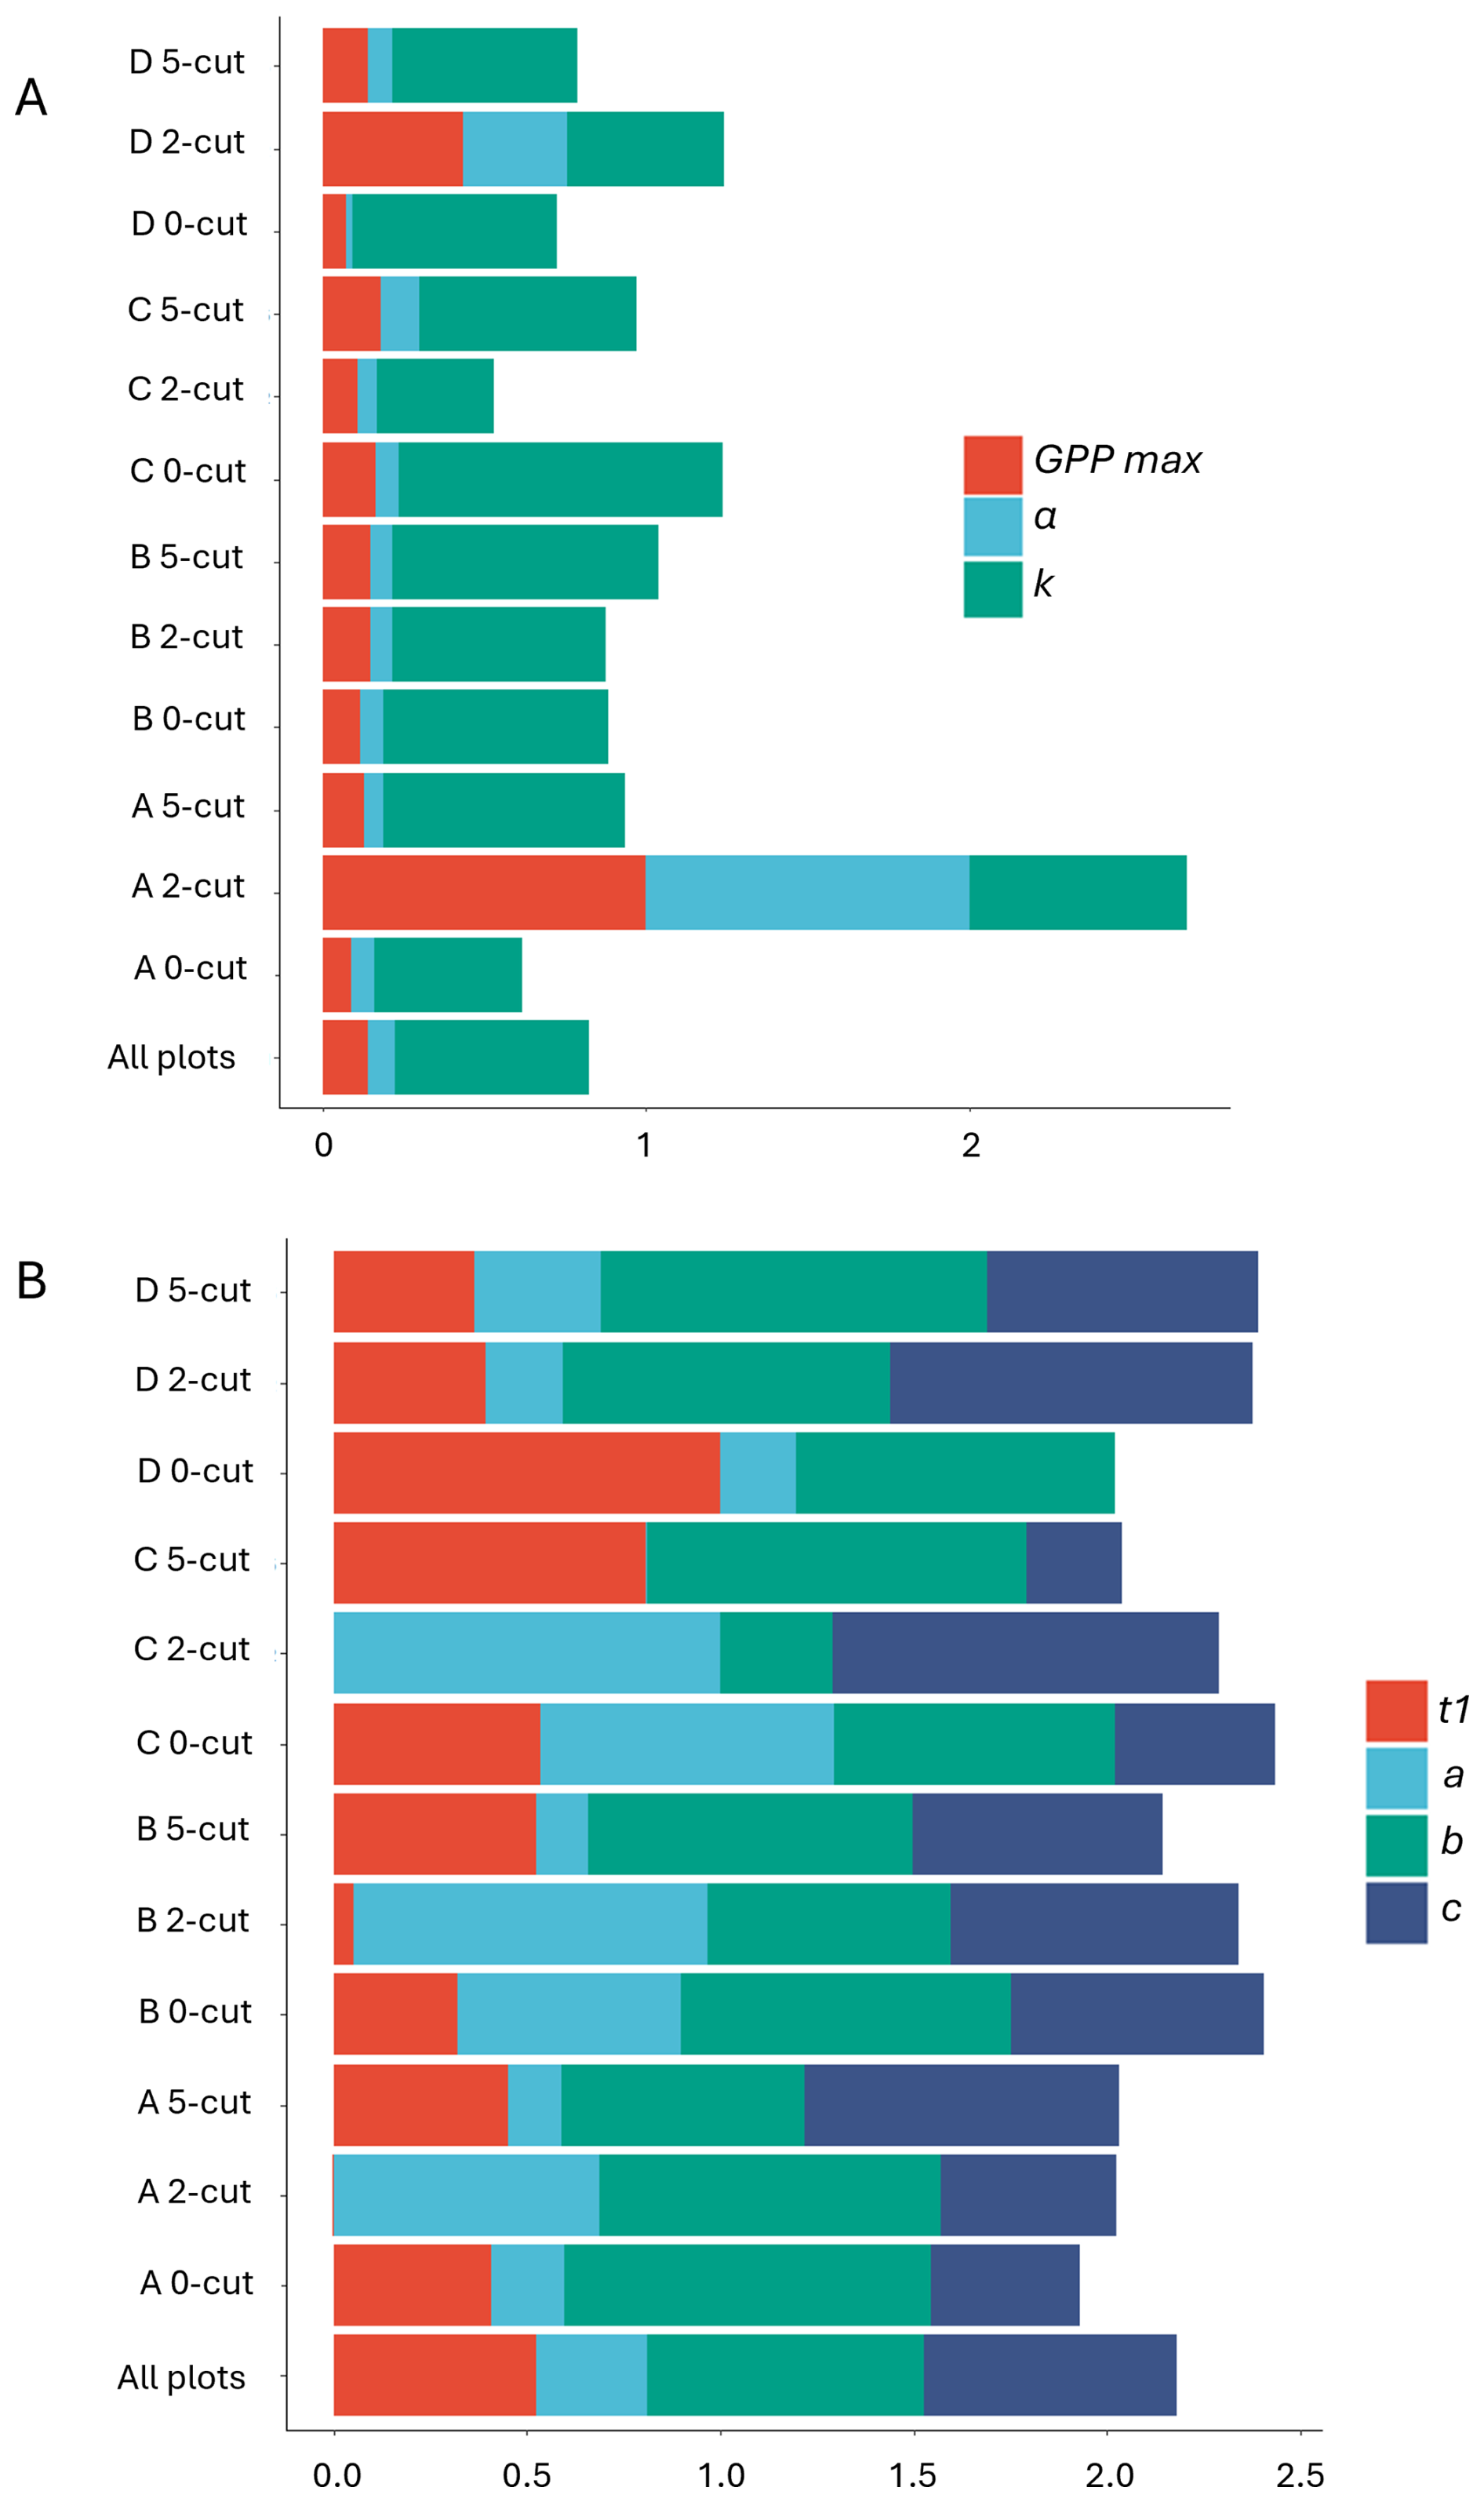
Figure A2Variability of parameters fitted in Reco model (4) (A) and the GPP model (B). Each bar represents a plot, and the bottom bar corresponds to the model including all plots. Each color represents a different parameter. Parameter values were normalized i.e. dividing them by the maximum value.

Figure A31 : 1 plots of measured vs. modelled Reco using model (4) for the three harvest treatments. All blocks are included each of the harvest treatments, N=104.
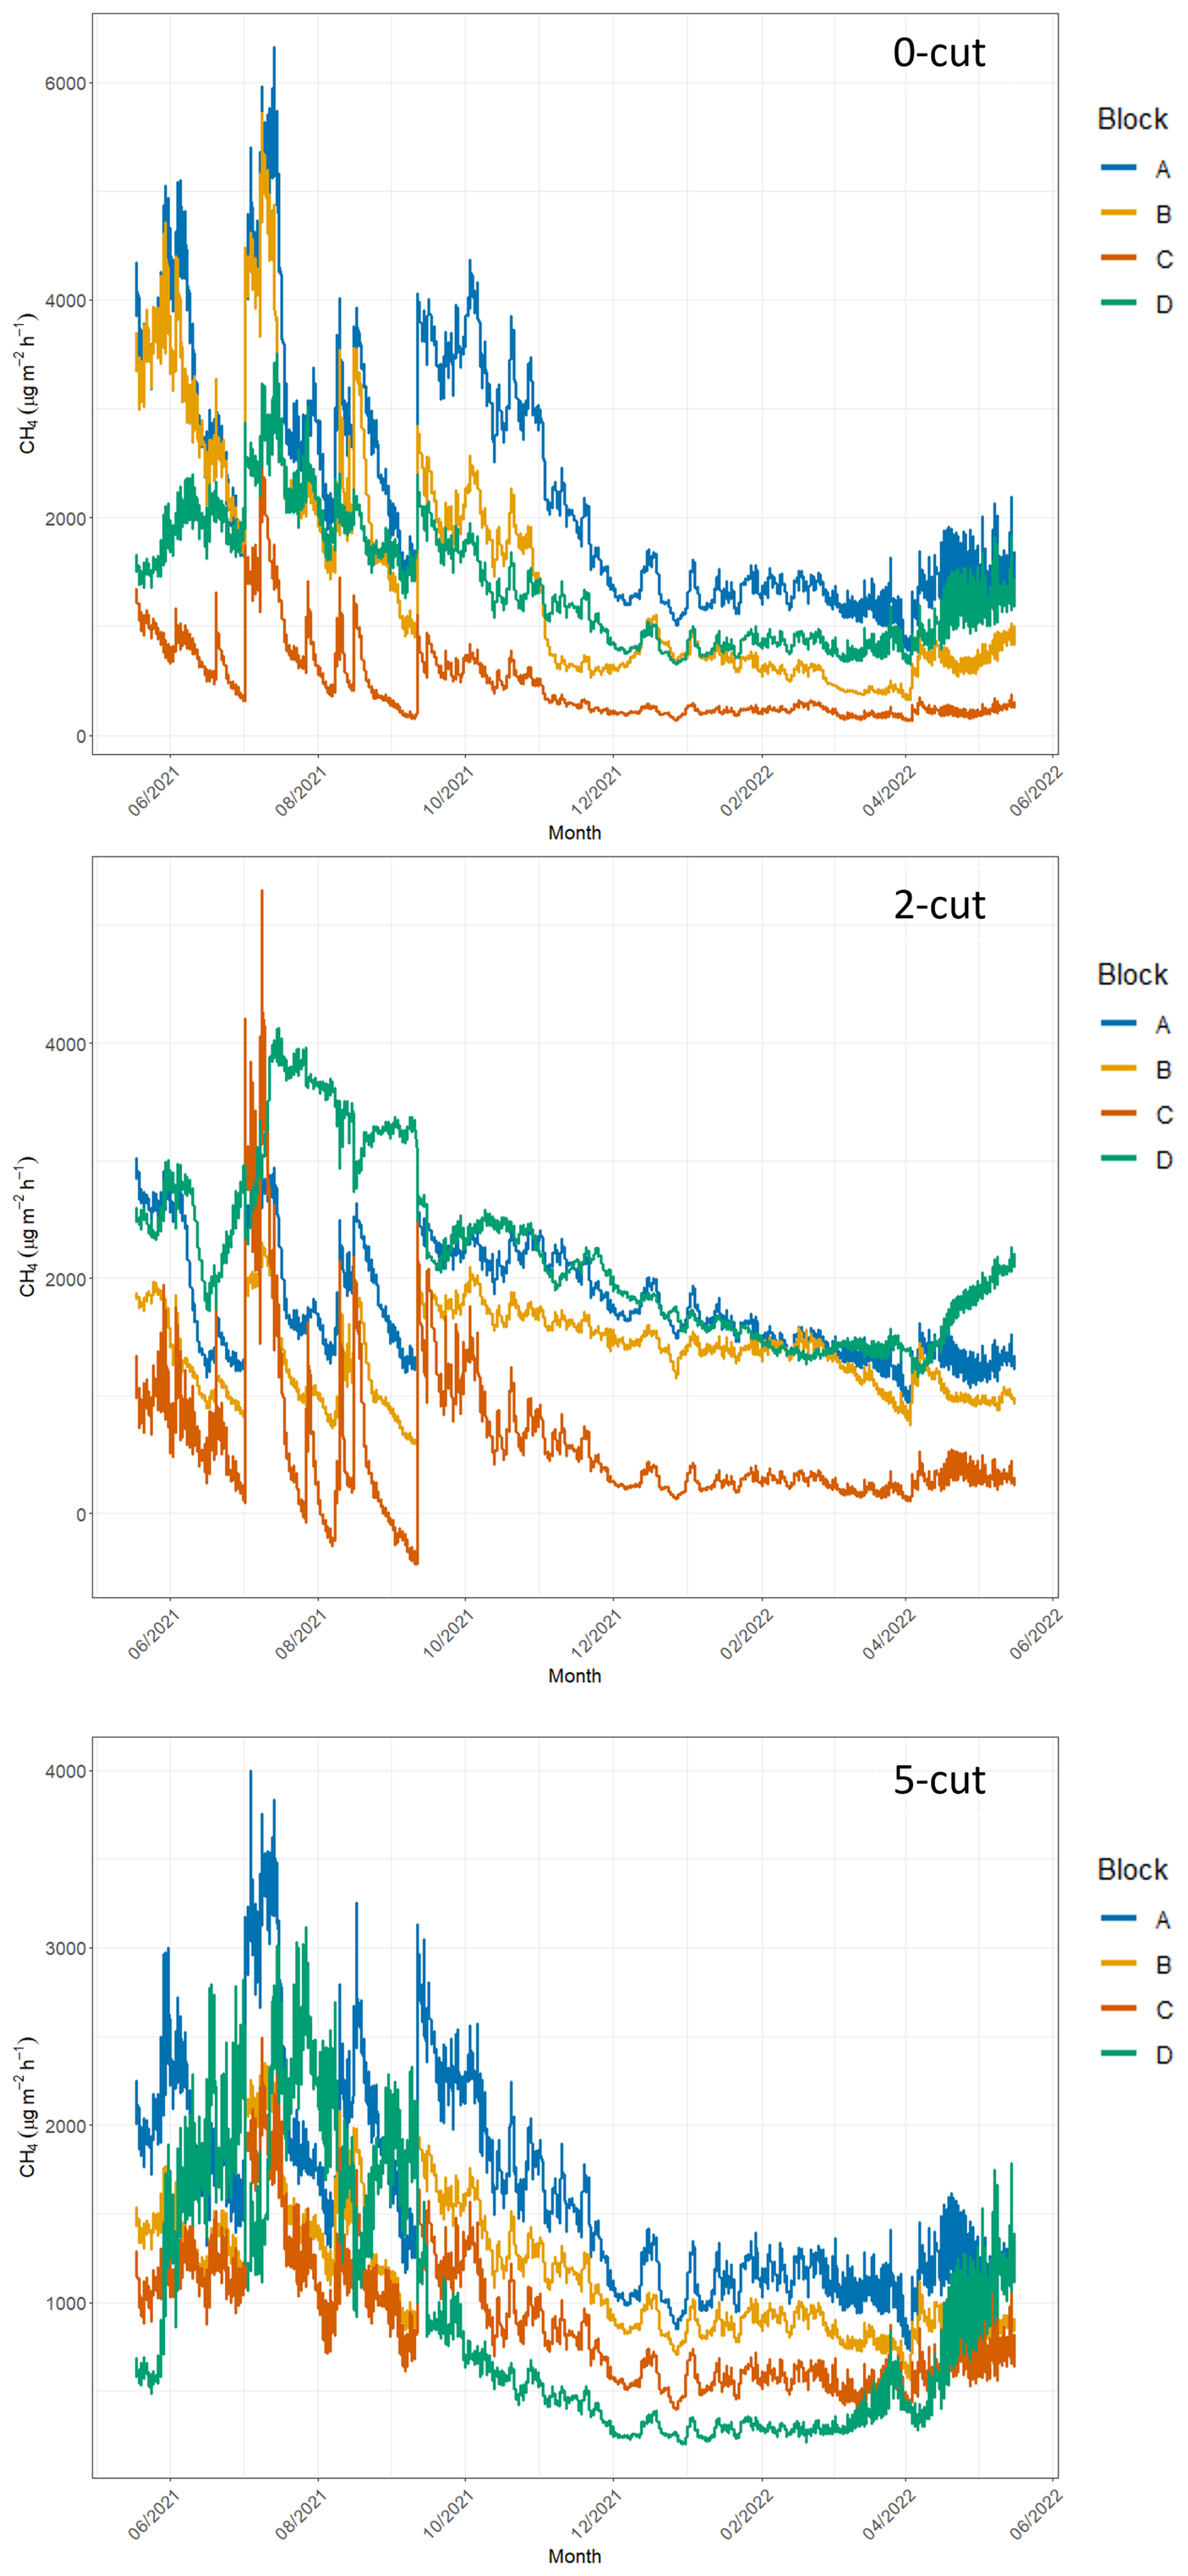
Figure A4Time series of methane emissions from studied blocks (different line colors) and from the three harvest treatments (0-cut, 2-cut, and 5-cut). CH4 emissions calculated only under 0 % PAR conditions.
Table A4Comparison of annual Reco estimated with models (4), (2) and (3), which use hourly data on Ts, WTD and RVI, model (4) using either mean annual WTD and Ts (M Model), and model (4) using mean annual WTD and hourly Ts (MH model), the latter two models including hourly RVI data.
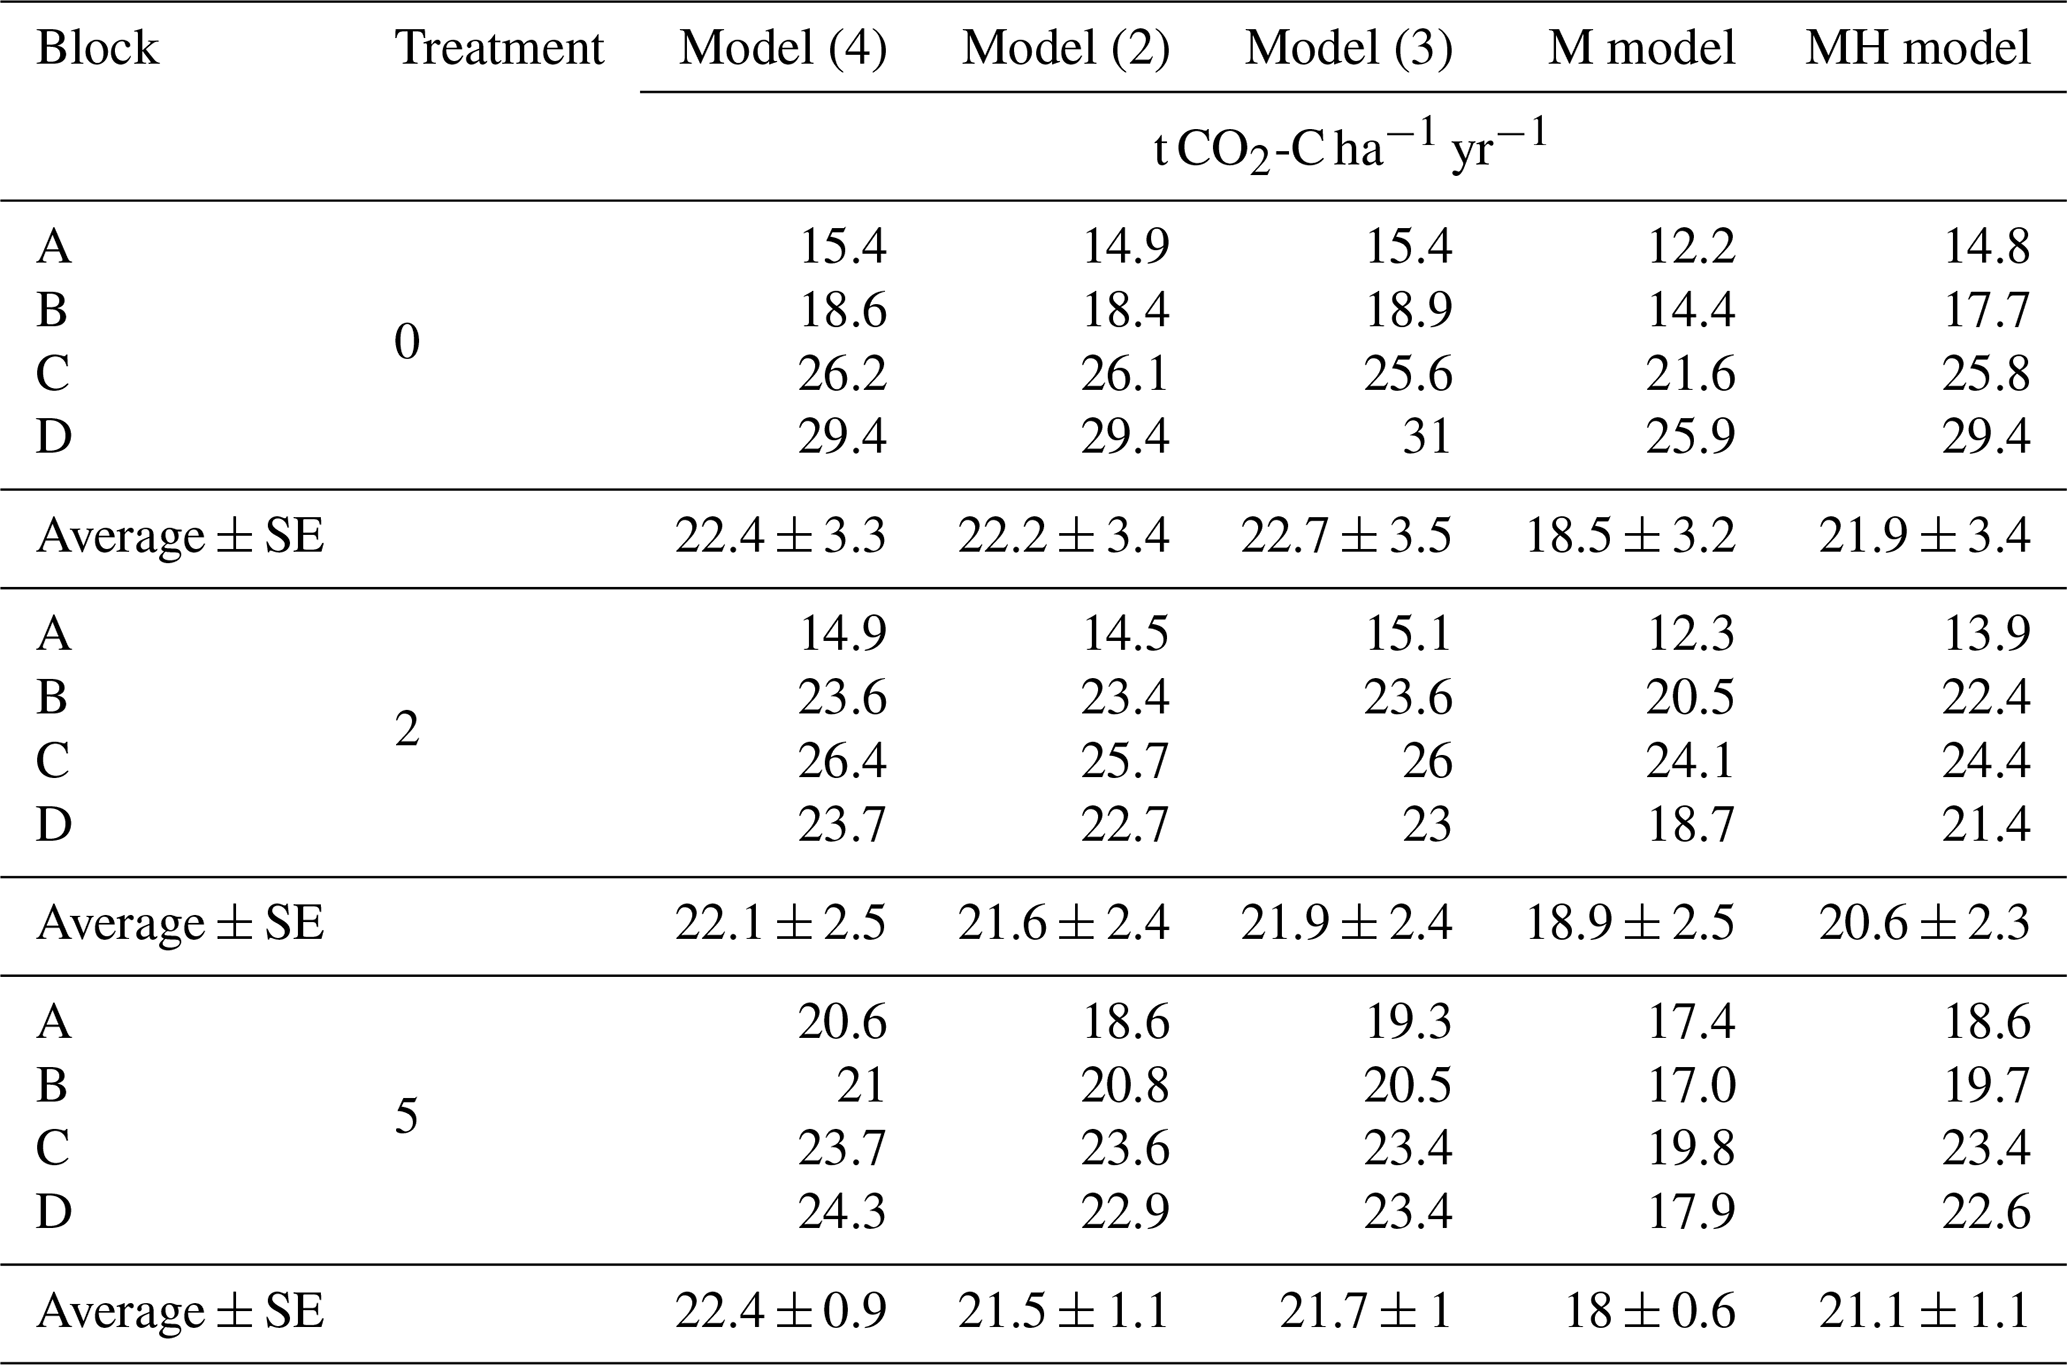
Table A5Total organic carbon (TOC), dissolved organic carbon (DOC), total nitrogen (TN), total dissolved nitrogen (TDN), total phosphorus (TP), total dissolved phosphorus (TDP), Turbidity (NTU), electrical conductivity (EC). If base model did not improve by adding the water chemistry parameters, R2 and RMSE are not shown.
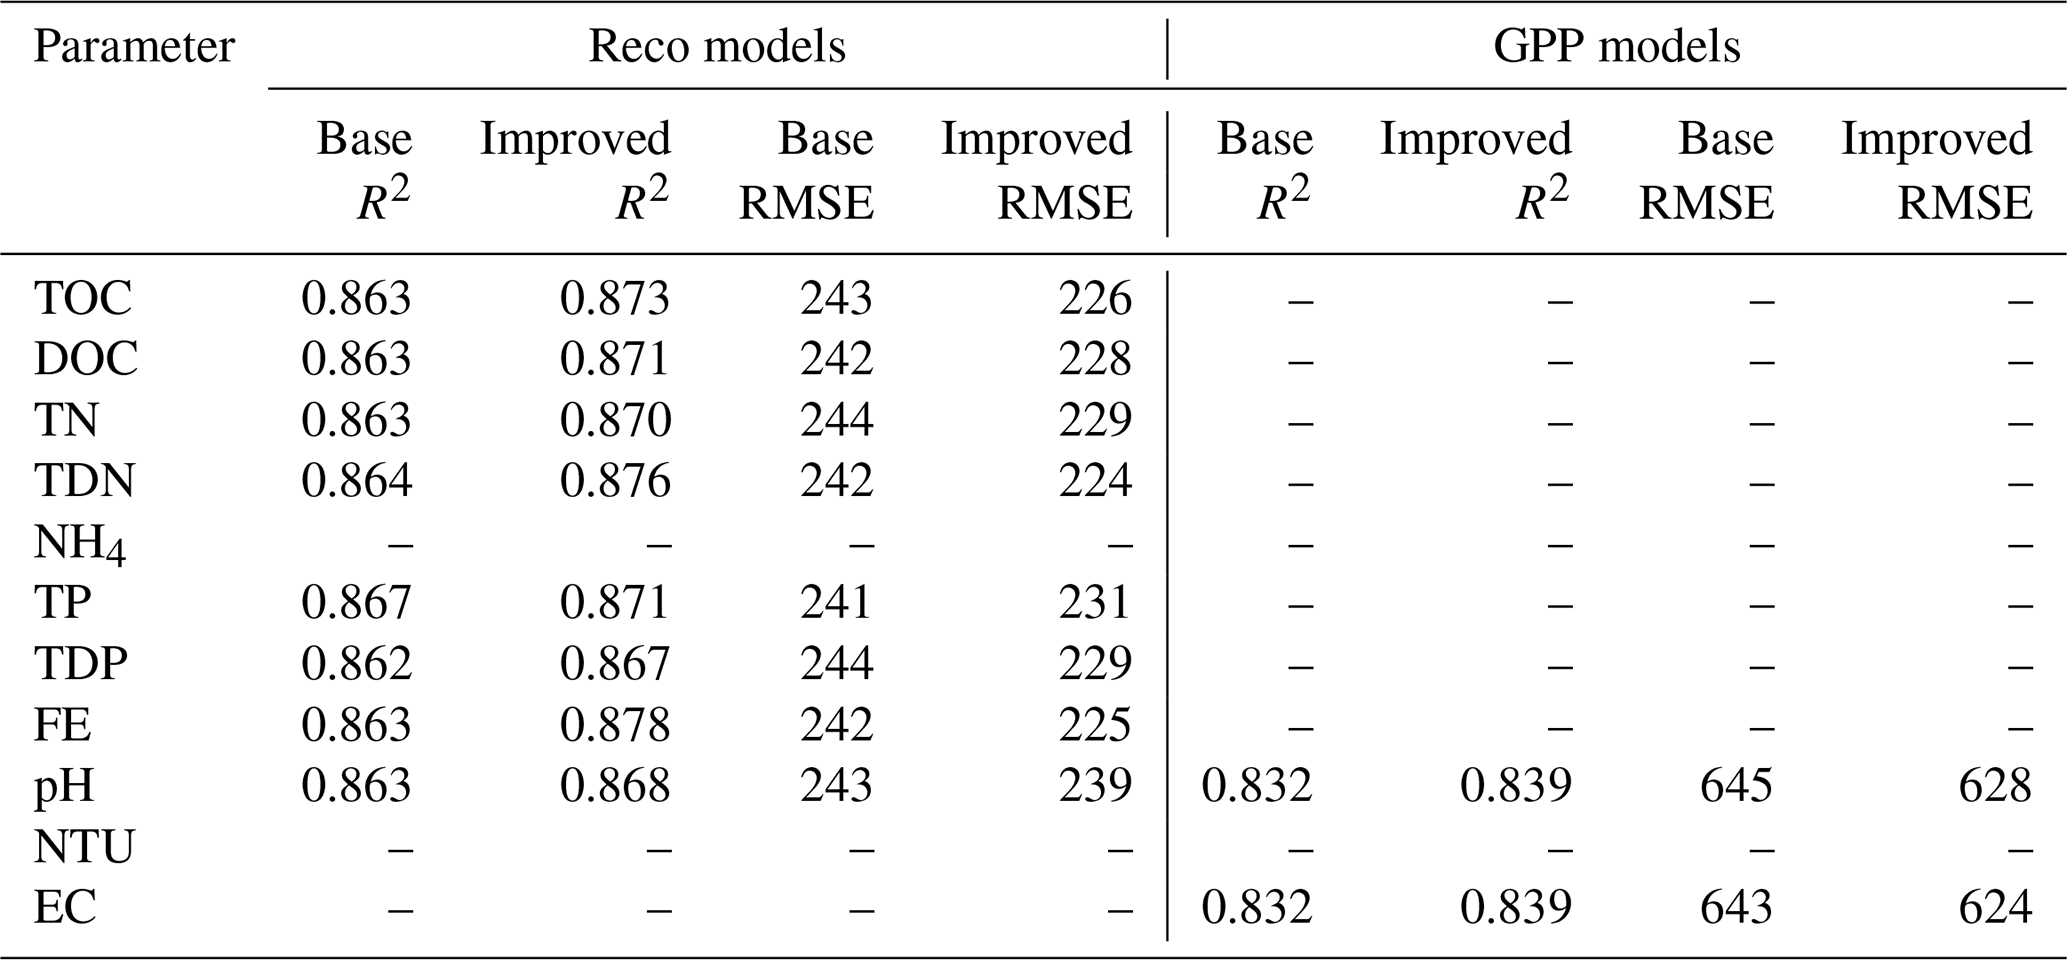
Table A6Model evaluation of Reco and GPP models using all data pooled and modelling all blocks and harvest treatments all together.
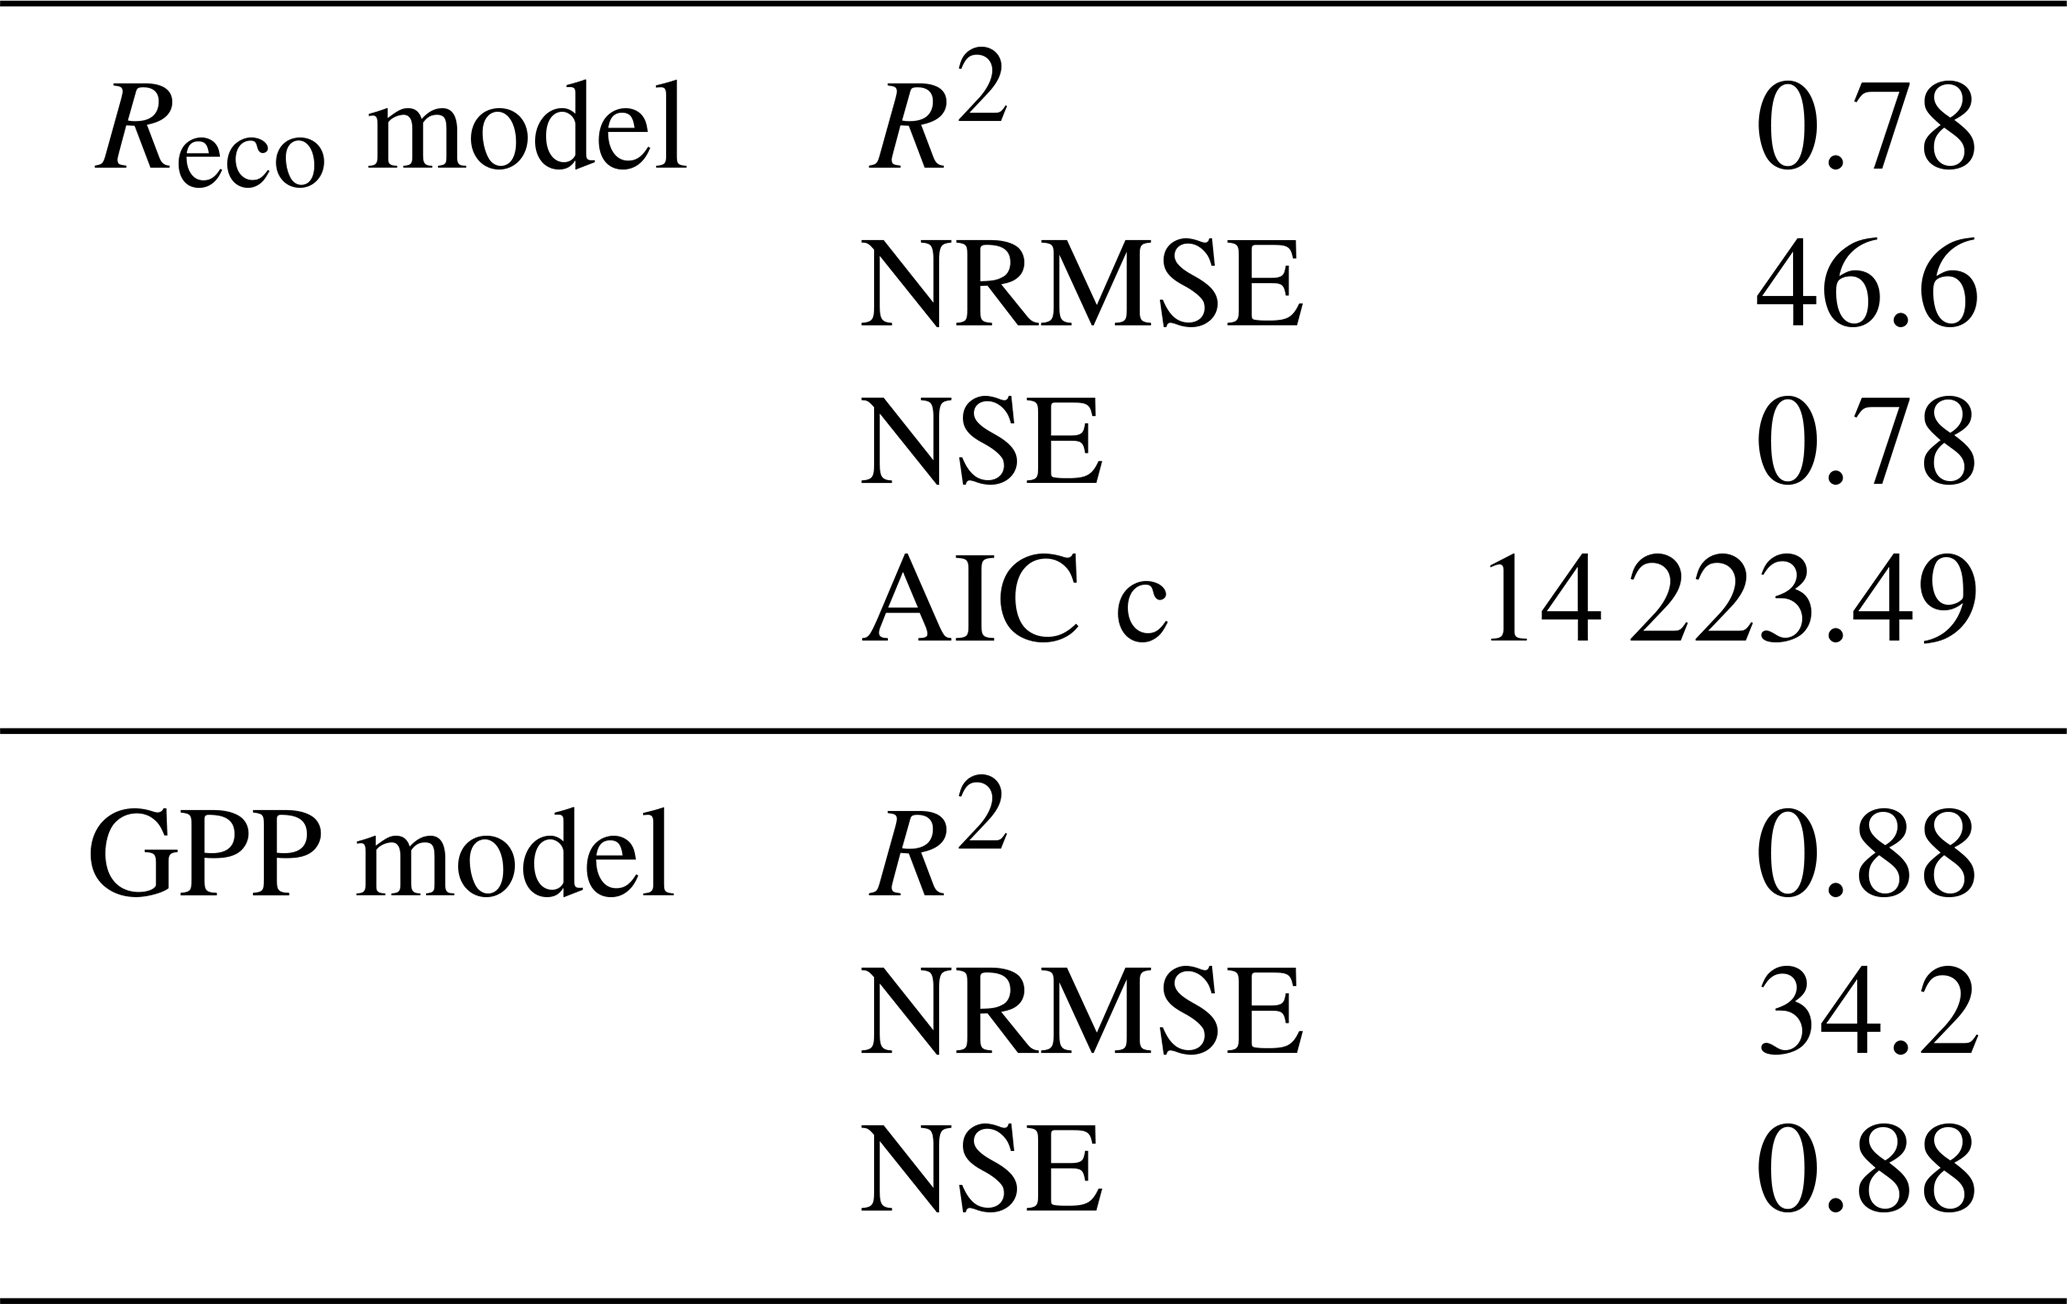
The four indexes of model evaluation are: R2, normalized root mean square of error (NRMSE), Nash-Sutcliffe efficiency (NSE), and corrected Akaike Information Criteria.
Table A7Carbon budget results obtained by using all data pooled and modelling all blocks and harvest treatments all together to obtain models of Reco and GPP.

Reco is ecosystem respiration, GPP is gross primary productivity, NEE is net ecosystem exchange, and NECB is the net ecosystem carbon balance (NEE + yield + CH4).
Data on CO2 and CH4 fluxes as well as pore water nutrient concentrations will be available on Zenodo: https://doi.org/10.5281/zenodo.14161801 (Lærke and Rodriguez, 2024).
PEL designed the experiment, methodology and directed data collection, AFR, JWMP, and PEL analyzed and visualized the data and wrote the original manuscript, all authors contributed in revising the manuscript.
The contact author has declared that none of the authors has any competing interests.
Publisher's note: Copernicus Publications remains neutral with regard to jurisdictional claims made in the text, published maps, institutional affiliations, or any other geographical representation in this paper. While Copernicus Publications makes every effort to include appropriate place names, the final responsibility lies with the authors. Views expressed in the text are those of the authors and do not necessarily reflect the views of the publisher.
This article is part of the special issue “Trade-offs and synergies of soil carbon sequestration and environmental impacts: implications for agricultural management”. It is a result of the EGU 2023, Vienna, Austria, 23–28 April 2023.
The authors would like to acknowledge the following people from the Agroecology Department at Aarhus University, Viborg: Michael Koppelgaard for his help in data collection and processing, Maarit Mäenpää for her help in the statistical analyses, Claudia Nielsen for her help in data processing, and Kirsten Kørup for her help in biomass harvesting.
This study was part of the INSURE project that received funding from the European Joint Programme EJP Soil under the European Union's Horizon 2020 research and innovation with grant agreement no. 862695. Co-funding was received from RePeat DK funded by the Danish Agricultural Agency.
This paper was edited by Eugenio Diaz Pines and reviewed by four anonymous referees.
Abdalla, M., Hastings, A., Truu, J., Espenberg, M., Mander, Ü., and Smith, P.: Emissions of methane from northern peatlands: a review of management impacts and implications for future management options, Ecology and Evolution, 6, 7080–7102, 2016.
AminiTabrizi, R., Dontsova, K., Grachet, N. G., and Tfaily, M. M.: Elevated temperatures drive abiotic and biotic degradation of organic matter in a peat bog under oxic conditions, Science of the Total Environment, 804, 150045, https://doi.org/10.1016/j.scitotenv.2021.150045, 2022.
Andersen, R., Farrell, C., Graf, M., Muller, F., Calvar, E., Frankard, P., Caporn, S., and Anderson, P.: An overview of the progress and challenges of peatland restoration in Western Europe, Restoration Ecology, 25, 271–282, 2017.
Arsenault, J., Talbot, J., and Moore, T. R.: Environmental controls of C, N and P biogeochemistry in peatland pools, Science of the Total Environment, 631, 714–722, 2018.
Arsenault, J., Talbot, J., Moore, T. R., Beauvais, M. P., Franssen, J., and Roulet, N. T.: The spatial heterogeneity of vegetation, hydrology and water chemistry in a peatland with open-water pools, Ecosystems, 22, 1352–1367, 2019.
Best, E. K.: An automated method for determining nitrate nitrogen in soil extracts, Queensland Journal of Agricultural and Animal Sciences, 33, 161–166, 1976.
Bianchi, A., Larmola, T., Kekkonen, H., Saarnio, S., and Lång, K: Review of greenhouse gas emissions from rewetted agricultural soils, Wetlands, 41, 1–7, 2021.
Bockermann, C., Eickenscheidt, T., and Drösler, M.: Adaptation of fen peatlands to climate change: rewetting and management shift can reduce greenhouse gas emissions and offset climate warming effects, Biogeochemistry, 167, 563–588, 2024.
Bourbonniere, R. A.: Review of water chemistry research in natural and disturbed peatlands, Canadian water resources journal, 34, 393–414, 2009.
Bridgham, S. D. and Richardson, C. J.: Hydrology and nutrient gradients in North Carolina peatlands, Wetlands, 13, 207–218, 1993.
Cabezas, A., Gelbrecht, J., Zwirnmann, E., Barth, M., and Zak, D.: Effects of degree of peat decomposition, loading rate and temperature on dissolved nitrogen turnover in rewetted fens, Soil Biology and Biochemistry, 48, 182–191, 2012.
Cabezas, A., Gelbrecht, J., and Zak, D.: The effect of rewetting drained fens with nitrate-polluted water on dissolved organic carbon and phosphorus release, Ecological engineering, 53, 79–88, 2013.
Chroňáková, A., Bárta, J., Kaštovská, E., Urbanová, Z., and Picek, T.: Spatial heterogeneity of belowground microbial communities linked to peatland microhabitats with different plant dominants, FEMS Microbiology Ecology, 95, fiz130, https://doi.org/10.1093/femsec/fiz130, 2019.
Crooke, W. M. and Simpson, W. E.: Determination of ammonium in Kjeldahl digests of crops by an automated procedure, Journal of the Science of Food and Agriculture, 22, 9–10, 1971.
Dansk Standard: DS 291. Water Analyses – orthophosphate-phosphorus, Photometric method, Dansk Standard, DS 291:1985, 2004.
Darusman, T., Murdiyarso, D., Impron, and Anas, I.: Effect of rewetting degraded peatlands on carbon fluxes: a meta-analysis, Mitigation and Adaptation Strategies for Global Change, 28, 10, https://doi.org/10.1007/s11027-023-10046-9, 2023.
De Jong, M., van Hal, O., Pijlman, J., van Eekeren, N., and Junginger, M.: Paludiculture as paludifuture on Dutch peatlands: An environmental and economic analysis of Typha cultivation and insulation production, Science of the Total Environment, 792, 148161, https://doi.org/10.1016/j.scitotenv.2021.148161, 2021.
Dragoni, F., Giannini, V., Ragaglini, G., Bonari, E., and Silvestri, N.: Effect of harvest time and frequency on biomass quality and biomethane potential of common reed (Phragmites australis) under paludiculture conditions, BioEnergy research, 10, 1066–1078, 2017.
Elsgaard, L., Görres, C. M., Hoffmann, C. C., Blicher-Mathiesen, G., Schelde, K., and Petersen, S. O.: Net ecosystem exchange of CO2 and carbon balance for eight temperate organic soils under agricultural management, Agriculture, ecosystems and environment, 162, 52–67, 2012.
Emsens, W. J., van Diggelen, R., Aggenbach, C. J., Cajthaml, T., Frouz, J., Klimkowska, A., Kotowski, W., Kozub, L., Liczner, Y., Seeber, E., Silvennoinen, H., Tanneberger, F., Vicena, J., Wilk, M., and Verbruggen, E.: Recovery of fen peatland microbiomes and predicted functional profiles after rewetting, ISME journal, 14, 1701–1712, 2020.
Erb, K. H., Kastner, T., Plutzar, C., Bais, A. L. S., Carvalhais, N., Fetzel, T., Gingrich, S., Haberl, H., Lauk, C., Niedertscheider, M., Pongratz, J., Thurner, M., and Luyssaert, S.: Unexpectedly large impact of forest management and grazing on global vegetation biomass, Nature, 553, 73–76, https://doi.org/10.1038/nature25138, 2018.
Evans, C. D., Peacock, M., Baird, A. J., Artz, R. R. E., Burden, A., Callaghan, N., Chapman, P. J., Cooper, H. M., Coyle, M., Craig, E., Cumming, A., Dixon, S., Gauci, V., Grayson, R. P., Helfter, C., Heppell, C. M., Holden, J., Jones, D. L., Kaduk, J., Levy, P., Matthews, R., McNamara, N. P., Misselbrook, T., Oakley, S., Page, S. E., Rayment, M., Ridley, L. M., Stanley, K. M., Williamson, J. L., Worrall, F., and Morrison, R: Overriding water table control on managed peatland greenhouse gas emissions, Nature, 593, 548–552, 2021.
Forster, P., Storelvmo, T., Armour, K., Collins, W., Dufresne, J.-L., Frame, D., Lunt, D. J., Mauritsen, T., Palmer, M. D., Watanabe, M., Wild, M., and Zhang, H.: The Earth's energy budget, climate feedbacks, and climate sensitivity, in: Climate change 2021: The physical science basis, Contribution of Working Group I to the Sixth Assessment Report of the Intergovernmental Panel on Climate Change, edited by: Masson-Delmotte, V., Zhai, P., Pirani, A., Connors, S. L., Péan, C., Berger, S., Caud, N., Chen, Y., Goldfarb, L., Gomis, M. I., Huang, M., Leitzell, K., Lonnoy, E., Matthews, J. B. R., Maycock, T. K., Waterfield, T., Yelekçi, O., Yu, R., and Zhou, B., Cambridge University Press, 923–1054, https://doi.org/10.1017/9781009157896.009, 2021.
Geurts, J. J., Oehmke, C., Lambertini, C., Eller, F., Sorrell, B. K., Mandiola, S. R., Grootjans, A. P., Brix, H., Wichtmann, W., Lamers, L. P., and Fritz, C.: Nutrient removal potential and biomass production by Phragmites australis and Typha latifolia on European rewetted peat and mineral soils, Science of the Total Environment, 747, 141102, https://doi.org/10.1016/j.scitotenv.2020.141102, 2020.
Giannini, V., Silvestri, N., Dragoni, F., Pistocchi, C., Sabbatini, T., and Bonari, E.: Growth and nutrient uptake of perennial crops in a paludicultural approach in a drained Mediterranean peatland, Ecological engineering, 103, 478–487, 2017.
Griffiths, N. A., Sebestyen, S. D., and Oleheiser, K. C.: Variation in peatland porewater chemistry over time and space along a bog to fen gradient, Science of the total environment, 697, 134152, https://doi.org/10.1016/j.scitotenv.2019.134152, 2019.
Haapalehto, T., Kotiaho, J. S., Matilainen, R., and Tahvanainen, T.: The effects of long-term drainage and subsequent restoration on water table level and pore water chemistry in boreal peatlands, Journal of Hydrology, 519, 1493–1505, 2014.
Hartung, C., Andrade, D., Dandikas, V., Eickenscheidt, T., Drösler, M., Zollfrank, C., and Heuwinkel, H.: Suitability of paludiculture biomass as biogas substrate–biogas yield and long-term effects on anaerobic digestion, Renewable energy, 159, 64–71, 2020.
Hemes, K. S., Chamberlain, S. D., Eichelmann, E., Anthony, T., Valach, A., Kasak, K., Szutu, D., Verfaillie, J., Silver, W. L., and Baldocchi, D. D.: Assessing the carbon and climate benefit of restoring degraded agricultural peat soils to managed wetlands, Agricultural and Forest Meteorology, 268, 202–214, 2019.
Jurasinski, G., Koebsch, F., Guenther, A., and Beetz, S.: flux: Flux Rate Calculation from Dynamic Closed Chamber Measurements, R package version 0.3-0.1, https://CRAN.R-project.org/package=flux (last access: 2 December 2025), 2022.
Juszczak, R., Humphreys, E., Acosta, M., Michalak-Galczewska, M., Kayzer, D., and Olejnik, J.: Ecosystem respiration in a heterogeneous temperate peatland and its sensitivity to peat temperature and water table depth, Plant and Soil, 366, 505–520, 2013.
Kandel, T. P., Sutaryo, S., Møller, H. B., Jørgensen, U., and Lærke, P. E.: Chemical composition and methane yield of reed canary grass as influenced by harvesting time and harvest frequency, Bioresource technology, 130, 659–666, 2013.
Kandel, T. P., Elsgaard, L., and Lærke, P. E.: Annual balances and extended seasonal modelling of carbon fluxes from a temperate fen cropped to festulolium and tall fescue under two-cut and three-cut harvesting regimes, GCB Bioenergy, 9, 1690–1706, 2017.
Kandel, T. P., Karki, S., Elsgaard, L., and Lærke, P. E.: Fertilizer-induced fluxes dominate annual N2O emissions from a nitrogen-rich temperate fen rewetted for paludiculture, Nutrient Cycling in Agroecosystems, 115, 57–67, 2019.
Karki, S., Elsgaard, L., Audet, J., and Lærke, P. E.: Mitigation of greenhouse gas emissions from reed canary grass in paludiculture: effect of groundwater level, Plant and Soil, 383, 217–230, 2014.
Karki, S., Kandel, T. P., Elsgaard, L., Labouriau, R., and Lærke, P. E.: Annual CO2 fluxes from a cultivated fen with perennial grasses during two initial years of rewetting, Mire Peat, 25, https://doi.org/10.19189/MaP.2017.DW.322, 2019.
Karimi, S., Hasselquist, E. M., Salimi, S., Järveoja, J., and Laudon, H.: Rewetting impact on the hydrological function of a drained peatland in the boreal landscape, Journal of Hydrology, 641, 131729, https://doi.org/10.1016/j.jhydrol.2024.131729, 2024.
Kreyling, J., Tanneberger, F., Jansen, F., Van Der Linden, S., Aggenbach, C., Blüml, V., Couwenberg, J., Emsens, W.J., Joosten, H., Klimkowska, Kotowski, W., Kozub, L., Lennartz, B., Liczner, Y., Liu, H., Michaelis, D., Oehmke, C., Parakenings, K., Pleyl, E., Poyda, A., Raabe, S., Röhl, M., Rücker, K., Schneider, A., Schrautzer, J., Schröder, C., Schug, F., Seeber, E., Thiel, F., Thiele, S., Tiemeyer, B., Timmermann, T., Urich, T., van Diggelen, R., Vegelin, K., Verbruggen, E., Wilmking, M., Wrage-Mönnig, N., Wołejko, L., Zak, D., and Jurasinski, G.: Rewetting does not return drained fen peatlands to their old selves, Nature communications, 12, 5693, https://doi.org/10.1038/s41467-021-25619-y, 2021.
Koch, J., Elsgaard, L., Greve, M. H., Gyldenkærne, S., Hermansen, C., Levin, G., Wu, S., and Stisen, S.: Water-table-driven greenhouse gas emission estimates guide peatland restoration at national scale, Biogeosciences, 20, 2387–2403, https://doi.org/10.5194/bg-20-2387-2023, 2023.
Kou, D., Virtanen, T., Treat, C. C., Tuovinen, J. P., Räsänen, A., Juutinen, S., Mikola, J., Aurela, M., Heiskanen, L., Heikkilä, M., Weckström, J., Juselius, T., Piilo, S. R., Deng, J., Zhang, Y., Chaudhary, N., Huang, C., Väliranta, M., Biasi, C., Liu, X., Guo, M., Zhuang, Q., Korhola, A., Shurpali, N. J.: Peatland heterogeneity impacts on regional carbon flux and its radiative effect within a boreal landscape, Journal of Geophysical Research: Biogeosciences, 127, e2021JG006774, https://doi.org/10.1029/2021JG006774, 2022.
Lærke, P. E. and Rodriguez, A.: INSURE DK Vejrumbro 2021_22, Zenodo [data set], https://doi.org/10.5281/zenodo.14161801, 2024.
Lafleur, P. M., Moore, T. R., Roulet, N. T., and Frolking, S.: Ecosystem respiration in a cool temperate bog depends on peat temperature but not water table, Ecosystems, 8, 619–629, 2005.
Lång, K., Honkanen, H., Heikkinen, J., Saarnio, S., Larmola, T., and Kekkonen, H.: Impact of crop type on the greenhouse gas (GHG) emissions of a rewetted cultivated peatland, Soil, 10, 827–841, https://doi.org/10.5194/soil-10-827-2024, 2024.
Larmola, T., Bubier, J. L., Kobyljanec, C., Basiliko, N., Juutinen, S., Humphreys, E., Preston, M., and Moore, T. R.: Vegetation feedbacks of nutrient addition lead to a weaker carbon sink in an ombrotrophic bog, Global Change Biology, 19, 3729–3739, 2013.
Leifeld, J. and Menichetti, L.: The underappreciated potential of peatlands in global climate change mitigation strategies, Nature communications, 9, 1071, https://doi.org/10.1038/s41467-018-03406-6, 2018.
Leifeld, J., Wüst-Galley, C., and Page, S.: Intact and managed peatland soils as a source and sink of GHGs from 1850 to 2100, Nature Climate Change, 9, 945–947, 2019.
Liu, H., Zak, D., Rezanezhad, F., and Lennartz, B.: Soil degradation determines release of nitrous oxide and dissolved organic carbon from peatlands, Environmental Research Letters, 14, 094009, https://doi.org/10.1088/1748-9326/ab3947, 2019.
Liu, W., Fritz, C., Weideveld, S. T., Aben, R. C., Van Den Berg, M., and Velthuis, M.: Annual CO2 budget estimation from chamber-based flux measurements on intensively drained peat meadows: Effect of gap-filling strategies, Frontiers in Environmental Science, 10, 803746, https://doi.org/10.3389/fenvs.2022.803746, 2022.
Loisel, J. and Gallego-Sala, A.: Ecological resilience of restored peatlands to climate change, Communications Earth & Environment, 3, 208, https://doi.org/10.1038/s43247-022-00547-x, 2022.
Lundin, L., Nilsson, T., Jordan, S., Lode, E., and Strömgren, M.: Impacts of rewetting on peat, hydrology and water chemical composition over 15 years in two finished peat extraction areas in Sweden, Wetlands ecology and management, 25, 405–419, 2017.
Malinowski, R., Groom, G., Schwanghart, W., and Heckrath, G.: Detection and delineation of localized flooding from WorldView-2 multispectral data, Remote sensing, 7, 14853–14875, 2015.
Mashhadi, S. R., Grombacher, D., Zak, D., Lærke, P. E., Andersen, H. E., Hoffmann, C. C., and Petersen, R. J.: Borehole nuclear magnetic resonance as a promising 3D mapping tool in peatland studies, Geoderma, 443, 116814, https://doi.org/10.1016/j.geoderma.2024.116814, 2024.
Nielsen, C. K., Stødkilde, L., Jørgensen, U., and Laerke, P. E.: Effects of harvest and fertilization frequency on protein yield and extractability from flood-tolerant perennial grasses cultivated on a fen peatland, Frontiers in Environmental Science, 9, 619258, https://doi.org/10.3389/fenvs.2021.619258, 2021.
Nielsen, C. K., Stødkilde, L., Jørgensen, U., and Lærke, P. E.: Ratio vegetation indices have the potential to predict extractable protein yields in green protein paludiculture, Mires and Peat, 29, https://doi.org/10.19189/MaP.2022.OMB.Sc.1883464, 2023a.
Nielsen, C. K., Elsgaard, L., Jørgensen, U., and Lærke, P. E.: Soil greenhouse gas emissions from drained and rewetted agricultural bare peat mesocosms are linked to geochemistry, Science of the Total Environment, 896, 165083, https://doi.org/10.1016/j.scitotenv.2023.165083, 2023b.
Nielsen, C. K., Liu, W., Koppelgaard, M., and Laerke, P. E.: To Harvest or not to Harvest: Management Intensity did not Affect Greenhouse Gas Balances of Phalaris Arundinacea Paludiculture, Wetlands, 44, 79, https://doi.org/10.1007/s13157-024-01830-7, 2024.
Page, S. E. and Baird, A. J.: Peatlands and global change: response and resilience, Annual Review of Environment and Resources, 41, 35–57, 2016.
Piilo, S. R., Korhola, A., Heiskanen, L., Tuovinen, J. P., Aurela, M., Juutinen, S., Marttila, H., Saari, M., Tuittila, E. S., Turunen, J., and Väliranta, M. M.: Spatially varying peatland initiation, Holocene development, carbon accumulation patterns and radiative forcing within a subarctic fen, Quaternary Science Reviews, 248, 106596, https://doi.org/10.1016/j.quascirev.2020.106596, 2020.
Purre, A. H., Penttilä, T., Ojanen, P., Minkkinen, K., Aurela, M., Lohila, A., and Ilomets, M.: Carbon dioxide fluxes and vegetation structure in rewetted and pristine peatlands in Finland and Estonia, Boreal Environment Research, 24, 1–6, 2019.
Putkinen, A., Tuittila, E. S., Siljanen, H. M., Bodrossy, L., and Fritze, H.: Recovery of methane turnover and the associated microbial communities in restored cutover peatlands is strongly linked with increasing Sphagnum abundance, Soil Biology and Biochemistry, 116, 110–119, 2018.
R Core Team: R: A Language and Environment for Statistical Computing, R Foundation for Statistical Computing, Vienna, Austria, https://www.R-project.org/ (last access: 2 December 2025), 2023.
Ren, L., Eller, F., Lambertini, C., Guo, W. Y., Brix, H., and Sorrell, B. K.: Assessing nutrient responses and biomass quality for selection of appropriate paludiculture crops, Science of the Total Environment, 664, 1150–1161, 2019.
Scharlemann, J. P., Tanner, E. V., Hiederer, R., and Kapos, V.: Global soil carbon: understanding and managing the largest terrestrial carbon pool, Carbon management, 5, 81–91, 2014.
Silvola, J., Alm, J., Ahlholm, U., Nykanen, H., and Martikainen, P. J.: CO2 fluxes from peat in boreal mires under varying temperature and moisture conditions, Journal of ecology, https://doi.org/10.2307/2261357, 219–228, 1996.
Rigney, C., Wilson, D., Renou-Wilson, F., Müller, C., Moser, G., and Byrne, K. A.: Greenhouse gas emissions from two rewetted peatlands previously managed for forestry, Mires and Peat, 21, 1–23, 2018.
Song, Y., Cheng, X., Song, C., Li, M., Gao, S., Liu, Z., Gao, J., and Wang, X.: Soil CO2 and N2O emissions and microbial abundances altered by temperature rise and nitrogen addition in active-layer soils of permafrost peatland, Frontiers in Microbiology, 13, 1093487, https://doi.org/10.3389/fmicb.2022.1093487, 2022.
Tanneberger, F., Schröder, C., Hohlbein, M., Lenschow, U., Permien, T., Wichmann, S., and Wichtmann, W.: Climate change mitigation through land use on rewetted peatlands–cross-sectoral spatial planning for paludiculture in Northeast Germany, Wetlands, 40, 2309–2320, 2020.
Thers, H., Knudsen, M. T., and Lærke, P. E.: Comparison of GHG emissions from annual crops in rotation on drained temperate agricultural peatland with production of reed canary grass in paludiculture using an LCA approach, Heliyon, 9, https://doi.org/10.1016/j.heliyon.2023.e17320, 2023.
Tiemeyer, B., Freibauer, A., Borraz, E. A., Augustin, J., Bechtold, M., Beetz, S., Beyer, C., Ebli, M., Eickenscheidt, T., Fiedler, S., Förster, C., Gensior, A., Giebels, M., Glatzel, S., Heinichen, J., Hoffmann, M., Höper, H., Jurasinski, G., Laggner, A., Leiber-Sauheitl, K., Peichl-Brak, M., and Drösler, M.: A new methodology for organic soils in national greenhouse gas inventories: Data synthesis, derivation and application, Ecological Indicators, 109, 105838, https://doi.org/10.1016/j.ecolind.2019.105838, 2020.
Urbanová, Z. and Bárta, J.: Recovery of methanogenic community and its activity in long-term drained peatlands after rewetting, Ecological engineering, 150, 105852, https://doi.org/10.1016/j.ecoleng.2020.105852, 2020.
Vroom, R. J., Xie, F., Geurts, J. J., Chojnowska, A., Smolders, A. J., Lamers, L. P., and Fritz, C.: Typha latifolia paludiculture effectively improves water quality and reduces greenhouse gas emissions in rewetted peatlands, Ecological engineering, 124, 88–98, 2018.
Wilson, D., Blain, D., Couwenberg, J., Evans, C. D., Murdiyarso, D., Page, S., Renou-Wilson, F., Rieley, J. O., Sirin, A., Strack, M., and Tuittila, E. S.: Greenhouse gas emission factors associated with rewetting of organic soils, Mires and Peat, 17, 1–28, 2016.
Wood, M. E., Macrae, M. L., Strack, M., Price, J. S., Osko, T. J., and Petrone, R. M.: Spatial variation in nutrient dynamics among five different peatland types in the Alberta oil sands region, Ecohydrology, 9, 688–699, 2016.
Yu, Z., Loisel, J., Brosseau, D. P., Beilman, D. W., and Hunt, S. J.: Global peatland dynamics since the Last Glacial Maximum, Geophysical research letters, 37, https://doi.org/10.1029/2010GL043584, 2010.
Zak, D., Roth, C., Unger, V., Goldhammer, T., Fenner, N., Freeman, C., and Jurasinski, G.: Unraveling the importance of polyphenols for microbial carbon mineralization in rewetted riparian peatlands, Frontiers in Environmental Science, 7, 147, https://doi.org/10.3389/fenvs.2019.00147, 2019.
Zambrano-Bigiarini, M.: hydroGOF: Goodness-of-fit functions for comparison of simulated and observed hydrological time series, R package version 0.4-0, Zenodo, https://doi.org/10.5281/zenodo.839854, 2020.
Zhong, Y., Jiang, M., and Middleton, B. A.: Effects of water level alteration on carbon cycling in peatlands, Ecosystem Health and Sustainability, 6, 1806113, https://doi.org/10.1080/20964129.2020.1806113, 2020.
Ziegler, R.: Paludiculture as a critical sustainability innovation mission, Research Policy, 49, 103979, https://doi.org/10.1016/j.respol.2020.103979, 2020.