the Creative Commons Attribution 4.0 License.
the Creative Commons Attribution 4.0 License.
 | 27 Nov 2023
The effect of different biopreparations on soil physical properties and CO2 emissions when growing winter wheat and oilseed rape
Sidona Buragienė
Egidijus Šarauskis
Aida Adamavičienė
Kęstutis Romaneckas
Kristina Lekavičienė
Daiva Rimkuvienė
Vilma Naujokienė
The introduction of innovative technologies in agriculture is key not only to improving the efficiency of agricultural production and crop yields and quality but also to balancing energy use and preserving a cleaner environment. Biopreparations are environmentally friendly means of restoring the vitality of the soil in which plants can thrive. Biopreparations have an impact on soil health and alter greenhouse gas emissions. The aim of this study was to investigate the effects of different biopreparations on soil porosity, temperature, and CO2 (carbon dioxide) emissions from the soil in northeast Europe (Lithuania) when growing winter wheat and oilseed rape. The experimental studies were carried out over 3 years, and each spring, after the resumption of winter crops, the soil surface was sprayed with biopreparations of different properties or with mixtures of biopreparations under seven scenarios, with one scenario left as a control. Soil porosity, temperature, and CO2 emissions from the soil were measured regularly every month from April to August. The application of the biopreparations showed a cumulative effect on the soil properties. In the third year of the study, the total porosity of the soil was higher in all scenarios compared to the control, ranging between 51 % and 74 %. The aeration porosity of the soil was also higher in all years of the study than in the control, although no significant differences were obtained. The results of the studies on CO2 emissions from the soil showed that, in the first year, the application of the biopreparations increased emissions compared to the control. However, when assessing the cumulative effect of the biopreparations on soil respiration intensity, it was found that, in the third year, most of the biopreparations led to a reduction in CO2 emissions compared to the control. The lowest emissions were achieved with the biopreparations consisting of essential oils of plants, 40 species of various herbs extracts, marine algae extracts, Azospirillum sp., Frateuria aurentia, Bacillus megaterium, mineral oils, Azotobacter vinelandi, humic acid, gibberellic acid, sodium molybdate, Azototbacter chroococcum, Azospirillum brasilense, etc. Evaluating the effectiveness of biopreparations on soil porosity, temperature, and CO2 emissions from the soil, it can be stated that the best effect was achieved in all 3 research years in using biopreparations with Azotobacter chroococcum, Azotospirilum brasilense, various herbs, marine algae extracts, oils of plants, and mineral substances. The multiple-regression model showed that soil temperature has a greater influence on the variation of CO2 emissions than soil aeration porosity.
- Article
(9061 KB) - Full-text XML
- BibTeX
- EndNote


1.1 Importance of biopreparations
Decades of soil degradation have led to a search for ways to contribute to soil sustainability by preserving soil properties without harming the environment. Over the last decade, European agricultural policy has increasingly turned towards environmental sustainability, with the aim of reducing the use of chemicals and increasing the organic area (European Commission, 2020). An increasing number of agricultural operators and farmers have adopted environmentally friendly biotechnologies that use biopreparations, i.e. bioproducts designed to inhibit the growth of pathogenic fungi or bacteria, stimulate plant growth, improve plant nutrient uptake, and restore soil properties and fertility (Michalak et al., 2016; Trevisan et al., 2019; Szparaga et al., 2019). Consumers have started to increasingly value agricultural products with high nutritional and functional value and environmentally sustainable production (Caruso et al., 2019; Szparaga et al., 2018). Therefore, bioproducts used in agricultural practice aim to enhance the biological protection of plants by reducing the spread of pathogens and pests, increasing crop productivity, improving soil microbiology, changing the physical and chemical properties of soil, reducing environmental pollution, and weakening the properties of crop residues (Khattab et al., 2009; Vaitauskiene et al., 2015; Oskiera et al., 2017; Naujokienė et al., 2018). Blaszczys et al. (2014) stated that Trichoderma harzianum and Trichoderma atroviride are common components of biopreparations used in agriculture. Fungi of the genus Trichoderma can effectively reduce phytopathogens in agricultural soils through various mechanisms (Oskiera et al., 2017). A combination of edaphic and dynamic factors, including crop rotation, residue management, soil type, tillage, and climate, affect the microorganism community (Bünemann et al., 2008; Gil et al., 2011; Zhang et al., 2014). A growing body of research demonstrates that plant-derived phytochemicals affect the soil microbiota through interactions between plant roots and soil (Bais et al., 2006; Kong et at., 2008; Lorenzo et al., 2013). Biopreparations have multiple effects, but scientists are placing more emphasis on their positive effects on plants and soil (Tarantino et al., 2018). Biopreparations are also used as seed diluents to increase germination and reduce seed contamination with pathogenic microorganisms (Selby et al., 2016; Rouphael et al., 2018). Kocira et al. (2020) report that the mixtures of seeds and biopreparations obtained from Archangelica officinalis L. significantly inhibit fungal development on the seed surface. Biopreparations have antimicrobial activity because they contain biologically active substances that can inhibit the development of microorganisms. The appropriate composition of the biopreparations to be used depends mainly on the plant species (Nostro et al., 2000; Sen and Batra, 2012; Shihabudeen et al., 2010). The use of biopreparations can reduce the cost of crop production and increase the efficiency of soil nutrient use by reducing the incidence of diseases caused by nutrient deficiencies. However, this effect is not easy to achieve as it requires a lot of knowledge on the proper selection of biopreparations, their application method, and the correct adjustment of the amount and concentration (Ertani et al., 2018; Szparaga et al., 2019; Michałek et al., 2018).
1.2 Effects of biopreparations on soil
Soil microorganisms are an essential link in the nutrient cycle in the soil and maintain soil fertility. Their activity determines the physical and chemical properties of the soil, and these properties in turn determine how the microorganisms feel in the soil. Soil physical properties such as porosity and temperature are constantly changing under the influence of the environment. A research team from Poland investigating the influence of microorganisms on soil density and porosity found no significant changes over 5 years (Pranagal et al., 2020). Other researchers (Montemurro et al., 2010; Peltre et al., 2015; Juknevičius et al., 2020) have suggested that biopreparations increased the organic carbon content of the soil, which presumably led to a decrease in soil density and an increase in overall porosity. Researchers have pointed out that soil water content influences soil density (Lu et al., 2018; Tian et al., 2018; Tong et al., 2020). Naujokienė et al. (2018) reported that the use of differently prepared biopreparations reduced soil hardness by up to 28 % and increased total porosity by up to 25 % in the second year of the study, which resulted in lower diesel fuel consumption and reduced GHG (greenhouse gas) emissions to the environment.
1.3 CO2 emissions from soil
The agricultural sector is one of the most important GHG polluters of the environment, and cleaner production processes in this sector are of particular interest (Hamzei and Seyyedi, 2016; Wu et al., 2017). CO2 emissions from soil are the second largest component of the carbon cycle and contribute to climate change (Mohammed et al., 2022). Agricultural producers are encouraged to increase agricultural production by developing alternative technologies that address climate change, i.e. that reduce the carbon footprint of agriculture (Dias et al., 2016; Foley et al., 2011; Tilman et al., 2002). Soil bioactivity is the set of biological processes that determine soil respiration, enzyme activity, humification, and mineralization processes. A group of researchers (Ma et al., 2021) has observed that microorganism structure (community structure) and soil properties change together depending on environmental conditions and determine the dynamics of GHG emissions. After using the biological preparation, the amount of organic carbon in the soil increased from 1.8 % to 2 %, a difference of 0.2 % (Juknevičius et al., 2018). Stimulating soil microorganisms increases CO2 release and improves nutrient mobilization (Klenz, 2015). Scientific results showed that the preparation of biocrusts biopreparation significantly improved soil physicochemical properties; respiration; and alkaline phosphatase, protease, and cellulose and reduced CO2 emissions in vegetation areas (Liu et al., 2017).
The dependence of soil respiration intensity, GHG emissions, and physical soil properties on tillage and other technological operations has already been studied quite extensively. However, the impact of environmentally friendly biopreparations on soil physical properties and the dynamics of CO2 emissions during the growing season has not yet been sufficiently studied (Naujokienė et al., 2018). The limited number of scientific papers on this topic shows that research on the effects of biopreparations on soil under different meteorological conditions is new and relevant. The aim of this study was to investigate the effects of different biopreparation formulations on soil porosity, temperature, and CO2 emissions from the soil in central Europe (Lithuania) when growing winter wheat and oilseed rape.
2.1 Site description and experimental design
Experimental field research was carried out in 2014–2017 at the Experimental Station of Vytautas Magnus University Agriculture Academy (54∘534′ N, 23∘50′ E) in ųgleyic-satiated planosoil (Endohypogleyic-Eutric Planosol – PLe-gln-w) (Buivydaitė et al., 2001). Analysis of changes in soil physical properties and CO2 emissions was carried out under the influence of biopreparations of different composition in northeast Europe (Lithuania) on the left bank of the river Nemunas in the Kaunas district.
Table 1Composition of the biopreparations used in different scenarios (Naujokienė et al., 2018).
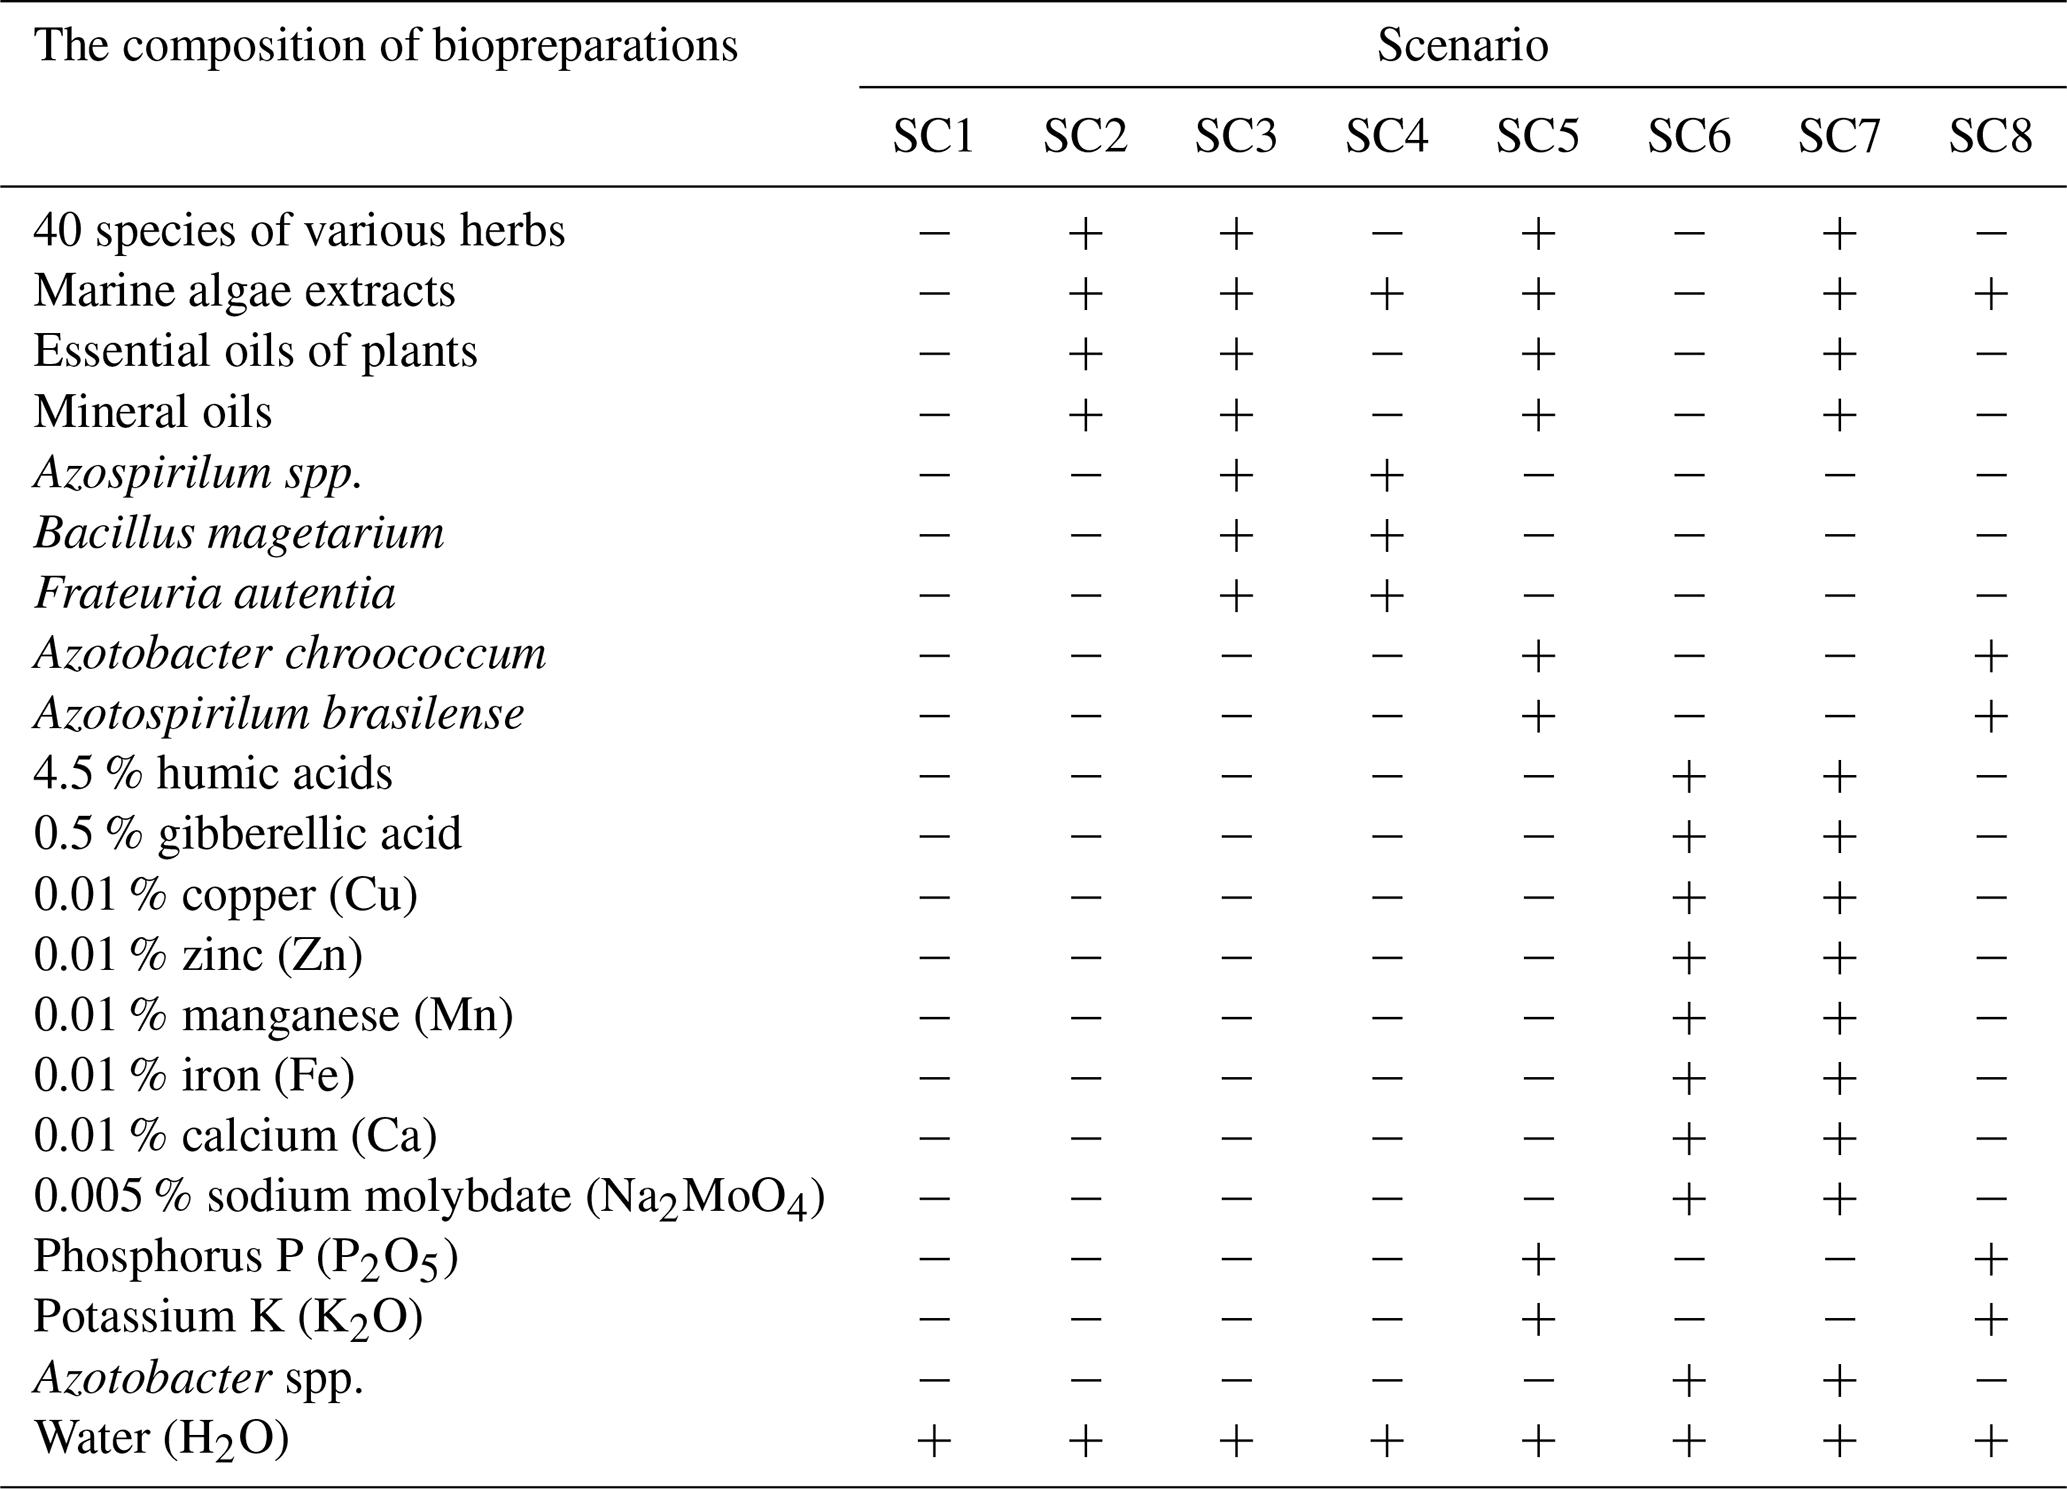
“+” – a compound is used; “−” – a compound is not used.
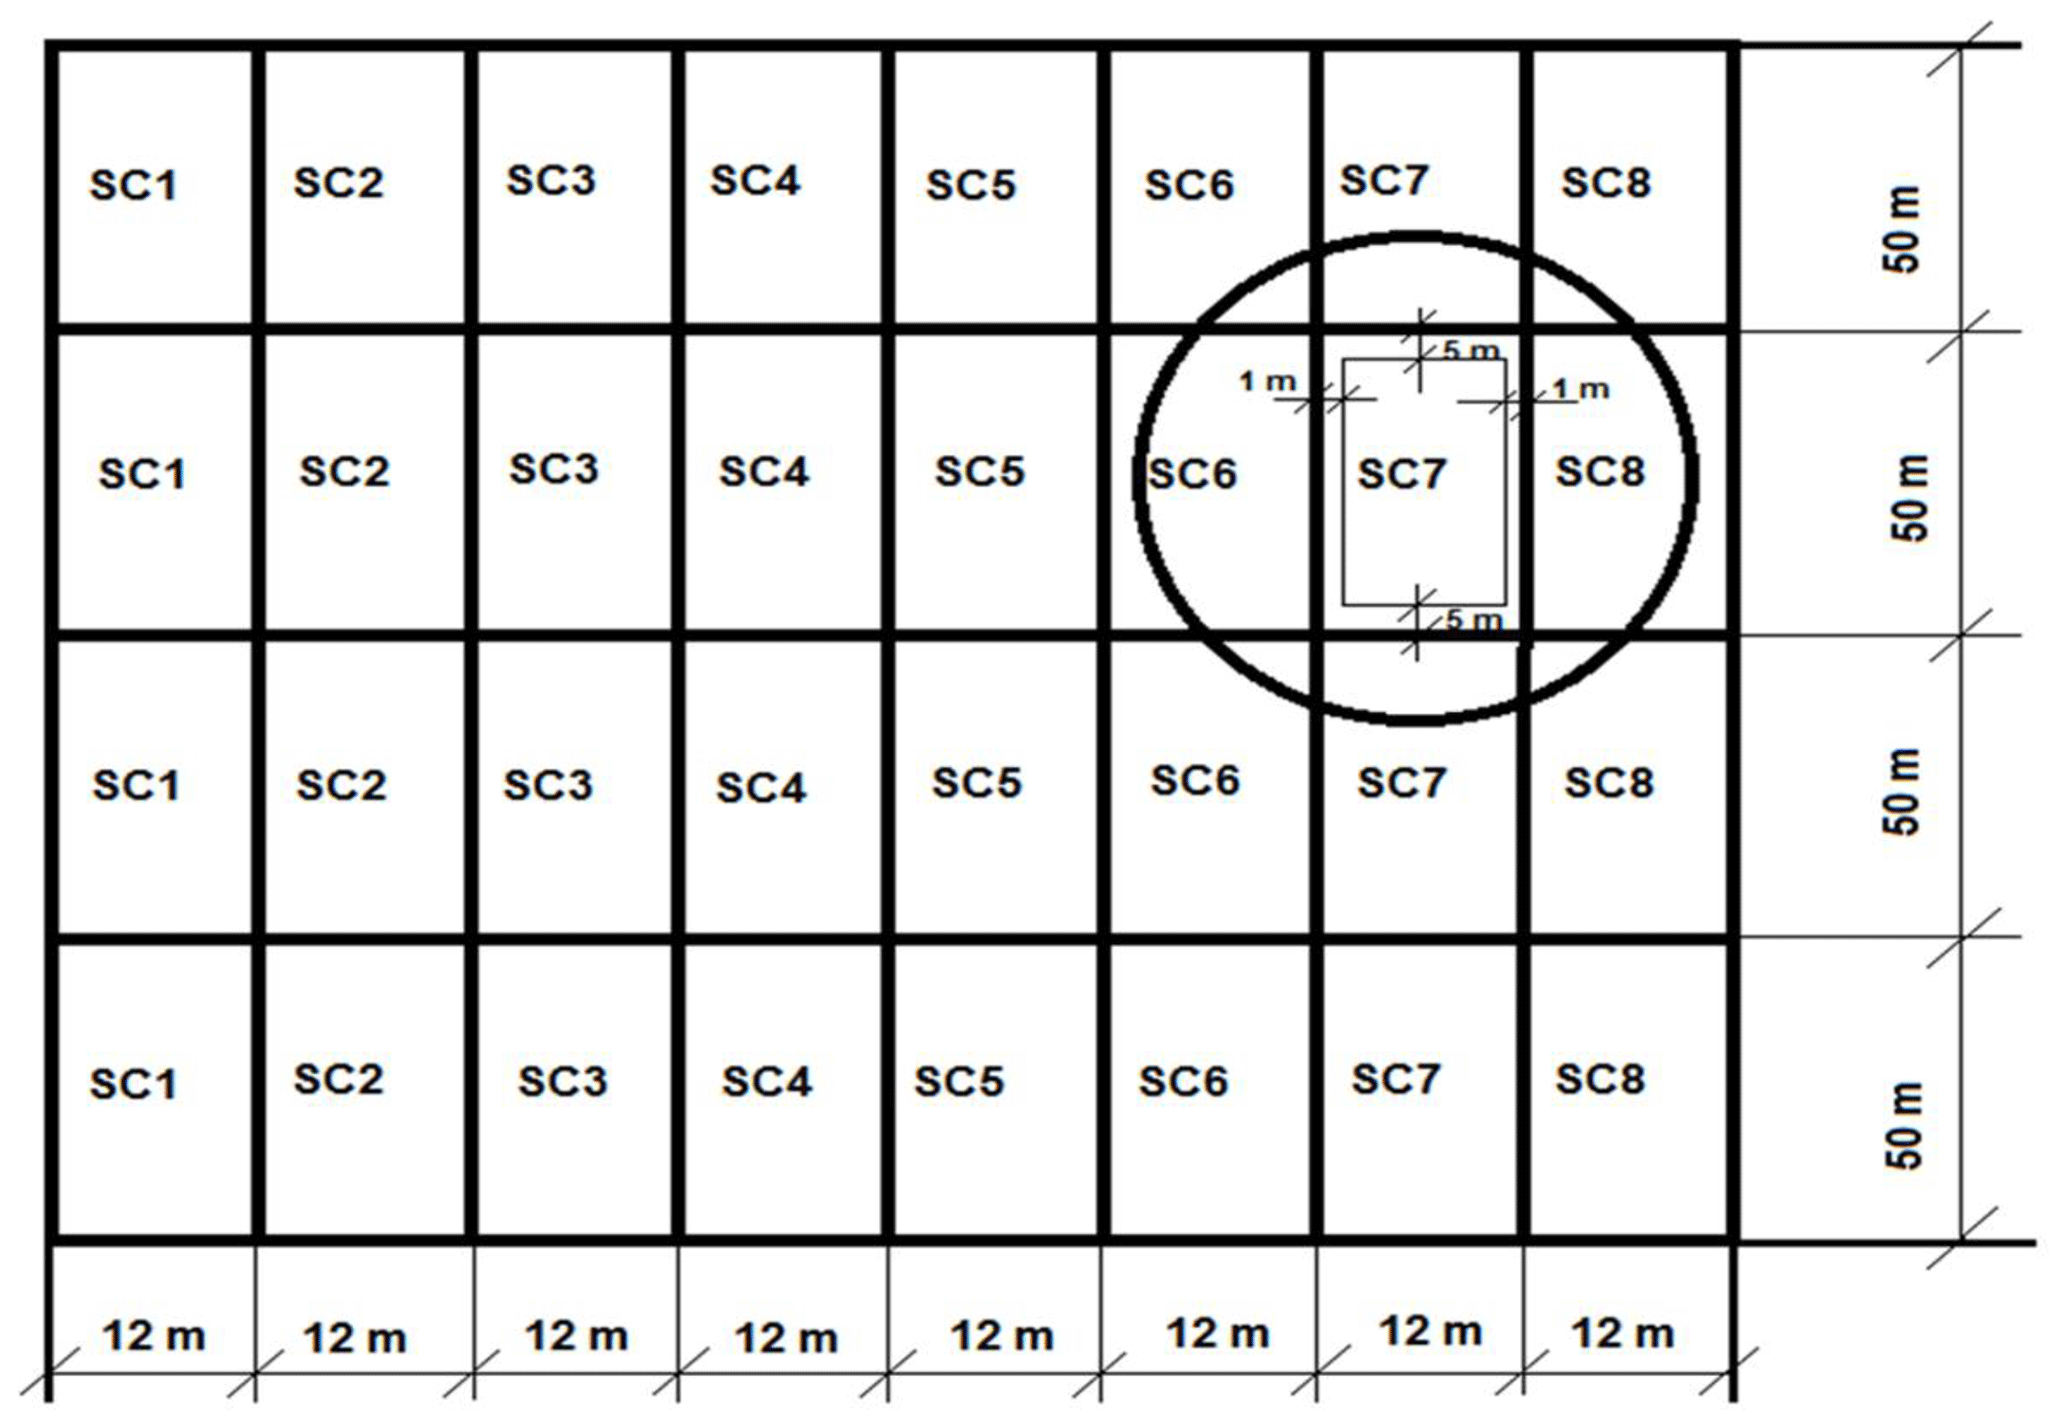
In the first year of the study, winter wheat (variety Ada) was grown; in the second year, winter wheat (Famulus) was grown; and in the third year, winter oilseed rape (Cult) was grown. Eight scenarios (SCs) were selected to determine the effect of biopreparations on soil properties and CO2 emissions from the soil, of which SC1 (scenario 1) was the control with no biopreparations used. In the other seven SCs, mixtures of biopreparations were used. The components of the biopreparations are given in Table 1. Mixtures of biopreparations were applied after the resumption of winter crops in the second half of April. The experimental plots were laid out in a linear pattern. The initial size of the plots was 600 m2, and the reference size was 400 m2 (Naujokienė et al., 2018). The layout of the experimental field scenarios is presented in Fig. 1.
2.2 Measurements of soil physical properties
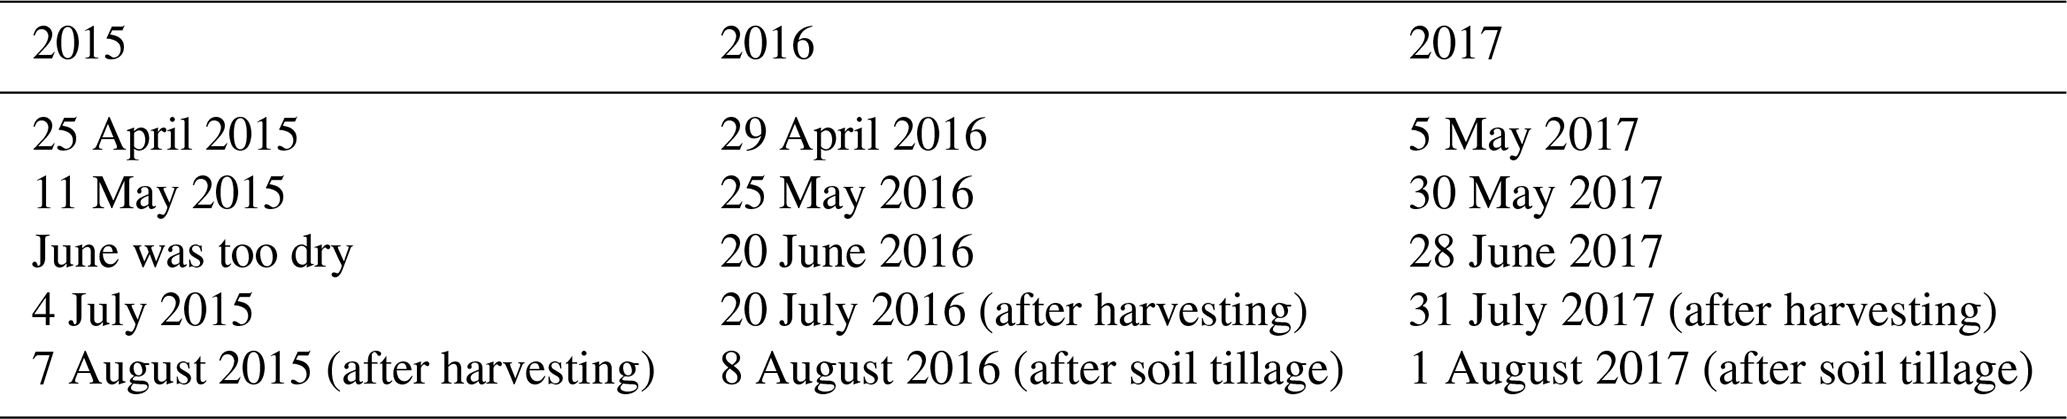
Soil properties were measured in April, May, June, July, and August over a 3-year period. A total of 14 tests were carried out (Table 2).
Soil porosity was sampled with a soil-sampling drill from a depth of 0–10 cm. For each scenario, five measurements were taken. Soil porosity was determined with a vacuum air pycnometer after drying the samples to an air-dry mass. The total porosity Pb was calculated according to the following formula (Maikštėniene et al., 2007):
where ρd refers to soil density (g cm−3), and refers to soil solid-phase density (g cm−3).
Aeration porosity Paer. was calculated according to the following formula (Maikštėniene et al., 2007):
where w refers to soil water content (%).
Soil density was determined by weighing and taking samples with a Nekrasov drill prior to calculation according to the formula (the mass-to-volume ratio):
where ϱ is the density of the soil (kg m−3), m is the soil mass (kg), and V is the soil volume (m3). The density of the solid phase was determined with a vacuum air pycnometer, after which the obtained results were inserted into the formulas presented in the article. Aeration porosity is a very important quantity for the soil as it determines the amount of air spaces in the soil, and air is needed for plant roots to grow and develop normally.
Soil temperature at a depth of 0–5 cm in all treatments was determined with a hand-held portable device, the HH2 Moisture Meter, to which a WET-2-type sensor was connected. The tests were carried out in five repetitions, and the depth of the temperature measurements is indicated as 0–5 cm as the rounding error is on the smaller side.
2.3 Measurement of CO2 emissions from soil
CO2 emissions from the soil were measured on the same dates as other physical soil properties. The measurements were carried out with the ADC Bioscientific LCpro+ System, a portable CO2 gas analyser consisting of a compact programming console, a soil respiration chamber, and a plastic ring to be inserted into the soil. Carbon dioxide emissions were measured five times in each scenario. CO2 gas emissions were measured in each repetition five times, the ring was placed in the soil at a depth of 20 mm, and all measurements were made in the first half of the day (from 10:00 to 14:00 Eastern European Time, EET; UTC+2). The soil temperature was measured in parallel with the measurement of CO2 gas emissions. The programming console was connected to the soil breathing chamber at the selected measurement location. A metal ring was inserted into the selected measurement site and the chamber attached to it. The ring was inserted perpendicular to the soil and left in place. The measurement site needed to be free of grass or other elements that could damage the sensors. The telescopic probe delivered CO2 from the atmosphere at a height of 3 m. This height was chosen to prevent the measurement from being influenced by the person taking the measurement. The measurement was carried out for 10 min, observing fluctuations in carbon dioxide. The data were automatically recorded on a memory stick.
2.4 Meteorological conditions
Meteorological data were received from the Kaunas Meteorological Station (KMS). The distance between the KMS and the area where the experiments were conducted is approximately 500 m. The weather station provides multi-year data averages, calculated from 1974 until 2017.
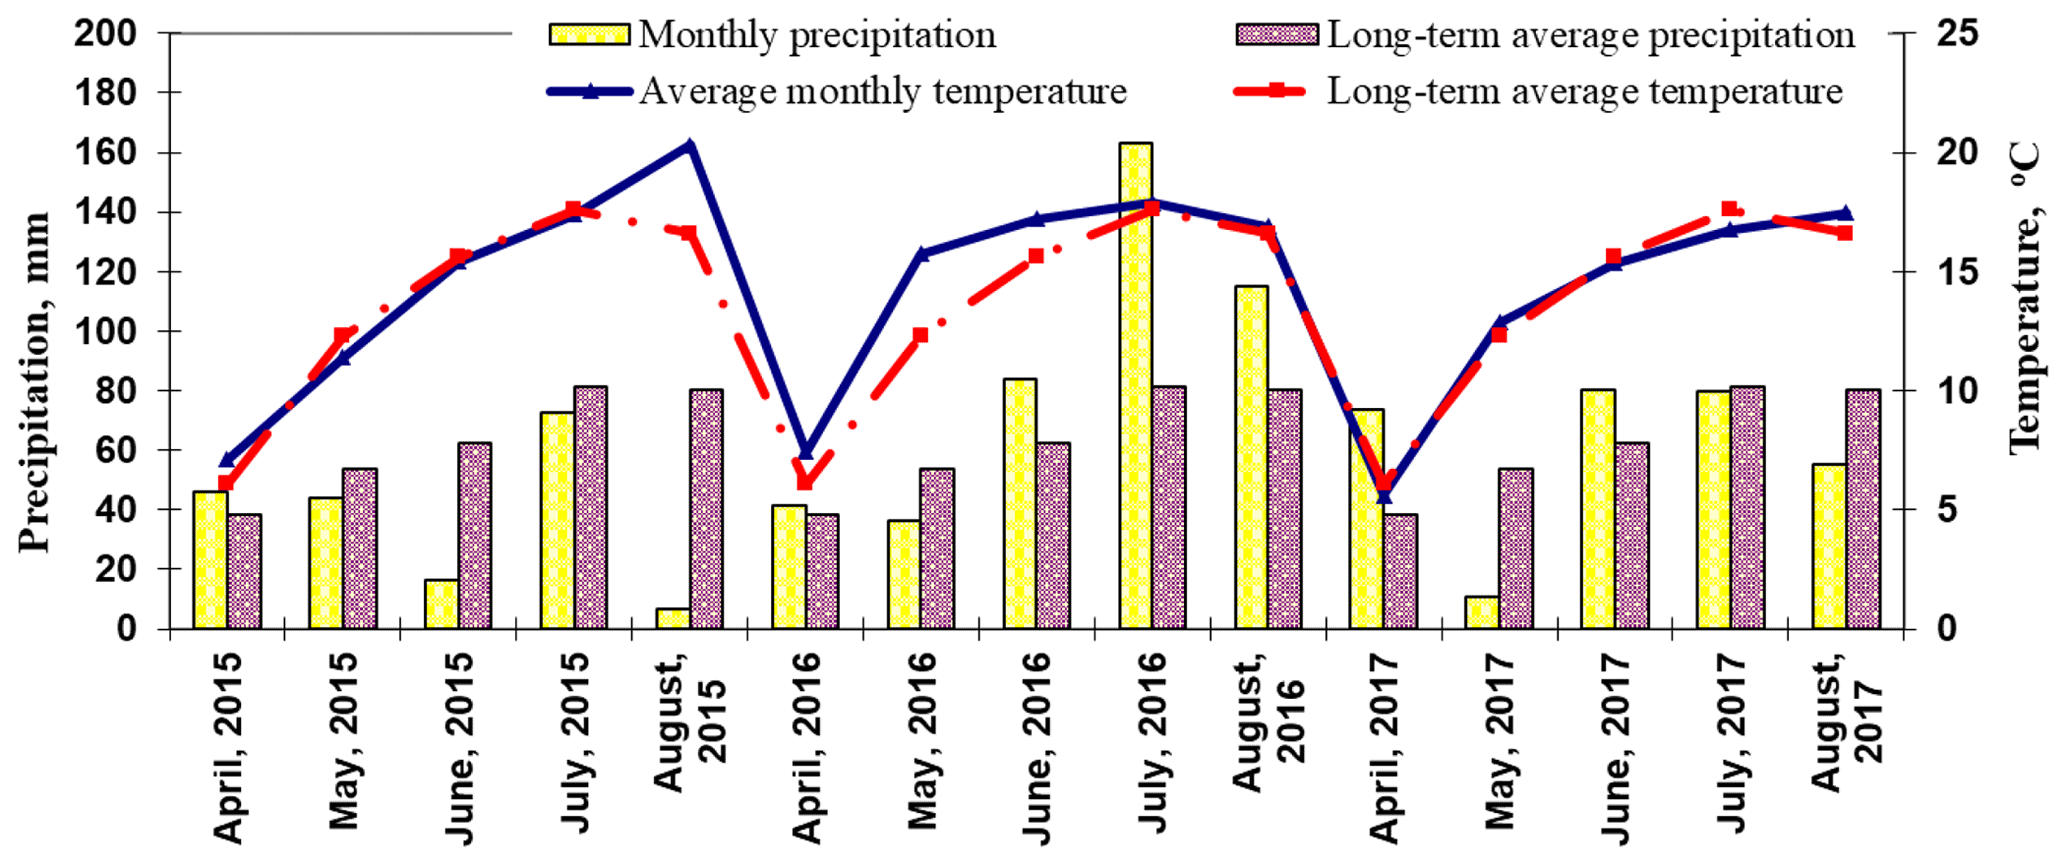
April 2015 was unusually warm. The average temperature for the month was 1 ∘C above the long-term average, and precipitation was 7.6 mm above the long-term average (Fig. 2). May and June 2015 were 0.9 and 0.2 ∘C colder than the long-term average, with 10 mm of precipitation in May and 46.2 mm less than the long-term average in June. July 2015 was close to the long-term average, with 8.8 mm less precipitation than the long-term average. August was hot and dry, with an average air temperature of 20.3 ∘C and only 6.9 mm of precipitation. These data show that the 2015 growing season was very dry and deficient in moisture.
In April 2016, the average air temperature was 1 ∘C above the long-term average, and in May, it was 3.43 ∘C above the long-term average. April received 41.2 mm of precipitation, while May was a low-precipitation month, with only 36.4 mm, 17.4 mm below the long-term average. Warm and humid weather prevailed in summer. June was particularly warm, with an average air temperature of 17.21 ∘C, 1.61 ∘C above the long-term average. July and August were about 0.3 ∘C warmer than the long-term average. Compared to the long-term average, precipitation was 21.1 mm higher in June, 81.7 mm higher in July, and 34.6 mm higher in August. The summer period of 2016 was humid.
Although the average temperature in April 2017 (5.61 ∘C) was close to the long-term average (6.1 ∘C), precipitation was 1.9 times higher than the long-term average. The weather in May was moderately warm and dry. The air temperature was 12.87 ∘C, 0.57 ∘C above the long-term average. Precipitation was very low at just 10.5 mm compared with the long-term average of 53.8 mm for May. The summer weather in Lithuania was humid and cool. The average temperature in June was no different from the long-term average, but precipitation was 1.28 times higher than the long-term average. Meteorological conditions in July were close to the long-term average, with an air temperature of 16.77 ∘C and 79.6 mm of precipitation. The weather warmed up to 17.47 ∘C in August, with a long-term average of 16.6 ∘C. Precipitation in August was 25.3 mm lower than the long-term average. Precipitation in the summer of 2017 was in line with the long-term average.
2.5 Statistical analysis
One-way analysis of variance (ANOVA) was used to assess the statistical significance of the results. Dispersion analysis was performed on the LSD (least significant difference) test for mathematical statistics (Raudonius, 2017; Olsson et al., 2007). We used the statistical software package SYSTAT, version 10. The probability level was indicated as follows: ∗ differences are significant at P ≤ 0.05 > 0.01; differences are significant at P ≤ 0.01 > 0.001.
Multivariate linear regression was applied to investigate the relationship of CO2 emission with soil aeration porosity (A. porosity), soil total porosity (T. porosity), and temperature. In this article, multiple linear regression was implemented using the backward elimination technique. With stepwise selection, the decision of whether to include or remove a variable from the model was based on Akaike's information criterion. The following tests are performed to check multivariate linear regression assumptions: normality, homoscedasticity, and multicollinearity. The assumption of homoscedasticity was tested using the Breusch–Pagan test, the assumption of normality was examined by using Shapiro–Wilk test, and the multicollinearity was analysed in the context of the variance inflation factor (VIF) assessment. Regression analysis was performed using R statistical software (v4.1.2).
3.1 Soil total porosity
In the first year of the study (2015), the total porosity ranged from 50.4 % to 55.4 % before the application of the biopreparations (Fig. 3a); 2 weeks after the spraying of the biopreparations (11 May 2015), the total porosity was measured, and it was found that all treatments showed a decrease in total porosity, ranging from 1.08 % to 7.82 %, except for treatments SC2 and SC8, which showed increases in total porosity of 8.4 % and 2.6 %, respectively. No studies were carried out in June due to drought. In July, total porosity varied from 47.5 % to 52.2 % for all treatments tested. Only one scenario, SC4, showed an increase in total porosity up to 3.9 % compared to the total porosity found in May. Significant differences were obtained in scenarios SC3, SC4, SC7, and SC8. In August, the range of treatments in total porosity was between 47.9 % and 51.7 %. Significant differences were obtained in scenarios SC5 and SC6.
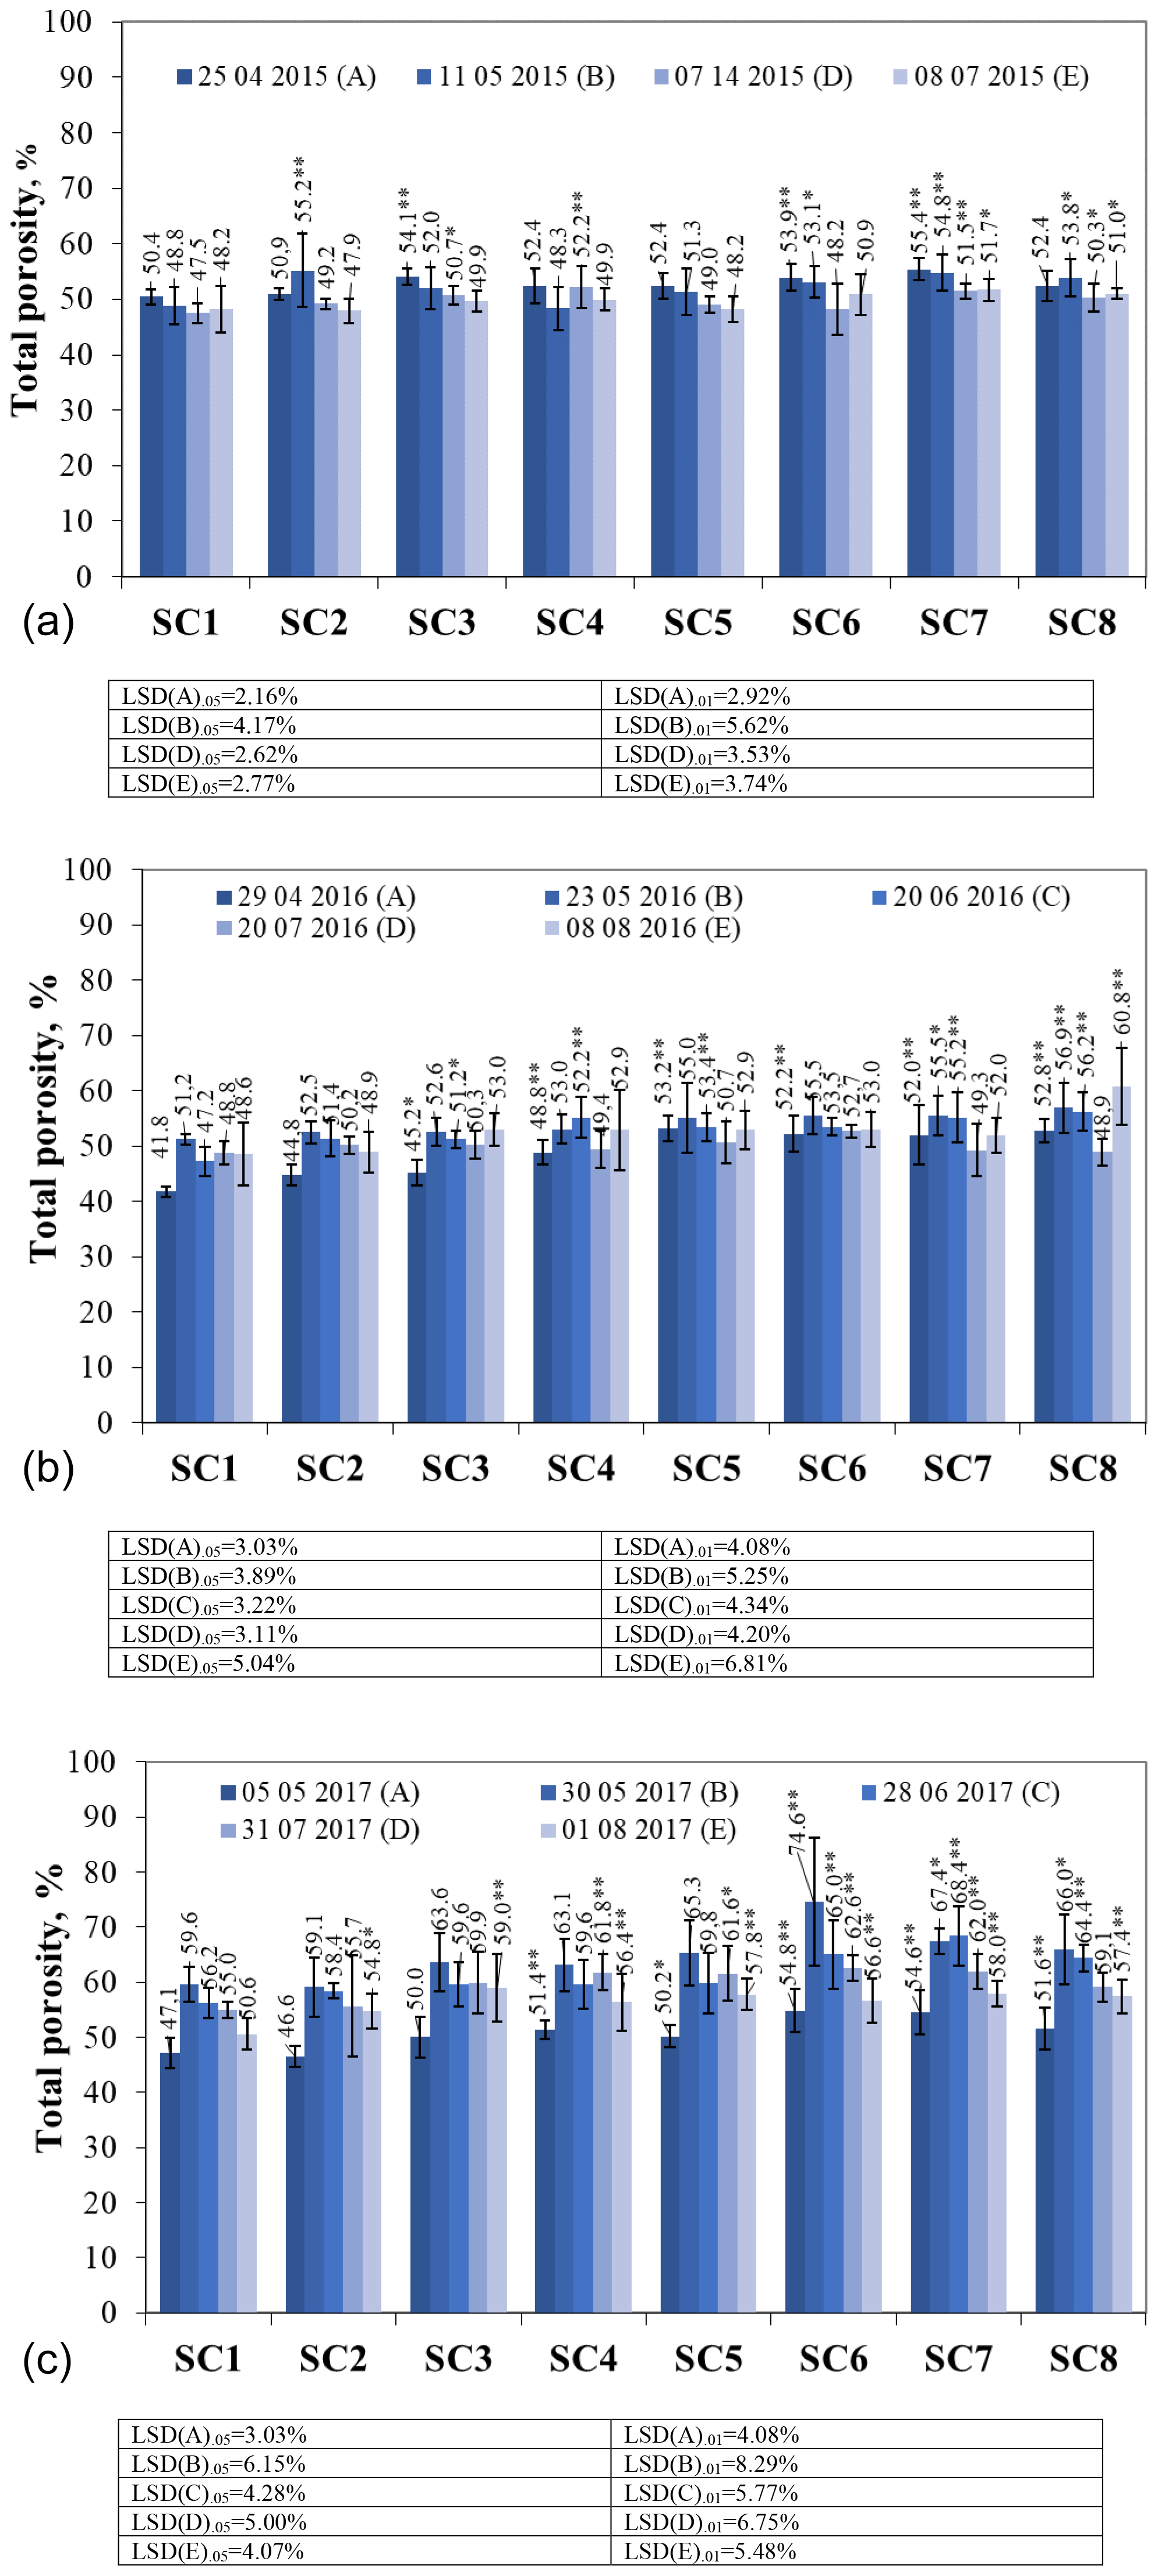
Figure 3The effect of biopreparations on the dynamics of soil total porosity in (a) 2015, (b) 2016, and (c) 2017. Notes: ∗ significant differences from control treatment (SC1) at P ≤ 0.05 > 0.01 and at P ≤ 0.01 > 0.001. Intervals mean standard deviation.
In 2016, the post-winter soil total porosity ranged from 41.8 % to 53.2 % (Fig. 3b). Total porosity was measured on 23 May 2016 after the application of the biopreparations and showed an increase in total porosity in all SCs. In the control treatment SC1, an increase in total porosity was also found due to the meteorological conditions as the warm and dry month of May prevailed. Carson et al. (2010) found that bacterial diversity increases with water potential ≤ 2.5 kPa in the sand and ≤ 4.0 kPa in silt–clay, which corresponds to a pore space filled with ≤ 56 % water. The higher precipitation in June resulted in soil compaction, which reduced the total porosity in all scenarios except for SC4 due to the presence of higher levels of microorganisms (Azospirillum sp., Frateuria aurentia, Bacillus megaterium) that prevented soil compaction. July was a high-precipitation month, which resulted in a decrease in total porosity of between 1.5 % and 13 % compared to June in all scenarios except SC1. In the control scenario, an increase of 3.4 % was observed in July due to the filling of soil pores with water, which slightly increased the total porosity. In August, all scenarios showed an increase in total porosity compared to July, with the exception of scenarios SC1 and SC2, which consisted of non-bacterial components. These scenarios showed a decrease but not a significant one. Comparing the results obtained in April (before the application of the biopreparations) and August, it was found that the application of the biopreparations which were dominated by microorganisms resulted in a more porous soil. The increase in total porosity ranged from 1.53 % to 17.26 % in most scenarios.
In 2017, total porosity at the beginning of May varied from 46.6 % to 54.8 % (Fig. 3c). Significant differences between the treatments compared to the control treatment were obtained in scenarios SC4, SC6, SC7, and SC8 at probability P ≤ 0.01 > 0.001 and in scenario SC5 at P ≤ 0.05 > 0.01. Biopreparations with higher bacterial content have a long-lasting effect, which is felt after overwintering with a higher total porosity index. The measurement of total porosity after spraying the biopreparations showed that, in all SCs, the total porosity increased from 18.54 % to 26.54 % because of the biopreparations and the environmental conditions. Scientists have found that biotreatments alter soil physicochemical properties (Banerjee, 2011; Cittenden and Goede, 2016). In June, when compared to the control, significant differences were obtained in scenarios SC6, SC7, and SC8 at P ≤ 0.01 > 0.001, although almost all SCs showed a decrease in total porosity, except for scenario SC7, which used Azotobacter spp. bacteria in combination with mineral oils, seaweed, and various grass extracts, which affected total porosity.
3.2 Soil aeration porosity
In the first year of the study, the aeration porosity before the application of the biopreparations ranged from 25.8 % to 33.7 % (Fig. 4a); 2 weeks after the application of the biopreparations, the aeration porosity was measured as well. It was found that aeration porosity increased in all treatments, except for SC4, which showed a decrease of 10.13 %. Scientists suggest that the application of biopreparations increases the organic carbon content of the soil and therefore decreases soil density and increases porosity (Montemurro et al., 2010; Peltre et al., 2015; Juknevičius et al., 2020). In July, aeration porosity varied from 23.8 % in SC1 to 30.0 % in SC7 for the treatments studied. In August, the variation in aeration porosity ranged from 26.9 % in SC2 to 32.4 % in SC7 and SC8. After re-vegetation of plants, the SC1 option had the lowest aeration porosity, and after a month, it increased 2.6 times, but in other options, where biological agents were used, the soil aeration porosity was found to be higher. This is due to meteorological conditions (soil moisture) and the plant root system.
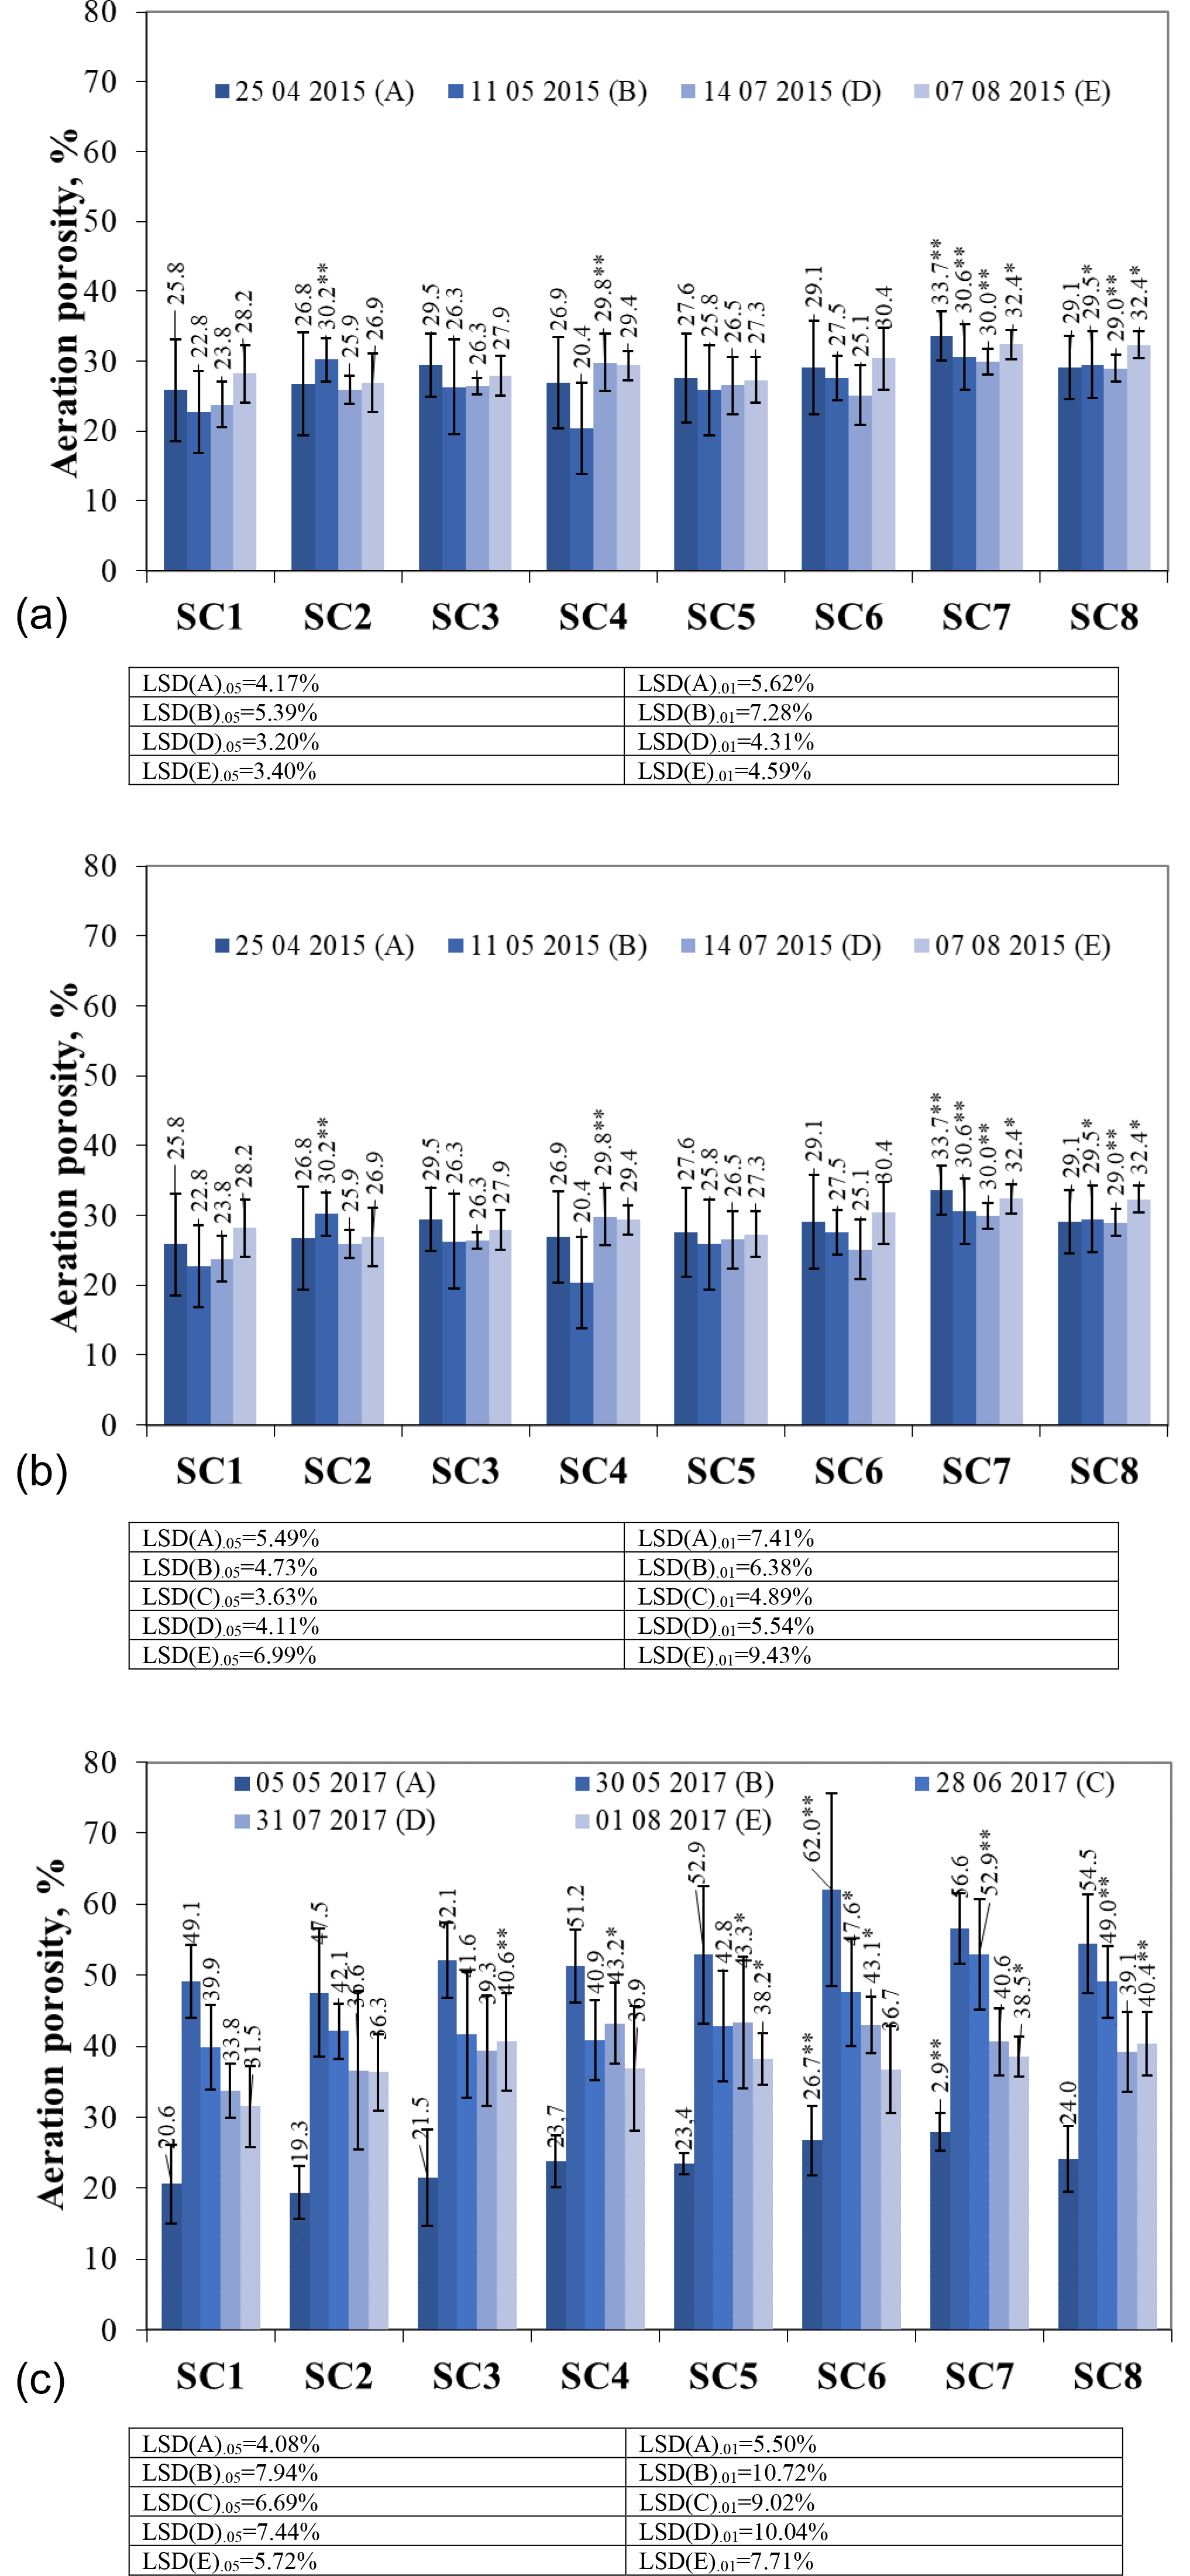
Figure 4The effect of biopreparations on the dynamics of soil aeration porosity in (a) 2015, (b) 2016, and (c) 2017. Notes: ∗ significant differences from control treatment (SC1) at P ≤ 0.05 > 0.01 and at P ≤ 0.01 > 0.001. Intervals mean standard deviation.
In 2016, in the spring, at the resumption of vegetation, aeration porosity ranged from 12.1 % in SC1 to 23.7 % in SC5 (Fig. 4b). In our case, SC1 had the lowest aeration porosity of 12.08 %, while in other SCs, it was around 20 %. Aeration porosity measurements taken 2 weeks after the application of the biopreparations showed an increase in aeration porosity in all the SCs compared to the April tests. The highest increase of 2.6 times in aeration porosity was found in the control scenario SC1. The increase in aeration porosity was influenced not only by the sprayed biopreparations but also by favourable meteorological conditions. Many researchers suggest that porosity is particularly sensitive to environmental conditions (Cassaro et al., 2011; Lipiec et al., 2012; da Costa et al., 2014). The month of June was particularly warm, with an average air temperature of 17.21 ∘C. The highest aeration porosity in June was found in SC4, SC7, and SC8. The lowest aeration porosity of 23.7 % was found in the control treatment. In July, the aeration porosity was similar to that in June. In August, all scenarios showed an increase in total porosity compared to July, except for scenarios SC1, SC2, and SC3.
In 2017, the aeration porosity at the beginning of May varied from 19.3 % to 27.9 % (Fig. 4c). Aeration porosity measurements after spraying biopreparations showed that in all scenarios except SC2, aeration porosity increased compared to the measurements taken in May because of biopreparations and environmental conditions. The measurements carried out in the June months of the third decade showed a decrease in aeration porosity in all the treatments compared to the measurements carried out in May. Researchers investigating effective microorganisms found no significant effect on porosity (Pranagal et al., 2020). At the end of July, aeration porosity ranged from 33.8 % to 43.3 %. After harvest, aeration porosity decreased in almost all scenarios except SC3 and SC8.
3.3 Soil temperature
Soil temperatures in April 2015 ranged from 10.5 to 11.8 ∘C (Fig. 5a). In April, compared to the control, soil temperature increased significantly in the SC3, SC5, and SC7 scenarios (P ≤ 0.05 > 0.01). Soil temperature is one of the most important variables influencing soil respiration and depends on environmental conditions (Moyano et al., 2013; Sierra et al., 2015). Our studies have also shown that environmental conditions have an effect on temperature changes; i.e. the use of a biopreparation influences the increase in temperature. As the soil gradually warmed in May, soil temperatures were found to be about 2–5 ∘C higher than in May. Compared to the control scenario SC1, significantly lower soil temperatures were observed in SC7 and SC8 at P ≤ 0.01 > 0.001 and at P ≤ 0.05 > 0.01 in SC6. In July, the soil temperature ranged from 19.08 ∘C (SC7) to 22.04 ∘C (SC2). In July, a significant decrease in soil temperature was found between control SC1 and SC6 (P ≤ 0.05 > 0.01) and between SC1 and SC7 (P ≤ 0.01 > 0.001), indicating that there was a denser crop. In August, the soil temperature was the highest recorded. Significant increases were found between scenarios SC1 and SC6 and SC1 and SC7 at the 95 % probability level and between SC1 and SC2 and SC1 and SC8 at the 99 % probability level.
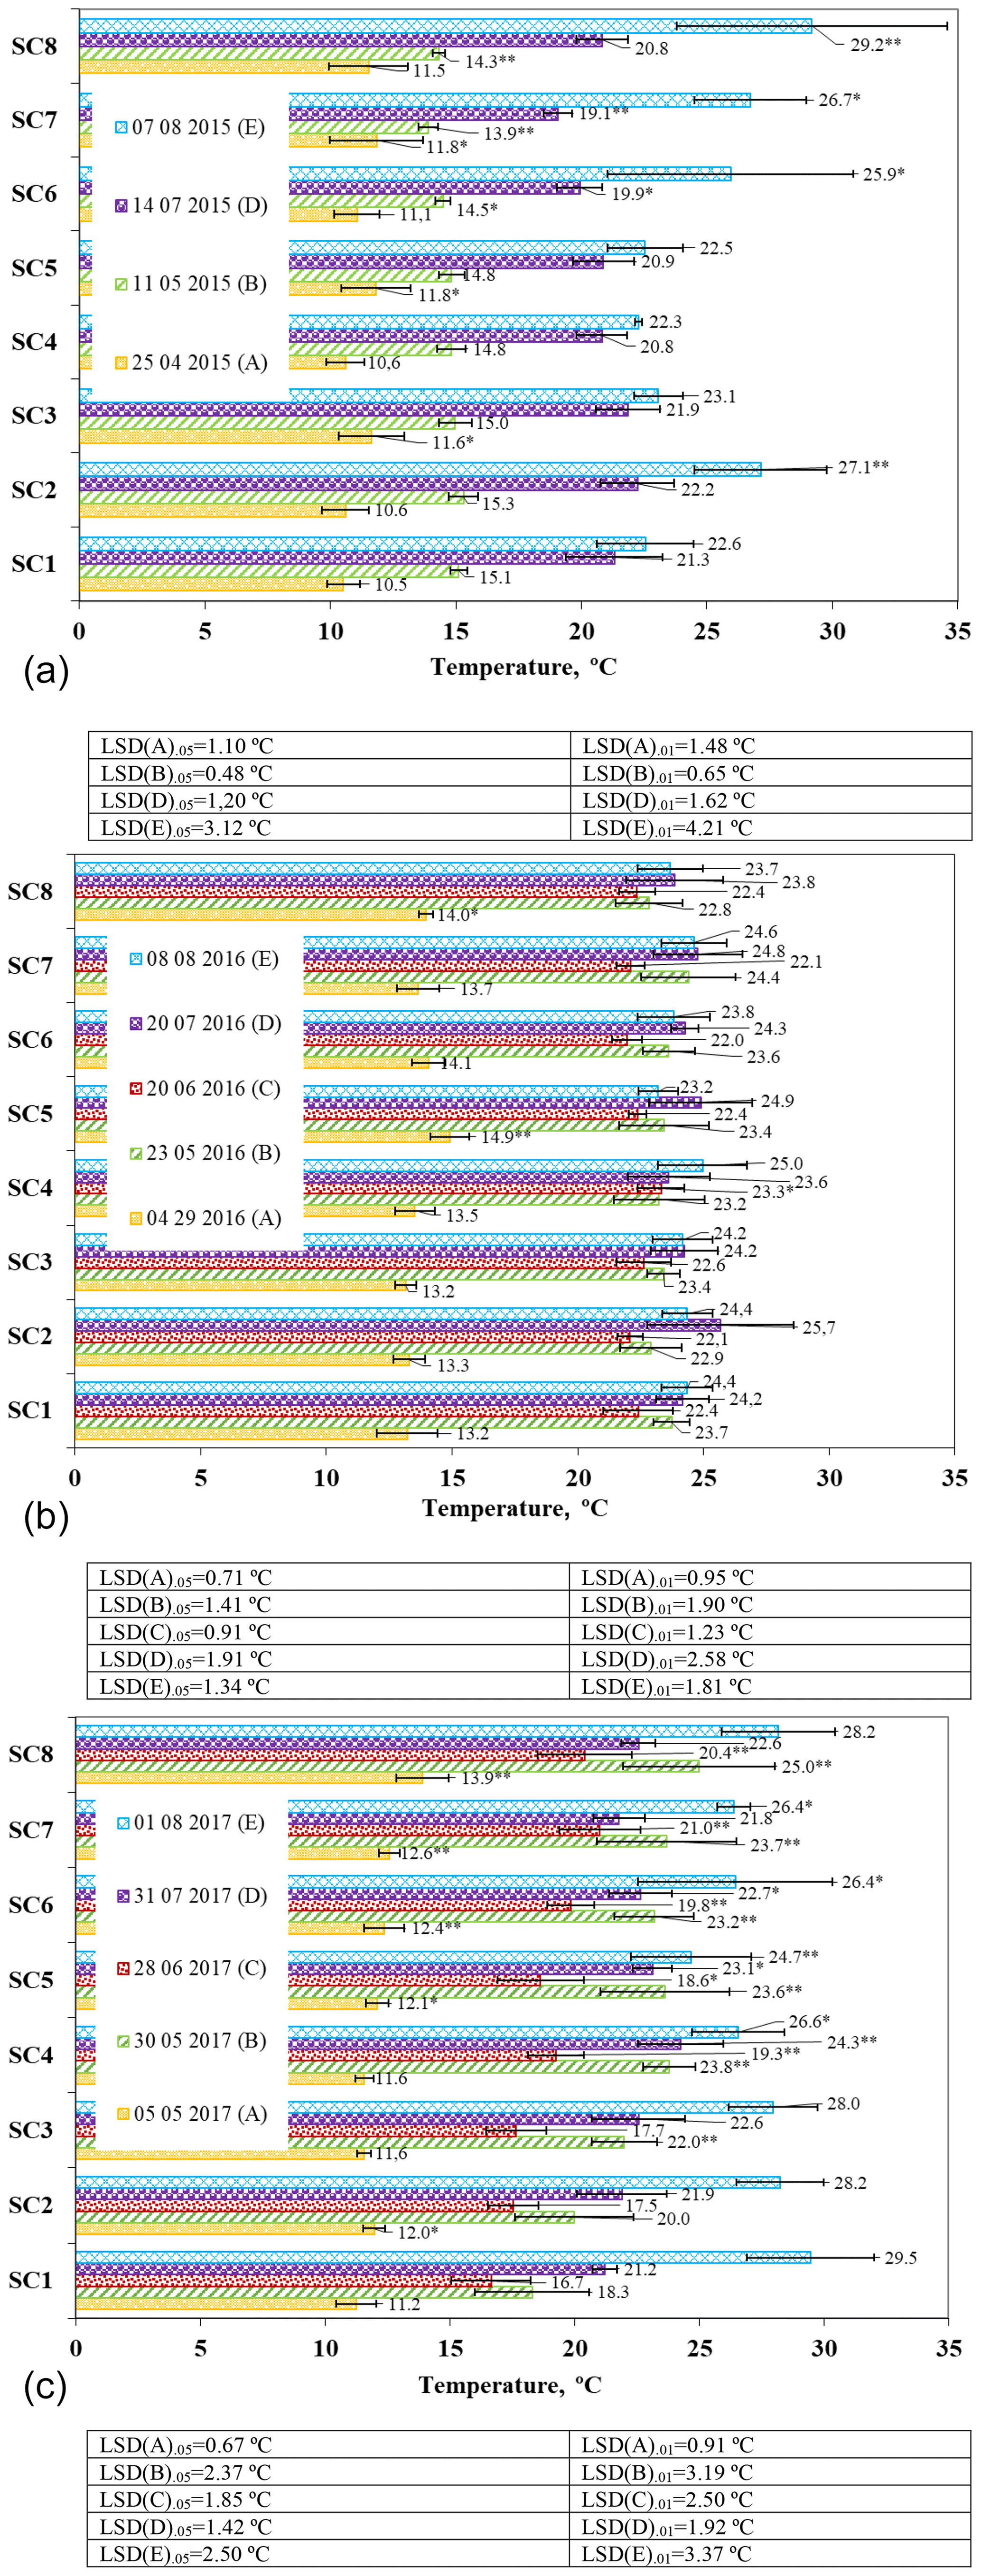
Figure 5The effect of biopreparations on the dynamics of soil temperature in (a) 2015, (b) 2016, and (c) 2017. Notes: ∗ significant differences from control treatment (SC1) at P ≤ 0.05 > 0.01 and at P ≤ 0.01 > 0.001. Intervals mean standard deviation.
In 2016, soil temperatures varied from 13.2 to 14.1 ∘C after the resumption of plant growth (Fig. 5b). A significant increase was found between scenarios SC1 and SC5 (P ≤ 0.01 > 0.001) and between SC1 and SC8 (P ≤ 0.05 > 0.01). At the end of May, soil temperature increased, on average, by about 10 ∘C. In June, soil temperature ranged from 22 ∘C (SC6) to 23.3 ∘C (SC4). In the SC4 scenario, soil temperature was significantly higher than the control (P ≤ 0.05 > 0.01). In July and August, soil temperatures were found to be similar due to the settled weather, and no significant differences were found between the scenarios and the control.
On 5 May 2017, the highest soil temperature was found in SC8, and the lowest was found in the control scenario (Fig. 5c). Soil temperatures were significantly higher in scenarios SC2 and SC5 (P ≤ 0.05 > 0.01) and in scenarios SC6, SC7, and SC8 (P ≤ 0.01 > 0.001) compared to the control scenario. Soil warming at the end of May resulted in a significant increase in soil temperature in all scenarios except SC2 at the 99 % probability level. In SC8, a substantial increase was found at the 95 % probability level compared to the control SC1. In June, the lowest soil temperature of 16.66 ∘C was found in SC1, and the highest soil temperature of 21 ∘C was found in SC7. Significantly higher soil temperatures compared to the control were found in scenarios SC4, SC6, SC7, and SC8 at the 99 % probability level. An increase in soil thermal conductivity increases temperature, whereas an increase in soil heat capacity reduces temperature (Obia et al., 2020). At the end of July, soil temperatures ranged from 21.8 to 24.3 ∘C. A significant increase was found between the control and SC4 (P ≤ 0.01 > 0.001) and between the control and SC5 and SC6 scenarios (P ≤ 0.05 > 0.01). On 1 August, soil temperature increased in most of the scenarios studied compared to soil temperature at the end of July. However, a significant decrease in soil temperature (P ≤ 0.01 > 0.001) was obtained in scenario SC5 after the harvest compared to the control, and at the 95 % probability level, soil temperature was significantly lower in the control scenario than in SC4, SC6, and SC7. In all scenarios, the higher soil surface temperatures were due to tillage, which allowed warm air to enter the soil. The data of other authors do not confirm these findings because all the research studies of ours and of other authors were in other spheres of soil composition and climate; thus, this was added as additional information as it was obtained in other countries, but perfectly parallel studies were not found – only similar ones were – due to the soil and the diversity of the area.
3.4 CO2 emissions from soil
In April 2015, the highest CO2 emissions were observed in scenario SC7 with 2.29 µmol m−2 s−1 (Fig. 6a), and the lowest were observed in SC2 with 0.73 µmol m−2 s−1. Soil moisture, temperature, and biopreparation composition were the main influences on soil respiration. Research groups suggest that soil moisture influences CO2 emissions, with continuous moisture conditions increasing the bacterial content of the soil, resulting in higher CO2 emissions from the soil compared to re-irrigation (Jiao et al., 2023; Gultekin et al., 2023; Barnard et al., 2015). Canarini et al. (2017) found that, in soils with more than 2 % organic carbon, CO2 emissions increase after drought in contrast to soils with low carbon content. In our case, substantial increases between the control SC1 and SC5 scenarios were found at the 95 % probability level and between SC1 and SC7 at the 99 % probability level. In May, soil respiration increased or remained the same compared to April. A substantial increase was found between the control and scenarios SC4, SC5, SC6, SC7, and SC8 at the 99 % probability level. It is likely that the bacteria present in the bioassay (Azospirillum sp., Frateuria aurentia, Bacillus megaterium, Azotobacter chroococum, Azospirillum brasilense, and Azobacter vinelandii) contributed to the substantial increases. Scientists suggest that soil microorganisms can increase CO2 release (Klenz, 2015) under certain environmental conditions. According to the results of the May study, soil temperature had a significant influence on CO2 emissions, although, in the following months of July and August, CO2 emissions increased due to higher ambient temperatures in all scenarios. A group of researchers (Tooth et al., 2018) investigated that soil emissions may be higher during the growing season. In August, the highest CO2 emissions were found in SC3 at 4.26 µmol m−2 s−1, and the lowest were found in SC2 at 2.15 µmol m−2 s−1. Significant increases between the control and SC8 were found at the 95 % probability level and between the control and SC4 at the 99 % probability level.
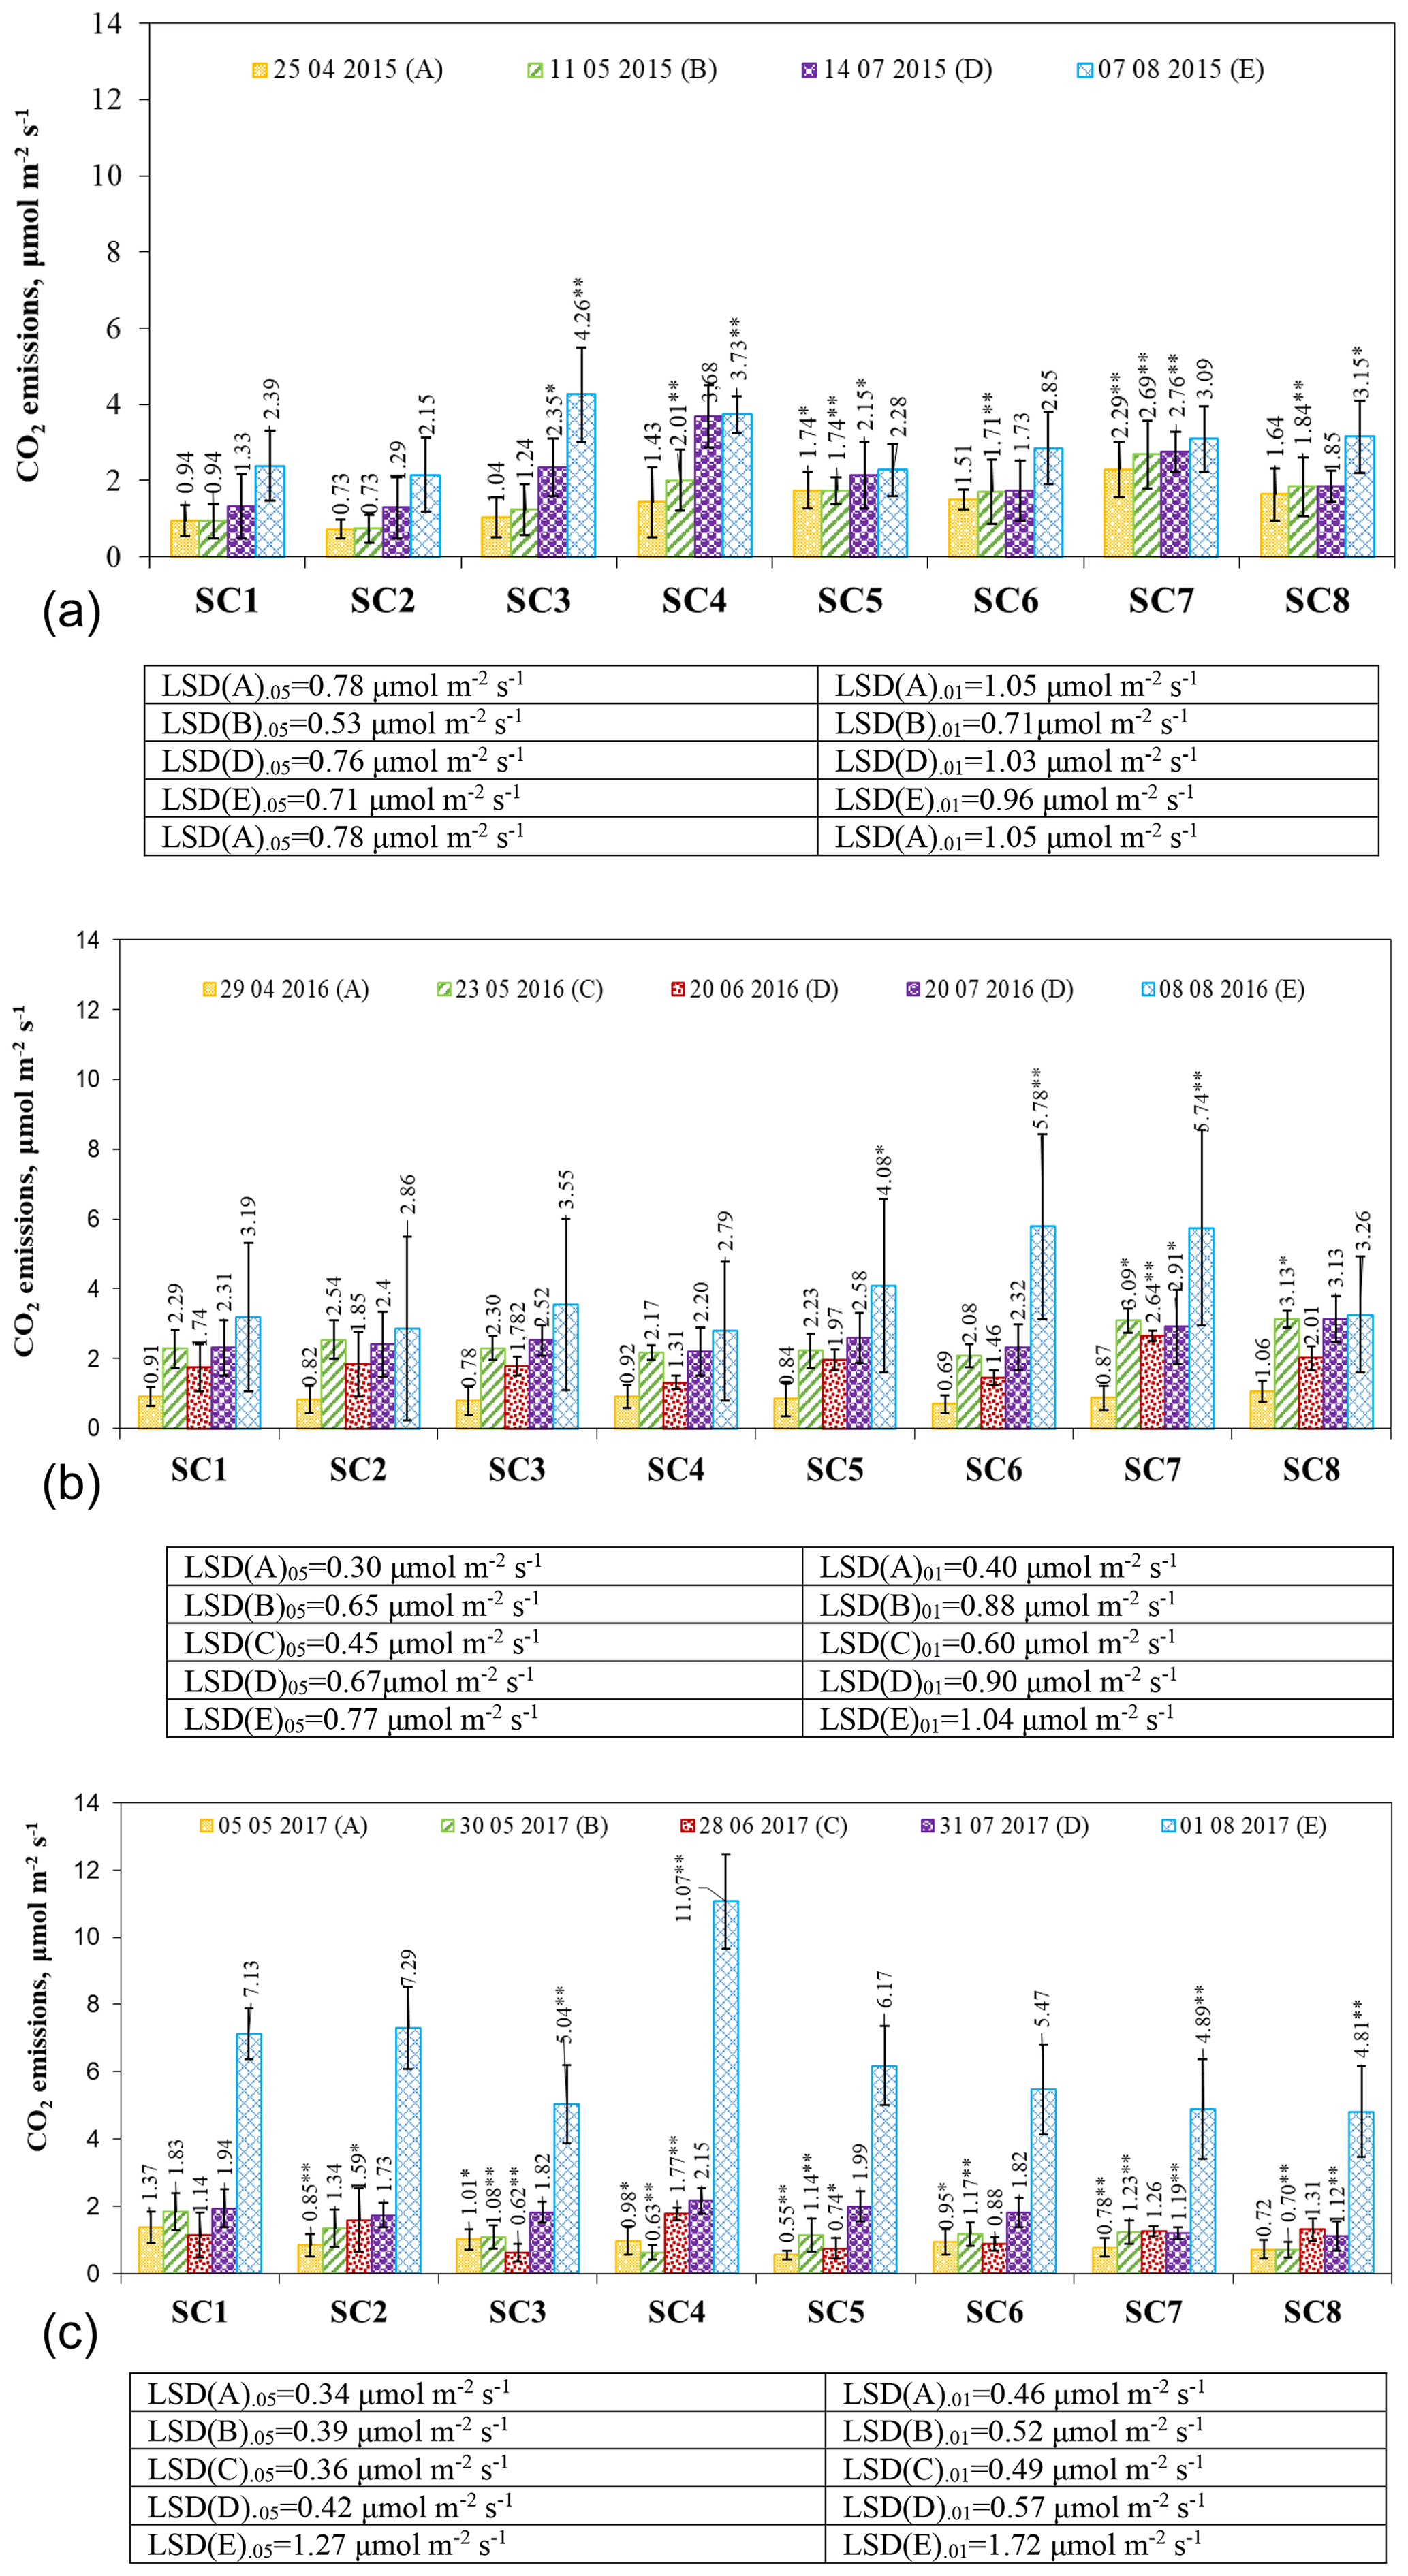
Figure 6The effect of biopreparations on the dynamics of CO2 emissions from soil in (a) 2015, (b) 2016, and (c) 2017. Notes: ∗ significant differences from control treatment (SC1) at P ≤ 0.05 > 0.01 and at P ≤ 0.01 > 0.001. Intervals mean standard deviation.
In 2016, CO2 emissions from the resumption of vegetation ranged from 0.69 to 1.06 µmol m−2 s−1 (Fig. 6b). Other researchers (Forte et al., 2017) who studied conventional tillage reported that this leads to higher CO2 emissions due to higher decomposition rates of soil organic matter and higher temperature fluctuations. At the end of May, soil respiration was more intense in all scenarios, and a substantial increase compared to the control was found in SC7 and SC8 at P ≤ 0.05 > 0.01. In June, with a decrease in air temperature of 1–2 ∘C, CO2 release slowed down and varied between 1.31 and 2.64 µmol m−2 s−1. A significant increase at P ≤ 0.01 > 0.001 was found in SC7 compared to SC1. In July, CO2 emissions increased, but at the 95 % confidence level, a significant increase was found in SC7 compared to SC1. Soil respiration increased further after harvest in August, ranging from 2.79 to 5.78 µmol m−2 s−1. CO2 emissions increased significantly compared to the control in SC6 and SC7 at the 99 % probability level and in SC5 at the 95 % probability level.
At the beginning of May 2017, CO2 emissions were in the range of 0.55–1.37 µmol m−2 s−1 (Fig. 6c). In the SC1 scenario, soil respiration was found to peak at 1.37 µmol m−2 s−1. At the end of May, all scenarios had higher CO2 emissions due to ambient conditions and were significantly different from the control, with all SCs at the 99 % probability level except SC2. Many field experiments have shown that CO2 is significantly and positively correlated with soil organic carbon (Liu et al., 2014) and soil temperature (Cartwright and Hui, 2015), but in our case, it is the opposite. In June, CO2 emissions increased significantly in SC1 compared to SC2 (P ≤ 0.05 > 0.01) and compared to the SC4 scenario (P ≤ 0.01 > 0.001). Significant reductions were obtained in scenarios SC5 (P ≤ 0.05 > 0.01) and SC3 (P ≤ 0.01 > 0.001). The settled temperature in July, which was close to the long-term average (around 10 ∘C), resulted in more intense soil respiration in all scenarios except SC7 and SC8. A significant decrease (P ≤ 0.01 > 0.001) was found between the control SC1 and SC7 and SC8 scenarios, which could be influenced by the different compositions of the biopreparations. Drulis et al. (2022) state that bioproducts are substances that can improve crop productivity and quality, increase nutrient availability in the soil, improve plant nutrient use efficiency, and promote organic matter decomposition and humification in the soil. In all scenarios, CO2 emissions increased by a factor of 3 to 5 in the range of 4.89–11.07 µmol m−2 s−1 after the harvest and tillage in August. These changes are due to the fact that the study was carried out immediately after tillage. The process of tillage greatly intensifies CO2 emissions to the environment (Buragienė et., 2015). However, the differences between the scenarios were influenced by the different compositions of the biopreparations. Emissions were significantly higher only in scenario SC4 compared to the control (P ≤ 0.01 > 0.001) and significantly lower in scenarios SC3, SC7, and SC8 compared to the control (P ≤ 0.01 > 0.001).
3.5 Multiple-regression model
A multiple-regression model including the dependent variable of soil CO2 emissions and the independent variables of soil temperature, aeration porosity (A. porosity), and total porosity (T. porosity) showed that A. porosity and T. porosity were statistically unreliable, and multicollinearity (VIF > 9) was found. Therefore, a stepwise model selection was performed to select a model that included two independent variables, temperature and A. porosity (R2 = 0.39, AIC = 378). Unfortunately, the model analysis showed that the assumptions of normality and homoscedasticity of the residual errors are violated in this case. Given that the dependent variable CO2 does not have a normal distribution (W = 0.78, p = 1.165 × 10⁻¹¹), the dependent variable was log-transformed, and another model was composed:
In this model, both independent variables are statistically significant (p < 0.001), with a coefficient of determination R2 = 0.51 and an Akaike information criterion AIC = 135. Residual error diagnostic plots show that the assumptions of normality (W = 0.98, p = 0.073), and homoscedasticity (BP = 2.303, p = 0.3162) of the residual errors are satisfied. It can be concluded that CO2 emissions from the soil decrease with increasing aeration porosity and that CO2 emissions increase with increasing soil temperature. Since the variable CO2 was logarithmic, we calculate the exponents of the coefficients as follows:
Calculating the exponents of the coefficients, it was found that a 1 unit increase in soil aeration porosity decreases CO2 emissions from the soil (0.019 %), while a 1 unit increase in soil temperature increases CO2 emissions (0.098 %).
Considering the standardized coefficients of the multiple-regression model (beta_A. porosity = 0.29, beta_temperature = 0.78), it can be assumed that CO2 variation is more influenced by soil temperature than by soil aeration porosity.
-
Due to the interaction between the long-term use of biopreparations and meteorological conditions, a fixed increase in the total porosity of the soil till was found at 74 %.
-
It was established that, due to half of the biopreparation usage, the soil temperature significantly increased.
-
The cumulative effect of biopreparation application on CO2 emissions from soil was most pronounced in the third year.
-
Studies confirmed that biopreparation components – namely marine algae extracts and bacteria – can significantly reduce the CO2 emission intensity from the soil after tillage.
-
Evaluating the effectiveness of biopreparations for soil porosity, temperature, and CO2 emissions from the soil, it can be stated that the best effect was achieved when the compounds were made up of 40 species of various herbs, marine algae extracts, essential oils of plants, mineral oils, 4.5 % humic acids, 0.5 % gibberellic acid, 0.01 % copper, 0.01 % zinc, 0.01 % manganese, 0.01 % iron, 0.01 % calcium, 0.005 % sodium molybdate, Azotobacter spp. mixed with water, marine algae extracts, Azotobacter chroococcum, Azotospirilum brasilense, phosphorus, potassium, and water.
-
The multiple-regression model showed that, as soil aeration porosity increases, CO2 emissions from the soil decrease, while CO2 emissions increase as soil temperature increases. It was established that soil temperature has a greater influence on the variation of CO2 emissions than soil aeration porosity.
Future research on the use of bacteria-based and environmentally friendly bioproducts should focus on increasing CO2 storage in soil, simplifying agricultural operations, reducing inputs, and increasing the efficiency of crop production.
All the data of the research results are presented in the article: there are no additional databases.
Conceptualization: SB, EŠ, AA, KR, KL, DR, VN; data curation: KL, DR, VN; formal analysis: SB, EŠ, AA, KR; investigation: SB, EŠ, AA, KR; methodology: KL, DR, VN, EŠ; project administration: EŠ, VN; resources: EŠ; software: DR; supervision: VN, EŠ; validation: VN, EŠ; visualization: SB, KR; writing – original draft preparation: SB, KL, VN; writing – review and editing: VN, KL.
The contact author has declared that none of the authors has any competing interests.
Publisher’s note: Copernicus Publications remains neutral with regard to jurisdictional claims made in the text, published maps, institutional affiliations, or any other geographical representation in this paper. While Copernicus Publications makes every effort to include appropriate place names, the final responsibility lies with the authors.
This paper was edited by Carolina Boix-Fayos and reviewed by one anonymous referee.
Bais, H. P., Weir, T. L., Perry, L. G., Gilroy, S., and Vivanco, J. M.: The role of root exudates in rhizosphere interactions with plants and other organisms, Annu. Rev. Plant Biol., 57, 233–266, https://doi.org/10.1146/annurev.arplant.57.032905.105159, 2006.
Banerjee, D.: Endophytic Fungal Diversity in Tropical and Subtropical Plants, Res. J. Microbiol., 6, 54–62, https://doi.org/10.3923/jm.2011.54.62, 2011.
Barnard, R. L., Osborne, C. A., and Firestone, M. K.: Changing precipitation pattern alters soil microbial community response to wet-up under a Mediterranean-type climate, ISME J., 9, 946–957, https://doi.org/10.1038/ismej.2014.192, 2015.
Błaszczyk, L., Siwulski, M., Sobieralski, K., Lisiecka, J., and Jędryczka, M.: Trichoderma spp. – application and prospects for use in organic farming and industry, Journal of Plant Protection Research, 54, 309–317, https://doi.org/10.2478/jppr-2014-0047, 2014.
Buivydaitė, V., Juodis, J., Motuzas, A., and Vaičys, M. (Eds.): Lietuvos dirvožemių klasifikacijos/Lietuvos dirvožemiai: monografija/sudaryt. V. Vasiliauskienė, PĮ “Lietuvos mokslas”, Vilnius, 408 pp., ISSN 1392-3196, 2001.
Bünemann, E. K., Marscher, P., Smernik, R. J., Conyers, M., and McNeill, A. M.: Soil organic phosphorus and microbial community composition as affected by 26 years of different management strategies, Biol. Fertil. Soils, 44, 717–726, https://doi.org/10.1007/s00374-007-0254-2, 2008.
Buragienė, S., Šarauskis, E., Romaneckas, K., Sasnauskienė, J., Masilionytė, L., and Kriaučiūnienė, Z.: Experimental analysis of CO2 emissions from agricultural soils subjected to five different tillage systems in Lithuania, Sci. Total Environ., 514, 1–9, https://doi.org/10.1016/j.scitotenv.2015.01.090, 2015.
Canarini, A., Kiær, L. P., and Dijkstra, F. A.: Soil carbon loss regulated by drought intensity and available substrate: A meta-analysis, Soil Biol. Biochem., 112, 90–99, https://doi.org/10.1016/j.soilbio.2017.04.020, 2017.
Carson, J. K., Gonzalez-Quiñones, V., Murphy, D. V., Hinz, C., Shaw, J. A., and Gleeson, D. B.: Low pore connectivity increases bacterial diversity in soil, Appl. Environ. Microb., 76, 3936, https://doi.org/10.1128/AEM.03085-09, 2010.
Cartwright, J. and Hui, D. F.: Soil respiration patterns and controls in limestone cedar glades, Plant Soil, 389, 157–169, https://doi.org/10.1007/s11104-014-2348-6, 2015.
Caruso, G., De Pascale, S., Cozzolino, E., Giordano, M., El-Nakhel, C., Cuciniello, A., Cenvinzo, V., Colla, G., and Rouphael, Y.: Protein Hydrolysate or Plant Extract-based Biostimulants Enhanced Yield and Quality Performances of Greenhouse Perennial Wall Rocket Grown in Different Seasons, Plants, 8, 208, https://doi.org/10.3390/plants8070208, 2019.
Cassaro, F. A. M., Borkowski, A. K., Pires, L. F., and Saab, S. D. C.: Characterization of a Brazilian clayey soil submitted to conventional and no-tillage management practices using pore size distribution analysis, Soil Till. Res., 111, 175–179, https://doi.org/10.1016/j.still.2010.10.004, 2011.
Crittenden, S. and Goede, R.: Integrating soil physical and biological properties in contrasting tillage systems in organic and conventional farming, Eur. J. Soil Biol., 77, 26–33, https://doi.org/10.1016/j.ejsobi.2016.09.003, 2016.
da Costa, P. A., Mota, J. C. A., Romero, R. E., Freire, A. G., and Ferreira, T. O.: Changes in soil pore network in response to twenty-three years of irrigation in a tropical semiarid pasture from northeast Brazil, Soil Till. Res., 137, 23–32, https://doi.org/10.1016/j.still.2013.11.004, 2014.
Dias, G. A., Rocha, R. H. C., Araújo, J. L., De Lima, J. F., and Guedes, W. A.: Growth, yield, and postharvest quality in eggplant produced under diferent foliar fertiliser (Spirulina platensis) treatments, Semin. Cienc. Agrar, 37, 3893–3902, https://doi.org/10.5433/1679-0359.2016v37n6p3893, 2016.
Drulis, S. P., Kriaučiūnienė, Z., and Liakas, V.: The Influence of Different Nitrogen Fertilizer Rates, Urease Inhibitors and Biological Preparations on Maize Grain Yield and Yield Structure Elements, Agronomy, 12, 1–15, https://doi.org/10.3390/agronomy12030741, 2022.
Ertani, A., Francioso, O., Tinti, A., Schiavon, M., Pizzeghello, D., and Nardi, S.: Evaluation of seaweed extracts from Laminaria and Ascophyllum nodosum spp. as biostimulants in Zea mays L. using a combination of chemical, biochemical and morphological approaches, Front. Plant Sci., 9, 428, https://doi.org/10.3389/fpls.2018.00428, 2018.
European Commission: European Green Deal, https://ec.europa.eu/info/strategy/priorities-2019-2024/european-green-deal (last access: 16 November 2022), 2020.
Foley, J. A., Ramankutty, N., Brauman, K. A., Cassidy, E. S., Gerber, J. S., Johnston, M., Mueller, N. D., O'Connell, C., Ray, D. K., and West, P. C.: Solutions for a cultivated planet, Nature, 478, 337–342, https://doi.org/10.1038/nature10452, 2011.
Forte, A., Fiorentino, N., Fagnano, M., and Fierro, A.: Mitigation impact of minimum tillage on CO2 and N2O emissions from a Mediterranean maize cropped soil under low-water input management, Soil Till. Res., 166, 167–178, https://doi.org/10.1016/j.still.2016.09.014, 2017.
Gil, S. V., Meriles, J., Conforto, C., Basanta, M., Radl, V., Hagn, A., Schloter, M., and March, G. J.: Response of soil microbial communities to different management practices in surface soils of a soybean agroecosystem in Argentina, Eur. J. Soil Biol., 47, 55–60, https://doi.org/10.1016/j.ejsobi.2010.11.006, 2011.
Gultekin, R., Avağ, R., Görgişen, C., Öztürk, Ö., and Yeter, T.: Effect of deficit irrigation practices on greenhouse gas emissions in drip irrigation, Sci. Hortic., 310, 111757, https://doi.org/10.1016/j.scienta.2022.111757, 2023.
Hamzei, J. and Seyyedi, M.: Energy use and input–output costs for sunflower production in sole and intercropping with soybean under different tillage systems, Soil Till. Res., 157, 73–82, https://doi.org/10.1016/j.still.2015.11.008, 2016.
Jiao, P., Yang, L., Nie, X., Li, Z., Liu, L., and Zheng, P.: Dependence of cumulative CO2 emission and microbial diversity on the wetting intensity in drying-rewetting cycles in agriculture soil on the Loess Plateau, Springer, Soil Ecology Letters, 5, 220147, https://doi.org/10.1007/s42832-022-0147-1, 2023.
Juknevičius, D., Šarauskis, E., Rimkuviene, D., Rukaite, J., and Karayel, D.: Effect of biological preparation on changes in soil organic carbon and its environmental impact applying precision farming, Engineering for Rural Development, Jelgava, https://doi.org/10.22616/ERDev2018.17.N398, 2018.
Juknevičius, D., Kriaučiūnienė, Z., Jasinskas, A., and Šarauskis, E.: Analysis of changes in coil organic carbon, energy consumption and environmental impact using bio-products in the production of winter wheat and oilseed rape, Sustainability, 12, 8246, https://doi.org/10.3390/su12198246, 2020.
Khattab, R. Y., Arntfield, S. D., and Nyachoti, C. M.: Nutritional quality of legume seeds as affected by some physical treatments, Part 1: Protein quality evaluation, LWT – Food Sci. Technol., 42, 1107–111, https://doi.org/10.1016/j.lwt.2009.02.008, 2009.
Klenz, K.: Promoting soil integrity: the use of cover crops and a microorganism stimulant on a striptill corn field in southeastern Minnesota, Natural Lands Ecology Papers, St. Olaf College, https://wp.stolaf.edu/naturallands/files/2017/05/Klenz_Kendra_2015_merged.pdf (last access: 22 November 2023), 2015.
Kocira, S., Hara, P., Szparaga, A., Czerwińska, E., Beloev, H., Findura, P., and Bajus, P.: Evaluation of the Effectiveness of the Use of Biopreparations as Seed Dressings, Agriculture, 10, 90, https://doi.org/10.3390/agriculture10040090, 2020.
Kong, C. H., Wang, P., Zhao, H., Xu, X. H., and Zhu, Y. D.: Impact of allelochemical exuded from allelopathic rice on soil microbial community, Soil Biol. Biochem., 40, 1862–1869, https://doi.org/10.1016/j.soilbio.2008.03.009, 2008.
Lipiec, J., Hajnos, M., and Świeboda, R.: Estimating effects of compaction on pore size distribution of soil aggregates by mercury porosimeter, Geoderma, 179–180, 20–27, https://doi.org/10.1016/j.geoderma.2012.02.014, 2012.
Liu, X. P., Zhang, W. J., Hu, C. S., and Tang, X. G.: Soil greenhouse gas fluxes from different tree species on Taihang Mountain, North China, Biogeosciences, 11, 1649–1666, https://doi.org/10.5194/bg-11-1649-2014, 2014.
Liu, Y., Xing, Z., and Yang, H.: Effect of biological soil crusts on microbial activity in soils of the Tengger Desert (China), J. Arid Environ., 144, 201–211, https://doi.org/10.1016/j.jaridenv.2017.04.003, 2017.
Lorenzo, P., Pereira, C. S., and Rodríguez-Echeverría, S.: Differential impact on soil microbes of allelopathic compounds released by the invasive Acacia dealbata link, Soil Biol. Biochem., 57, 156–163, https://doi.org/10.1016/j.soilbio.2012.08.018, 2013.
Lu, Y., Horton, R., and Ren, T.: Simultaneous determination of soil bulk density and water content: A heat pulse-based method, Eur. J. Soil Sci., 69, 947–952, https://doi.org/10.1111/ejss.12690, 2018.
Ma, S., Fan, J., Chen, Y., and Lu, X.: Studying greenhouse gas emissions through interactions between phospholipid fatty acid content and soil properties of alpine grassland soil in Northern Tibet, China, Global Ecology and Conservation, 27, 1–16, https://doi.org/10.1016/j.gecco.2021.e01558, 2021.
Maikštėnienė, S., Šlepetienė, A., and Masilionytė, L.: The effect of mouldboard nouldbo and on energetic efficiency of agrosystems, Zemdirbyste = Agriculture, 94, 3–23, 2007.
Michalak, I., Chojnacka, K., Dmytryk, A., Wilk, R., Gramza, M., and Rój, E.: Evaluation of supercritical extracts of algae as biostimulants of plant growth in field trials, Front. Plant Sci., 7, 1591, https://doi.org/10.3389/fpls.2016.01591, 2016.
Michałek, W., Kocira, A., Findura, P., Szparaga, A., and Kocira, S.: The Influence of Biostimulant Asahi SL on the Photosynthetic Activity of Selected Cultivars of Phaseolus vulgaris L., Rocz. Ochr. Sr., 20, 1286–1301, 2018.
Mohammed, S., Mirzaei, M., Toro, A. P., Anari, M. G., Moghiseh, E., Asadi, H., Szabo, S., Kakuszi-Szeles, A., and Harsany, E.: Soil carbon dioxide emissions from maize (Zea mays L.) fields as influenced by tillage management and climate, Irrig. Drain., 71, 228–240, https://doi.org/10.1002/ird.2633, 2022.
Montemurro, F., Ferri, D., Tittarelli, F., Canali, S., and Vitti, C.: Anaerobic Digestate and On-Farm Compost Application: Effects on Lettuce (Lactuca sativa L.) Crop Production and Soil Properties, Compost Sci. Util., 18, 184–193, https://doi.org/10.1080/1065657X.2010.10736954, 2010.
Moyano, F. E., Manzoni, S., and Chenu, C.: Responses of soil heterotrophic respiration to moisture availability: an exploration of processes and models, Soil Biol. Biochem., 59, 72–85, https://doi.org/10.1016/j.soilbio.2013.01.002, 2013.
Naujokienė, V., Šarauskis, E., Lekavičienė, K., Adamavičienė, A., Buragienė, S., and Kriaučiūnienė, Z.: The influence of biopreparations on the reduction of energy consumption and CO2 emissions in shallow and deep soil tillage, Sci. Total Environ., 626, 1402–1413, https://doi.org/10.1016/j.scitotenv.2018.01.190, 2018.
Nostro, A., Germano, M. P., D'angelo, V., Marino, A., and Cannatelli, M. A.: Extraction methods and bioautography for evaluation of medicinal plant antimicrobial activity, Lett. Appl. Microbiol., 30, 379–384, https://doi.org/10.1046/j.1472-765x.2000.00731.x, 2000.
Obia, A., Cornelissen, G., Martinsen, V., Smebye, A. B., and Mulder, J.: Conservation tillage and biochar improve soil water content and moderate soil temperature in a tropical Acrisol, Soil Till. Res., 197, 1–12, https://doi.org/10.1016/j.still.2019.104521, 2020.
Olsson, U., Engstrand, U., and Rupšys, P.: Statistiniai metodai/Mokomoji knyga, Akademija, 138 pp., 2007.
Oskiera, M., Szczech, M., Bartoszewski, G., Stępowska, A., and Smoliska, U.: Monitoring of Trichoderma species in agricultural soil in response to application of biopreparations, Biol. Control, 113, 65–72, https://doi.org/10.1016/j.biocontrol.2017.07.005, 2017.
Peltre, C., Nyord, T., Bruun, S., Jensen, L. S., and Magida, J.: Repeated soil application of organic waste amendments reduces draught force and fuel consumption for soil tillage, Agr. Ecosyst. Environ., 211, 94–101, https://doi.org/10.1016/j.agee.2015.06.004, 2015.
Pranagal, J., Ligęza, S., and Smal, H.: Impact of Effective Microorganisms (EM) Application on the Physical Condition of Haplic Luvisol, Agronomy, 10, 1049, https://doi.org/10.3390/agronomy10071049, 2020.
Raudonius, S.: AppliScation, of statistics in plant and crop research: important issues, Žemdirbystė–Agriculture, 104, 377–382, https://doi.org/10.13080/z-a.2017.104.048, 2017.
Rouphael, Y., Giordano, M., Cardarelli, M., Cozzolino, E., Mori, M., Kyriacou, M., Colla, G., and Bonini, P.: Plant-and seaweed-based extracts increase yield but differentially modulate nutritional quality of greenhouse spinach through biostimulant action. Agronomy, 8, 126, https://doi.org/10.3390/agronomy8070126, 2018.
Selby, C., Carmichael, E., and Sharma, H. S.: Bio-refining of perennial ryegrass (Lolium perenne): Evaluation of aqueous extracts for plant defence elicitor activity using French bean cell suspension cultures, Chem. Biol. Technol. Agric., 3, 11, https://doi.org/10.1186/s40538-016-0061-9, 2016.
Sen, A. and Batra, A.: Evaluation of antimicrobial activity of different solvent extracts of medicinal plant: Melia azedarach L., Int. J. Curr. Pharm. Res., 4, 67–73, 2012.
Shihabudeen, M. S., Priscilla, D. H., and Thirumurugan, K.: Antimicrobial activity and phytochemical analysis of selected Indian folk medicinal plants, Int. J. Pharm. Sci. Res., 1, 430–434, 2010.
Sierra, C. A., Trumbore, S. E., Davidson, E. A., Vicca, S., and Janssens, I.: Sensitivity of decomposition rates of soil organic matter with respect to simultaneous changes in temperature and moisture, J. Adv. Model. Earth Syst., 7, 335–356, https://doi.org/10.1002/2014MS000358, 2015.
Szparaga, A., Kocira, S., Kocira, A., Czerwińska, E., Świeca, M., Lorencowicz, E., Kornas, R., Koszel, M., and Oniszczuk, T.: Modification of growth, yield, and the nutraceutical and antioxidative potential of soybean through the use of synthetic biostimulants, Front. Plant Sci., 9, 1401, https://doi.org/10.3389/fpls.2018.01401, 2018.
Szparaga, A., Kocira, S., Kocira, A., Czerwińska, E., Depo, K., Erlichowska, B., and Deszcz, E.: Effect of applying a biostimulant containing seaweed and amino acids on the content of fiber fractions in three soybean cultivars, Legume Res., 42, 341–347, https://doi.org/10.18805/LR-412, 2019.
Tarantino, A., Lops, F., Disciglio, G., and Lopriore, G.: Efects of Plant Biostimulants on Fruit Set, Growth, Yield and Fruit Quality Attributes of “Orange Rubis®” Apricot (Prunus armeniaca L.) Cultivar in Two Consecutive Years, Sci. Hortic., 239, 26–34, https://doi.org/10.1016/j.scienta.2018.04.055, 2018.
Tian, Z., Lu, Y., Ren, T., Horton, R., and Heitman, J. H.: Improved thermo-time domain reflectometry method for continuous in-situ determination of soil bulk density, Soil Till. Res., 178, 118–129, https://doi.org/10.1016/j.still.2017.12.021, 2018.
Tilman, D., Cassman, K. G., Matson, P. A., Naylor, R., and Polasky, S.: Agricultural sustainability and intensive production practices, Nature, 418, 671–677, https://doi.org/10.1038/nature01014, 2002.
Tong, B., Kool, D., Heitman, J. L., Sauer, T. J., Gao, Z., and Horton, R.: Thermal property values of a central Iowa soil as functions of soil water content and bulk density or of soil air content, Soil Sci., 71, 169–178, https://doi.org/10.1111/ejss.12856, 2020.
Tooth, E., Gelybó, G., Dencső, M., Kása, I., Birkás, M., and Horel, Á.: Soil CO2 Emissions in a Long-Term Tillage Treatment Experiment, in: Soil Management and Climate Change, Academic Press, 293–307, https://doi.org/10.1016/B978-0-12-812128-3.00019-7, 2018.
Trevisan, S., Manoli, A., and Quaggiotti, S.: A Novel Biostimulant, Belonging to Protein Hydrolysates, Mitigates Abiotic Stress Effects on Maize Seedlings Grown in Hydroponics, Agronomy, 9, 28, https://doi.org/10.3390/agronomy9010028, 2019.
Vaitauskienė, K., Šarauskis, E., Naujokienė, V., and Liakas, V.: The influence of fr ee-living nitrogen-fixing bacteria on the mechanical characteristics of different plant residues under no-till and strip-till conditions, Soil Till. Res., 154, 91–102, https://doi.org/10.1016/j.still.2015.06.007, 2015.
Wu, H., Yuan, Z., Geng, Y., Ren, J., Sheng, H., and Gao, L.: Temporal trends and spatial patterns of energy use efficiency and greenhouse gas emissions in crop production of Anhui Province, China, Energy, 15, 955–968, https://doi.org/10.1016/j.energy.2017.05.173, 2017.
Zhang, B., Li, Y., Ren, T., Tian, Z., Wang, G., He, X., and Tian, C.: Short-term effect of tillage and crop rotation on microbial community structure and enzyme activities of a clay loam soil, Biol. Fertil. Soils, 50, 1077–1085, https://doi.org/10.1007/s00374-014-0929-4, 2014.