the Creative Commons Attribution 4.0 License.
the Creative Commons Attribution 4.0 License.
 | 19 Sep 2023
Land inclination controls CO2 and N2O fluxes, but not CH4 uptake, in a temperate upland forest soil
Lauren M. Gillespie
Nathalie Y. Triches
Diego Abalos
Peter Finke
Sophie Zechmeister-Boltenstern
Stephan Glatzel
Eugenio Díaz-Pinés
Inclination and spatial variability in soil and litter properties influence soil greenhouse gas (GHG) fluxes and thus ongoing climate change, but their relationship in forest ecosystems is poorly understood. To elucidate this, we explored the effect of inclination, distance from a stream, soil moisture, soil temperature, and other soil and litter properties on soil–atmosphere fluxes of carbon dioxide (CO2), methane (CH4), and nitrous oxide (N2O) with automated static chambers in a temperate upland forest in eastern Austria. We hypothesised that soil CO2 emissions and CH4 uptake are higher in sloped locations with lower soil moisture content, whereas soil N2O emissions are higher in flat, wetter locations. During the measurement period, soil CO2 emissions were significantly higher on flat locations (p<0.05), and increased with increasing soil temperature (p<0.001) and decreasing soil moisture (p<0.001). The soil acted as a CH4 sink, and CH4 uptake was not significantly related to inclination. However, CH4 uptake was significantly higher at locations furthest away from the stream as compared to at the stream (p<0.001) and positively related to litter weight and soil C content (p<0.01). N2O fluxes were significantly higher on flat locations and further away from the stream (p<0.05) and increased with increasing soil moisture (p<0.001), soil temperature (p<0.001), and litter depth (p<0.05). Overall, this study underlines the importance of inclination and the resulting soil and litter properties in predicting GHG fluxes from forest soils and therefore their potential source-sink balance.
- Article
(1874 KB) - Full-text XML
-
Supplement
(641 KB) - BibTeX
- EndNote


Forests play a crucial role in the global climate by emitting and consuming the greenhouse gases (GHGs) carbon dioxide (CO2), methane (CH4), and nitrous oxide (N2O; IPCC, 2022). They store a large amount of carbon (C) in vegetation and soil organic matter and can be effective CO2 sinks (Pan et al., 2011). Soil microorganisms also take up atmospheric C through the oxidisation of CH4 during methanotrophy (Le Mer and Roger, 2001; Hiltbrunner et al., 2012). However, forest soils also emit substantial quantities of CO2 (Webster et al., 2008), which, in aerobic conditions, is mainly released by root respiration and microbial respiration during decomposition (Cronan, 2018; Zechmeister-Boltenstern et al., 2018). N2O is produced by soil microorganisms, mainly during nitrification and denitrification (Butterbach-Bahl et al., 2013). In aerobic conditions, bacteria convert ammonium to nitrite and further to nitrate during nitrification. In anoxic conditions, nitrate is then used as an alternative electron acceptor instead of O2 and is reduced to N2 during denitrification (Butterbach-Bahl et al., 2014). Under most conditions, these processes occur simultaneously and usually result in a net atmospheric emission of N2O (Ambus, 1998). Conversely, net N2O uptake has been reported from forest soils, especially since monitoring instrumentation has become sensitive enough to measure very low fluxes (Savage et al., 2014; Subke et al., 2021). Net N2O uptake (from the atmosphere into the soil) is a complex process closely tied to N2O consumption (within the soil) that is driven principally by denitrifying bacteria (Liu et al., 2022).
Temporal and spatial variations in soil CO2, CH4, and N2O fluxes are driven mostly by changes in soil temperature and soil moisture (Raich and Potter, 1995; Davidson et al., 1998; Le Mer and Roger, 2001; Butterbach-Bahl et al., 2014). Rising temperatures accelerate microbial activities and, consequently, the production and emission of N2O and CO2 (Butterbach-Bahl et al., 2013). Elevated soil respiration could lead to a depletion of O2, which also results in increased N2O from denitrification (Butterbach-Bahl et al., 2013). Contrarily, CH4 uptake appears to be less sensitive to temperature changes than CO2 and N2O fluxes (Hanson and Hanson, 1996). Soil moisture has a major influence on all GHG fluxes by regulating O2 and substrate availability to soil microorganisms and influencing the diffusion of gases within the soil matrix (Butterbach-Bahl et al., 2014; Schimel, 2018). Indeed, soil microbial activity decreases as soils become water saturated (Davidson et al., 2012). Soil moisture further affects fluxes since diffusion coefficients of GHG in air are approximately 104 times larger than in water (Marrero and Mason, 1972).
Inclination and distance from a water source influence some of the most important drivers of soil GHG fluxes. For example, soil moisture content changes on small scales at different inclinations through accumulation, runoff, and leaching of precipitation water (Burt and Butcher, 1985; Lookingbill and Urban, 2004; Lin et al., 2006). Inclination also modifies other important drivers of soil GHG fluxes, such as the hydrological transport of nutrients (Hairston and Grigal, 1994), litter accumulation (Butler et al., 1986), soil aeration, soil texture, soil pH, and substrate availability (soil C and N), usually resulting in high GHG spatial variability (e.g. Fierer and Jackson, 2006; Thomas and Packham, 2007). Flat locations by a water source are also at higher risk to be influenced by flooding and subsequent changes to soil properties and the soil microbial community (Ou et al., 2019; Unger et al., 2009). Forest litter in particular can have a major impact on the exchange of GHGs by adding nutrients to the soil, acting as a physical barrier (i.e., holding gases in the soil rather than releasing them into the atmosphere) or influencing the water and heat exchange between soil and atmosphere (Leitner et al., 2016; Walkiewicz et al., 2021).
Studies on the effect of inclination on GHG fluxes from temperate upland forest soils are particularly rare. Some studies reported higher soil CO2 emissions on sloped compared to flat locations, associated with warmer air and soil temperatures and lower soil moisture contents, favouring faster diffusion rates though not so low as to impede microbial activity (Yu et al., 2008; Warner et al., 2018). Conversely, no effect of topography on soil CO2 emissions was reported in a laboratory study on a montane tropical forest (Arias-Navarro et al., 2017). With regard to CH4, relatively little is known on how inclination and its influence on chemical and physical soil properties may affect CH4 fluxes (Warner et al., 2018). Soil CH4 uptake is highly variable in space and time and appears to be highest on dry slopes (Hiltbrunner et al., 2012; Yu et al., 2021) even though it is assumed that temperate upland forest soils take up CH4 irrespective of the inclination (Lamprea Pineda et al., 2021). Effects of inclination on N2O fluxes are also contradictory. Some studies show increased N2O emissions with higher soil water content at flat locations (Davidson et al., 2000; Lamprea Pineda et al., 2021), whereas others show a higher emission in aerated soils on slopes (Yu et al., 2008, 2021). Assessing the impact of inclination on soil GHGs therefore remains a challenging task.
In this study, we aim to improve the understanding of the effects of inclination and distance from the stream on the emission and uptake of GHGs in a temperate upland forest soil in eastern Austria. We monitored soil CO2, CH4, and N2O fluxes with automated chambers over 6 months for two different inclinations and at four distances from a stream in a deciduous forest. We tested three hypotheses: (1) soil CO2 emissions are higher in sloped than flat locations because of the inclination and the lower soil moisture content at sloped locations, (2) soil CH4 uptake is higher in sloped than flat locations because of the inclination and the lower soil moisture content at sloped locations, and (3) soil N2O emissions are lower in sloped than flat locations because of the inclination and the higher soil moisture content at flat locations.
2.1 Study site and experimental design
This study was conducted within the framework of the Long-Term Ecosystem and socio-ecological Research Infrastructure – Carbon, Water and Nitrogen (LTER-CWN) project (further information is available at https://www.lter-austria.at/en/cwn-sites/, last access: 1 September 2023). The BOKU University Forest Rosalia Lehrforst (47∘42′25.35′′ N, 16∘16′36.62′′ E) is one of the associated sites and served as the site for our study (see Fürst et al., 2021, for more information). At the site, European beech (Fagus sylvatica L.) and Norway spruce (Picea abies (L.) H. Karst.) are the dominant tree species but alluvial forest species (Alnus spp. Mill, Fraxinus excelsior L.) are also present next to the study location. The elevation is around 400 m a.s.l. and the dominant soil type is pseudo-gleyic Cambisol (Schad, 2016).
We used the GasFluxTrailer (explained below) to measure soil GHG fluxes from 17 June to 24 November 2020. We positioned 16 chambers linearly in groups of four at four different distances from a small forest stream: 0.5, 5, 10, and 15 m (Fig. S1 in the Supplement). Trees adjacent to the chambers were F. sylvatica and P. abies. These distances served as a first treatment effect and are hereafter referred to as chamber groups (CGs): CG0.5, CG5, CG10, and CG15. These distances were chosen because they were expected to cover a decreasing soil moisture gradient from CG0.5 to CG15. To measure this gradient, a Em50 (METER Group, Inc. Pullman, WA, USA) was connected to four ECH2O 5 TM volumetric water content and temperature sensors (METER Group). One sensor was installed at each CG approximately 1 m away from the outer chamber (Fig. S1). As a second treatment effect, the distances were also chosen so that the CGs were set up at two different inclinations. CG0.5 and CG5 were located at flat locations (average 1∘; the slope at these distances did not exceed 2∘) and CG10 and CG15 at sloped locations (average 35∘; west facing).
For meteorological information, we used precipitation (OTT Pluvio L weighing rain gauge) and air temperature (air temperature and humidity sensor TR1) data recorded at 30 min intervals by the Mehlbeerleiten weather station, located approximately 100 m north-west of the site (Diaz-Pines and Gasch, 2021; Fürst et al., 2021).
2.2 Gas flux measurements: GasFluxTrailer
An automated and mobile measuring system was used, termed the GasFluxTrailer. It consists of a mobile trailer estimating soil–atmosphere GHG exchange rates of CH4, CO2, and N2O. The GasFluxTrailer connects with the chambers and it controls the sampling of each individual chamber (i.e., the opening and closing and gas sampling) and recording of the gas concentrations. The 16 automated, static, non-steady-state, non-flow-through chambers (Pumpanen et al., 2004), with a length, width and height of 0.5 m × 0.5 m × 0.15 m are made of stainless steel and placed on stainless-steel frames of the same area. They are equipped with fans to ensure homogenous air mixing. The gas analysers are a G2301 (PICARRO Inc., Santa Clara, USA), measuring concentrations of CO2 and CH4, and a G5131i (PICARRO Inc.), estimating N2O concentrations. The software used to run automatic sequences is the IDASw Recorder 4.5.0., developed by the Institute of Meteorology and Climate Research Atmospheric Environmental Research (IMK-IFU) in Germany.
2.3 Field and laboratory measurements
We inserted the chamber frames 5 cm deep into the soil approximately 1 month before the measuring campaign to avoid additional soil CO2 release from cut roots, affecting our measurements (Davidson et al., 2002). For each measurement estimate, a chamber was closed for 10 min, which, thanks to the highly sensitive instruments used here, was sufficient time to measure gas concentrations changes, including low N2O fluxes (Harris et al., 2021). The closing and opening was done successively; thus one full cycle of all 16 chambers took 160 min. We calculated fluxes with a linear regression approach according to Butterbach-Bahl et al. (2011). This was justified with short chamber closure times and a relatively large chamber size (Hutchinson and Mosier, 1981). Positive flux values indicate gas emission from the soil, and negative values indicate net uptake. To ensure the system was running and working correctly, we controlled the GHG flux measurements on-site every week and three to four times per week remotely. There were no inundations or significant drying/rewetting events during the observation period.
Close to each of the 16 chambers, a litter and soil sample was collected in December 2021. The litter depth was measured first, before disturbing the litter and topsoil by placing a 0.2 m × 0.2 m frame on the ground at this location. The litter was then collected within this frame, dried at 65 ∘C for 7 d, and weighed. After litter collection and removal of the organic layer, two soil cores (stainless steel core, 7 cm diameter, 7 cm depth) were taken from the topsoil mineral layer for analyses of pH, C and N content, and soil texture. C and N contents (%) were determined by dry combustion on 1.6 mg of soil using the Austrian standard ÖNORM L 1080 (ÖNORM, 2013). Particle size analysis was conducted using the pipette method on 10 g of soil according to the Austrian standard ÖNORM L 1061 (ÖNORM, 2002), after the organic material had been burned off in an oven at 550 ∘C, in order to determine soil texture (%). In short, sieved soil (<2 mm) is agitated in a volume of water, and a pipette is used to sample a defined volume at a defined depth at specific times after which the samples are dried to determine clay and silt contents. The remaining soil is then sieved (63 µm) to determine sand content. Soil pH was measured on 5 g of soil with 0.01 M CaCl2 using the Austrian standard ÖNORM L 1083 (ÖNORM, 2006). Because the soil was relatively rocky, we calculated the soil bulk density (BD, g cm−3) including the coarse (stone) fraction as
where dry soil weight is the weight of the soil in the core after oven drying in grams and core volume is the volume of the core in cubic centimetres.
We calculated the total porosity (Φ) using the bulk density and an estimated soil particle density, obtained from the weighted average of the specific weights of mineral material (2.65 g cm−3) and organic matter (1.45 g cm−3). We took into account the organic matter content because it was relatively high, i.e. between 8 % and 27 %.
2.4 Data processing and statistics
We quality-controlled the CO2, CH4, and N2O flux data using the determination coefficient (R2) values between GHG concentrations and the time after chamber closure. For CO2 and CH4, we filtered the data with R2>0.8 and a visual plausibility check based on expert knowledge. For N2O, R2>0.8 was applied only if fluxes were >5 µg N2O-N m−2 h−1. For low flux rates (<5 µg N2O-N m−2 h−1), we did not remove values with R2<0.8 if corresponding CO2 fluxes were valid. We kept these measurements in the dataset because the low R2 values were due to fluxes below the detection limit of the system; however, the measurement itself remained valid as indicated by plausible CO2 fluxes, and as elaborated in Parkin et al. (2012). Through this quality control, we found that two chambers did not produce any reliable measurements from 24 September onwards. August data for all chambers were excluded due to a malfunctioning of the equipment that was not initially detected. Furthermore, all of the data from one chamber (chamber 13) were not used for the analysis because of a failure in the chamber gas sampling. After data quality screening, there were 125 d of measurement included in the analysis for CO2 and CH4 and 85 d for N2O.
All statistical analyses were performed with R (version 4.0.4; R Core Team, 2022). All data were visually and statistically checked for normality (Levene's test) and homoscedasticity before testing for statistical differences. Since the original data were not normally distributed, CO2 and N2O fluxes were log-transformed. To homogenise the data from the gas flux analysers and the soil temperature and soil moisture sensors, we rounded all gas flux data into 3 h intervals (00:00, 03:00, 06:00, 09:00, 12:00, 15:00, 18:00, 21:00), corresponding to the approximate gas flux measurement cycle duration. Soil temperature and soil moisture data were available every 30 min and was thus also aggregated to the same 3 h intervals. For the statistical analyses, we ran linear mixed-effect models (LMM) using the “lmer” function from the lme4 package (version 1.1-27; Bates et al., 2015), the “lmerTest” package (version 3.1-3; Kuznetsova et al., 2017), and the “optimx” function from the optimx package (version 2021-6.12; Nash and Varadhan, 2011). Models were selected according to the guidelines of Zuur et al. (2009). For the null models, soil temperature, soil moisture, and inclination or distance from the stream (i.e. 0.5 m to 15 m away from the stream, CG0.5–CG15) were included as fixed effects, with an interaction between soil temperature and soil moisture. Sampling date and chamber number were included as random effects. Sampling date was included as a random variable since we were not exploring temporal changes and since there were multiple observations per day. Inclination and distance were not included in the same model because they were highly correlated. We therefore separated our treatments in “inclination” and “distance”, resulting in two LMM models per GHG. We then created a model, using the original model structure, including each soil or litter characteristic individually as an additional explanatory variable. The model Akaike information criterion (AIC) was then compared using ANOVA. Finally, we selected the model with the lowest AIC value if it was significantly different from the null model. This was done for each gas–inclination or gas–distance combination. To obtain the conditional and marginal R2 of the models, the “r2_nakagawa” function from the performance package was used (version 0.7.3; Nakagawa et al., 2017).
Table 1Average values and standard error (SE) of litter and soil parameters at each distance from the stream. “CG” indicates chamber group, with the numbers 0.5, 5, 10, and 15 defining the distance from the stream (in metres). Different letters indicate differences between distances (Dunn multiple comparison test after Kruskal–Wallis test, p<0.05) for each variable.
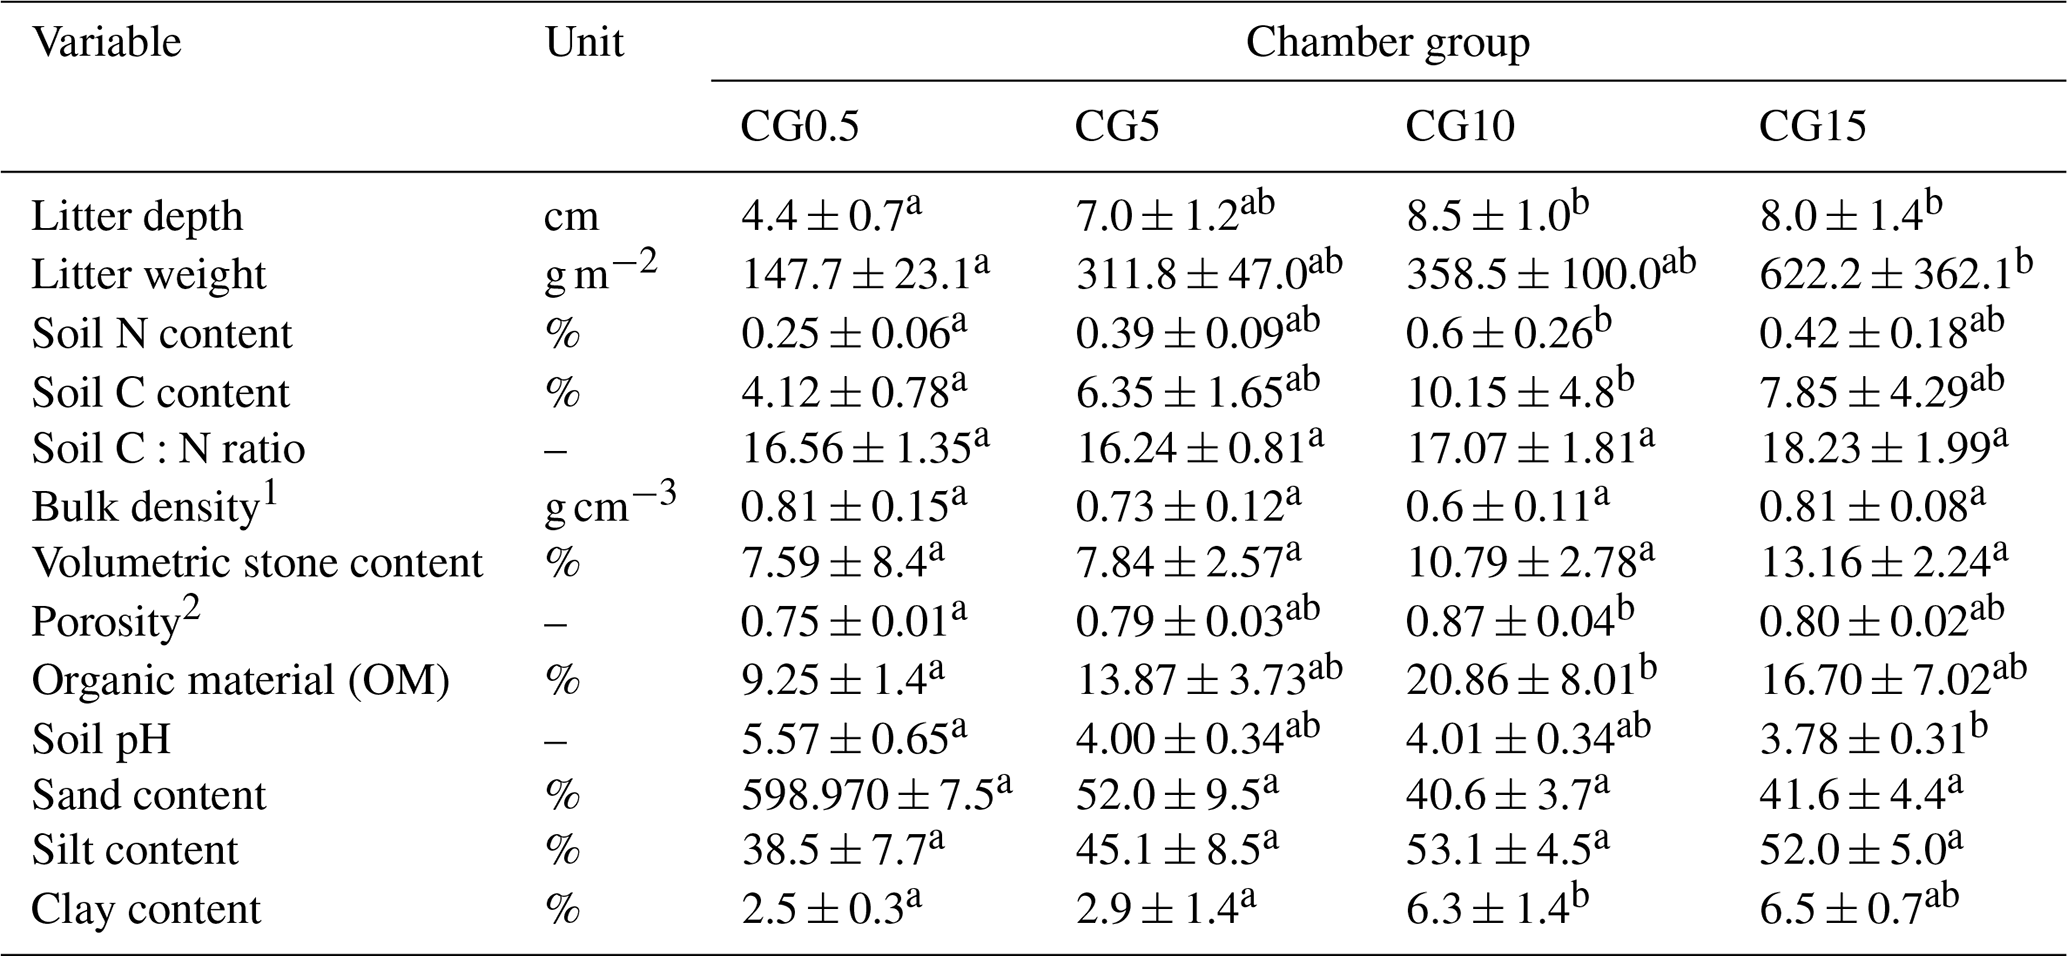
1 with coarse material. 2 without coarse material.
Over the measurement period (June–November 2020, 161 d), the mean air temperature was 12.30 ∘C and cumulative precipitation was 561 mm. The average volumetric water content, here referred to as “soil moisture”, was 0.22 ± 0.07 m3 m−3, with wetter soils in flat (0.28 ± 0.04 m3 m−3) compared to sloped locations (0.17 ± 0.02 m3 m−3; Fig. S2). The mean soil temperature was 12.85 ± 2.62 ∘C, with no significant difference between flat and sloped locations. The wettest and warmest location was at CG5 (0.3 ± 0.03 m3 m−3 and 13.62 ± 2.54 ∘C; Fig. S2). Changes in soil moisture and soil temperature were strongly related to variations in precipitation and air temperature (Fig. S3). Furthermore, the interaction between soil moisture and soil temperature was significant in all models (p<0.001), showing a decrease in soil moisture with increasing soil temperature. Litter depth and weight were much lower at CG0.5 than at all other CGs (Table 1). Soil N and C contents and organic matter content were lowest at CG0.5 and highest at CG10 but C:N ratios were similar at all CGs (Table 1). Bulk density was low (0.6–0.8 g cm−3) at all distances. Soil pH was considerably higher at CG0.5 compared to all other CGs (Table 1). The soil in flat locations was sandier, whereas the sloped locations were more clayey (Table 1).
Table 2LMM results exploring the relationship between inclination (flat compared to sloped) or distance (m), soil moisture (m3 m−3), soil temperature (∘C), soil moisture : soil temperature interaction, soil pH, and volumetric stone content regarding soil CO2 emissions (mg CO2-C m−2 h−1). Soil pH and volumetric stone content are included because the LMM models including these variables had AIC values statistically smaller than the null model. R2m indicates marginal R2, and R2c indicates conditional R2 values. p values are coded as , , and .
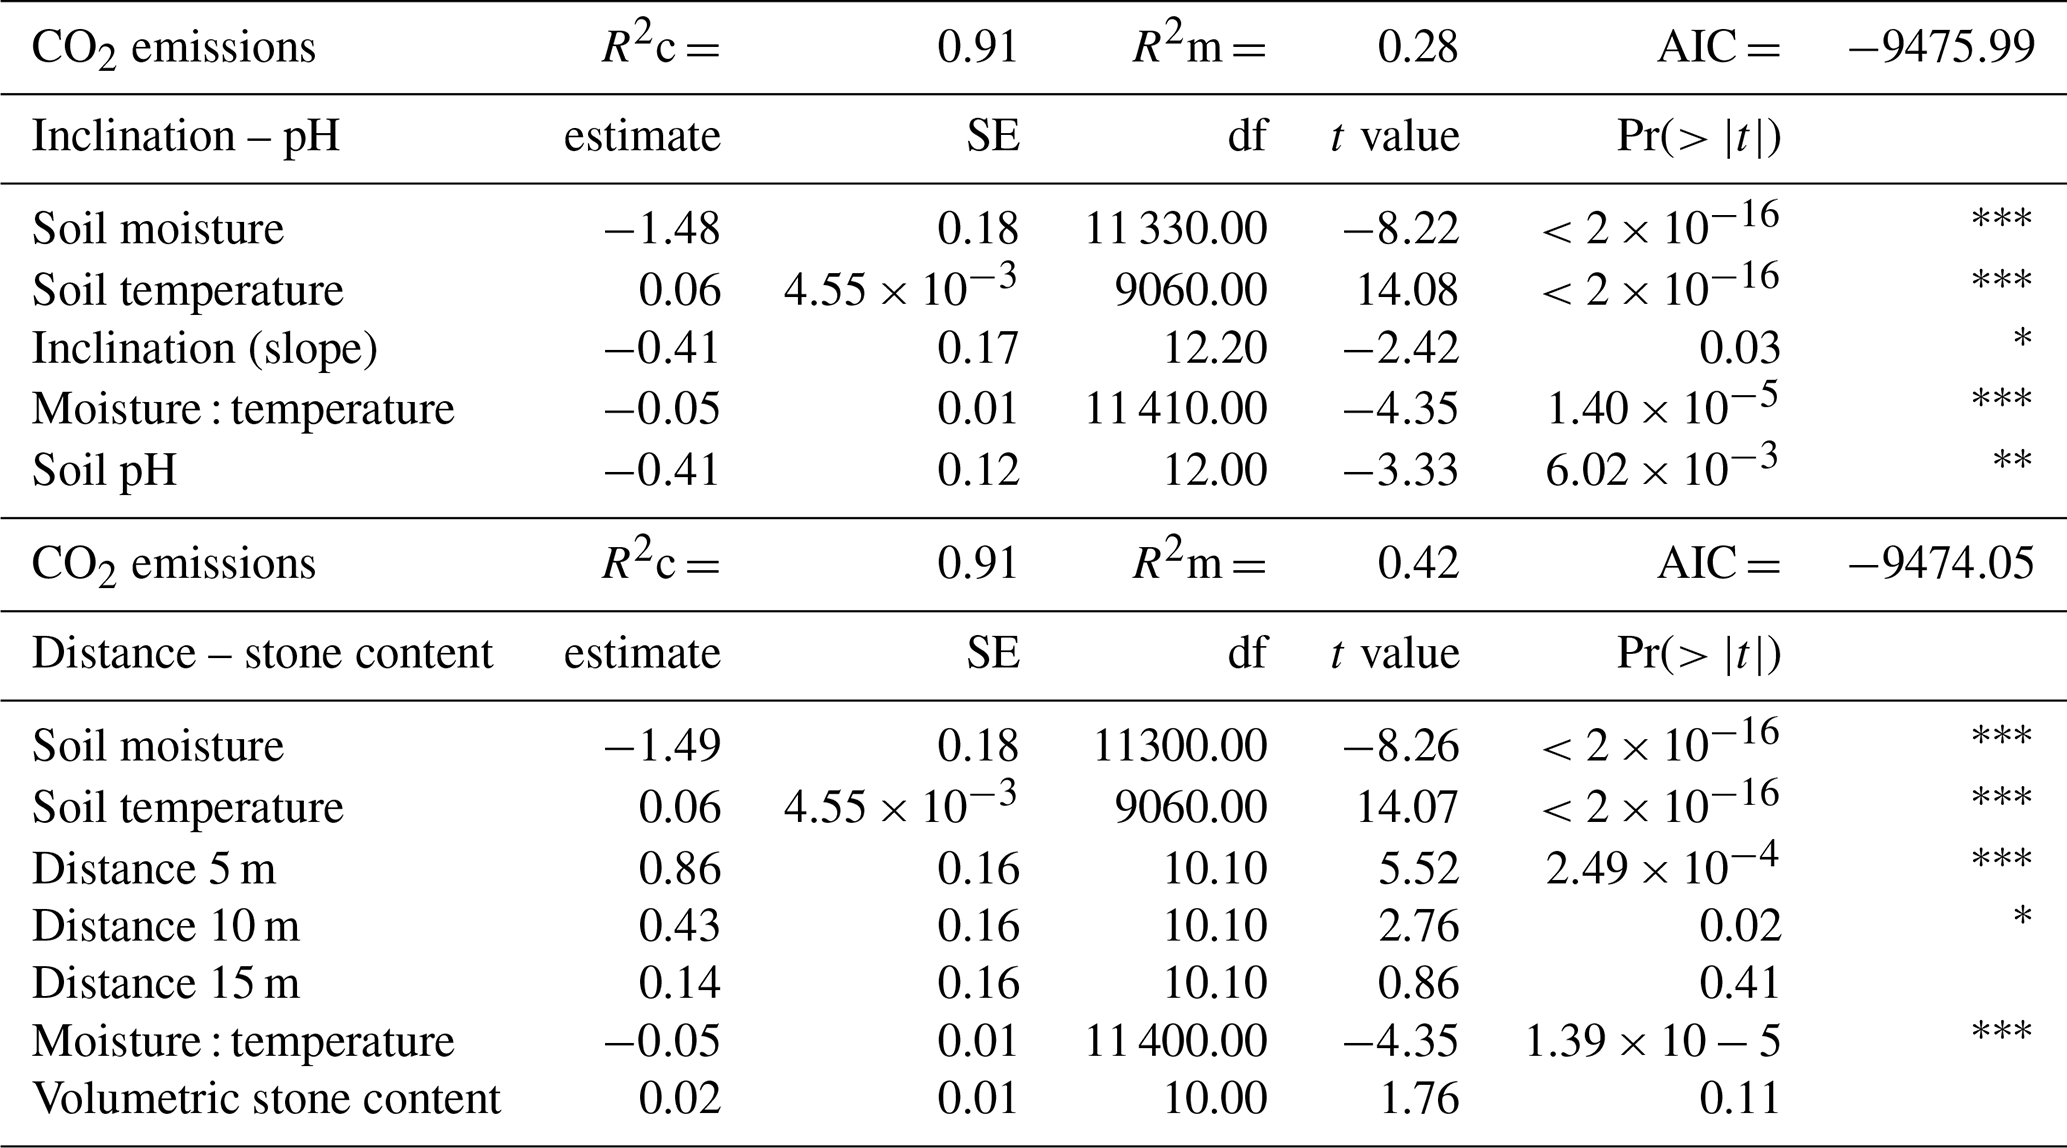
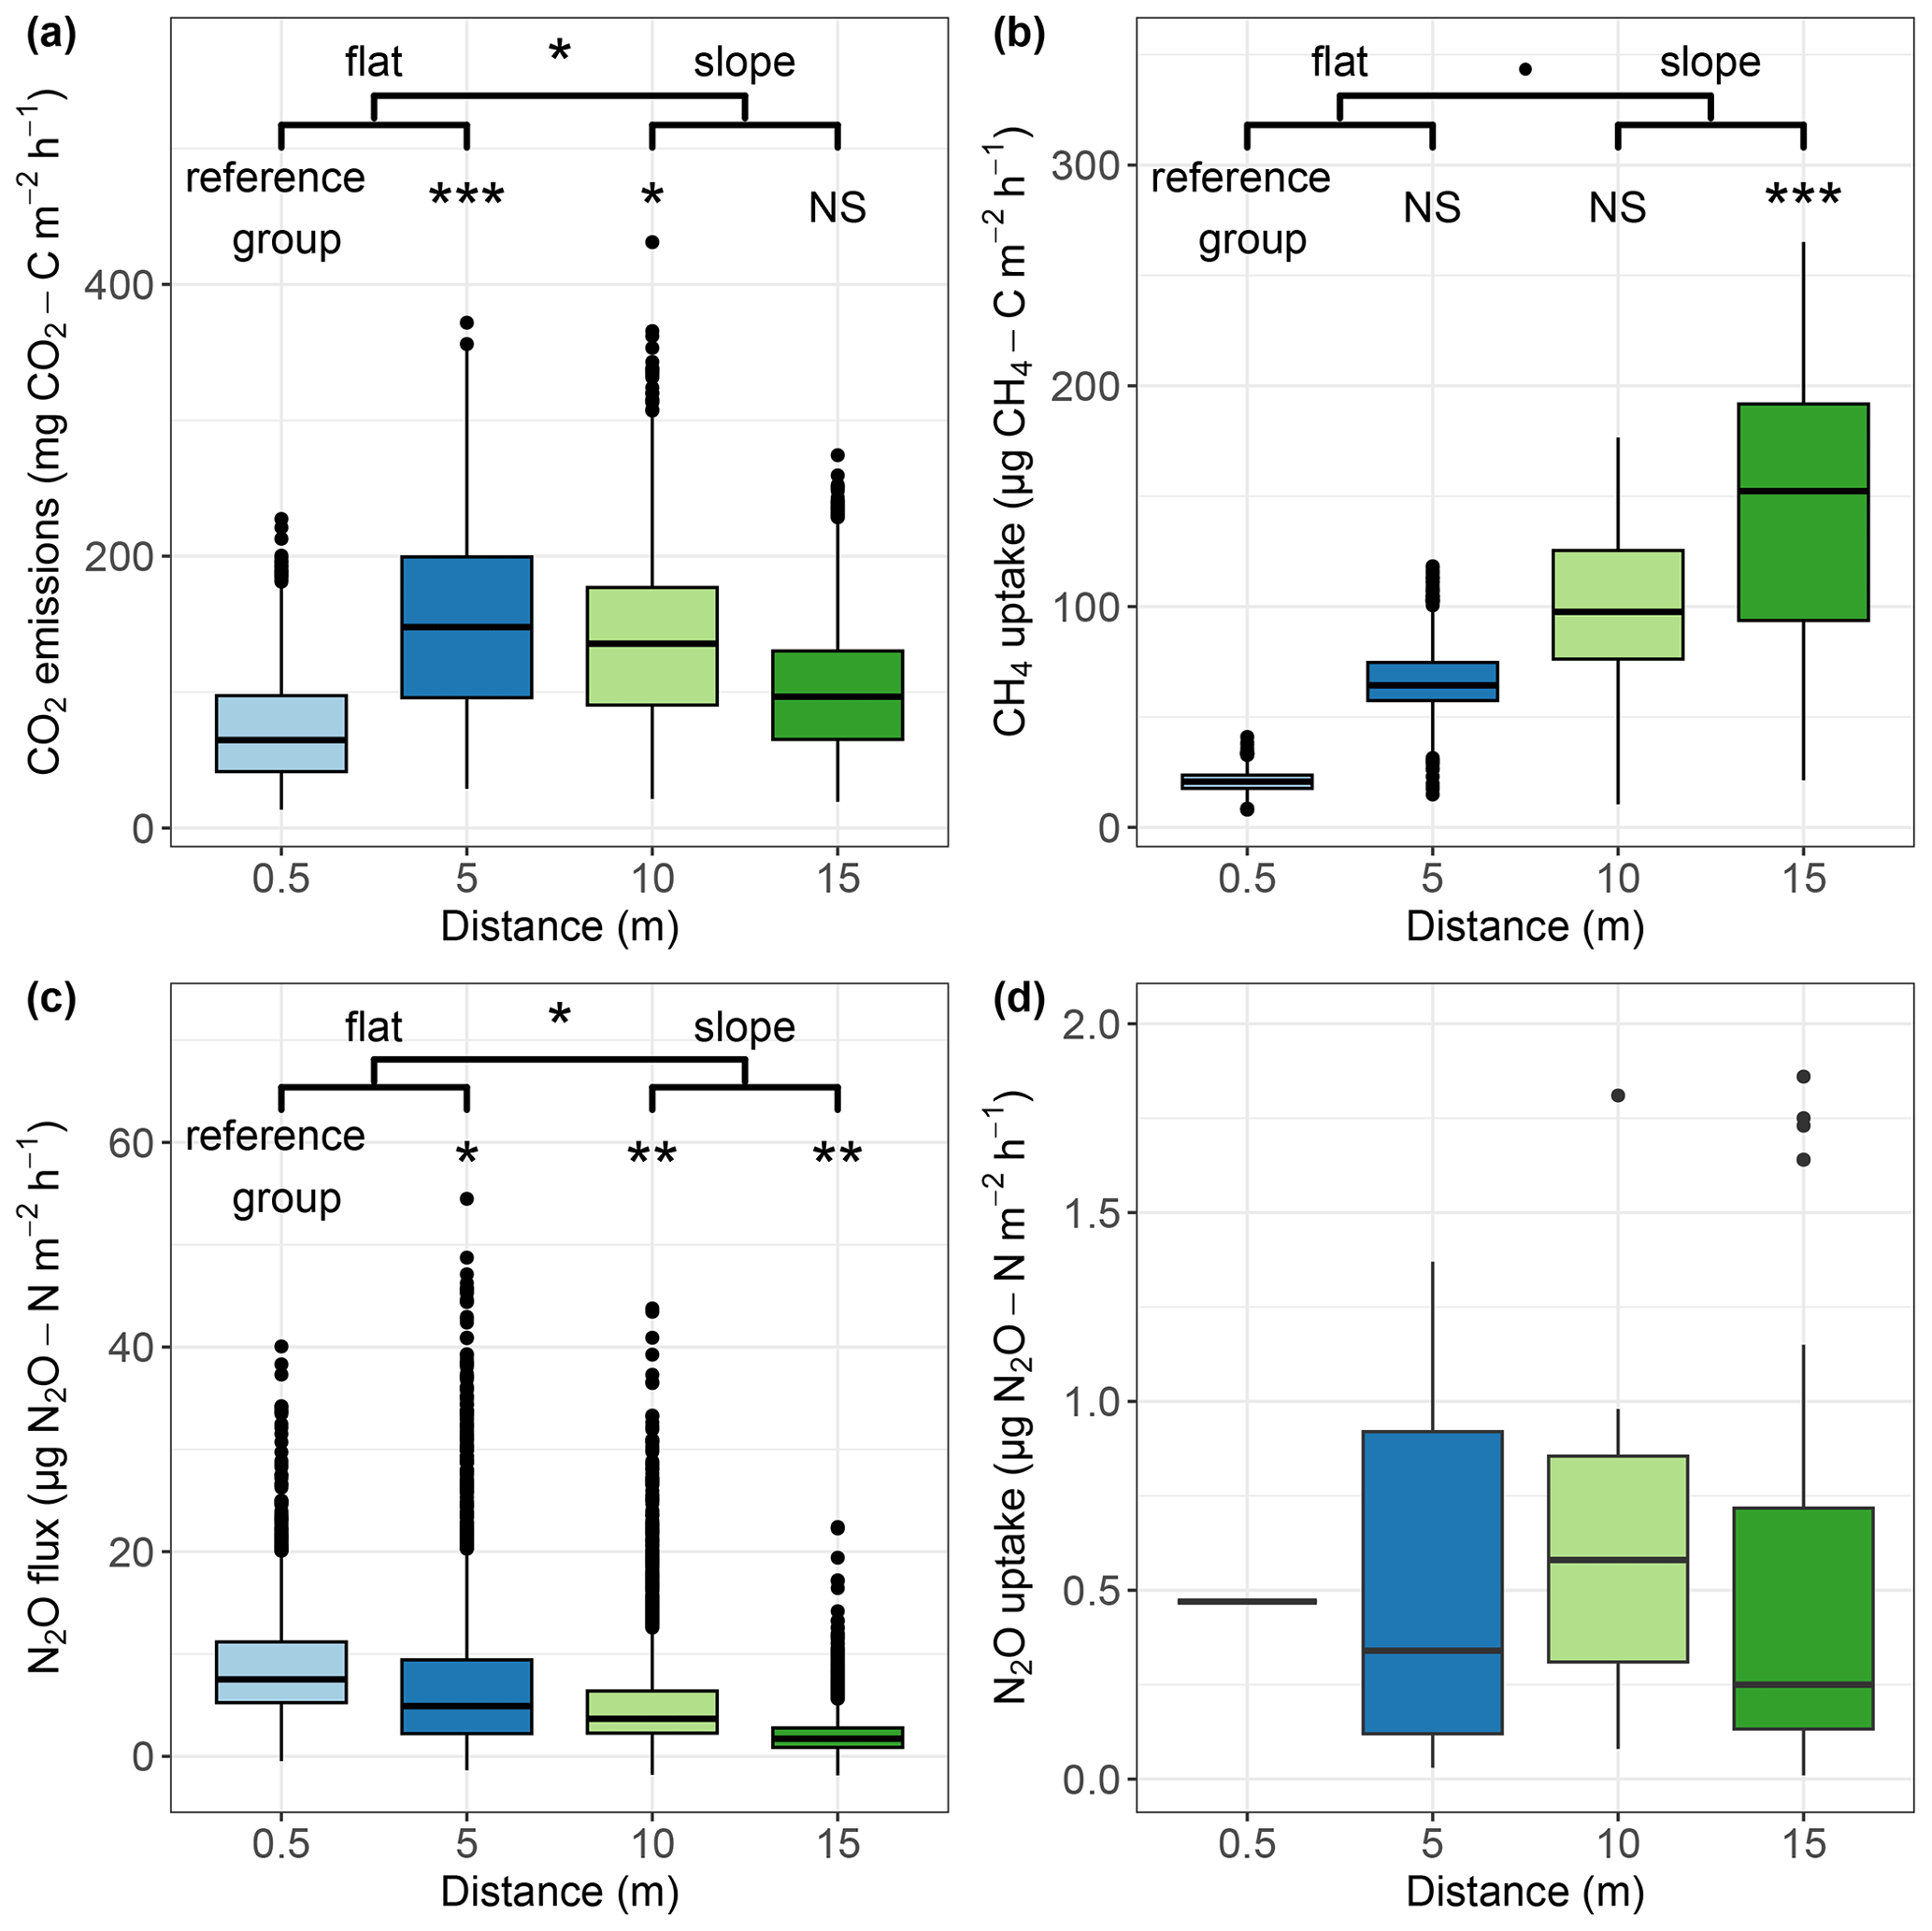
Figure 1(a) CO2 emissions (mg CO2-C m−2 h−1), (b) CH4 uptake (µg CH4-C m−2 h−1), (c) N2O flux (µg N2O-N m−2 h−1), and (d) N2O uptake (µg N2O-N m−2 h−1) at four distances from the stream: 0.5, 5, 10, and 15 m (i.e. CG0.5, CG5, CG10, and CG15). Blue indicates flat locations, and green indicates sloped locations. Statistical significance is from the “distance model” (linear mixed model, LMM) for the differences between the four distances and the “inclination model” for the differences between the flat and slope positions associated with each gas (Tables 1, 2, 3); no LMM was run for N2O uptake. Non-significance is indicated by “NS” and p values are coded as , , and .
3.1 Soil CO2 emissions
The average soil CO2 emissions during the observation period were 116.2 ± 61.5 mg CO2-C m−2 h−1, with flat and sloped locations emitting 113.6 ± 66.7 and 118.6 ± 56.3 mg CO2-C m−2 h−1, respectively (Table 2, Fig. 1a). The soil CO2 emission pattern was bell-curved with increasing distance from the stream, with the lowest emissions at CG0.5, the highest emissions at CG5 and CG10, and relatively low emissions at CG15 as compared to CG10 (Table 2, Fig. 1a). Our analysis showed a significant inclination effect on soil CO2 emissions (p<0.05); furthermore, we found a significant difference between emissions at CG0.5 and CG5 (p<0.001), as well as between CG0.5 and CG10 (p<0.05, Table 2).
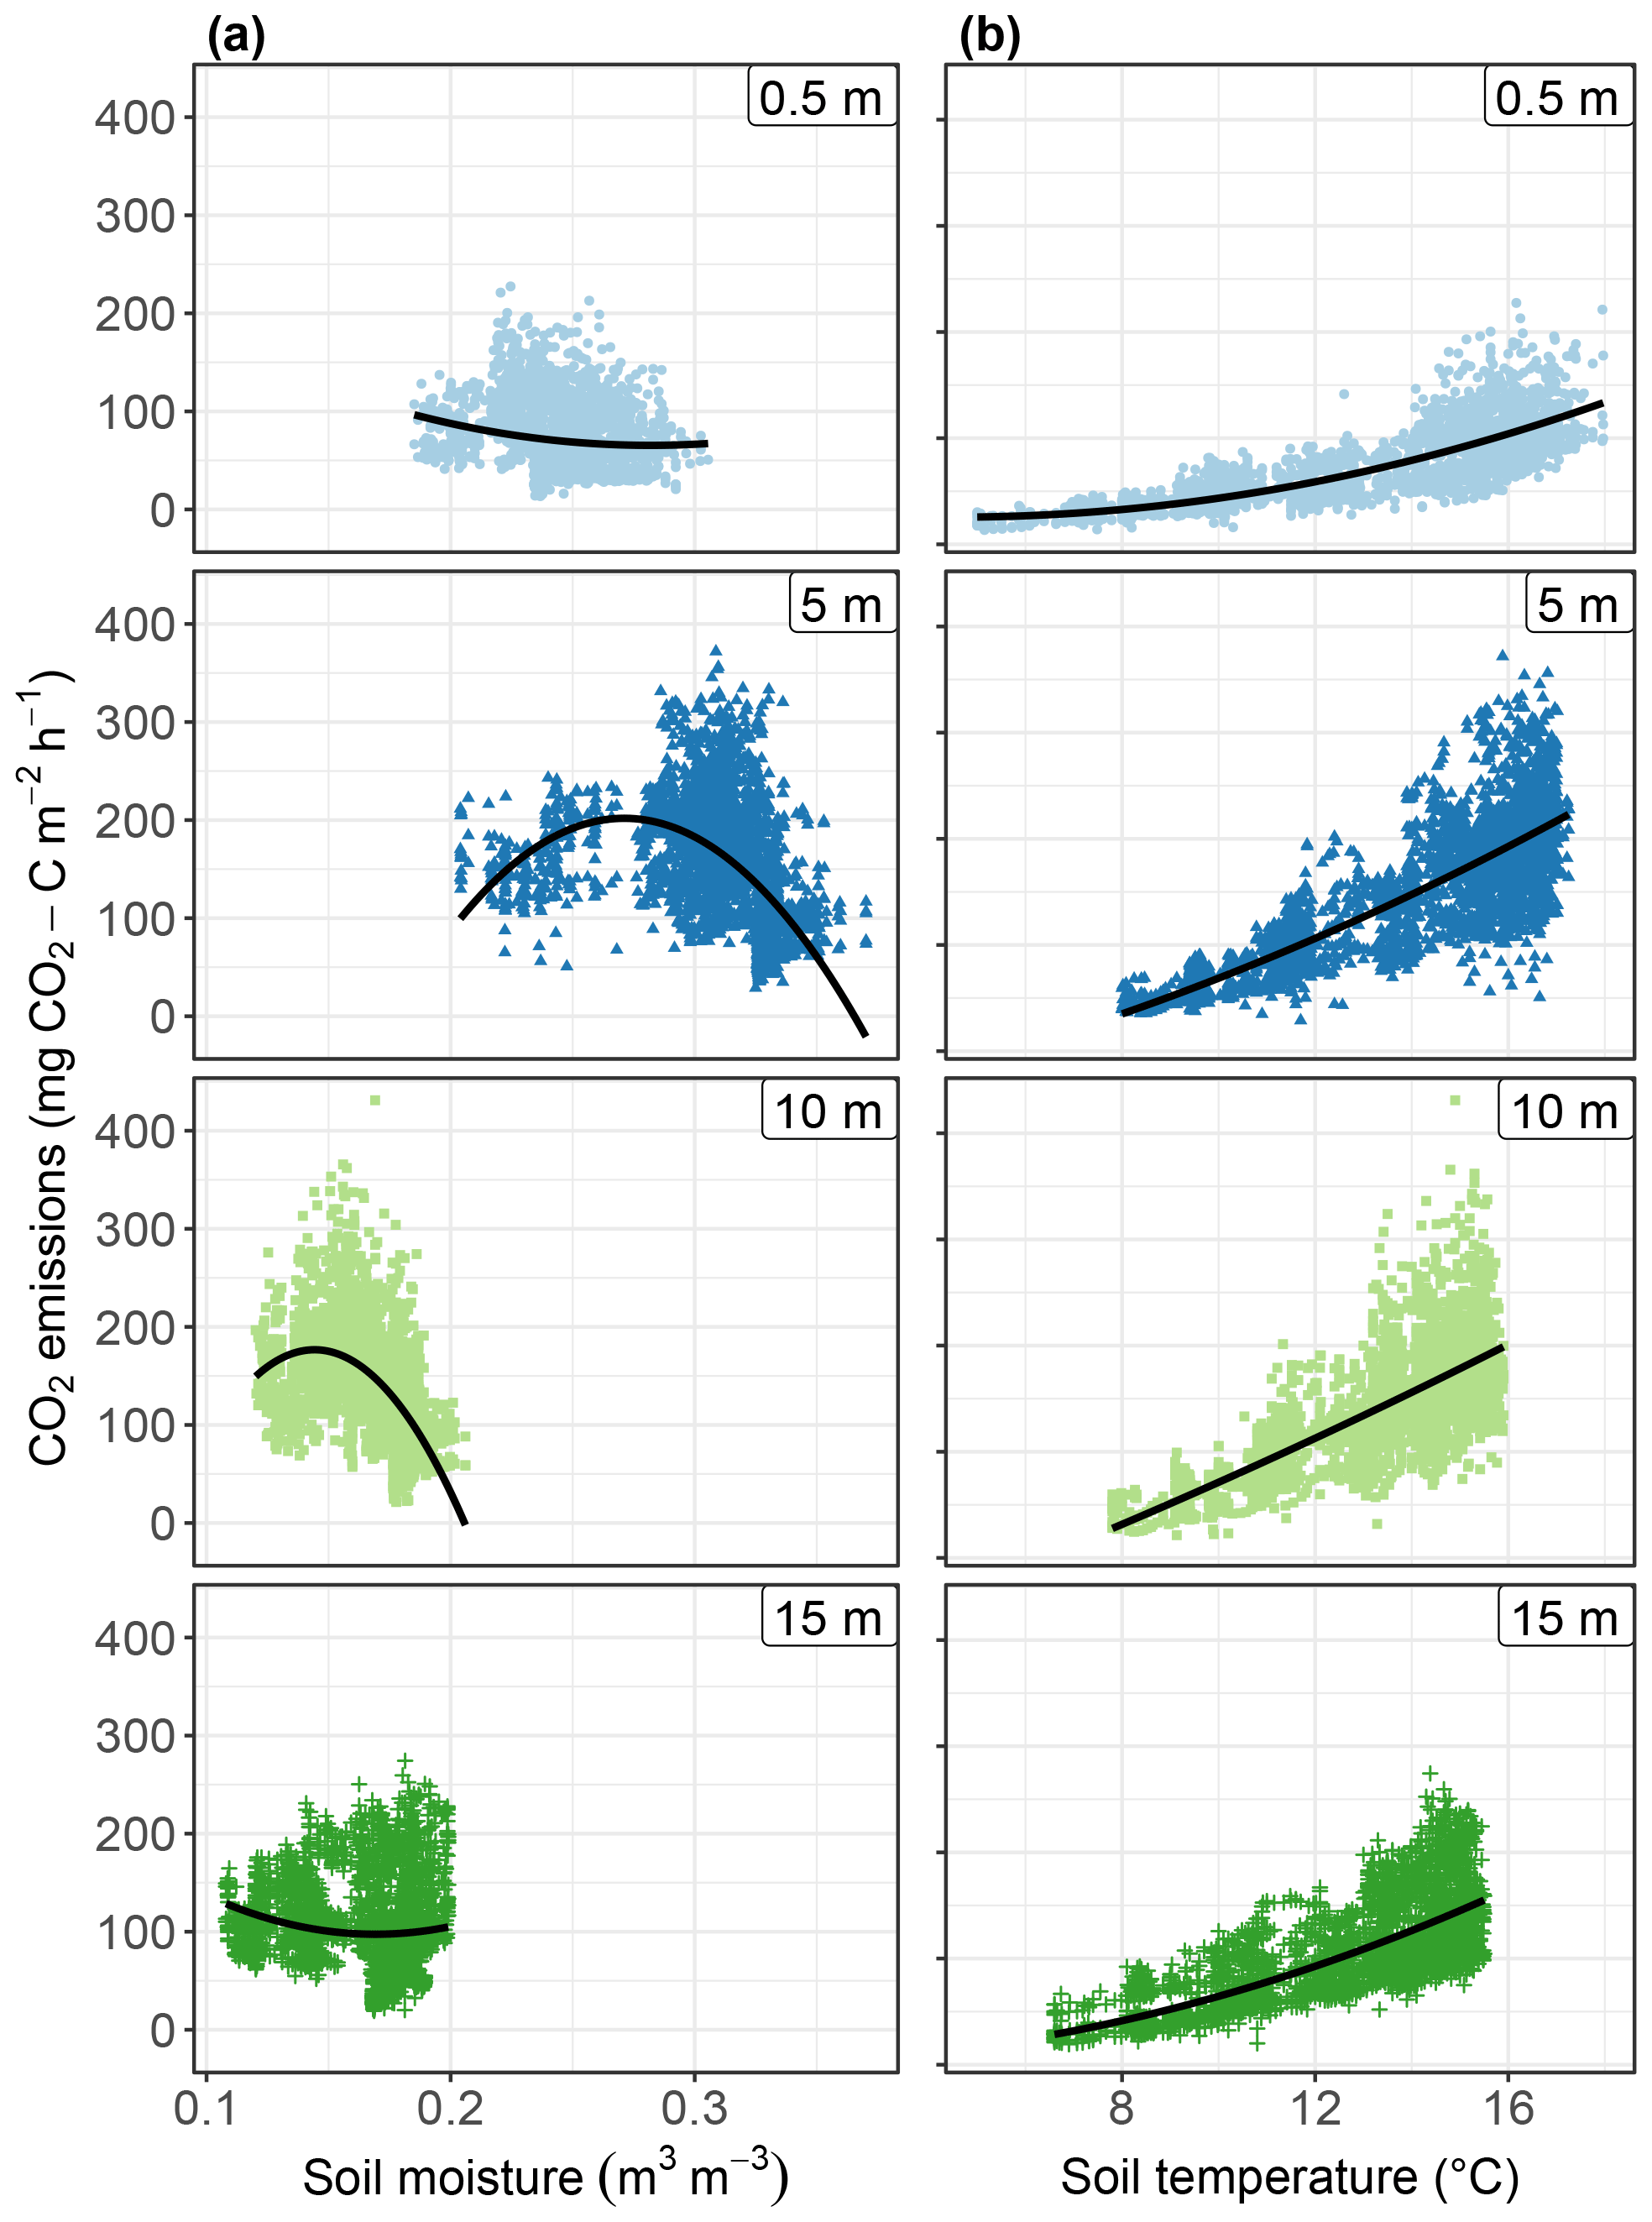
Figure 2Relationship between soil CO2 emissions (mg CO2-C m−2 h−1) and (a) soil moisture (m3 m−3), and (b) soil temperature (∘C) by distance from the stream (0.5, 5, 10, 15 m). Flat locations are indicated in blue (0.5 and 5 m) and sloped locations in green (10 and 15 m). The fitted lines show the linear regression on geometrically distributed data using the “geom_smooth” function (method = “lm”) from ggplot2. The R2 for these regressions are shown in Table 2.
Both model results showed a significant negative correlation between soil CO2 emissions and soil moisture (p<0.001, Table 2). This pattern was more distinct looking at the CGs at the different distances (Fig. 2a). A significant positive correlation between CO2 emissions and soil temperature was found (p<0.001, Table 2, Fig. 2b). The interaction between soil moisture and soil temperature, namely soil moisture decreasing with increasing soil temperature, was shown to correlate negatively with CO2 emissions (p<0.001, Table 2). According to “inclination” model results, CO2 emissions also decreased with increasing soil pH when comparing flat to sloped locations (p<0.01, Table 2).
Table 3LMM results exploring the relationship between inclination (flat compared to sloped) or distance (m), soil moisture (m3 m−3), soil temperature (∘C), soil moisture : soil temperature interaction, litter weight (g), and soil C content effects on soil CH4 uptake (µg CH4-C m−2 h−1). Litter weight and soil C content are included because the LMM models including these variables had AIC values statistically smaller than the null model. R2m indicates marginal R2, and R2c indicates conditional R2 values. p values are coded as , , , and .

3.2 Soil CH4 uptake
The soil showed an average CH4 uptake of 88.5 ± 58.0 µg CH4-C m−2 h−1, with uptake 180 % higher in sloped as compared to flat locations (126.9 ± 51.3 and 45.0 ± 25.3 µg CH4-C m−2 h−1, respectively; Fig. 1b). Average CH4 uptake increased by approximately 40 µg CH4-C m−2 h−1 for every 5 m from the stream (Fig. 1b). However, the “inclination” model showed only marginally significant differences between the CH4 uptake at flat and sloped locations (p<0.1, Table 3). Litter weight was positively correlated with the CH4 uptake at flat and sloped locations (p<0.001). The “distance” model showed a significant difference between the locations at the stream (CG0.5) and furthest away (CG15; p<0.001, Table 3) and a positive correlation between soil C content and CH4 uptake at all CGs (p<0.01, Table 3).
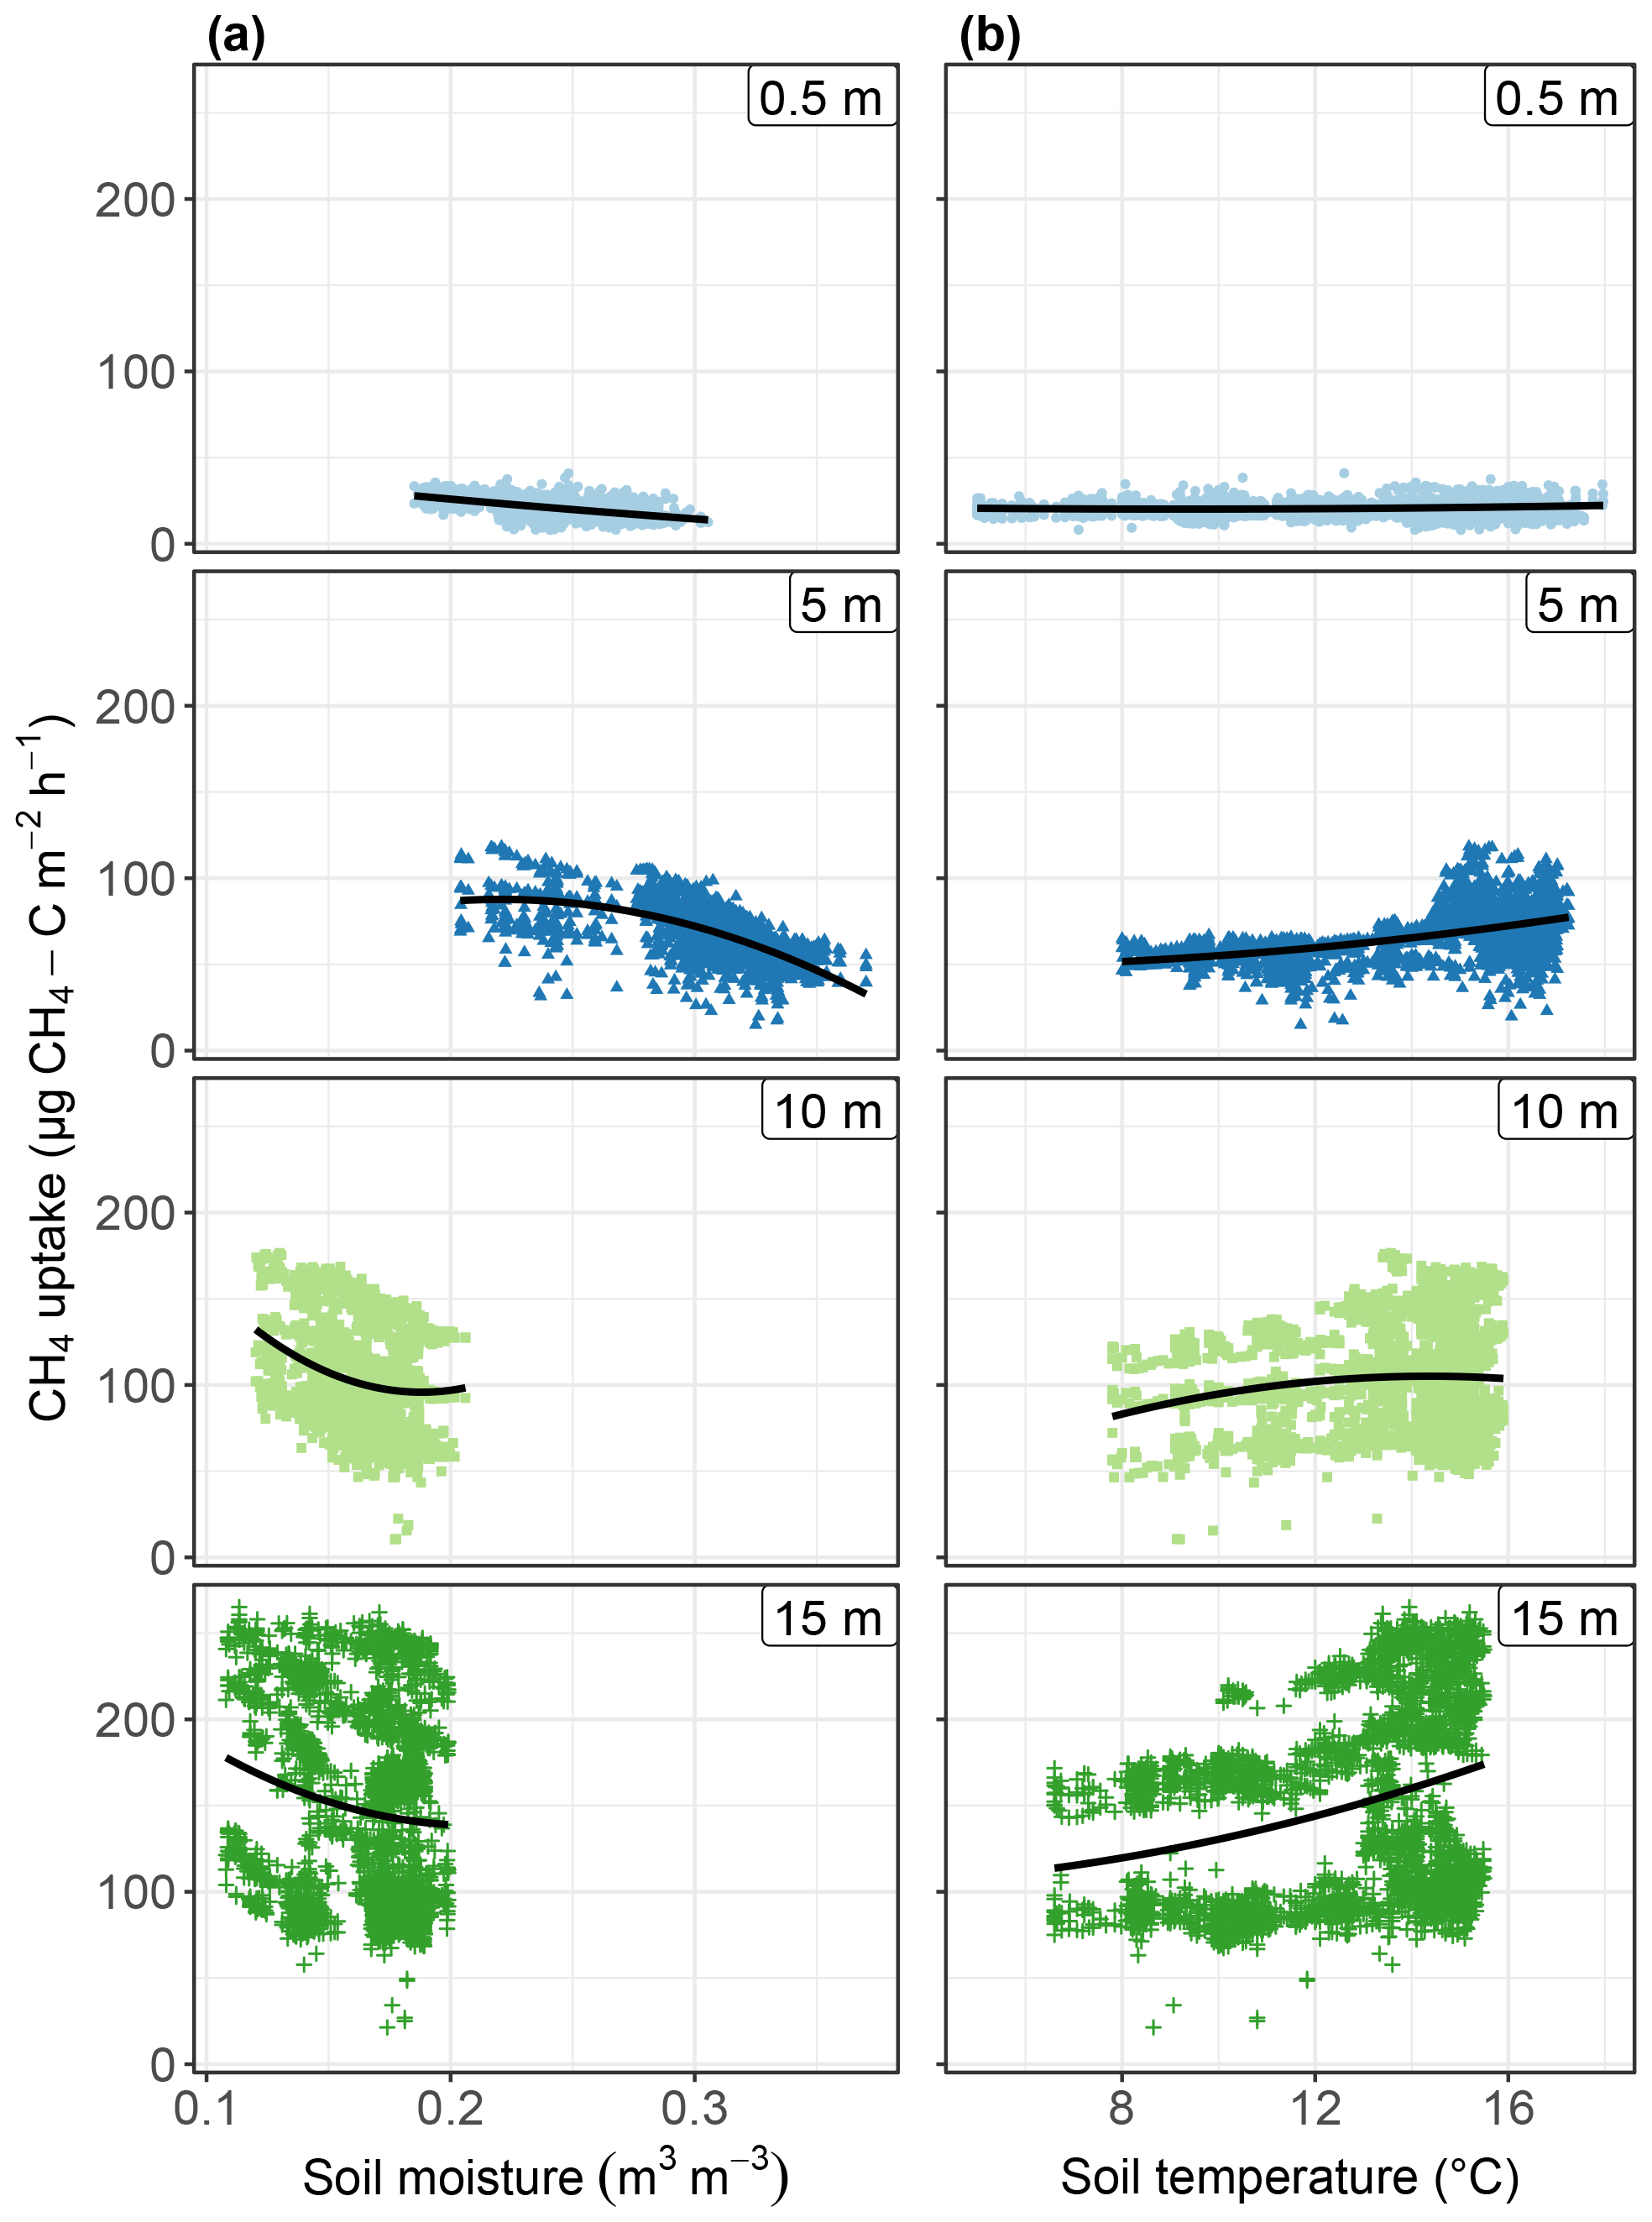
Figure 3Relationship between CH4 uptake (µg CH4-C m−2 h−1) and (a) soil moisture (m3 m−3) and (b) soil temperature (∘C) by distance from the stream (0.5, 5, 10, 15 m). Flat locations are indicated in blue (0.5 and 5 m) and sloped locations in green (10 and 15 m). The fitted lines show the linear regression on geometrically distributed data using the “geom_smooth” function (method = “lm”) from ggplot2. The R2 for these regressions are shown in Table 3.
Both “inclination” and “distance” model results show a significant positive correlation between soil moisture and CH4 uptake (p<0.001) and a significant negative correlation between soil temperature and CH4 uptake (p<0.001, Table 3). These patterns could, however, not be confirmed visually (Fig. 3). Like for CO2 emissions, the soil moisture : soil temperature interaction, namely soil moisture decreasing with increasing soil temperature, was significant (p<0.001, Table 3). According to the “inclination” model results, litter weight was positively correlated with the CH4 uptake at flat and sloped locations (p<0.001). The “distance” model showed that higher soil C content resulted in a higher CH4 uptake at all CGs (p<0.01, Table 3).
3.3 Soil N2 O flux
The soil had an average N2O emission of 5.9 ± 6.3 µg N2O-N m−2 h−1, with flat locations having 120 % higher fluxes than sloped (8.4 ± 7.2 and 3.8 ± 4.5 µg N2O-N m−2 h−1, respectively; Fig. 1c). The “inclination” model results showed significantly decreasing N2O emissions on sloped locations compared to flat locations (p<0.05, Table 3). This was supported by the “distance” model results, with significantly decreasing emissions from CG0.5 towards CG15 (Fig. 1c, Table 4).
Table 4LMM results exploring the relationship between inclination (flat compared to sloped) or distance (m), soil moisture (m3 m−3), soil temperature (∘C), soil moisture : soil temperature interaction, and litter depth (cm) on soil N2O emissions (µg N2O-N m−2 h−1). Litter depth is included because the LMM model including this variable had an AIC value statistically smaller than the null model. R2m indicates marginal R2, and R2c indicates conditional R2 values. p values are coded as , , and .
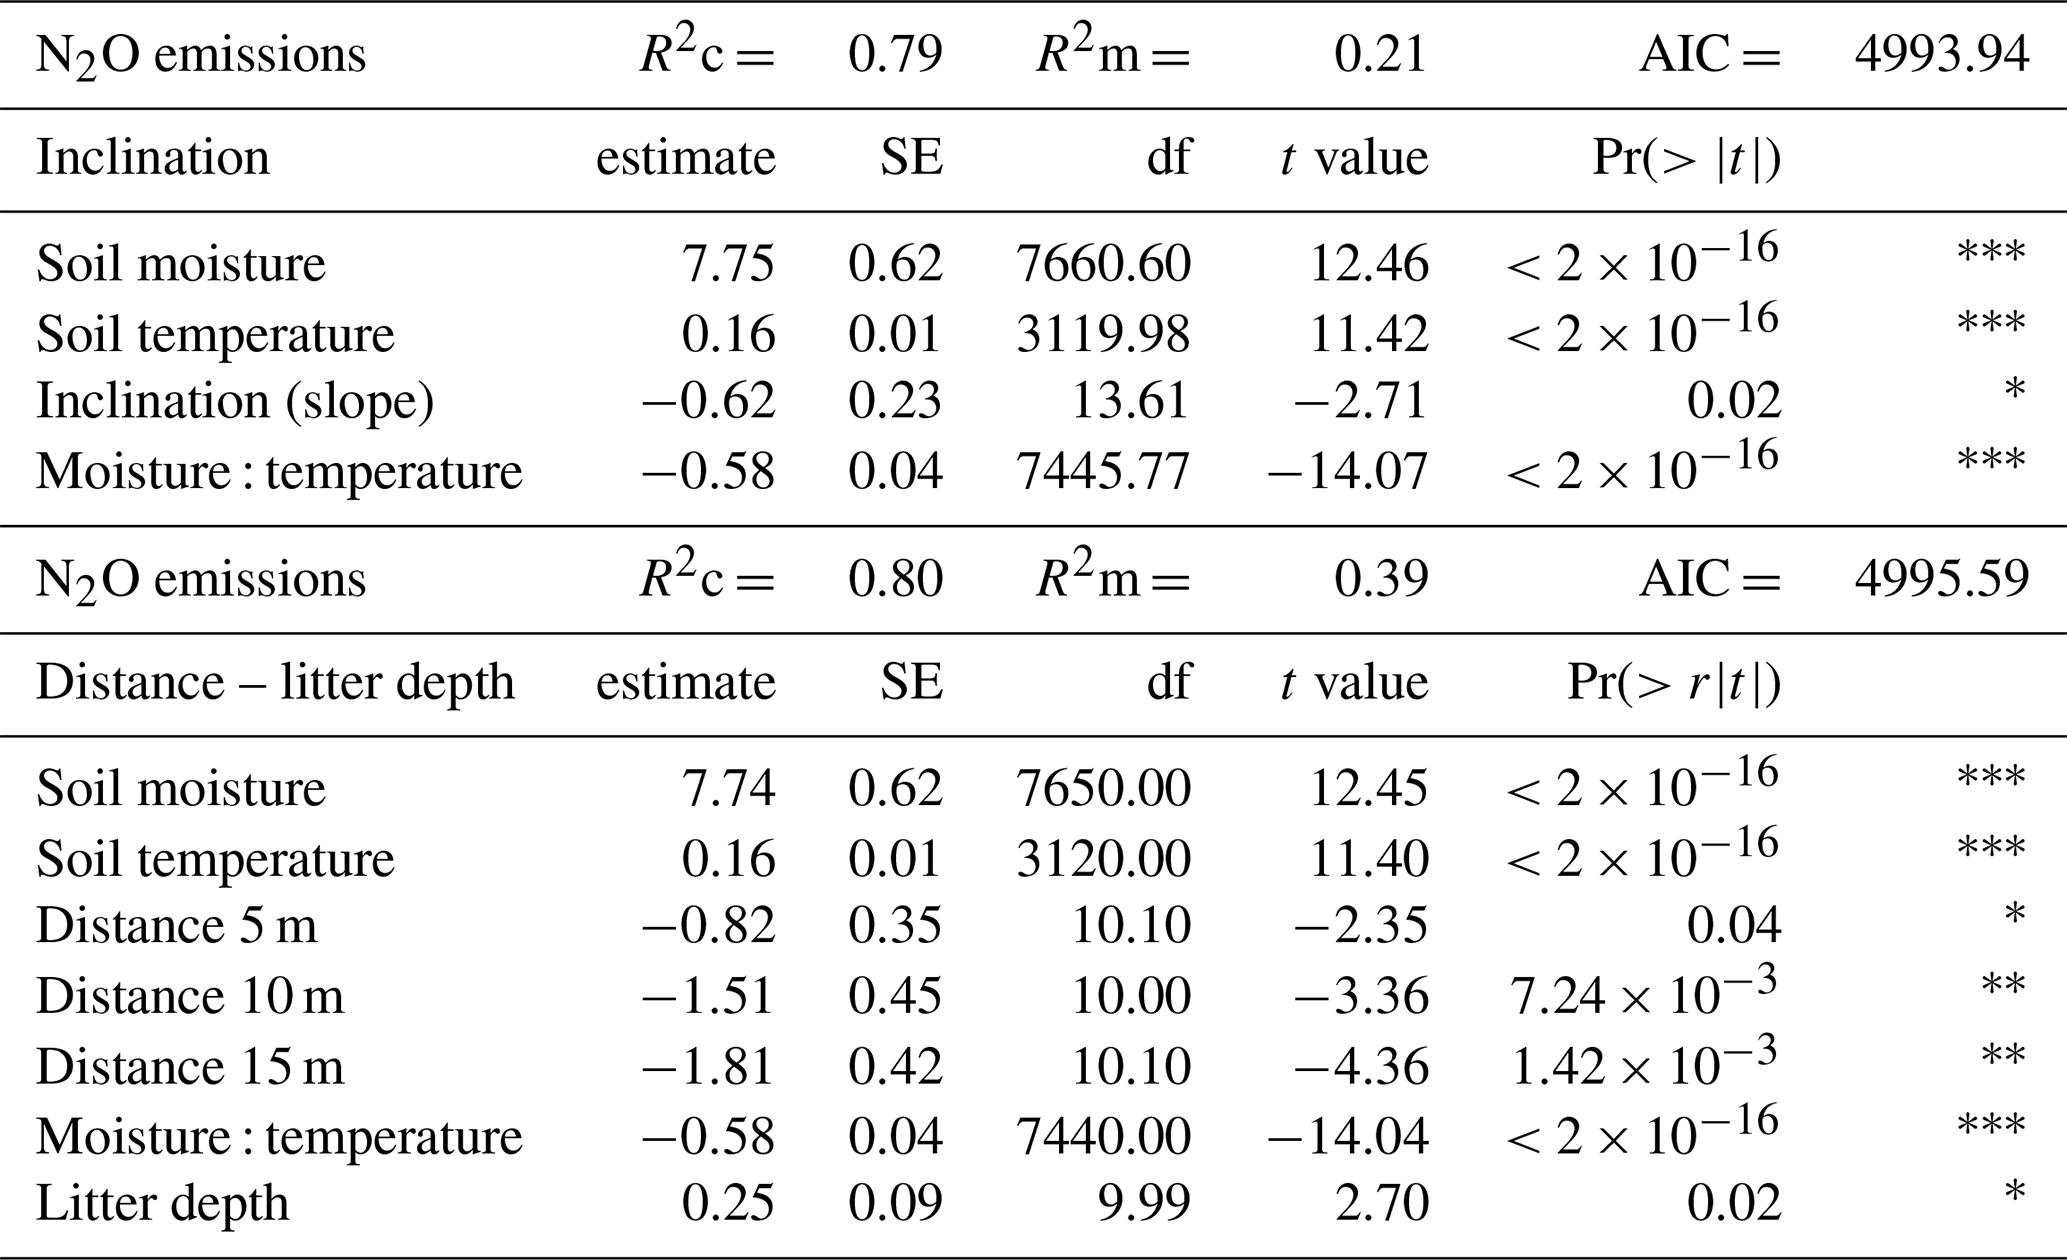
We found significant positive correlations between N2O emissions and both soil moisture and soil temperature in both the “inclination” and “distance” model (p<0.001, Table 3). The correlation between N2O emissions and soil moisture appeared bell-curved at CG5 and CG10 (Fig. 4a). The correlation between N2O emissions and soil temperature appeared bell-curved at CG10 (Fig. 4b). As for CO2 and CH4 fluxes, the soil moisture : soil temperature interaction resulted in significantly decreasing N2O emissions across all CGs and both the flat and sloped locations. Similar to the “inclination” model results for CH4 uptake, the N2O “distance” model showed that a higher litter depth resulted in increasing N2O emissions at all CGs (p<0.05).
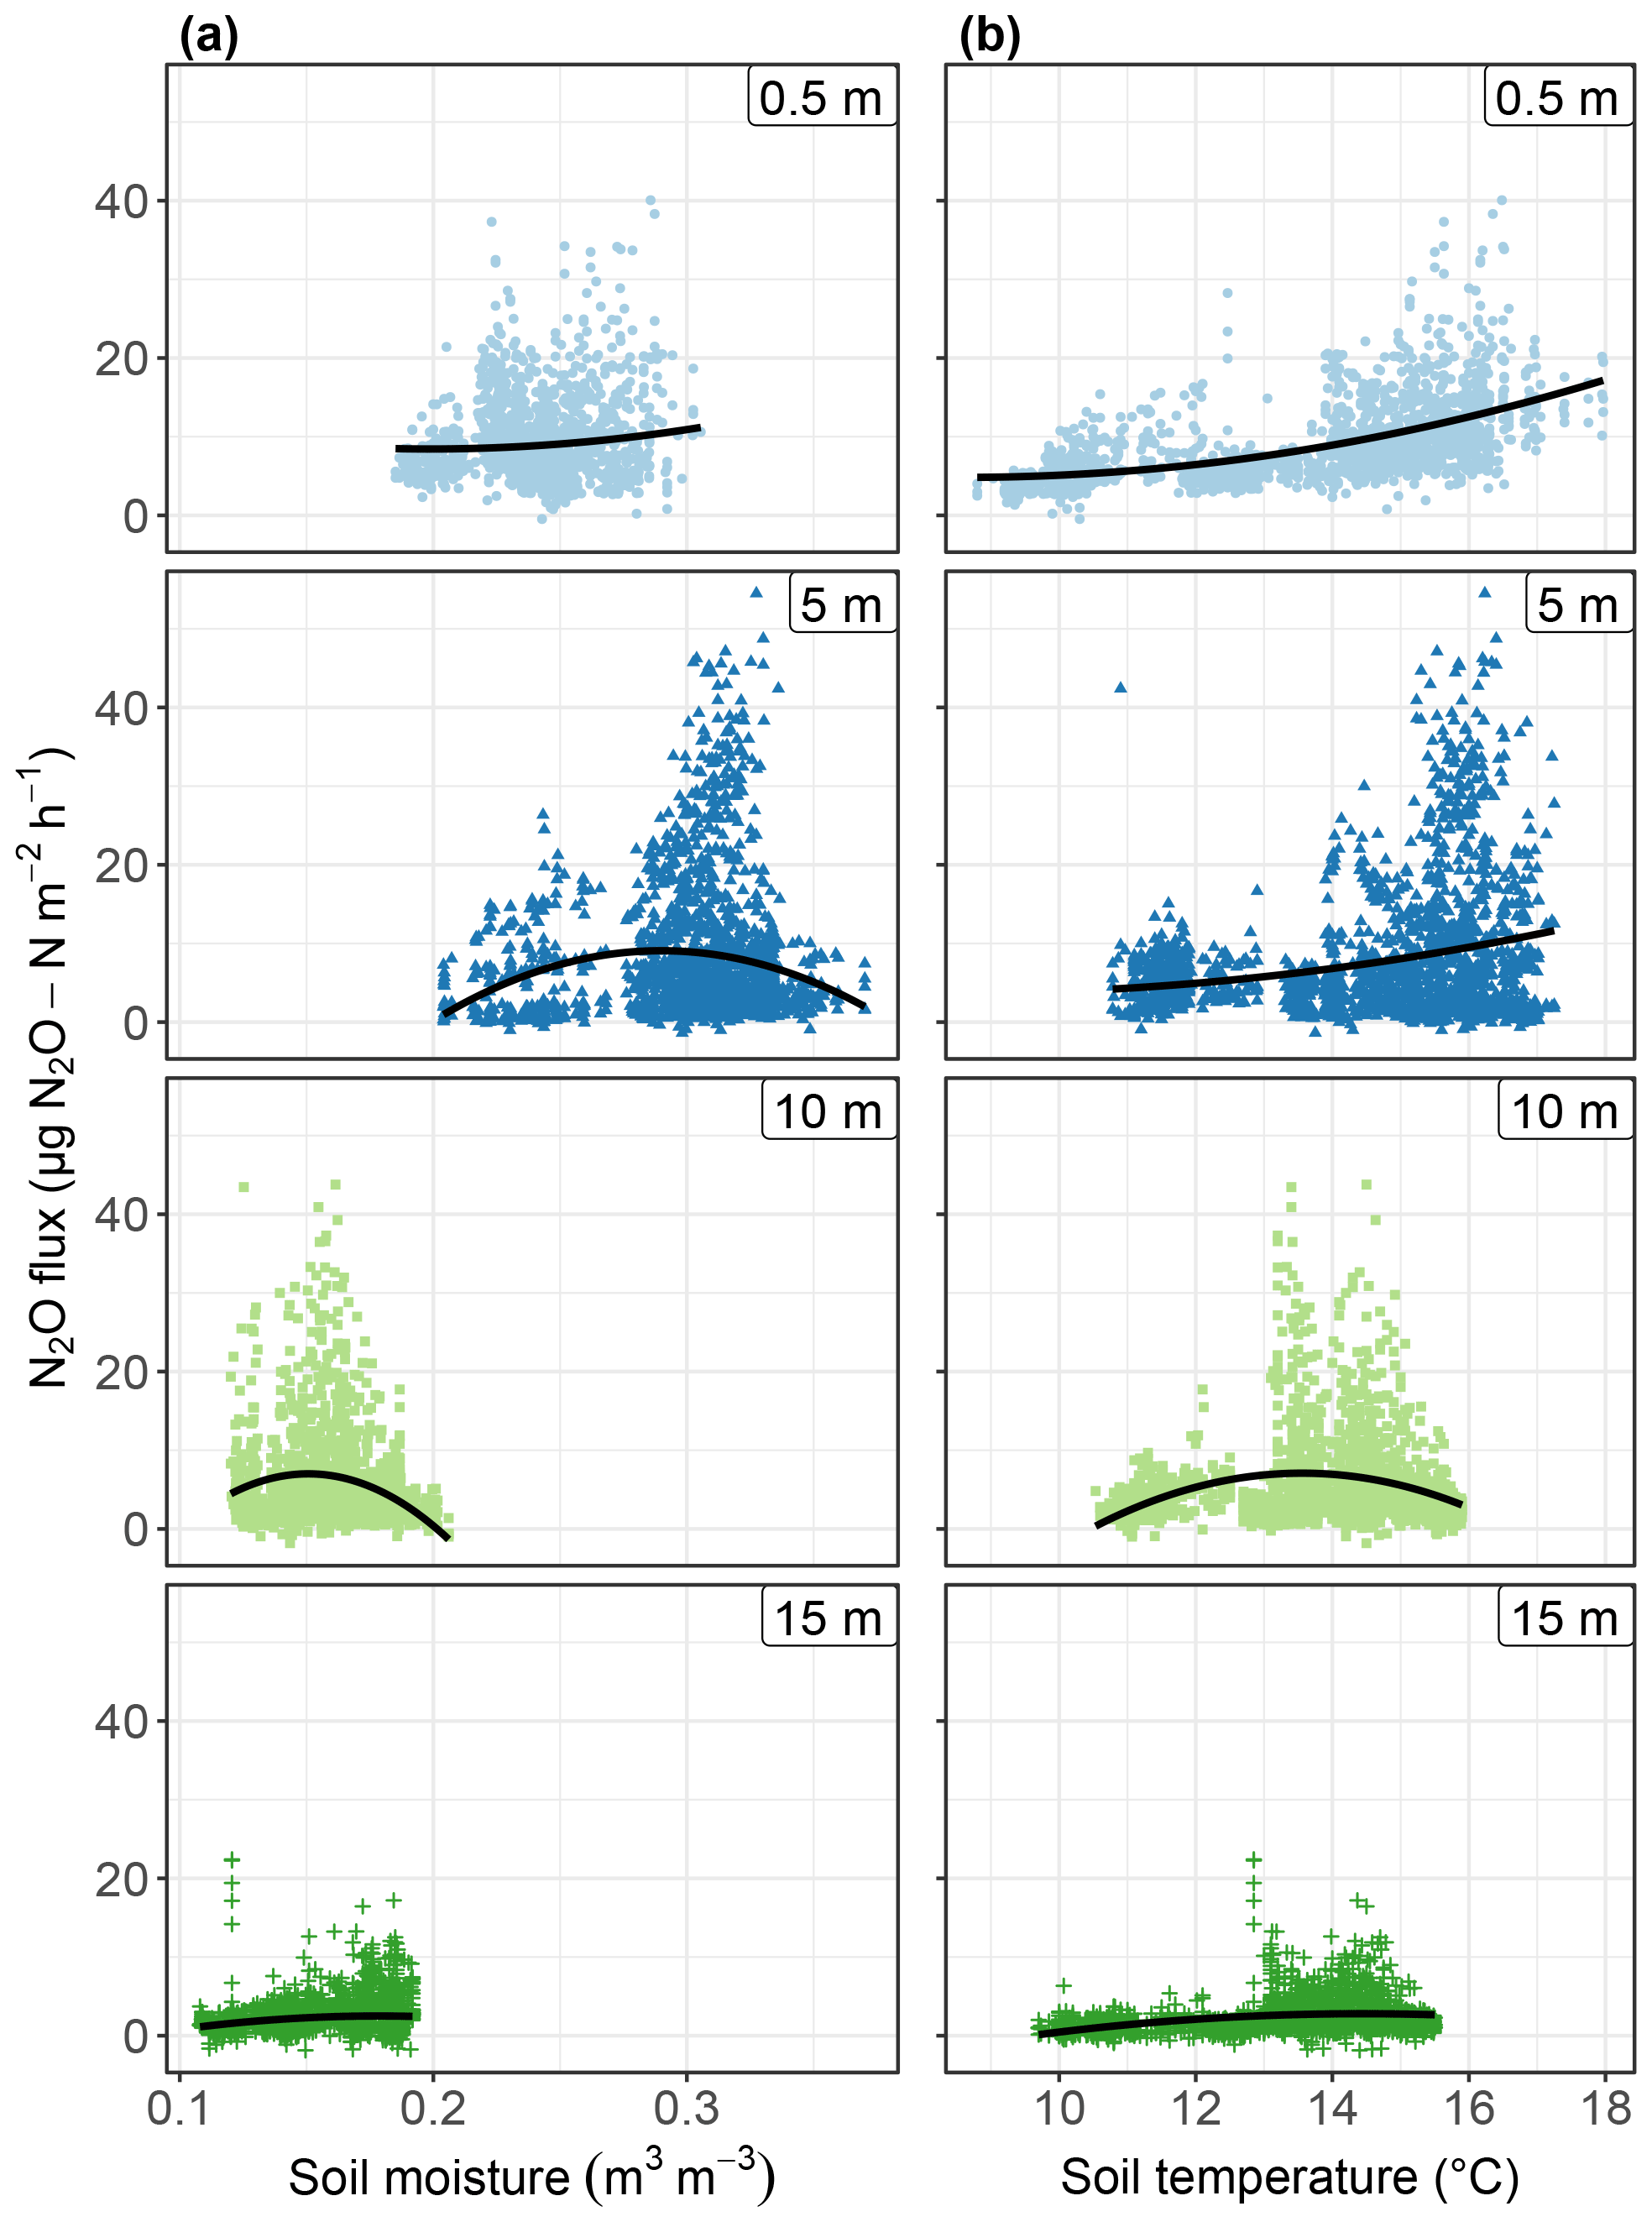
Figure 4Relationship between N2O fluxes (µg N2O-N m−2 h−1) and (a) soil moisture (m3 m−3) and (b) soil temperature (∘C) by distance from the stream (0.5, 5, 10, 15 m). Flat locations are indicated in blue (0.5 and 5 m) and sloped locations in green (10 and 15 m). The fitted lines show the linear regression on geometrically distributed data using the “geom_smooth” function (method = “lm”) from ggplot2. The R2 for these regressions are shown in Table 4.
Over the 85 d measurement period, we detected episodes of N2O uptake in 11 chambers. The measured uptake rates averaged 0.51 ± 0.48 µg N2O-N m−2 h−1. N2O uptake occurred predominantly in sloped locations (number of observations: 65 sloped, 16 flat), notably at CG15 (50 observations; Fig. 1d), and predominantly later in the measurement period (September to November).
4.1 Soil CO2 emissions
The soil CO2 emissions estimated in this study are similar to those from studies in nearby forests, with 115.7 and 113.0 mg CO2-C m−2 h−1 emitted in Rosalia (Leitner et al., 2016) and in Schottenwald, near Vienna, respectively (Hahn et al., 2000). The values we measured are only slightly lower than the average soil CO2 emission from 18 different forest ecosystems amongst Europe (Janssens et al., 2001). However, other studies in comparable beech and spruce stands in France (Epron et al., 1999) and Germany have found values up to 50 % lower (Luo et al., 2012). Apart from differences in measurement methods and seasons, it is very likely that most of the differences can be explained by variations in soil moisture (e.g. Hanson et al., 1993) and temperature (e.g. Lloyd and Taylor, 1994), as discussed in the following section.
4.2 Effect of inclination and distance from a stream on soil CO2 emissions
Model results showed a significant negative effect of inclination, with lower soil CO2 emissions on sloped locations. This is contrary to our first hypothesis and to the findings of studies from temperate and boreal forests in North America (Creed et al., 2013; Warner et al., 2018), where soil CO2 emissions were highest in sloped locations compared to ridge and flat locations, while a subtropical forest in Puerto Rico showed only a weak relation between CO2 fluxes and topographic variation (Quebbeman et al., 2022). However, our results suggest that higher CO2 emissions at flat locations were mainly driven by CG5, where we observed the highest CO2 emissions. Being at the foot of the slope, CG5 likely received large water and nutrient inputs from the steep slope as compared to the other distances and had optimal conditions for soil microbial activity. A soil texture favourable to microbial activity (enough clay to retain moisture and enough sand to allow sufficient volatile substrate and O2 access) could lead to such a peak, but the clay content was not significantly different between CG0.5, CG5, and CG15 nor was the sand significantly different at any distance. The effect of soil moisture on CO2 emissions was different across the CGs: at CG10, where we recorded the second-highest emissions, soil moisture was as low as at CG15. It is possible that the high porosity at CG10 enabled easier diffusion of CO2 from the soil matrix to the atmosphere. However, even though we found the highest emissions at the wettest CG, our overall results showed higher CO2 emissions with decreasing soil moisture, probably due to the negative correlation between soil moisture and soil temperature. Indeed, the strong interaction between soil moisture and soil temperature, seen in the model results for all three gases, restricts our ability to draw firm conclusions for these variables individually. Consistent over all CGs, we found that CO2 emissions increased with increasing soil temperature, in agreement with findings from, e.g. temperate Norway spruce and beech forests in Europe (Epron et al., 1999; Hahn et al., 2000; Buchmann, 2000; Luo et al., 2012), where most temporal variations in the soil CO2 flux could be explained by soil temperature. The spatial variability of soil moisture and soil temperature itself may be an effect of a different slope, its exposition, and the direction from where the rain comes. This influences the amount of rain reaching the soil surface and the evapotranspiration of the forest, which results in a differing water balance. Compared to sites in North America (Creed et al., 2013; Warner et al., 2018) and Germany (Buchmann, 2000), and considering the exposition of the slope, our site is likely drier.
We suggest that the effect of inclination and distance from the stream were closely interacting with indirect effects on soil properties and resulted in different soil CO2 emissions than we expected, notably at CG5. For example, CO2 emissions were significantly lower at CG0.5 than all other CGs, and soil pH was the highest at this distance, probably due to the close proximity to the forest stream with a higher pH value or root-mediated changes in the pH (Hinsinger et al., 2003; Fürst et al., 2021). Higher soil pH (>5) can increase soil CO2 fluxes by stimulating autotrophic respiration from living roots and heterotrophic respiration from soil microorganisms (Reth et al., 2005; Aciego Pietri and Brookes, 2008). However, our model results suggest increasing CO2 emissions with low soil pH values. We suggest that this is due to the chemistry in the soil, namely the dominating carbonate species (Finke, personal communication, 2022). At a low soil pH, carbonic acid (H2CO3) dominates carbonate (CO and carbonic acid may release CO2. At high pH, carbonate dominates, which can hinder CO2 emissions. We encourage researchers to analyse their sites covering a wider range of microbial communities, roots, and soil nutrients, which might give further insight into whether soil pH directly or indirectly influences soil CO2 emissions on a topological and moisture gradient. Overall, inclination likely had an indirect effect on the CO2 emissions at our study site through its influence on soil moisture and soil properties at the base of the slope (GC5), where the highest emissions were measured.
4.3 CH4 uptake
The soil CH4 uptake at our site was considerably higher than values reported from other studies in the same forest (Leitner et al., 2016), in forests near Vienna (Hahn et al., 2000), and in Germany (Born et al., 1990; Brumme and Borken, 1999). These differing values support the findings in forest ecosystems across northern Europe, where temperate forest soils showed CH4 uptake rates with a widely varying range of 1–165 µg CH4-C m−2 h−1 (Smith et al., 2000). The uptake at our sloped locations (126.9 ± 51.3 µg CH4-C m−2 h−1) falls on the upper end of this range. Different measurement methods, involving the use of manual chambers and gas chromatography in nearby plots (see Leitner et al., 2016) compared to the automated chambers and laser-based gas analysers in our study, could explain the dissimilar values obtained in the same forest ecosystem. In addition, the measurement period of this study did not cover the entire year, which may give rise to the differences between this study and previous studies conducted at the same site. As for soil CO2 emissions, spatial variability resulting from the exposition of the slope, and the differences in soil moisture and soil temperature, might be other reasons for our high values. Because the soils at our site are relatively dry, this might have favoured the uptake of soil CH4.
4.4 Effect of inclination and distance from the stream on soil CH4 uptake
Opposite to our second hypothesis, soil CH4 uptake was not significantly correlated with inclination. This is also the opposite of the findings of other studies that did find an inclination effect. However, the studies are not in agreement as to where uptake is higher: in a subtropical forest in Puerto Rico, higher CH4 uptake on ridges was found as compared to in valleys (Quebbeman et al., 2022); in a temperate forest in Maryland, USA, CH4 uptake was higher in transition zones than uplands and valley bottoms were occasionally large net sources (Warner et al., 2018); and in a tropical forest in China, hillslopes were found to be hotspots for CH4 uptake, while the slope foot and groundwater discharge zone contributed less (Yu et al., 2021). Nonetheless, soil CH4 uptake was significantly higher at CG15 compared to CG0.5, suggesting that the distance from the stream did have an effect on CH4 uptake; the two other distances were potentially not far enough from the stream for them to have a significant effect on the soil moisture, soil temperature, and soil parameters that would lead to an effect on the CH4 uptake. With significant positive correlations between both litter weight and soil C content with CH4 uptake, we suggest that soil C content and litter regulated CH4 uptake over distance. In agreement with our findings, Warner et al. (2018) found higher CH4 uptake on locations with high C content in a temperate forest landscape in Maryland, USA. Litter can hinder precipitation water from easily entering the soil (Walkiewicz et al., 2021). Since there was more litter on sloped than on flat locations, the litter could have stored the rainfall water, thus keeping the mineral soils underneath drier at sloped locations, as has been reported in other studies (Borken and Beese, 2006; Wang et al., 2013). We therefore suggest that inclination modulated the soil CH4 uptake through its influence on weight and depth of the litter layer, and that inclination per se was not the main driver of CH4 uptake at our site. Instead, the weight and depth of the litter layer and the soil C content had the largest effect on the CH4 uptake.
In our study, both models showed higher CH4 uptake rates with increasing soil moisture and decreasing soil temperature. This not only contradicts findings from other forests (e.g. Adamsen and King, 1993; Castro et al., 1995); it also cannot be distinguished visually (Fig. 3). It is possible that our models produced ambiguous results for soil moisture and temperature because they were unavoidably associated in our studied in situ system; both variables are influenced by inclination and distance from a stream concurrently, and this thus limits our ability to draw firm conclusions about either variable separately. Running an LMM with one variable or the other did not help resolve this ambiguity. A long-term study in a German forest also found that soil moisture and soil temperature only weakly correlated with CH4 uptake and was not able to find a suitable empirical model for CH4 (Luo et al., 2012). The lack of clear relationships between soil moisture and soil temperature with CH4 uptake confirms that litter and soil C content were the best predictors of CH4 uptake at our site.
4.5 Soil N2O fluxes
The soil N2O emissions from our site were very similar to the rates reported 200 m further upslope from this study (Leitner et al., 2016) and in deciduous forests near Vienna (Pilegaard et al., 2006), with values between 5.4 and 6.4 µg N2O-N m−2 h−1, respectively. They are also comparable to the average N2O emissions from soils in seven European coniferous forests (Pilegaard et al., 2006) but lower than N2O emission estimates in forests subjected to high N deposition rates in Europe (Hahn et al., 2000; Luo et al., 2012; Gundersen et al., 2012), suggesting that N deposition was not a significant driver for the N2O emissions at our study site. In addition to data on low N2O emissions, we provide a new dataset from a temperate upland forest soil with reliable N2O uptake measurements, highlighting the possibility of upland forest soils acting as N2O sink (Wrage et al., 2004; Savage et al., 2014). With the GasFluxTrailer being a robust, state-of-the-art instrument and with a total of 7670 N2O flux observations, 81 of which indicating uptake, we are confident that the N2O uptake we measured is not instrumental noise (see Cowan et al., 2014).
4.6 Effect of inclination and distance from the stream on soil N2O emissions
In agreement with our third hypothesis, N2O emissions were significantly lower in sloped locations with lower soil moisture content, which was also found by other forest soil studies in France (Vilain et al., 2012), Kenya (Arias-Navarro et al., 2017), Australia (Butterbach-Bahl et al., 2004), and Ecuador (Lamprea Pineda et al., 2021); however, this is the opposite of the findings in forests in China (Yu et al., 2021) and in Puerto Rico (Quebbeman et al., 2022). Furthermore, N2O emissions in flat positions increased with increasing soil temperature. Our findings therefore could support the hypothesis that inclination influences N2O emissions from temperate upland forest soils. However, this soil temperature effect should be interpreted with caution considering significant concurrent soil moisture : soil temperature interaction, which could influence the significance of individual effects. N2O emissions further decreased significantly with increasing distance from the stream. The decrease in N2O emissions from CG0.5 to CG15 might also be a consequence of the higher litter depth at these distances. The quantity and quality of the litter input has been shown to influence N2O emissions from forests (Ambus et al., 2006; Pilegaard et al., 2006; Walkiewicz et al., 2021), especially when coniferous needle litter is compared with deciduous leaf litter. Moreover, tree species have been found to exert a strong control on N cycling in forests (Lovett et al., 2004). We suggest that the thick, mostly deciduous leaf litter layer provided a physical barrier that hindered rainfall water from easily reaching the soil matrix and thus affected N2O emissions indirectly by reducing soil moisture, which is in line with what we suggested for the CH4 uptake. Our conclusions, however, are not consistent with a study conducted at another site in Rosalia, where removal of litter led to lowered N2O emissions (Leitner et al., 2016). This site was, however, a pure mature beech stand. Because it is unclear how much of the total soil N2O emissions resulted from the litter layer, we suggest that further studies repeat litter removal versus control experiments in order to quantify the magnitude of N2O emissions resulting from litter. We propose that for our site, a large fraction of the N remained stored in the litter layer and was not released as N2O (Eickenscheidt and Brumme, 2013).
With the state-of-the-art technology used in this study, our dataset allows for a detailed look at the influence of inclination, distance from a stream, soil moisture, soil temperature, and other soil and litter properties on soil CO2, CH4, and N2O fluxes in a temperate upland forest in eastern Austria. Our study provides evidence of the complex interactions between inclination and distance from a stream, as well as the resulting small-scale changes in soil and litter properties within an upland forest ecosystem. We suggest that soil CO2 emissions were likely indirectly affected by inclination through its influence on soil moisture and soil properties. Contrary to our expectations, soil CO2 emissions were lower in sloped locations where soil moisture content was lower. Our study site was a large CH4 sink over the whole measurement period, with higher soil CH4 uptake rates at the locations furthest away from the stream. Because inclination was not significantly related to the uptake of CH4, we suggest that it was not a direct driver of CH4 uptake at our site. Instead of soil moisture, which is commonly cited as the main driver of CH4 fluxes, we found that soil C content and litter depth and weight were likely the main drivers of CH4 uptake. Our study showed a clear, significant influence of inclination and distance from the stream on soil N2O emissions from a temperate upland forest ecosystem, which was to some extent regulated by litter depth. We showed that the impact of inclination and distance from the stream on GHG fluxes is driven by multiple direct and indirect effects, highlighting the need to consider small-scale differences as controlling factors in future GHG flux studies to improve future GHG balance predictions in forest ecosystems.
The code can be provided upon request.
The gas flux data, soil, and litter parameter data and meteorological data used in this study are open access and available at https://b2share.eudat.eu/records/3900981a45684bfea5d648eb744622d3 (last access: 4 September 2023, Gillespie et al., 2023).
The supplement related to this article is available online at: https://doi.org/10.5194/soil-9-517-2023-supplement.
EDP designed the experiment and collected and pre-processed the data. LMG and NYT analysed the data, assisted by DA, PF, and EDP. LMG conducted the final statistics and finalised the figures. NYT and LMG wrote the text with extensive comments from EDP. DA, PF, SG, and SZB edited the text. EDP, SZB, and SG were responsible for infrastructure development in the LTER-CWN project. SZB and SG were responsible for funding acquisition.
The contact author has declared that none of the authors has any competing interests.
Publisher’s note: Copernicus Publications remains neutral with regard to jurisdictional claims in published maps and institutional affiliations.
We would like to thank the BOKU forest demonstration centre and its head Josef Gasch for providing access to the research area. Assistance from Thomas Kager and Christian Holtermann during installation and field measurements and from Astrid Hobel for the laboratory measurements was highly appreciated.
This research has been supported by the Österreichische Forschungsförderungsgesellschaft (LTER-CWN: Long-Term Ecosystem Research Infrastructure for Carbon, Water and Nitrogen, grant no. 858024), the Klima- und Energiefonds (Austrian Climate Research Programme 12th Call, grant no. KR19AC0K17557, “EXAFOR”), and the European Commission, Horizon 2020 (H2020 Project eLTER PLUS, grant no. 871128).
This paper was edited by Ember Morrissey and reviewed by two anonymous referees.
Aciego Pietri, J. C. and Brookes, P. C.: Nitrogen mineralisation along a pH gradient of a silty loam UK soil, Soil Biol. Biochem., 40, 797–802, https://doi.org/10.1016/j.soilbio.2007.10.014, 2008.
Adamsen, A. P. S. and King, G. M.: Methane Consumption in Temperate and Subarctic Forest Soils: Rates, Vertical Zonation, and Responses to Water and Nitrogen, Appl. Environ Microbiol., 59, 485–490, https://doi.org/10.1128/aem.59.2.485-490.1993, 1993.
Ambus, P.: Nitrous oxide production by denitrification and nitrification in temperate forest, grassland and agricultural soils, Eur. J. Soil Sci., 49, 495–502, https://doi.org/10.1046/j.1365-2389.1998.4930495.x, 1998.
Ambus, P., Zechmeister-Boltenstern, S., and Butterbach-Bahl, K.: Sources of nitrous oxide emitted from European forest soils, Biogeosciences, 3, 135–145, https://doi.org/10.5194/bg-3-135-2006, 2006.
Arias-Navarro, C., Díaz-Pinés, E., Klatt, S., Brandt, P., Rufino, M. C., Butterbach-Bahl, K., and Verchot, L. V: Spatial variability of soil N2O and CO2 fluxes in different topographic positions in a tropical montane forest in Kenya, J. Geophys. Res.-Biogeo., 122, 514–527, https://doi.org/10.1002/2016JG003667, 2017.
Bates, D., Mächler, M., Bolker, B., and Walker, S.: Fitting Linear Mixed-Effects Models using lme4, J. Stat. Softw., 67, 1–48, 2015.
Borken, W. and Beese, F.: Methane and nitrous oxide fluxes of soils in pure and mixed stands of European beech and Norway spruce, Eur. J. Soil Sci., 57, 617–625, https://doi.org/10.1111/j.1365-2389.2005.00752.x, 2006.
Born, M., Dorr, H., and Levin, I.: Methane consumption in aerated soils of the temperate zone, Tellus B, 42, 2–8, https://doi.org/10.1034/j.1600-0889.1990.00002.x, 1990.
Brumme, R. and Borken, W.: Site variation in methane oxidation as affected by atmospheric deposition and type of temperate forest ecosystem, Global Biogeochem. Cy., 13, 493–501, https://doi.org/10.1029/1998GB900017, 1999.
Buchmann, N.: Biotic and abiotic factors controlling soil respiration rates in Picea abies stands, Soil Biol. Biochem., 32, 1625–1635, https://doi.org/10.1016/S0038-0717(00)00077-8, 2000.
Burt, T. P. and Butcher, D. P.: Topographic controls of soil moisture distributions, J. Soil Sci., 36, 469–486, https://doi.org/10.1111/j.1365-2389.1985.tb00351.x, 1985.
Butler, J., Goetz, H., and Richardson, J. L.: Vegetation and Soil-Landscape Relationships in the North Dakota Badlands, Am. Midland Nat., 116, 378, https://doi.org/10.2307/2425746, 1986.
Butterbach-Bahl, K., Kock, M., Willibald, G., Hewett, B., Buhagiar, S., Papen, H., and Kiese, R.: Temporal variations of fluxes of NO, NO2, N2O, CO2, and CH4 in a tropical rain forest ecosystem, Global Biogeochem. Cy., 18, GB3012, https://doi.org/10.1029/2004GB002243, 2004.
Butterbach-bahl, K., Kiese, R., and Liu, C.: Chapter eighteen – Measurements of Biosphere – Atmosphere Exchange of CH4 in Terrestrial Ecosystems, in: Methods in Enzymology, vol. 495, Elsevier Inc., 271–287, https://doi.org/10.1016/B978-0-12-386905-0.00018-8, 2011.
Butterbach-Bahl, K., Baggs, E. M., Dannenmann, M., Kiese, R., and Zechmeister-Boltenstern, S.: Nitrous oxide emissions from soils: how well do we understand the processes and their controls?, Philos. T. Roy. Soc. B, 368, 20130122, https://doi.org/10.1098/rstb.2013.0122, 2013.
Butterbach-Bahl, K., Diaz-Pines, E., and Dannenmann, M.: Soil Trace Gas Emissions and Climate Change, in: Global Environmental Change, Springer Netherlands, Dordrecht, 325–334, https://doi.org/10.1007/978-94-007-5784-4_ 4, 2014.
Castro, M. S., Steudler, P. A., Melillo, J. M., Aber, J. D., and Bowden, R. D.: Factors controlling atmospheric methane consumption by temperate forest soils, Global Biogeochem. Cy., 9, 1–10, https://doi.org/10.1029/94GB02651, 1995.
Cowan, N. J., Famulari, D., Levy, P. E., Anderson, M., Reay, D. S., and Skiba, U. M.: Investigating uptake of N2O in agricultural soils using a high-precision dynamic chamber method, Atmos. Meas. Tech., 7, 4455–4462, https://doi.org/10.5194/amt-7-4455-2014, 2014.
Creed, I. F., Webster, K. L., Braun, G. L., Bourbonnière, R. A., and Beall, F. D.: Topographically regulated traps of dissolved organic carbon create hotspots of soil carbon dioxide efflux in forests, Biogeochemistry, 112, 149–164, https://doi.org/10.1007/s10533-012-9713-4, 2013.
Cronan, C. S.: Ecosystem Biogeochemistry, Springer International Publishing, Cham, https://doi.org/10.1007/978-3-319-66444-6, 2018.
Davidson, E. A., Keller, M., Erickson, H. E., Verchot, L. V, and Veldkamp, E.: Testing a Conceptual Model of Soil Emissions of Nitrous and Nitric Oxides, Bioscience, 50, 667, https://doi.org/10.1641/0006-3568(2000)050[0667:tacmos]2.0.co;2, 2000.
Davidson, E. A., Savage, K., Verchot, L. V., and Navarro, R.: Minimizing artifacts and biases in chamber-based measurements of soil respiration, Agr. Forest Meteorol., 113, 21–37, https://doi.org/10.1016/S0168-1923(02)00100-4, 2002.
Davidson, E. A., Samanta, S., Caramori, S. S., and Savage, K.: The Dual Arrhenius and Michaelis-Menten kinetics model for decomposition of soil organic matter at hourly to seasonal time scales, Global Change Biol., 18, 371–384, https://doi.org/10.1111/j.1365-2486.2011.02546.x, 2012.
Davidson, EriC. A., Belk, E., and Boone, R. D.: Soil water content and temperature as independent or confounded factors controlling soil respiration in a temperate mixed hardwood forest, Global Change Biol., 4, 217–227, https://doi.org/10.1046/j.1365-2486.1998.00128.x, 1998.
Diaz-Pines, E. and Gasch, J.: Rosalia Lehrforst Austria – Meteorological Data 2001–2020, https://b2share.eudat.eu/records/681966be29a34f3ebc6015ac255ab143, 2021.
Eickenscheidt, N. and Brumme, R.: Contribution of 15N-labelled leaf litter to N turnover, nitrous oxide emissions and N sequestration in a beech forest during eleven years, Plant Soil, 362, 67–77, https://doi.org/10.1007/s11104-012-1245-0, 2013.
Epron, D., Farque, L., Lucot, É., and Badot, P.-M.: Soil CO2 efflux in a beech forest: dependence on soil temperature and soil water content, Ann. For. Sci., 56, 221–226, https://doi.org/10.1051/forest:19990304, 1999.
Fierer, N. and Jackson, R. B.: The diversity and biogeography of soil bacterial communities, P. Natl. Acad. Sci. USA, 103, 626–631, https://doi.org/10.1073/pnas.0507535103, 2006.
Fürst, J., Nachtnebel, H. P., Gasch, J., Nolz, R., Stockinger, M. P., Stumpp, C., and Schulz, K.: Rosalia: an experimental research site to study hydrological processes in a forest catchment, Earth Syst. Sci. Data, 13, 4019–4034, https://doi.org/10.5194/essd-13-4019-2021, 2021.
Gillespie, L. M., Triches, N. Y., Abalos, D., Finke, P., Zechmeister-Boltenstern, S., Glatzel, S., and Diaz-Pines, E.: Soil CO2, CH4 and N2O fluxes, soil and litter parameters and meteorological data from a temperate upland forest along a land inclination gradient [data set], https://b2share.eudat.eu/records/3900981a45684bfea5d648eb744622d3, last access: 4 September 2023, 2023.
Gundersen, P., Christiansen, J. R., Alberti, G., Brüggemann, N., Castaldi, S., Gasche, R., Kitzler, B., Klemedtsson, L., Lobo-do-Vale, R., Moldan, F., Rütting, T., Schleppi, P., Weslien, P., and Zechmeister-Boltenstern, S.: The response of methane and nitrous oxide fluxes to forest change in Europe, Biogeosciences, 9, 3999–4012, https://doi.org/10.5194/bg-9-3999-2012, 2012.
Hahn, M., Gartner, K., and Zechmeister-Boltenstern, S.: Greenhouse gas emissions (N2O, CO2 and CH4) from three forest soils near Vienna (Austria) with different water and nitrogen regimes, Die Bodenkultur, 2, 115–125, 2000.
Hairston, A. B. and Grigal, D. F.: Topographic variation in soil water and nitrogen for two forested landforms in Minnesota, USA, Geoderma, 64, 125–138, https://doi.org/10.1016/0016-7061(94)90093-0, 1994.
Hanson, P. J., Wullschleger, S. D., Bohlman, S. A., and Todd, D. E.: Seasonal and topographic patterns of forest floor CO2 efflux from an upland oak forest, Tree Physiol., 13, 1–15, https://doi.org/10.1093/treephys/13.1.1, 1993.
Hanson, R. S. and Hanson, T. E.: Methanotrophic bacteria, Microbiol. Rev., 60, 439–471, https://doi.org/10.1128/mr.60.2.439-471.1996, 1996.
Harris, E., Diaz-Pines, E., Stoll, E., Schloter, M., Schulz, S., Duffner, C., Li, K., Moore, K. L., Ingrisch, J., Reinthaler, D., Zechmeister-Boltenstern, S., Glatzel, S., Brüggemann, N., and Bahn, M.: Denitrifying pathways dominate nitrous oxide emissions from managed grassland during drought and rewetting, Sci. Adv., 7, eabb7118, https://doi.org/10.1126/sciadv.abb7118, 2021.
Hiltbrunner, D., Zimmermann, S., Karbin, S., Hagedorn, F., and Niklaus, P. A.: Increasing soil methane sink along a 120-year afforestation chronosequence is driven by soil moisture, Global Change Biol., 18, 3664–3671, https://doi.org/10.1111/j.1365-2486.2012.02798.x, 2012.
Hinsinger, P., Plassard, C., Tang, C., and Jaillard, B.: Origins of root-mediated pH changes in the rhizosphere and their responses to environmental constraints: A review, Plant. Soil, 248, 43–59, https://doi.org/10.1023/A:1022371130939, 2003.
Hutchinson, G. L. and Mosier, A. R.: Improved Soil Cover Method for Field Measurement of Nitrous Oxide Fluxes, Soil Sci. Soc. Am. J., 45, 311–316, https://doi.org/10.2136/sssaj1981.03615995004500020017x, 1981.
IPCC: IPCC, 2022: Climate Change 2022: Impacts, Adaptation, and Vulnerability, Contribution of Working Group II to the Sixth Assessment Report of the Intergovernmental Panel on Climate Change, Cambridge University Press, Cambridge University Press, Cambridge, UK and New York, https://doi.org/10.1017/9781009325844, 2022.
Janssens, I. A., Lankreijer, H., Matteucci, G., Kowalski, A. S., Buchmann, N., Epron, D., Pilegaard, K., Kutsch, W., Longdoz, B., Grünwald, T., Montagnani, L., Dore, S., Rebmann, C., Moors, E. J., Grelle, A., Rannik, Ü., Morgenstern, K., Oltchev, S., Clement, R., Guðmundsson, J., Minerbi, S., Berbigier, P., Ibrom, A., Moncrieff, J., Aubinet, M., Bernhofer, C., Jensen, N. O., Vesala, T., Granier, A., Schulze, E.-D., Lindroth, A., Dolman, A. J., Jarvis, P. G., Ceulemans, R., and Valentini, R.: Productivity overshadows temperature in determining soil and ecosystem respiration across European forests, Global Change Biol., 7, 269–278, https://doi.org/10.1046/j.1365-2486.2001.00412.x, 2001.
Kuznetsova, A., Brockhoff, P. B., and Christensen, R. H. B.: lmerTest Package: Tests in Linear Mixed Effects Models, J. Stat. Softw., 82, https://doi.org/10.18637/jss.v082.i13, 2017.
Lamprea Pineda, P. A., Bauters, M., Verbeeck, H., Baez, S., Barthel, M., Bodé, S., and Boeckx, P.: Ideas and perspectives: patterns of soil CO2, CH4, and N2O fluxes along an altitudinal gradient – a pilot study from an Ecuadorian neotropical montane forest, Biogeosciences, 18, 413–421, https://doi.org/10.5194/bg-18-413-2021, 2021.
Leitner, S., Sae-Tun, O., Kranzinger, L., Zechmeister-Boltenstern, S., and Zimmermann, M.: Contribution of litter layer to soil greenhouse gas emissions in a temperate beech forest, Plant. Soil, 403, 455–469, https://doi.org/10.1007/s11104-015-2771-3, 2016.
Lin, H. S., Kogelmann, W., Walker, C., and Bruns, M. A.: Soil moisture patterns in a forested catchment: A hydropedological perspective, Geoderma, 131, 345–368, https://doi.org/10.1016/j.geoderma.2005.03.013, 2006.
Liu, H., Li, Y., Pan, B., Zheng, X., Yu, J., Ding, H., and Zhang, Y.: Pathways of soil N2O uptake, consumption, and its driving factors: a review, Environmental Science and Pollution Research, 29, 30850–30864, https://doi.org/10.1007/s11356-022-18619-y, 2022.
Lloyd, J. and Taylor, J. A.: On the Temperature Dependence of Soil Respiration, Funct. Ecol., 8, 315, https://doi.org/10.2307/2389824, 1994.
Lookingbill, T. and Urban, D.: An empirical approach towards improved spatial estimates of soil moisture for vegetation analysis, Lands. Ecol., 19, 417–433, https://doi.org/10.1023/B:LAND.0000030451.29571.8b, 2004.
Lovett, G. M., Weathers, K. C., Arthur, M. A., and Schultz, J. C.: Nitrogen cycling in a northern hardwood forest: Do species matter?, Biogeochemistry, 67, 289–308, https://doi.org/10.1023/B:BIOG.0000015786.65466.f5, 2004.
Luo, G. J., Brüggemann, N., Wolf, B., Gasche, R., Grote, R., and Butterbach-Bahl, K.: Decadal variability of soil CO2, NO, N2O, and CH4 fluxes at the Höglwald Forest, Germany, Biogeosciences, 9, 1741–1763, https://doi.org/10.5194/bg-9-1741-2012, 2012.
Marrero, T. R. and Mason, E. A.: Gaseous Diffusion Coefficients, J. Phys. Chem. Ref. Data, 1, 3–118, https://doi.org/10.1063/1.3253094, 1972.
Le Mer, J. and Roger, P.: Production, oxidation, emission and consumption of methane by soils: A review, Eur. J. Soil Biol., 37, 25–50, https://doi.org/10.1016/S1164-5563(01)01067-6, 2001.
Nakagawa, S., Johnson, P. C. D., and Schielzeth, H.: The coefficient of determination R2 and intra-class correlation coefficient from generalized linear mixed-effects models revisited and expanded, J. R. Soc. Interface, 14, 20170213, https://doi.org/10.1098/rsif.2017.0213, 2017.
Nash, J. C. and Varadhan, R.: Unifying Optimization Algorithms to Aid Software System Users: optimx for R, J. Stat. Softw., 43, https://doi.org/10.18637/jss.v043.i09, 2011.
ÖNORM: ÖNORM L 1061, Physical investigations of soil; determination of grain size distribution of soils less than 2 mm particle size, Österreichisches Normungsinstitut, Vienna, Austria, 1988.
ÖNORM: ÖNORM L 1083, Chemical analyses of soils – Determination of acidity (pH value), Österreichisches Normungsinstitut, Vienna, Austria, 2006.
ÖNORM: ÖNORM L 1080, Chemical Analyses of Soils – Determination of Organic Carbon by Dry Combustion with and without Consideration of Carbonates, Österreichisches Normungsinstitut, Vienna, Austria, 2013.
Ou, Y., Rousseau, A. N., Wang, L., Yan, B., Gumiere, T., and Zhu, H.: Identification of the alteration of riparian wetland on soil properties, enzyme activities and microbial communities following extreme flooding, Geoderma, 337, 825–833, https://doi.org/10.1016/j.geoderma.2018.10.032, 2019.
Pan, Y., Birdsey, R. A., Fang, J., Houghton, R., Kauppi, P. E., Kurz, W. A., Phillips, O. L., Shvidenko, A., Lewis, S. L., Canadell, J. G., Ciais, P., Jackson, R. B., Pacala, S. W., McGuire, A. D., Piao, S., Rautiainen, A., Sitch, S., and Hayes, D.: A Large and Persistent Carbon Sink in the World's Forests, Science, 333, 988–993, https://doi.org/10.1126/science.1201609, 2011.
Parkin, T. B., Venterea, R. T., and Hargreaves, S. K.: Calculating the Detection Limits of Chamber-based Soil Greenhouse Gas Flux Measurements, J. Environ. Qual., 41, 705–715, https://doi.org/10.2134/jeq2011.0394, 2012.
Pilegaard, K., Skiba, U., Ambus, P., Beier, C., Brüggemann, N., Butterbach-Bahl, K., Dick, J., Dorsey, J., Duyzer, J., Gallagher, M., Gasche, R., Horvath, L., Kitzler, B., Leip, A., Pihlatie, M. K., Rosenkranz, P., Seufert, G., Vesala, T., Westrate, H., and Zechmeister-Boltenstern, S.: Factors controlling regional differences in forest soil emission of nitrogen oxides (NO and N2O), Biogeosciences, 3, 651–661, https://doi.org/10.5194/bg-3-651-2006, 2006.
Pumpanen, J., Kolari, P., Ilvesniemi, H., Minkkinen, K., Vesala, T., Niinistö, S., Lohila, A., Larmola, T., Morero, M., Pihlatie, M., Janssens, I., Yuste, J. C., Grünzweig, J. M., Reth, S., Subke, J.-A., Savage, K., Kutsch, W., Østreng, G., Ziegler, W., Anthoni, P., Lindroth, A., and Hari, P.: Comparison of different chamber techniques for measuring soil CO2 efflux, Agr. Forest Meteorol., 123, 159–176, https://doi.org/10.1016/j.agrformet.2003.12.001, 2004.
Quebbeman, A. W., Menge, D. N. L., Zimmerman, J., and Uriarte, M.: Spatial Variation in Soil Greenhouse Gas Fluxes in a Subtropical Forest, Ecosystems, 25, https://doi.org/10.1007/s10021-021-0067, 2022.
Raich, J. W. and Potter, C. S.: Global patterns of carbon dioxide emissions from soils, Global Biogeochem. Cy., 9, 23–36, https://doi.org/10.1029/94GB02723, 1995.
R Core Team: R: A language and environment for statistical computing, R Foundation for Statistical Computing, R Foundation for Statistical Computing, Vienna, Austria, 2022.
Reth, S., Reichstein, M., and Falge, E.: The effect of soil water content, soil temperature, soil pH-value and the root mass on soil CO2 efflux – A modified model, Plant. Soil, 268, 21–33, https://doi.org/10.1007/s11104-005-0175-5, 2005.
Savage, K., Phillips, R., and Davidson, E.: High temporal frequency measurements of greenhouse gas emissions from soils, Biogeosciences, 11, 2709–2720, https://doi.org/10.5194/bg-11-2709-2014, 2014.
Schad, P.: The International Soil Classification System WRB, Third Edition, 2014, in: Springer Water, Springer International Publishing, 563–571, https://doi.org/10.1007/978-3-319-24409-9_ 25, 2016.
Schimel, J. P.: Life in Dry Soils: Effects of drought on soil microbial communities and processes, Annu. Rev. Ecol. Evol. Syst., 49, 409–432, https://doi.org/10.1146/annurev-ecolsys-110617-062614, 2018.
Smith, K. A., Dobbie, K. E., Ball, B. C., Bakken, L. R., Sitaula, B. K., Hansen, S., Brumme, R., Borken, W., Christensen, S., Priemé, A., Fowler, D., Macdonald, J. A., Skiba, U., Klemedtsson, L., Kasimir-Klemedtsson, A., Degórska, A., and Orlanski, P.: Oxidation of atmospheric methane in Northern European soils, comparison with other ecosystems, and uncertainties in the global terrestrial sink, Global Change Biol., 6, 791–803, https://doi.org/10.1046/j.1365-2486.2000.00356.x, 2000.
Subke, J.-A., Kutzbach, L., and Risk, D.: Soil Chamber Measurements, in: Springer Handbook of Atmospheric Measurements, Springer International Publishing, 1603–1624, https://doi.org/10.1007/978-3-030-52171-4_ 60, 2021.
Thomas, P. A. and Packham, J. R.: Energy and nutrients. In Ecology of Woodlands and Forests: Description, Dynamics and Diversity, Cambridge: Cambridge University Press, 318–349, https://doi.org/10.1017/CBO9780511805578.010, 2007.
Unger, I. M., Motavalli, P. P., and Muzika, R.-M.: Changes in soil chemical properties with flooding: A field laboratory approach, Agr. Ecosyst. Environ., 131, 105–110, https://doi.org/10.1016/j.agee.2008.09.013, 2009.
Vilain, G., Garnier, J., Passy, P., Silvestre, M., and Billen, G.: Budget of N2O emissions at the watershed scale: role of land cover and topography (the Orgeval basin, France), Biogeosciences, 9, 1085–1097, https://doi.org/10.5194/bg-9-1085-2012, 2012.
Walkiewicz, A., Rafalska, A., Bulak, P., Bieganowski, A., and Osborne, B.: How Can Litter Modify the Fluxes of CO2 and CH4 from Forest Soils?, A Mini-Review, Forests, 12, 1276, https://doi.org/10.3390/f12091276, 2021.
Wang, Y., Wang, H., Ma, Z., Dai, X., Wen, X., Liu, Y., and Wang, Z.-L.: The litter layer acts as a moisture-induced bidirectional buffer for atmospheric methane uptake by soil of a subtropical pine plantation, Soil Biol. Biochem., 66, 45–50, https://doi.org/10.1016/j.soilbio.2013.06.018, 2013.
Warner, D. L., Vargas, R., Seyfferth, A., and Inamdar, S.: Transitional slopes act as hotspots of both soil CO2 emission and CH4 uptake in a temperate forest landscape, Biogeochemistry, 138, 121–135, https://doi.org/10.1007/s10533-018-0435-0, 2018.
Webster, K. L., Creed, I. F., Bourbonnière, R. A., and Beall, F. D.: Controls on the heterogeneity of soil respiration in a tolerant hardwood forest, J. Geophys. Res., 113, G03018, https://doi.org/10.1029/2008JG000706, 2008.
Wrage, N., Lauf, J., del Prado, A., Pinto, M., Pietrzak, S., Yamulki, S., Oenema, O., and Gebauer, G.: Distinguishing sources of N2O in European grasslands by stable isotope analysis, Rapid Communications in Mass Spectrometry, 18, 1201–1207, https://doi.org/10.1002/rcm.1461, 2004.
Yu, K., Faulkner, S. P., and Baldwin, M. J.: Effect of hydrological conditions on nitrous oxide, methane, and carbon dioxide dynamics in a bottomland hardwood forest and its implication for soil carbon sequestration, Global Change Biol., 14, 798–812, https://doi.org/10.1111/j.1365-2486.2008.01545.x, 2008.
Yu, L., Zhu, J., Ji, H., Bai, X., Lin, Y., Zhang, Y., Sha, L., Liu, Y., Song, Q., Dörsch, P., Mulder, J., and Zhou, W.: Topography-related controls on N2O emission and CH4 uptake in a tropical rainforest catchment, Science of The Total Environment, 775, 145616, https://doi.org/10.1016/j.scitotenv.2021.145616, 2021.
Zechmeister-Boltenstern, S., Díaz-Pinés, E., Spann, C., Hofmann, K., Schnecker, J., and Reinsch, S.: Soil – The Hidden Part of Climate, in: Soil and Climate, CRC Press, Boca Raton, FL: CRC Press, Taylor & Francis Group, 2018, Adv. Soil Sci., 11–60, https://doi.org/10.1201/b21225-2, 2018.
Zuur, A. F., Ieno, E. N., Walker, N., Saveliev, A. A., and Smith, G. M.: Mixed effects models and extensions in ecology with R, Springer New York, New York, NY, https://doi.org/10.1007/978-0-387-87458-6, 2009.