the Creative Commons Attribution 4.0 License.
the Creative Commons Attribution 4.0 License.
 | 13 Jul 2023
Mapping land degradation risk due to land susceptibility to dust emission and water erosion
Mahdi Boroughani
Fahimeh Mirchooli
Mojtaba Hadavifar
Stephanie Fiedler
Land degradation is a cause of many social, economic, and environmental problems. Therefore identification and monitoring of high-risk areas for land degradation are necessary. Despite the importance of land degradation due to wind and water erosion in some areas of the world, the combined study of both types of erosion in the same area receives relatively little attention. The present study aims to create a land degradation map in terms of soil erosion caused by wind and water erosion of semi-dry land. We focus on the Lut watershed in Iran, encompassing the Lut Desert that is influenced by both monsoon rainfalls and dust storms. Dust sources are identified using MODIS satellite images with the help of four different indices to quantify uncertainty. The dust source maps are assessed with three machine learning algorithms encompassing the artificial neural network (ANN), random forest (RF), and flexible discriminant analysis (FDA) to map dust sources paired with soil erosion susceptibility due to water. We assess the accuracy of the maps from the machine learning results with the area under the curve (AUC) of the receiver operating characteristic (ROC) metric. The water and aeolian soil erosion maps are used to identify different classes of land degradation risks. The results show that 43 % of the watershed is prone to land degradation in terms of both aeolian and water erosion. Most regions (45 %) have a risk of water erosion and some regions (7 %) a risk of aeolian erosion. Only a small fraction (4 %) of the total area of the region had a low to very low susceptibility for land degradation. The results of this study underline the risk of land degradation for in an inhabited region in Iran. Future work should focus on land degradation associated with soil erosion from water and storms in larger regions to evaluate the risks also elsewhere.
- Article
(4123 KB) - Full-text XML
- BibTeX
- EndNote


Land degradation is one of the most pressing environmental issues around the globe. Several aspects of this issue have been recognized by the United Nations Convention to Combat Desertification (Gholami et al., 2019a). Land degradation can be driven by both water and wind, of which the former can have a stronger impact on soil erosion in a short time (Gia et al., 2018). A total of 30 % of global land area and 3 billion people are affected by land degradation (Wieland et al., 2019). In Iran, it is estimated that land and water degradation cost about USD 12.8 billion per year, which is 4 % of the total gross domestic product (GDP) (Emadodin et al., 2012). Therefore, spatial mapping of risks of land degradation is necessary which can provide a basis to support managers and policymakers in risk mitigation and adaptation to aeolian and water erosion.
Land degradation driven by aeolian erosion is a known problem (Shi et al., 2004). Dust storms, which are a natural hazard, are associated with soil erosion. This phenomenon has detrimental impacts on the Earth system, e.g., for food security (Boroughani et al., 2022), water supply (Duniway et al., 2019), human health (Moridnejad et al., 2015), geochemical conditions (Gholami et al., 2020b), and the Earth's carbon cycle (Gherboudj et al., 2017). Identifying dust sources as potential areas of dust emission is therefore necessary for developing a better understanding of land degradation. Spatial mapping of dust source susceptibility areas (DSSAs) is a crucial step for erosion mitigation and watershed management.
In addition to soil erosion by wind, water-driven soil erosion is a known mechanism for soil degradation. This kind of soil erosion is a known environmental threat and can influence both terrestrial and aquatic systems (Halecki et al., 2018; Sun et al., 2014). Therefore, knowing the spatial distribution of water-induced soil erosion susceptibility areas (SESA) is also necessary.
Different approaches for identifying DSSAs exist, e.g., using meteorological data (Yang et al., 2019), numerical modeling (Péré et al., 2018), and remote sensing (Jafari et al., 2021). Remote sensing can provide worldwide information on aerosol properties (Park et al., 2014). The present study uses Moderate Resolution Imaging Spectroradiometer (MODIS) satellite images in combination with machine learning to detect dust aerosols and map its susceptibility over the Lut Desert. Moreover, several numerical models exist for predictions and risk evaluations of water-induced soil erosion (Chicas et al., 2016; Gao et al., 2017; Anache et al., 2018; Gia et al., 2018; Halecki et al., 2018), but none used machine learning to combine different observational datasets for assessing soil erosion. Machine learning has emerged as a subfield of data science and helps to better understand environmental problems (Gholami et al., 2019b). It can integrate data from different sources to create forecasts and discover patterns (Gholami et al., 2020a). In environmental sciences, algorithms such as the support vector machine, random forest (RF), artificial neural network (ANN), and multivariate adaptive regression spline have been applied, e.g., for groundwater (Lee et al., 2017), gully erosion (Zabihi et al., 2018), sediment contamination (Mirchooli et al., 2019), dust sources (Boroughani et al., 2020), landslides (Youssef and Pourghasemi, 2021), floods (Tehrany et al., 2014), and trace elements (Derakhshan-Babaei et al., 2022).
Though land susceptibility to soil erosion and dust emission has been assessed in different and separate studies, it has attracted less attention to investigate both of them in the same study. So, the novelty of this study lies in constructing an integrated framework based on field survey, different environmental factors, and machine learning algorithms to assess both water erosion and dust emission.
This research is conducted to test some hypotheses including the following: (1) the central and western parts of the watershed are the most highly susceptible areas to water erosion and aerosol emission, respectively; (2) NADI and land use are the most important factors for water erosion and aolian emission; and (3) central areas are the parts of the watershed that are most prone to these phenomena. Correspondingly, the aims of the current study are (1) to assess the spatially resolved contribution of soil erosion by water and wind using three machine learning algorithms, (2) to determine the most important factor influencing water and dust emission susceptibility, and (3) to combine the findings into spatially resolved information on risks for land degradation and recognize hotspot areas in terms of water erosion and dust emission.
The focus of this study is on the Lut watershed situated in the east and southeast of Iran covering an area of 206 242 km2 (28∘10′ to 32∘30′ N latitude and 55∘45′ to 61∘15′ E longitude) and is marked in Fig. 1. This watershed include a great diversity of topographic characteristics, with an elevation ranging from 124 to 4269 m and slope ranging from 0 to 28.04∘. In this region, southwest and northeast aspects are most frequent (34 % of the area). This watershed covers some parts of the South Khorasan, Yazd, Kerman, and Sistan–Baluchestan provinces of Iran. In addition, several important cities and towns such as Birjand, Tabas, and Bam are located in the watershed. Aridisols are the dominant soil order of the watershed; they constitute 40.1 % of this region. The study watershed includes the largest desert of the country, the Lut Desert. The region contributes to the increasing dust concentration in southwest Asia (Ebrahimi-khusfi et al., 2021). This area is chosen to develop and test the methods based on regional data on erosion observations, with examples shown in Fig. 1a–d. It underlines the impacts of land degradation that go well beyond impacts on the natural environment.
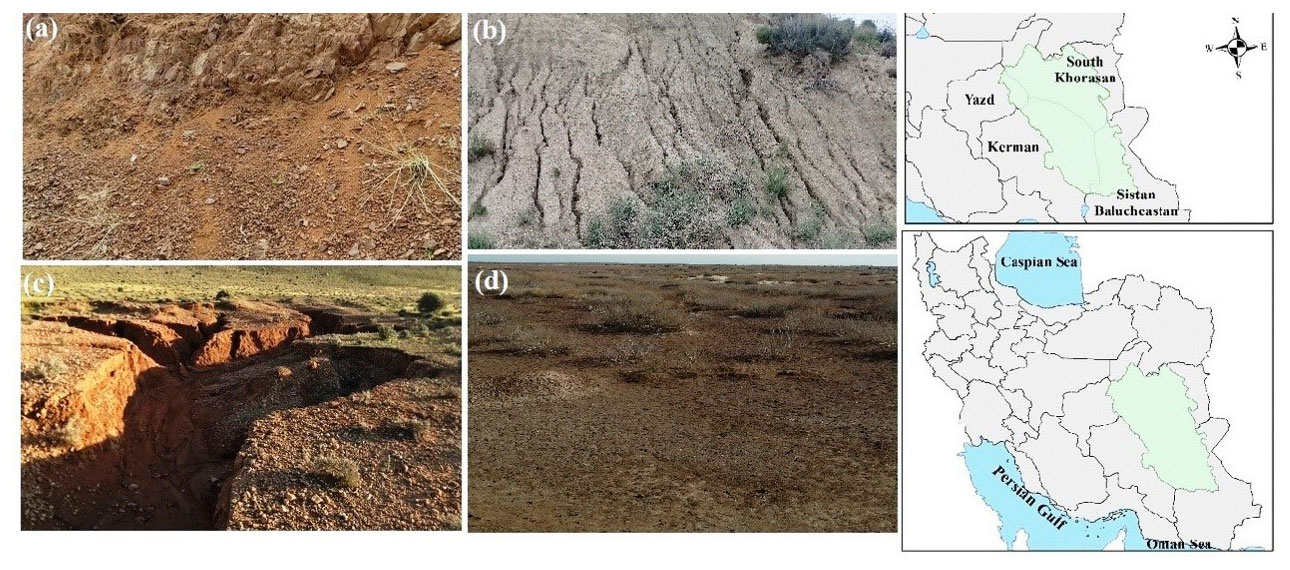
Figure 1Geographical location of the study watershed. Green shading marks the Lut watershed. The Lut Desert is located in the center of the watershed. Settlements are primarily situated in the northern and southwestern parts. Examples of soil erosion in the watershed are sheet erosion (a), rill erosion (b), gully erosion (c), and wind erosion (d).
2.1 Land degradation mapping
Our land degradation zonation consists of three main processing steps, graphically depicted in Fig. 2. At first, spatial mapping of water erosion is conducted (Sect. 2.1.1). In the second step, spatial mapping of dust source susceptibility is carried out with machine learning methods (Sect. 2.1.2). In the last step, the patterns of water erosion and dust source susceptibility are combined to identify risk areas of land degradation (Sect. 2.2.3).
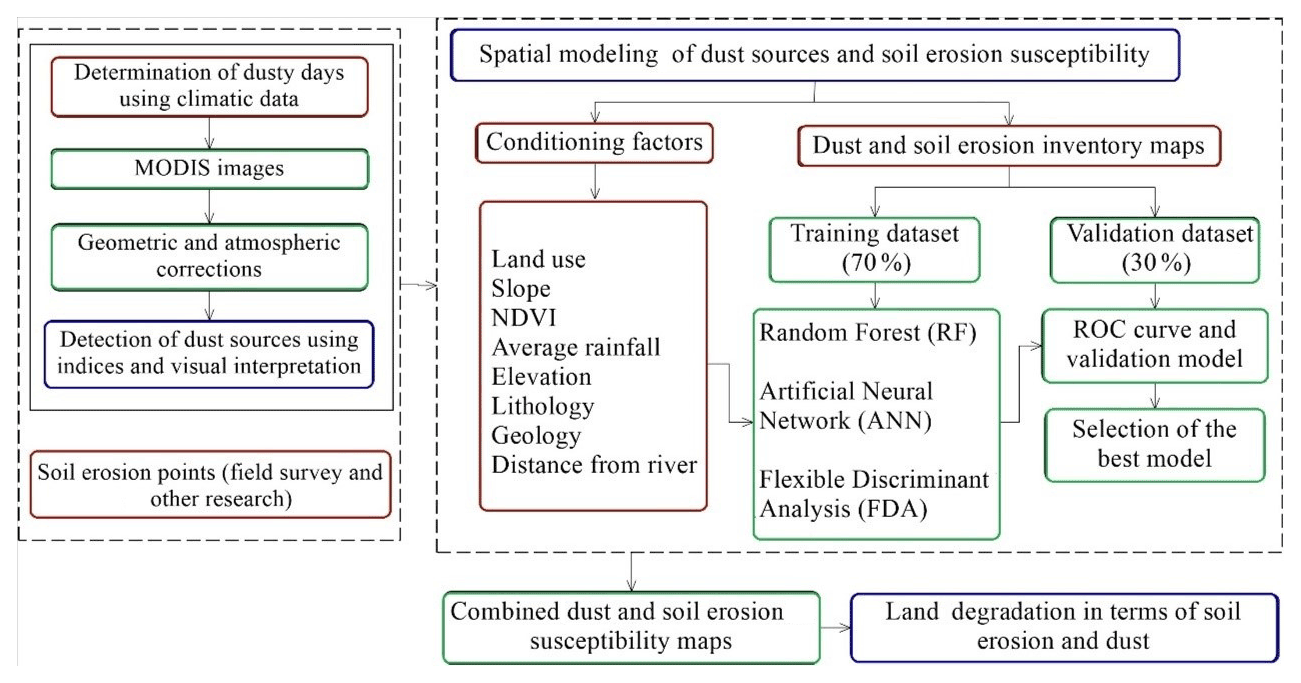
Figure 2Flowchart of inputs (red boxes), data processing (green boxes), and outputs (blue boxes) in the present study.
2.1.1 Water erosion map
Quantifying the erosion susceptibility of an area requires determining a spatial distribution of observed water-induced soil erosion that can have different characteristics, e.g., gully erosion, rill erosion, and surface erosion. That information is extracted from data collected during a field survey paired with previous research (Shit et al., 2020). In the previous research, a combination of consulting with provincial experts, satellite images, recent aerial photos, and field survey was applied to identify soil erosion. The aim of the field survey for the present study was to identify regions where sheet, rill, and gully erosion took place. This field survey was carried out in accessible parts of the watershed in April 2020. These accessible parts are mostly distributed around the cities (such as Bam, Ravar, Shahdad, Baravar, Birjand, and Tabas) with proper road access located in the watershed. The dataset contains the type of water-induced soil erosion, along with the geographical location using the Global Positioning System (GPS). A selection of the identified water soil erosion in the study region is shown in Fig. 1.
We translated the observations of the field survey into maps of non-degraded and degraded areas. These areas were plotted in an inventory map and prepared for further analysis, although not all desert areas are fully covered by the survey.
2.1.2 Dust aerosol map
The large desert area to be covered is a motivation for the use of satellite data for estimating dust sources. We used MODIS images from the Terra (morning) and Aqua (afternoon) satellites (Vickery and Eckardt, 2013) to identify dust aerosols. We define dusty days as when the horizontal visibility is less than 2000 m for at least 1 h during the day based on available weather stations in Iran (Vickery and Eckardt, 2013; Boroughani et al., 2021). According to the mentioned condition, more than 500 dusty days were identified during 2010–2021 distributed over the stations in Birjand, Zahedan, Kerman, Bam, Doostabad, Bisheh, Rafsanjan, and Mighan. We pair the station observations with satellite data to estimate the spatial extent of the dust aerosol plumes. Due to the overpass of the Terra and Aqua satellites once per day, we acquired 28 satellite images from the MODIS sensor during times when the weather stations had documented dusty conditions in the 10-year period. For identifying pixels with dust aerosols in these images, we calculate four different dust indices (brightness temperature difference for band 29, 31, and 32, i.e., BTD2931 and BTD3132; normalized difference dust index, NDDI; and parameter D) for dust aerosol identification (Boroughani et al., 2020, 2021; Hahnenberger and Nicoll, 2014).
where B(T, λ) represents the Planck equation at λ (µm), T is the BT (K), h is Planck's constant (6.626 × 10⁻³⁴ m2 kg s−1), k is Boltzmann's constant (1.38 × 10⁻²³)5, c is the speed of light (2.99 × 10⁸ m s−1), and T is the temperature (Hao et al., 2007).
Using Planck's equation, the value of the temperature can be derived, where L is the amount of radiance in the images (in W m−2 sr−1 µm−1).
where p2.13 and p0.469 depict the reflectance value at the top of the atmosphere at 2.13 and 0.469 µm, respectively (Qu et al., 2006).
where rr shows the reflectance proportion among wavelengths of 0.54 µm and 0.86 µm, BTD is the difference among bands 11 and 12 µm, and a and b are constants taken during the initial calibration (Eq. 1) (Qu et al., 2006; Miller, 2003; Hao et al., 2007; Boroughani et al., 2020, 2021).
We compute false color maps using four combinations of channels (1 – NDDI, B4, and B3; 2 – D, BTD2931, and NDDI; 3 – D, BTD3132, and NDDI; and 4 – BTD2931, B4, and B3) in ENVI software. We choose these four different indices for cross-validating the presence of dust aerosols. With each of these methods we see dust aerosol in different color and qualities in the MODIS images over 28 d. After combining the four methods in ENVI software, we choose the method that shows the dust plume in the MODIS image more clearly as the best method (Boroughani et al., 2020, 2022). This method is based on a cone of dust diffusion seen in the processed MODIS images, where the apex denotes the dust's source (Lee et al., 2009; Walker et al., 2009). Ultimately, the inventory map of the dust aerosols in the Lut watershed was created.
2.2 Identification of key factors controlling aeolian and water erosion
To develop DSSA and SESA, the identification and selection of appropriate dust sources and soil erosion effective factors are necessary. The main factors affecting DSSA and SESA were selected and constructed based on literature, available data, and geographical maps (Torabi et al., 2021; Zabihi et al., 2018; Boroughani et al., 2020; Gholami et al., 2020a). The considered factors in this study included elevation, land use, slope of terrain, lithology, annual rainfall, distance from rivers, distance from roads, the topographic wetness index (TWI), and the normalized difference vegetation index (NDVI). Various sources were used to gather data for these factors, introduced in the following in more detail. All collected data were mapped to a horizontal grid of 1 km resolution.
Shuttle Radar Topography Mission (SRTM) images were used to create the digital elevation model (DEM; Fig. 3c) (Ghorbanzadeh et al., 2018). The lowest and highest elevation of the study area is 124 m in the center of the desert and 3966 m at the western and eastern margins of the study watershed, respectively (Fig. 3c). Vegetation cover considerably supports soil conservation. Areas with low vegetation cover would be more sensitive to erosion both by water and wind (Arabameri et al., 2019a; Gholami et al., 2019b). Therefore, we use the normalized difference vegetation index (NDVI) to assess the vegetation cover in the study area from MODIS images following (Arabameri et al., 2019a; Boroughani et al., 2020)
where R is the red band (0.620–0.670 µm) and NIR is the near-infrared band (0.841–0.876 µm) (Fig. 3d).
Annual rainfall (Fig. 3e) was obtained from the Iran Meteorological Organization for the period of 2000–2021. Mean annual rainfall was calculated using 40 different meteorological stations located within or close to the watershed (Fig. 3e). The inverse distance weighting (IDW) interpolation method was applied to integrate rainfall over the study area in the ArcGIS environment (Gholami et al., 2020a). The topographic wetness index (TWI), which indicates the spatial distribution of areas of potential soil saturation, is an effective factor to indicate water erosion including landslides and also flooding (Arabameri et al., 2019b). The TWI, which determines the dry and wet zones, is calculated as follows (Beven and Kirkby, 1979):
where α is the cumulative upslope area from a point (per unit contour length), and β is the slope angle at that point. This index was calculated in the SAGA-GIS environment and classified into four groups, viz. 14–17, 17–19, 17–21, and 21–24 (Fig. 3f). The aspect map was also generated using a DEM and grouped into 10 classes (Fig. 3g). Distance from the road is an indicator of infrastructure development which influences soil erosion and land degradation (Torabi et al., 2021). This factor is shown in five classes in Fig. 3h. Distance from the river is one of the most effective factors in water-caused erosion (Amiri et al., 2019), and this is classified into six groups (Fig. 3i).
The slope map (%) was created using a digital elevation map (DEM; Fig. 3j) and classified into five groups including 0 %–3 %, 3 %–6 %, 6 %–12 %, 12 %–21 %, and 21 %–54 %. The lithology map indicates 11 different soil classes in the study area (Fig. 3k).
Land-use and soil maps were obtained from base maps developed by the Iranian Forest, Rangeland, and Watershed Management Organization (https://frw.ir/, last access: 14 February 2021). In the study region, there are 14 land-use classes including wetlands, rangelands of three states (poor, medium, and rich), dry farming, agricultural lands, urban area, fallow land, rock-covered land, wetland, saltland, woodland, bare surfaces, and sand dunes (Fig. 3l). A large percentage (83 %) of the watershed area is covered by bare land, poor rangeland, and sand dunes. All three land-use classes are prone to wind erosion due to sparse or no vegetation.
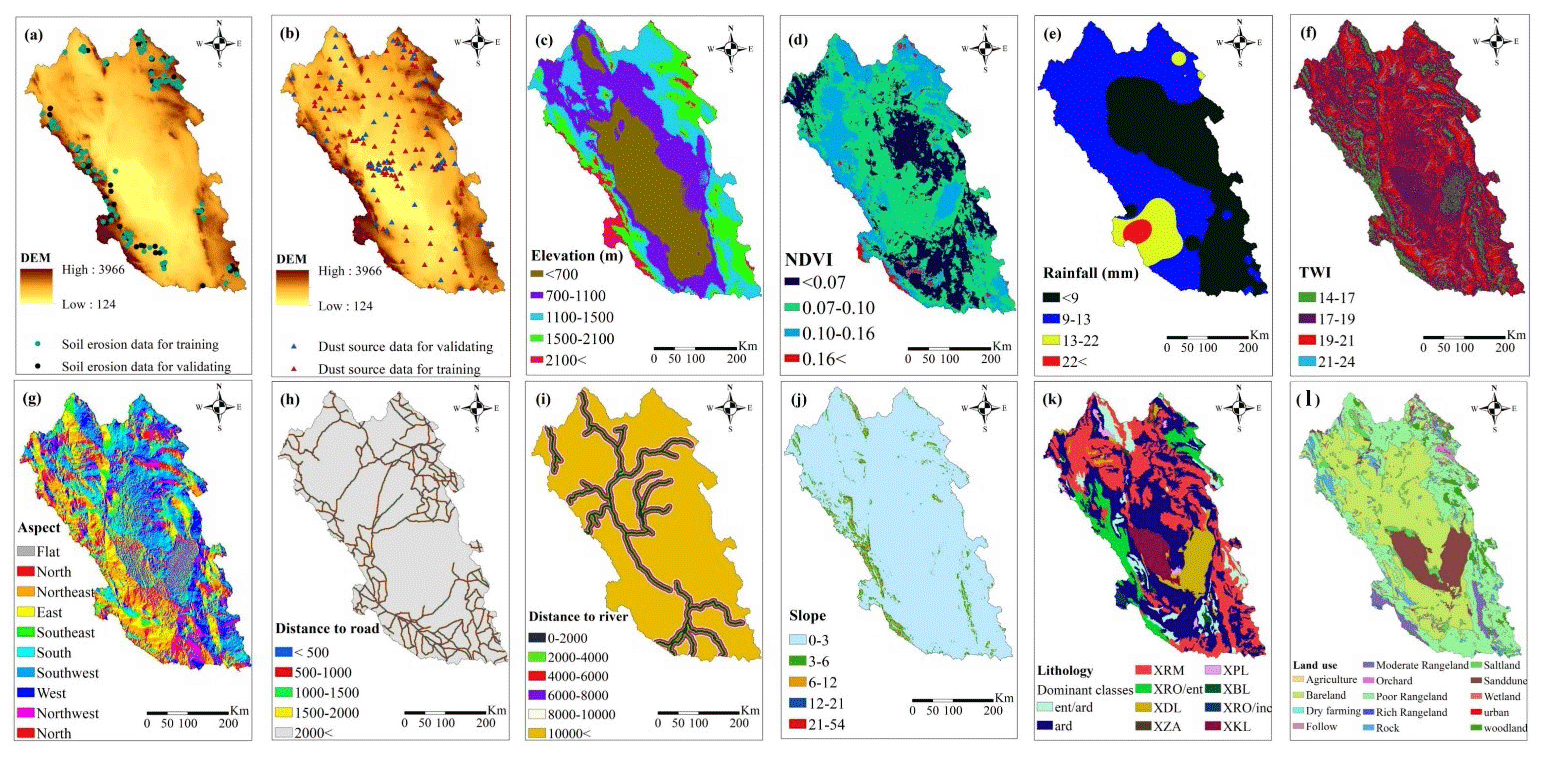
Figure 3Location of dust observation points for training and validation (a), water-induced soil erosion points for training and validation (b), and the conditional factors (elevation c, NDVI d, rainfall e, TWI f, aspect g, distance from road h, distance from river i, slope j, lithology k, and land use l) in the watershed.
2.3 Spatial mapping of DSSA and SESA using machine learning algorithms
We combine the two susceptibility maps for DSSA and SESA to create the land degradation hazard map with regards to water- and wind-induced soil erosion. For both types of soil erosion, three machine learning models were constructed and applied using the Biomod2 package (Thuiller et al. 2016). The land degradation susceptibility map was then created by synthesizing the results for both soil erosion types in an ArcGIS 10.5 environment, and the land degradation susceptibility was ultimately evaluated with four classes.
A wide range of machine learning algorithms has been applied for spatial mapping of environmental phenomena in the past. The effective factors described in Sect. 2.2 and the inventory maps of water and wind erosion were used as the input of the machine learning algorithms. In the present study, the random forest (RF), artificial neural network (ANN), and flexible discriminant analysis (FDA) algorithms were used to produce DSSA and SESA maps. We choose three different algorithms to test the dependency of the results on the method as a measure of uncertainty. The three algorithms are described in more detail in the following.
2.3.1 Random forest (RF)
Random forest developed by Breiman (2001) is a machine learning algorithm for non-parametric multivariate classification. RF builds multiple trees using a random selection of the training dataset. The data not included, called out-of-bag (OOB) data, determine the model accuracy using generalization error estimation (Breiman, 2001). Diversity among the classification trees increases through resampling of the data with replacement and also a random change of predictors that are set during tree induction processes (Youssef et al., 2016). Information from numerous decision trees has been combined in the RF algorithm.
Generally, it is essential to define two parameters to run the RF model including the number of trees (ntree) and the number of factors prepared from the data shown in Fig. 3 (mtry). The former is built while the RF model is running, while the latter is used in the tree-building process. Both the number of trees and the number of factors need to be optimized to minimize the generalization error (Rahmati et al., 2016). The optimization was done through sensitivity tests.
2.3.2 Artificial neural network (ANN)
The artificial neural network (ANN) is a machine learning tool developed by imitating human brain performances and making connections between inputs and outputs (Sakizadeh et al., 2017). The human brain is mimicked in two ways: firstly, obtaining information and knowledge using a learning process, and secondly, storing knowledge using synaptic weights. Therefore, the ANN has been identified as the model that finds the optimal solution for non-linear problems, such as dust source and soil erosion susceptibility, by identifying patterns with conditioning factors (Ghorbanzadeh et al., 2019). In an ANN, a neuron is the smallest data processing unit which could make many neural network structures and be used in research for different purposes. The standard structure of an ANN consists of three layers, namely, the input layer, the hidden layers, and the output layer. The input layer consists of training data and conditioning factors of dust source, the neurons in the hidden layer analyze the complex information contained in the data, and the output layer consists of the maps of dust source susceptibility. In this structure, the neurons across the same layer are not connected, but they are linked with neurons in the previous and subsequent layers. The ANN algorithm determines a weight for each input factor and a transfer function to build results (Kalantar et al., 2017).
2.3.3 Flexible discriminant analysis (FDA)
The modification of the linear regression model for the application to non-linear problems is the purpose of FDA (Avand et al., 2021). Non-parametric regression models, non-linear discriminant analysis, and classification methods are combined into one framework. This algorithm is flexible for non-linear classifications because non-linear transformation is used and clusters are soft (Kalantar et al., 2020); here clusters for the relationship between soil erosion and the predictor factors are shown in Fig. 3. In this way, variables in FDA are firstly aligned with the multivariate adaptive regression splines (MARS), and then dimension reduction is performed (Kim and Kim, 2021). FDA can overcome the problem of linear discriminant analysis (LDA), and it minimizes the square average of the residuals (Mosavi et al., 2020), while linear regression is replaced by non-parametric regression in FDA. Therefore, FDA has the potential to be applied for non-linear natural problems such as soil erosion, dust, flood, and landslide.
2.4 Evaluation of machine learning algorithms
In our DSSA and SESA assessment, 70 % of point data are randomly selected for the training dataset and 30 % for model validation. The prediction accuracy of the machine learning algorithms is assessed by comparing the DSSA map with the validation dataset of dust sources. These data were extracted from MODIS images, and some indicators are explained in Sect. 2.1.2. The receiver operating characteristic (ROC) curve and the area under the curve (AUC) are applied following past studies that used these to test the prediction skill of a model for the occurrence or non-occurrence of the studied phenomena (Naghibi et al., 2017). The AUC ranges from 0 to 1 in which the models that better perform represent the AUC close to 1.
3.1 Spatial distribution of DSSA
3.1.1 Dust aerosol detection
An illustration of a dust storm seen in MODIS FCC (false color composite) satellite imagery over the Lut watershed on 7 August 2019 is shown in Fig. 4. Following a visual analysis of the images, we determined that the false color combination (red: BTD2931, green: band 4, blue: band 3) is the best and applied it to 26 MODIS images of dusty days. As a result, the Lut watershed's dust source locations were identified (Fig. 4).
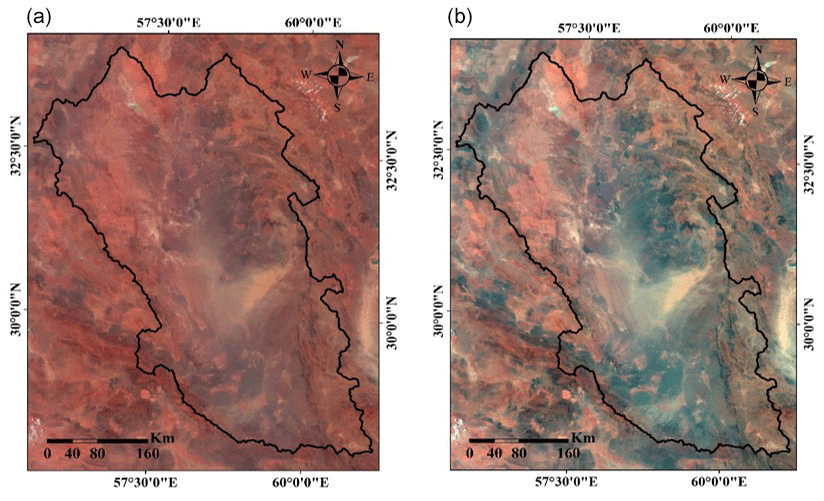
Figure 4The dust storm on 7 August 2019, as seen above, is an example of the visual inspection of a dust storm. (a) MODIS true color (red: band 5, green: band 4, blue: band 3) and (b) enhanced MODIS satellite photo (red: BTD2931, green: band 4, blue: band 3).
3.1.2 The importance of conditioning factors for DSSA
Since multicollinearity among factors has been identified as an obstacle to explaining the results (Roy and Saha, 2019), the variance inflation factor (VIF) was calculated to assess the relationships among conditioning factors. This was conducted because multicollinearity among factors will reduce the accuracy of the models (Arabameri et al., 2019b). In the present study, VIF values for DSSA mapping range from 1.05 to 1.57, which illustrated no collinearity among the eight factors. Therefore, no exclusion was applied, and all factors were considered in successive calculations and modeling.
The importance and impact of each factor depend on the machine learning algorithms. The result of DSSA mapping using RF showed that NDVI, elevation, land use, and lithology had the greatest degree of effect among conditioning factors. Land use and NDVI as an index of vegetation cover proved to have a controlling impact on wind erosion and dust emission (Gholami et al., 2020). Elevation is an effective factor for DSSA in which lowlands have higher impacts than highlands. This was confirmed by other studies such as Darvand et al. (2021). Lithology is another important factor in this watershed since dust emission mostly occurs in the sensitive lithology rather than resistant ones (Sissakian et al., 2013). Overall, the impacts of these factors on DSSA have been proved by previous investigations (Gholami et al., 2020a, b). Other factors such as the distance from rivers, rainfall, and slope were identified as rather weak predictors, respectively. These findings agree with other research (Boroughani and Pourhashemi, 2020; Darvand et al., 2021).
The FDA approach showed, however, that elevation, NDVI, and land use had the highest effects on dust source susceptibility; other factors had no impact on DSSA. Similarly, with the ANN, elevation, NDVI, and land use were identified as the three most effective factors, and other factors were weaker predictors rather than the former three. However these two FDA and ANN models provide similar results in terms of the importance of conditioning factors, and FDA could be used rather than the ANN because of its higher accuracy, which is shown in the next section.
3.1.3 Spatial distribution of dust source susceptibility
The dust source susceptibility (DSS) maps created by RF, FDA, and ANN algorithms are classified into five risk classes (very high, high, moderate, low, and very low), shown in Fig. 5. These classes are set as in earlier studies (Mosavi et al., 2020; Boroughani et al., 2022). The results of the model evaluation using the ROC indicate that the RF model with an accuracy of 75.0 % provides the most accurate outputs. FDA and ANN algorithms had similar performances with the accuracy of 71.7 % and 70.7 %. In terms of the true skill statistic (TSS), similar results have been obtained in which RF with an accuracy of 45.8 % again had the best performance in comparison to FDA (32.4 %) and the ANN (35.8 %). In this way, RF introduces different priorities for the effective factors in comparison with FDA and ANN algorithms. RF proposes NDVI, elevation, land use, and lithology as the most important factors, while FDA and the ANN suggest elevation, NDVI, and land use as the most influencing factors. The dominance of NDVI, elevation, and land use as the most effective factors for DSS is consistent with the understanding of dust source locations that are typically found in topographic depressions with sparse or no vegetation. The DSSA map from RF was selected for further analysis due to the highest accuracy, although the differences between FDA and ANN algorithms are in the statistical sense relatively small. According to the DSSA maps, 29 % and 17 % of the watershed were classified as areas of high and very high DSSA, i.e., almost half of the study area. Only 4 % and 16 % of the watershed have a very low and low susceptibility to soil erosion through winds, respectively. The spatial extent of high and very high risk areas from RF is smaller than the ones obtained by ANN and FDA algorithms. In all three maps, it can be seen that the biggest potential for dust emission is located in the central parts (Lut Desert) of the watershed. These results are consistent with other research, indicating that RF allows more detailed spatial mapping of dust source susceptibility compared to other machine learning algorithms (Rahmati et al., 2020a; Gholami et al., 2019b; Darvand et al., 2021).
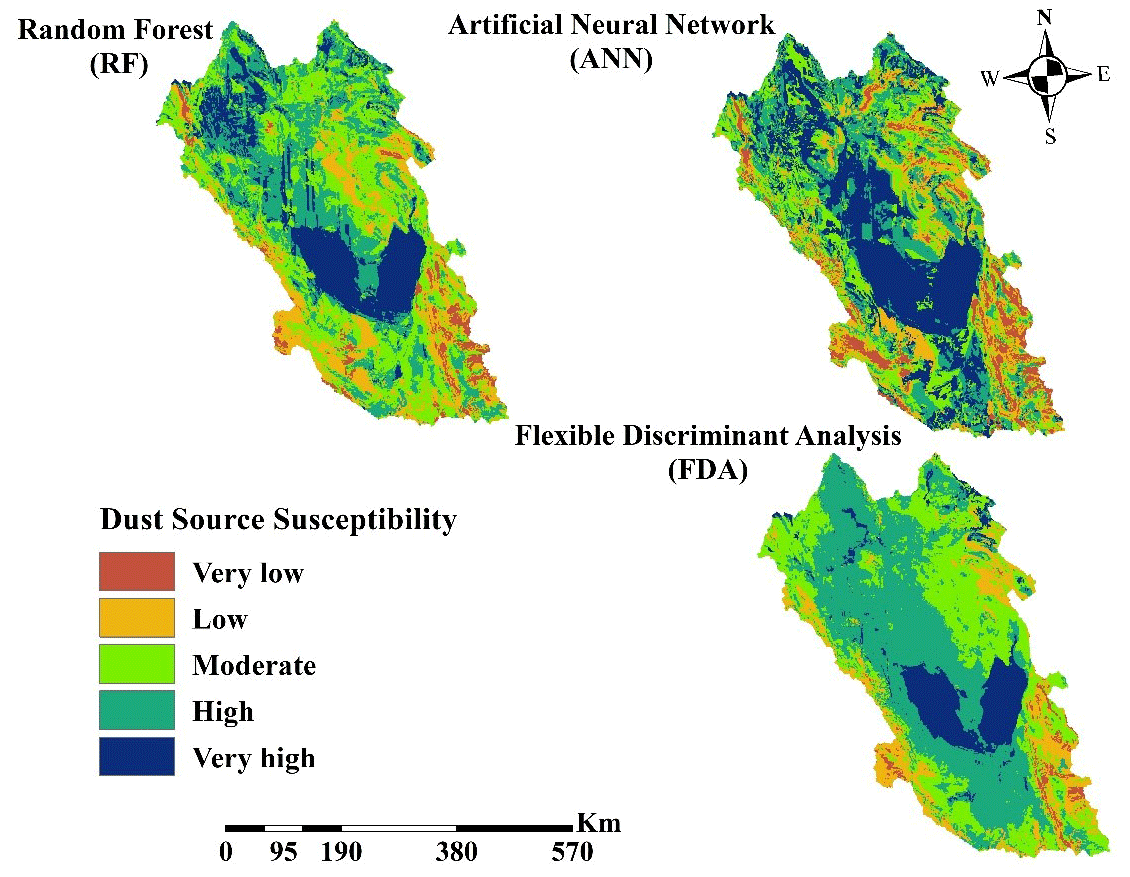
Figure 5Dust source susceptibility area (DSSA) based on random forest (RF), artificial neural network (ANN), and flexible discriminant analysis (FDA) algorithms.
As mentioned before, the watershed is one of the key regions with dust concentration in southwest Asia. Spatial distribution of dust sources in this region is a key roadmap for preventive and adaptive measurement. This would reduce dust emission across the watershed, region, and even other near countries.
3.2 Soil erosion susceptibility map
3.2.1 Relative influential conditioning factors for SESA
There are some differences in the contributions of influential factors among models. RF indicates that rainfall, the TWI, slope, elevation, land use, and geology are the most important conditioning factors. Considering this watershed is located in an arid region of Iran, rainfall and the TWI play a decisive and crucial role in soil erosion among them. The TWI, which indicates soil moisture and water-saturated areas (Silva et al., 2023), has also been identified as an effective factor for different kinds of soil erosion such as rill–interrill, gully, and piping erosion (Sholagberu et al., 2017; Hosseinalizadeh et al., 2019). Slope also influences soil erosion rate through affecting runoff velocity, vegetation cover, and soil type (Avand et al., 2022). This conditioning factor has also been reported as one of the most influential factor in most studies (Sholagberu et al., 2017; Pournader et al., 2018; Lei et al., 2020). Moreover, distance from roads and rivers was recognized as the least important factor. These findings of the impact of conditioning factors for SESA are similar in other regions (Arabameri et al., 2019a; Hosseinalizadeh et al., 2019). For the ANN, TWI, slope, and land use were the most effective factors for prediction, which are followed by NDVI, land use, and distance from the river. The results from FDA indicated that the most important conditioning factors are the TWI, slope, and elevation, geology, and NDVI. The TWI has an important impact on SESA in all three models. This is because the study watershed predominantly has low slopes and elevation. The opposite result of this finding was obtained by Silva et al. (2023).
A large area of the watershed is land with typically little rain and vegetation cover such that bare soil is the main physical attribute in the watershed. This kind of surface is known to be prone to water-induced soil erosion, when rain events occur. The erosion can be particularly pronounced over slopes. This understanding is consistent with all algorithms, pointing to a major role of the TWI and slope for SESA.
Some environmental factors (rainfall, TWI, slope, elevation, and geology) influence SESA more than DSSA. Land use as a human-induced conditioning factor, however, affects both SESA and DSSA, which underlines the importance of land-use planning and management.
3.2.2 Spatial modeling of SESA
Figure 6 shows the SESA predictions from the three machine learning algorithms, classified by the soil erosion risk in the ArcGIS environment. Validation of the three machine learning algorithms highlights that RF was again the most reliable algorithm amongst the three, indicated by the best prediction rate. Based on the ROC, RF yields a 94 % accuracy for SESA (Fig. 6c). The ROC coefficients of the ANN and FDA were slightly lower but still high with an accuracy of 91 % and 89 %, respectively. In the case of the TSS index, better performance was obtained again for RF (89 %) rather than the ANN (78 %) and FDA (78 %). The high performance of RF model in classification issues is related to its potential to handle big datasets and apply a large number of conditioning factors (Naghibi et al., 2018). In addition, Rahmati et al. (2020b) state that high accuracy of RF is the result of several advantages of this model, such as its iterative nature and ability to prevent problems by overfitting (Rahmati et al., 2020a).
The majority of the land in the watershed (81 %) has a high and very high risk for water-induced soil erosion by RF. This is slightly lower than for the ANN and FDA which classified 85 % and 89 % of the watershed as highly and very highly susceptible areas. The highly and very highly susceptible areas for water-driven soil erosion are mostly located in the north and southwest parts of the watershed. The highly and very highly susceptible areas have socio-economic implications, particularly because most settlements and cities of the watershed are located in the same regions. This can mean that human activity is a contributing factor to the water-induced soil erosion. Mutually, intensified soil erosion might lead to migration of resident people to other places and even other countries.
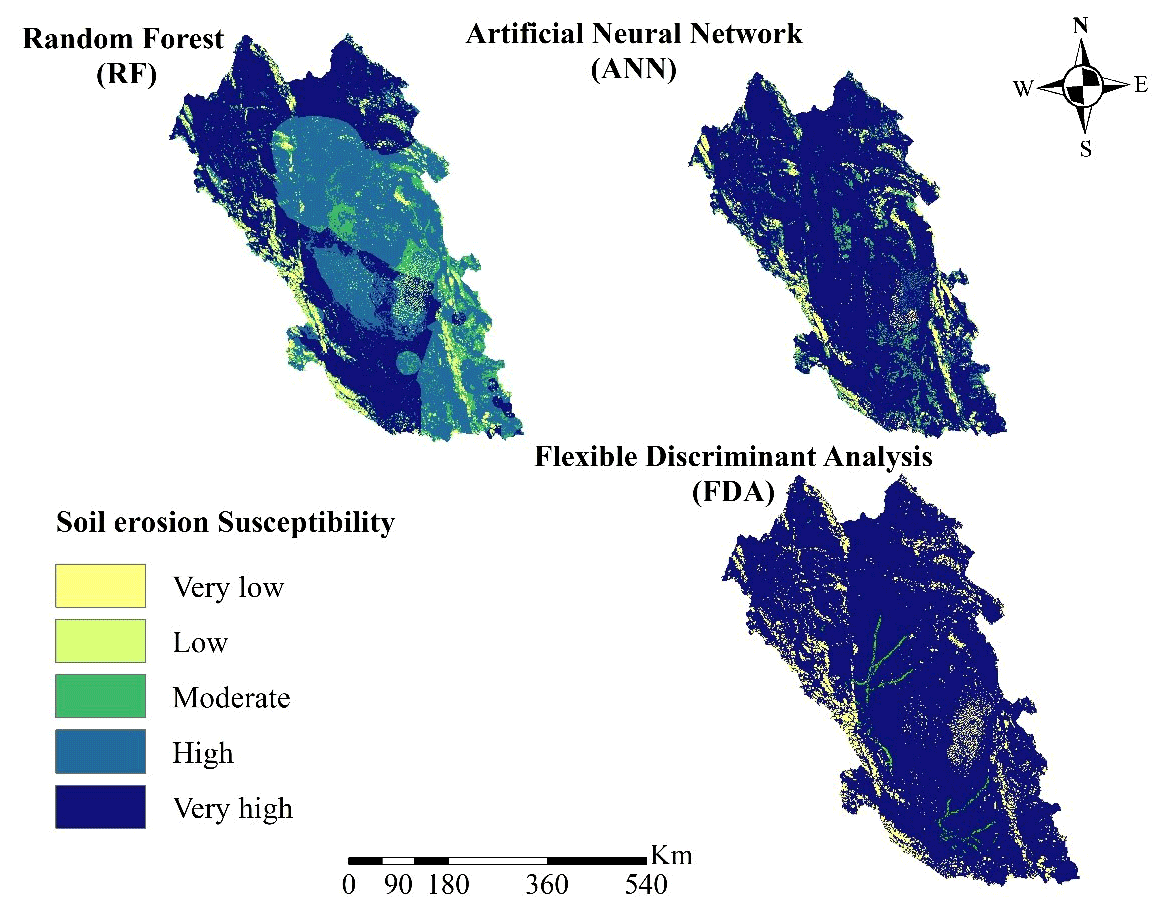
Figure 6Soil gully erosion susceptibility map (GESM) using random forest (RF), artificial neural network (ANN), and flexible discriminant analysis (FDA) algorithms.
3.3 Land degradation susceptibility
The majority of the study watershed is susceptible to a substantial risk for land degradation. The spatial distribution of land degradation susceptibility, shown in Fig. 7, indicates that only 4 % of the land area has low to very low risks of land degradation. Areas susceptible to soil erosion by both water and winds together constitute 43 % of the total area. Approximately 45 % and 8 % of the study area are at risk of soil erosion by water and wind, respectively. Taken together, it means that the majority of the Lut watershed falls under the category of land degradation risks. The watershed accounts for 12.5 % of the total land of Iran. The findings of the present study are therefore consistent with a report that indicated that water erosion is an environmental hazard in Iran (Tien Bui et al., 2019). The results of the study will be helpful and applicable for identifying water-induced and dust source hotspots across the watershed and prioritizing appropriate conservation measurements and rehabilitative policies.
The areas that fall under the category of both kinds of land degradation might be most vulnerable concerning local self-sufficiency for food security and sustainability of human activities. For instance, dust storms drive water loss through failure of agricultural crops in Iran (Boroughani et al., 2022). Moreover, the adverse impacts of water-induced soil erosion are known from numerous other regions (Lal and Moldenhauer, 2008; Gao et al., 2015; Panagos et al., 2018; Roy et al., 2022).
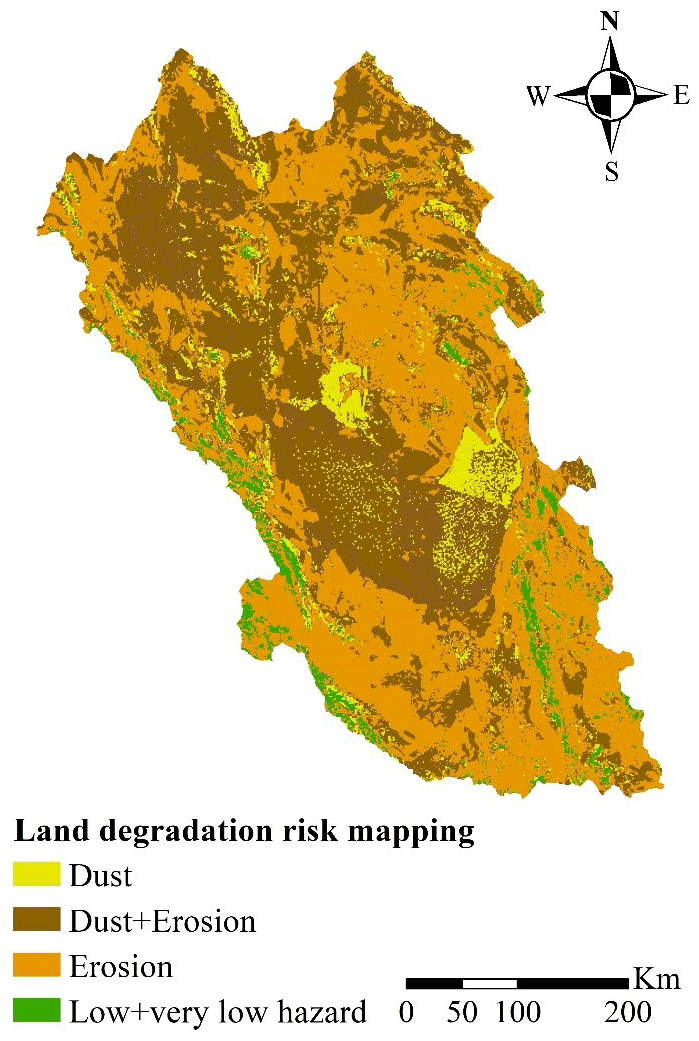
Figure 7Land degradation susceptibility map in terms of soil erosion and dust source areas.
Investigation of soil erosion through water, along with wind-driven soil erosion from dust sources, has received little attention in past studies, despite the importance for land degradation with associated social, economic, and environmental impacts. The present study used several different datasets, conducted a field survey, and paired the data with three different machine learning algorithms to construct spatial maps for areas of risk for land degradation for the Lut watershed in Iran. Three machine learning algorithms were successfully applied to create land susceptibility maps describing dust aerosol occurrence considering methodological uncertainty. In addition, these models were used to identify the areas prone to soil erosion by surface water runoff. These obtained maps were synthesized to generate a single map for risks of land degradation.
The results of the present study show that the random forest algorithm outperformed the other two machine learning approaches for both dust sources and soil erosion susceptibility mapping, with an accuracy of 75 % and 94 %, respectively.
As expected, the vegetation cover, elevation, land use, and geology were important prerequisites for dust-emission occurrence in the watershed, while rainfall, the topographical wetness index (TWI), terrain slope, terrain elevation, land use, and geology were identified as the most influential factors for water-induced soil erosion.
Based on the land degradation map, almost the entire study region is at risk. A large fraction of 43 % of the area is prone to both high wind-driven and water-driven soil erosion. In addition to these areas, another 45 % and 8 % of the area are at risk of water-driven and wind-driven soil erosion, respectively. The methods tested in this study could be later transferred to similar assessments in other regions around the world. Choosing this region in Iran is further motivated by the impact of land degradation on the country's economy. The current study has some limitations, including the small sample size and non-uniform distribution of water-induced soil erosion points because of lack of accessibility to a road network in some parts of the watershed. Despite these limitations, these results can potentially be useful for managers and policymakers to identify local hotspots for land degradation to implement mitigation and adaptation measures in this watershed. Future studies could work on improving the spatial resolution and coverage of the risk assessment for providing more information on risks for land degradation. In addition, it is suggested that future research should estimate the role of other climatic factors such as humidity and air temperature in soil erosion and dust source susceptibility. Prediction of NDVI and rainfall as the most effective factors on soil erosion and dust sources and estimation of their impacts on future water-induced soil erosion and dust source susceptibility are also suggested for the other studies. This requires more measurements for soil erosion by water and winds to train the machine learning models.
Code is available at https://cran.r-project.org/web/packages/biomod2/index.html (Thuiller et al., 2016).
All data compiled in this study are published in the figures. Detailed primary data are available upon request from the corresponding author.
FM conceptualized, collected, and processed the data; carried out the analysis; visualized the results; and wrote, reviewed, and edited the paper. MB collected data; carried out the analysis; and wrote, reviewed, and edited the paper. MH collected data and reviewed and edited the paper. SF supervised and conceptualized the work and wrote, reviewed, and edited the paper.
The contact author has declared that none of the authors has any competing interests.
Publisher’s note: Copernicus Publications remains neutral with regard to jurisdictional claims in published maps and institutional affiliations.
Stephanie Fiedler acknowledges funding from the German Research Foundation (DFG) for SFB 1502/1–2022 (Project: 450058266).
This research has been supported by Hakim Sabzevari University (to Mahdi Boroughani). Stephanie Fiedler was funded by the German Research Foundation (DFG) for SFB 1502/1–2022 (Project: 450058266).
This paper was edited by Carolina Boix-Fayos and reviewed by three anonymous referees.
Amiri, M., Pourghasemi, H. R., Ghanbarian, G. A., and Afzali, S. F.: Assessment of the importance of gully erosion effective factors using Boruta algorithm and its spatial modeling and mapping using three machine learning algorithms, Geoderma, 340, 55–69, https://doi.org/10.1016/j.geoderma.2018.12.042, 2019.
Anache, J. A. A., Flanagan, D. C., Srivastava, A., and Wendland, E. C.: Land use and climate change impacts on runoff and soil erosion at the hillslope scale in the Brazilian Cerrado, Sci. Total Environ., 622, 140–151, https://doi.org/10.1016/j.scitotenv.2017.11.257, 2018
Arabameri, A., Chen, W., Loche, M., Zhao, X., Li, Y., Lombardo, L., Cerda, A., Pradhan, B., and Bui, D. T.: Comparison of machine learning models for gully erosion susceptibility mapping, Geosci. Front., 11, 1609–1620, https://doi.org/10.1016/j.gsf.2019.11.009, 2019a.
Arabameri, A., Pradhan, B., and Rezaei, K.: Gully erosion zonation mapping using integrated geographically weighted regression with certainty factor and random forest models in GIS, J. Environ. Manag., 232, 928–942, https://doi.org/10.1016/j.jenvman.2018.11.110, 2019b.
Avand, M., Moradi, H. R., and Lasboyee, M. R.: Spatial prediction of future flood risk: An approach to the effects of climate change, Geosciences, 11, 1–20, https://doi.org/10.3390/geosciences11010025, 2021.
Beven, K. J. and Kirkby, M. J.: A physically based, variable contributing area model of basin hydrology/Un modèle à base physique de zone d'appel variable de l'hydrologie du bassin versant, Hydrol. Sci. J., 24, 43–69, 1979.
Boroughani, M., Mohammadi, M., Mirchooli, F., and Fiedler, S.: Assessment of the impact of dust aerosols on crop and water loss in the Great Salt Desert in Iran, Comput. Electron. Agr., 192, 106605, https://doi.org/10.1016/j.compag.2021.106605, 2022.
Boroughani, M. and Pourhashemi, S.: Susceptibility Zoning of Dust Source Areas by Data Mining Methods over Khorasan Razavi Province, Q. J. Environ. Erosion Res., 9, 1–22, 2020.
Boroughani, M., Pourhashemi, S., Hashemi, H., Salehi, M., Amirahmadi, A., Asadi, M. A., and Berndtsson, R.: Application of remote sensing techniques and machine learning algorithms in dust source detection and dust source susceptibility mapping, Ecol. Inform., 56, 101059, https://doi.org/10.1016/j.ecoinf.2020.101059, 2020.
Boroughani, M., Pourhashemi, S., Gholami, H., and Kaskaoutis, D. G.: 2021. Predicting of dust storm source by combining remote sensing, statistic-based predictive models and game theory in the Sistan watershed, southwestern Asia, J. Arid Land., 13, 1103–1121, 2021.
Breiman, L.: Random forests, Mach Learn., 45, 5–32, https://doi.org/10.1023/A:1010933404324, 2001.
Chicas, S. D., Omine, K., and Ford, J. B.: Identifying erosion hotspots and assessing communities perspectives on the drivers, underlying causes and impacts of soil erosion in Toledo's Rio Grande Watershed: Belize, Appl. Geogr., 68, 57–67, https://doi.org/10.1016/j.apgeog.2015.11.010, 2016.
Darvand, S., Khosravi, H., Keshtkar, H., Zehtabian, G., and Rahmati, O.: Comparison of machine learning models to prioritize susceptible areas to dust production, J. Watershed Manag. Res., 74, 53–68, 2021.
Derakhshan-Babaei, F., Mirchooli, F., Mohammadi, M., Nosrati, K., and Egli, M.: Tracking the origin of trace metals in a watershed by identifying fingerprints of soils, landscape and river sediments, Sci. Total Environ., 835, 155583, https://doi.org/10.1016/j.scitotenv.2022.155583, 2022.
Duniway, M. C., Pfennigwerth, A. A., Fick, S. E., Nauman, T. W., Belnap, J., and Barger, N. N.: Wind erosion and dust from US drylands: a review of causes, consequences, and solutions in a changing world, Ecosphere., 10, e02650, https://doi.org/10.1002/ecs2.2650, 2019.
Ebrahimi-khusfi, Z., Taghizadeh-mehrjardi, R., and Mirakbari, M.: Evaluation of machine learning models for predicting the temporal variations of dust storm index in arid regions of Iran, Atmos. Pollut. Res., 12, 134–147, https://doi.org/10.1016/j.apr.2020.08.029, 2021.
Emadodin, I., Narita, D., and Rudolf, H.: Soil degradation and agricultural sustainability: an overview from Iran, Environ. Dev. Sustain., 14, 611–625, https://doi.org/10.1007/s10668-012-9351-y, 2012.
Gao, L., Bowker, M. A., Xu, M., Sun, H., Tuo, D., and Zhao, Y.: Biological soil crusts decrease erodibility by modifying inherent soil properties on the Loess Plateau, China, Soil Biol. Biochem., 105, 49–58, https://doi.org/10.1016/j.soilbio.2016.11.009, 2017.
Gao, X., Xie, Y., Liu, G., Liu, B., and Duan, X.: Effects of soil erosion on soybean yield as estimated by simulating gradually eroded soil profiles, Soil Till. Res., 145, 126–134, 2015.
Gherboudj, I., Beegum, S. N., and Ghedira, H.: Identifying natural dust source regions over the Middle-East and North-Africa: Estimation of dust emission potential, Earth-Sci. Rev., 165, 342–355, https://doi.org/10.1016/j.earscirev.2016.12.010, 2017.
Gholami, H., Kordestani, M. D., Li, J., Telfer, M. W., and Fathabadi, A.: Diverse sources of aeolian sediment revealed in an arid landscape in southeastern Iran using a modified Bayesian un-mixing model, Aeolian Res., 41, 100547, https://doi.org/10.1016/j.aeolia.2019.100547, 2019a.
Gholami, H., Mohammadifar, A., and Collins, A. L.: Spatial mapping of the provenance of storm dust: Application of data mining and ensemble modelling Hamid, Atmos. Res., 233, 104716, https://doi.org/10.1016/j.atmosres.2019.104716, 2019b.
Gholami, H., Mohamadifar, A., Sorooshian, A., and Jansen, J. D.: Machine-learning algorithms for predicting land susceptibility to dust emissions: The case of the Jazmurian Basin, Iran, Atmos. Pollut. Res., 11, 1303–1315, https://doi.org/10.1016/j.apr.2020.05.009, 2020a.
Gholami, H., Mohammadifar, A., Pourghasemi, H. R., and Collins, A. L.: A new integrated data mining model to map spatial variation in the susceptibility of land to act as a source of aeolian dust, Environ. Sci. Pollut. Res., 27, 42022–42039, 2020b.
Ghorbanzadeh, O., Valizadeh Kamran, K., Blaschke, T., Aryal, J., Naboureh, A., Einali, J., and Bian, J.: Spatial Prediction of Wildfire Susceptibility Using Field Survey GPS Data and Machine Learning Approaches, Fire, 2, 1–23, 2019.
Gia, T., Degener, J., and Kappas, M.: Integrated universal soil loss equation (USLE) and Geographical Information System (GIS) for soil erosion estimation in A Sap basin: Central Vietnam, Int. Soil Water Conserv. Res., 6, 99–110, https://doi.org/10.1016/j.iswcr.2018.01.001, 2018.
Halecki, W., Kruk, E., and Ryczek, M.: Land Use Policy Loss of topsoil and soil erosion by water in agricultural areas: A multi- criteria approach for various land use scenarios in the Western Carpathians using a SWAT model, Land Use Policy, 73, 363–372, https://doi.org/10.1016/j.landusepol.2018.01.041, 2018.
Hao, J., Ma, C., Gao, C., Qiu, J., Wang, M., Zhang, Y., and Xu, P.: Pseudomonas stutzeri as a novel biocatalyst for pyruvate production from DL-lactate, Biotechnol. Lett., 29, 105–110, https://doi.org/10.1007/s10529-006-9204-6, 2007.
Hosseinalizadeh, M., Kariminejad, N., Rahmati, O., Keesstra, S., Alinejad, M., and Behbahani, A. M.: How can statistical and artificial intelligence approaches predict piping erosion susceptibility?, Sci. Total Environ., 646, 1554–1566, https://doi.org/10.1016/j.scitotenv.2018.07.396, 2019.
Hahnenberger, M. and Nicoll, K.: Geomorphic and land cover identification of dust sources in the eastern Great Basin of Utah, USA, Geomorphology, 204, 657–672, https://doi.org/10.1016/j.geomorph.2013.09.013, 2014.
Jafari, M., Mesbahzadeh, T., Masoudi, R., Zehtabian, G., and Amouei Torkmahalleh, M.: Dust storm surveying and detection using remote sensing data, wind tracing, and atmospheric thermodynamic conditions (case study: Isfahan Province, Iran), Air Qual. Atmos. Health., 14, 1301–1311, 2021.
Kalantar, B., Pradhan, B., Naghibi, S. A., Motevalli, A., and Mansor, S.: Assessment of the effects of training data selection on the landslide susceptibility mapping: a comparison between support vector machine (SVM), logistic regression (LR) and artificial neural networks (ANN), Geomatics, Nat. Hazards Risk., 5705, 1–21, https://doi.org/10.1080/19475705.2017.1407368, 2017.
Kalantar, B., Ueda, N., Saeidi, V., Ahmadi, K., Halin, A. A., and Shabani, F.: Landslide susceptibility mapping: Machine and ensemble learning based on remote sensing big data, Remote Sens., 12, 1–23, https://doi.org/10.3390/rs12111737, 2020.
Kim, J. W. and Kim, H. G.: Landslide susceptibility analysis by type of cultural heritage site using ensemble model: Case study of the Chungcheong Region of South Korea, Sens. Mater., 33, 3819–3833, https://doi.org/10.18494/SAM.2021.3593, 2021.
Lal, R. and Moldenhauer, W. C.: Effects of soil erosion on crop productivity, Effects of soil erosion on crop productivity, Crit. Rev. Plant Sci., 5, 303–367, https://doi.org/10.1080/07352688709382244, 2008.
Lee, J. A., Gill, T. E., Mulligan, K. R., Acosta, M. D., and Perez, A. E.: Land use/land cover and point sources of the 15 December 2003 dust storm in southwestern North America, Geomorphology, 105, 18–27, 2009.
Lee, S., Hong, S.-M., and Jung, H. S.: GIS-based groundwater potential mapping using artificial neural network and support vector machine models: the case of Boryeong city in Korea, Geocarto Int., 6049, 1–15, https://doi.org/10.1080/10106049.2017.1303091, 2017.
Lei, L., Huang, X., Zhang, S., Yang, J., Yang, L., and Xu, M.: Comparison of prevalence and associated factors of anxiety and depression among people affected by versus people unaffected by quarantine during the COVID-19 epidemic in Southwestern China, Med. Sci. Monit., 26, e924609-1, https://doi.org/10.12659/MSM.924609, 2020.
Miller, S. D.: A consolidated technique for enhancing desert dust storms with MODIS, Geophys. Res. Lett., 30, https://doi.org/10.1029/2003GL018279, 2003.
Mirchooli, F., Motevalli, A., Pourghasemi, H. R., Mohammadi, M., Bhattacharya, P., Maghsood, F. F., and Tiefenbacher, J. P.: How do data-mining models consider arsenic contamination in sediments and variables importance?, Environ. Monit. Assess., 191, 1–19, https://doi.org/10.1007/s10661-019-7979-x, 2019.
Moridnejad, A., Karimi, N., and Ariya, P. A.: Newly desertified regions in Iraq and its surrounding areas: Significant novel sources of global dust particles, J. Arid. Environ., 116, 1–10, https://doi.org/10.1016/j.jaridenv.2015.01.008, 2015.
Mosavi, A., Golshan, M., Janizadeh, S., Choubin, B., Melesse, A. M., and Dineva, A. A.: Ensemble models of GLM, FDA, MARS, and RF for flood and erosion susceptibility mapping: a priority assessment of sub-basins, Geocarto Int., 37, 2541–2560, https://doi.org/10.1080/10106049.2020.1829101, 2020.
Naghibi, S. A., Ahmadi, K., and Daneshi, A.: Application of Support Vector Machine, Random Forest, and Genetic Algorithm Optimized Random Forest Models in Groundwater Potential Mapping, Water Resour. Manag., 31, 2761–2775, https://doi.org/10.1007/s11269-017-1660-3, 2017.
Panagos, P., Standardi, G., Borrelli, P., Lugato, E., Montanarella, L., and Bosello, F.: Cost of agricultural productivity loss due to soil erosion in the European Union: From direct cost evaluation approaches to the use of macroeconomic models, Land. Degrad. Dev., 29, 471–484, https://doi.org/10.1002/ldr.2879, 2018.
Park, S. S., Kim, J., Lee, J., Lee, S., Kim, J. S., Chang, L. S., and Ou, S.: Combined dust detection algorithm by using MODIS infrared channels over East Asia, Remote Sens. Environ., 141, 24–39, https://doi.org/10.1016/j.rse.2013.09.019, 2014.
Péré, J. C., Rivellini, L., Crumeyrolle, S., Chiapello, I., Minvielle, F., Thieuleux, F., Choël, M., and Popovici, I.: Simulation of African dust properties and radiative effects during the 2015 SHADOW campaign in Senegal, Atmos. Res., 199, 14–28, 2018.
Pournader, M., Ahmadi, H., Feiznia, S., Karimi, H., and Peirovan, H. R.: Spatial prediction of soil erosion susceptibility: an evaluation of the maximum entropy model, Earth Sci. Inform., 11, 389–401, https://doi.org/10.1007/s12145-018-0338-6, 2018.
Qu, J. J., Hao, X., Kafatos, M., and Wang, L.: Asian dust storm monitoring combining Terra and Aqua MODIS SRB measurements, IEEE Geosci. Remote. Sens. Lett., 3, 484–486, https://doi.org/10.1109/LGRS.2006.877752, 2006.
Rahmati, O., Pourghasemi, H. R., and Melesse, A. M.: Application of GIS-based data driven random forest and maximum entropy models for groundwater potential mapping: a case study at Mehran Region, Iran, Catena., 137, 360–372, https://doi.org/10.1016/j.catena.2015.10.010, 2016.
Rahmati, O., Mohammadi, F., Ghiasi, S. S., Tiefenbacher, J., Moghaddam, D. D., Coulon, F., Nalivan, O. A., and Bui, D. T.: Identifying sources of dust aerosol using a new framework based on remote sensing and modelling, Sci. Total Environ., 737, 139508, https://doi.org/10.1016/j.scitotenv.2020.139508, 2020a.
Rahmati, O., Pourghasemi, H. R., and Melesse, A. M.: Application of GIS-based data driven random forest and maximum entropy models for groundwater potential mapping: A case study at Mehran Region, Iran, Catena, 137, 360–372, https://doi.org/10.1016/j.catena.2015.10.010, 2020b.
Roy, J. and Saha, S.: GIS-based Gully Erosion Susceptibility Evaluation Using Frequency Ratio, Cosine Amplitude and Logistic Regression Ensembled with fuzzy logic in Hinglo River Basin, India, Remote Sens. Appl., 15, 100247, https://doi.org/10.1016/j.rsase.2019.100247, 2019.
Sakizadeh, M., Mirzaei, R., and Ghorbani, H.: Support vector machine and artificial neural network to model soil pollution: a case study in Semnan Province, Iran, Neural. Comput. Appl., 28, 3229–3238, https://doi.org/10.1007/s00521-016-2231-x, 2017.
Shi, P., Yan, P., Yuan, Y., and Nearing, M. A.: Wind erosion research in China: Past, present and future, Prog. Phys. Geogr., 28, 366–386, https://doi.org/10.1191/0309133304pp416ra, 2004.
Shit, P. K., Pourghasemi, H. R., and Bhunia, G. S.: Gully erosion studies from India and surrounding regions, Springer, https://doi.org/10.1007/978-3-030-23243-6, 2020.
Sholagberu, A. T., Raza, M. M., Yusof, K. W., and Mustafa, H. A.: Assessing the influence of terrain characteristics on spatial distribution of satellite derived land surface parameters in mountainous areas, in: Proceedings of the IAHR World Congress, 2897–2906, 2017.
Silva, L. D. C. M., Peixoto, D. S., Azevedo, R. P., Avanzi, J. C., Junior, M. D. S. D., Vanella, D., Consoli, S., Acuña-Guzman, S. F., Borghi, E., de Resende, Á. V., and Silva, B. M.: Assessment of soil water content variability using electrical resistivity imaging in an Oxisol under conservation cropping systems, Geoderma Reg., 33, e00624, https://doi.org/10.1016/j.geodrs.2023.e00624, 2023.
Sissakian, V., Al-Ansari, N., and Knutsson, S.: Sand and dust storm events in Iraq, J. Nat. Sci., 5, 1084–1094, https://doi.org/10.4236/ns.2013.510133, 2013.
Sun, W., Shao, Q., Liu, J., and Zhai, J.: Assessing the effects of land use and topography on soil erosion on the Loess Plateau in China, Catena, 121, 151–163, https://doi.org/10.1016/j.catena.2014.05.009, 2014.
Tehrany, M. S., Pradhan, B., and Jebur, M. N.: Flood susceptibility mapping using a novel ensemble weights-of-evidence and support vector machine models in GIS, J. Hydrol., 512, 332–343, https://doi.org/10.1016/j.jhydrol.2014.03.008, 2014.
Thuiller, W., Georges, D., Engler, R., Breiner, F., Georges, M. D., and Thuiller, C. W.: Package “biomod2”, Species distribution modeling within an ensemble forecasting framework [code], https://cran.r-project.org/web/packages/biomod2/index.html (last access: September 2022), 2016.
Tien Bui, D., Shirzadi, A., Shahabi, H., Chapi, K., Omidavr, E., Pham, B. T., Talebpour Asl, D., Khaledian, H., Pradhan, B., Panahi, M., and Bin Ahmad, B.: A novel ensemble artificial intelligence approach for gully erosion mapping in a semi-arid watershed (Iran), Remote Sens., 29, 19, 2444, https://doi.org/10.3390/s19112444, 2019.
Torabi Haghighi, A., Darabi, H., Karimidastenaei, Z., Davudirad, A. A., Rouzbeh, S., Rahmati, O., Sajedi-Hosseini, F., and Klöve, B.: Land degradation risk mapping using topographic, human-induced, and geo-environmental variables and machine learning algorithms, for the Pole-Doab watershed, Iran, Environ. Earth Sci., 80, 1–21, https://doi.org/10.1007/s12665-020-09327-2, 2021.
Yang, M., Zhu, X., Pan, H., Ai, W., Song, W., and Pan, Y.: Changes of the relationship between spring sand dust frequency and large-scale atmospheric circulation, Atmos. Res., 226, 102–109, https://doi.org/10.1016/j.atmosres.2019.04.004, 2019
Youssef, A. M. and Pourghasemi, H. R.: Landslide susceptibility mapping using machine learning algorithms and comparison of their performance at Abha Basin, Asir Region, Saudi Arabia, Geosci. Front., 12, 639–655, 2021
Vickery, K. and Eckardt, F.: Dust emission controls on the lower Kuiseb River valley, central Namib, Aeolian Res., 10, 125–133, https://doi.org/10.1016/j.aeolia.2013.02.006, 2013.
Walker, A. L., Liu, M., Miller, S. D., Richardson, K. A., and Westphal, D. L.: Development of a dust source database for mesoscale forecasting in Southwest Asia, J. Geophys. Res., 114, 1–24, https://doi.org/10.1029/2008JD011541, 2009.
Wieland, R., Lakes, T., Yunfeng, H., and Nendel, C.: Identifying drivers of land degradation in Xilingol, China, between 1975 and 2015, Land Use Policy, 83, 543–559, https://doi.org/10.1016/j.landusepol.2019.02.013, 2019.
Zabihi, M., Mirchooli, F., Motevalli, A., Darvishan, A. K., Pourghasemi, H. R., Zakeri, M. A., and Sadighi, F.: Spatial modelling of gully erosion in Mazandaran Province, northern Iran, Catena, 161, 1–13, https://doi.org/10.1016/j.catena.2017.10.010, 2018.