the Creative Commons Attribution 4.0 License.
the Creative Commons Attribution 4.0 License.
 | 11 Jul 2023
Validating plutonium-239+240 as a novel soil redistribution tracer – a comparison to measured sediment yield
Katrin Meusburger
Paolo Porto
Judith Kobler Waldis
Christine Alewell
Quantifying soil redistribution rates is a global challenge addressed with direct sediment measurements (e.g. traps), models, and isotopic, geochemical, and radionuclide tracers. The isotope of plutonium, namely 239+240Pu, is a relatively new soil redistribution tracer in this challenge. Direct validation of 239+240Pu as a soil redistribution tracer is, however, still missing. We used a unique sediment yield time series in southern Italy, reaching back to the initial fallout of 239+240Pu to verify 239+240Pu as a soil redistribution tracer. Distributed soil samples (n=55) were collected in the catchment, and at undisturbed reference sites (n=22), 239+240Pu was extracted, measured with inductively coupled plasma mass spectrometry (ICP-MS), and converted to soil redistribution rates. Finally, we used a generalized additive model (GAM) to regionalize soil redistribution estimates for the catchment. For the catchment sites, mean 239+240Pu inventories were significantly reduced (16.8 ± 10.2 Bq m−2) compared to the reference inventory (40.5 ± 3.5 Bq m−2), indicating the dominance of erosion. Converting these inventory losses into soil erosion rates resulted in an average soil loss of 22.2 ± SD 7.2 t ha−1 yr−1. The uncertainties of the approach stemmed mainly from the high measurement uncertainties of some low-activity samples where samples have been bulked over depth. Therefore, we recommend taking incremental soil samples and extracting larger soil volumes (∼ 20 g). The geographic coordinates and the flow accumulation best described the spatial pattern of erosion rates in the GAM model. Using those predictors to upscale Pu-derived soil redistribution rates for the entire catchment resulted in an average on-site loss of 20.7 t ha−1 yr−1, which corresponds very well to the long-term average sediment yield of 18.7 t ha−1 yr−1 measured at the catchment outlet and to 137Cs-derived soil redistribution rates. Overall, this comparison of Pu-derived soil redistribution rates with measured sediment yield data validates 239+240Pu as a suitable retrospective soil redistribution tracer.
- Article
(4363 KB) - Full-text XML
- BibTeX
- EndNote


Soil erosion endangers climate and food security and has considerable adverse off-site effects on freshwater systems (Reichstein et al., 2013; Amundson et al., 2015; Alewell et al., 2016; Panagos et al., 2016; Borrelli et al., 2017; Alewell et al., 2020). Plutonium isotopes, with their previous hazardous impacts on the environment and being released as a product of thermonuclear weapons testing and from nuclear accidents (e.g. Chernobyl), may serve as a tool to quantify long-term soil loss (Alewell et al., 2017).
The approach to use 239+240Pu as soil and sediment tracer is similar to other fallout radionuclides (FRNs) (Xu et al., 2015; Meusburger et al., 2018). Once deposited on the ground, FRNs strongly bind to soil particles and move across the landscape primarily through physical soil redistribution processes (IAEA, 2014). In this way, fallout radionuclides provide an effective and retrospective (from the time of the fallout) track of net soil and sediment redistribution (Zapata, 2003). However, 137Cs, the most commonly applied soil redistribution tracer, will reach its detection limit soon due to the successive decay (half life of 30.17 years). Thus, alternative tracers like excess Pb-210 and 239+240Pu have been explored (Wallbrink and Murray, 1996; Matisoff et al., 2002; Mabit et al., 2008; Kato et al., 2010; Porto et al., 2013; Teramage et al., 2015; Xu et al., 2015; Meusburger et al., 2018). While Pb-210 is associated with high uncertainties (Porto and Walling, 2012; Mabit et al., 2014; Meusburger et al., 2018), the characteristics of 239+240Pu seem more promising for soil tracing (Alewell et al., 2017).
The advent of 239+240Pu as a soil redistribution tracer was accelerated by the adoption of the less time-consuming (minutes instead of hours per sample) inductively coupled plasma mass spectrometry (ICP-MS). It was a door-opener for using 239+240Pu as a soil erosion tracer. The application of 239+240Pu comes along with other advantages, such as (i) reduced initial spatial variability at undisturbed, so-called reference sites (Alewell et al., 2014; Meusburger et al., 2016); (ii) less preferential uptake by plants (Froehlich et al., 2016); (iii) the possibility to assess the origin of the fallout by determining 240Pu-to-239Pu atom ratios or 137Cs-to-239+240Pu activity ratios (Ketterer et al., 2004; Xu et al., 2013; Meusburger et al., 2016, 2020); (iv) considerably smaller soil sample volume needed for analysis; and (v) no decline due to decay, which is of particular relevance for locations with low initial 137Cs fallout such as the Southern Hemisphere (Tims et al., 2010). The potential of 239+240Pu further convenes with the availability of the new conversion model Modelling Deposition and Erosion rates with RadioNuclides (MODERN), suitable for estimating soil redistribution rates by comparing references with soil redistribution-affected inventories with any FRN (Arata et al., 2016a, b).
Several studies (Schimmack et al., 2001; Tims et al., 2010; Hoo et al., 2011; Lal et al., 2013; Michelotti et al., 2013; Xu et al., 2013, 2015; Meusburger et al., 2018) have highlighted 239+240Pu's suitability as a soil redistribution tracer. However, to date, direct validation efforts to compare on-site FRN-based soil erosion rates with off-site sediment yields have focused on other FRNs such as 137Cs and excess 210Pb (Porto et al., 2001, 2003; Porto and Walling, 2012; Porto and Callegari, 2022). For 239+240Pu-derived soil redistribution rates, such a direct validation is not achieved yet, to the best of our knowledge. This study aims to fill this gap by validating 239+240Pu-derived soil redistribution rates with a long-term time series of measured catchment suspended sediment yields.
2.1 Study site and soil sampling
This study takes advantage of a unique long-term sediment yield monitoring catchment (W2; 1.38 ha) located near Crotone in Calabria, southern Italy (35 m a.s.l.; 39∘09′02′′ N, 17∘08′10′′ E). The steep catchment with a mean average slope of ca. 35 % is located in the ephemeral headwaters of the larger Crepacuore Basin (Fig. 1). The geology of this area consists of Upper Pliocene and Quaternary materials and produced soils with a clay loam texture with 14.6 %, 49.2 %, and 36.2 % of sand, silt, and clay, respectively. The catchment was never ploughed, but in 1968, Eucalyptus occidentalis Engl. was planted and cut again in 1978 and 1990. The tree cover is partly patchy, with about 20 % of the area on south-facing slopes having discontinuous tree and grass cover. The climate is Mediterranean, with a mean annual precipitation of ∼ 670 mm, predominantly occurring from October to March.
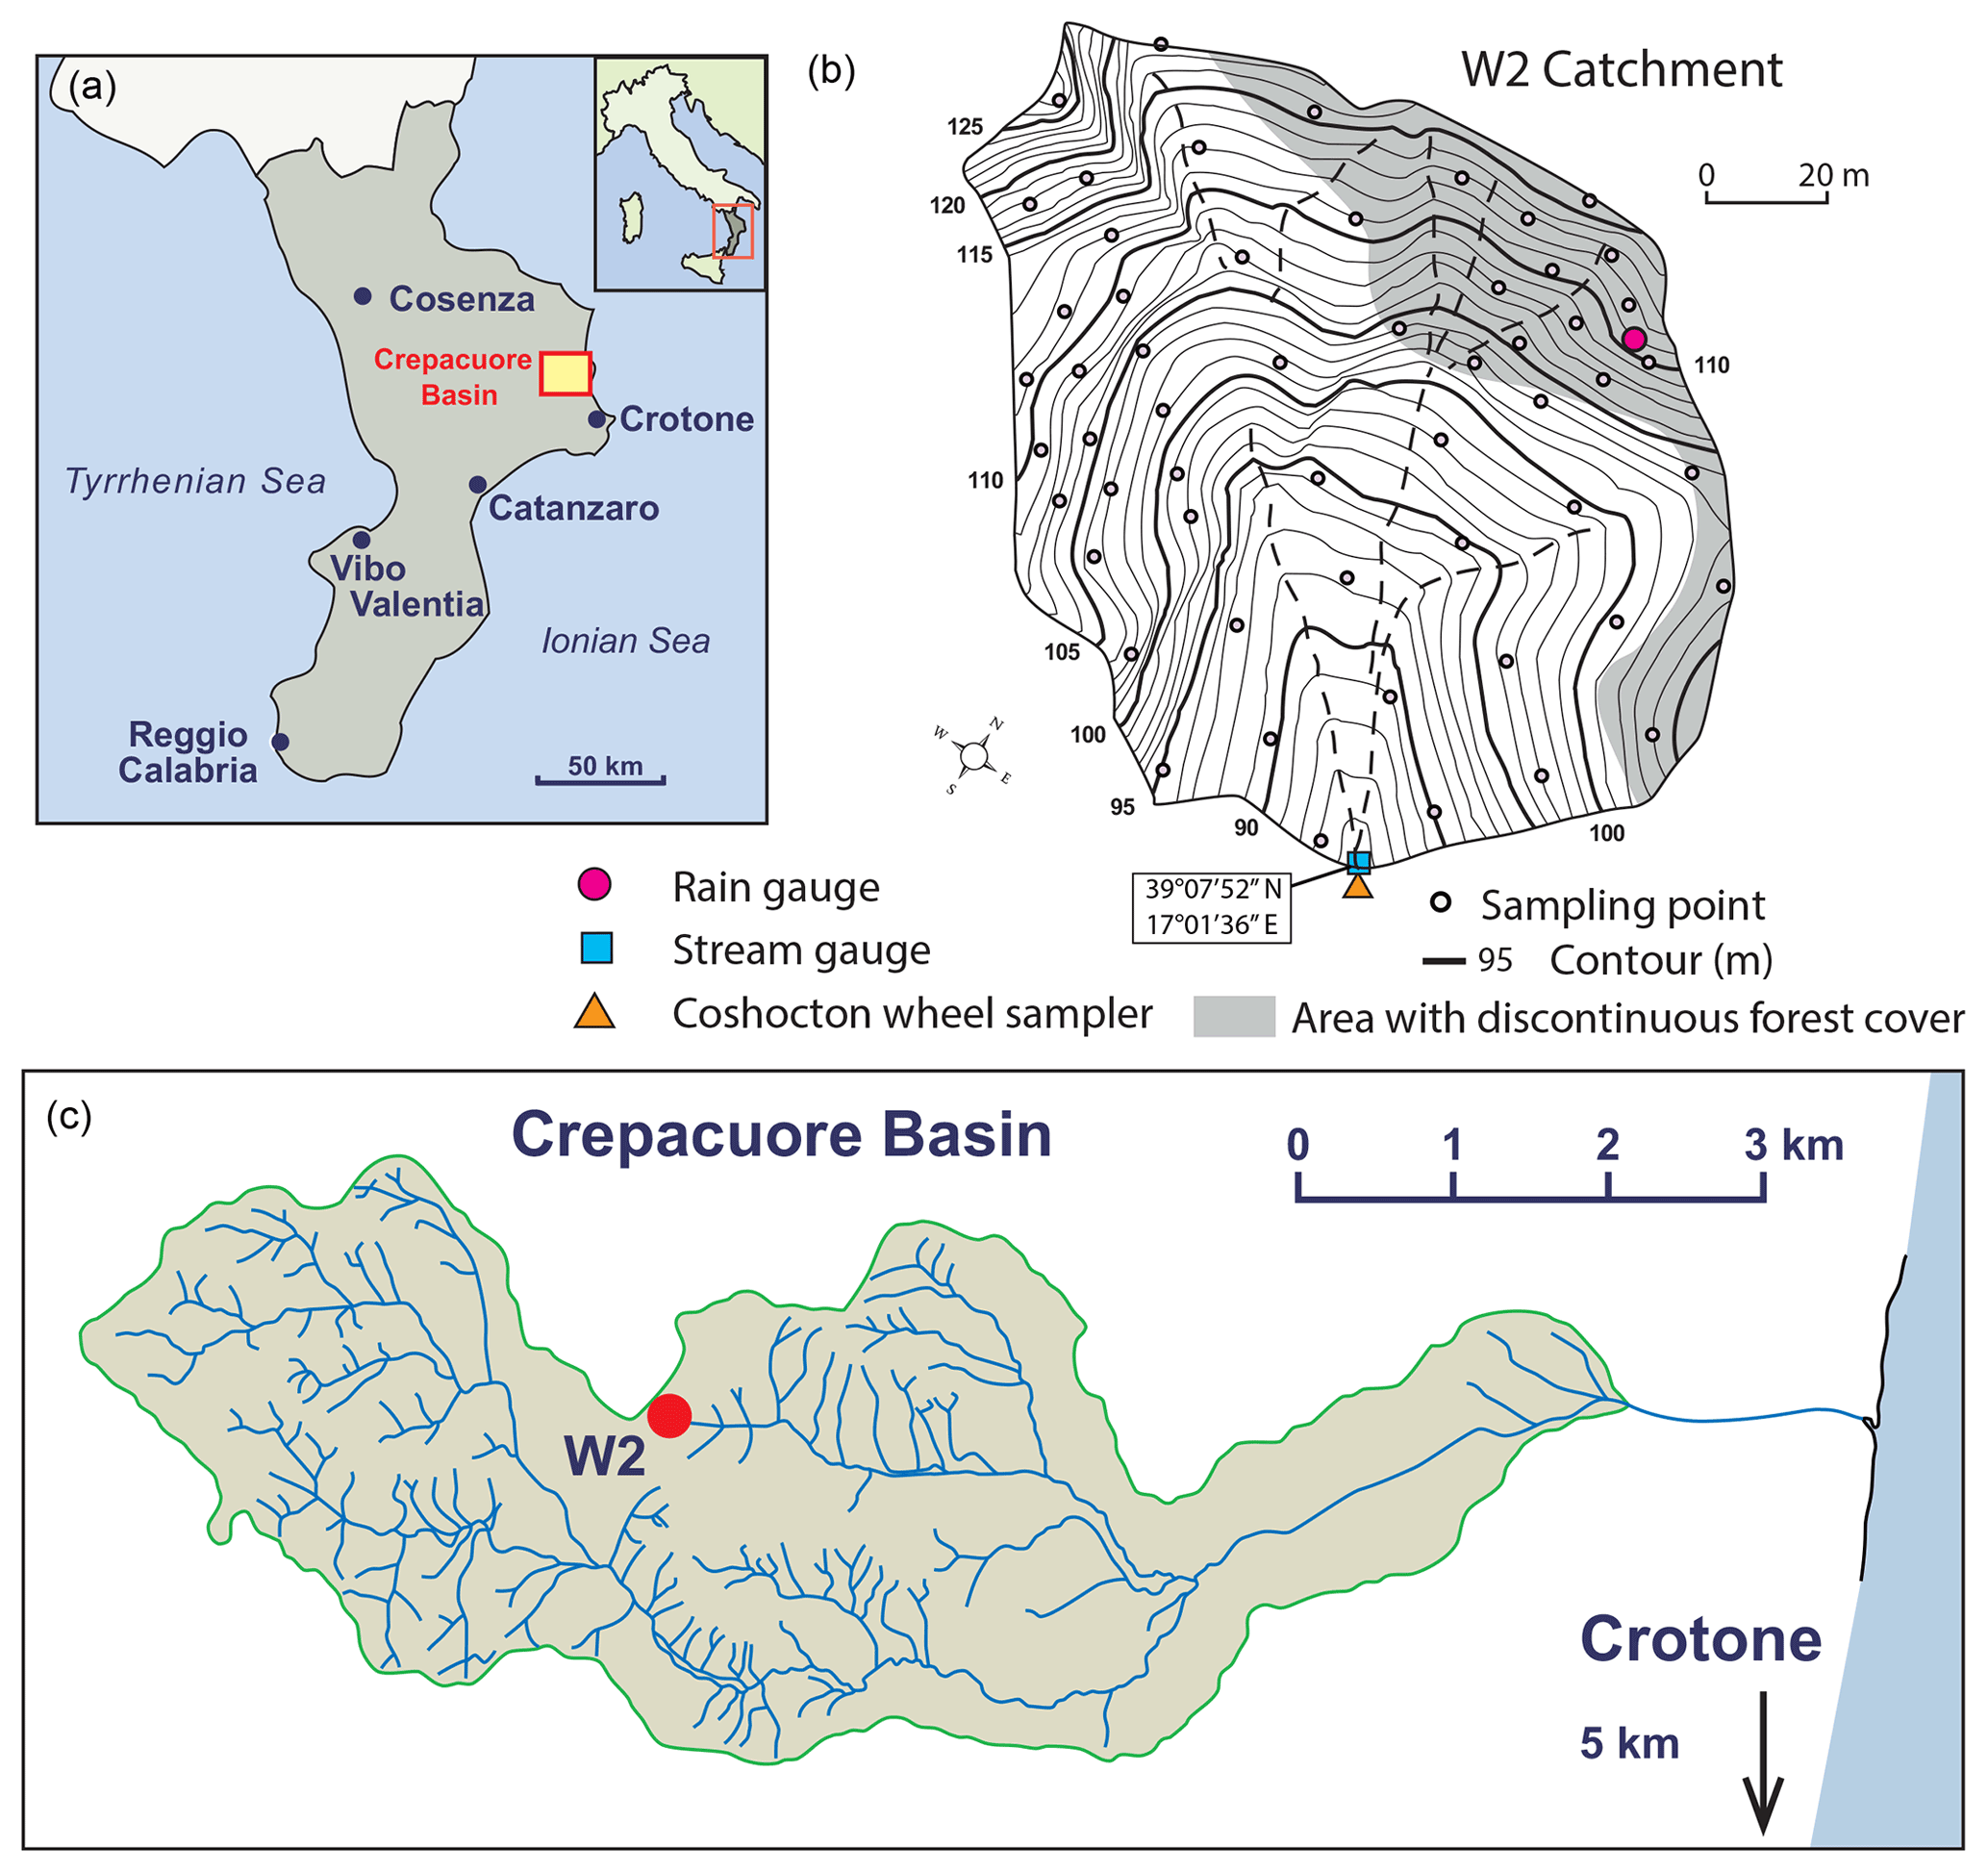
Figure 1Location of the studied headwater catchment W2 within the Crepacuore Basin (c; indicated by a red dot) Calabria, Italy.
In 2014, the collection of soil samples in the catchment was undertaken along an approximate 20 m × 20 m grid with additional cores collected from areas characterized by marked variability of vegetation cover and topography with slopes from 5 to 35∘ (Fig. 1). The samples were taken with a steel core tube (10 cm diameter) driven into the ground to a depth of 15 cm by a motorized percussion corer and subsequently extracted using a hand-operated winch. For each sampling point, two cores were taken, and they were bulked before analysis. This procedure provided a total of 55 composite bulk cores over the catchment area.
In March 2021, a new sampling campaign was undertaken to obtain information at the reference area to establish the baseline for 239+240Pu in the area. In this case, three depth profiles and 19 additional bulk reference soil cores were collected in adjacent undisturbed rangeland with some scattered oaks (Quercus pubescens) at a similar altitude to the study catchment (see Porto and Callegari, 2022). The area has very low gradients (2 %–3 %) and it is located on top of a hill. As such, the sampling point did not receive run-on surface flow from positions immediately upslope. Further, we avoided sampling the areas covered by canopy to minimize the interception effects. Each sampling point was carefully chosen in the clearing areas far from the tree trunks to also avoid problems due to stemflow.
The samples were collected using the same sampling device consisting of a motorized soil column cylinder auger set in which a core tube (60 cm in length) with a larger internal diameter (11 cm) is accommodated. The three depth profiles were sectioned into increments of 2 cm and were analysed separately for 137Cs and 239+240Pu content. Before radiometric analyses, all samples were dried and sieved to <2 mm. In a previous study, the soil samples collected within the catchment were analysed for 137Cs using high-resolution high-purity germanium (HPGe) detectors available at the Mediterranea University Department of Agricultural Science, Reggio Calabria, Italy (Porto et al., 2014). Counting times for the samples collected during that campaign were ca. 80 000 s, providing a precision of ca. ± 10 % at the 95 % confidence level. The reference samples of 2021 were also analysed for 137Cs with the same detector settings. All 137Cs measurements were decay corrected to 1 January 2014 and used to calculate 239+240Pu-to-137Cs activity ratios.
2.2 Extraction of 239+240Pu and mass spectrometry for atom ratio and concentration measurements
All samples (5–10 g) were oven-dried at 105 ∘C for 48 h, mechanically disaggregated, and dry-sieved to recover the <2 mm fraction. First, a representative sub-sample of this fraction was spiked with ∼ 0.005 Bq of a 242Pu yield tracer (licensed solution from NIST). Next, Pu was leached with 16M nitric acid overnight at 80 ∘C and separated from the leach solution using a Pu-selective TEVA resin (Ketterer et al., 2011). The isotope dilution calculations determined the masses of 239Pu and 240Pu present in the sample and converted them into the summed 239+240Pu activity. The analysis was done with a Thermo X7 quadrupole ICP-MS system at Universidad de Cádiz. Please refer to Meusburger et al. (2020) for details on the instrument method.
The information of 239+240Pu in relation to 137Cs allows for assessing the origin of the fallout (e.g. Chernobyl-derived versus global bomb fallout). A prerequisite for using the 137Cs-to-239+240Pu activity ratio is that Pu is exclusively derived from global fallout. Thus, in a first step, the 240Pu-to-239Pu atom ratios around 0.18 confirmed the 239+240Pu origin merely from global bomb fallout (Kelley et al., 1999). In a second step, 137Cs-to-239+240Pu activity ratios reveal the percentage of bomb derived (ratio of 0.027) versus Chernobyl derived (ratio of 0.013) (Ketterer et al., 2004; Xu et al., 2013; Meusburger et al., 2016, 2020).
2.3 Conversion of Pu-239+240 activities to soil redistribution rates
The total inventory (Bq m−2) of each bulk soil core was calculated as the product of the measured 239+240Pu activity (Bq kg−1) and the dry mass of the <2 mm fraction of the bulk core (kg), divided by the surface area associated with the soil core (m2). The inventories were converted into soil redistribution rates using the profile distribution model (PDM) (Walling et al., 2002, 2014) and the Modelling Deposition and Erosion rates with RadioNuclides (MODERN; Arata et al., 2016a, b) model. The profile distribution model is commonly employed to interpret the shape of an FRN along the soil profile. It assumes an exponential depth distribution, and the depth of soil removed by erosion is estimated by comparing the reduction in the FRN inventory with that related to the reference site (see Porto et al., 2003). MODERN aligns the sampling site's total inventory to the measured shape of the reference site's depth profile to estimate the thickness of soil losses and gains. The intersection along the soil profile represents the solution of the model. We selected 1963 as the reference year for the erosion rate conversion. In 1963, the main global fallout peak occurred, commonly used in conversion models (Walling et al., 2002). The PDM equation was implemented in R, while MODERN was calculated with MATLAB R2022b.
We accounted for the uncertainty in the conversion procedure by running both conversion models 100 times, sampling from the reference and the erosion inventory within the uncertainty bounds and for the PDM in addition to the shape factor h0. The sampling was done from normal distributions, defined by the mean measured value and the standard deviations (SD): (i) of the repeated ICP-MS measurements for the erosional sites, (ii) of the replicate reference inventories, and (iii) of the three depth profiles for the h0 factor (Fig. A1 in the Appendix).
2.4 Sediment yield measurements
Since 1978, precipitation, runoff, and sediment yield have been measured in the W2 catchment (Cantore et al., 1994). Precipitation was recorded using a tipping-bucket rain gauge, and runoff was measured at the outlet using an H-flume structure equipped with a mechanical stage recorder. Below the H flume, the sediment load was measured with a Coshocton wheel sampler (Porto et al., 2003). Sediment yield data used in this analysis are related to the period from 1978 to 1994 (Cantore et al., 1994) and from 2006 to 2013 (Fig. 2). However, due to the malfunctioning of the sediment sampling equipment in the catchment during some events, direct measurements of total annual sediment yield values are not available for all years. To account for these missing years, the corresponding sediment output was estimated using the Arnoldus index, for which long-term observations are available from the station of Crotone located at a ca. 10 km distance from the study catchment (see Capra et al., 2017). The standard error of this regression was 23 t ha−1 yr−1. These estimates were then incorporated into the annual record of sediment yield (Fig. 2), and the sediment yield data were extrapolated to cover the period 1963–2013, corresponding to the period captured by 239+240Pu-derived soil redistribution assessments.
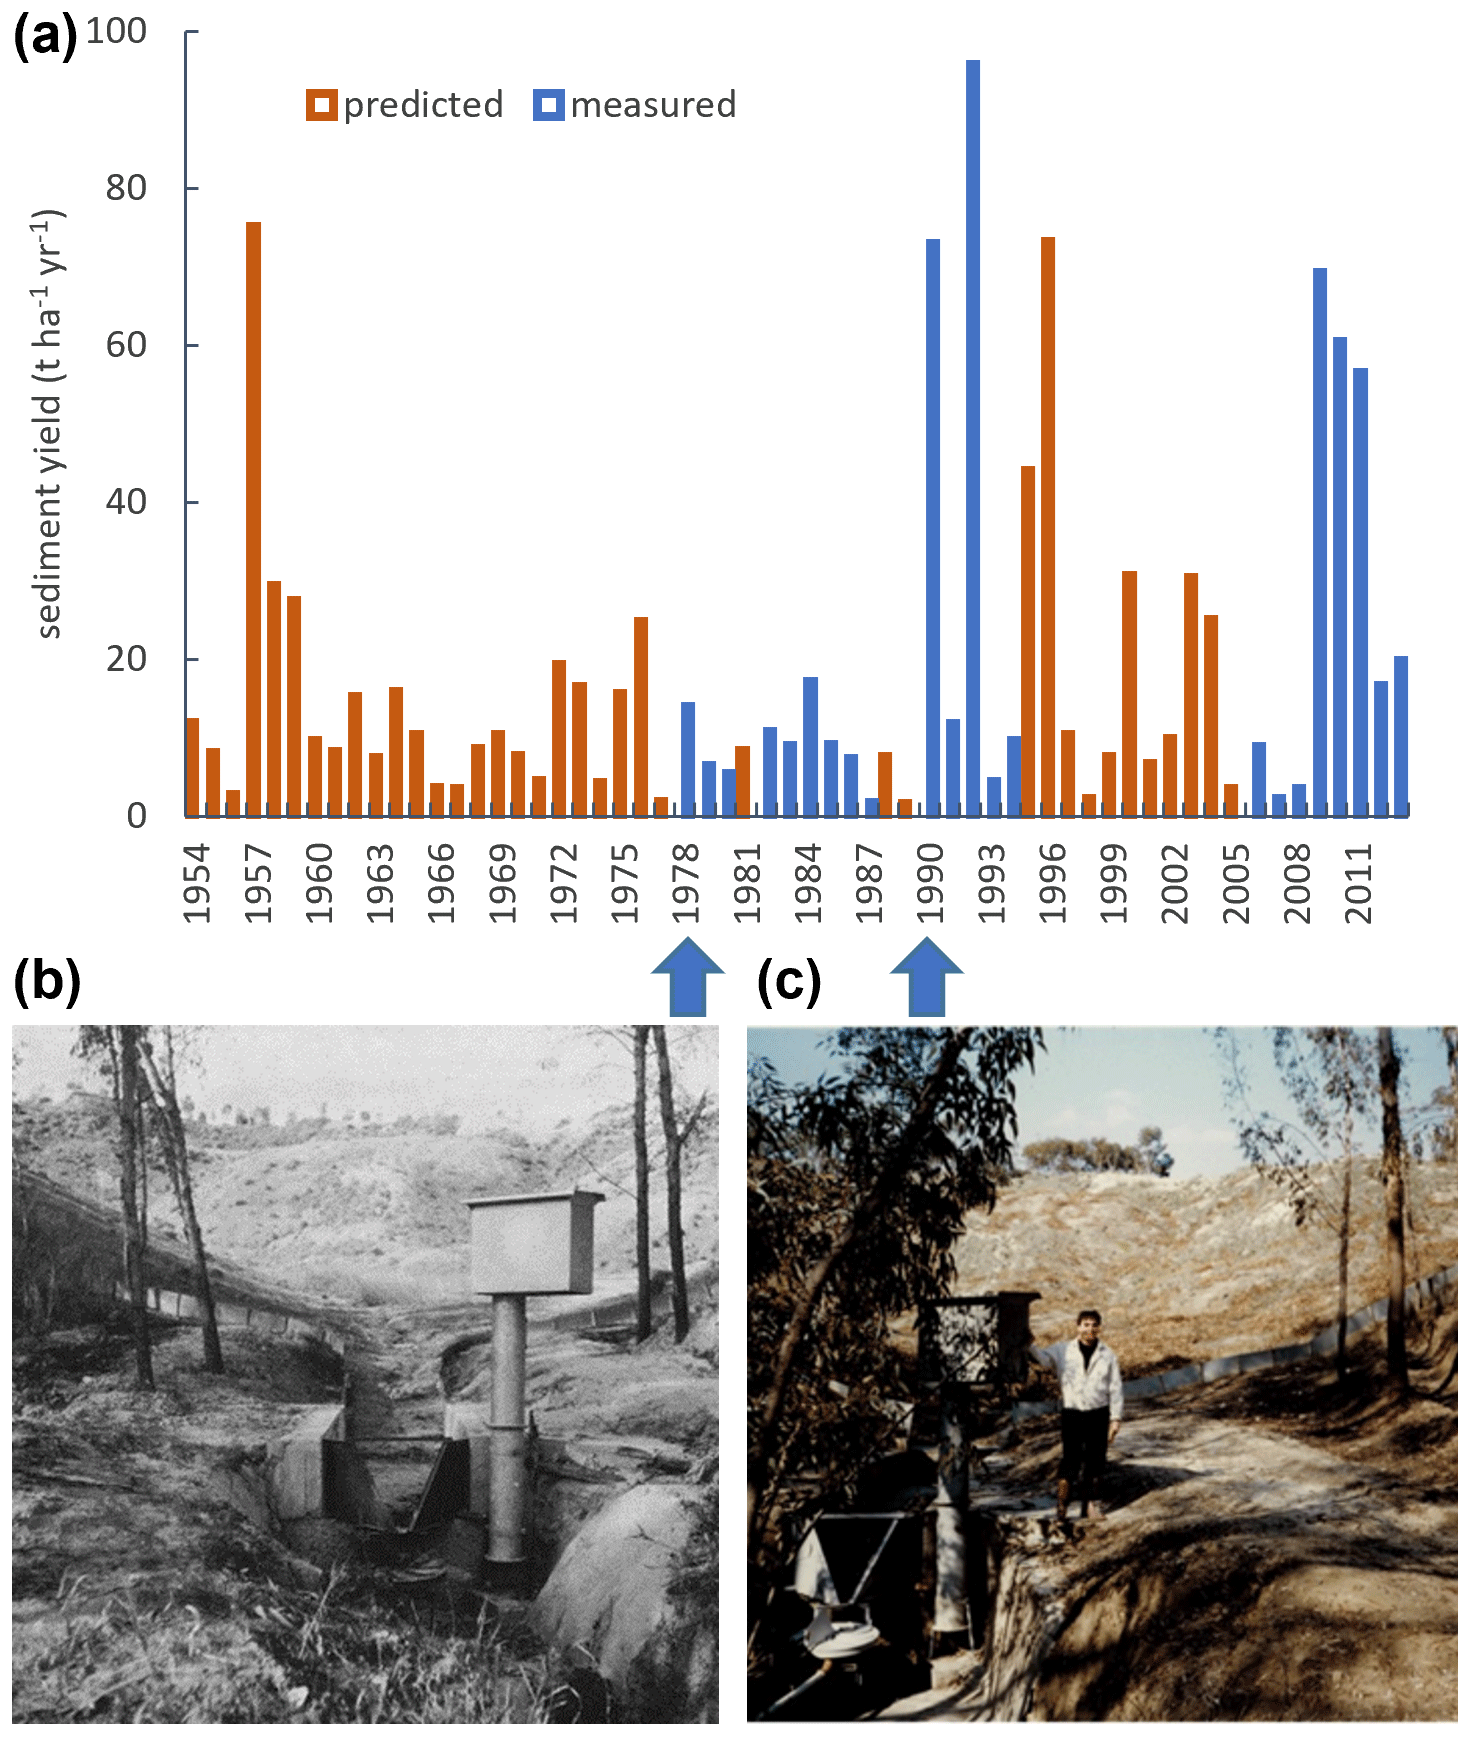
Figure 2Measured (orange) and predicted (blue) annual sediment yield (t ha−1 yr−1) of the headwater catchment W2 (a). Predictions of sediment yields are based on a significant relation to Arnoldus erosivity index. In 1968, Eucalyptus occidentalis Engl. was planted in the catchment that was harvested in 1978 (b) (photo by Marcello Raglione; from Avolio et al., 1980) and a second time in 1990 (c).
2.5 Spatial extrapolation of 239+240Pu-derived estimates
We used a generalized additive model (GAM) to upscale the point erosion estimates to the entire catchment. Spatially explicit soil redistribution rates for the entire catchment are needed to enable the comparison to the sediment yields measured at the catchment's outlet. Therefore, GAMs were fitted to the measured erosion estimates using spatially explicit covariates. As spatial covariates, elevation, slope, aspect, flow accumulation, and scarce, discontinuous tree cover (as 0 and 1 categorical variables; see Fig. 1) were tested. These covariates were derived from a DEM with 3 m spatial resolution using the terrain function from the raster package. Because of the small sample size of 55 sites, only a maximum of three covariables could be added to the model. For cross-validation (n=50) of the spatial prediction, the data were randomly split into 80 % training and 20 % testing data. GAMs can account for nonlinear relationships by coefficients that can be expanded as smooth functions of covariates. These smooth terms were modelled by splines, and geographic coordinates (x and y) were modelled as a 2D spline. To prevent overfitting, we used the restricted maximum likelihood (REML) method with the R package mgcv (Wood, 2006).
3.1 239+240Pu distribution at the reference sites
The mean measured 240Pu-to-239Pu atom ratios at the reference and sampling sites were 0.18±0.03 (Kelley et al., 1999). These atom ratios corresponded to the atom ratio found for the global fallout (Kelley et al., 1999) and confirmed global fallout as the sole source of Pu in the catchment.
The three reference depth profiles of 239+240Pu activity at the reference site showed different shapes with soil depth (Fig. A1). While profile 2 displays the expected exponential decline with soil depth, profile 1 shows signs typically expected from erosional processes and profile 3 of depositional processes (Fig. A1). Therefore, only profile 2 was assessed to be suitable for extracting the shape of the depth distribution for the conversion procedure (Fig. 3a). The penetration depth of 239+240Pu reached 205 kg m−2, corresponding to 26 cm soil depth (Fig. 3b). With an exponential model fit of the PDM, we derived an h0 at 94 kg m−2, representing the point where half of the activity is stored. The mean 239+240Pu reference inventory was estimated at 42.3 ± 3.5 Bq m−2. The surface soil (0 cm) concentration, which was derived by fitting an exponential model, was 0.45 Bq kg−1 (Fig. 3a).
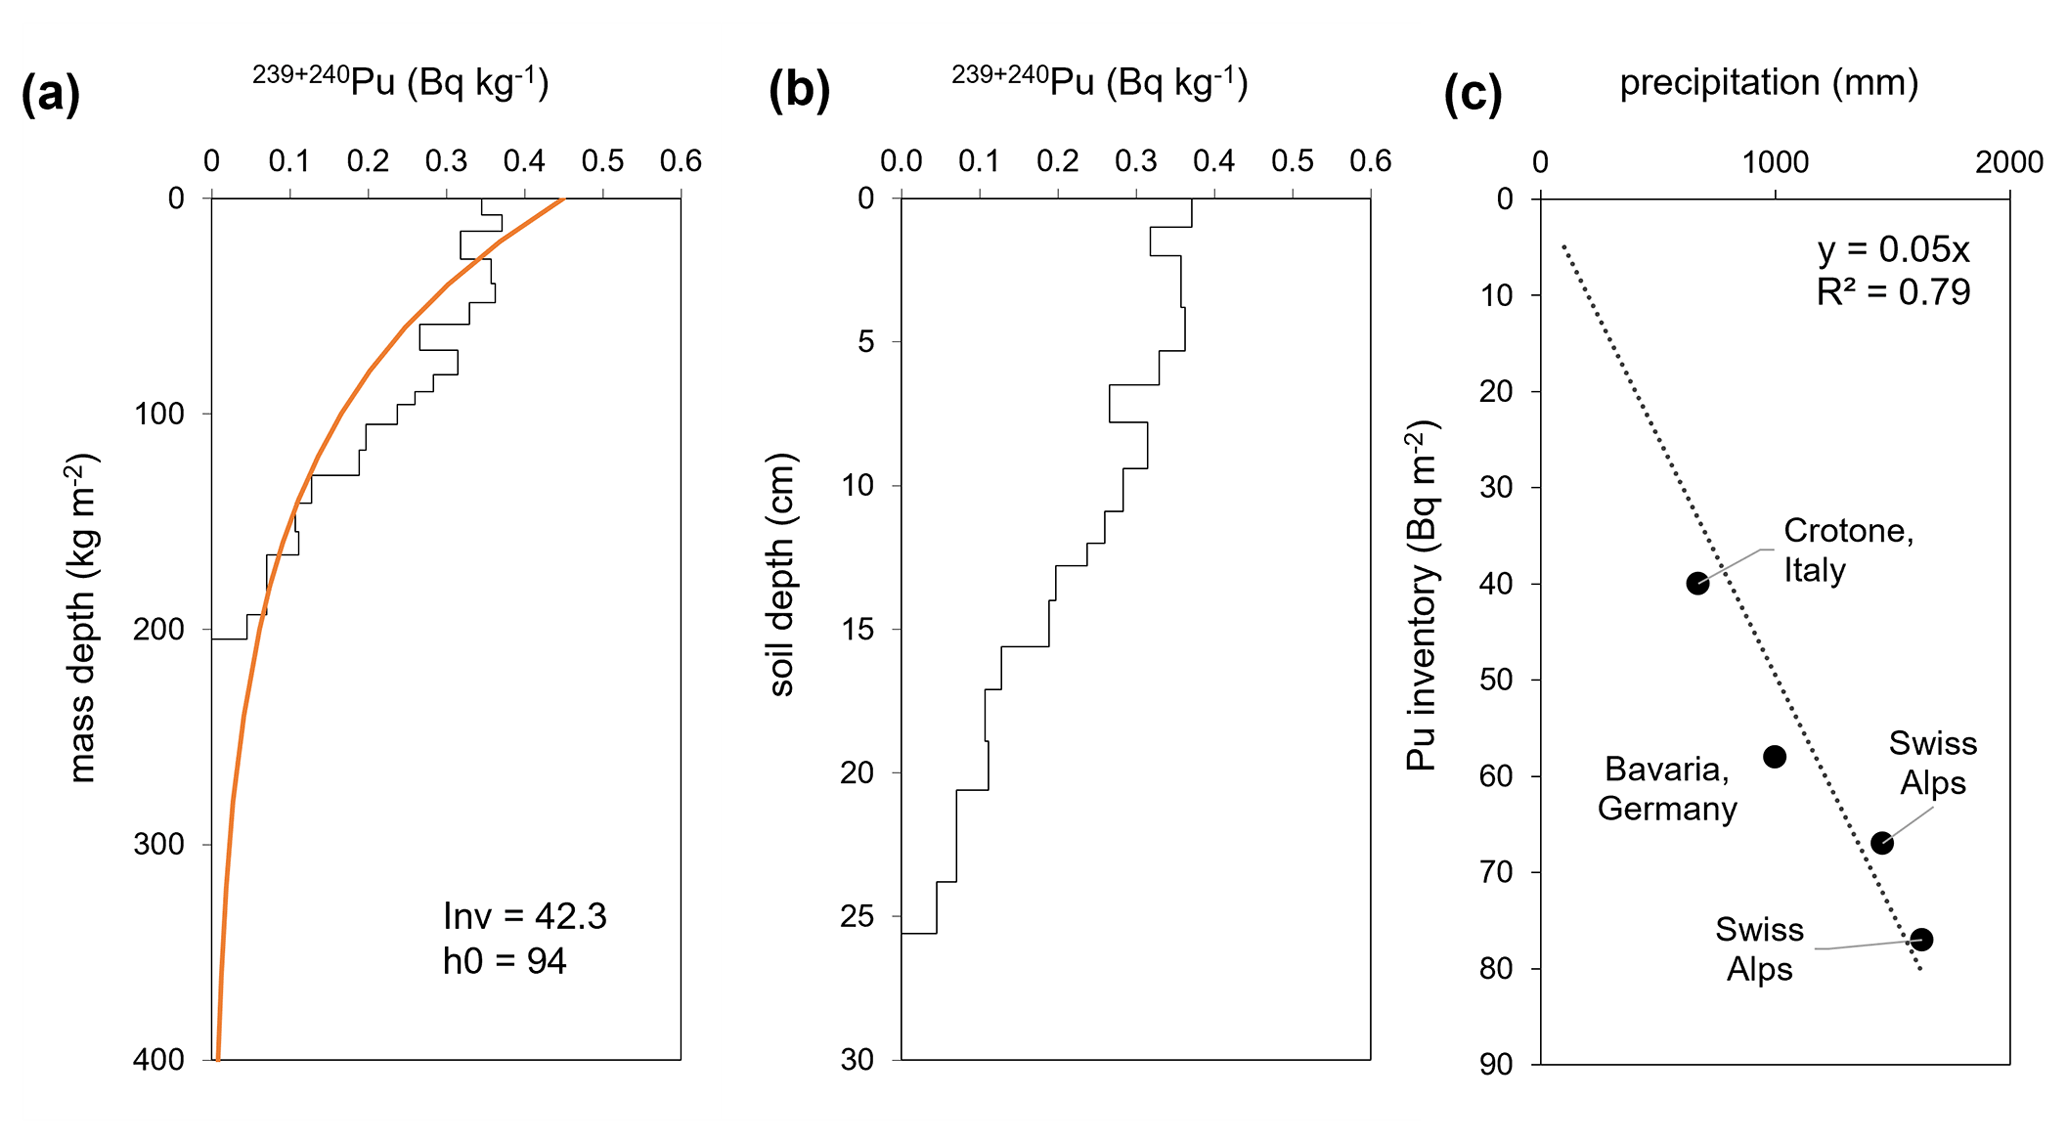
Figure 3(a) 239+240Pu activity with soil mass depth measured at the reference site (selected profile 2). Inv corresponds to the total inventory of the soil and h0 to the shape factor of the exponential fit (orange). (b) 239+240Pu activity with soil depth (cm) at the reference site (profile 2). (c) Relation between Pu reference inventories and precipitation for European studies (Schimmack et al., 2001; Alewell et al., 2014; Meusburger et al., 2018).
The 239+240Pu measurements of the 19 bulk reference soil cores showed a bimodal distribution with six high inventories clustering at a mean of 40.2 ± 4.4 Bq m−2 and 13 low inventories of 15.0 ± 2.8 Bq m−2. The 239+240Pu activities of the bulk soil cores with low inventories had activity values <0.043 Bq kg−1, close to the detection limit, and the standard deviation of replicated measurements of these samples was high. We calculated the Pu-to-Cs activity ratios to verify the plausibility of these low inventories. For European soil samples, the activity ratio of Pu to Cs (with Cs being decay corrected to 2014) is expected between 81 and 24 (Meusburger et al., 2020). However, the low-inventory bulk cores had mean ratios of 156, which is clearly outside this range. A possible explanation for these very low Pu values in the reference site might be the mixing and dilution of deeper layers with no Pu activity into the bulk reference soil cores. Therefore, these low-reference bulk samples were removed from further analysis. Bulking of Pu samples causing a dilution of the Pu activity should be avoided, particularly in areas of high erosion or low initial fallout (Wilken et al., 2021). Here, we resolved the dilution problem due to the availability of 137Cs data, as the 137Cs-to-239+240Pu activity ratios were valuable in identifying the suitability of the reference samples. The plausibility of the Pu inventory was further underpinned when the inventory was related to the mean annual precipitation of other published European studies (Fig. 3c). The few published Pu inventories in Europe (Schimmack et al., 2001; Alewell et al., 2014; Meusburger et al., 2018) show a linear relation to mean annual precipitation with 77, 67, and 58 Bq m−2 for 1650, 1450, and 950 mm of rainfall. The high inventory of this study of 40.2 Bq m−2 plots on the linear relation (Fig. 3c), while the low inventory of 15 Bq m−2 is below the expected amount given the catchment's mean annual precipitation. Taking the depth distribution reference and only the six high inventories of bulk soil cores into account, the mean reference inventory of the soil profiles was 40.5 ± 3.5 Bq m−2 with a coefficient of variation of 8.6 %. In the context of other Pu studies conducted in Europe, our inventories are at the lower end of the spectrum due to the low rainfall in these Mediterranean regions. However, in the context of global studies, even lower Pu inventories are common, e.g. in the Congo with 8.0–24.4 Bq m−2 in non-forested reference sites (Wilken et al., 2021) and Australia with 8.8 Bq m−2 (Lal et al., 2013).
All in all, following the above-described procedure, the 239+240Pu reference inventories had a small spatial variability with a coefficient of variation (CV) of <9 %. For 137Cs, the CV was 11.6 % in the same reference area (see Porto and Callegari, 2022). The spatial variability of Pu in reference sites was comparable to previous studies (Alewell et al., 2014; Meusburger et al., 2016).
3.2 Catchment inventories and soil redistribution rates at sampling points
The 239+240Pu activities at the sampling sites ranged from 0.001 to 0.143 Bq kg−1 with a mean of 0.066 Bq kg−1. The uncertainties of repeated ICP-MS measurements increase with decreasing activities from the smallest SD of 0.0004 Bq kg−1 to the largest of 0.067 Bq kg corresponding to <1 % to larger >24 % of the measured activity with a mean of 2 % (Fig. A2).
The respective mean 239+240Pu inventories for all 55 sites were 16.8 Bq m−2 with a spatial SD of ± 10.2 Bq m−2; thus less than half of the reference inventory. Given the uncertainty bounds, all inventories, except for four sites, were significantly smaller than the reference inventory, indicating soil erosion (Fig. 4a). One site close to the catchment outlet had a very high 239+240Pu inventory of 111 Bq m−2 exceeding the reference inventory by almost 3 times (Fig. 4a). The 239+240Pu inventories are significantly (p<0.001) correlated to the 137Cs inventories with 24.7 times more Bq m−2 for 137Cs (Fig. 4b). The activity ratios of the catchment sites were at the lower range of the plausible fallout range (between 23.9 for global and 81.3 for Chernobyl) with a mean value of 24.7. The activity ratios are significantly (p<0.005) decreasing with decreasing erosion rates even though R2 of the regression is very low with 0.15 (Fig. 4c).
This depletion in 137Cs pointed towards a preferential loss of 137Cs during soil loss. A possible explanation might be that 137Cs is transported with different soil particles as Pu, which are more susceptible to soil erosion. It is known that 239+240Pu exhibits a different sorption behaviour to soil particles compared to, e.g. 137Cs. Pu is mainly associated with organic matter and sesquioxides in addition to clay particles, whereas 137Cs is predominantly bound to the fine mineral clay fraction (Lujaniene et al., 2002; Qiao et al., 2012; Meusburger et al., 2016; Xu et al., 2017). As a consequence, 239+240Pu is more exchangeable and might more easily migrate downward in soils (Schimmack et al., 2001; Meusburger et al., 2016). This different sorption behaviour may result in different depth distributions, which have important implications for its use as a soil erosion tracer, e.g. regarding the conversion of measured FRN inventory changes into soil redistribution rates. Further, it may also have implications regarding interpreting 137Cs-to-239+240Pu activity ratios that may be shifted outside the expected ranges at sites affected by soil redistribution.
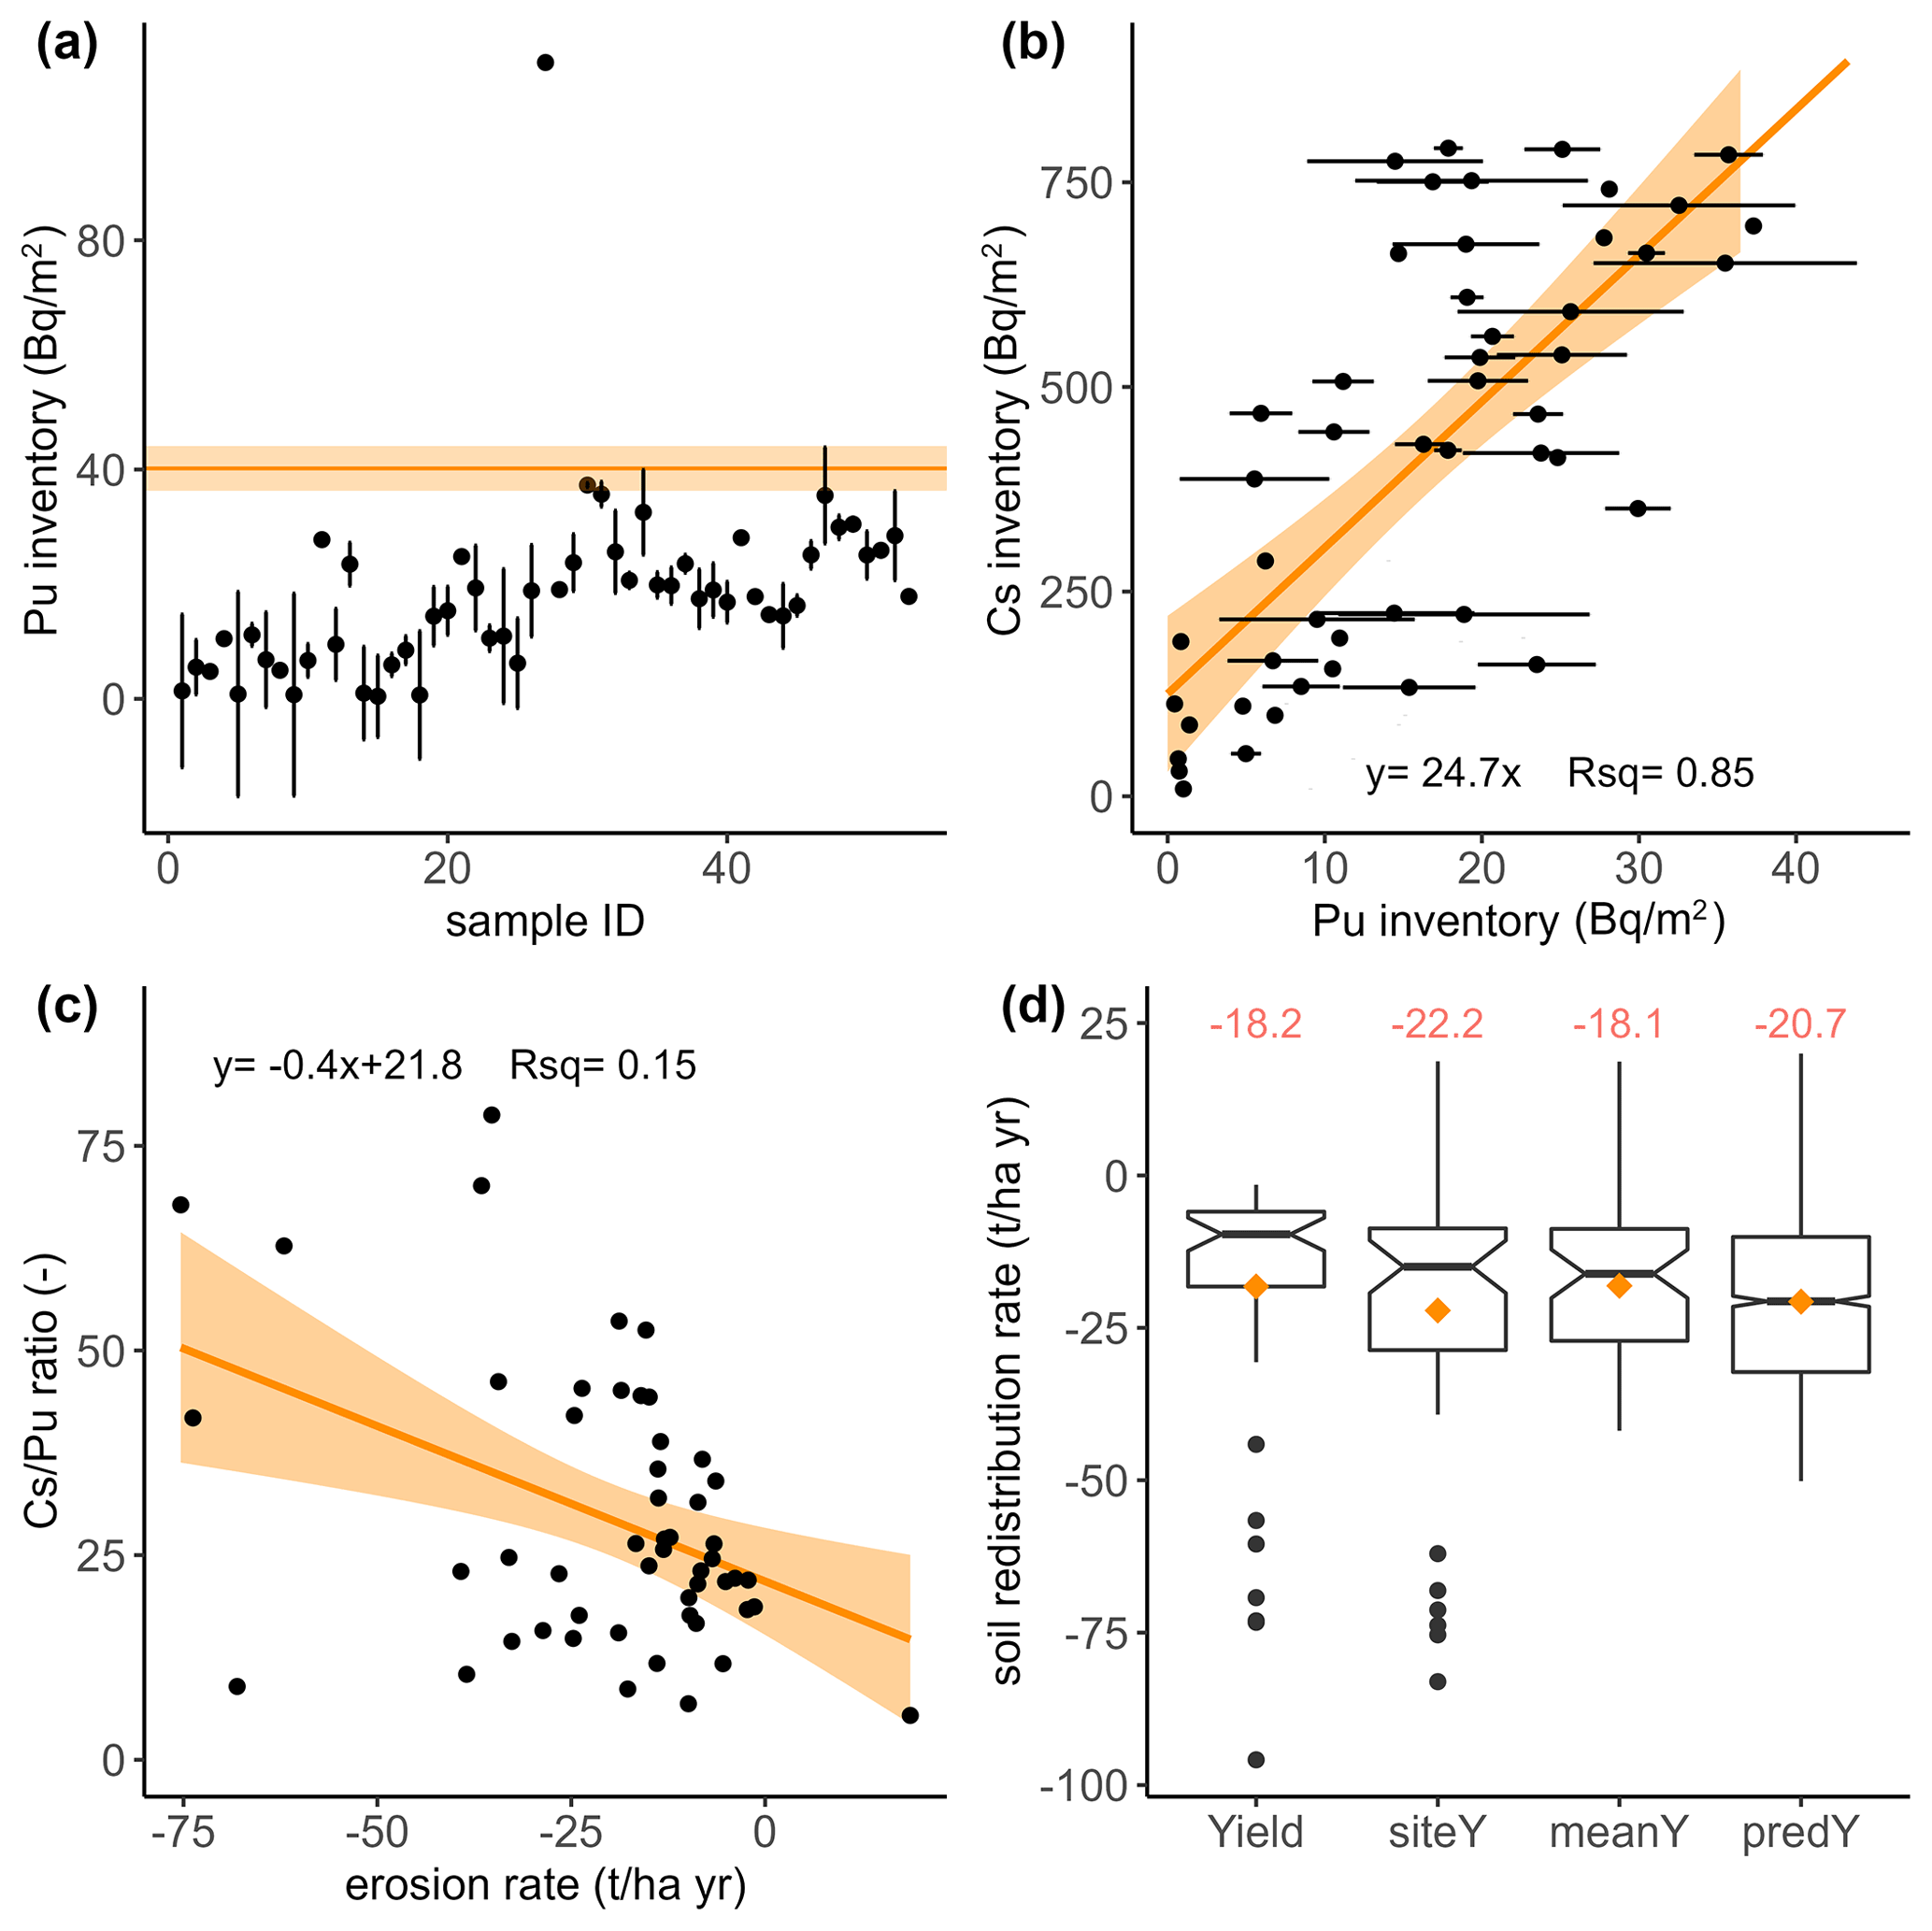
Figure 4(a) 239+240Pu inventories with measurement errors in relation to sample ID (points) and the reference inventory (orange line with ribbon). (b) Relation between 239+240Pu and 137Cs inventories (error bars indicate the measurement error for Pu) with a linear trend line. (c) Activity ratio of Cs to Pu versus erosion rate. (d) Measured sediment yield at catchment outlet (Yield), Pu-derived erosion rates based on measured inventories within the catchment (siteY) and as a mean of the repeated conversion results (meanY), and mean of regionalized catchment Pu-derived erosion rates (predY). Orange points and text show the mean values of each approach.
3.3 Comparison of 239+240Pu-derived soil redistribution rates and sediment yield of the catchment
Soil redistribution rates obtained from the established conversion model (PDM) and the relatively new MODERN model agree very well (Fig. A3). This agrees with previous comparisons done for different conversion models and FRNs (Meusburger et al., 2018). We produced three sets of Pu-derived soil redistribution rates using (i) direct conversion of the site inventories (siteY), (ii) the average of 100 Monte Carlo conversion models per site generated by sampling within the uncertainty ranges of all input parameters (meanY), and (iii) regionalized estimates for the catchment (predY). For the point estimates, we will refer to these as meanY in the following because the uncertainty related to the entire procedure is included in meanY.
Soil redistribution rates were highly variable within the catchment (Fig. 5). The highest soil loss with 43 ± 20 t ha−1 yr−1 occurred in the upper part with patchy tree cover. Generally, the sites with scarce tree cover and adjacent sites showed the highest soil erosion rates. Downslope and towards the outlet of the catchment, the erosion rates decrease. Close to the outlet, soil deposition of 18.7 ± 2.0 t ha−1 yr−1 was observed in one measurement point (W2_29). The deposition rate is, however, difficult to quantify without knowledge of the respective soil source area or a Pu depth profile in the deposition site. The average of all measured site redistribution rates (siteY) indicated erosion of −22.2 t ha−1 yr−1 with a spatial standard deviation of ± 21.1 t ha−1 yr−1. On average, the standard deviation, derived from repeated Monte Carlo conversions, of these redistribution rates were 7.2 t ha−1 yr−1, with a slightly lower median of the standard deviations of 4.2 t ha−1 yr−1 corresponding to a mean CV of 45 % and a median CV of 36 %. Generally, higher erosion estimates are subject to higher standard deviations resulting from higher uncertainties for measuring low Pu activities. Excluding these measurement uncertainties from the Monte Carlo conversion reduced the CV of the erosion estimates to mean and median CVs of 19 % and 13 %, respectively.
The xy coordinates, elevation, and flow accumulation best explained the spatial pattern of soil redistribution rates. The deviance explained with these two spatial covariates was 56.7 %, with lower accuracy of 24 % for the cross-validation procedure. The spatial pattern of the predicted soil redistribution rates showed erosion in most of the catchment (Fig. 5). Only in grid cells with high-flow accumulation did deposition occur. The average redistribution rate from the grid cells (predY) amounted to −20.7 t ha−1 yr−1 (Fig. 4d). Given the mean measured sediment yield at the outlet (Yield) of −18.2 t ha−1 yr−1 (standard deviation between years of 21.8 t ha−1 yr−1), this corresponds to a 14 % overestimation of the mean soil loss by the Pu method (Fig. 4d). The sediment yield (Yield) corresponds to the off-site net erosion over time, while the Pu-derived rates (siteY, meanY, and predY) correspond to the on-site erosion over space. Their correspondence indicates that most of the on-site eroded sediments are delivered to the outlet of the stream channel within the considered period.
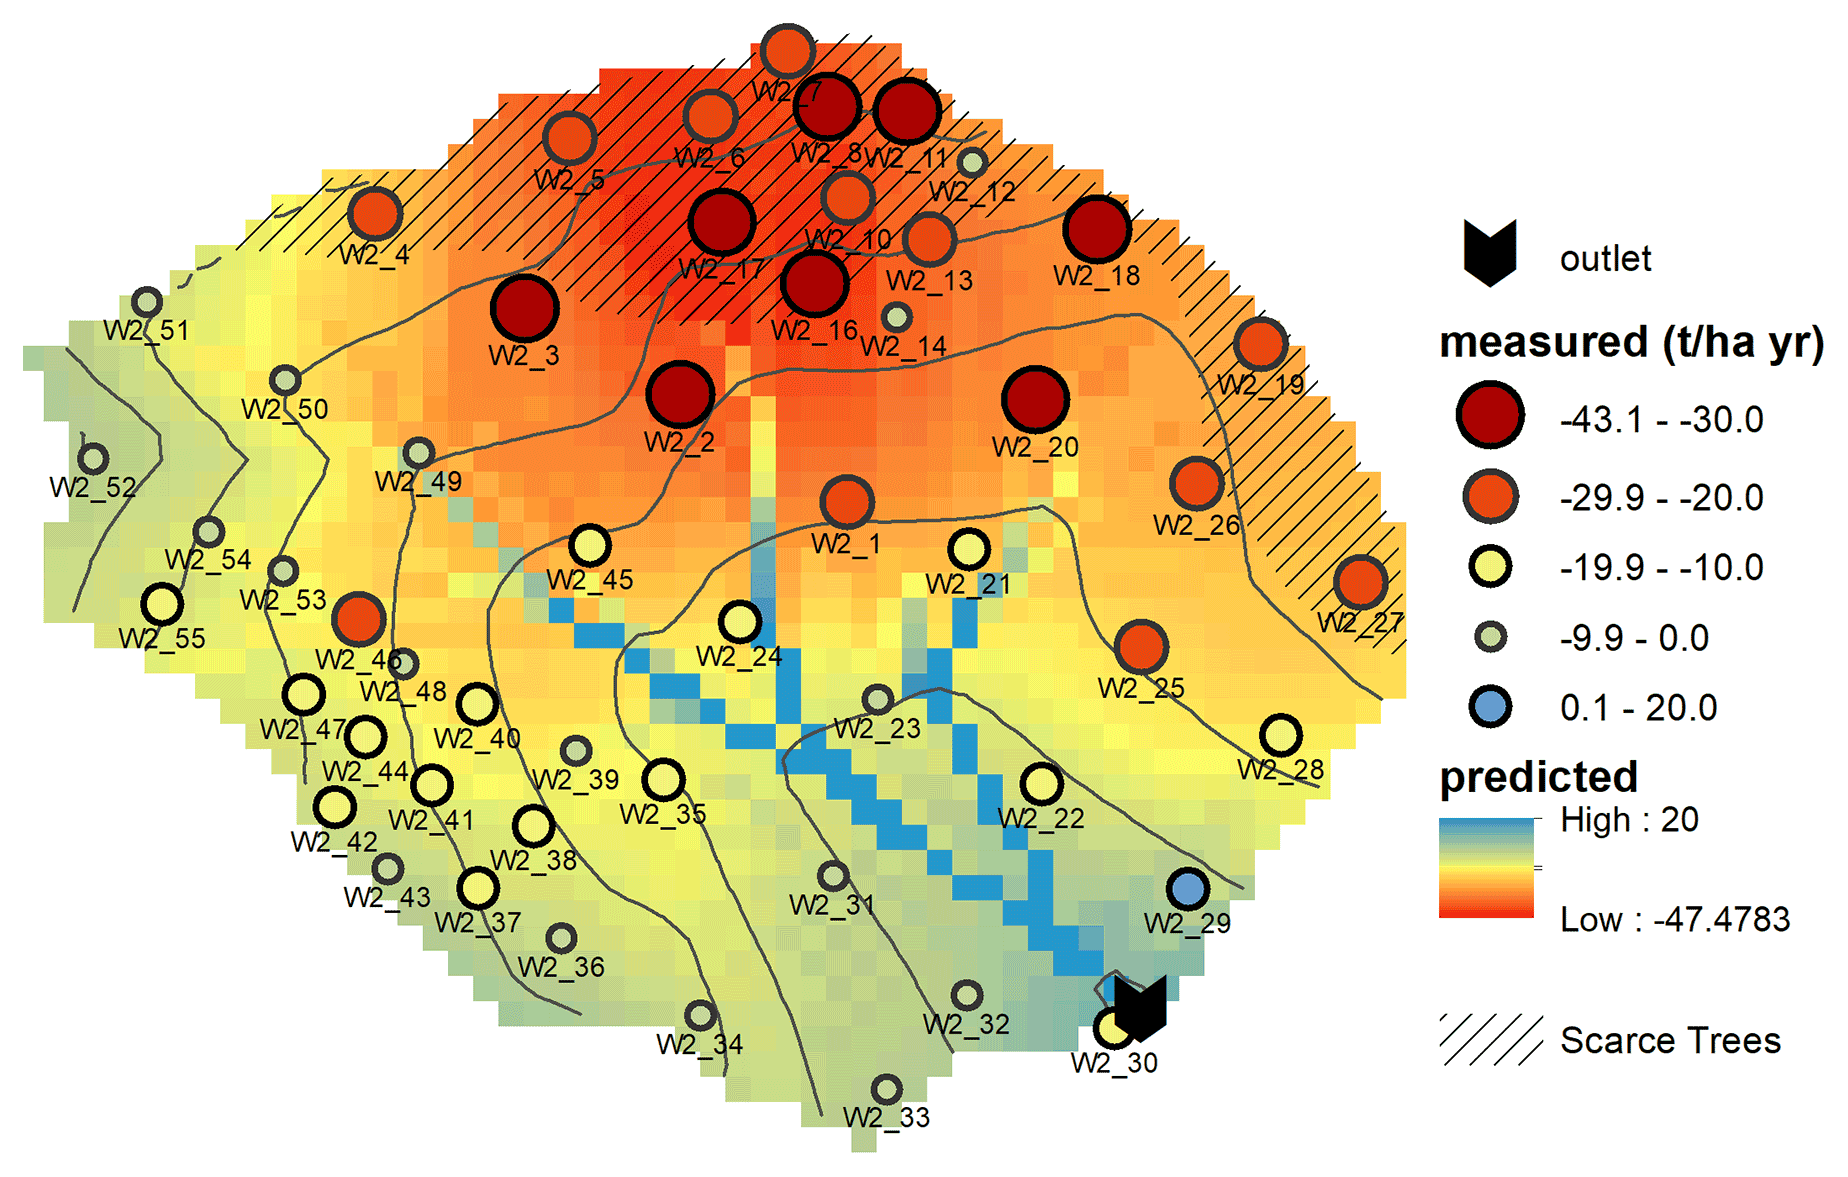
Figure 5Soil redistribution rates assessed with Pu-derived soil redistribution rates (points) and spatial prediction of soil redistribution rates based on these point rates using xy coordinates, elevation, and flow accumulation as spatial covariates.
The Pu-derived soil erosion rates in the catchment were very high, with maximum values t ha−1 yr−1. However, documented soil erosion peaks in this area can reach up to 100–150 t ha−1 yr−1 during exceptional rainfall events (Porto et al., 2018, 2022). The sediment yield time series reveals that besides the rainfall erosivity, the second harvest of eucalyptus trees (1990) particularly triggered soil erosion. The soil conservation effect of the eucalyptus trees was also revealed by the lower Pu inventory and, therefore, higher soil losses in the catchment area with scarce tree cover. The protective effect of trees (Sorriso-Valvo et al., 1995; Zhou et al., 2002) and vegetation cover, in general, was also found in other studies and reviewed by Zuazo and Pleguezuelo (2009). Flow accumulation, a proxy for runoff concentration in a catchment, was an important predictor of soil erosion patterns. Interestingly, the relationship was negative with lower soil losses and higher chances for deposition with increasing flow accumulation. A reason for this was likely the collinearity between decreasing slopes with increasing flow accumulation, reducing the sediment transport capacity (Xiao et al., 2017). Still, flow accumulation performed better than alternative GAM models, such as those including slopes.
Mean 239+240Pu-based mean soil redistribution rates were −20.7 t ha−1 yr−1 and 14 % higher as measured sediment yields at the catchment outlet. Given both methods' uncertainties and variability, comparable magnitudes were achieved. In a recent study, Porto and Callegari (2022) found 137Cs redistribution mean rates of −20.4 t ha−1 yr−1. The 137Cs and 239+240Pu-derived soil redistribution rates are in good agreement.
Recent measurements of 239+240Pu in a catchment in southern Italy provided essential insights into the suitability of the 239+240Pu technique to estimate soil erosion rates. We also rigorously tested the uncertainties involved in the approach. In our case study, the highest uncertainty resulted from the high measurement uncertainty of low inventory samples, with a median CV of 21 % and a high measurement uncertainty of <1 %–100 %. This high uncertainty can, for future studies, be minimized by (i) taking incremental soil depth samples, avoiding dilution with deeper horizons of low-activity soil, and (ii) extracting Pu on larger soil samples to reach Pu activities >0.02 Bq kg−1. Based on values with adequate measurement certainty, the 239+240Pu technique showed a low spatial variability of the reference inventory (CV < 9 %) and the shape of the Pu distribution within the soil profile proved stable adsorption to the topsoil. Patterns of inventory loss were related to soil redistribution processes, with the best spatial predictors being tree cover and flow accumulation. The Pu-assessed redistribution rates were in agreement with 137Cs-derived rates and sediment yield measurements at the catchment outlet.
Increasing climatic extremes associated with more intense farming practices endanger our soil resources, and new tools to monitor soil losses are of utmost importance. So far, the tracer 137Cs has been a powerful approach to assess soil redistribution rates since its fallout. However, alternative tracers are needed in light of the subsequent decay of 137Cs approaching the detection limit. In most aspects, the 239+240Pu technique works analogue to the 137Cs technique. However, sample preparation with extraction is more demanding and destructive to the soil, while for the 137Cs method, soils are only sieved and dried and might be re-used for further analysis. We conclude that 239+240Pu, with its considerably longer half life, is a suitable and promising soil redistribution tracer.
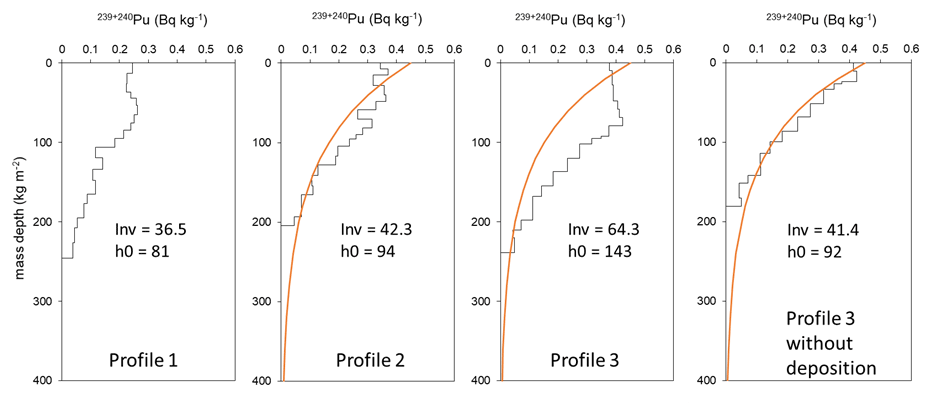
Figure A1Pu-239+240 activity with soil mass depth measured at three potential reference sites. Inv corresponds to the total inventory of the soil and h0 to the shape factor of the exponential fit (orange). Profile 3 was fitted with and without deposition layers. The standard deviation of the depth distribution and h0 factor of profiles 1, 2, and 3 (without deposition) was used for the uncertainty assessment in the conversion model.
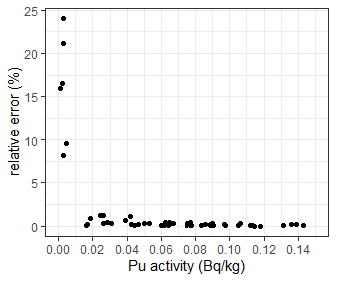
Figure A2Relative error (%) of replicate 239+240Pu activity measurements with a quadrupole ICP-MS. At low activities, the relative error of the measurements increased.
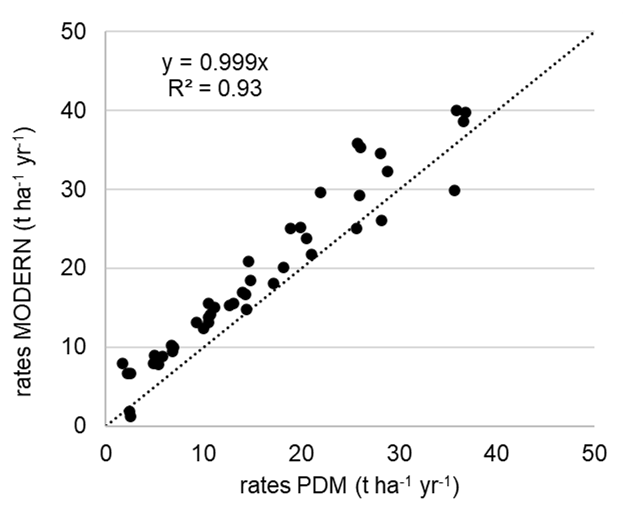
Figure A3Comparison of soil erosion rates between the profile distribution conversion model (PDM) and the Modelling Deposition and Erosion rates with RadioNuclides (MODERN) model.
The dataset used for this study is available in the EnviDat data repository at https://doi.org/10.16904/envidat.413 (Meusburger et al., 2023).
KM, CA, and PP conceptualized the study. PP collected the samples, and JKW measured them and calculated the measurement uncertainties. KM and PP did the data analysis. KM wrote the paper, and all co-authors contributed to the writing process.
The contact author has declared that none of the authors has any competing interests.
Publisher’s note: Copernicus Publications remains neutral with regard to jurisdictional claims in published maps and institutional affiliations.
We thank the University of Cadiz for measuring 239+240Pu on the ICP-MS. The study has been performed within the International Atomic Energy Agency Coordinated Research Project D1.50.17 on “Nuclear techniques for a better understanding of the impact of climate change on soil erosion in upland agroecosystems”.
This paper was edited by David Dunkerley and reviewed by Emil Fulajtar and one anonymous referee.
Alewell, C., Meusburger, K., Juretzko, G., Mabit, L., and Ketterer, M. E.: Suitability of 239+240Pu and 137Cs as tracers for soil erosion assessment in mountain grasslands, Chemosphere, 103, 274–280, https://doi.org/10.1016/j.chemosphere.2013.12.016, 2014.
Alewell, C., Birkholz, A., Meusburger, K., Schindler Wildhaber, Y., and Mabit, L.: Quantitative sediment source attribution with compound-specific isotope analysis in a C3 plant-dominated catchment (central Switzerland), Biogeosciences, 13, 1587–1596, https://doi.org/10.5194/bg-13-1587-2016, 2016.
Alewell, C., Pitois, A., Meusburger, K., Ketterer, M., and Mabit, L.: Pu239+240 from “contaminant” to soil erosion tracer: Where do we stand?, Earth-Sci. Rev., 172, 107–123, https://doi.org/10.1016/j.earscirev.2017.07.009, 2017.
Alewell, C., Ringeval, B., Ballabio, C., Robinson, D. A., Panagos, P., and Borrelli, P.: Global phosphorus shortage will be aggravated by soil erosion, Nat. Commun., 11, 4546, https://doi.org/10.1038/s41467-020-18326-7, 2020.
Amundson, R., Berhe, A. A., Hopmans, J. W., Olson, C., Sztein, A. E., and Sparks, D. L.: Soil and human security in the 21st century, Science, 348, https://doi.org/10.1126/science.1261071, 2015.
Arata, L., Alewell, C., Frenkel, E., A'Campo-Neuen, A., Iurian, A.-R., Ketterer, M. E., Mabit, L., and Meusburger, K.: Modelling Deposition and Erosion rates with RadioNuclides (MODERN) – Part 2: A comparison of different models to convert 239+240Pu inventories into soil redistribution rates at unploughed sites, J. Environ. Radioactiv., 162–163, 97–106, https://doi.org/10.1016/j.jenvrad.2016.05.009, 2016a.
Arata, L., Meusburger, K., Frenkel, E., A'Campo-Neuen, A., Iurian, A.-R., Ketterer, M. E., Mabit, L., and Alewell, C.: Modelling Deposition and Erosion rates with RadioNuclides (MODERN) – Part 1: A new conversion model to derive soil redistribution rates from inventories of fallout radionuclides, J. Environ. Radioactiv., 162–163, 45–55, https://doi.org/10.1016/j.jenvrad.2016.05.008, 2016b.
Avolio, S., Ciancio, O., Grinovero, C., Iovino, F., Mirabella, A., Raglione, M., Sfalanga, M., and Torri, D.: Effetti del tipo di bosco sull'entità dell'erosione in unità idrologiche della Calabria – Modelli erosivi, Annali Istituto Sperimentale Selvicoltura, 11, 45–131, 1980.
Borrelli, P., Robinson, D. A., Fleischer, L. R., Lugato, E., Ballabio, C., Alewell, C., Meusburger, K., Modugno, S., Schütt, B., Ferro, V., Bagarello, V., van Oost, K., Montanarella, L., and Panagos, P.: An assessment of the global impact of 21st century land use change on soil erosion, Nat. Commun., 8, 2013, https://doi.org/10.1038/s41467-017-02142-7, 2017.
Cantore, V., Iovino, F., and Puglisi, S.: Influenza della forma di governo sui deflussi liquidi e solidi in piantagioni di eucalitti, L'Italia Forestale e Montana, 5, 463–477, 1994.
Capra, A., Porto, P., and La Spada, C.: Long-term variation of rainfall erosivity in Calabria (southern Italy), Theor. Appl. Climatol., 128, 141–158, 2017.
Froehlich, M. B., Dietze, M. M. A., Tims, S. G., and Fifield, L. K.: A comparison of fallout U-236 and Pu-239 uptake by Australian vegetation, J. Environ. Radioactiv., 151, 558–562, https://doi.org/10.1016/j.jenvrad.2015.06.021, 2016.
Hoo, W. T., Fifield, L. K., Tims, S. G., Fujioka, T., and Mueller, N.: Using fallout plutonium as a probe for erosion assessment, J. Environ. Radioactiv., 102, 937–942, https://doi.org/10.1016/j.jenvrad.2010.06.010, 2011.
IAEA: Guidelines for using Fallout radionuclides to assess erosion and effectiveness of soil conservation strategies, International Atomic Energy Agency, Vienna, Austria, 224 pp., 2014.
Kato, H., Onda, Y., and Tanaka, Y.: Using Cs-137 and Pb-210(ex) measurements to estimate soil redistribution rates on semi-arid grassland in Mongolia, Geomorphology, 114, 508–519, https://doi.org/10.1016/j.geomorph.2009.08.009, 2010.
Kelley, J. M., Bond, L. A., and Beasley, T. M.: Global distribution of Pu isotopes and 237Np, Sci. Total Environ., 237–238, 483–500, https://doi.org/10.1016/s0048-9697(99)00160-6, 1999.
Ketterer, M. E., Hafer, K. M., Link, C. L., Kolwaite, D., Wilson, J., and Mietelski, J. W.: Resolving global versus local/regional Pu sources in the environment using sector ICP-MS, J. Anal. Atom. Spectrom., 19, 241–245, https://doi.org/10.1039/b302903d, 2004.
Ketterer, M. E., Zheng, J., and Yamada, M.: Applications of Transuranics as Tracers and Chronometers in the Environment, Handbook of Environmental Isotope Geochemistry, Vols. 1 and 2, edited by: Baskaran, M., Springer-Verlag Berlin, Berlin, 395–417, https://doi.org/10.1007/978-3-642-10637-8_20, 2011.
Lal, R., Tims, S. G., Fifield, L. K., Wasson, R. J., and Howe, D.: Applicability of Pu-239 as a tracer for soil erosion in the wet-dry tropics of northern Australia, Nucl. Instrum. Meth. B, 294, 577–583, https://doi.org/10.1016/j.nimb.2012.07.041, 2013.
Lujaniene, G., Plukis, A., Kimtys, E., Remeikis, V., Jankunaite, D., and Ogorodnikov, B. I.: Study of Cs-137, Sr-90, Pu-239, Pu-240, Pu-238 and Am-241 behavior in the Chernobyl soil, J. Radioanal. Nucl. Ch., 251, 59–68, https://doi.org/10.1023/a:1015185011201, 2002.
Mabit, L., Benmansour, M., and Walling, D. E.: Comparative advantages and limitations of the fallout radionuclides Cs-137, Pb-210(ex) and Be-7 for assessing soil erosion and sedimentation, J. Environ. Radioactiv., 99, 1799–1807, https://doi.org/10.1016/j.jenvrad.2008.08.009, 2008.
Mabit, L., Benmansour, M., Abril , J. M., Walling, D. E., Meusburger, K., Iurian, A. R., Bernard, C., Tarján, S., Owens, P. N., Blake, W. H., and Alewell, C.: Fallout 210Pbex as a soil and sediment tracer in catchment sediment budget investigations: A review, Earth-Sci. Rev., 138, 335–351, 2014.
Matisoff, G., Bonniwell, E. C., and Whiting, P. J.: Soil erosion and sediment sources in an Ohio watershed using beryllium-7, cesium-137, and lead-210, J. Environ. Qual., 31, 54–61, 2002.
Meusburger, K., Mabit, L., Ketterer, M., Park, J.-H., Sandor, T., Porto, P., and Alewell, C.: A multi-radionuclide approach to evaluate the suitability of Pu239+240 as soil erosion tracer, Sci. Total Environ., 566, 1489–1499, https://doi.org/10.1016/j.scitotenv.2016.06.035, 2016.
Meusburger, K., Porto, P., Mabit, L., La Spada, C., Arata, L., and Alewell, C.: Excess Lead-210 and Plutonium-239+240: Two suitable radiogenic soil erosion tracers for mountain grassland sites, Environ. Res., 160, 195–202, https://doi.org/10.1016/j.envres.2017.09.020, 2018.
Meusburger, K., Evrard, O., Alewell, C., Borrelli, P., Cinelli, G., Ketterer, M., Mabit, L., Panagos, P., van Oost, K., and Ballabio, C.: Plutonium aided reconstruction of caesium atmospheric fallout in European topsoils, Sci. Rep., 10, 11858, https://doi.org/10.1038/s41598-020-68736-2, 2020.
Meusburger, K., Porto, P., Kobler-Waldis, J., and Alewell, C.: Plutonium-239+240 and sediment yield data for a small catchment in Southern Italy, EnviDat [data set], https://doi.org/10.16904/envidat.413, 2023.
Michelotti, E. A., Whicker, J. J., Eisele, W. F., Breshears, D. D., and Kirchner, T. B.: Modeling aeolian transport of soil-bound plutonium: considering infrequent but normal environmental disturbances is critical in estimating future dose, J. Environ. Radioactiv., 120, 73–80, https://doi.org/10.1016/j.jenvrad.2013.01.011, 2013.
Panagos, P., Imeson, A., Meusburger, K., Borrelli, P., Poesen, J., and Alewell, C.: Soil Conservation in Europe: Wish or Reality?, Land Degrad. Dev., 27, 1547–1551, https://doi.org/10.1002/ldr.2538, 2016.
Porto, P. and Callegari, G.: Comparing long-term observations of sediment yield with estimates of soil erosion rate based on recent Cs-137 measurements. Results from an experimental catchment in Southern Italy, Hydrol. Process., 36, e14663, https://doi.org/10.1002/hyp.14663, 2022.
Porto, P. and Walling, D. E.: Validating the use of Cs-137 and Pb-210(ex) measurements to estimate rates of soil loss from cultivated land in southern Italy, J. Environ. Radioactiv., 106, 47–57, https://doi.org/10.1016/j.jenvrad.2011.11.005, 2012.
Porto, P., Walling, D. E., and Ferro, V.: Validating the use of caesium-137 measurements to estimate soil erosion rates in a small drainage basin in Calabria, Southern Italy, J. Hydrol., 248, 93–108, https://doi.org/10.1016/s0022-1694(01)00389-4, 2001.
Porto, P., Walling, D. E., Ferro, V., and Di Stefano, C.: Validating erosion rate estimates provided by caesium-137 measurements for two small forested catchments in Calabria, southern Italy, Land Degrad. Dev., 14, 389–408, https://doi.org/10.1002/ldr.561, 2003.
Porto, P., Walling, D. E., and Callegari, G.: Using 137Cs and 210Pbex measurements to investigate the sediment budget of a small forested catchment in southern Italy, Hydrol. Process., 27, 795–806, https://doi.org/10.1002/hyp.9471, 2013.
Porto, P., Walling, D. E., Alewell, C., Callegari, G., Mabit, L., Mallimo, N., Meusburger, K., and Zehringer, M.: Use of a 137Cs re-sampling technique to investigate temporal changes in soil erosion and sediment mobilization for a small forested catchment in southern Italy, J. Environ. Radioactiv., 138, 137–148, 2014.
Porto, P., Cogliandro, V., and Callegari, G.: Exploring the performance of the SEDD model to predict sediment yield in eucalyptus plantations. Long-term results from an experimental catchment in Southern Italy, IOP C. Ser. Earth Env., 107, 012020, https://doi.org/10.1088/1755-1315/107/1/012020, 2018.
Porto, P., Bacchi, M., Preiti, G., Romeo, M., and Monti, M.: Combining plot measurements and a calibrated RUSLE model to investigate recent changes in soil erosion in upland areas in Southern Italy, J. Soils Sediments, 22, 1010–1022, https://doi.org/10.1007/s11368-021-03119-2, 2022.
Qiao, J. X., Hansen, V., Hou, X. L., Aldahan, A., and Possnert, G.: Speciation analysis of I-129, Cs-137, Th-232, U-238, Pu-239 and Pu-240 in environmental soil and sediment, Appl. Radiat. Isotopes, 70, 1698–1708, https://doi.org/10.1016/j.apradiso.2012.04.006, 2012.
Reichstein, M., Bahn, M., Ciais, P., Frank, D., Mahecha, M. D., Seneviratne, S. I., Zscheischler, J., Beer, C., Buchmann, N., Frank, D. C., Papale, D., Rammig, A., Smith, P., Thonicke, K., van der Velde, M., Vicca, S., Walz, A., and Wattenbach, M.: Climate extremes and the carbon cycle, Nature, 500, 287–295, https://doi.org/10.1038/nature12350, 2013.
Schimmack, W., Auerswald, K., and Bunzl, K.: Can Pu239+240 replace Cs-137 as an erosion tracer in agricultural landscapes contaminated with Chernobyl fallout?, J. Environ. Radioactiv., 53, 41–57, 10.1016/s0265-931x(00)00117-x, 2001.
Sorriso-Valvo, M., Bryan, R. B., Yair, A., Iovino, F., and Antronico, L.: Impact of afforestation on hydrological response and sediment production in a small Calabrian catchment, Catena, 25, 89–104, https://doi.org/10.1016/0341-8162(95)00002-A, 1995.
Teramage, M. T., Onda, Y., Wakiyama, Y., Kato, H., Kanda, T., and Tamura, K.: Atmospheric Pb-210 as a tracer for soil organic carbon transport in a coniferous forest, Environ. Sci.-Proc. Imp., 17, 110–119, https://doi.org/10.1039/c4em00402g, 2015.
Tims, S. G., Everett, S. E., Fifield, L. K., Hancock, G. J., and Bartley, R.: Plutonium as a tracer of soil and sediment movement in the Herbert River, Australia, Nucl. Instrum. Meth. B, 268, 1150–1154, https://doi.org/10.1016/j.nimb.2009.10.121, 2010.
Wallbrink, P. J. and Murray, A. S.: Determining soil loss using the inventory ratio of excess lead-210 to cesium-137, Soil Sci. Soc. Am. J., 60, 1201–1208, 1996.
Walling, D. E., He, Q., and Appleby, P. G.: Conversion models for use in soil-erosion, soil-redistribution and sedimentation investigations, in: Handbook for the Assessment of Soil Erosion and Sedimentation using Environmental Radionuclides, edited by: Zapata, F., Kluwer Academic Publishers, the Netherlands, 111–164, ISBN 1-4020-1041-9, 2002.
Walling, D. E., Zhang, Y., and He, Q.: Conversion models and related software, in: Guidelines for Using Fallout Radionuclides to Assess Erosion and Effectiveness of Soil Conservation Strategies, IAEA-TECDOC-1741, Vienna, 125–148, ISBN 978–92–0–105414–2, 2014.
Wilken, F., Fiener, P., Ketterer, M., Meusburger, K., Muhindo, D. I., van Oost, K., and Doetterl, S.: Assessing soil redistribution of forest and cropland sites in wet tropical Africa using 239+240Pu fallout radionuclides, SOIL, 7, 399–414, https://doi.org/10.5194/soil-7-399-2021, 2021.
Wood, S. N.: Low-rank scale-invariant tensor product smooths for generalized additive mixed models, Biometrics, 62, 1025–1036, https://doi.org/10.1111/j.1541-0420.2006.00574.x, 2006.
Xiao, H., Liu, G., Liu, P., Zheng, F., Zhang, J., and Hu, F.: Sediment transport capacity of concentrated flows on steep loessial slope with erodible beds, Sci. Rep., 7, 2350, https://doi.org/10.1038/s41598-017-02565-8, 2017.
Xu, Y., Pan, S., Wu, M., Zhang, K., and Hao, Y.: Association of Plutonium isotopes with natural soil particles of different size and comparison with 137Cs, Sci. Total Environ., 581–582, 541–549, https://doi.org/10.1016/j.scitotenv.2016.12.162, 2017.
Xu, Y. H., Qiao, J. X., Hou, X. L., and Pan, S. M.: Plutonium in Soils from Northeast China and Its Potential Application for Evaluation of Soil Erosion, Sci. Rep., 3, 3506, https://doi.org/10.1038/srep03506, 2013.
Xu, Y. H., Qiao, J. X., Pan, S. M., Hou, X. L., Roos, P., and Cao, L. G.: Plutonium as a tracer for soil erosion assessment in northeast China, Sci. Total Environ., 511, 176–185, https://doi.org/10.1016/j.scitotenv.2014.12.006, 2015.
Zapata, F.: The use of environmental radionuclides as tracers in soil erosion and sedimentation investigations: recent advances and future developments, Soil Till. Res., 69, 3–13, 2003.
Zhou, G. Y., Morris, J. D., Yan, J. H., Yu, Z. Y., and Peng, S. L.: Hydrological impacts of reafforestation with eucalypts and indigenous species: a case study in southern China, Forest Ecol. Manage., 167, 209–222, https://doi.org/10.1016/S0378-1127(01)00694-6, 2002.
Zuazo, V. C. H. D. and Pleguezuelo, C. R. O. R.: Soil-Erosion and Runoff Prevention by Plant Covers: A Review, in: Sustainable Agriculture, edited by: Lichtfouse, E., Navarrete, M., Debaeke, P., Véronique, S., and Alberola, C., Springer Netherlands, Dordrecht, 785–811, https://doi.org/10.1007/978-90-481-2666-8, ISBN 978-90-481-2665-1, 2009.