the Creative Commons Attribution 4.0 License.
the Creative Commons Attribution 4.0 License.
 | 05 Jul 2023
Pesticide transport through the vadose zone under sugarcane in the Wet Tropics, Australia
Rezaul Karim
Les Dawes
Ofer Dahan
Glynis Orr
Photosystem II (PS II) pesticides, recognized as a threat to ecological health, were targeted for reduction in sugarcane farming in Great Barrier Reef (GBR) catchments. Alternative herbicides, the non-PS II herbicides (including glyphosate, paraquat, 2,4-D, imazapic, isoxaflutole, metolachlor, and S-metolachlor), continue to be used in these catchments. However, the potential ecological fate, transport, and off-site environmental effects of non-PS II herbicides, with respect to their usage scheme, local rainfall patterns, and infiltration dynamics, have not been investigated previously. A vadose zone monitoring system, instrumented beneath sugarcane land in a GBR catchment, was applied for real-time tracing of pesticide migration across the unsaturated zone, past the root zone during 2017–2019. The regularly applied pesticides (fluroxypyr and isoxaflutole) exhibited substantial migration through the unsaturated zone. Within 1 month of application of fluroxypyr, it leached to 2.87 m depth in the vadose zone, with declining concentrations with depth. Isoxaflutole, which was applied yearly, was found only once, in November 2018, at 3.28 m depth in the soil profile. Other pesticides (imazapic, metolachlor, glyphosate, and haloxyfop) applied during the same period were not detected in the vadose zone. However, imidacloprid, which was not applied at the site during the monitored period, was detected across the entire vadose zone, revealing substantial resistance to degradation. The results show no evidence of any regularly applied pesticides in the site bores at the end of the study, indicating their ultimate degradation within the vadose zone before reaching the groundwater.
- Article
(3680 KB) - Full-text XML
-
Supplement
(1157 KB) - BibTeX
- EndNote


Agriculture has a considerable influence on groundwater quality as well as quantity. With continuous increases in agricultural production, agrochemicals (fertilizers and pesticides) can be transported into the environment (Adeoye et al., 2013). These agrochemicals can potentially percolate through the rhizosphere after rain and may ultimately leach into the underlying groundwater, potentially lowering the quality of the groundwater (Adeoye et al., 2013). During the past centuries, catchments close to the Great Barrier Reef (GBR) have been considerably changed through the growth of agricultural activities and municipal settlement. There is evidence that this development has resulted in water quality deterioration in the GBR waterways (Brodie et al., 2013; Armour et al., 2009; Rasiah and Armour, 2001). Despite the high level of protection in recent decades, the water quality situation has continued to decline (Kroon et al., 2016). The key concerns for the catchments are the increasing quantity of suspended sediments, the discharge of nitrogen (Brodie et al., 2015), and the transport and potential toxic effects of pesticides from farming areas (Smith et al., 2012). Many studies have detected increased loads of agrochemicals, e.g. fertilizers and pesticides, being transported to the GBR via runoff (Smith et al., 2012). Yet, there is also potential for pesticides and nutrients to be moved to the GBR via groundwater, and only a few studies have focused on groundwater pathways (Rayment, 2003; Stieglitz, 2005; Armour et al., 2009; Rasiah and Armour, 2001).
In 2001, the Great Barrier Reef Marine Park Authority first reported water condition deterioration in the GBR (Great Barrier Reef Marine Park Authority, 2009). In response, the Reef Water Quality Protection Plans 2003, 2009, and 2013 and most recently the Reef 2050 Plan have been designed to deal with the problem (Brodie et al., 2017). During this period, 2001–2018, there has been a significant growth in the knowledge of pesticide dynamics, including sources, movement, exposure, fate, and, finally, the environmental threat of pesticides to the GBR (Devlin et al., 2015; Johnson and Ebert, 2000; Kroon et al., 2013; Shaw et al., 2010; Smith et al., 2012). Pesticides in the GBR area have been discovered in rivers and creeks (Smith et al., 2012), sediments (Haynes et al., 2000), freshwater wetlands (Devlin et al., 2015; Davis et al., 2012), and marine environments (Gallen et al., 2016; Shaw et al., 2010). Elevated pesticide concentrations were mostly found in connection with sugarcane farming in three geographical regions, Tully–Murray, Burdekin–Townsville, and Mackay–Whitsunday, of the GBR catchment area (Lewis et al., 2009). Pesticides were also observed in the Johnstone River (Wallace et al., 2015) and South Johnstone River (Smith et al., 2012), which are also sugarcane-dominated catchments.
Five photosystem II (PS II)-inhibiting herbicides (namely tebuthiuron, ametryn, hexazinone, diuron, and atrazine, known as the “Priority Five”) were recognized as a threat to the environmental health and resilience at the GBR catchments and have been targeted for decrease through land management practices (Brodie et al., 2009; Davis and Pradolin, 2016; Devlin et al., 2015; Masters et al., 2013; Silburn et al., 2013; Thorburn et al., 2013; Vardy et al., 2015; Wallace et al., 2015). Pesticide reduction loads, reducing 50 % of end-of-catchment loads, were introduced in agriculture, primarily from cropping and sugarcane farming through best management practices (Devlin et al., 2015). Reported management practices already in use across sugarcane farming, not only in the GBR but also globally, include cropping systems (Nachimuthu et al., 2016), product selection, application timing, precision application (García-Santos et al., 2016; Melland et al., 2016; Masters et al., 2013; Oliver et al., 2014), using a straw/trash blanket (Dang et al., 2016; Nachimuthu et al., 2016), and even switching to “alternative PS II or non-PS II herbicides” (Tao and Yang, 2011; Lewis et al., 2016). Alternative/other non-PS II herbicides, including 2,4-D, glyphosate, paraquat, monosodium methyl arsenate (MSMA), 4-chloro-2-methylphenoxyacetic acid (MCPA), imazapic, trifloxysulfuron sodium, isoxaflutole, trifluralin, S-metolachlor, metolachlor, and pendimethalin, have been widely used in sugarcane farming (Davis et al., 2014).
At the paddock scale, pesticide loads, estimation of the mass of pesticides annually entering the GBR from agriculture, were quantified based on monitoring data and modelling data (Australian Government and Queensland Government, 2018). Significant advances in techniques to measure impacts in situ were applied to determine the default values through the species sensitivity distribution technique (Smith, 2018). Aquatic ecosystem protection guideline values have been developed recently for 28 pesticides, including 13 PS II herbicides, frequently utilized in the GBR catchments (King et al., 2017a, b; Smith, 2018). However, out of all pesticides detected, PS II herbicides still provide the highest loads and the highest ecological risk to the GBR (Devlin et al., 2015; Wallace et al., 2015; Gallen et al., 2016; Vardy et al., 2015). These potential risks have been supported by the detection of several PS II herbicides in soil, vadose water, and groundwater at low concentrations (Karim et al., 2021).
The vadose zone, which extends from the ground surface to the aquifer, is incredibly complicated in structure, governing water passage along its extent (Arora and Ahmed, 2011). Dahan et al. (2009) introduced the vadose zone monitoring system (VMS) to monitor water and solute movement through the vadose zone. The system consists of flexible time domain reflectometry (FTDR) waveguides and flexible vadose zone sampling ports (VSPs), which support attachment of the water content sensor and sampling units to the unusual structure of borehole walls. The VMS enables uninterrupted tracing of water percolation and chemical transport across the entire vadose zone (Rimon et al., 2007; Dahan et al., 2009; Turkeltaub et al., 2016; Aharoni et al., 2017). The installation of VMS has been tested internationally in various settings. Examples include those in largely desert and semi-arid areas in Rene, California (Dahan et al., 2003), in a hyper-arid desert, in Arava Valley, Israel (Dahan et al., 2007), in a typical desert ephemeral river, Namibia (Dahan et al., 2008), and in a Mediterranean climate, Israel (Rimon et al., 2007). It was also applied to investigate PS II herbicide transport across the vadose zone in the sugarcane field during 2017–2019 (Karim et al., 2021). However, this study was unable to link the water percolation and pesticide migration dynamics with application regime, as PS II herbicides (including the Priority Five) were not applied during monitoring period at the site.
It is important to track pesticide transport and transformation dynamics from shallow to deep vadose zone horizons, in order to achieve “real time early warning” of pesticide pollution potential (Dahan et al., 2009) and thereby quickly detect and take steps to manage these pesticides (Lewis et al., 2016). The lag times from application to the appearance of pesticides in groundwater or impact on the environment may range from days to several years (Bidwell, 2000). Therefore, continuous tracking of the transport characteristics of pesticides (after immediate application) in the unsaturated zone is critical for appropriate assessment of the possible impact of pesticide usage on groundwater. The transport and transformation of pesticides in the unsaturated zone is not yet clearly understood due to complex biotransformation process that can take place in the unsaturated zone (Rivett et al., 2011). There is scarce information on the possible ecological fate and off-site environmental impacts of non-PS herbicides used in sugarcane farming catchments (Davis et al., 2014).
This study aims to investigate water percolation and pesticide migration dynamics across the vadose zone below sugarcane fields in the conditions of the Wet Tropics of Australia. The study was performed using continuous measurements of temporal variations in soil saturation plus measurements of the concentration of pesticides along the vadose zone profile and underlying alluvial aquifers at sugarcane fields in the South Johnstone River sub-basin, Australia. A vadose zone monitoring system was set up to enable the characterization of pesticide (non-PS II herbicides) migration with respect to pesticide application, sugarcane growing period, and, finally, rainwater infiltration.
2.1 Monitoring site details
The study area (17∘44′44.72′′ S, 146∘2′58.76′′ E; Fig. 1) is in a sugarcane field near Silkwood township, in the centre of the South Johnstone catchment. It is owned by a commercial sugar manufacturing company, MSF, and is approximately 2.8 ha. It is isolated from the surrounding surface water runoff by a constructed channel. The channel (1–1.5 m deep) bounds the northern, eastern, and southern borders of the paddock, enabling drainage away from the site (Masters et al., 2017). The construction of channels around three sides of the paddock is not typical practice in the catchment.
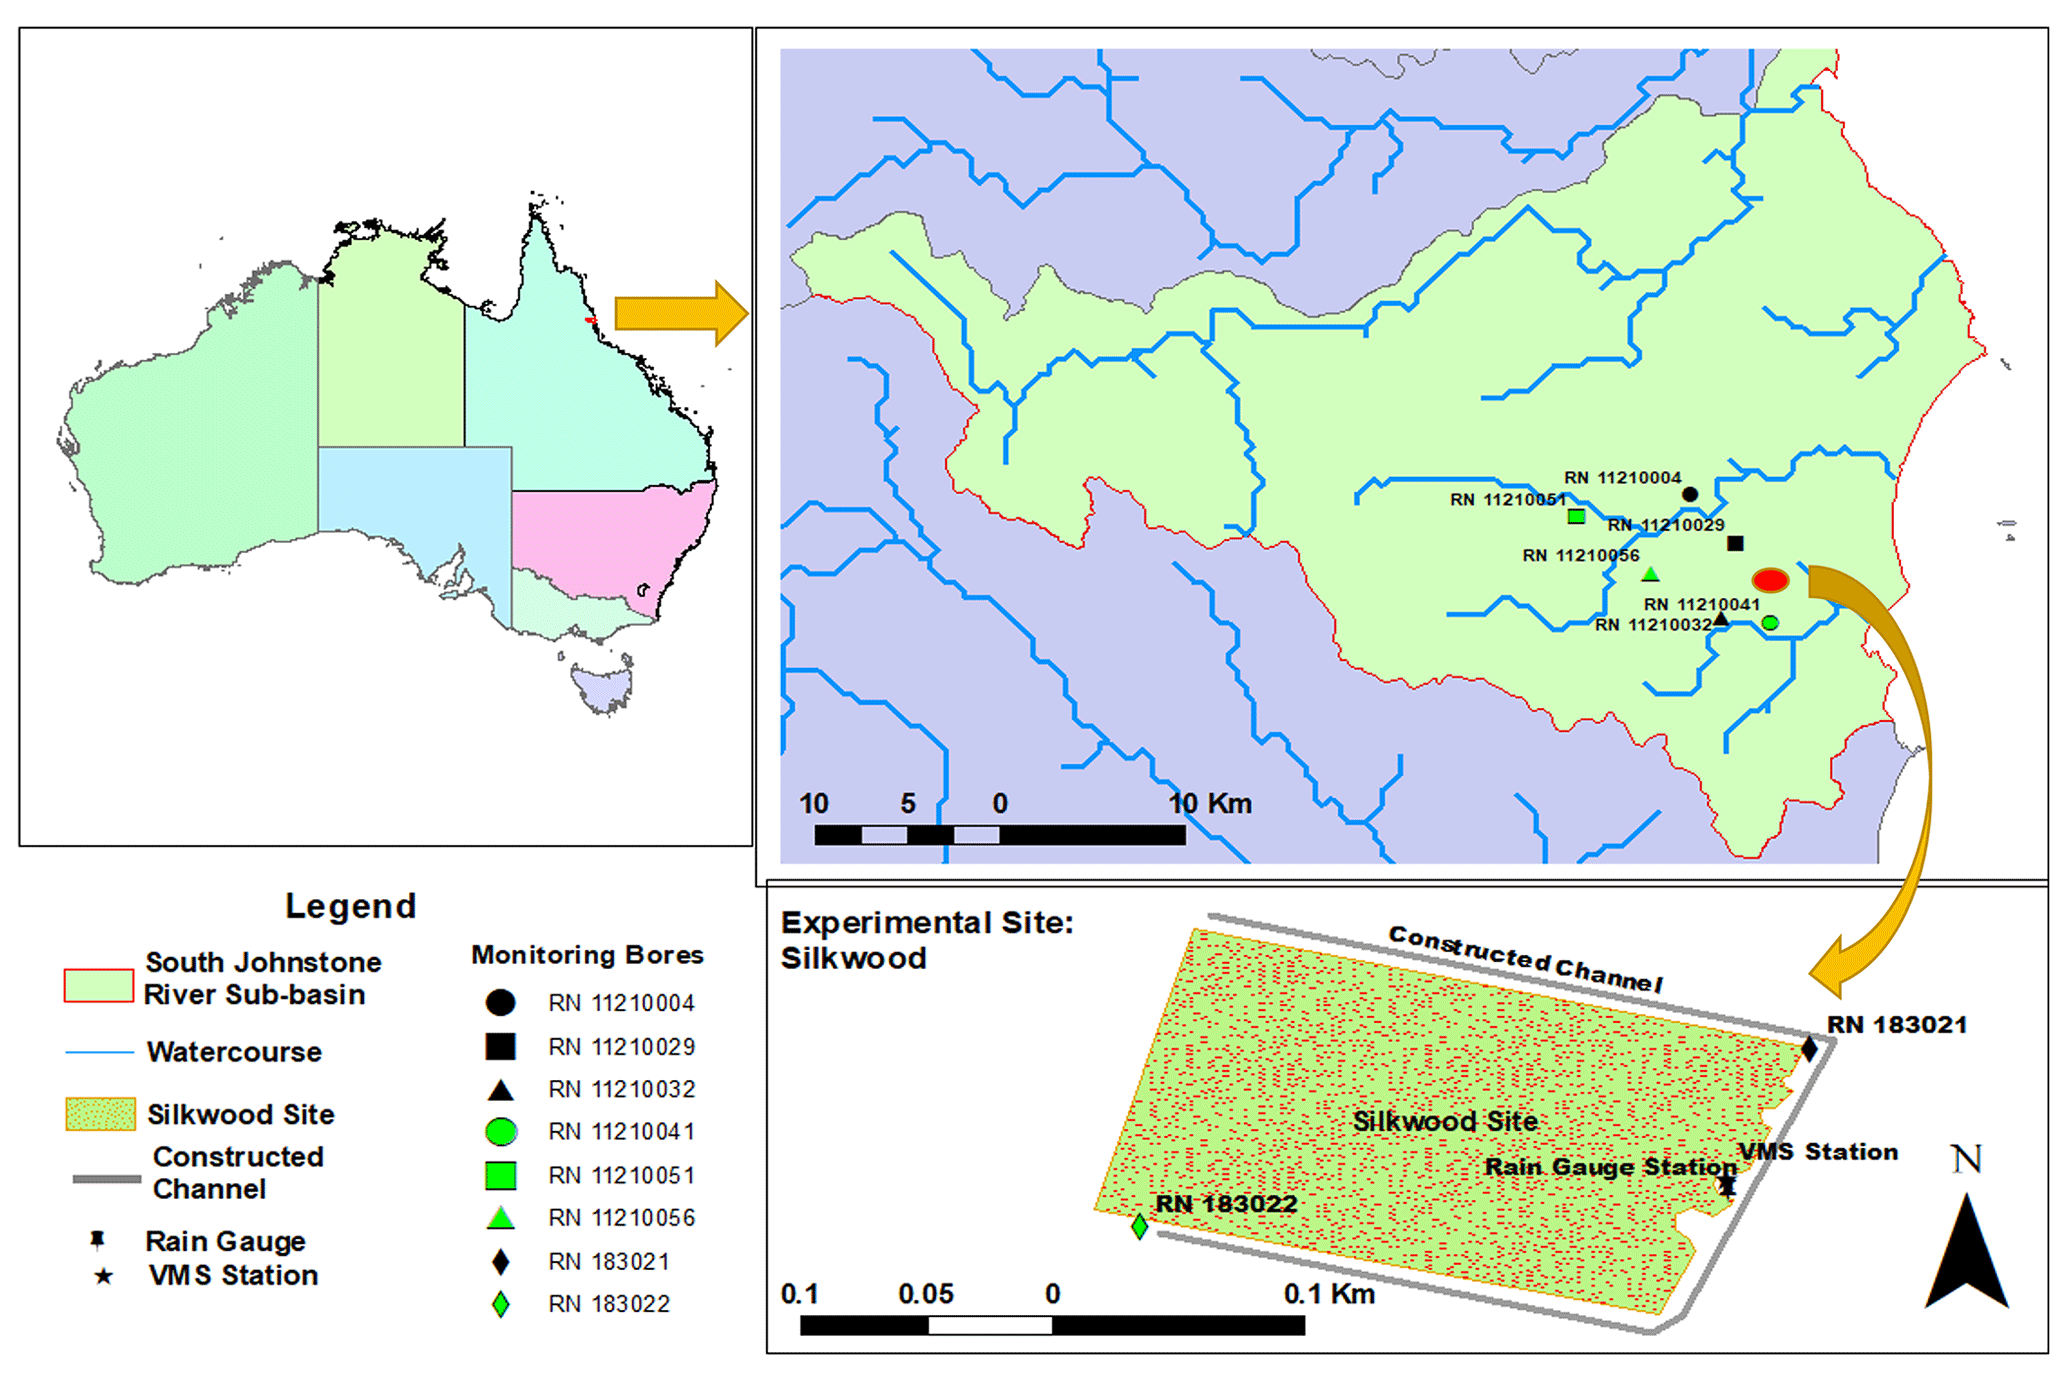
Figure 1Monitoring site: Silkwood, South Johnstone River sub-basin, Queensland, Australia.
A detailed soil survey was carried out across the monitored site to identify and map the soil types (Masters et al., 2017). The dominant soil is regionally described as Bulgun series, a poorly drained alluvial soil first described by Murtha (1986), also classified as very deep Humose-Acidic, Dermosolic, Redoxic Hydrosol (Isbell, 2016). Based on the world reference base for soil resources 2014 (ISUU Working Group WRB, 2022), the soil at the site is classified as “Stagnic Umbrisol (Pantoclayic, Sideralic, Humic)” according to Enderlin and Harms (2023). The detailed soil profile, to 4 m depth, was stratified into five different layers, predominantly loamy textures (Fig. 2; Karim et al., 2021). The extended profile to 12 m depth was predominantly composed of clay-rich layers, followed by aquifer material at 9–11 m depth (Stanley, 2019). These loam- and clay-rich textures regulate the site hydrology (infiltration, runoff, and deep drainage). The organic matter content of productive agricultural topsoil is usually between 3 % and 6 % (Fenton et al., 2008), but the present study found higher organic matter, above 20 % in the topsoil (0.0–0.7 m depth; Table 1), than the previous study (5.7 %, 0.0–0.1 m depth) in wet conditions (Masters et al., 2017).
Table 1Soil organic matter in the site soil (loss-on-ignition method).

The study site experiences a humid tropical climate, predominantly influenced by coastal meteorological situations (Tahir et al., 2019). According to the interpolated climatic data available through the Queensland Government's SILO database from 2010 to 2023 (SILO grid point: latitude – 17.75, longitude – 146.05), the mean annual minimum and maximum temperatures are 21 and 29 ∘C respectively. The average predicted potential evapotranspiration is 5.18 mm yr−1, determined by Morton's potential evapotranspiration, during 2010–2023. The annual average interpolated rainfall is 3202 mm yr−1 at the monitoring site. According to the Bureau of Meteorology (BoM), the annual average rainfall is 3092 mm yr−1 at the nearest BoM Station – Bingil Bay (Site 032009), situated nearly 12.5 km from the site. This area typically experiences the highest rainfall in the wet seasons, from December to April. For regular rainfall monitoring, the site was fitted with tipping bucket rain gauges, which were organized by the Queensland Government (Masters et al., 2017). The site is not irrigated, which is common for sugarcane cultivation in tropical conditions. Therefore, the local rainfall patterns govern the site hydrology with respect to soil stratigraphy.
2.2 Cropping history of the monitoring site
After harvesting the previous sugarcane crop in November 2013, the site was laser levelled to ensure a uniform slope across the paddock. Then, planting beds were designed using controlled traffic farming methods in early December (Masters et al., 2017). In the subsequent wet season, 2013–2014, the land was uncultivated. After the wet season, lime was applied. The cane variety, Q183, was transplanted in July 2014. Typically, sugarcane becomes mature in spring (September–November) and is harvested at the end of this season in the Wet Tropics region. In this article, the period from September to October will be considered as the sugarcane growing season (plant or ratoon, new shoot springing from the base). The cropping periods will be referred to as 2014–2015 (plant), 2015–2016 (ratoon 1), 2016–2017 (ratoon 2), 2017–2018 (ratoon 3), 2018–2019 (last harvesting, ratoon 4), and 2019–2020 (fallow, field processing for next planting; Table 2).
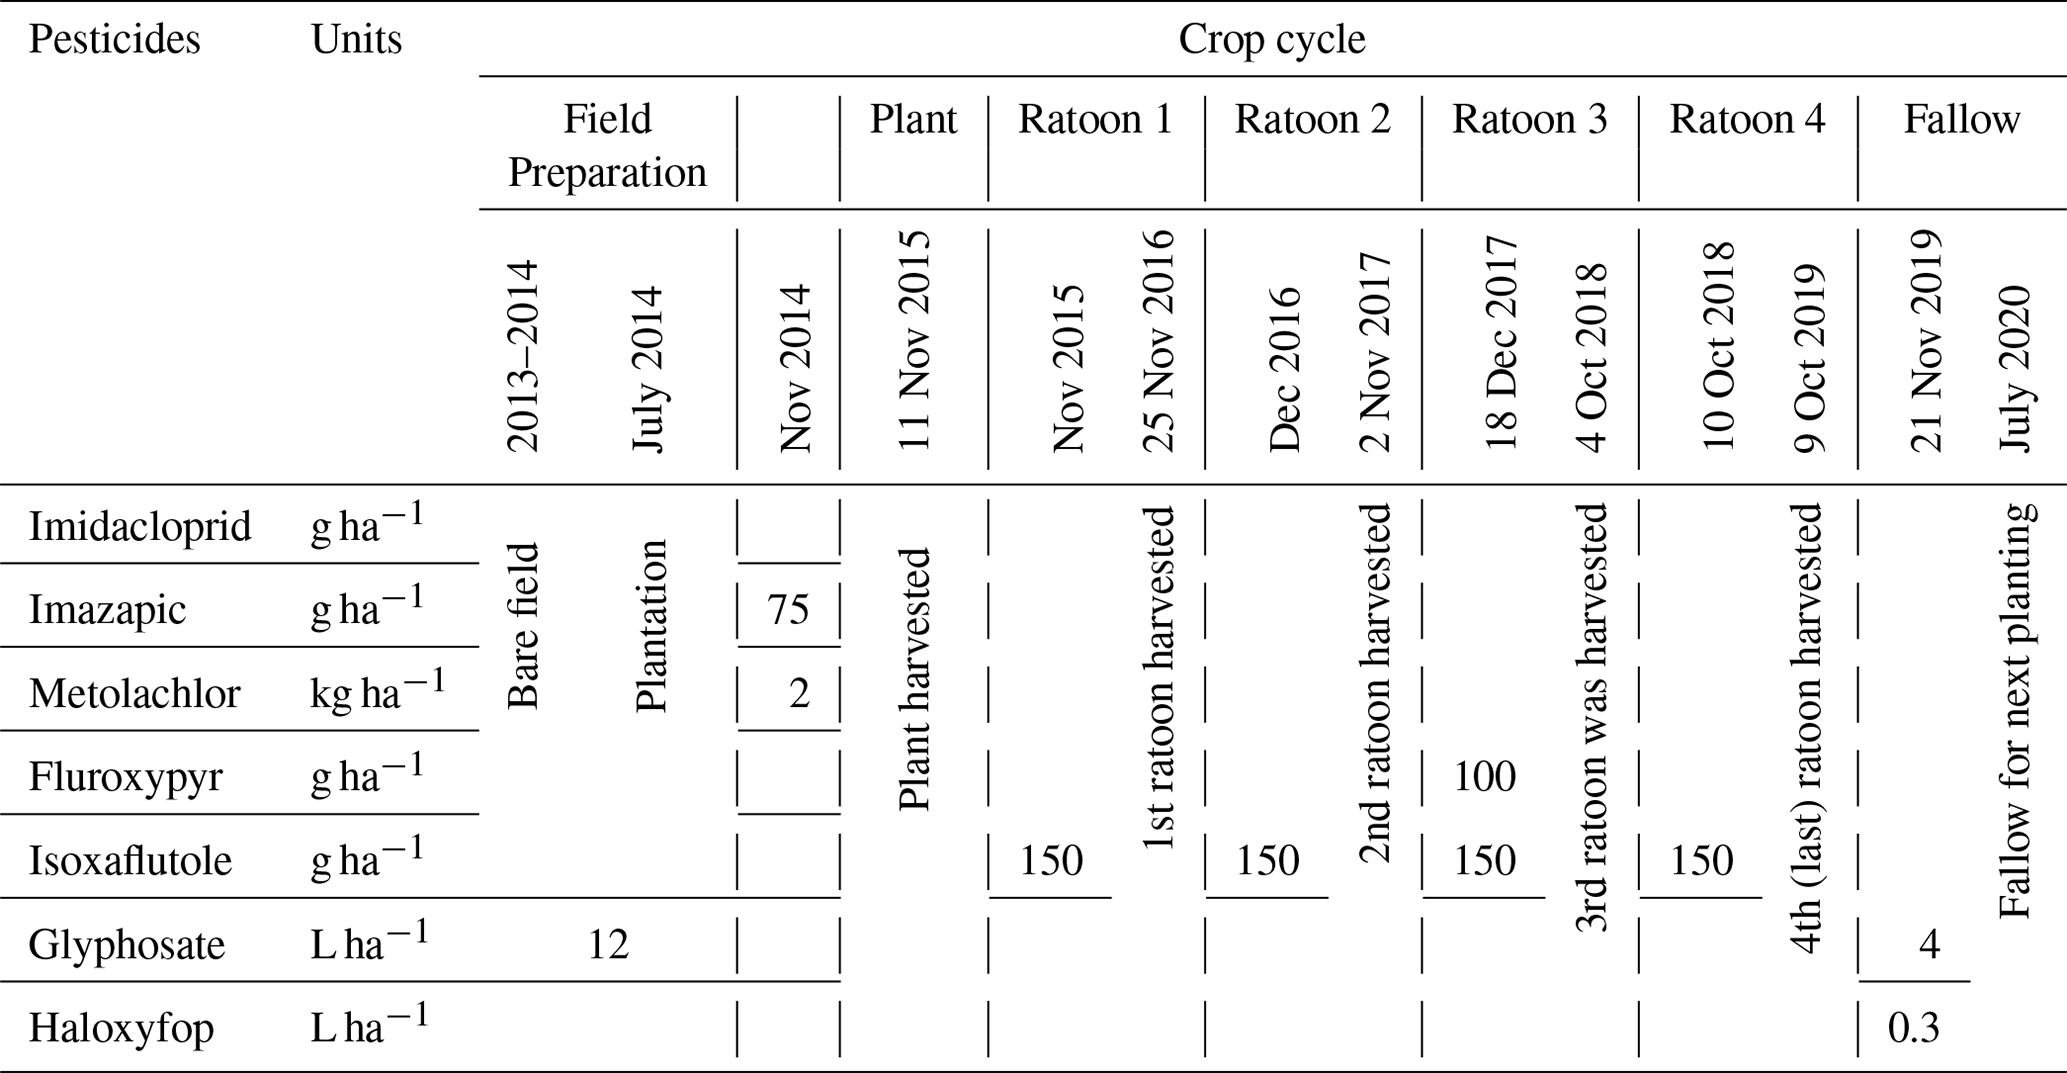
A concise description of all cultivation and pest and weed management methods during planting to harvesting is given in the Table 2. Each year, after harvesting the matured ratoon, pesticides were applied for the next ratoon at the site. Pesticide applications at the site included imazapic and metolachlor in November 2014, fluroxypyr in November 2017, and isoxaflutole each year after harvesting. Glyphosate was applied during 2013–2014 and 2019–2020 and haloxyfop was applied once in November 2019.
2.3 Monitoring setup
2.3.1 Vadose zone monitoring system
The site was instrumented with a VMS (Sensoil Ltd, Israel) in July 2017 (Fig. 2). Details on the VMS, including installation procedures and performance, have been described previously (Rimon et al., 2007). There were two sleeves (A and B) in the installed VMS at the site. Each sleeve was installed in a slanted (35∘ to perpendicular) borehole. Each sleeve consisted of four FTDR probes for constant measurement of soil water content and four VSPs for regular porewater sampling (Fig. 2; Karim et al., 2021). The slanted holes were bored using a sonic drilling rig.
The vertical allocation of VMS units (FTDR and VSP) along with soil profile (texture and clay content) is given in Fig. 3. While sampling, pressurized gas (N2) was utilized to recover porewater to the sampling port (Dahan et al., 2009). The site VMS system was regulated with data acquisition and logging devices (e.g. CR800; Karim et al., 2021).
2.3.2 Monitoring bores
Six state-government-listed groundwater bores namely RN (registered number) 11210004, RN 11210029, RN 11210032, RN 11210041, RN 11210051, and RN 11210056 were selected in the South Johnstone River sub-basin. The aquifer depth of these bores ranged from 7 to 33 m (Stanley, 2019). Additionally, two bores, RN 183021 and RN 183022 (aquifer depth, 9–11 m), were installed in the north-east and south-west corner of the paddock respectively. The surface elevation of the two installed bores (RN 183021 and RN 183022) was 7–7.5 and 5–5.5 m respectively, indicating surface water flow from the south-west to the north-east (Masters et al., 2017). These bores were fitted with pressure transducers to monitor the groundwater level (GWL) at the site. A perched aquifer at 3–4 m depth was encountered while drilling bore RN 183021.
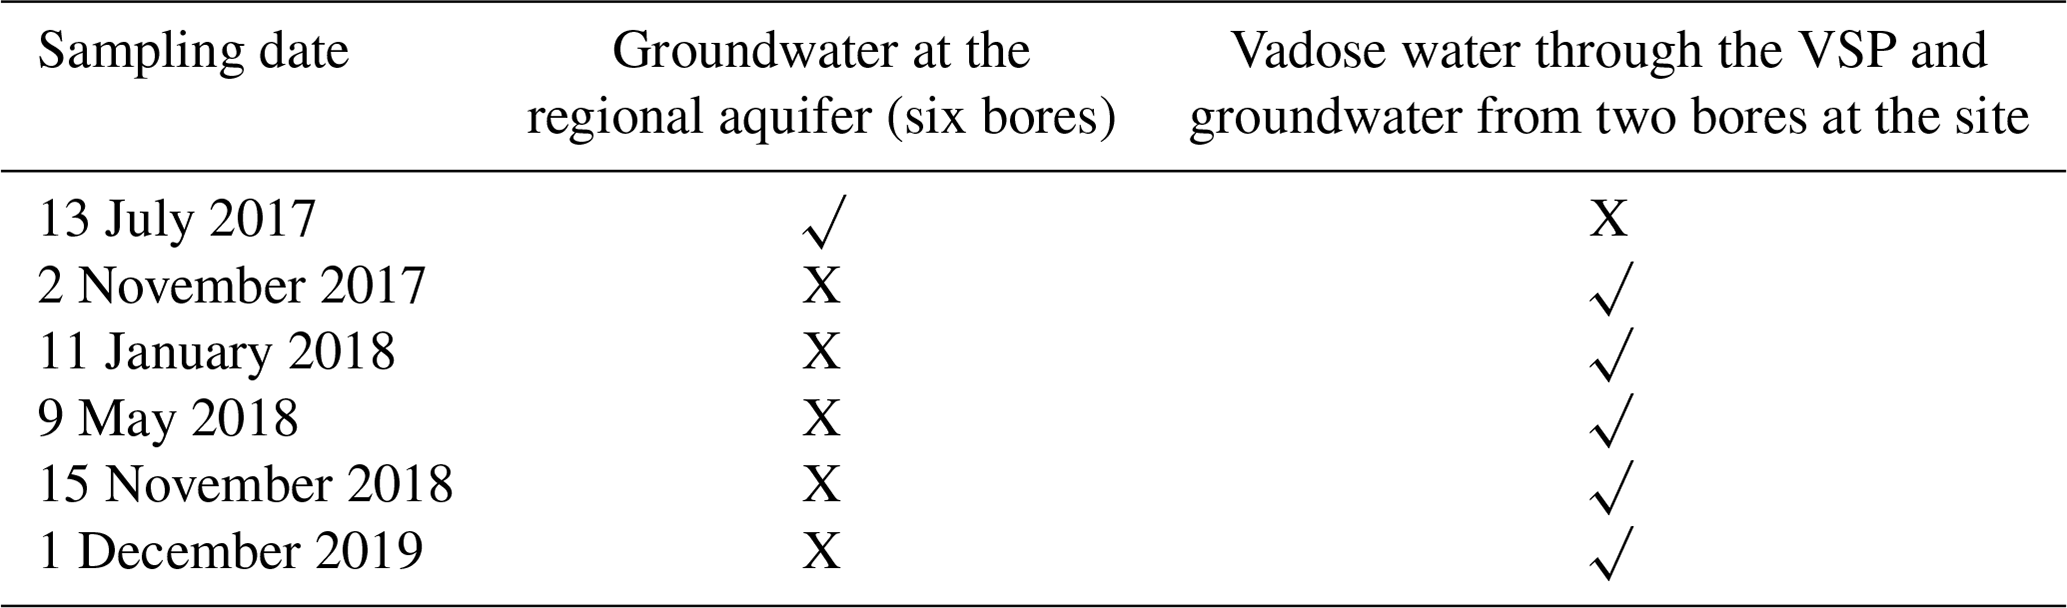
2.4 Sampling
Water and soil sampling at the site were scheduled from July 2017 to December 2019, considering the sugarcane growing phase and pesticide application time. The half-lives of pesticides recently applied at the site (Table A1 in the Appendix) were also considered for the sampling plan.
2.4.1 Water sampling
During the monitoring period, water samples (a total of 56) were gathered from the designated monitoring bores and from eight VSPs at different depths across the vadose zone (Table 3). For groundwater sampling, each bore was purged of 3 × volume of the bore casing to eliminate static bore water before sampling, confirming a more precise representation of aquifer water (Sundaram et al., 2009). Samples were stored in cool conditions at the site and kept in storage at 4 ∘C during transport to the lab for chemical analysis.
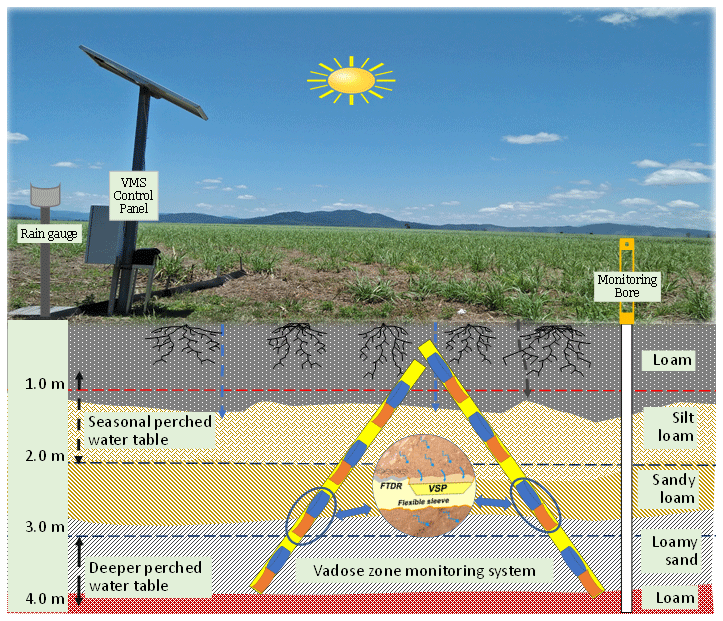
Table 3Water sampling regime for pesticide analysis (√ denotes samples collected on the corresponding date and X denotes dates when no samples were collected).
2.4.2 Soil sampling
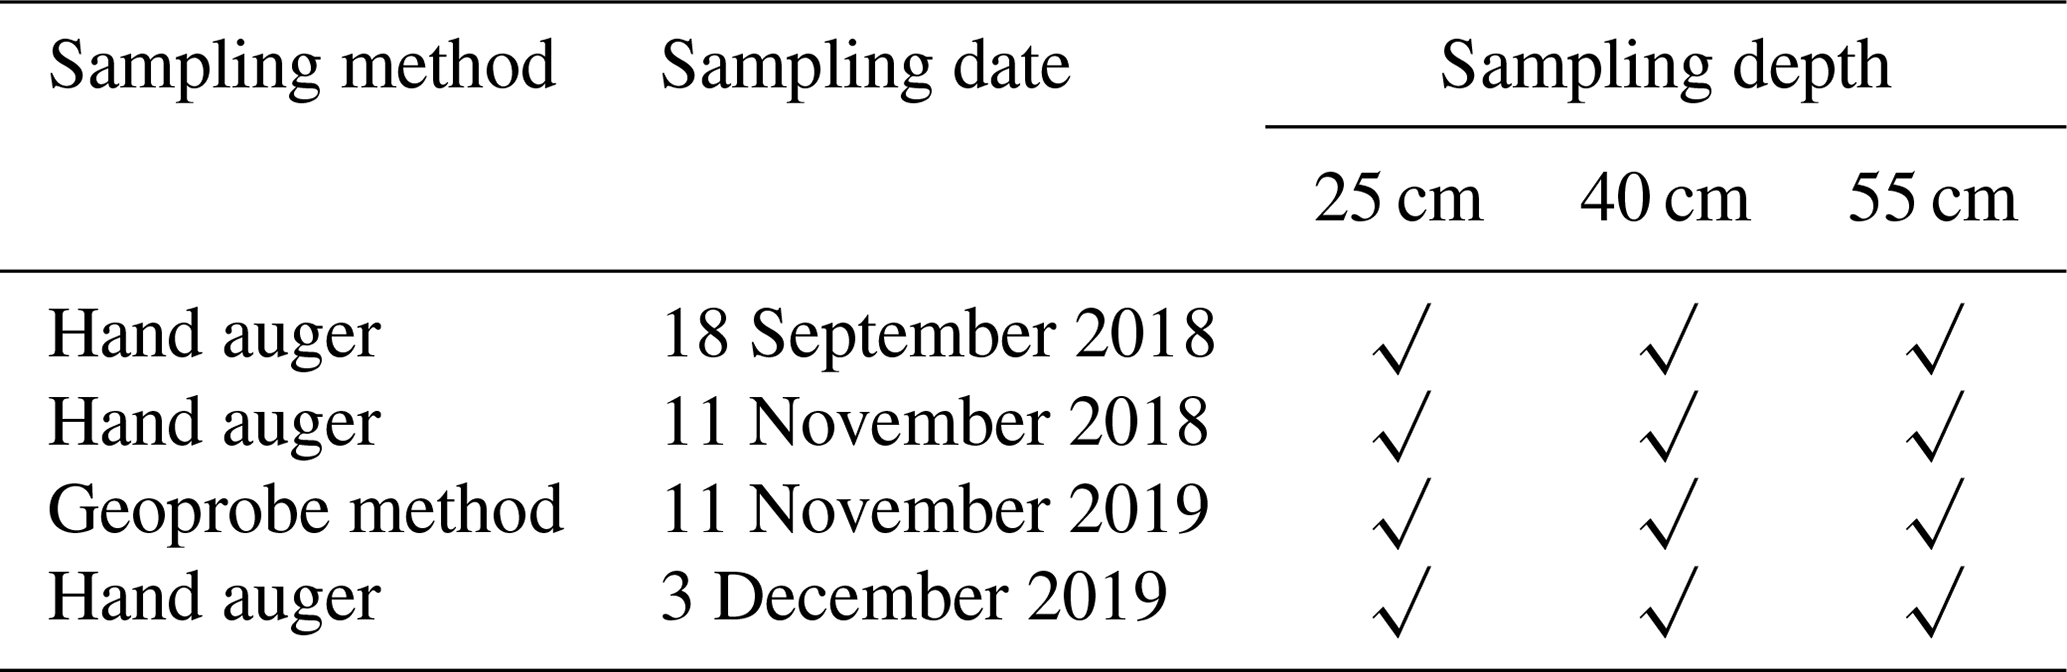
Based on the pesticide application regime (before and after), soil samples (a total of 12) were collected in 2018 and 2019 (Table 4). Soil sampling cores were collected from a depth of 20 cm from the soil surface at intervals to 55 cm by using a hand-driven auger and a Geoprobe system. These were immediately cooled on ice and kept cool during transport to the laboratory.
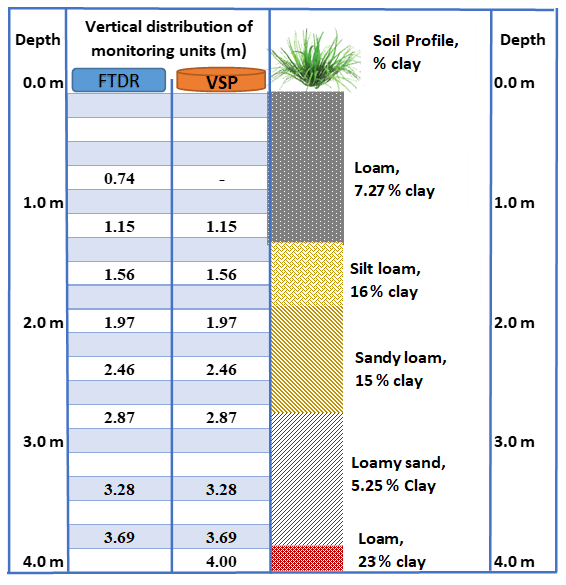
Table 4Soil sampling schedule for pesticide analysis (√ denotes the depths at which soil samples were collected for each of the sampling dates).
2.5 Chemical analysis
The pesticides and their possible metabolites were analysed by Queensland Health, Coopers Plains, Queensland. All collected samples (water and soil) were separated via solid-phase extraction (SPE) and analysed with liquid chromatography mass spectrometry (LC-MS). The analytical methodology (SPE combined with LC-MS) is generally utilized by the Great Barrier Reef Catchment Loads Modelling Program (Gallen et al., 2016; Shaw et al., 2010; Vardy et al., 2015; Wallace et al., 2015). One insecticide (imidacloprid) and six herbicides namely imazapic, metolachlor, fluroxypyr, isoxaflutole, glyphosate, and haloxyfop, which have been applied in recent years at the monitoring site, were tested in this study (Tables 5 and A1).
Table 5Ecotoxicity threshold value of pesticides and their common metabolites.
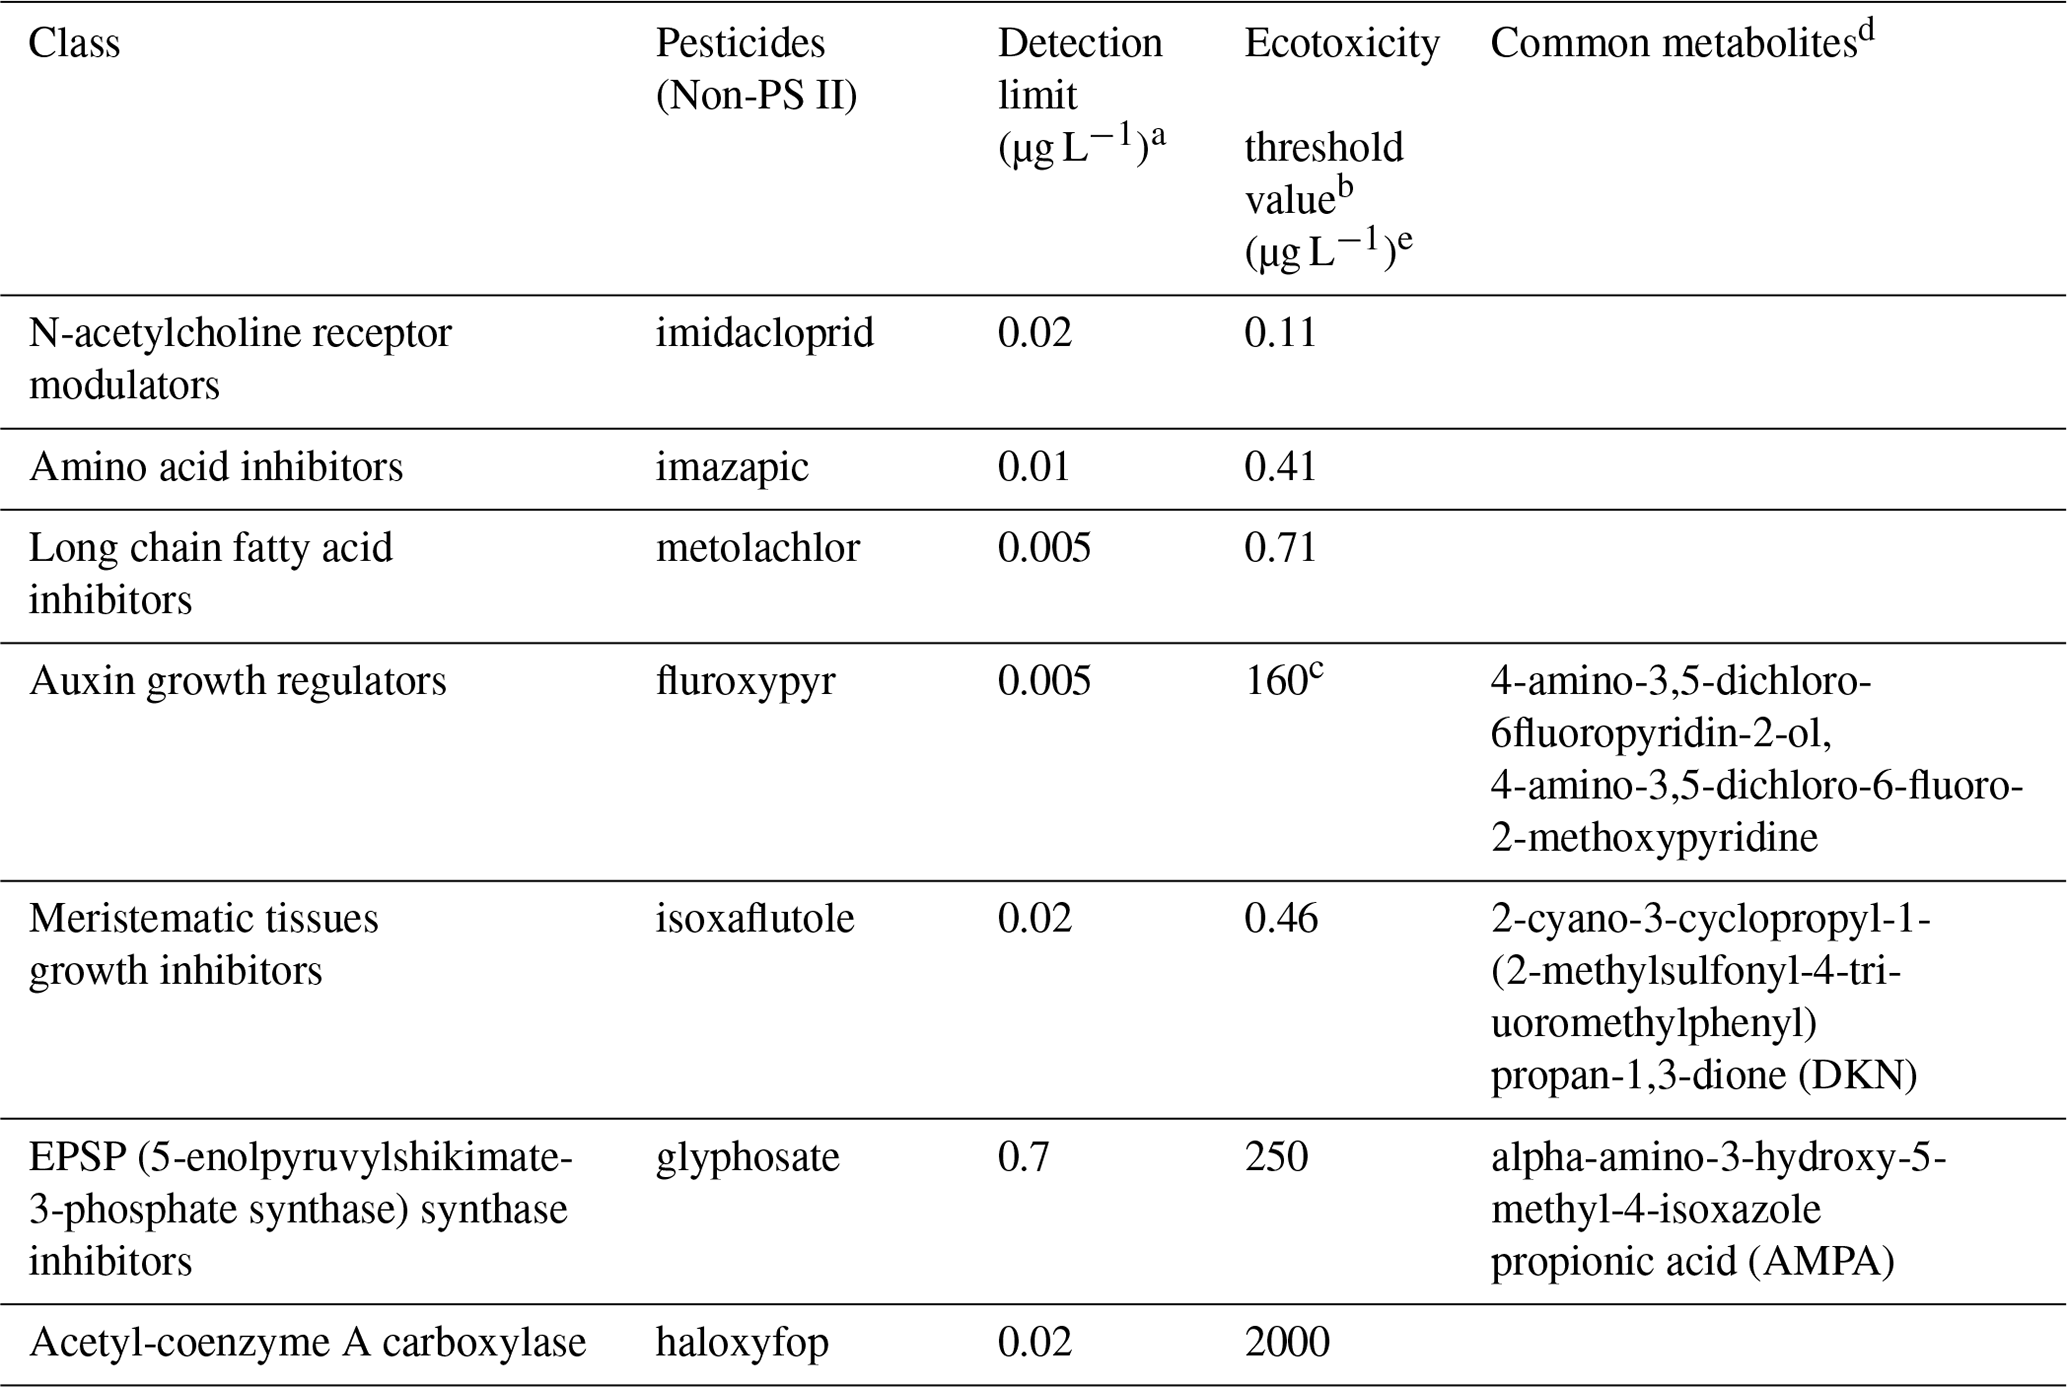
a The detection limits were defined by the analysis suite for water samples, developed by the Queensland Health Forensic and Scientific Service. b King et al. (2017b), c King et al. (2017a), d Database (2021) e Ecotoxicity threshold values were derived using Burrlioz 2.0 (2016) software for 95 % species protection (Warne et al., 2015).
2.5.1 Water analysis
There were two analytical method groups (Queensland Health notation: QIS 33963 for herbicides and pesticides and QIS 33917 for glyphosate) for water analysis used at the Queensland Health Laboratory. The analysis was performed by direct injection method by filtering 1 mL of sample using 0.2 µm filter and analysed on LC-MS/MS. For water herbicide analysis for imidacloprid, imazapic, metolachlor, fluroxypyr, isoxaflutole, and haloxyfop, the method details are provided in Table A2. During analysis, some matrix effects were experienced, and in these cases, the limit of reporting (LOR) was increased.
2.5.2 Soil analysis
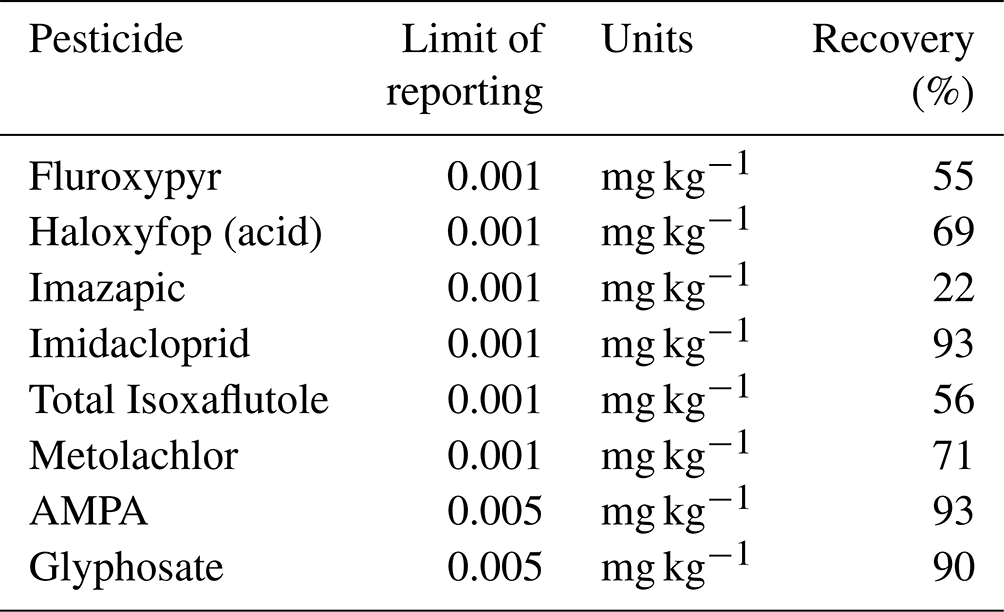
There were two analytical method groups (QIS 30814 for glyphosate and QIS 32456 for herbicides and pesticides) in soil/sediment. For QIS 30814, glyphosate and aminomethylphosphonic acid (AMPA) in soil/vegetation by LC-MS/MS was used: water was added to the soil samples and shaken. The aqueous phase was filtered and analysed via direct injection on the LC-MS/MS. For QIS 32456, determination of herbicides in soil and sediment using an LC-HRAM-Orbitrap was undertaken: the soil/sediment sample was first shaken with acetone using a tabletop shaker for approximately 12 h. The herbicides were then extracted using the QuEChERS (Quick Easy Cheap Effective Rugged Safe) method. The final extract was analysed with a LC-HRAM-Orbitrap. The method details for pesticide and herbicides in soil and sediment are provided in Table A3. Imazapic showed low recovery (<40 %) when it was analysed with the QIS 33456 method.
Increases in sediment water content are typically the outcome of water infiltration and downwards propagation of a wetting front, while a decrease of water content is a consequence of either deep drainage or evapotranspiration at the shallow layers affected by root uptake (Dahan et al., 2008). Accordingly, sequential wetting with depth represents the wetting front propagation velocity and infiltration fluxes (Rimon et al., 2011). Firstly, the site hydrology (Sect. 3.1) with respect to the local rainfall pattern, site morphology, and sugarcane growing season will be defined. Then, pesticide migration will be characterized with respect to the site hydrology (Sect. 3.2). Finally, the pesticide concentrations in groundwater will be reported and compared with the ecotoxicity threshold value (Sect. 3.3).
3.1 Site hydrology (infiltration and GWL variation)
3.1.1 Rainfall infiltration
Temporal changes in sediment water content through the vadose zone signifies percolation events which are well correlated to rainfall intensity and frequency (Fig. 4). Substantial increases in the measured water content of shallow sediments (0.74 and 1.15 m) were observed immediately following all significant rainfall events. However, the next two deeper probes, at 1.56 and 1.97 m, show high (saturated) water content, caused by a seasonal perched water table. Indications of seasonal perched water table were obtained during the drilling for VMS installation. Deeper in the cross sections at depths of 2.46 and 2.87 m, under the uppermost perching layer, the water content sensors exhibited unsaturated conditions with small fluctuations that are attributed to the rainfall events. Finally, the deepest probes (3.28 and 3.69 m) exhibited high and steady water content values that represent saturation over the whole monitored period due to a perched layer at this depth.
Each significant rainfall event initiated the infiltration process by causing substantial increases in water content, notably at shallow sediments (0.74 and 1.15 m). The 158.4 mm rainfall event on 19 September 2017 resulted in the first sharp rise in water content, indicating the appearance of a wetting front at the first probe at 0.74 m below the ground surface. This wetting front was marked as an increase in moisture content from 20 % to 46 % at 0.74 m (“A” in Fig. 4). After this response, this probe experienced a reduction in the water content. This could have been caused by drainage, evaporation, and/or water uptake by mature sugarcane (ratoon 2). Sequentially, an increase from 26 % to 42 % was recorded at 1.15 m depth (within 3 h), indicating that the wetting front propagated to that depth.
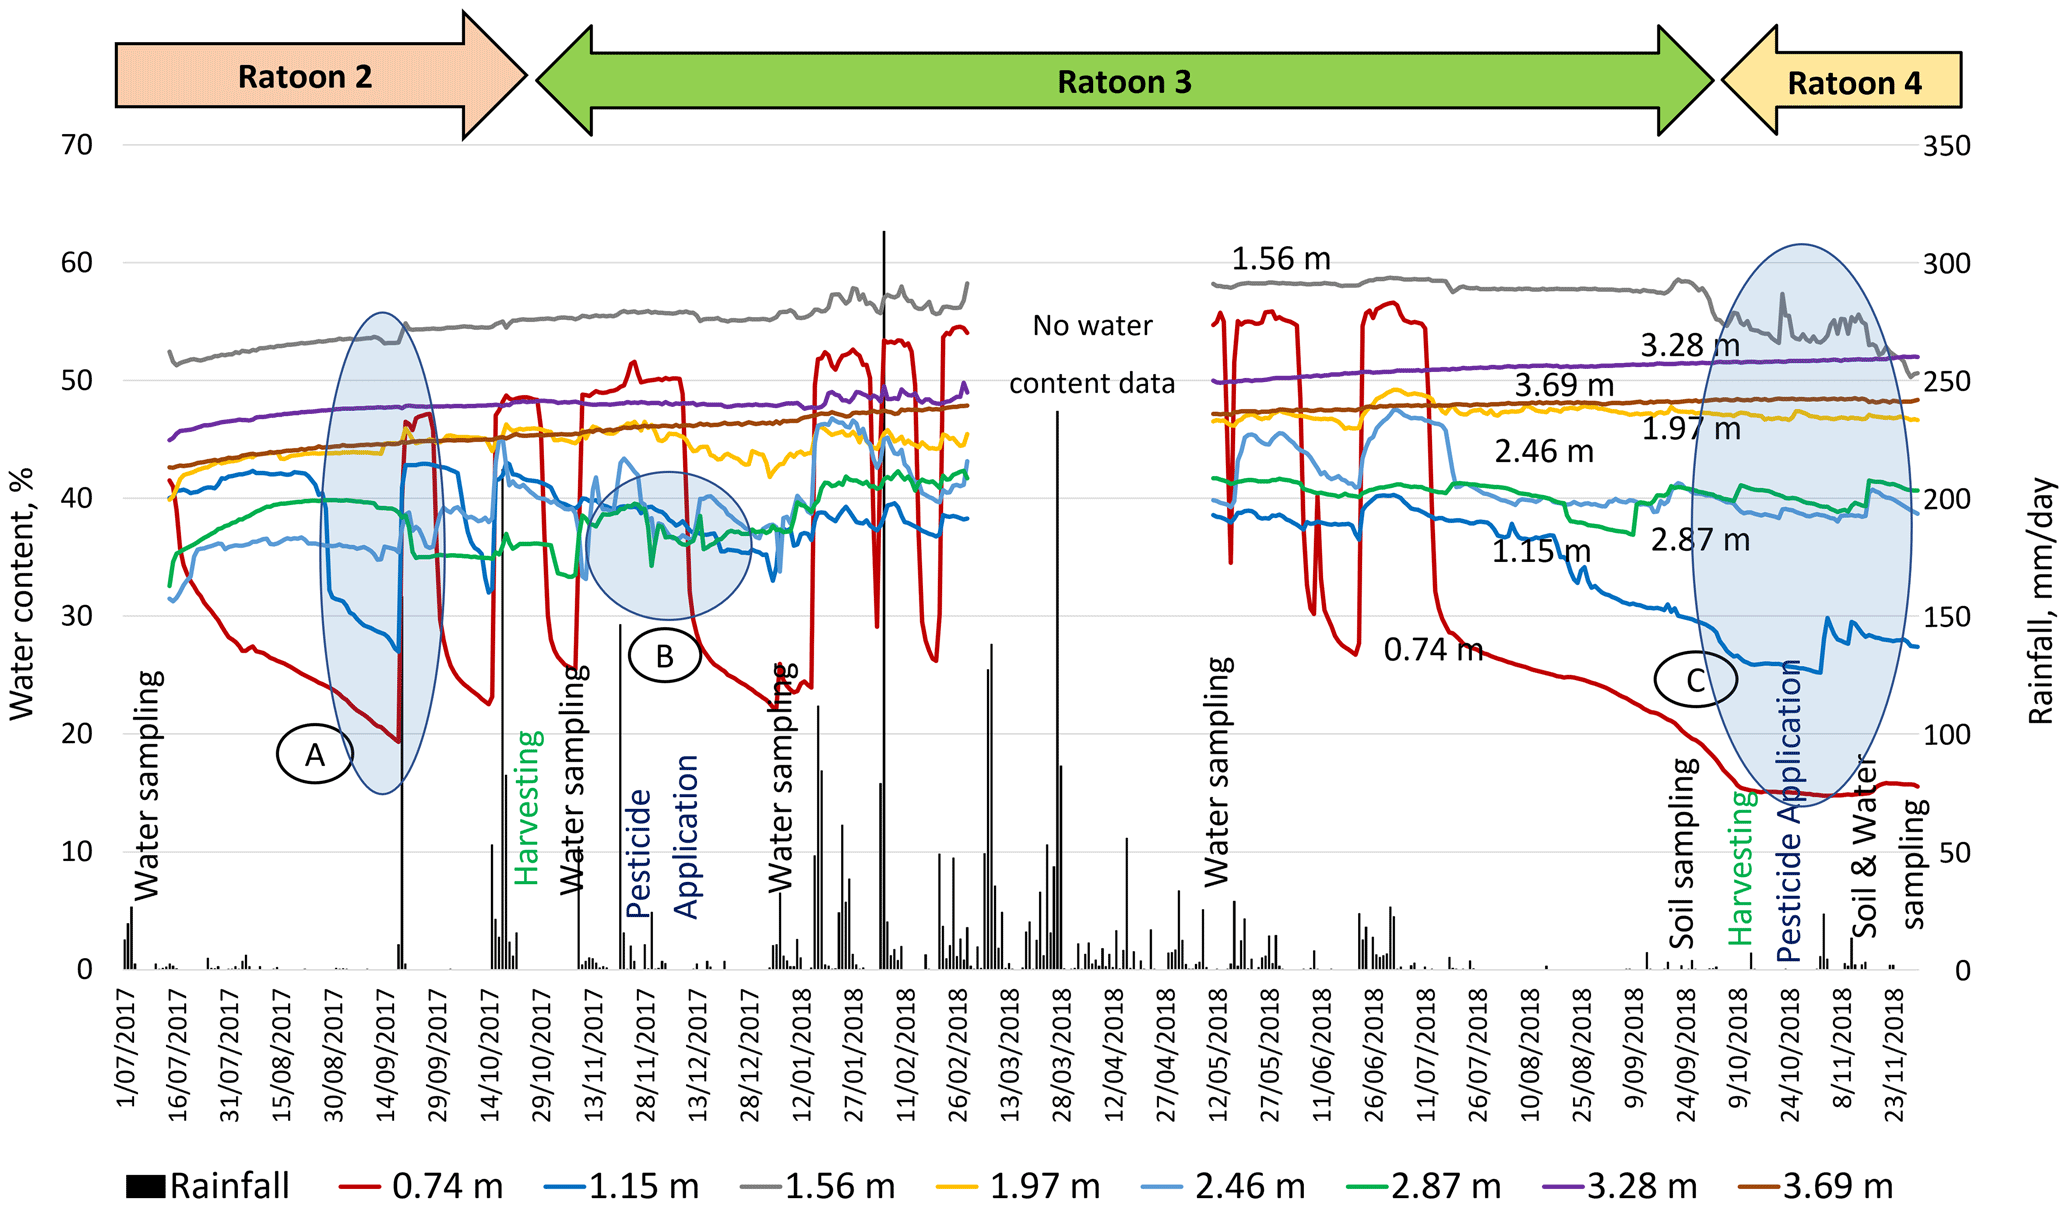
The next two probes, at 1.56 and 1.97 m, exhibited high and stable water content (>50 %), with no significant change over time, indicating stable soil saturation. This could be due to the existence of a seasonal perched water table around 1–2 m depth in the vadose zone (Masters et al., 2017). The responses of these probes also relate to this layer's composition, fine sediment (clay and silt, 76 %). The probes at 2.46 and 2.87 m, situated in the sandy loam layer, showed lower water content than the upper probes (at 1.56 and 1.97 m), but showed large fluctuations over time, indicating unsaturated conditions under the seasonal perched water table (1–2 m depth). As the sandy loam layer has limited water retention properties, it can quickly drain to deeper layers, which was evidenced by a reduction water content over time (“B” in Fig. 4). As a result of the continuous deep drainage from the unsaturated layers, water content was consistently high (∼50 %) at the two deepest probes (3.28 and 3.69 m), suggesting their permanent saturation. The underlying loam layer (with 23 % clay content at 3.80–4.00 m depth; Fig. 2) serves as hydrological barrier, reducing further downward water percolation. Therefore, the two probes at 3.28 and 3.69 m recorded high water content, implying their location within a deeper perched layer. Indications of a perched water table (3–4 m depth) were obtained while drilling bore RN 183021 at the monitoring site, near the VMS site.
During the dry period (July–November 2018), all eight FTDR probes across the vadose zone (“C” in Fig. 4) gradually responded with a declining trend in water content. The upper two probes showed a reduction in water content from saturation to 15 % at 0.74 m and 25 % at 1.15 m depth. During the dry period, mature sugarcane can access a significant amount of water from the seasonal water table (within 1.5 m depth; Hurst et al., 2004), significantly reducing the water content in the upper soil layers. Following this recession at 0.74 and 1.15 m, the water content at probe at 1.56 m depth dropped from saturation to ∼50 % for the first time. The declines in water content in the upper layers also aided in a gradual rise (∼2 %–3 %) in the water content at the two deepest probes (3.28 and 3.69 m).
3.1.2 Groundwater level
Both bores (RN 183021 and RN 183022) showed a substantial fluctuation in GWL in response to the rainfall at the site during November 2017–December 2019 (Fig. 5). The GWL trends showed shallower depths for bore RN 183021 (<2 m depth and even above ground) and 2 to 3.80 m depth from the surface for bore RN 183022 during the monitoring period. Yet, aquifer material (medium-to-coarse sand layer) of both bores is encountered at the depth of 9–11 m. The shallower GWL depth (<4 m or even above the ground) could be due to the semi-confined nature of the aquifer at 9–11 m and regular degree of saturation of the dense clay-rich layers at the site (Fig. 3).
There was a discrete difference in the GWL trends between bores RN 183021 and RN 183022. They are approximately 265 m apart but showed a 2 m difference in GWL. A previous study by Masters et al. (2017) showed ∼1–2 m elevation difference based on an elevation model at the site. This topographic deviation could be the reason for the deviation in GWL trends. There was a distinct variation in GWL trends between wet/rainy (December–April) and dry periods (September–November). At the beginning of ratoon 3, the GWL was close to surface for bore RN 183021 and within 2 m depth for bore RN 183022. Quick responses in GWL were observed with a significant rainfall event. For example, a light rainfall event (52.2 mm d−1) on 9 November 2017 and a moderate rainfall event (146 mm d−1) on 22 November 2017 resulted in peaked GWL values for both bores (Fig. 5). When flooding was observed at the monitoring site in March 2018, groundwater was observed to overflow, at the top of the bore casing, for RN 183021 and become close to the surface for RN 183022. The groundwater responses at this site support the infiltration data (Fig. 4), which shows the movement of wetting fronts throughout the entire vadose zone, passing through perching layers. The rapid responses observed for groundwater at this site provide evidence of the close connection between the surface and underlying groundwater.
3.2 Pesticide transport through the vadose zone
In the present study, during 2017–2019, seven commonly used non-PS II herbicides namely imidacloprid, imazapic, metolachlor, fluroxypyr, isoxaflutole, glyphosate, and haloxyfop (Table 5) were analysed in the soil samples (to 50 cm) and in vadose water sampled through the vadose zone (1.15 to 4 m depth). Fluroxypyr (51 d half-life) and isoxaflutole (1.3 d half-life) exhibited substantial migration through the unsaturated zone after their application. Two non-persistent herbicides, namely metolachlor (21 d half-life) and glyphosate (15 d half-life), were not found in the soil or across the vadose zone. Haloxyfop, a moderately persistent (55 d half-life) pesticide, was reported above the detection limit for soil samples to 50 cm depth just after application in 2019 but was not found throughout the vadose zone. The persistent imazapic (187 d half-life) applied in 2014 was not identified in the soil or across the vadose zone during the study period. However, among the detected pesticides, the persistent imidacloprid (187 d half-life) was not used at the site since 2013 but found in soil samples and in the vadose water samples (Table 2). At the last sampling period (December 2019), none of the seven pesticides were detected through the vadose zone, indicating their transport beyond the vadose zone or ultimate degradation across the vadose zone.
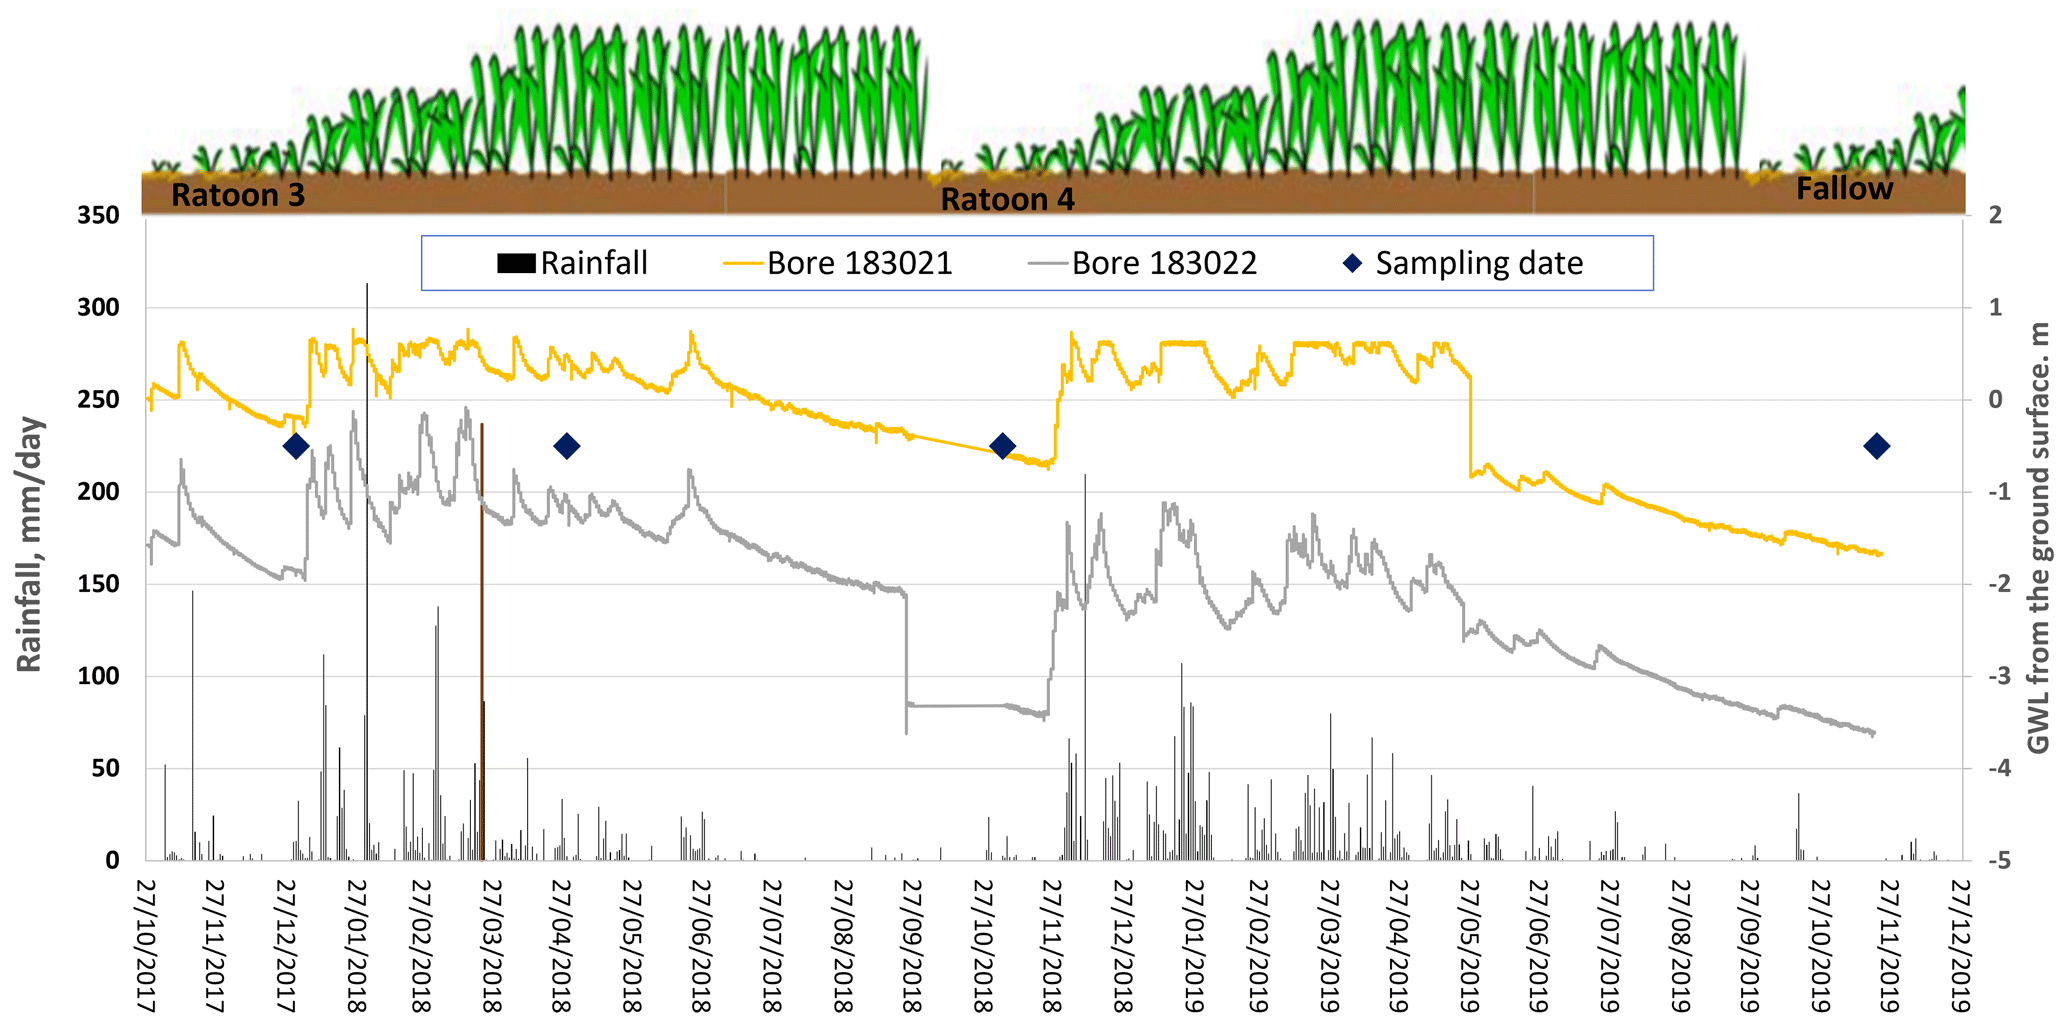
Figure 5Groundwater level of bores RN 183021 and RN 183022 with respect to local rainfall (measured from the ground surface).
3.2.1 Fluroxypyr
Fluroxypyr was transported beneath the sugarcane root zone, immediately after its application, and the decreasing trend of its concentration over time indicated its ultimate degradation within the vadose zone (Fig. 6). It was also below the detection limit through the soil, from 0 to 55 cm depth (Tables S8 and S9). Previous studies detected small active ingredient (a.i.) residual loads of fluroxypyr with 0.03 kg a.i. ha−1 at 30 cm soil depth (van Zwieten et al., 2016). Due to its natural decay, moderately persistent fluroxypyr (51 d half-life) was not expected to be detected in any vadose water sampled in November 2017.
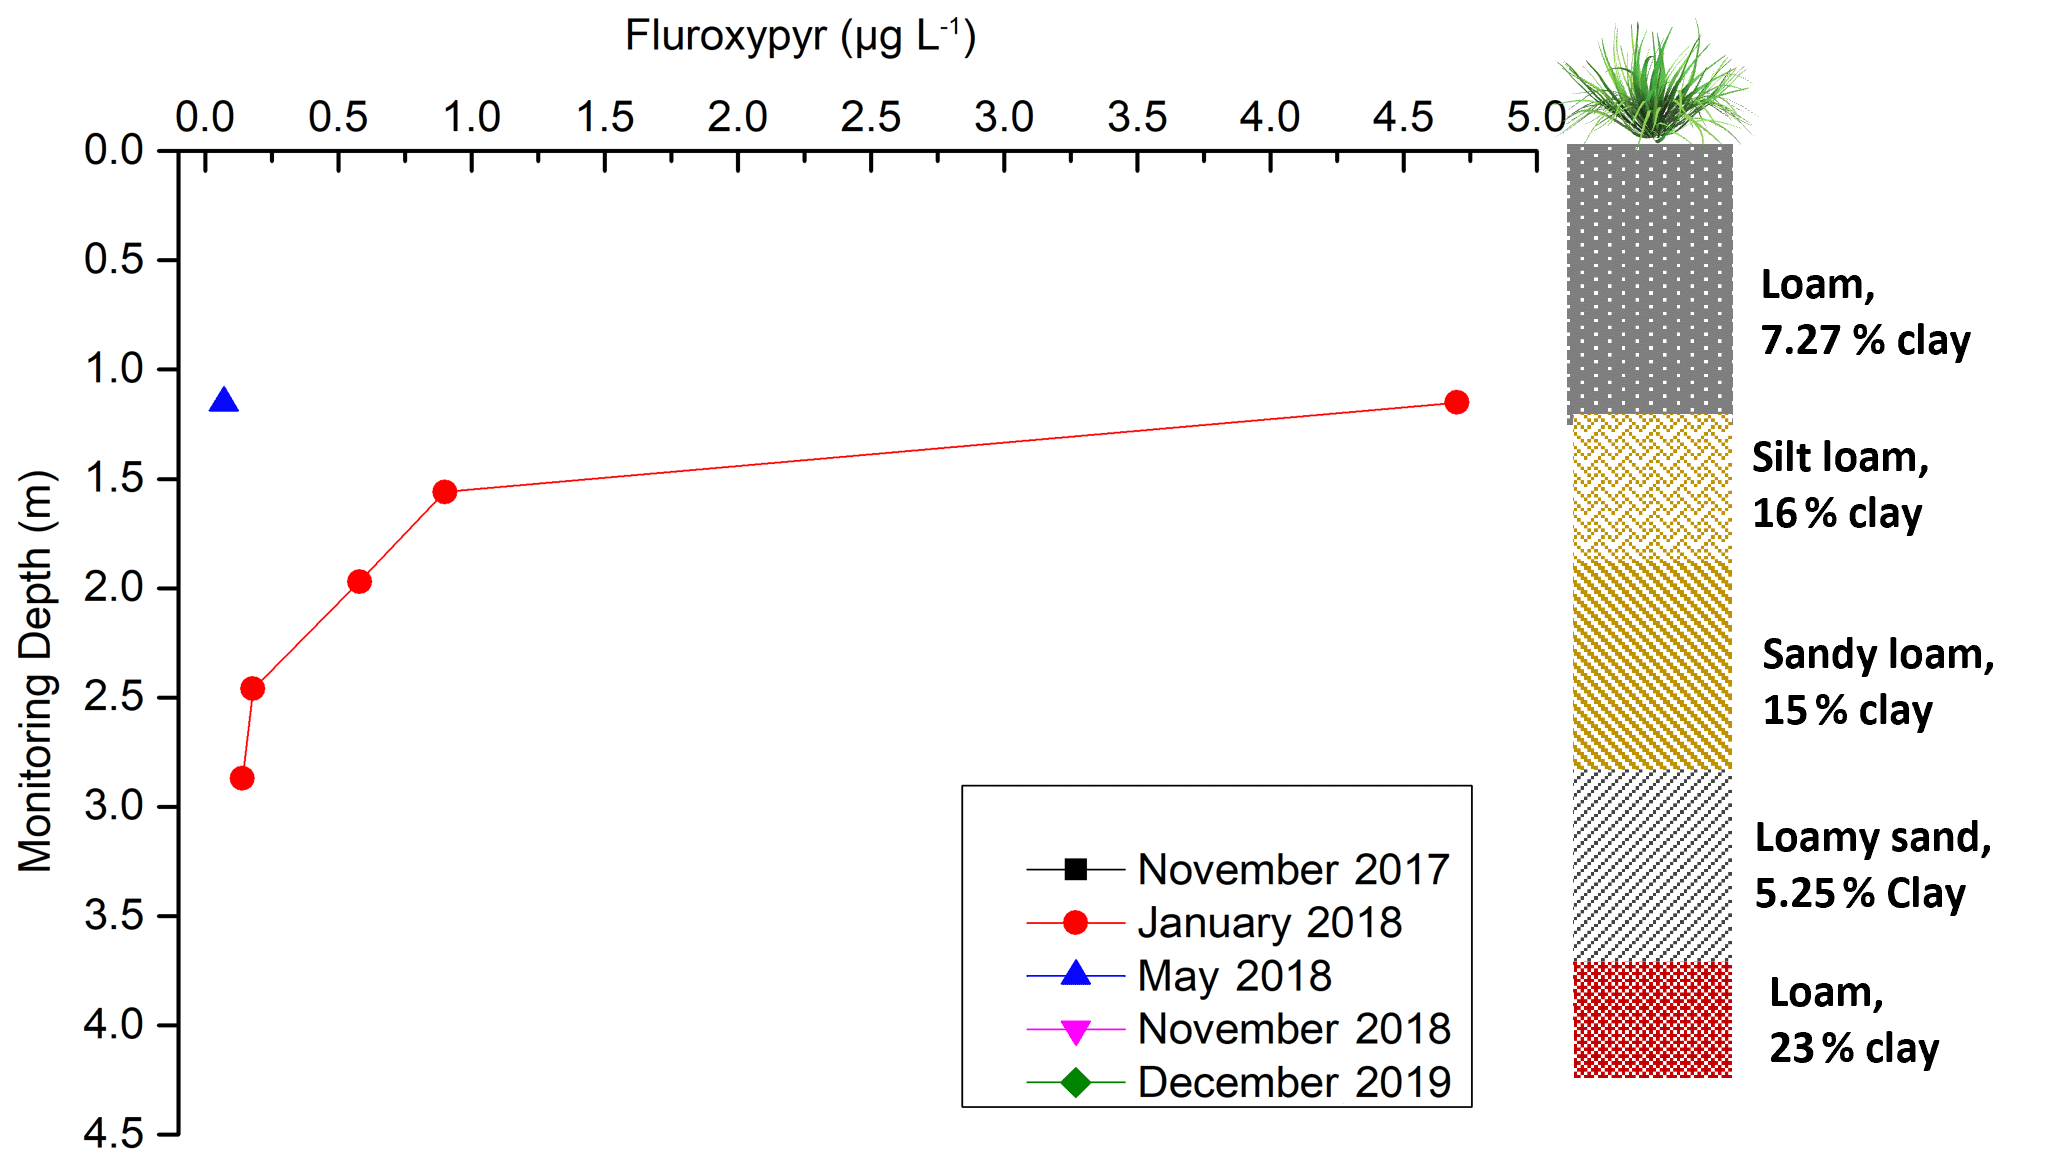
Figure 6Fluroxypyr concentration over time and depth (November 2017, November 2018, and December 2019 were not shown in the figure as the results were below the detection limit).
Fluroxypyr was applied once at the site in December 2017 (Table 2). Subsequent sampling in January 2018 showed the detection of fluroxypyr at the ports ranging from 1.15 to 2.87 m, but not at the deeper VSPs (Fig. 6). Following volatilization and root uptake, fluroxypyr was transported below the root zone, up to 2.87 m depth from the surface within 24 d of application. These observations indicate the transport of fluroxypyr to a depth of at least 2.87 m below the soil surface (Fig. 6). These results provide complementary evidence that water is draining vertically downwards below the seasonal water table (perched layer) and through the entire vadose zone.
During the January 2018 sampling, fluroxypyr was observed at a concentration of 4.70 µg L−1 at the upper port of 1.15 m depth, 1 month after its application (Fig. 6). The concentration levels were exceeding the detection limit (0.10 µg L−1), following a sharp decreasing trend with depth, at the ports of 1.56, 1.96, 2.46, and 2.87 m depth. Beyond 2.87 m from the surface, it was below the detection limit (Fig. 6). The decreasing trend could be due to the loam-rich layers within the soil profile at 0–55 cm, which could slow down pesticide transport through the vadose zone and enable transformation of fluroxypyr into its metabolites (Tao and Yang, 2011). This rapid degradation could cause the absence of fluroxypyr and its metabolites in the deepest VSPs (3.69 or 4 m in depth) during the monitoring period. In addition, when the soil was saturated, the lateral flow occurred before vertical leaching, below 1–2 m depth, could take place (Masters, et al., 2017). This could be another potential reason for the sharp decline of concentration below 1.15 m depth.
Fluroxypyr was detected only in the topmost port (1.15 m in depth) in samples collected May 2018 (Fig. 6). As fluroxypyr and its metabolites were not found in the vadose water, it is likely that fluroxypyr and its metabolites had completely metabolized by May 2018. Additionally, from January to April 2018, high water content (>40 %) through the vadose zone (Fig. 4) and the partial flood event in March 2018 at the monitoring site (Masters et al., 2017) could have also contributed to a quicker degradation of fluroxypyr within this period (Tao and Yang, 2011). Therefore, there is limited potential for the fluroxypyr to have reached regional groundwater through direct vertical transport through the vadose zone. This is also supported by the lack of fluroxypyr detection within the vadose zone water sampled in November 2018 and in December 2019. Residues of fluroxypyr and its metabolites were also no longer detected in the soil profile during November 2018–December 2019 (Tables S8 and S9).
3.2.2 Imidacloprid
During the monitoring period 2017–2019, persistent imidacloprid (187 d half-life) was found in the vadose water samples (Fig. 7) four times (Tables S2–S6) from 1.15 to 4 m depth. Although imidacloprid was not applied at the monitoring site, its transport and concentration beneath the sugarcane root zone varied with depth over time. It was possibly being released from residues present in the upper soil layers or transported imidacloprid from the neighbouring sugarcane fields. During September–November 2017, there were several medium-to-very-high rainfall events which resulted in infiltration (Fig. 4). This could have contributed to imidacloprid leaching beyond the root zone and travelling to 4 m depth, as it shows characteristics of high solubility (610 µg L−1) and high leachability (groundwater ubiquity score, GUS, leaching potential index of 3.69; Table A1).
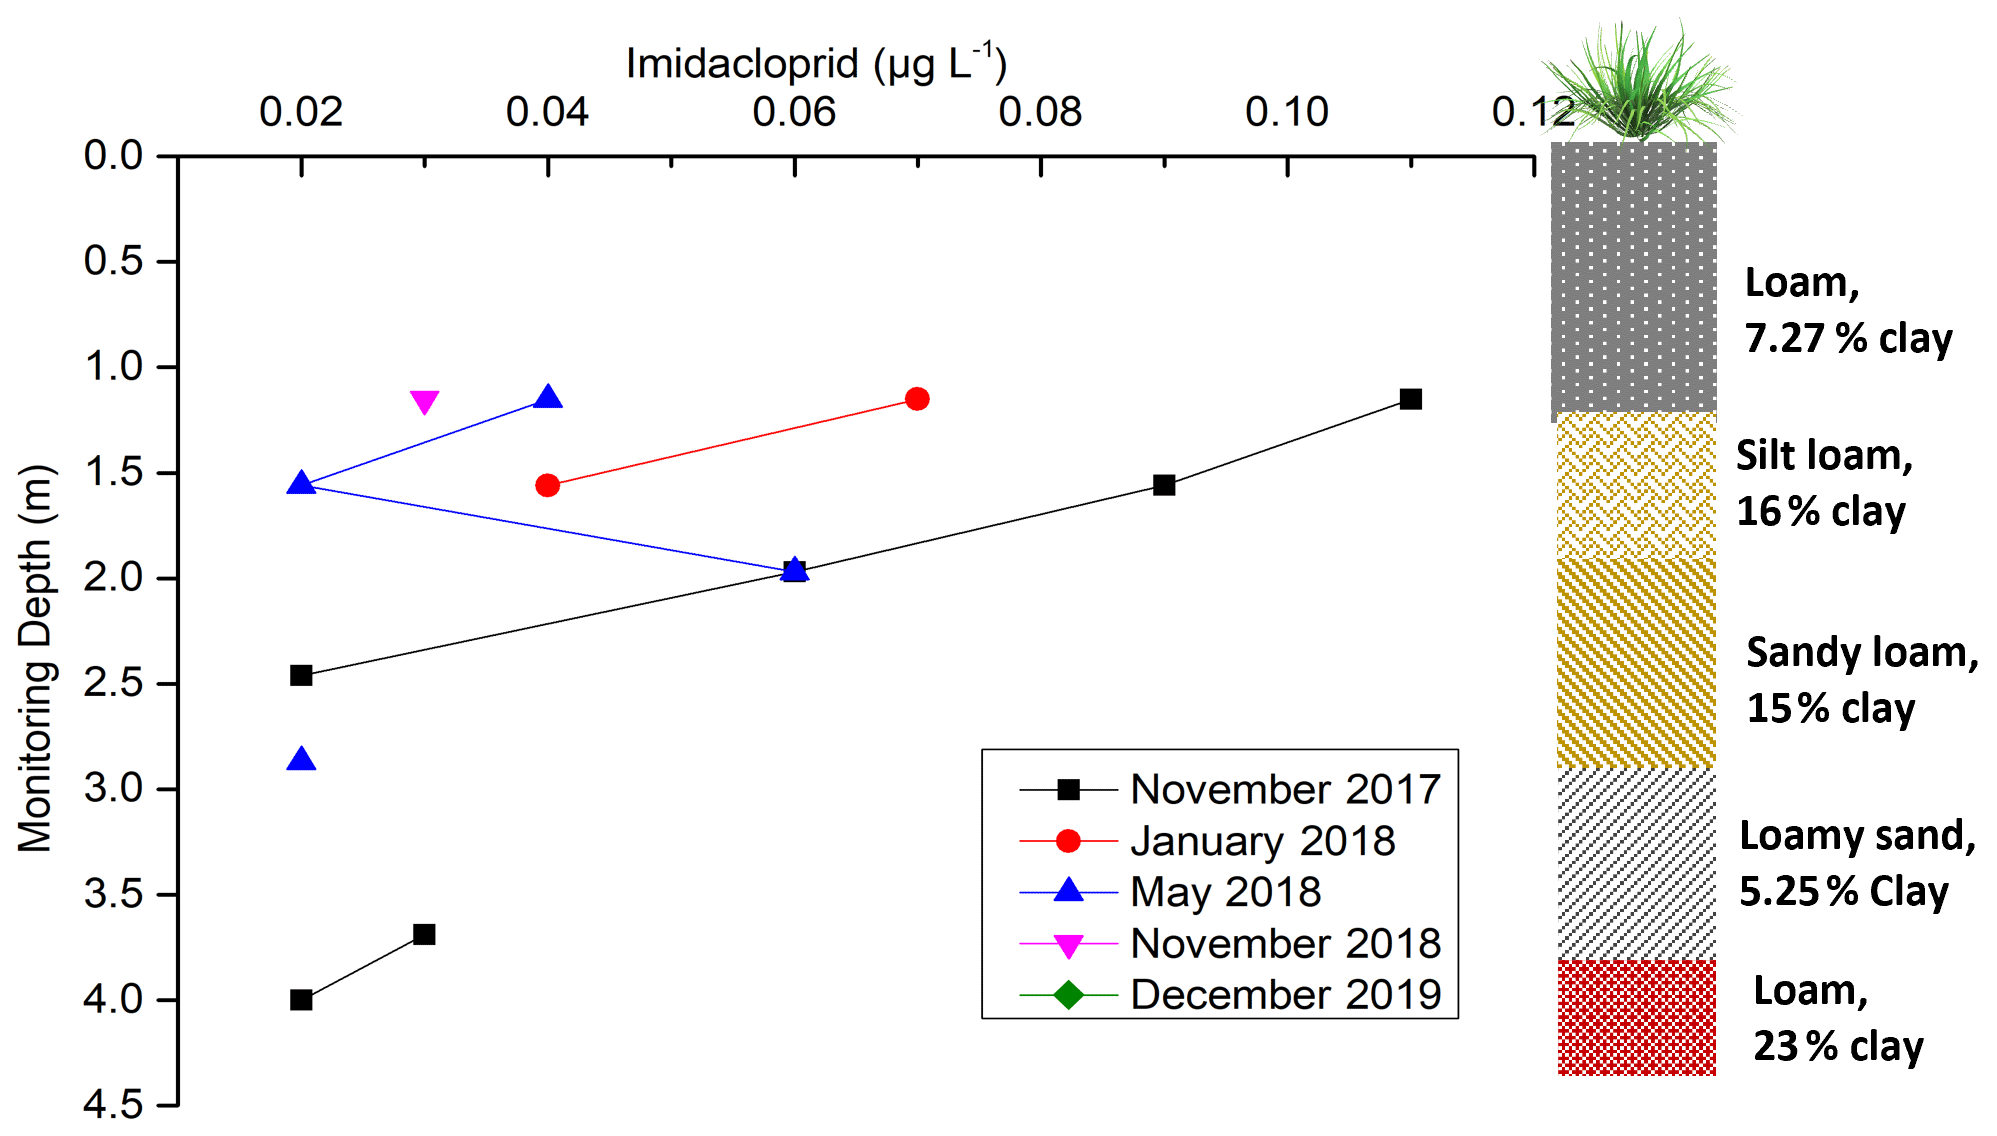
Figure 7Imidacloprid concentration over time and depth (December 2019 was not shown in the figure as the result was below the detection limit).
After November 2017, imidacloprid was detected only in the upper vadose zone and not at the end of the vadose zone (3–4 m depth), in the proximity of the perched aquifer. Imidacloprid was found to a depth of 1.56 m in January 2018, 2.96 m in May 2018, and 1.15 m in November 2018 (Fig. 7). There was also a reduction in imidacloprid concentrations observed over time. This lowering concentration could be due to the combination of the dilution by infiltration and lateral transport after consecutive high rainfall events, as drainage water was reported to seep laterally into the neighbouring channels at the site (Masters et al., 2017). Finally, in December 2019, imidacloprid was below the detection limit throughout the vadose zone (Fig. 7). The possible explanation for the lower leaching could be its sorption onto the clay-rich sediments (Oi, 1999) and lower rain events in December 2019 (Fig. 4; Gupta et al., 2002).
Imidacloprid was not detected in soil samples collected in September and November 2018 (Table S8). Interestingly, persistent imidacloprid was found in the upper part of the soil, at 25 and 35 cm depth, at 0.0122 kg a.i. ha−1 (0.004 mg kg−1) and 0.010 kg a.i. ha−1 (0.010 mg kg−1) respectively in November 2019 (Table S9). It was observed only at 25 cm soil depth at 0.0366 kg a.i. ha−1 (0.012 mg kg−1) in December 2019. The concentration of imidacloprid at upper part of soil may indicate a source within a neighbouring sugarcane field. This imidacloprid had not yet travelled into the vadose zone until 1.15 m depth or beyond as it was not detected in vadose water sampled in November and December 2019 (Fig. 7).
3.2.3 Isoxaflutole
Isoxaflutole, applied annually during 2015 to 2018, was not found through the entire depth of the vadose zone during the five sampling periods (Fig. 8). As it is quickly transferred into a diketonitrile derivative (DKN) in soils (Mougin et al., 2000), it can be undetectable immediately after application. The diketonitrile derivative, an active pesticide with a longer half-life and higher water solubility than its parent pesticide, undergoes rapid conversion into the inert benzoic acid analogue (Mitra et al., 2000; Mougin et al., 2000). It has also been reported to bind firmly to soils with higher organic matter content and a large portion is retained in soil, resulting in lower leaching potential for DKN (Mitra et al., 2000). Yet, it was not found in the 0–55 cm depth soil profile (Tables S8 and S9), despite the high organic material content (5.7 %; Masters et al., 2017). The fact that no isoxaflutole was identified in the soil profile at this site is not surprising as this pesticide is generally not found below 6 cm soil depth (EPA, 1998).
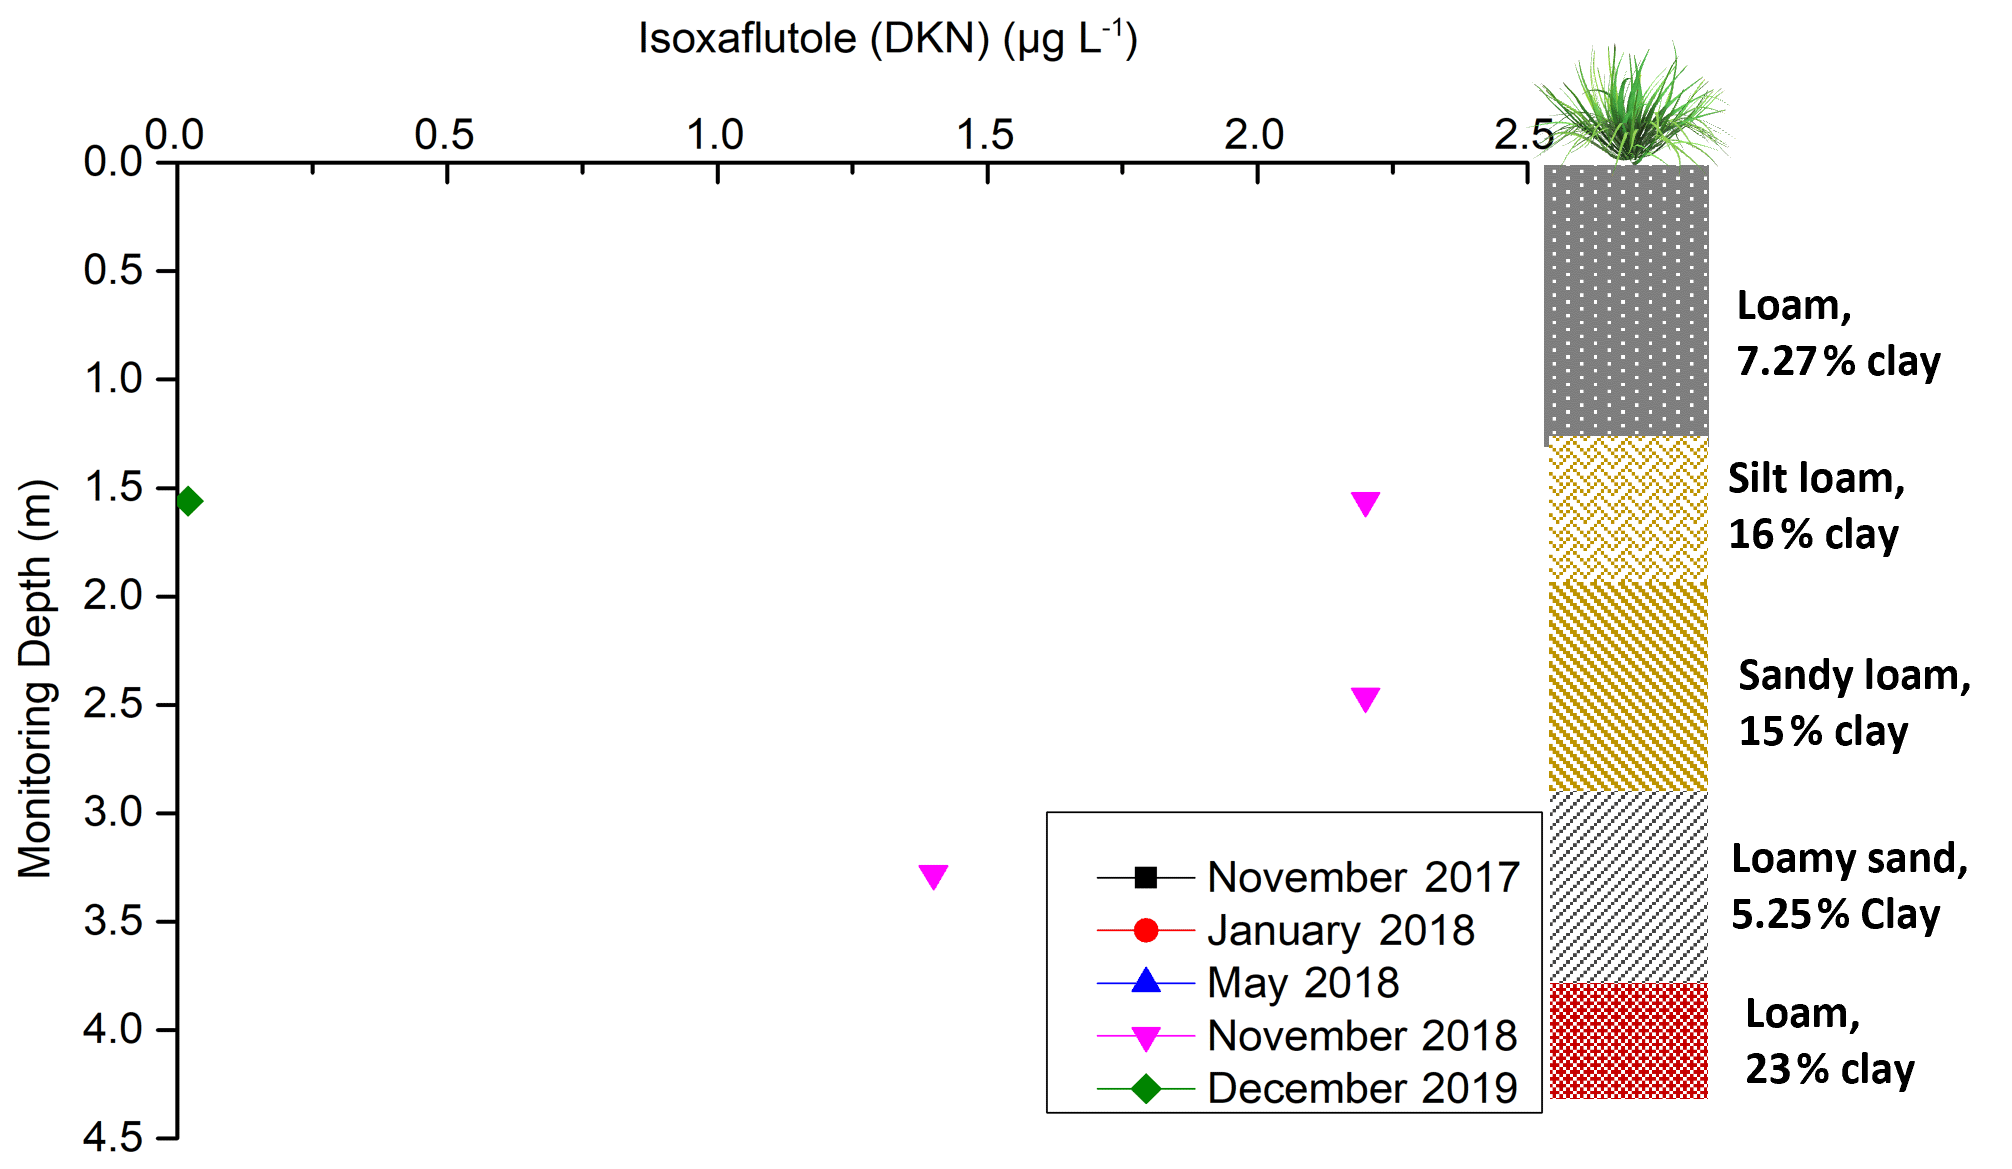
Figure 8Isoxaflutole concentration over time and depth (November 2017, January 2018, and May 2018 were not shown in the figure as the results were below the detection limit).
The concentration of isoxaflutole metabolite (DKN) and its inactive benzoic acid derivative were below the detection limit at all depths sampled in November 2017 before it was applied in December 2017. As isoxaflutole has short half-life (1.3 d), it was not found in samples collected in January 2018 and May 2018. The scenario was different for samples collected on November 2018 (1 month after isoxaflutole application) as DKN was found in the middle of the vadose zone (1.56–3.28 m depth). The concentration was 2.2 µg L−1 at the depths of 1.56 and 2.46 m and 1.4 µg L−1 at 3.28 m depth. The concentrations decreased with depth but were higher than the ecotoxicity limit (0.46 µg L−1). It is worth noting that isoxaflutole was not detected at the two ports at 1.97 and 2.87 m depth, despite their proximity. This could be due to lateral heterogeneity. After harvesting the final ratoon in 2019, isoxaflutole was just above detection limit only at 1.56 m depth, even though it had not been applied. This indicates that isoxaflutole can be transported across the unsaturated zone and may possibly also reach groundwater. Yet, its high degradation rate makes it unlikely that it will be transported into groundwater.
3.2.4 Haloxyfop
Haloxyfop, a moderately persistent (55 d half-life) pesticide, was found to be below the detection limit for soil samples in 2018 (Table S8), but it was reported above the detection limit just after application in 2019 (Tables 3 and S9). The GUS leaching potential index score for haloxyfop is 3.70 (high leachability), indicating higher likelihood of transport through the soil (Database, 2021; Gustafson, 1989). The concentration of haloxyfop at the depths of 25, 35, and 50 cm were 0.012 kg a.i. ha−1 (0.004 mg kg−1), 0.043 kg a.i. ha−1 (0.01 mg kg−1), and 0.012 kg a.i. ha−1 (0.002 mg kg−1) respectively (Table S9). These results indicate the transport of haloxyfop to at least 50 cm soil depth. They also indicate the potential for haloxyfop to travel beyond this depth, through the vadose zone. But it was found below the detection limit throughout the vadose zone (Tables S2–S6). This indicates that it did not reach 1.15 m depth in short time (2 weeks). The transport of haloxyfop could be reduced due to lack of infiltrating rainfall and subsequent low water content across the vadose zone in this period (Fig. 4).
3.3 Pesticide concentration in groundwater
Only two pesticides were found in three of the six bores in the South Johnstone River sub-basin in July 2017. Imidacloprid was detected in bores RN 11210032 and RN 11210051 at concentrations of 0.6 and 0.08 µg L−1 respectively (Table A1). The observed imidacloprid concentration (0.6 µg L−1) in bore RN 11210032 exceeded the aquatic ecosystem protection guideline value (0.11 µg L−1; Table 5) for protection of 95 % of species for the GBR (King et al., 2017a, b; Smith, 2018). Previous studies also detected imidacloprid in South Johnstone River sub-basin surface waters (0.06 µg L−1; Smith et al., 2012) and in bores within the Johnstone catchment (1.15 µg L−1; Masters et al., 2014). Though imazapic was not previously detected in any surface water or groundwater in the South Johnstone catchment (Masters et al., 2014; Smith et al., 2012), it was detected in bore RN 11210056. Its concentration, 0.70 µg L−1, was greater than the ecotoxicity value, 0.41 µg L−1 (Table 5). Other herbicides namely metolachlor, fluroxypyr, isoxaflutole, glyphosate, and haloxyfop were all below the detection limits in the six groundwater monitoring bores tested. None of these pesticides have previously been found in surface water studies in the basin (Smith et al., 2012) or in bores with in the Johnstone catchment (Masters et al., 2014). The lack of detection of these pesticides in surface and groundwater most likely relates to their limited use in recent decades combined with their natural degradation.
Overall, the results of monitoring the two site bores (RN 183021 and RN 183022, collected five times, at the same time as vadose water sampling through VSP) were below the detection limits for all seven pesticides tested in this study. Significantly, isoxaflutole, applied annually, was expected to be present in the soil and in the vadose zone and as potentially having leached into the groundwater. It has previously been reported that the annual pesticide mass leached below the root zone could range between <0.1 and 1 % (sometimes higher, up to 4 %; Flury, 1996). The lack of isoxaflutole and its metabolites in the soil sample and declining concentration in the pore water with depth and time highlight limited transport through the vadose zone. This could be due to the low application dose of 150 g ha−1 isoxaflutole in the field trial. Additionally, the amount of isoxaflutole percolated below the root zone after plant consumption could have degraded into the soil before reaching the groundwater. This is supported by its absence in the monitoring bores at the site.
The infiltration process is exemplified by the soil moisture content in the shallow soil profile, which exhibits a seasonal perched water table at 1.56 and 1.97 m depth (Fig. 4). Under this perched layer, unsaturated conditions occurred at depths of 2.46 and 2.87 m. Frequent monitoring of regularly applied pesticides supported interpretation of the hydrological characteristics through the vadose zone. This was evidenced by the concentration levels of fluroxypyr exceeding the detection limit (0.10 µg L−1) and followed a sharp decreasing trend with depth, from 1.15 to 2.87 m (Fig. 6). The decreasing trend could be due to the combination of reduced fluroxypyr transport by the clay layer, transformation of fluroxypyr into its metabolites by carbon content (Tao and Yang, 2011), drainage by lateral flow up to 1–2 m depth at the site (Masters et al., 2017), or dilution because of the high water content in the perched layer.
Fluroxypyr was not identified in the deepest part of the vadose zone (3.6 or 4 m in depth) where a perched aquifer layer exists. This observation supports the regulating and partitioning behaviour of the red coarse mottled structured loam layer (with 23 % clay) at 3.80–4 m depth. This layer could affect rainwater infiltration and pesticide migration into the more permeable aquifer material at ∼9 m (groundwater). However, the values of the non-PS II herbicides were below the detection limit in groundwater, indicating less potential of leaching into the groundwater.
Based on the Pesticide Impact Rating Index (PIRI), imidacloprid and isoxaflutole were predicted to present “low” risk to invertebrates and metolachlor “high” risk to invertebrates (Davis et al., 2014). In this study, imazapic and metolachlor, last applied in 2014 at the site, were not identified in the soil profile or across the vadose zone, and imidacloprid was below the detection limit throughout the vadose zone at the end of sampling. As this study found that those non-PS II herbicides (imidacloprid, isoxaflutole, and metolachlor) were attenuated within the soil profile within the study period (about 3 years), this study substantiates the switch from PS II herbicides to non-PS II herbicides. Our data also support substitution for other herbicides (fluroxypyr and haloxyfop, which were projected to present “medium” risk profiles; Davis et al., 2014). The detection of glyphosate used at the study site in 2013–2014 and 2019 also support its substitution – it was predicted to present a “high” risk to invertebrates (Davis et al., 2014).
This study, focussing on seven non-PS II herbicides in the Wet Tropics, has provided increased knowledge of the fate, existence, and transport of these pesticides across the vadose zone. As the concentration of regularly applied pesticides in the vadose zone reduces quickly following pesticide application, a shift of product choice to alternative/other non-PS II herbicides instead of PS II herbicides could be advisable also in other tropical regions with agricultural activities. This study describes improved characterization of pesticide movement dynamics (immediately after application) under a sugarcane field. This allows for a better understanding of the agrochemical impact of sugarcane farming on the groundwater environment in the tropics. Only two pesticides (imidacloprid and imazapic) were detected in three of the six bores sampled once in the South Johnstone River sub-basin, but these pesticides were not detected in the bores on the monitoring site. As there was no record of detecting these two pesticides at the end of the monitoring period, it is assumed that these ultimately degraded in the groundwater to concentrations below current detection limits. However, based on the data at one site, the study was not able to explore potential contamination at a regional groundwater scale.
Rainwater percolation through the soil and unsaturated zone resulted in pesticide transport to deeper components of the vadose zone and into groundwater, but the extent of this transport beyond the sugarcane root zone was attributed to rainfall events following pesticide application. Fluroxypyr and haloxyfop are both moderately persistent with high leachability (GUI, >2.80). Fluroxypyr application followed by several rainfall events showed substantial migration to a depth of at least 2.87 m below the soil surface but haloxyfop did not, as the lack of rainfall and subsequent low water content through the vadose zone may have reduced its transport beyond the root zone. However, two non-persistent herbicides, namely isoxaflutole and glyphosate (with low leachability, GUI, <1.80), are unlikely to have reached the vadose zone. The persistent imazapic, applied in 2014, was not expected to be detected in the soil or across the vadose zone during the study period. However, among the detected herbicides, the persistent imidacloprid, despite not being utilized at the site since 2013, was found in the soil and in the vadose water. None of the seven pesticides were identified within the vadose zone in the last sampling period (December 2019). Based on the data, this present study revealed the transport of non-PS II pesticides beyond the crop root zone, but these pesticides were no longer detectable during the last sampling period. Their disappearance is due to either transformation into metabolites through the thick carbon-rich clay layer within the soil profile or dilution within the perched layer, thereby indicating their limited ability to reach groundwater. The findings of this case study support the substitution of PS II herbicides with non-PS II pesticides (at least seven of all other pesticides). However, some non-PS II pesticides, for example, persistent imidacloprid and imazapic, were found at concentrations higher than the ecotoxicity threshold level in the regional aquifer groundwater samples, indicating that at some locations and with some products, contamination of the groundwater is occurring.
Table A1Pesticides applied at the block and their properties.
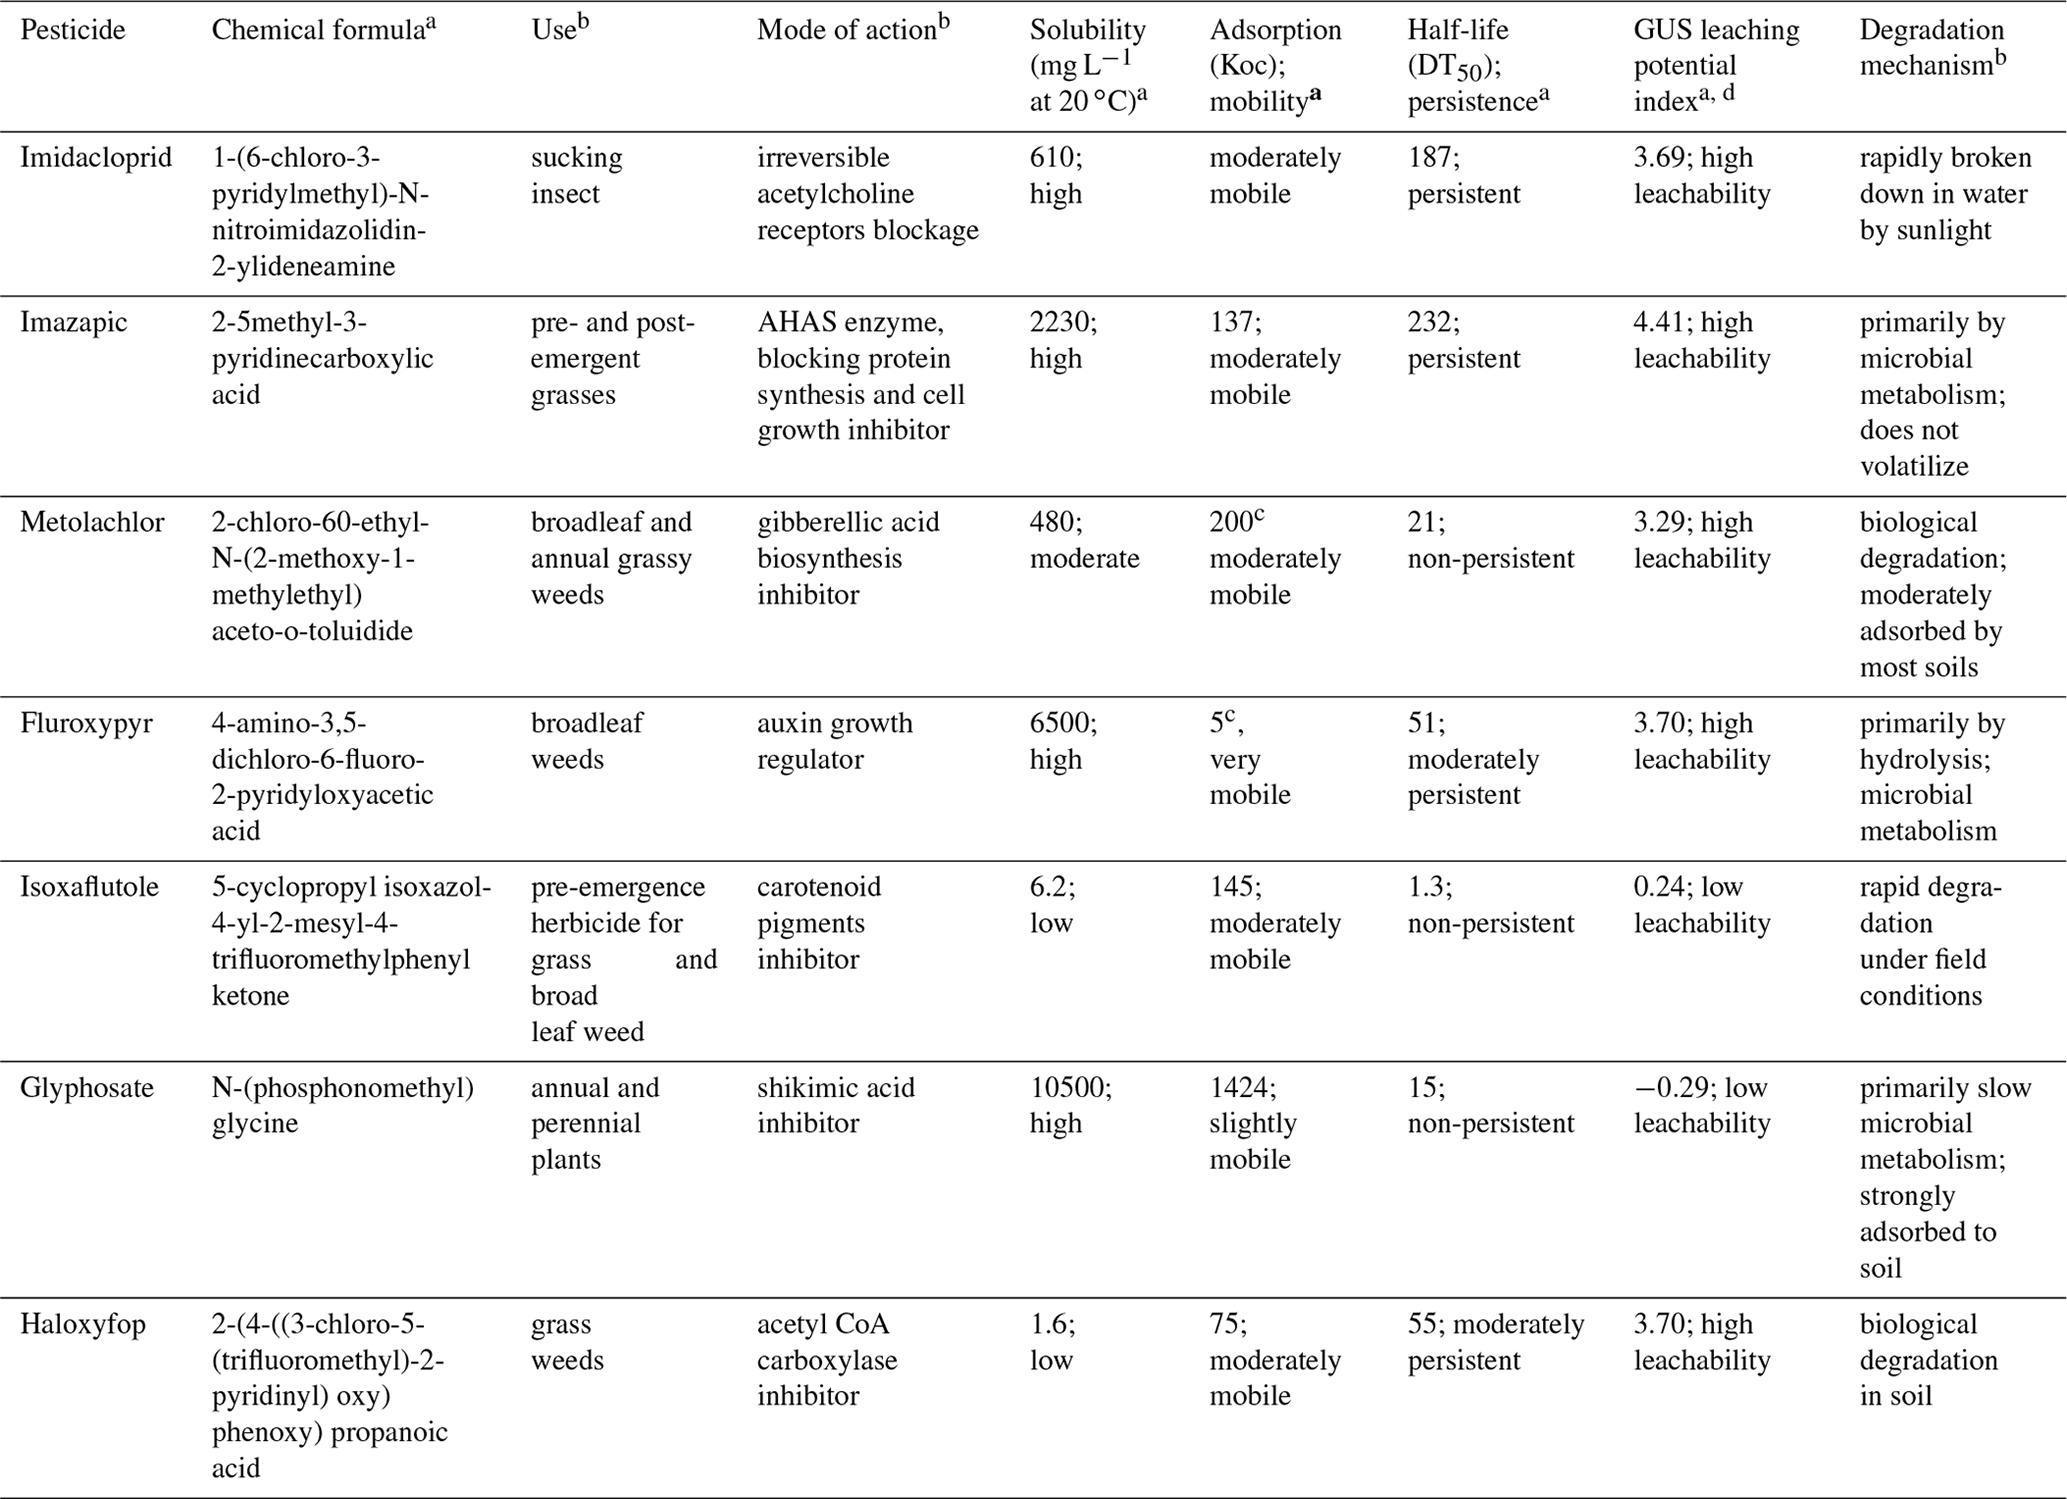
a Database (2021), b Tu et al. (2001); c Senseman (2007); d GUS values lower than 1.8 and higher than 2.8
indicate respectively non-leaching and leaching pesticide compounds; for GUS
values
between 1.8 and 2.8, the pesticide is considered to be in a transition zone
(Gustafson, 1989).
Table A2Method details for determining pesticides in water by direct injection using LC-MS/MS and a Q Exactive Orbitrap.
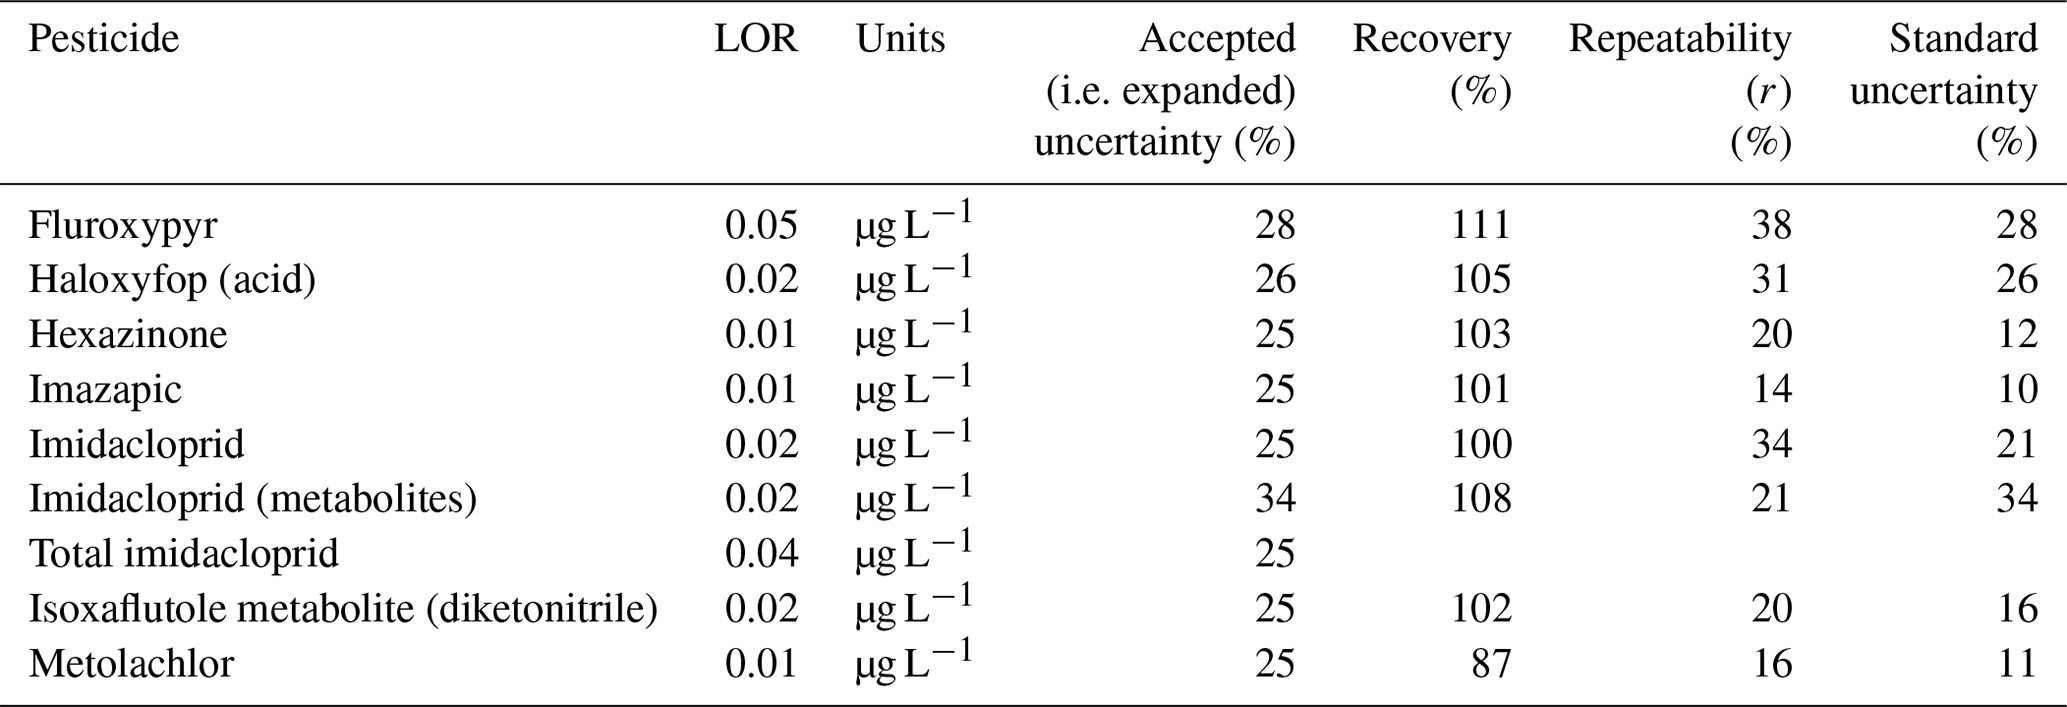
Table A3Method details for determining pesticides in soil and sediment by LC-MS/MS and LC-HRAM-Orbitrap.
To access the raw data, contact with the corresponding author.
The supplement related to this article is available online at: https://doi.org/10.5194/soil-9-381-2023-supplement.
LR formulated the research questions, directed the research, and edited the manuscript. OD assembled and inaugurated the vadose zone monitoring system at the monitoring site. RK collected and analysed the data extensively and prepared the draft of the manuscript. LD, OD, and GO reviewed and edited. RK finalized the manuscript for submission and production.
The contact author has declared that none of the authors has any competing interests.
Publisher’s note: Copernicus Publications remains neutral with regard to jurisdictional claims in published maps and institutional affiliations.
The authors would like to convey their gratitude to Jim Stanley and Jim Yaxley, Queensland University of Technology and Star Drilling, Thomastown, for assembling and inaugurated the monitoring system at the monitoring site. We thank Christian Brunk from the Queensland University of Technology and Daniel Roebuck from Campbell Scientific Australia for their technical assistance in operating the experimental setups. We thank the Centre for Wet Tropics Agriculture, South Johnstone. Further thanks are due to the dedicated Paddock-to-Reef project, Silkwood team, for their concerted support by sharing information and project outputs and in assisting with field work. We thank MSF Sugar Pty Ltd for providing entry to their land and crop–pest management records. Gratitude is also expressed for the extensive laboratory analysis provided by Queensland Health, Coopers Plains.
The funding for this project was provided by the Department of Regional Development, Manufacturing and Water, Australia, and the Queensland University of Technology.
This paper was edited by Raúl Zornoza and reviewed by two anonymous referees.
Adeoye, P. A., Abubakar, S. K., Adeolu, A. R., El-Mohsen, A. A. A., Sabbour, M., Farhadi, A., Hamidi, R., and Pirasteh-Anosheh, H.: Effect of agrochemicals on groundwater quality: A review, Sci. Agr., 1, 1–7, 2013.
Aharoni, I., Siebner, H., and Dahan, O.: Application of vadose-zone monitoring system for real-time characterization of leachate percolation in and under a municipal landfill, Waste Manage., 67, 203–213, https://doi.org/10.1016/j.wasman.2017.05.012, 2017.
Armour, J. D., Hateley, L. R., and Pitt, G. L.: Catchment modelling of sediment, nitrogen and phosphorus nutrient loads with SedNet/ANNEX in the Tully-Murray basin, Mar. Freshw. Res., 60, 1091–1096, https://doi.org/10.1071/Mf08345, 2009.
Arora, T. and Ahmed, S.: Characterization of recharge through complex vadose zone of a granitic aquifer by time-lapse electrical resistivity tomography, J. Appl. Geophys., 73, 35–44, https://doi.org/10.1016/j.jappgeo.2010.11.003, 2011.
Australian Government and Queensland Government: The Reef 2050 Water Quality Improvement Plan 2017–2022, 56 pp., 2018.
Bidwell, V. J.: A formula for predicting advection-dispersion in the vadose zone at uneven drainage intervals, Water Resour. Res., 36, 3077–3080, https://doi.org/10.1029/2000wr900192, 2000.
Brodie, J., Lewis, S., Bainbridge, Z., Mitchell, A., Waterhouse, J., and Kroon, F.: Target setting for pollutant discharge management of rivers in the Great Barrier Reef catchment area, Mar. Freshw. Res., 60, 1141–1149, https://doi.org/10.1071/MF08339, 2009.
Brodie, J., Waterhouse, J., Schaffelke, B., Kroon, F., Thorburn, P., Rolfe, J., Johnson, J., Fabricius, K., Lewis, S., and Devlin, M.: 2013 Scientific Consensus Statement. Land use impacts on Great Barrier Reef water quality and ecosystem condition, 12 pp., 2013.
Brodie, J., Burford, M., Davis, A., da Silva, E., Devlin, M., Furnas, M., Kroon, F., Lewis, S., Lønborg, C., and O'Brien, D.: The relative risks to water quality from particulate nitrogen discharged from rivers to the Great Barrier Reef in comparison to other forms of nitrogen, TropWATER Report 14/31, James Cook University, Townsville, QLD, 98 pp., 2015.
Brodie, J., Baird, M., Waterhouse, J., Warne, M., Skerratt, J., Smith, R., Mann, R., Robillot, C., and Mongin, M.: Development of basin-specific ecologically relevant water quality targets for the Great Barrier Reef, Australian Centre for Tropical Water and Aquatic Ecosystem Research, 98 pp., 2017.
Dahan, O., McDonald, E. V., and Young, M. H.: Flexible time domain reflectometry probe for deep vadose zone monitoring, Vadose Zone J., 2, 270–275, 2003.
Dahan, O., Shani, Y., Enzel, Y., Yechieli, Y., and Yakirevich, A.: Direct measurements of floodwater infiltration into shallow alluvial aquifers, J. Hydrol., 344, 157–170, https://doi.org/10.1016/j.jhydrol.2007.06.033, 2007.
Dahan, O., Tatarsky, B., Enzel, Y., Kulls, C., Seely, M., and Benito, G.: Dynamics of flood water infiltration and ground water recharge in hyperarid desert, Ground Water, 46, 450–461, https://doi.org/10.1111/j.1745-6584.2007.00414.x, 2008.
Dahan, O., Talby, R., Yechieli, Y., Adar, E., Lazarovitch, N., and Enzel, Y.: In situ monitoring of water percolation and solute transport using a vadose zone monitoring system, Vadose Zone J., 8, 916–925, https://doi.org/10.2136/vzj2008.0134, 2009.
Dang, A., Silburn, M., Craig, I., Shaw, M., and Foley, J.: Washoff of residual photosystem II herbicides from sugar cane trash under a rainfall simulator, J. Agric. Food Chem., 64, 3967–3974, https://doi.org/10.1021/acs.jafc.5b04717, 2016.
Database, P. P.: The PPDB: A to Z list of pesticide active ingredients, 2021.
Davis, A. M. and Pradolin, J.: Precision Herbicide Application Technologies To Decrease Herbicide Losses in Furrow Irrigation Outflows in a Northeastern Australian Cropping System, J. Agric. Food Chem., 64, 4021–4028, https://doi.org/10.1021/acs.jafc.5b04987, 2016.
Davis, A. M., Lewis, S. E., Bainbridge, Z. T., Glendenning, L., Turner, R. D. R., and Brodie, J. E.: Dynamics of herbicide transport and partitioning under event flow conditions in the lower Burdekin region, Australia, Mar. Pollut. Bull., 65, 182–193, https://doi.org/10.1016/j.marpolbul.2011.08.025, 2012.
Davis, A. M., Lewis, S. E., Brodie, J. E., and Benson, A.: The potential benefits of herbicide regulation: a cautionary note for the Great Barrier Reef catchment area, Sci. Total Environ., 490, 81–92, https://doi.org/10.1016/j.scitotenv.2014.04.005, 2014.
Devlin, M., Lewis, S., Davis, A., Smith, R., Negri, A., Thompson, M., and Poggio, M.: Advancing our understanding of the source, management, transport and impacts of pesticides on the Great Barrier Reef 2011–2015, A report for the Queensland Department of Environment and Heritage Protection, James Cook University, Cairns, 134, 140 pp., 2015.
Enderlin, N. and Harms, B.: P2Reef monitoring project site: Silkwood (P2REEF 71-2, 74–84 & 112), 2023.
EPA: Pesticide fact sheet: Isoxaflutole, 15 pp., 1998.
Fenton, M., Albers, C., and Ketterings, K.: Soil organic matter Cornell University, 2 pp., 2008.
Flury, M.: Experimental evidence of transport of pesticides through field soils – a review, J. Environ. Qual., 25, 25–45, https://doi.org/10.2134/jeq1996.00472425002500010005x, 1996.
Gallen, C., Thompson, K., Paxman, C., Devlin, M., and Mueller, J.: Marine monitoring program: Annual report for inshore pesticide monitoring 2014–2015, The National Research Centre for Environmental Toxicology (Entox), Brisbane, QLD, ISBN 9781742721668, 140 pp., 2016.
García-Santos, G., Feola, G., Nuyttens, D., and Diaz, J.: Drift from the use of hand-held knapsack pesticide sprayers in Boyacá (Colombian Andes), J. Agric. Food Chem., 64, 3990–3998, 2016.
Great Barrier Reef Marine Park Authority: Great barrier reef outlook report 2009: In brief, Great Barrier Reef Marine Park Authority, ISBN 978 1 876945 91 6 (paperback), 34 pp., 2009.
Gupta, S., Gajbhiye, V., and Agnihotri, N.: Leaching behavior of imidacloprid formulations in soil, Bull. Environ. Contam. Toxicol., 68, 502–508, 2002.
Gustafson, D. I.: Groundwater ubiquity score: A simple method for assessing pesticide leachability, Environ. Toxicol. Chem., 8, 339–357, https://doi.org/10.1002/etc.5620080411, 1989.
Haynes, D., Ralph, P., Prange, J., and Dennison, B.: The impact of the herbicide diuron on photosynthesis in three species of tropical seagrass, Mar. Pollut. Bull., 41, 288–293, https://doi.org/10.1016/S0025-326x(00)00127-2, 2000.
Hurst, C. A., Thorburn, P. J., Lockington, D., and Bristow, K. L.: Sugarcane water use from shallow water tables: Implications for improving irrigation water use efficiency, Agr. Water Manage., 65, 1–19, https://doi.org/10.1016/S0378-3774(03)00207-5, 2004.
Isbell, R. F.: The Australian soil classification, 2nd, CSIRO Publishing, Clayton South, ISBN 978 1 486304 63 9 (paperback), 152 pp., 2016.
ISUU Working Group: World reference base for soil resources, World Soil Resources Report, 103 pp., 2022.
Johnson, A. K. L. and Ebert, S. P.: Quantifying inputs of pesticides to the Great Barrier Reef Marine Park – a case study in the Herbert River catchment of north-east Queensland, Mar. Pollut. Bull., 41, 302–309, https://doi.org/10.1016/s0025-326x(00)00130-2, 2000.
Karim, R., Reading, L., Dawes, L., Dahan, O., and Orr, G.: Transport of photosystem II (PS II)–inhibiting herbicides through the vadose zone under sugarcane in the Wet Tropics, Australia, CATENA, 206, 105527, https://doi.org/10.1016/j.catena.2021.105527, 2021.
King, O. C., Smith, R. A., Warne, M. S. J., Frangos, J. S., and Mann, R.: Proposed aquatic ecosystem protection guideline values for pesticides commonly used in the Great Barrier Reef catchment area: Part 2 – Bromacil, Chlorothalonil, Fipronil, Fluometuron, Fluroxypyr, Haloxyfop, MCPA, Pendimethalin, Prometryn, Propazine, Propiconazole, Terbutryn, Triclopyr and Terbuthylazine, Department of Science, Information Technology and Innovation, Brisbane, Queensland, Australia, 213 pp., 2017a.
King, O. C., Smith, R. A., Warne, M. S. J., Frangos, J. S., and Mann, R.: Proposed aquatic ecosystem protection guideline values for pesticides commonly used in the Great Barrier Reef catchment area: Part 1 (amended) - 2,4-D, Ametryn, Diuron, Glyphosate, Hexazinone, Imazapic, Imidacloprid, Isoxaflutole, Metolachlor, Metribuzin, Metsulfuron-methyl, Simazine, Tebuthiuron, Department of Environment and Science, Brisbane, Queensland, Australia, 296 pp., 2017b.
Kroon, F., Turner, R., Smith, R., Warne, M., Hunter, H., Bartley, R., Wilkinson, S., Lewis, S., Waters, D., and Carroll, C.: Scientific Consensus Statement 2013, Chapter 4: Sources of sediment, nutrients, pesticides and other pollutants in the Great Barrier Reef catchment, Queensland State Government, Reef Water Quality Protection Plan Secretariat, Brisbane, QLD, 42 pp., 2013.
Kroon, F. J., Thorburn, P., Schaffelke, B., and Whitten, S.: Towards protecting the Great Barrier Reef from land-based pollution, Global Change Biol., 22, 1985–2002, https://doi.org/10.1111/gcb.13262, 2016.
Lewis, S. E., Brodie, J. E., Bainbridge, Z. T., Rohde, K. W., Davis, A. M., Masters, B. L., Maughan, M., Devlin, M. J., Mueller, J. F., and Schaffelke, B.: Herbicides: A new threat to the Great Barrier Reef, Environ. Pollut., 157, 2470–2484, https://doi.org/10.1016/j.envpol.2009.03.006, 2009.
Lewis, S. E., Silburn, D. M., Kookana, R. S., and Shaw, M.: Pesticide behavior, fate, and effects in the tropics: An overview of the current state of knowledge, J. Agr. Food Chem., 64, 3917–3924, https://doi.org/10.1021/acs.jafc.6b01320, 2016.
Masters, B., Rohde, K., Gurner, N., and Reid, D.: Reducing the risk of herbicide runoff in sugarcane farming through controlled traffic and early-banded application, Agr. Ecosyst. Environ., 180, 29–39, https://doi.org/10.1016/j.agee.2012.02.001, 2013.
Masters, B., Mortimore, C., Armour, J. A., and Silburn, D. M.: Pesticides in groundwater of the Tully-Murray and Johnstone catchments: 2012/2013 report, Wet Tropics Region, Queensland Department of Natural Resources and Mines, 41 pp., 2014.
Masters, B., Tahir, N., Fries, J., Mortimore, C., Enderlin, N., and Armour, J.: Paddock-scale water quality monitoring of nitrogen fertiliser management practices in sugarcane cropping 2014–2016 technical report, Wet Tropics region, Department of Natural Resources and Mines, Brisbane, QLD, 73 pp., 2017.
Melland, A. R., Silburn, D. M., McHugh, A. D., Fillols, E., Rojas-Ponce, S., Baillie, C., and Lewis, S.: Spot spraying reduces herbicide concentrations in runoff, J. Agr. Food Chem., 64, 4009–4020, https://doi.org/10.1021/acs.jafc.5b03688, 2016.
Mitra, S., Bhowmik, P. C., and Xing, B.: Sorption and desorption of the diketonitrile metabolite of isoxaflutole in soils, J. Agr. Food Chem., 108, 183–190, https://doi.org/10.1016/s0269-7491(99)00192-x, 2000.
Mougin, C., Boyer, F.-D., Caminade, E., and Rama, R.: Cleavage of the diketonitrile derivative of the herbicide isoxaflutole by extracellular fungal oxidases, J. Agr. Food Chem., 48, 4529–4534, https://doi.org/10.1021/jf000397q, 2000.
Murtha, G.: Soils of the Tully-Innisfail area, North Queensland (Division of Soils Report No. 82), Townsville, QLD, 99, https://doi.org/10.4225/08/585ac669675d7, 1986.
Nachimuthu, G., Halpin, N. V., and Bell, M. J.: Effect of sugarcane cropping systems on herbicide losses in surface runoff, Sci. Total Environ., 557, 773–784, https://doi.org/10.1016/j.scitotenv.2016.03.105, 2016.
Oi, M.: Time-dependent sorption of imidacloprid in two different soils, J. Agr. Food Chem., 47, 327–332, https://doi.org/10.1021/jf980658k 1999.
Oliver, D. P., Anderson, J. S., Davis, A., Lewis, S., Brodie, J., and Kookana, R.: Banded applications are highly effective in minimising herbicide migration from furrow-irrigated sugar cane, Sci. Total Environ., 466, 841–848, https://doi.org/10.1016/j.scitotenv.2013.07.117, 2014.
Rasiah, V. and Armour, J. D.: Nitrate accumulation under cropping in the ferrosols of far North Queensland wet tropics, Aust. J. Soil Res., 39, 329–341, https://doi.org/10.1071/Sr99133, 2001.
Rayment, G. E.: Water quality in sugar catchments of Queensland, Water Sci. Technol., 48, 35–47, 2003.
Rimon, Y., Dahan, O., Nativ, R., and Geyer, S.: Water percolation through the deep vadose zone and groundwater recharge: Preliminary results based on a new vadose zone monitoring system, Water Resour. Res., 43, 12 pp., https://doi.org/10.1029/2006wr004855, 2007.
Rimon, Y., Nativ, R., and Dahan, O.: Vadose zone water pressure variation during infiltration events, Vadose Zone J., 10, 1105–1112, https://doi.org/10.2136/vzj2010.0061, 2011.
Rivett, M. O., Wealthall, G. P., Dearden, R. A., and McAlary, T. A.: Review of unsaturated-zone transport and attenuation of volatile organic compound (VOC) plumes leached from shallow source zones, J. Contam. Hydrol., 123, 130–156, https://doi.org/10.1016/j.jconhyd.2010.12.013, 2011.
Senseman, S. A.: Herbicide handbook, 9, 632.954 W394h9, Weed Science Society of America, Lawrence, US, 458 pp., 2007.
Shaw, M., Furnas, M. J., Fabricius, K., Haynes, D., Carter, S., Eaglesham, G., and Mueller, J. F.: Monitoring pesticides in the Great Barrier Reef, Mar. Pollut. Bull., 60, 113–122, https://doi.org/10.1016/j.marpolbul.2009.08.026, 2010.
Silburn, D. M., Foley, J. L., and deVoil, R. C.: Managing runoff of herbicides under rainfall and furrow irrigation with wheel traffic and banded spraying, Agr. Ecosyst. Environ., 180, 40–53, https://doi.org/10.1016/j.agee.2011.08.018, 2013.
Smith, R., Middlebrook, R., Turner, R., Huggins, R., Vardy, S., and Warne, M.: Large-scale pesticide monitoring across Great Barrier Reef catchments–paddock to reef integrated monitoring, modelling and reporting program, Mar. Pollut. Bull., 65, 117–127, https://doi.org/10.1016/j.marpolbul.2011.08.010, 2012.
Smith, R. A.: Ecologically relevant, quantitative methods for measuring pesticide reduction for the Great Barrier Reef, School of Mathematics Sciences, Queensland University of Technology, Brisbane, QLD, MS, 133 pp., 2018.
Stanley, J.: Groundwater chemistry and microbiology in a Wet Tropics agricultural catchment, School of Biology and Environmental Science, Queensland University of Technology, Brisbane, QLD, MS, 183 pp., 2019.
Stieglitz, T.: Submarine groundwater discharge into the near-shore zone of the Great Barrier Reef, Australia, Mar. Pollut. Bull., 51, 51–59, https://doi.org/10.1016/j.marpolbul.2004.10.055, 2005.
Sundaram, B., Feitz, A., Caritat, P. d., Plazinska, A., Brodie, R., Coram, J., and Ransley, T.: Groundwater sampling and analysis – a field guide, Geosci Aust Rec, 27, 95 pp., ISSN 1448-2177, 2009.
Tahir, N., Fries, J., King, A., and Masters, B.: Paddock-scale water quality monitoring of nitrogen fertiliser management practices in sugarcane cropping 2016–2018, technical report, Wet Tropics region, Queensland Department of Natural Resources and Mines, Brisbane, QLD, 61 pp., 2019.
Tao, L. and Yang, H.: Fluroxypyr biodegradation in soils by multiple factors, Environ. Monit. Assess., 175, 227–238, https://doi.org/10.1007/s10661-010-1508-2, 2011.
Thorburn, P. J., Wilkinson, S. N., and Silburn, D. M.: Water quality in agricultural lands draining to the Great Barrier Reef: A review of causes, management and priorities, Agr. Ecosyst. Environ., 180, 4–20, https://doi.org/10.1016/j.agee.2013.07.006, 2013.
Tu, M., Hurd, C., and Randall, J. M.: Weed control methods handbook: Tools & techniques for use in natural areas, The Nature Conservancy, Paper 533, 119 pp., 2001.
Turkeltaub, T., Kurtzman, D., and Dahan, O.: Real-time monitoring of nitrate transport in the deep vadose zone under a crop field – implications for groundwater protection, Hydrol. Earth Syst. Sci., 20, 3099–3108, https://doi.org/10.5194/hess-20-3099-2016, 2016.
van Zwieten, L., Rose, M., Zhang, P., Nguyen, D., Scanlan, C., Rose, T., McGrath, G., Vancov, T., Cavagnaro, T., and Seymour, N.: Herbicide residues in soils–are they an issue?, GRDC Grains Research Update Coonabarabran, 117–125, 2016.
Vardy, S., Tumer, R. D. R., Lindemann, S., Orr, D., Smith, R. A., Huggins, R., Gardiner, R., and Warne, M. S. J.: Pesticides and nutrients in groundwater and their transport to rivers from sugar can cropping in the lower Burdekin, Department of Science, Information Technology, Innovation and the Arts, Brisbane, 81 pp., 2015.
Wallace, R., Huggins, R., Smith, R., Turner, R., Garzon-Garcia, A., and Warne, M. S. J.: Total suspended solids, nutrient and pesticide loads (2012–2013) for rivers that discharge to the Great Barrier Reef–Great Barrier Reef Catchment Loads Monitoring Program 2012–2013, Department of Science, Information Technology, Innovation and the Arts, Brisbane, QLD, 3, . 95 pp., 2015.
Warne, M. J., Batley, G., van Dam, R., Chapman, J., Fox, D., Hickey, C., and Stauber, J.: Revised Method for Deriving Australian and New Zealand water quality guideline values for toxicants, Brisbane, Queenland, 48 pp., 2015.