the Creative Commons Attribution 4.0 License.
the Creative Commons Attribution 4.0 License.
 | 07 Dec 2022
Delineating the distribution of mineral and peat soils at the landscape scale in northern boreal regions
Eliza Maher Hasselquist
Johan Stendahl
Mats B. Nilsson
Siddhartho S. Paul
To meet the sustainable development goals and enable sustainable management and protection of peatlands, there is a strong need for improving the mapping of peatlands. Here we present a novel approach to identify peat soils based on a high-resolution digital soil moisture map that was produced by combining airborne laser scanning-derived terrain indices and machine learning to model soil moisture at 2 m spatial resolution across the Swedish landscape. As soil moisture is a key factor in peat formation, we fitted an empirical relationship between the thickness of the organic layer (measured at 5479 soil plots across the country) and the continuous SLU (Swedish University of Agricultural Science) soil moisture map (R2= 0.66, p < 0.001). We generated categorical maps of peat occurrence using three different definitions of peat (30, 40, and 50 cm thickness of the organic layer) and a continuous map of organic layer thickness. The predicted peat maps had a higher overall quality (MCC = 0.69–0.73) compared to traditional Quaternary deposits maps (MCC = 0.65) and topographical maps (MCC = 0.61) and captured the peatlands with a recall of ca. 80 % compared to 50 %–70 % on the traditional maps. The predicted peat maps identified more peatland area than previous maps, and the areal coverage estimates fell within the same order as upscaling estimates from national field surveys. Our method was able to identify smaller peatlands resulting in more accurate maps of peat soils, which was not restricted to only large peatlands that can be visually detected from aerial imagery – the historical approach of mapping. We also provided a continuous map of the organic layer, which ranged 6–88 cm organic layer thickness, with an R2 of 0.67 and RMSE (root mean square error) of 19 cm. The continuous map exhibits a smooth transition of organic layers from mineral soil to peat soils and likely provides a more natural representation of the distribution of soils. The continuous map also provides an intuitive uncertainty estimate in the delineation of peat soils, critically useful for sustainable spatial planning, e.g., greenhouse gas or biodiversity inventories and landscape ecological research.
- Article
(14744 KB) - Full-text XML
- BibTeX
- EndNote


Soil, i.e., the pedosphere, provides a suite of unique and essential ecosystem services globally (Smith et al., 2021), such as food (Silver et al., 2021) and forest production (Laamrani et al., 2014), conservation of water resources (Cheng et al., 2021), modulation of extreme events (Saco et al., 2021), and regulation of the global carbon cycle (Scharlemann et al., 2014). The characteristics of the pedosphere depend on multiple soil forming factors, i.e., parent material, climate, organisms, topography, and time (Jenny, 1941). In the northern boreal regions, the parent material of soil is mostly composed of Quaternary deposits that were formed during several cycles of glaciation and deglaciation (Imbrie et al., 1993). Therefore, the surficial sediments in these regions are mainly characterized by unsorted deposits from preceding stadial and interstadial periods (Hirvas et al., 1988; Olsen et al., 2013). Sorted sediments were also deposited in glaciofluvial deposits such as eskers, as well as marine and lacustrine environments during and after the glacial melting (Stroeven et al., 2016). Furthermore, the humid climate of the northern boreal regions favors anoxic soil conditions that support widespread mire formation and peat deposits (Ivanov, 1981; Rydin and Jeglum, 2013). Altogether, the boreal ecosystem contains one of the largest terrestrial carbon storages of the world (Beaulne et al., 2021; Loisel et al., 2014), which makes it significantly important for the earth system, especially under the current global warming and climate change (Astrup et al., 2018). The boreal biome stores about 272 (±23) Pg of C and 60 % of this carbon is found in soil organic matter (Pan et al., 2011).
The soil moisture regime, which is also a strong regulator of soil organic matter (SOM) dynamics, is a critical factor for ecosystem functioning and management in the boreal regions (Ivanov, 1981; Sewell et al., 2020). Soil moisture and SOM feedback has been clearly documented, for example, in central and northern Sweden which comprises a key boreal forest region (Hounkpatin et al., 2021). In Swedish boreal podzols, dry sites have an average soil organic carbon (SOC) stock of 6.7 kg C m−2 while mesic-moist sites had 9.7 kg C m−2 in the mineral horizons and 2.0 to 4.4 kg C m−2 alone in the organic horizon (Olsson et al., 2009). Moreover, SOC stock in peatlands of this boreal region is even higher, ranging from 22.6 to 72.0 kg C m−2 (Beaulne et al., 2021; Loisel et al., 2014). This clear relationship between SOM and soil moisture regime can provide an opportunity for mapping the distribution of peat soils in the boreal ecosystem. Soil maps detailing the distribution of mineral and peat soils across the boreal regions could support better the sustainable management and ecological restoration activities in these regions. Unfortunately, availability of soil maps are substantially limited for most regions and existing maps are mostly based on the technology and data from the 1900s – usually a result of manual interpretation of topographical maps, aerial photos, and field investigations (Olsson, 1999).
Recently, high-resolution topographic data from airborne laser scanning (ALS) have provided a new avenue for producing highly accurate maps of soil and site conditions at local to regional scales (Behrens et al., 2018; Latifovic et al., 2018; O'Neil et al., 2020; Pouliot et al., 2019; Prince et al., 2020). In Sweden, for instance, ALS data at 2 m spatial resolution were combined with machine learning (Lidberg et al., 2020) to map soil moisture condition in a recent study that exhibited both categorical soil wetness classes and continuous moisture variation at the national scale (Ågren et al., 2021). These maps provide new opportunities to explore the relationship between soil moisture regime and thickness of the organic layer, which in turn can be used to map the horizontal distribution of peat and mineral soils at landscape scale. In this study, we used Sweden as a test area for mapping the distribution of peat soils specifically based on soil moisture information, where we combined data from the National Forest Inventory (NFI) (Fridman et al., 2014), the Swedish Forest Soil Inventory (Stendahl et al., 2017), and the nationwide soil moisture map (Ågren et al., 2021).
This study focuses on the division between peat and mineral soils based on soil moisture condition. Here, we define peat soils and peatlands according to the definition provided by Rydin and Jeglum (2013).
Peat is the remains of plant and animal constituents accumulating under more or less water-saturated conditions owing to incomplete decomposition. It is the result of anoxic conditions, low decomposability of the plant material, and other complex causes. Peat is organic material that has formed in place, i.e., as sedentary material, in contrast to aquatic sedimentary deposits. Quite different plant materials may be involved in the process of peat formation, for instance, woody parts, leaves, rhizomes, roots and bryophytes (notably Sphagnum peat mosses). … Peatland generally refers to peat-covered terrain while a minimum depth of organic layer is required for a site to be classified as peatland.
For technical or practical reasons, a minimum organic layer depth is commonly used to define peatlands. However, such a technical depth-based definition of peatlands incorporates strong biases in aerial estimates of peatland across large regions. In addition, there is inconsistency – nationally and internationally – about the minimum organic layer depth required for an area to be classified as a peatland. For example, the Geological Survey of Sweden sets a threshold of 50 cm organic layer depth for peatland. The same threshold is also used in Scotland (Burton, 1996) while an organic layer depth of 40 cm is recognized for peatland in Canada, England, and Wales (Burton, 1996; Cruickshank and Tomlinson, 1990; Zoltai et al., 1975). This 40 cm limit also follows the definition of “Histosols” (i.e., soils consisting of dominantly organic materials) according to the World Reference Base for Soil Resources (WRB, 2015). Moreover, an organic layer thickness of 30 cm is used for defining peatland by the Swedish Forest Soil Inventory and NFI, Geological Survey of Finland, International Mire Conservation Group, and International Peat Society (Joosten and Clarke, 2002; Lappalainen and Hänninen, 1993). A shallower threshold of organic layer thickness to define a peatland will include more of the mineral-soil wetlands that often have a substantial content of organic matter within their surface layers. But the organic matter in these mineral-soil wetlands has not had a high enough accumulation rate or has not had enough time for thicker peat formation. Such soils in the boreal region may include the soil type “peaty mor” and form landscape features such as “cryptic wetlands,” which are usually elongated small areas with saturated soils commonly found in the bottom of small valleys, and riparian peat (Creed et al., 2003; Ploum et al., 2018; Kuglerova et al., 2014a). Therefore, to be useful for different practitioner groups and the scientific community, the map of peat soil distribution needs to incorporate multiple definitions of peatland based on the thickness of organic layer.
In this study, we developed an approach for accurate mapping of peat soil distribution based on the relationship between soil moisture variation and organic layer thickness using Sweden as a test case for a peat-rich northern landscape. The specific objectives of our study were to (i) generate categorical maps of mineral vs. peat soils across Sweden using multiple definitions of organic layer thickness for peatlands as described above, (ii) produce a continuous organic layer thickness map that could visualize and be useful for any definition of peatlands, (iii) evaluate our predicted peatland estimate of Sweden against inventory data and compare with the existing estimates from traditional maps, and (iv) provide the most accurate national estimates of peatland coverage and constrain the uncertainty in the estimates. This study provides a guide to map mineral and peat soils in any northern boreal region that will be essential for effective ecosystem management and for supporting sustainable development goals related to restoration of degraded land and climate action.
2.1 Study area
Our study area, the whole of the country of Sweden (latitude 55–70∘ N, longitude 11–25∘ E) falls in the boreal and temperate forest region of northern Europe (Fig. 1a). According to satellite data, the land cover in Sweden is dominated by forest, covering 69 % of the country, followed by agricultural land (9 %), open peatland (9 %), grassland (8 %), rock outcrops (5 %), and urban land (3 %) (Schöllin and Daher, 2019). The climate according to Köppen is classified as warm summer continental or hemiboreal climates (Dfb) and subarctic or boreal climates (Dfc) (Beck et al., 2018). There is a notable elevation and precipitation gradient from north to south, and from east to west of the country, with annual precipitation ranging from 400 to 2100 mm (1961–1990). The soil type in Sweden is dominated by Podzols, but more complex distribution of Histosols, Gleysols, Arenosols, and Regosols are also common (Olsson, 1999). The topogenous fens are most common wetland types in Sweden, followed by string mixed mires and string flark fens (Gunnarsson and Löfroth, 2009).
2.2 Swedish Forest Soil Inventory (SFSI)
The Swedish Forest Soil Inventory (SFSI) was used for organic layer thickness data (Olsson, 1999; Stendahl et al., 2017). The spatial density of the inventory plots varies throughout Sweden due to landscape heterogeneity, emanating from both natural and human-induced conditions (Fig. 1b). The SFSI is conducted on plots with a radius of 10 m. In case of heterogeneity inside the plots, they are divided into partial plot areas and data are recorded on the sub plots. In these plots, the organic layer thickness was directly recorded from soil pits (a soil sampling circle with 1 m radius which is located within the plot area). We included a total of 5479 data points for organic layer thickness (Fig. 1b).

Figure 1(a) Sweden's position in the northern boreal zone/taiga; map data from Dinerstein et al. (2017). (b) Black dots indicate the sites for the Swedish Forest Soil Inventory (Olsson, 1999; Stendahl et al., 2017) where the thickness of the organic layer has been measured (n= 5479).
2.3 Generating categorical (peat vs. mineral soils) and continuous organic layer thickness maps
This study utilized the SLU (Swedish University of Agricultural Science) soil moisture map that exhibits soil moisture variation across Sweden on an arbitrary scale from 1 to 100, i.e., from dry to wet (Ågren et al., 2021). The method development of the SLU soil moisture map was described in Ågren et al. (2021) and a previous version in Lidberg et al. (2020). Here we give a brief introduction to the SLU soil moisture map as this study is based on that map. It was developed using a combination of digital terrain indices (derived from 2 m resolution digital elevation model) based on airborne laser scanning (ALS) data and ancillary data on Quaternary deposits, soil depth, annual and seasonal runoff etc. The topographical indices were calculated on window sizes from 6×6 to 160×160 m to allow for both large-scale and small-scale controls on soil moisture. By working on a higher resolution than most studies, we aimed to improve the modeling of soil moisture in local pits and small-scale variability in riparian zones. In total, 45 different maps (or features) were evaluated for predicting soil moisture, and after the feature reduction step 28 different maps was included in the final predictive machine learning model (e.g., extreme gradient boosting model, Chen et al., 2020) that was used to predict the soil moisture across Sweden. Top predictors for mapping soil moisture across Sweden included depth-to-water maps and topographic wetness index maps calculated at different scales and resolutions, but also the autumn runoff and latitude (Ågren et al., 2021). These maps are now publicly available (Sveriges lantbruksuniversitet/Swedish University of Agricultural Sciences, 2022). The model was trained and tested using 19 643 field observations from the NFI of which 80 % were used for training and 20 % was used for testing. The soil moisture map has a Cohen's kappa (Cohen, 1960) and Matthews correlation coefficient (MCC) (Matthews, 1975) values of 0.69 and 0.68, respectively. The map displays the probability of a soil being wet (0–1), which was rescaled to 1–100 (Fig. 2a) so the variability could be displayed without the use of decimals which reduced file size. There is a strong correlation with the probability of a soil being wet and the soil moisture (i.e., Fig. 6 in Ågren et al., 2021), and the use of a scale from 1–100 allows the modeling of smooth transitions from dry to wet instead of fixed categories. The current SLU soil moisture map version includes 98.7 % of the Swedish landmass. The remaining 1.3 % was not laser scanned at the time of map production. Thus, the prediction of peat soil maps in this study also excludes those 1.3 % areas of Sweden, which added minor uncertainties in our national estimates of peat soils.
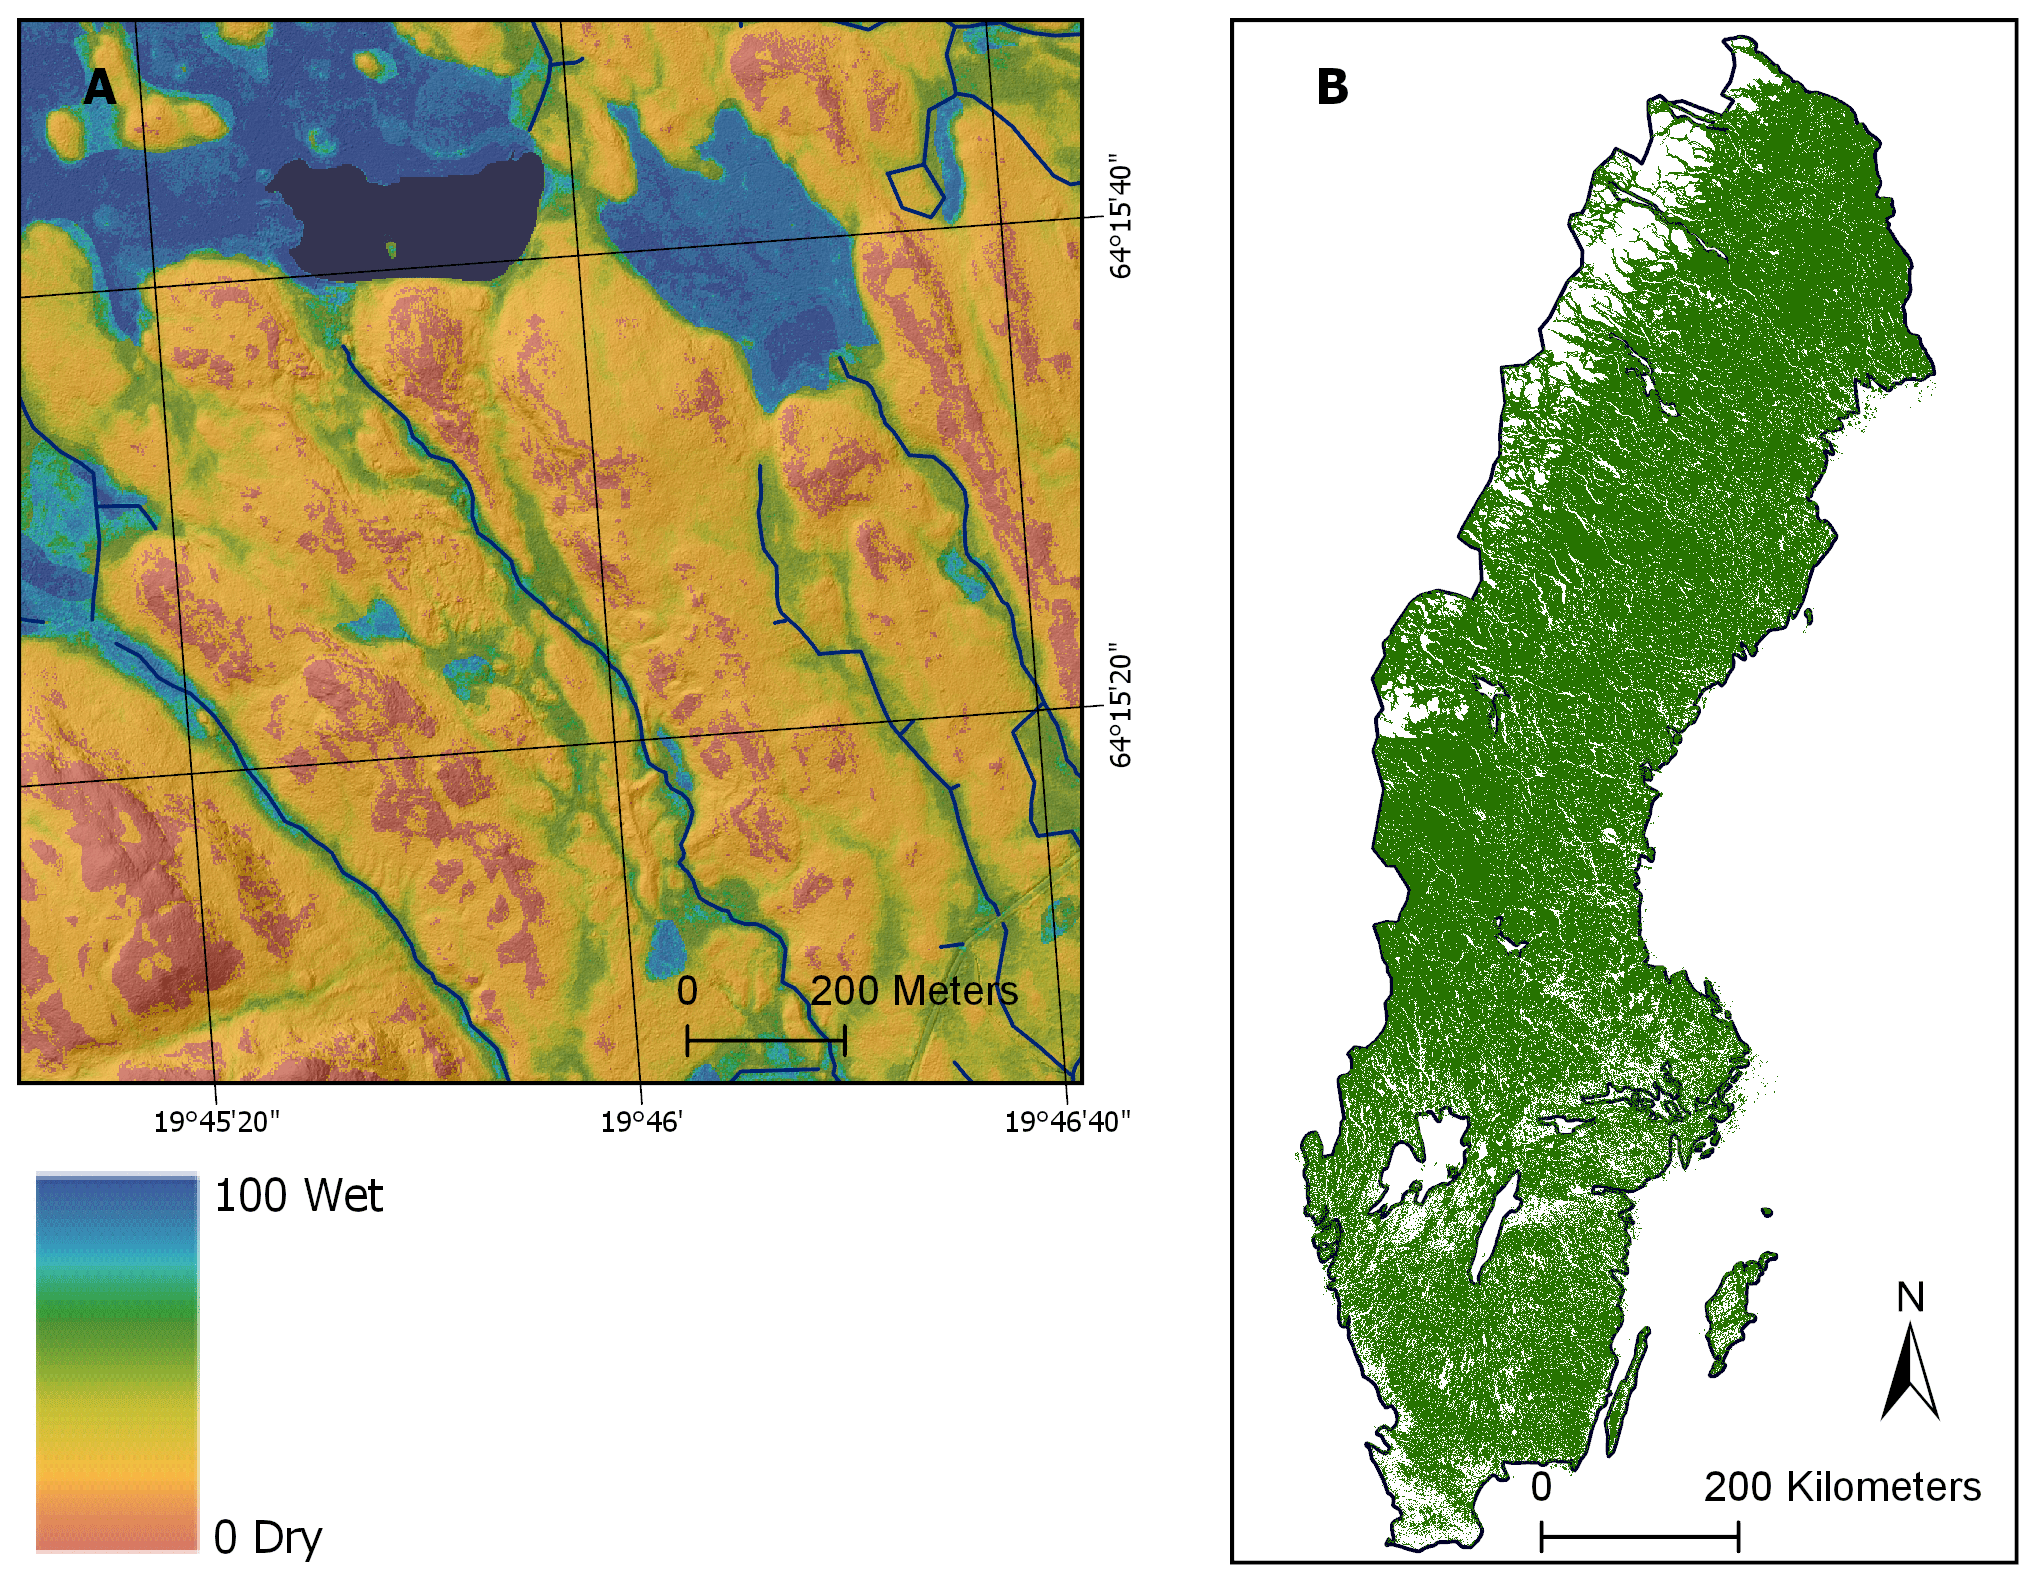
Figure 2(a) Example of the SLU soil moisture map showing the probability of a soil being wet (0 %–100 %) (Ågren et al., 2021). (b) Green areas indicate the forest landscape in Sweden that is sampled by the Swedish National Forest Inventory (Fridman et al., 2014) and the Swedish Forest Soil Inventory (Olsson, 1999; Stendahl et al., 2017).
We tested the relationship between the SLU soil moisture map and the thickness of the organic layers. The organic layer thickness was registered in the Swedish Forest Soil Inventory up to a maximum thickness of 99 cm. We first divided the Swedish Forest Soil Inventory data (from Sect. 2.2) into calibration and validation datasets using a randomized 50 % split on the IBM SPSS statistics program. The calibration dataset was then used to establish a relationship between the SLU soil moisture map and the thickness of the organic layers using the curve estimation procedure in IBM SPSS statistics version 27, which fits a total of 11 linear and non-linear models. The model with the highest R2 was selected to describe the relationship (Fig. 3).
The categorical maps were generated based on the relationship with the highest R2. By solving Eq. (7) for X when Y was 30, 40, and 50 cm, we could determine the soil moisture limits for classifying peat soil. At organic layer thickness of ≥ 30, ≥ 40, and ≥ 50 cm, the soil moisture limits were ≥ 76 %, ≥ 83 %, and ≥ 87 %, respectively (Fig. 3). These thresholds were used to reclassify the soil moisture map into maps of peat extent while the remaining soil was delineated as mineral soil. Hence, three different peatland maps were derived, which we referred to as “peat ≥ 30 cm”, “peat ≥ 40 cm”, and “peat ≥ 50 cm”. In addition, a continuous organic layer thickness map was generated by applying Eq. (7) in raster calculator on the continuous soil moisture map. This continuous map does not contain discrete classes of mineral and peat soils, rather it presents the distribution of organic layer thickness across the landscape. The accuracy of the maps was then tested using the validation dataset described in Sect. 2.5.
As the data underlying the maps comes from NFI and SFSI, we lack evaluation data from other land use types. We therefore first defined the Swedish forest landscape to indicate where the predicted maps could be trusted. The Swedish Forest Soil Inventory samples both productive forest land (defined as areas with a potential wood yield capacity of > 1 m3 ha−1 yr−1) and low-productivity forest land (with lower yield capacity), such as pastures, thin soils, non-forest peatlands, rock outcrops, and areas close to the tree line (e.g., birch forests in the alpine region). We generated a map of the Swedish forest landscape (Fig. 2b) by reclassifying the National Land Cover Database (NMD), a land cover map over the entire country in 10 m resolution (Olsson and Ledwith, 2020) where we excluded areas outside the NFI's sampling (crop fields, urban areas, roads, rail roads, and power lines) and the alpine region above the birch forest (based on an elevation threshold which is a function of latitude).
2.4 Quaternary deposits maps and topographical maps
We used the Quaternary deposit and topographic maps of Sweden for comparison with our predicted estimates of peat soil distribution. In the Quaternary deposits map from the Geological Survey of Sweden (SGU), peatland is delineated based on these criteria: (i) organic layer thickness ≥ 50 cm, (ii) minimum detected area of 2500 m2, and (iii) the estimated position accuracy ranging 25–200 m (Karlsson et al., 2021). Some linear peatlands narrower than 50 m, but important for the understanding of the geology, were also included and expanded to 50 m width (Cecilia Karlsson, SGU, personal communication, 2022). However, there are various scales with different coverages for the Quaternary deposit maps in Sweden, such as 1:25 000 covers 1.7 % of the area, 1:50 000 covers 2.7 %, 1:100 000 covers 47 %, 1:200 000 covers 1.4 %, 1:250 000 covers 21.2 %, 1:750 000 covers 33.6 %, and 1:1 000 000 covers 100 %. These maps were merged together to produce a single Quaternary deposits map for the whole country where the map with the highest scale was always chosen in areas with overlapping maps (Lidberg et al., 2020). This Quaternary deposit map contains five categories of deposit, including till soils, thin soils and rock outcrops, peat, coarse sediments (sand–gravel–boulders), and fine sediments (clay–silt). The coverage of each category was calculated by summarizing the areas of all polygons within the respective category. Finally, the total coverage of peat category was used for comparison with our predicted estimate of peatland.
Another commonly used mask for delineating peatlands in Sweden is wetlands from the topographic map, i.e., the Swedish property map (1:12 500) (Lantmäteriet, 2020). However, the wetland class in the property map is not based on the thickness of organic layer; instead, it is defined as peat-forming mires or watery mires and grouped into two categories – (i) wetlands that can be crossed on foot and include mires with shrubs, sedge, and trees of variable densities, and (ii) impassible wetlands that are inaccessible on foot and include watery mires, which are mostly fens, soft bed without vegetation, and overgrown lakes with reed. Here we calculated the total coverage of the wetlands and impassible wetlands by summarizing the areas of the polygons for all of Sweden. These two categories of wetlands were merged together to find a peatland coverage for the whole country and compared with our predicted estimate.
2.5 Statistical evaluation of the accuracy of the different peat maps
We evaluated the accuracy of the categorical peatland maps using confusion matrix and the validation dataset (see Sect. 2.4). Three predicted peatland maps (i.e., “peat ≥ 30 cm”, “peat ≥ 40 cm”, and “peat ≥ 50 cm”) along with the peatland coverage derived from Quaternary deposit and topographic maps were evaluated following the same approach. More specifically, the ground truth for peat was the SFSI evaluation plots where observed organic layer thickness was larger than the respective thresholds, and the mineral soil ground truth was the SFSI evaluation plots with observed organic layer thickness lower than the respective thresholds. The following accuracy metrics were calculated based on the confusion matrix:
where true positives (TP) is the number of observations where the field data and map agree that soils are peat; true negatives (TN) is the number of observations where the field data and map agree that soils are mineral soils; false positives (FP) is the number of observations where the map predicts peat while soils are mineral soils; false negatives (FN) is the number of observations where the map predicts mineral soils while soils are peat; Po= Relative observed agreement; and Pe= Hypothetical probability of chance agreement. Additionally, the continuous map of the organic layer thickness was evaluated by calculating the goodness of fit (R2) and root mean square error (RMSE) from the predicted and observed organic layer thickness.
2.6 Peatland estimates from the NFI and SFSI
To compare the predicted peat soil estimates from the maps with other estimates of peatland coverage in Sweden, we also calculated peatland coverage by statistical upscaling from the national inventories, i.e., NFI and SFSI (SLU, 2021) to derive a complete coverage for the Swedish forest landscape. From these inventories, peat coverage was estimated by the statistical experts at NFI (Fridman et al., 2014) and SFSI (Stendahl et al., 2017) in six different ways: (1) peat coverage was registered in the 2016–2020 NFI survey plots (7 and 10 m radius) in the following classes – peat coverage 0 % (n= 33 161), 0 %–50 % (n= 1553), 50 %–100 % (n= 1439), and 100 % (n= 6080). For the upscaling, the peat coverage ranges of 0 %–50 % or 50 %–100 % were assumed to cover 25 % and 75 %, respectively, of the plot. It should be noted that isolated peatland patches smaller than 25 m2 on plots were disregarded. Details on the NFI data upscaling approach can be found in (Hånell, 2009). (2) NFI also conducts assessment of cover of different species on 5.64 m plots. On natural peatlands, the bryophytes are dominated by the genus Sphagnum or brown mosses (Amblystegiaceae family). Polytrichum commune commonly also grows in bogs and in riparian zones. Their coverage is measured in the NFI, here we pool the coverage of Sphagnum, brown mosses, and Polythrichum commune into a class that we call “peat indicative mosses”. In addition to NFI, the 2003–2012 SFSI database registered peat soils as (3) Quaternary deposits with organic layer thickness ≥ 50 cm, and as (4) soil type histosol with organic layer ≥ 40 cm (WRB, 2015). Moreover, SFSI classified the humus form according to the depths of the OF (soil taxonomy Oe), OH (soil taxonomy Oa), and H horizons, and amount of aggregates in case of an A horizon. Based on humus form, peat soils were registered as (5) peat if organic layer ≥ 30 cm and 6), peat with no thickness restriction (i.e., peat if organic layer ≥ 30 cm + peaty mor with organic layer < 30 cm). This upscaling from the SFSI database was performed following the approach described in Nilsson et al. (2018). The survey data from NFI and SFSI are based on sampling of the Swedish forest landscape, not the total land area. In short, this includes productive forest land, pastures, mires, rock outcrops, and alpine region below treeline but excluding arable land, alpine region above treeline, railroads, power lines, roads, and urban areas. However, the exact definitions of forest land differ slightly among sources which introduces an uncertainty in the national estimates. For example, the forest landscape mask (Fig. 2b) covers 343 000 km2, while NFI and SFSI suggest that 338 000 and 306 000 km2, respectively, are forest land. This can explain some smaller discrepancies between different sources in Tables 2 and 3.
3.1 Relationship between soil moisture and thickness of organic layer
The relationship between the soil moisture variation from the SLU map (Ågren et al., 2021) and organic layer thickness derived from the Swedish Forest Soil Inventory was well described with a cubic relationship (Eq. 7, R2= 0.66, p < 0.001; Fig. 3).
where Y is the thickness of the organic layer (cm) and X is the soil moisture level from the SLU soil moisture map. The s-shape of the curve is due to a rapid increase in organic layer thickness at the high end of soil moisture and a sharp decrease in organic layer thickness at the lower end of the moisture spectrum. The driest sites are generally found on crests and ridges characterized by rock outcrops with very thin organic layers.
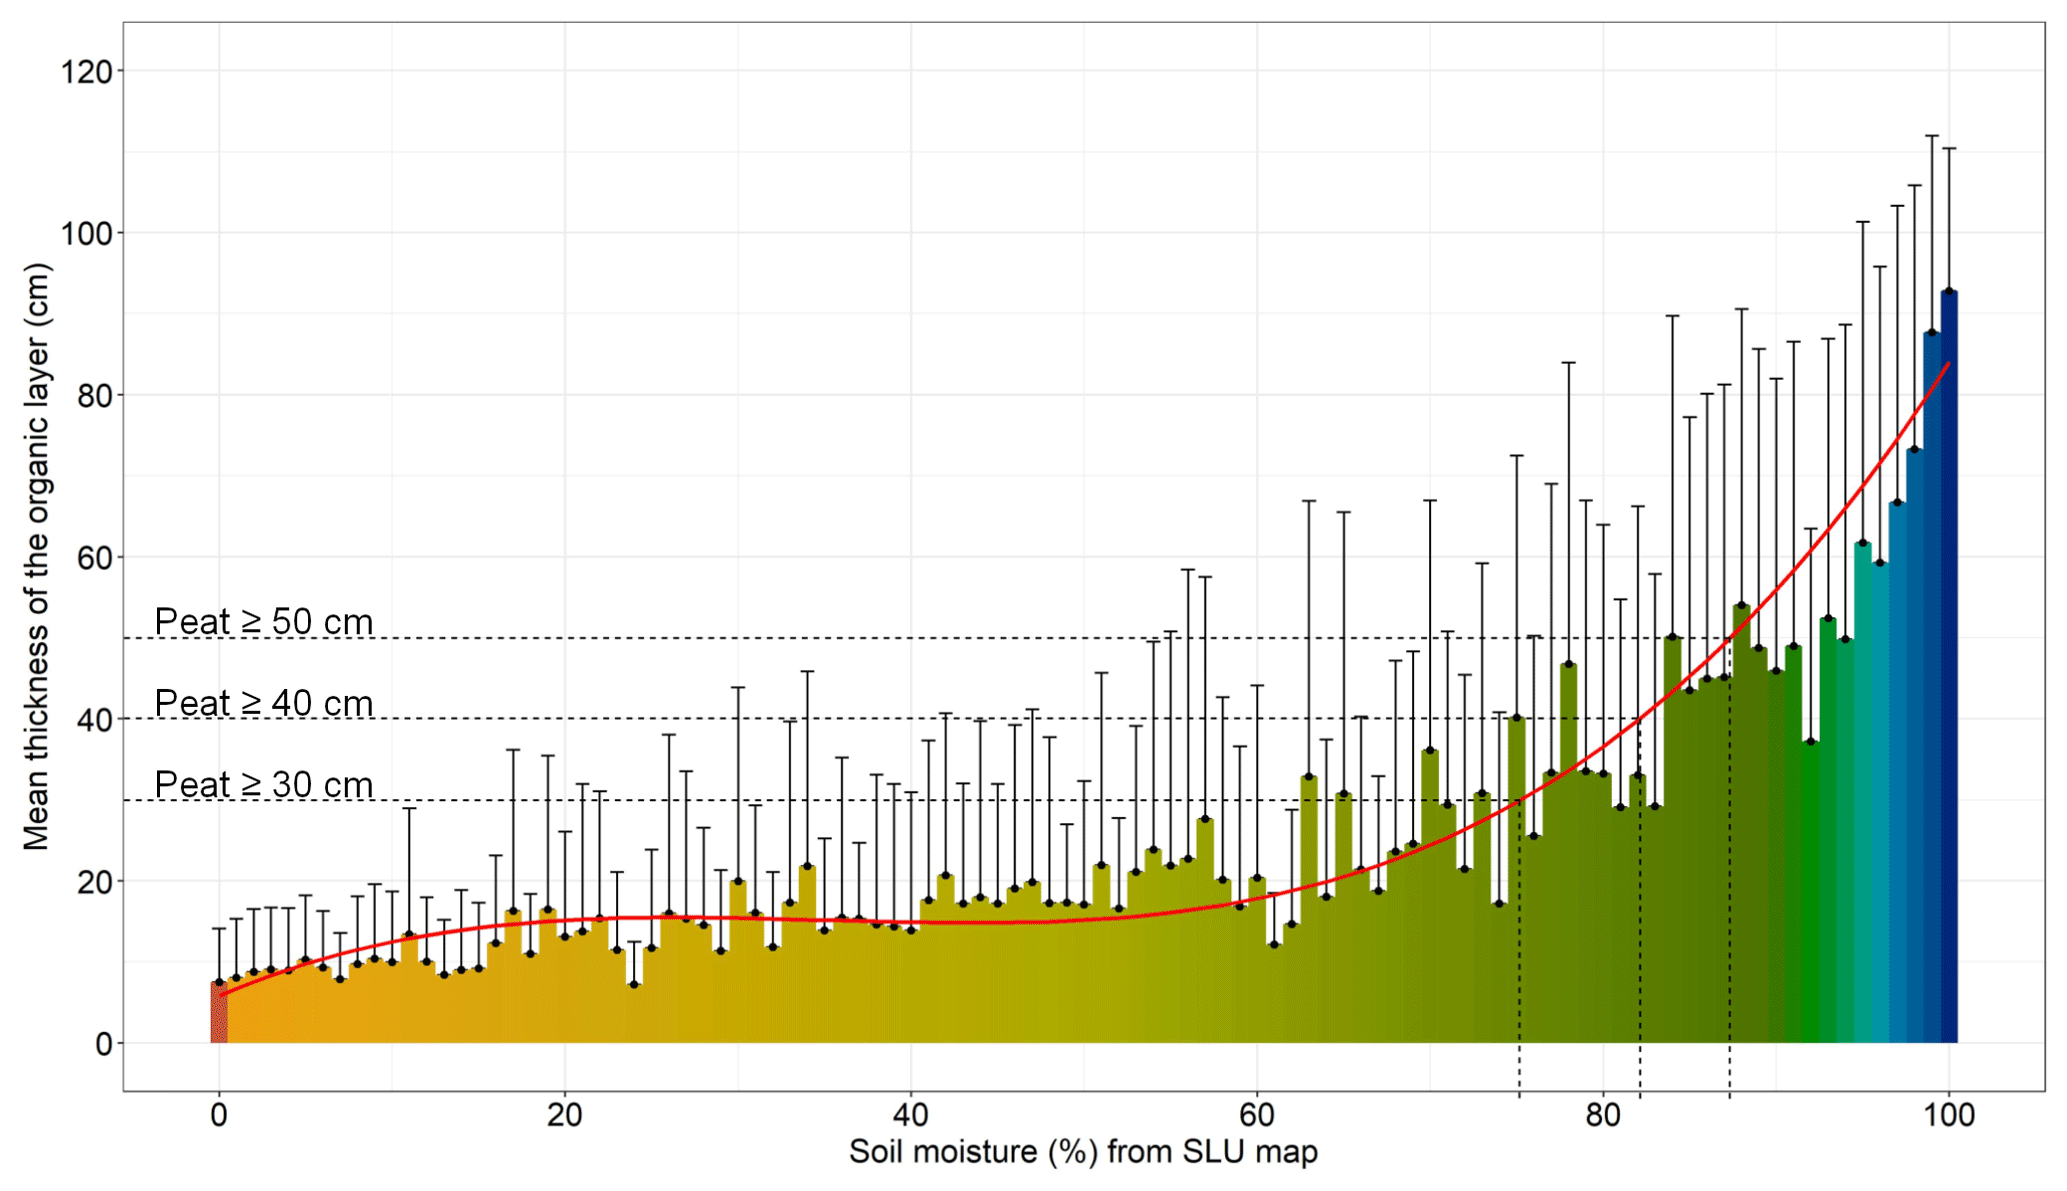
Figure 3The red line depicts the cubic relationship (R2= 0.66) between the thickness of the organic layer in SFSI plots and the probability for the soil being wet according to the SLU soil moisture map (Ågren et al., 2021). The colored bars and black dots indicate the mean organic layer thickness (in the calibration dataset) for soil moisture variation from 0 (dark orange) to 100 (dark blue) as extracted from the SLU soil moisture map (shown using the same color code). The error bars represent the standard error of mean of the organic layer thickness at each soil moisture level. Note that the soil moisture in percentages denotes the probability of a soil being wet expressed as percent, not the volumetric soil water content.
3.2 Statistical evaluation of different peatland maps
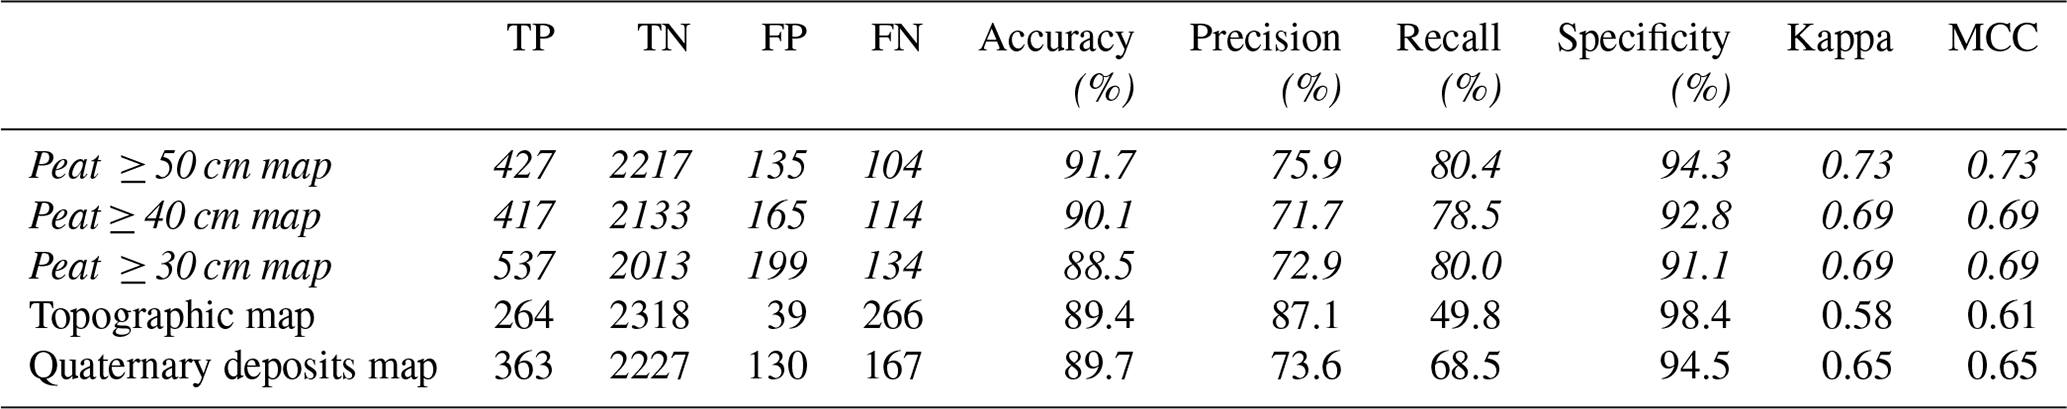
Our predicted peat maps generally performed better than the existing topographic and Quaternary deposit map products (Table 1). Particularly, the predicted peat ≥ 50 cm map was of highest quality in terms of accuracy, recall, kappa, and MCC values. The prediction of peat ≥ 40 cm and peat ≥ 30 cm had equal kappa (i.e., 0.69) and MCC (i.e., 0.69) values; however, they were about 5 % less accurate than the kappa and MCC of peat ≥ 50 cm. Although all three predicted peat maps exhibited better accuracies for most metrics, the topographic map had higher precision and specificity values.
Table 1Evaluation metrics of different maps of peat soils. TP = True positives, TN = True negative, FP = False positives, FN = False negatives. The other metrics are explained in Eqs. (1)–(6). Kappa refers to Cohen's kappa and MCC to the Matthews correlation coefficient. The peat maps that we predicted in this study are highlighted in italics. The topographic and Quaternary deposits maps are existing national products.
To illustrate the confusion matrix for evaluating classified data, we exemplify this in red in Fig. 4 using peat with ≥ 50 cm depth. The model misclassifies peat as mineral soil in 104 instances (FN) and misclassifies mineral soils as peat in 135 cases (FP). There are 427 observations correctly classified as peat (TP) and 2217 are correctly classified as mineral soils (TN). So even though there is a lot of scatter in Fig. 4, 2644 of 2883 soil pits are correctly classified in this example. The prediction of continuous organic layer thickness captures the general patterns, with a positive relationship between measured and observed thickness of organic layer (R2 of 0.67 and p < 0.001). However, the confidence interval (CI) in Fig. 4 and a root mean square error (RMSE) of 19 cm indicate a rather large uncertainty in the estimated thickness of the organic soils. Moreover, the cubic relationship shown in Fig. 3 (i.e., Eq. 7) could not fully capture the rapid increase in organic layer thickness that occurred with high soil moisture and the sharp decrease in organic layer thickness with dry soils. Hence, the predictions in Fig. 4 only ranged 6–88 cm compared with the measured data which ranged 0–99 cm. As a result, the model systematically overestimates thin organic layers and underestimates thick organic layers.
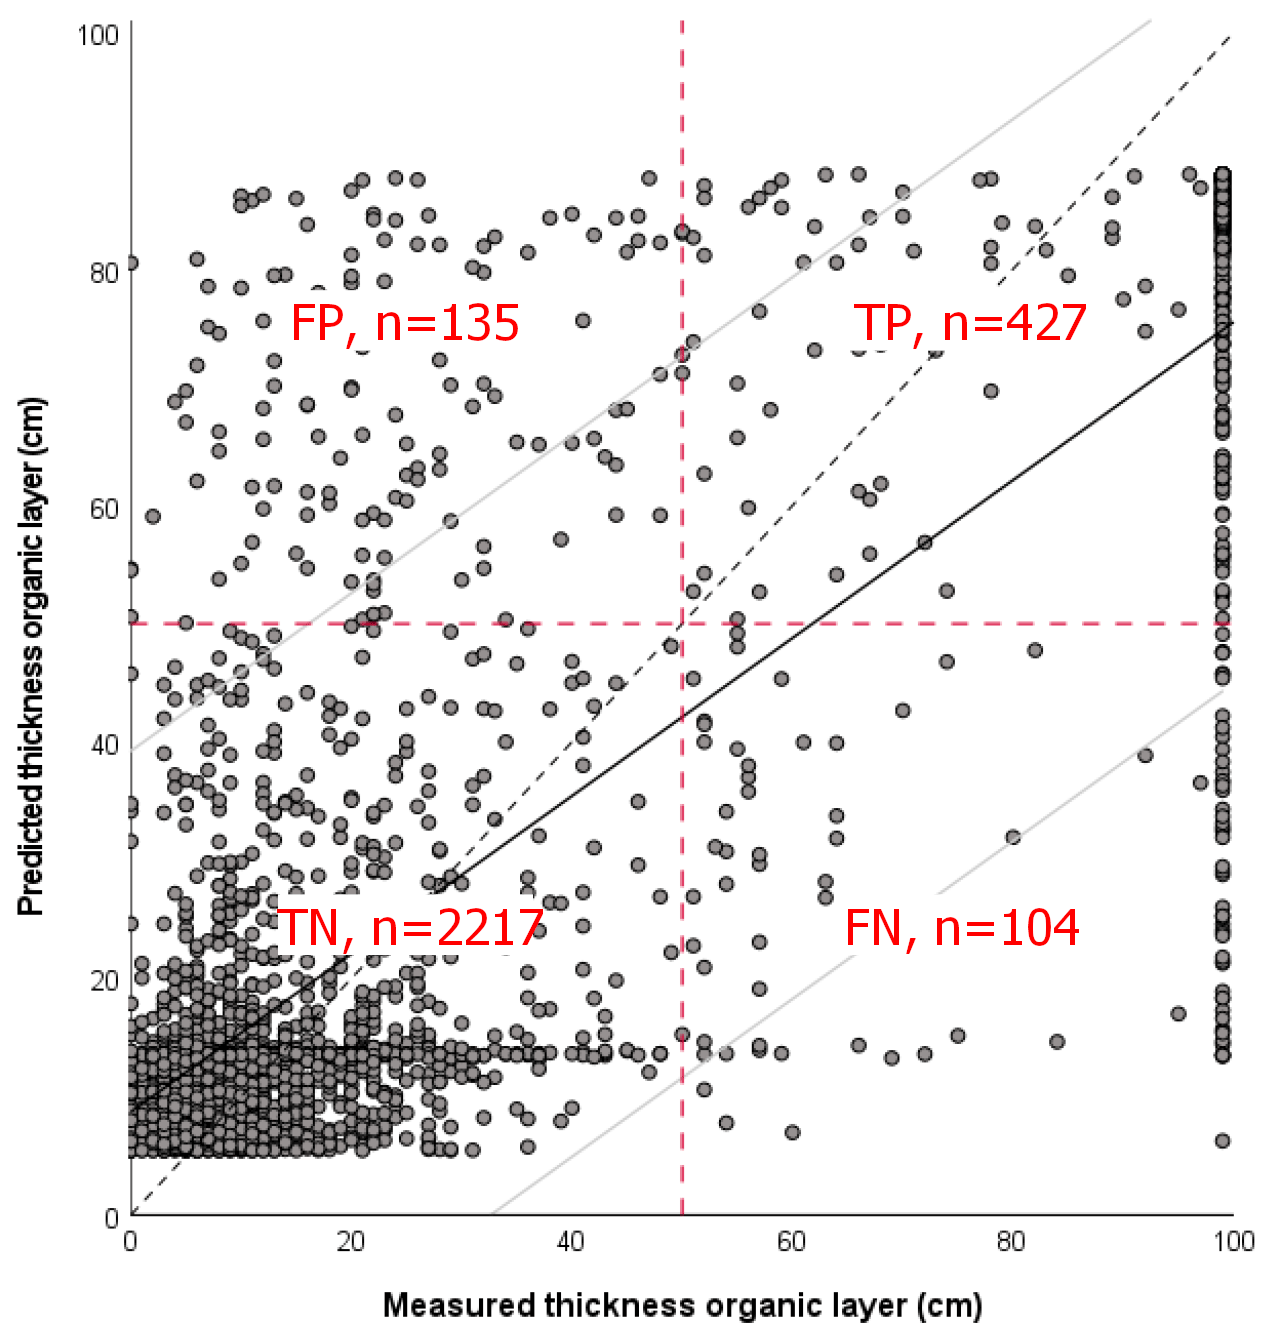
Figure 4Predicted vs. measured continuous thickness of the organic layer in the evaluation dataset (n= 2883). Red lines indicate the quadrants of the confusion matrix for classified data using peat with ≥ 50 cm depth. Dashed line indicates the 1:1 line and black line a linear regression (R2= 0.67, p < 0.001), grey lines indicate 95 % CI. Field measurements of peat thickness that were 99 cm or above were reported as 99 cm, hence the many overlapping data points.
3.3 Visual interpretation of peatland maps
As described above, the predicted area of peat ≥ 50 cm covers larger areas than the existing national maps (Table 2), which was also evident in Fig. 5 (panels a and d). The peat ≥ 50 cm map captured more riparian peat soils than the topographic and Quaternary deposit maps (Fig. 5a). It also better delineated the mire areas that are obscured by tree canopy and typically not captured using traditional mapping techniques based on aerial photos (illustrated in Fig. 5d, cf. hillshade and aerial photo in Fig. A1 in Appendix A). Although there were differences in peatland coverage between the predicted maps at different thresholds (i.e., ≥ 30, ≥ 40, and ≥ 50 cm peat maps), they provided more or less comparable distribution of peat across the landscape (Fig. 5b, e). A RMSE of 19 cm for the prediction of continuous organic layer thickness (Fig. 5c, f), indicates that the depth estimates are uncertain and should not be taken literally. However, we argue that this map can be used to display the horizontal distribution of peat and mineral soils, and indicates a smoother and more realistic impression of the high variability in areal distribution of the organic soils. The map with continuous organic layer depths exhibits pixel-by-pixel variation in organic layer thickness ranging from 6 to 88 cm across the country, and unlike the categorical maps, does not demonstrate discrete soil classes which may cause misrepresentation of natural conditions and distribution of organic soils due to oversimplification.

Figure 5The left panels (a, d) show an example of two different locations with peatlands with the following three maps overlaid on each other for comparison: Quaternary deposits map (1:25 000) (black hatched area), topographical map (1:12 500) (blue hatched area), and the predicted peat ≥ 50 cm map (2 m resolution) (brown area). The center panels (b, e) demonstrate the difference in the predicted peat maps using 30, 40, and 50 cm organic layer thresholds by superimposing the predictions on top of each other with peat ≥ 30 cm in the bottom (a wider distribution) and peat ≥ 50 cm at the top (a narrower distribution). The right panels (c, f) exemplify the continuous map of organic layer thickness derived using Eq. (7) in two different areas. Note that the thickness of the organic layer may be underestimated in some areas as the full depth of the organic deposits are not registered in the Swedish Forest Soil Inventory database (ranges 0–99 cm).
3.4 Peat coverage in Sweden
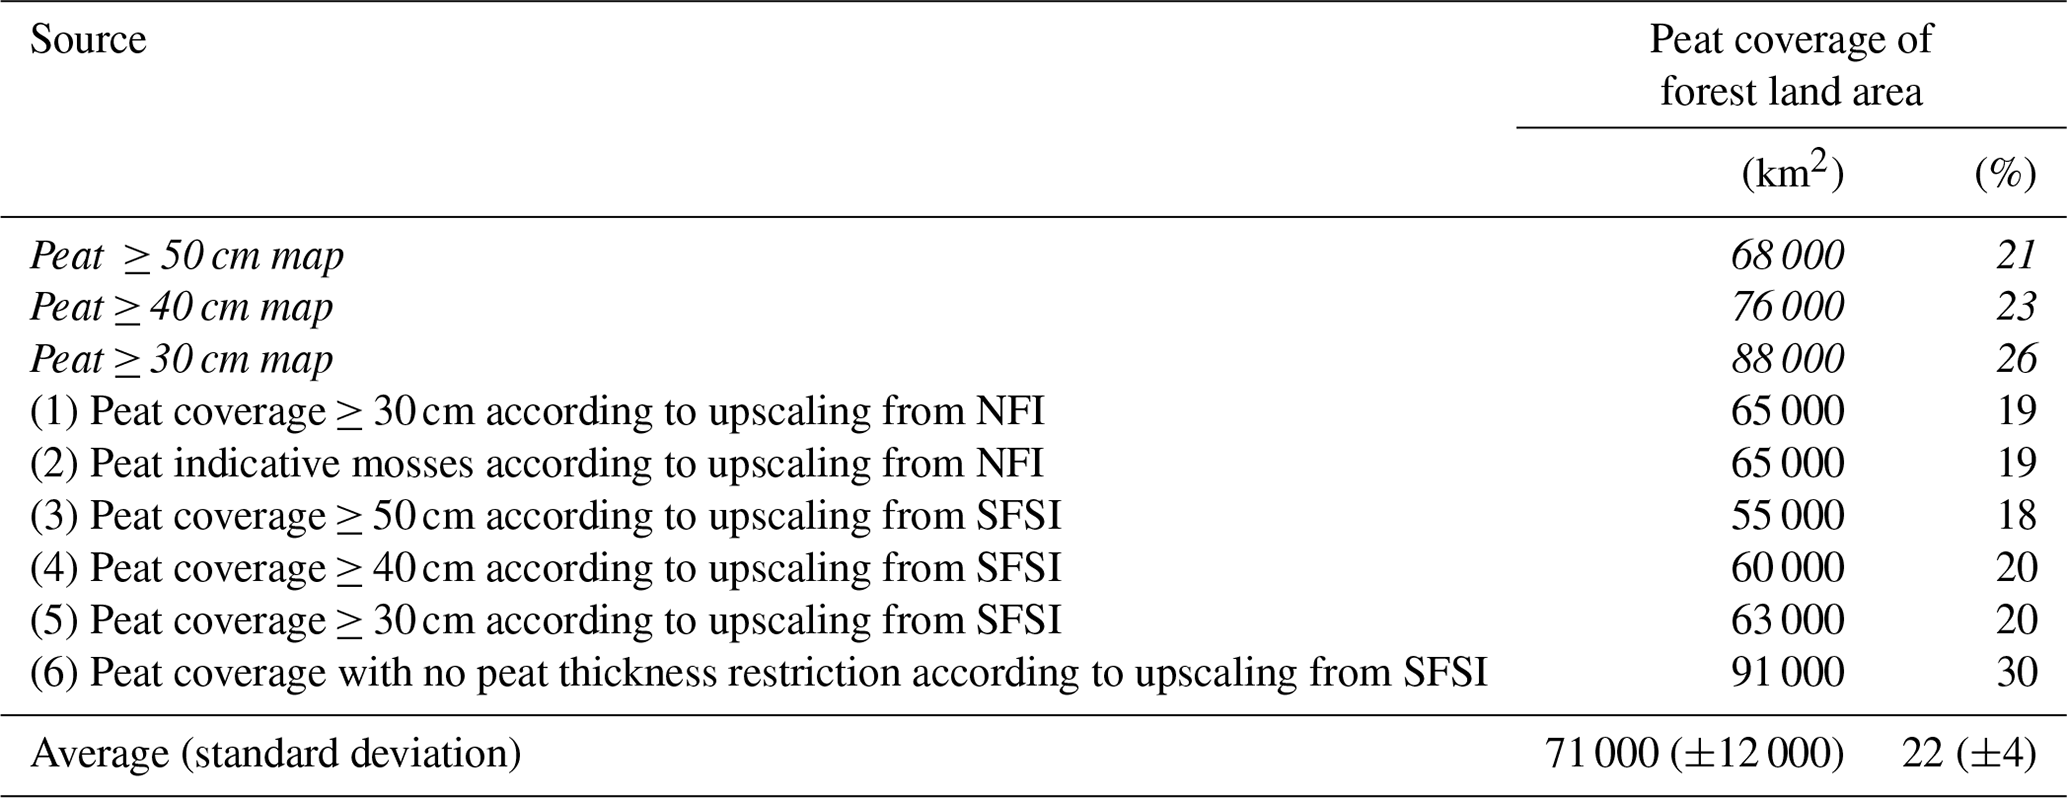
We observed notable differences in peat coverage between our predicted maps and estimates from the existing map products (Table 2). There was large variation in our predicted estimates of peatland coverage at different thresholds of organic layer thickness ranging from 70 000–94 000 km2, and this suggests that 18 %–24 % of Swedish landmass is covered by peatland, depending on the definition used, which is considerably larger than the estimates from the existing Swedish map products. Namely, the peatland coverage from topographic map was only 13 %, while it was just 14 % based on the Quaternary deposit map. This is in comparison to the coverage of other Quaternary deposits in Sweden from the calculations of the Quaternary deposits map: till soils 53 %, thin soils and rock outcrops 18 %, coarse sediments (sand–gravel–boulders) 8 %, fine sediments (clay–silt) 6 %, and other (ice, fillings, etc.) 1 %. The forest landscape, according to the map in Fig. 2b, covers ca. 85 % of the land area in Sweden. While excluding peatlands outside forest land decreased the overall coverage of peat to 68 000–88 000 km2, we see that in relative terms, peatlands were more common in the forest landscape (21 %–26 %) (Table 3) compared to the national averages (Table 2). The peat coverage estimates of the forest landscape according to upscaling from NFI and SFSI (Sect. 2.6) ranged 55 000–91 000 km2, depending on the definition used. The average errors from these surveys range 2 %–4 %.
Table 2Coverage of peatlands in Sweden according to different maps, in km2 or in % of the land area in Sweden (excluding lakes and large ≥ 6 m wide rivers). The peat maps that we predicted in this study are highlighted in italics. The topographic and Quaternary deposits maps are existing national products.
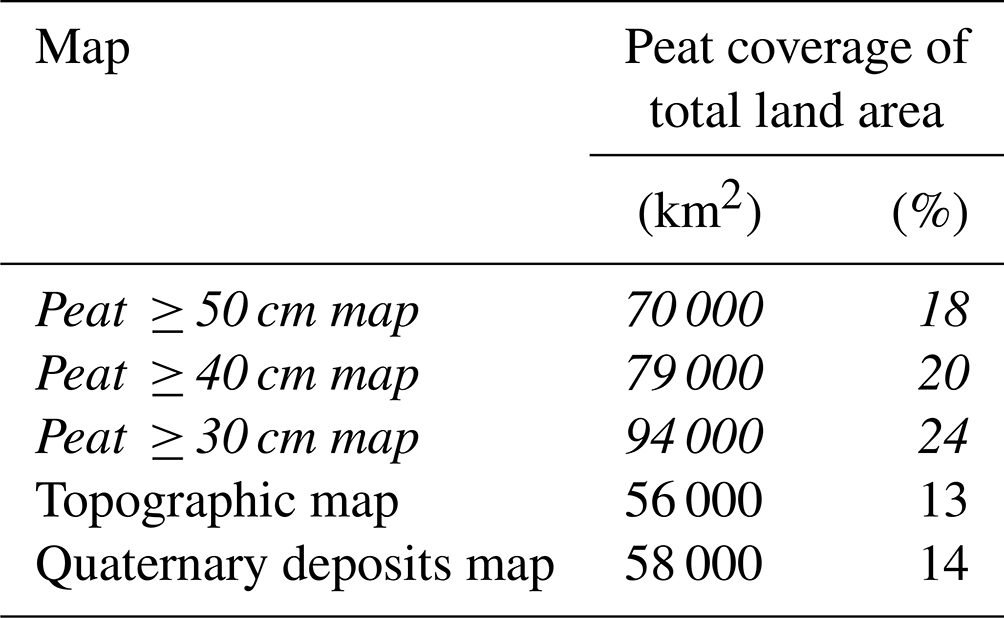
Table 3Peatland coverage in km2 or in percent of forest land according to different sources. The peat maps that we predicted in this study are marked in italics. The numbering refers to the different upscaling estimates from inventory data as described in Sect. 2.6. Forest land includes productive forest land, pastures, mires, rock outcrops, and alpine region below treeline, but excludes arable land, alpine region above treeline, railroads, power lines, roads, and urban areas. However, the exact definitions differ slightly among sources which can explain some inconsistences in the % cover among the three data sources in the table (maps, NFI, and SFSI data), see Sect. 2.6.
Using Sweden as a test case, this study provides a guide to improved mapping of peat and mineral soils using ALS data across large areas – that can be applied to other boreal forest regions. We have successfully shown in a largely boreal landscape that we can use soil moisture to predict spatial distribution of peat soils more accurately than previous techniques used for the existing national maps. Specifically, these new maps include smaller areas with peat or tree-covered peat soils previously overlooked in earlier maps. This new map of peat soils was developed to support the need for land use management optimization, by incorporating landscape sensitivity and hydrological connectivity into a framework that promotes a rational and sustainable management of organic and wet soil areas. Improved decision-support tools hold the key for land-use management policies, and as we enter the UN Decade on Ecosystem Restoration, mechanistic insights into restoration targets become increasingly important. For example, the peat maps can be used to plan land-use management, such as planning road constructions or off road driving, designing riparian protection zones to optimize the protection of water quality and biodiversity, or guiding the restoration of drained wetlands. According to Minasny et al. (2019), global estimates of soil C stocks have improved over the last decade (Arrouays et al., 2014). But, as digital maps of peatlands are typically of low quality globally, C stock estimates for peatlands vary considerably, between 113 and 612 Pg (Jackson et al., 2017). Improved mapping of peatlands can therefore also answer more fundamental research questions such as improving future estimates of soil carbon stocks.
4.1 Categorical maps – delineation of peat soils
Our categorical peat maps based on predictions from soil wetness were of substantially higher quality compared to the spatial peat distribution from the existing national topographic and Quaternary deposits maps (Table 1). In fact, all evaluation metrics except accuracy and specificity measures (Table 1) were higher for our predicted categorical peat maps. The high specificity for the topographic map is mostly driven by the underprediction of peatlands. For example, the topographic map only overpredicts 39 instances but underpredicts 266 instances, a clear bias toward underprediction (with an overweight of 227 misclassified soil pits). So the high precision for the topographic map is driven by the low number of FP; however, note that the recall for the topographic map was below 50 %. The ≥ 50 cm peat underpredicts peat in 104 instances and overpredicts peat in 135 instances, a fairly balanced distribution of errors with only a slight overweight (n= 31) towards overpredictions. However, this problem was larger for the peat ≥ 30 cm map, with an overweight of 65 plots towards overprediction. The best measure of the overall performance of the map quality (taking into account both over- and underpredictions) is the kappa and MCC, which shows that our predicted maps outperform the topographical and Quaternary deposits maps and that the ≥ 50 cm peat has the highest quality. Kappa and MCC measures are better metrics for overall prediction quality than accuracy, which can give overoptimistic results driven by the larger class (i.e., mineral soil in our case) in this unbalanced dataset, while we are in fact more interested in the smaller class (i.e., peat soil) (Delgado and Tibau, 2019; Chicco and Jurman, 2020). Out of the two measurements, kappa and MCC, MCC is considered the most informative measure (Chicco et al., 2021). We believe it should be standard to publish the raw confusion data (TP, TN, FP, FN) in studies evaluating map quality (Table 1), as that will enable future metastudies to calculate all possible evaluation metrics needed for comparison. This is often neglected in the literature today.
Our predicted peat maps captured smaller peat areas as small as 4 m2 due to the high quality input data of 2 m spatial resolution (Fig. 5a), while the existing traditional maps only include peatlands larger than 2500 m2. While there exist really small topographic hollows (in the order of 4 m2) that can fill up with peat, this is not the typical peat that we were able to map with the new methodology. The visual inspection of the map indicates that the main improvement from traditional maps is that the maps capture the riparian peat or in smaller pockets in the bottom of small valleys (Fig. 5a) where groundwater flow paths converge. These more local-scale peat soils are common in the boreal region, and are sometimes called “cryptic wetlands” (Creed et al., 2003), discrete riparian input points (DRIPS) (Ploum et al., 2018), or groundwater discharge areas (Kuglerova et al., 2014a), and are more connected to mineral soils. Such areas often have higher nutrient status and pH, and more nutrient-demanding plant species (Kuglerova et al., 2016, 2014b; Rydin et al., 1999) than larger mire complexes. In addition, we noted that peat soils seemed to be underestimated in the forested areas in the traditional maps. Black and white aerial photos (or color and infrared – IR) were used for the delineation of peatlands in traditional mapping in combination with field observations – mainly along the roads. As a result, the cartographers interpreted many areas under dense forest canopy as mineral soils, a common misinterpretation when mapping soils from aerial photos. A typical example of such cartographic challenges is provided in Fig. 4d and Appendix A. The flat low-laying areas drained by ditches (Appendix A, Fig. 1c) is a forested peatland area (Appendix A, Fig. 1d), that was misclassified on traditional maps (5D). Therefore, such traditional mapping techniques have likely resulted in underestimation of productive, now forested peatlands. Our peat maps, based on predictions from soil wetness, were mainly based on digital terrain indices and high-resolution laser scanning data (Ågren et al., 2021) that are not restricted by dense forest canopies, and thus could provide much more accurate estimates of peat soils. In addition, the new peat maps also give a much more accurate delineation of the border between for example a flat mire and surrounding drumlins. This is easy to see based on ALS data, while this was more difficult using aerial photos. Our predicted maps therefore capture larger areas of peat soils previously unmapped and had a recall rate in the order of 80 % that can be compared to ca. 50 % and 70 % on topographic and Quaternary deposits maps, respectively.
While the peat ≥ 50 cm map had the highest overall quality, all of the predicted maps (i.e., peat ≥ 30, ≥ 40, and ≥ 50 cm) were qualitatively more or less comparable, at least in comparison to traditional maps (Table 1, Fig. 5b, e), i.e., the spatial overall distribution remained, even if the area covered by peat soils increased when moving from ≥ 50 to ≥ 30 cm peat depth. The delineation of peat soils using peat that is 30, 40, or 50 cm can be valuable depending on the research or management objectives. Even though the error bars in Fig. 3, and an RMSE of 19 cm for the continuous map of the organic layer thickness, indicate that there is some level of uncertainty for the estimates of peat soil depth, the categorical maps still delineated peat soils better than traditional maps (i.e., Quaternary deposits maps and topographical maps). We deem the level of uncertainty to be satisfactory for the horizontal delineation of peatlands; especially if the continuous map are used to highlight the areas where the delineation is more uncertain, i.e., along the borders of the peatlands (see Sect. 4.2). However, given the large RMSE for the depth estimates, and the generally thin layers of organic soils across most of the Swedish forest landscape, we do not suggest to use the depth estimates for carbon stocks.
4.2 Map of the continuous thickness of the organic layer
Categorization is a fundamental mechanism of human cognitive construction (by dividing the subject of interest into groups and comparing them, we form our knowledge of the world) (McGarty et al., 2015). Such categorical divisions, however, may cause overgeneralization and inaccurate representation of the true distributions. We argue that in nature there is often a more gradual shift from mineral soil to peat soil, rather than a clearly defined border. Applying a cubic relationship (Eq. 7), we could model the thickness of the organic layer from the SLU soil moisture map. The high-resolution (2 m) SLU soil moisture map, displaying the probability of a soil being wet, captures the gradual shifts in soil moisture across the natural landscape (Fig. 2). The high quality of the SLU soil moisture map is obtained by combining data from 24 different spatial data sources in a machine learning model (i.e., extreme gradient boosting; Chen et al., 2020) to adjust the map to both regional and local conditions based on the observations from ∼ 16 000 National Forest Inventory (NFI) plots across Sweden. Ågren et al. (2021) found that the SLU soil moisture map captures 79 % of wet soils, suggesting a significant improvement over the existing map products. Hence, the SLU soil moisture map has enabled the possibility of predicting how water follows the flow paths from each ridge into local valleys where the groundwater is concentrated in swales (i.e., cryptic wetlands and riparian peats), to further downstream into flat areas where water gets stagnant with high groundwater levels, typically landscapes with mixed mire complexes. We have now shown that this continuum of hydrological connectivity of the landscape has a significant relationship with the organic layer thickness, and thus can be effective for tracking the distribution of the organic layer thickness in a continuous map (Fig. 5c, f). In the study region, most organic soils are overlaying till deposits, which are highly heterogeneous and often anisotropic. The surface roughness of the underlying till will have a local effect on peat depth, which likely contributes to the relatively high RMSE for the continuous peat depth map. In short, the maps are based on modeling from soil surface data from ALS measurements, while stones, boulders, or ridges made of till can be hidden below the flat peat surface, affecting the peat thickness (Nijp et al., 2019). The relatively high RMSE of 19 cm is also an indication that the delineations of peat soils based on a defined thickness of the organic layer (i.e., ≥ 30, ≥ 40 ,or ≥ 50 cm) are uncertain. We therefore argue that a map based on continuous organic layer thickness (Fig. 5c, f) provides a more realistic representation of peat soil distribution in the natural landscape and comprises a better basis for addressing specific research or management questions. It should be noted that the map will not capture the full depth of the peat deposits; however, this was not the purpose of this mapping analysis. Mean peat thickness in Sweden has been estimated to be 1.52 m in north Sweden, 1.94 m in south-central Sweden, and 2.26 m in south Sweden (Franzen et al., 2012). Therefore, the depth of the organic layers should not be taken literally, but the continuous map can be used to indicate the horizontal distribution of peat soils instead of using a fixed threshold. Light yellow areas on the continuous map are indicative of mineral soils, and brown areas are indicative of peat soils, while the areas that show a rapid change in color are indicative of the transition zone between mineral soils and peatlands (Fig. 5c and f). We argue that this is an intuitive way of illustrating the uncertainty in the borders between mineral and peat soils.
4.3 National estimates of peat coverage for the forest landscape
Our new estimations of peatland coverage for all of Sweden ranged 70 000–94 000 km2 and are better than previous estimates from Quaternary deposits map (58 000 km2) and topographical maps (56 000 km2) (Table 2), given that the maps of ≥ 50, ≥ 40, and ≥ 30 cm peat had a higher quality (Table 1). For the first time, it is possible to produce maps that delineate each individual peat deposit and that give more reasonable estimates of the national peat cover for Sweden. The new maps produce peat estimates for Sweden close to some of the best estimates, based on a combination of data sources and upscaling; 85 023 km2 (Barthelmes et al., 2015) and 63 700–69 200 km2 (Tanneberger et al., 2017). While it is interesting to compare the peat coverage for the national estimates, the predicted maps can only be trusted for the forest landscape, as our study is based on sampling of the forest landscape. The peat coverage estimates will vary depending on the definition used (Table 3), and all sources have uncertainties. However, by calculating several measures we can constrain the national estimates of peat soil coverage on Swedish forest land. In general, there was a strong agreement in the total peat soil area derived from soil wetness-based predictions and from statistical upscaling of the national inventories. The predicted maps from soil moisture have slightly larger areas of peat coverage (77 000±10 000 km2) compared with the estimations from the NFI and SFSI surveys (67 000±14 000 km2), but lower than earlier estimates from NFI; 83 000 km2 (Hånell, 2009) and 100 000 km2 (including peaty mor) (Hånell, 1990). One potential explanation why the maps predict larger areas than peat coverage from NFI can be that isolated peat soil patches smaller than 25 m2 are disregarded in the NFI survey, while our maps predict peat areas as small as 4 m2. It can therefore be assumed that many of the smaller peatland features such as riparian peat or peat in local pits/swales to a certain degree are disregarded in the NFI data but are included in our new map predictions. Given an RMSE of 19 cm for the continuous map, we argue that one should not analyze different peat depth maps estimates in detail, rather all the different estimates can be used to constrain the uncertainty in the peatland estimates. The peat coverage of Swedish forest land according to all estimates is 71 000±12 000 km2 (22±4 %). In addition, on agricultural land the total area of peat soil used in agricultural production is estimated to be 2257 km2 (7 % of the total agricultural area) of which 80% is used as arable land and 20 % for pasture (Minasny et al., 2019). Another estimate of agricultural peat and gyttja soils in Sweden is 3015 km2 (Berglund and Berglund, 2010). Furthermore, the alpine region above the birch forest is estimated to have 3040 km2 of peatlands, but these numbers are uncertain due to few observations (Löfgren, 1998). A clear advantage with our method of mapping peatlands compared with previous maps generated from NFI data is that our new method for the first time allows for a delineation of all peat soils across Sweden, while maps from NFI data traditionally only show statistical fractions of peat coverage per land area at county scale, i.e., not spatially explicit distribution (Nilsson et al., 2001; Olsson, 1999).
4.4 The novelty of the developed maps
A recent review of digital mapping of peatlands shows that there has been a successive increase in our ability to map peatlands globally via digital mapping using remote sensing and satellites such as Landsat, Sentinel, and MODIS (10–1000 m resolution), or using satellites that measure earth's surface moisture (Gravity Recovery And Climate Experiment (GRACE) available at about 50 km resolution, and Soil Moisture Active Passive (SMAP) available at 3 km resolution) (Minasny et al., 2019). While the coarse resolution satellite data may be useful for continental or global mapping, it is not adequate for detailed planning of land-use management. Moreover, the review showed that while it is common to delineate peat extent, studies rarely perform validation or calculations of the uncertainty of the predictions (Minasny et al., 2019). Here, we present a novel way of delineating peatlands across an entire country, at a very fine spatial resolution (2 m), in addition we validate the maps using a separate evaluation dataset and several evaluation metrics (Table 1). Furthermore, we calculate several estimates of the peatland coverage of the Swedish forest landscape which allows us to constrain the estimates (Table 3). Schönauer et al. (2022), recently showed that by combining airborne laser data with other map sources and AI models, they could produce accurate soil moisture maps for six study areas in Finland, Germany, and Poland. By applying an XGBoost machine learning model for predicting soil moisture, they predicted 74 % of wet values correctly, a significant improvement compared to depth-to-water maps that predicted 38 % of wet values correctly. As the number of countries that have wide-area public lidar datasets are increasing in the northern boreal zone (Cohen et al., 2020) and new methods of mapping soil moisture using machine learning from a combination of data sources (Schönauer et al., 2022; Ågren et al., 2021) are being developed, this study can provide a benchmark for new and improved peatland maps of the northern boreal zone at a nationwide scale. This can bridge an important research gap between global-scale mapping using satellites on a coarse scale, and detailed field-scale mapping (Minasny et al., 2019).
An empirical relationship between the thickness of the organic layer and the continuous SLU soil moisture map (R2= 0.66, p < 0.001) was used to generate three categorical maps of peat distribution in Sweden (using peat depths of ≥ 30, 40, or 50 cm, respectively, as thresholds). The developed peat maps had a higher overall quality (MCC = 0.73) compared to traditional Quaternary deposits maps (MCC = 0.65) and topographical maps (MCC = 0.61), and captured more of the peatlands with a recall of ca. 80 % compared to 50 %–70 % on the traditional maps. The ability to map smaller-scale peatlands as fine as 4 m2 and the fact that our predicted peat maps were not restricted by dense forest canopies (as our maps were based on high-resolution digital terrain indices) together provided better estimates of peat soils that nearly doubled the accounting of peat soil areas for Sweden compared to other national map products. We also provided a continuous map of the organic layer depth, ranging from 6–88 cm, with an R2 of 0.67 and RMSE of 19 cm. This continuous map exhibits a smooth transition from mineral to peat soils and provides an intuitive uncertainty estimate in the horizontal delineation of peat soils. Finally, by calculating several measures of peat soils, we can constrain the uncertainties in the national estimates of peat soils in the Swedish forest landscape to 71 000±12 000 km2 or 22±4 %.
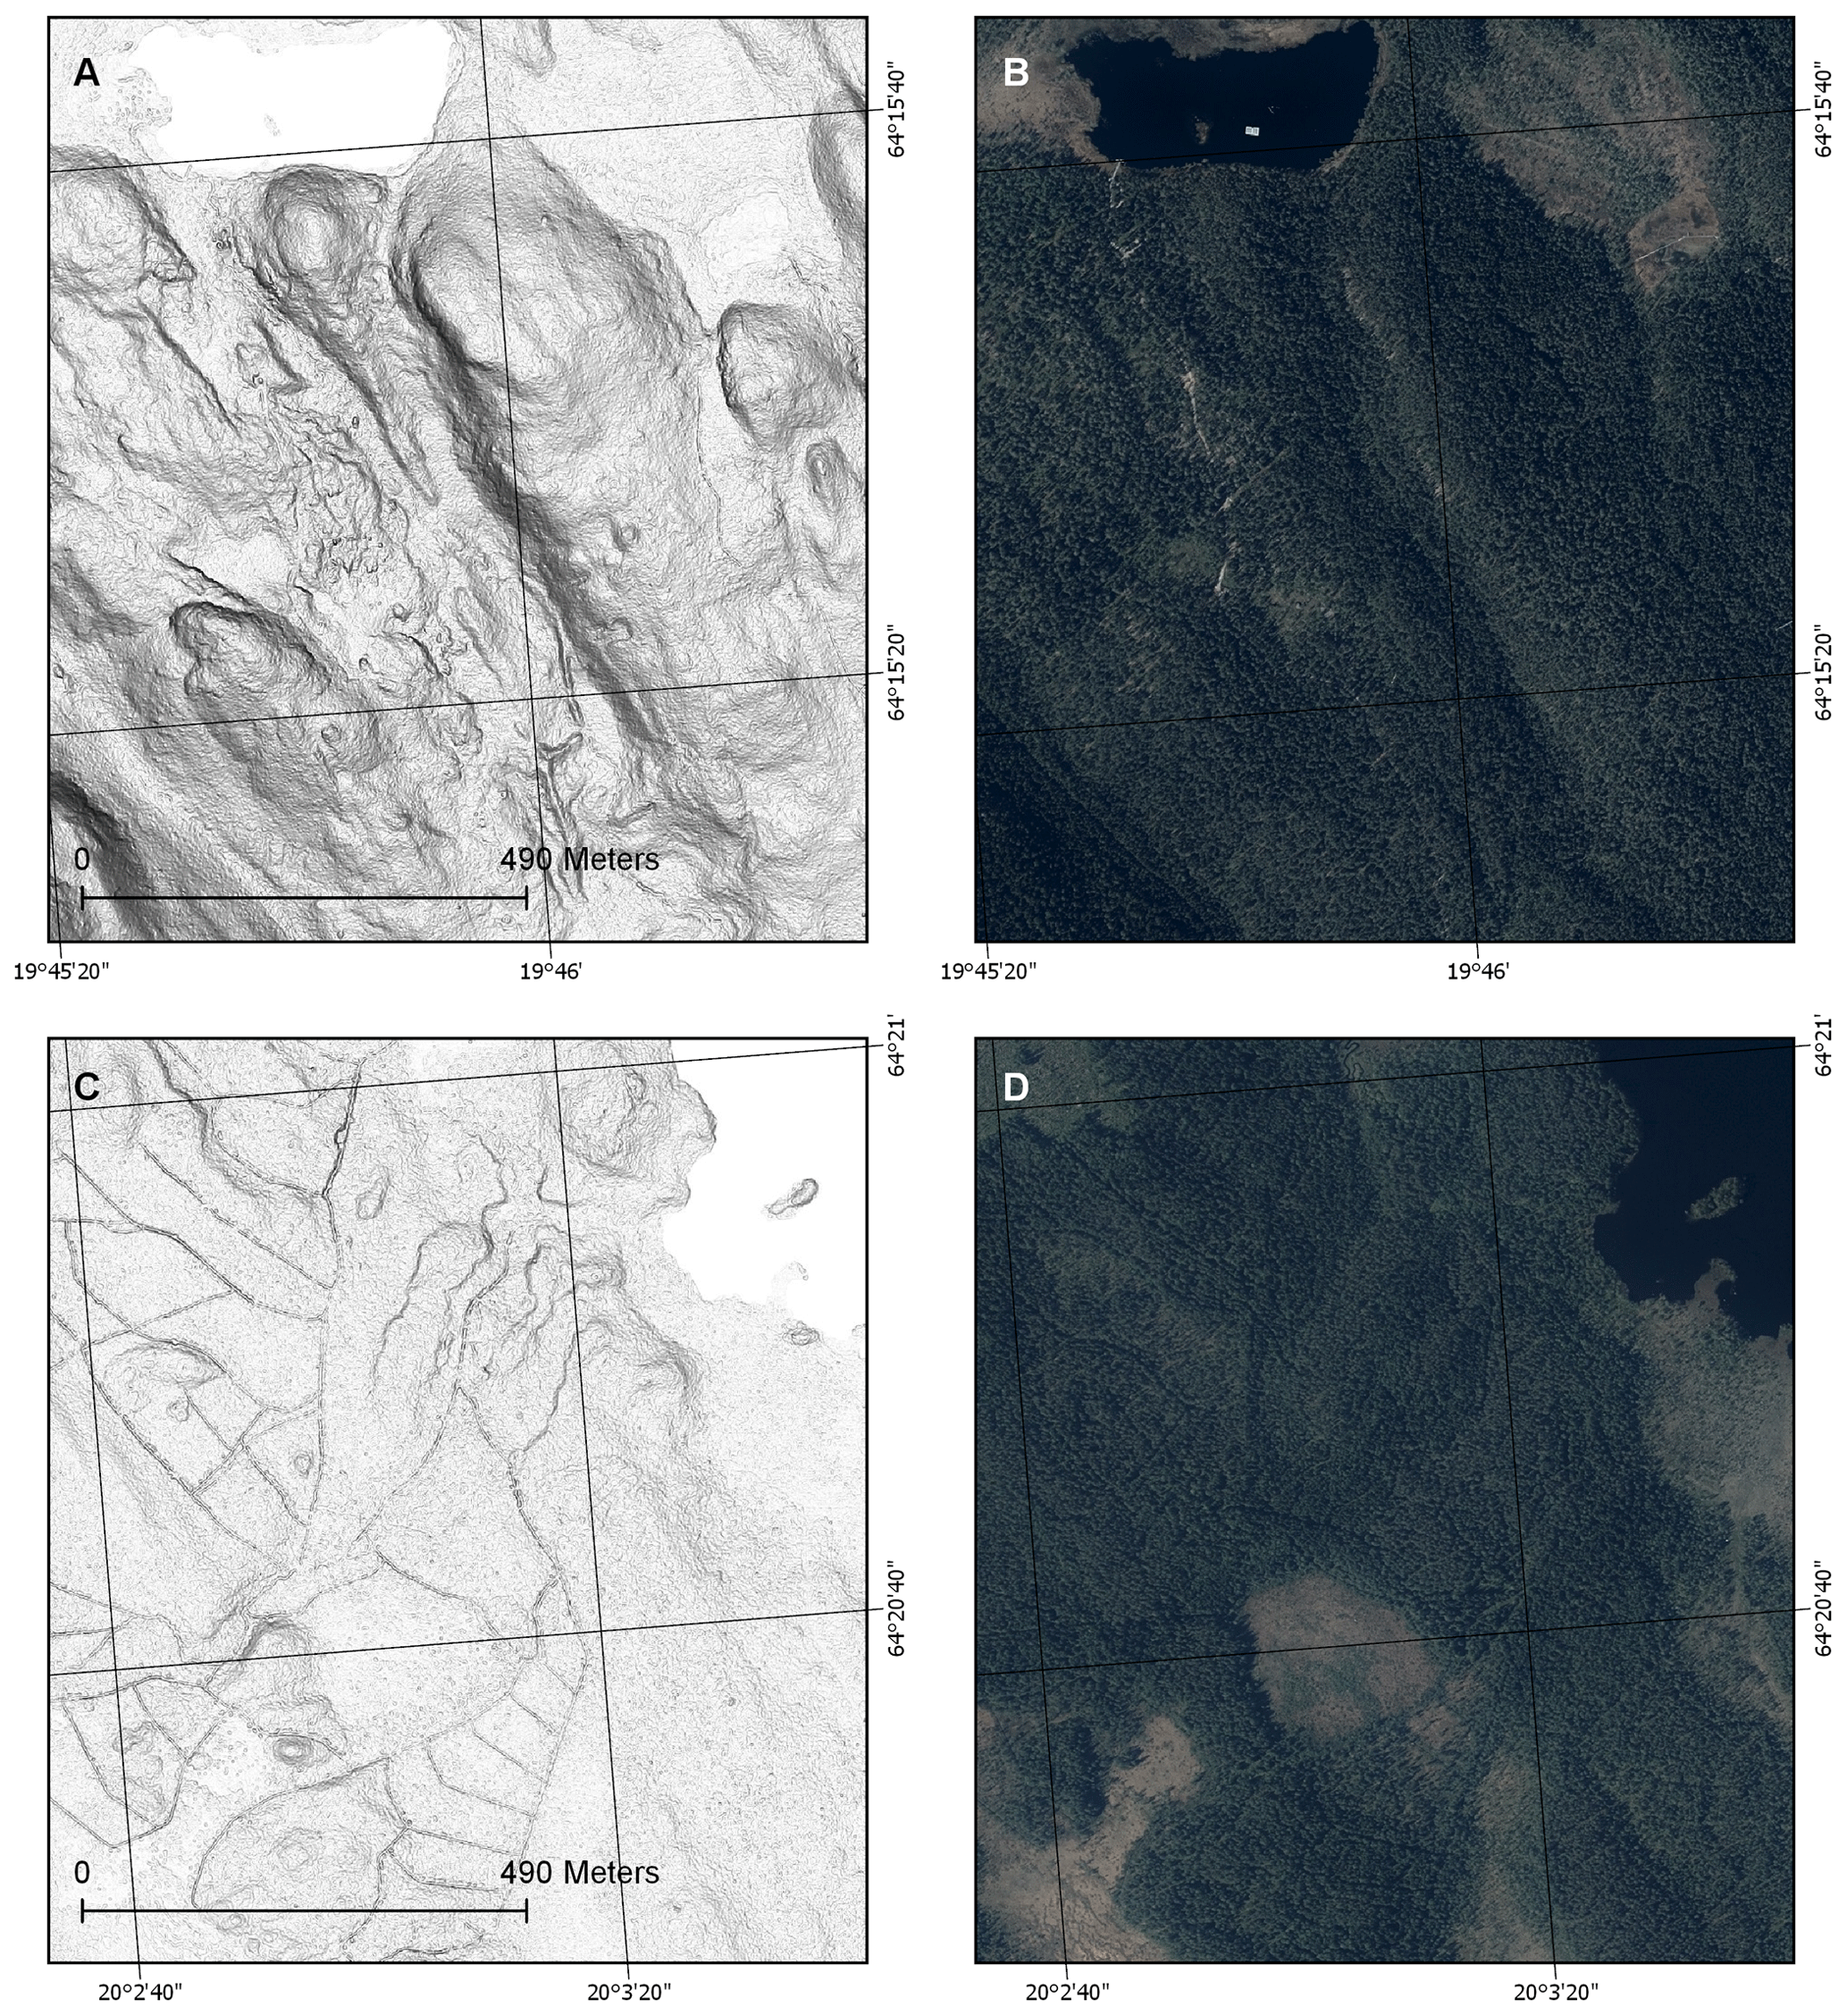
Figure A1Hillshade and aerial photo of the two mapped areas shown in Fig. 5. © Lantmäteriet.
The SLU soil moisture maps that underlie this study are open data (https://www.slu.se/mfk, Sveriges lantbruksuniversitet/Swedish University of Agricultural Sciences, 2022).
AMÅ conceptualized the study, developed the methodology, ran the statistical analysis, produced the maps, wrote original draft, produced maps and visualizations, and acquired the funding. EMH contributed to the writing of the article and funded part of the study. JS contributed to the methodology, the SFSI upscaling peat estimates, and writing of the article. MBN contributed to the writing of the article. SSP developed the methodology, ran statistical analysis, produced maps, and contributed to the writing of the article.
The contact author has declared that none of the authors has any competing interests.
Publisher's note: Copernicus Publications remains neutral with regard to jurisdictional claims in published maps and institutional affiliations.
We would like to thank the staff at the Swedish Forest Soil Inventory for providing the data for this article and Jonas Dahlgren at NFI, who calculated the peatland cover from the NFI data (Sect. 2.6).
This research has been supported by the Svenska Forskningsrådet Formas (grant nos. 2019-00173, 2021-00115, 2021-00713, 2018-00723, and 2016-00896) and the Knut och Alice Wallenbergs Stiftelse (grant no. 2018.0259).
This paper was edited by David Dunkerley and reviewed by two anonymous referees.
Ågren, A. M., Larson, J., Paul, S. S., Laudon, H., and Lidberg, W.: Use of multiple LIDAR-derived digital terrain indices and machine learning for high-resolution national-scale soil moisture mapping of the Swedish forest landscape, Geoderma, 404, 115280, https://doi.org/10.1016/j.geoderma.2021.115280, 2021.
Arrouays, D., Grundy, M. G., Hartemink, A. E., Hempel, J. W., Heuvelink, G. B. M., Hong, S. Y., Lagacherie, P., Lelyk, G., McBratney, A. B., McKenzie, N. J., Mendonca-Santos, M. d. L., Minasny, B., Montanarella, L., Odeh, I. O. A., Sanchez, P. A., Thompson, J. A., and Zhang, G.-L.: Chapter Three – GlobalSoilMap: Toward a Fine-Resolution Global Grid of Soil Properties, in: Advances in Agronomy, edited by: Sparks, D. L., Academic Press, 93–134, https://doi.org/10.1016/B978-0-12-800137-0.00003-0, 2014.
Astrup, R., Bernier, P. Y., Genet, H., Lutz, D. A., and Bright, R. M.: A sensible climate solution for the boreal forest, Nat. Clim. Change, 8, 11–12, https://doi.org/10.1038/s41558-017-0043-3, 2018.
Barthelmes, A., Couwenberg, J., Risager, M., Tegetmeyer, C., and Joosten, H.: Peatlands and Climate in a Ramsar Context: A Nordic-Baltic Perspective, Nordic Council of Ministers, ISBN 978-92-893-4196-7, 2015.
Beaulne, J., Garneau, M., Magnan, G., and Boucher, E.: Peat deposits store more carbon than trees in forested peatlands of the boreal biome, Sci. Rep.-UK, 11, 2657, 2021.
Beck, H. E., Zimmermann, N. E., McVicar, T. R., Vergopolan, N., Berg, A., and Wood, E. F.: Present and future Koppen-Geiger climate classification maps at 1-km resolution, Sci. Data, 5, 180214, https://doi.org/10.1038/sdata.2018.214, 2018.
Behrens, T., Schmidt, K., MacMillan, R. A., and Rossel, R. A. V.: Multi-scale digital soil mapping with deep learning, Sci. Rep.-UK, 8, 15244, https://doi.org/10.1038/s41598-018-33516-6, 2018.
Berglund, O. and Berglund, K.: Distribution and cultivation intensity of agricultural peat and gyttja soils in Sweden and estimation of greenhouse gas emissions from cultivated peat soils, Geoderma, 154, 173–180, https://doi.org/10.1016/j.geoderma.2008.11.035, 2010.
Burton, R. G. O.: The peat resources of Great Britain (Scotland, England and Wales and Isle of Man), in: Global Peat Resources, edited by: Lappalainen, E., International Peat Society, Jyskä, Finland, 79–86, ISBN 952-90-7487-5, 1996.
Chen, T., He, T., Benesty, M., Khotilovich, V., Tang, Y., Cho, H., Chen, K., Mitchell, R., Cano, I., Zhou, T., Li, M., Xie, J., Lin, M., Geng, Y., and Li, Y.: xgboost: Extreme Gradient Boosting, R package version 1.0.0.2, CRAN repository [code] , https://mran.microsoft.com/snapshot/2020-05-05/web/packages/xgboost/index.html (last access: 25 November 2022), 2020.
Cheng, K., Xu, X. R., Cui, L. Q., Li, Y. P., Zheng, J. F., Wu, W. N., Sun, J. F., and Pan, G. X.: The role of soils in regulation of freshwater and coastal water quality, Philos. T. R. Soc. B, 376, 20200176, https://doi.org/10.1098/rstb.2020.0176, 2021.
Chicco, D. and Jurman, G.: The advantages of the Matthews correlation coefficient (MCC) over F1 score and accuracy in binary classification evaluation, BMC Genomics, 21, 6, https://doi.org/10.1186/s12864-019-6413-7, 2020.
Chicco, D., Warrens, M. J., and Jurman, G.: The Matthews Correlation Coefficient (MCC) is More Informative Than Cohen's Kappa and Brier Score in Binary Classification Assessment, IEEE Access, 9, 78368–78381, https://doi.org/10.1109/ACCESS.2021.3084050, 2021.
Cohen, A., Klassen, S., and Evans, D.: Ethics in Archaeological Lidar, Journal of Computer Applications in Archaeology, 3, 76–91, https://doi.org/10.5334/jcaa.48, 2020.
Cohen, J.: A coefficient of agreement for nominal scales, Educ. Psychol. Meas., 20, 37–46, 1960.
Creed, I. F., Sanford, S. E., Beall, F. D., Molot, L. A., and Dillon, P. J.: Cryptic wetlands: integrating hidden wetlands in regression models of the export of dissolved organic carbon from forested landscapes, Hydrol. Process., 17, 3629–3648, https://doi.org/10.1002/hyp.1357, 2003.
Cruickshank, M. M. and Tomlinson, R. W.: Peatland in Northern Ireland: inventory and prospect, Irish Geography, 23, 17–30, https://doi.org/10.1080/00750779009478763, 1990.
Delgado, R. and Tibau, X. A.: Why Cohen's Kappa should be avoided as performance measure in classification, Plos One, 14, e0222916, https://doi.org/10.1371/journal.pone.0222916, 2019.
Dinerstein, E., Olson, D., Joshi, A., Vynne, C., Burgess, N. D., Wikramanayake, E., Hahn, N., Palminteri, S., Hedao, P., Noss, R., Hansen, M., Locke, H., Ellis, E. C., Jones, B., Barber, C. V., Hayes, R., Kormos, C., Martin, V., Crist, E., Sechrest, W., Price, L., Baillie, J. E. M., Weeden, D., Suckling, K., Davis, C., Sizer, N., Moore, R., Thau, D., Birch, T., Potapov, P., Turubanova, S., Tyukavina, A., de Souza, N., Pintea, L., Brito, J. C., Llewellyn, O. A., Miller, A. G., Patzelt, A., Ghazanfar, S. A., Timberlake, J., Klöser, H., Shennan-Farpón, Y., Kindt, R., Lillesø, J.-P. B., van Breugel, P., Graudal, L., Voge, M., Al-Shammari, K. F., and Saleem, M.: An Ecoregion-Based Approach to Protecting Half the Terrestrial Realm, BioScience, 67, 534–545, https://doi.org/10.1093/biosci/bix014, 2017.
Franzen, L. G., Lindberg, F., Viklander, V., and Walther, A.: The potential peatland extent and carbon sink in Sweden, as related to the Peatland/Ice Age Hypothesis, Mires Peat, 10, 1–19, 2012.
Fridman, J., Holm, S., Nilsson, M., Nilsson, P., Ringvall, A. H., and Ståhl, G.: Adapting National Forest Inventories to changing requirements – the case of the Swedish National Forest Inventory at the turn of the 20th century, Silva Fenn, 48, 1095, https://doi.org/10.14214/sf.1095, 2014.
Gunnarsson, U. and Löfroth, M.: Våtmarksinventeringen – resultat från 25 års inventeringar Nationell slutrapport för våtmarksinventeringen (VMI) i Sverige, Stockholm, 120, ISBN 978-91-620-5925-5, 2009 (in Swedish).
Hirvas, H., Lagerbäck, R., Mäkinen, K., Nenonen, K., Olsen, L., Rodhe, L., and Thoresen, M.: The Nordkalott Project: studies of Quaternary geology in northern Fennoscandia, Boreas, 17, 431–437, https://doi.org/10.1111/j.1502-3885.1988.tb00560.x, 1988.
Hounkpatin, K. O. L., Stendahl, J., Lundblad, M., and Karltun, E.: Predicting the spatial distribution of soil organic carbon stock in Swedish forests using a group of covariates and site-specific data, SOIL, 7, 377–398, https://doi.org/10.5194/soil-7-377-2021, 2021.
Hånell, B.: Torvtäckta marker, dikning och sumpskogar i Svergie, Sveriges Lantbruksuniversitet, Umeå, 6, ISSN 0280-7408, 1990.
Hånell, B.: Bilaga 4 – Möjligheterna till höjning av skogsproduktionen i Sverige genom dikesrensning, dikning och gödsling av torvmarker, in: Skogsskötsel för ökad tillväxt, Faktaunderlag till MINT utredningen, edited by: Fahlvik, N., Johansson, U., and Nilsson, U., SLU, Alnarp, 26, ISBN 978-91-86197-43-8, 2009.
Imbrie, J., Berger, A., Boyle, E. A., Clemens, S. C., Duffy, A., Howard, W. R., Kukla, G., Kutzbach, J., Martinson, D. G., Mcintyre, A., Mix, A. C., Molfino, B., Morley, J. J., Peterson, L. C., Pisias, N. G., Prell, W. L., Raymo, M. E., Shackleton, N. J., and Toggweiler, J. R.: On the Structure and Origin of Major Glaciation Cycles 2. The 100,000-Year Cycle, Paleoceanography, 8, 699–735, https://doi.org/10.1029/93PA02751, 1993.
Ivanov, K. E.: Water movement in mirelands, Academic Press, London England, translated by: Arthur Thomson and Ingram, H. A. P., 276, ISBN 0123764602, 1981.
Jackson, R. B., Lajtha, K. Crow, S. E. Hugelius, G. Kramer, M. G., and Pineiro G.: The Ecology of Soil Carbon: Pools, Vulnerabilities, and Biotic and Abiotic Controls, Annu. Rev. Ecol. Evol. S., 48, 419–445, https://doi.org/10.1146/annurev-ecolsys-112414-054234, 2017.
Jenny, H.: Factors of Soil Formation – A System of Quantitative Pedology, Dover Publications, Inc., New York, ISBN 0486681289, 1941.
Joosten, H. and Clarke, D.: Wise use of mires and peatlands – Background and principles including a framework for decision-making, Saarijärvi, Finland, 304, ISBN 951-97744-8-3, 2002.
Karlsson, C., Sohlienius, G., and Peterson Becher, G.: Handledning för jordartsgeologiska kartor och databaser över Sverige, Sveriges Geologiska Undersökning, Uppsala, 83, https://resource.sgu.se/dokument/publikation/sgurapport/sgurapport202117rapport/s2117-rapport.pdf (last access: 29 November 2022), 2021 (in Swedish).
Kuglerova, L., Ågren, A., Jansson, R., and Laudon, H.: Towards optimizing riparian buffer zones: Ecological and biogeochemical implications for forest management, Forest Ecol. Manag., 334, 74–84, https://doi.org/10.1016/j.foreco.2014.08.033, 2014a.
Kuglerova, L., Jansson, R., Ågren, A., Laudon, H., and Malm-Renofalt, B.: Groundwater discharge creates hotspots of riparian plant species richness in a boreal forest stream network, Ecology, 95, 715–725, https://doi.org/10.1890/13-0363.1, 2014b.
Kuglerova, L., Dynesius, M., Laudon, H., and Jansson, R.: Relationships Between Plant Assemblages and Water Flow Across a Boreal Forest Landscape: A Comparison of Liverworts, Mosses, and Vascular Plants, Ecosystems, 19, 170–184, https://doi.org/10.1007/s10021-015-9927-0, 2016.
Laamrani, A., Valeria, O., Bergeron, Y., Fenton, N., Cheng, L. Z., and Anyomi, K.: Effects of topography and thickness of organic layer on productivity of black spruce boreal forests of the Canadian Clay Belt region, Forest Ecol. Manag., 330, 144–157, https://doi.org/10.1016/j.foreco.2014.07.013, 2014.
Lantmäteriet: Product Description, GSD-Property map, vector, Document version 6.2.7, report, 153, 2020.
Lappalainen, E. and Hänninen, P.: Suomen turvevarat, The peat reserves of Finland, Espoo, Finland, 133, 1–19, 1993.
Latifovic, R., Pouliot, D., and Campbell, J.: Assessment of Convolution Neural Networks for Surficial Geology Mapping in the South Rae Geological Region, Northwest Territories, Canada, Remote Sens.-Basel, 10, 1–19, https://doi.org/10.3390/rs10020307, 2018.
Lidberg, W., Nilsson, M., and Ågren, A.: Using machine learning to generate high-resolution wet area maps for planning forest management: A study in a boreal forest landscape, Ambio, 49, 475–486, https://doi.org/10.1007/s13280-019-01196-9, 2020.
Loisel, J., Yu, Z. C., Beilman, D. W., Camill, P., Alm, J., Amesbury, M. J., Anderson, D., Andersson, S., Bochicchio, C., Barber, K., Belyea, L. R., Bunbury, J., Chambers, F. M., Charman, D. J., De Vleeschouwer, F., Fialkiewicz-Koziel, B., Finkelstein, S. A., Galka, M., Garneau, M., Hammarlund, D., Hinchcliffe, W., Holmquist, J., Hughes, P., Jones, M. C., Klein, E. S., Kokfelt, U., Korhola, A., Kuhry, P., Lamarre, A., Lamentowicz, M., Large, D., Lavoie, M., MacDonald, G., Magnan, G., Makila, M., Mallon, G., Mathijssen, P., Mauquoy, D., McCarroll, J., Moore, T. R., Nichols, J., O'Reilly, B., Oksanen, P., Packalen, M., Peteet, D., Richard, P. J. H., Robinson, S., Ronkainen, T., Rundgren, M., Sannel, A. B. K., Tarnocai, C., Thom, T., Tuittila, E. S., Turetsky, M., Valiranta, M., van der Linden, M., van Geel, B., van Bellen, S., Vitt, D., Zhao, Y., and Zhou, W. J.: A database and synthesis of northern peatland soil properties and Holocene carbon and nitrogen accumulation, Holocene, 24, 1028–1042, https://doi.org/10.1177/0959683614538073, 2014.
Löfgren, P.: Skogsmark, samt träd- och buskmark inom fjällomradet, Arbetsrapport 34, Sveriges lantbruksuniversitet, Umeå, 13 pp., ISSN 1401-1204, 1998 (in Swedish).
Matthews, B. W.: Comparison of the predicted and observed secondary structure of T4 phage lysozyme, Biochim. Biophys. Acta, 405, 442–451, https://doi.org/10.1016/0005-2795(75)90109-9, 1975.
McGarty, C., Mavor, K. I., and Skorich, D. P.: Social categorization, in: International Encyclopedia of the Social & Behavioral Sciences, edited by: Wright, J. D., 186–191, https://doi.org/10.1016/B978-0-08-097086-8.24091-9, 2015.
Minasny, B., Berglund, O., Connolly, J., Hedley, C., de Vries, F., Gimona, A., Kempen, B., Kidd, D., Lilja, H., Malone, B., McBratney, A., Roudier, P., O'Rourke, S., Rudiyanto, Padarian, J., Poggio, L., ten Caten, A., Thompson, D., Tuve, C., and Widyatmanti, W.: Digital mapping of peatlands – A critical review, Earth-Sci. Rev., 196, 102870, https://doi.org/10.1016/j.earscirev.2019.05.014, 2019.
Nijp, J. J., Metselaar, K. Limpens, J. Bartholomeus, H. M. Nilsson, M. B. Berendse, F., and van der Zee S. E. A. T. M.: High-resolution peat volume change in a northern peatland: Spatial variability, main drivers, and impact on ecohydrology, Ecohydrology, 12, e2114, https://doi.org/10.1002/eco.2114, 2019.
Nilsson, M., Mikkela, C., Sundh, I., Granberg, G., Svensson, B. H., and Ranneby, B.: Methane emission from Swedish mires: National and regional budgets and dependence on mire vegetation, J. Geophys. Res.-Atmos., 106, 20847–20860, https://doi.org/10.1029/2001JD900119, 2001.
Nilsson, T., Lundblad, M., and Karltun, E.: Förändring av torvmarksrelaterade variabler på skogsmark mellan omdreven och taxeringsår – Data från Riksskogstaxeringen (RT) och Markinventeringen (MI), med koppling till vissa klimatdata från SMHI Rapport no 17, Institutionen för mark och miljö, Sveriges Lantbruksuniversitet, Sveriges Metrologiska och Hydrologiska Institut, Norrköping, 62, ISSN 1653-8102, 2018 (in Swedish).
Olsen, L., Sveian, H., Ottesen, D., and Rise, L.: Quaternary glacial, interglacial and interstadial deposits of Norway and adjacent onshore and offshore areas., in: Quaternary Geology of Norway, edited by: Olsen, L., Fredin, O., and Olesen, O., Geological Survey of Norway Special Publication, 79–144, ISBN 978-82-7385-153-6, 2013.
Olsson, B. and Ledwith, M.: National Land Cover Database (NMD) – Product Description, English version, Swedish Environmental Protection Agency, Stockholm, 13, 2020.
Olsson, M.: Soil survey in Sweden, In: Soil resources of Europe, edited by: Bullock, P., Jones, R. J. A., and Montanarella, L., The European Soil Bureau. Research Report No.6, EUR 18991 EN, Joint Research Centre, Ispra, Italy, 145–151, 1999.
Olsson, M. T., Erlandsson, M., Lundin, L., Nilsson, T., Nilsson, A., and Stendahl, J.: Organic Carbon Stocks in Swedish Podzol Soils in Relation to Soil Hydrology and Other Site Characteristics, Silva Fenn., 43, 209–222, https://doi.org/10.14214/sf.207, 2009.
O'Neil, G. L., Goodall, J. L., Behl, M., and Saby, L.: Deep learning Using Physically-Informed Input Data for Wetland Identification, Environ. Modell. Softw., 126, 104665, https://doi.org/10.1016/j.envsoft.2020.104665, 2020.
Pan, Y. D., Birdsey, R. A., Fang, J. Y., Houghton, R., Kauppi, P. E., Kurz, W. A., Phillips, O. L., Shvidenko, A., Lewis, S. L., Canadell, J. G., Ciais, P., Jackson, R. B., Pacala, S. W., McGuire, A. D., Piao, S. L., Rautiainen, A., Sitch, S., and Hayes, D.: A Large and Persistent Carbon Sink in the World's Forests, Science, 333, 988–993, https://doi.org/10.1126/science.1201609, 2011.
Ploum, S. W., Leach, J. A., Kuglerová, L., and Laudon, H.: Thermal detection of discrete riparian inflow points (DRIPs) during contrasting hydrological events, Hydrol. Process., 32, 3049–3050, https://doi.org/10.1002/hyp.13184, 2018.
Pouliot, D., Latifovic, R., Pasher, J., and Duffe, J.: Assessment of Convolution Neural Networks for Wetland Mapping with Landsat in the Central Canadian Boreal Forest Region, Remote Sens.-Basel, 11, 772, https://doi.org/10.3390/rs11070772, 2019.
Prince, A., Franssen, J., Lapierre, J. F., and Maranger, R.: High-resolution broad-scale mapping of soil parent material using object-based image analysis (OBIA) of LiDAR elevation data, Catena, 188, 104422, https://doi.org/10.1016/j.catena.2019.104422, 2020.
Rydin, H. and Jeglum, J. K.: The biology of peatlands, Second edition, Oxford Univesity Press, Oxford, 381, ISBN 9780199603008, 2013.
Rydin, H., Sjörs, H., and Löfroth, M.: Mires, in: Swedish plant geography, edited by: Rydin, H., Snoeijs, P., and Diekmann, M., Acta Phytogeographica Suecica, TK-tryck, Uppsala, 91–112, ISBN 91-72 1 0-084-2, 1999.
Saco, P. M., McDonough, K. R., Rodriguez, J. F., Rivera-Zayas, J., and Sandi, S. G.: The role of soils in the regulation of hazards and extreme events, Philos. T. R. Soc. B, 376, 20200178, https://doi.org/10.1098/rstb.2020.0178, 2021.
Scharlemann, J. P. W., Tanner, E. V. J., Hiederer, R., and Kapos, V.: Global soil carbon: understanding and managing the largest terrestrial carbon pool, Carbon Manag., 5, 81–91, https://doi.org/10.4155/cmt.13.77, 2014.
Schöllin, M. and Daher, K. B.: Land use in Sweden, Seventh edition, Örebro, 183, ISBN 978-91-618-1660-6, 2019.
Schönauer, M., Prinz, R., Väätäinen, K., Astrup, R., Pszenny, D., Lindeman, H., and Jaeger, D.: Spatio-temporal prediction of soil moisture using soil maps, topographic indices and SMAP retrievals, Int. J. Appl. Earth Obs., 108, 102730, https://doi.org/10.1016/j.jag.2022.102730, 2022.
Sewell, P. D., Quideau, S. A., Dyck, M., and Macdonald, E.: Long-term effects of harvest on boreal forest soils in relation to a remote sensing-based soil moisture index, Forest Ecol. Manag., 462, 117986, https://doi.org/10.1016/j.foreco.2020.117986, 2020.
Silver, W. L., Perez, T., Mayer, A., and Jones, A. R.: The role of soil in the contribution of food and feed, Philos. T. R. Soc. B, 376, 20200181, https://doi.org/10.1098/rstb.2020.0181, 2021.
SLU: Field work instructions – Swedish National Forest Inventory and Swedish Soil Inventory, Institutionen för skoglig resurshushållning, Umeå, 237, 2021.
Sveriges lantbruksuniversitet/Swedish University of Agricultural Sciences: SLU Markfuktighetskartor, https://www.slu.se/mfk, last access: 25 November 2022.
Smith, P., Keesstra, S. D., Silver, W. L., Adhya, T. K., De Deyn, G. B., Carvalheiro, L. G., Giltrap, D. L., Renforth, P., Cheng, K., Sarkar, B., Saco, P. M., Scow, K., Smith, J., Morel, J. C., Thiele-Bruhn, S., Lal, R., and McElwee, P.: Soil-derived Nature's Contributions to People and their contribution to the UN Sustainable Development Goals, Philos. T. R. Soc. B, 376, 20200185, https://doi.org/10.1098/rstb.2020.0185, 2021.
Stendahl, J., Berg, B., and Lindahl, B. D.: Manganese availability is negatively associated with carbon storage in northern coniferous forest humus layers, Sci. Rep.-UK, 7, 15487, https://doi.org/10.1038/s41598-017-15801-y, 2017.
Stroeven, A. P., Hattestrand, C., Kleman, J., Heyman, J., Fabel, D., Fredin, O., Goodfellow, B. W., Harbor, J. M., Jansen, J. D., Olsen, L., Caffee, M. W., Fink, D., Lundqvist, J., Rosqvist, G. C., Stromberg, B., and Jansson, K. N.: Deglaciation of Fennoscandia, Quaternary Sci. Rev., 147, 91-121, https://doi.org/10.1016/j.quascirev.2015.09.016, 2016.
Tanneberger, F., Tegetmeyer, C., Busse, S., Barthelmes, A., Shumka, S., Marine, A. M., Jenderedjian, K., Steiner, G. M., Essl, F., Etzold, J., Mendes, C., Kozulin, A., Frankard, P., Milanovic, D., Ganeva, A., Apostolova, I., Alegro, A., Delipetrou, P., Navratilova, J., Risager, M., Leivits, A., Fosaa, A. M., Tuominen, S., Muller, F., Bakuradze, T., Sommer, M., Christanis, K., Szurdoki, E., Oskarsson, H., Brink, S. H., Connolly, J., Bragazza, L., Martinelli, G., Aleksans, O., Priede, A., Sungaila, D., Melovski, L., Belous, T., Saveljic, D., de Vries, F., Moen, A., Dembek, W., Mateus, J., Hanganu, J., Sirin, A., Markina, A., Napreenko, M., Lazarevic, P., Stanova, V. S., Skoberne, P., Perez, P. H., Pontevedra-Pombal, X., Lonnstad, J., Kuchler, M., Wust-Galley, C., Kirca, S., Mykytiuk, O., Lindsay, R., and Joosten, H.: The peatland map of Europe, Mires Peat, 19, 22, https://doi.org/10.19189/MaP.2016.OMB.264, 2017.
WRB: World Reference Base for Soil Resources 2014, update 2015 International soil classification system for naming soils and creating legends for soil maps, World Soil resources reports 106, Food and Agriculture Organization of the United Nations, Rome, 192, ISBN 978-92-5-108369-7, 2015.
Zoltai, S. C., Pollett, F. C., Jeglum, J. K., and Adams, G. D.: Developing a wetland classification for Canada, in: Forest Soils and Forest Land Management. Proceedings of the Fourth North American Forest Soils Conference, 4th North American Forest Soils Conference, Laval University, Laval, Quebec, Canada, August 1973, 497–511, 1975.