the Creative Commons Attribution 4.0 License.
the Creative Commons Attribution 4.0 License.
 | 23 Aug 2022
Dynamics of carbon loss from an Arenosol by a forest to vineyard land use change on a centennial scale
Solène Quéro
Christine Hatté
Sophie Cornu
Adrien Duvivier
Nithavong Cam
Floriane Jamoteau
Daniel Borschneck
Isabelle Basile-Doelsch
Few studies have focused on Arenosols with regard to soil carbon dynamics despite the fact that they represent 7 % of the world's soils and are present in key areas where food security is a major issue (e.g., in Sahelian regions). As for other soil types, land use changes (from forest or grassland to cropland) lead to a loss of substantial soil organic carbon (SOC) stocks and have a lasting impact on the SOC turnover. Here we quantified long-term variations in carbon stocks and their dynamics in a 80 cm deep Mediterranean Arenosol that had undergone a forest-to-vineyard land use change over a 100 years ago. Paired sites of adjacent plots combined with carbon and nitrogen quantification and natural radiocarbon (14C) abundance analyses revealed a C stock of 53 t ha−1 in the 0–30 cm forest soil horizon, which was reduced to 3 t ha−1 after long-term grape cultivation. Total organic carbon in the vineyard was dramatically low, with around 1 g C kg−1, and there was no vertical gradient as a function of depth. 14C showed that deep plowing (50 cm) in the vineyard plot redistributed the remaining carbon both vertically and horizontally. This remaining carbon was old (compared to that of the forest), which had a C:N ratio characteristic of microbial organic matter and was probably stabilized within organomineral associations. Despite the drastic degradation of the organic matter (OM) pool in this Arenosol, this soil would have a high carbon storage potential if agricultural practices, such as grassing or organic amendment applications, were to be implemented within the framework of the 4 per 1000 initiative.
- Article
(8808 KB) - Full-text XML
- BibTeX
- EndNote


Arenosol is one of the 30 soil groups in the FAO soil classification system. Arenosols account for about 7 % of the world's soils and are found mostly under desert, tropical, and Mediterranean climatic conditions. They are silty-sandy or sandy soils, with less than 35 % by volume of coarse elements, exhibit no or partial diagnostic horizon, and are generally 100 cm deep (FAO, 2014). Given their excessive permeability and low nutrient content, agricultural use of Arenosols requires careful management.
The C concentration range in Arenosols is wide, varying in topsoil (0–30 cm) from 100 g kg−1 (Andreetta et al., 2013) to 1 g kg−1 (Fourie et al., 2005; López-Piñeiro, 2013), with topsoil stocks ranging from 80 t C ha−1 (Marschner and Waldemar Wilczynski, 1991) down to 15 t C ha−1 (Muñoz-Rojas et al., 2012). With the average for soils at the global scale being 80 t C ha−1 (Mousset, 2014), Arenosols belong to the soil groups with rather low organic matter content. In addition, and as with other soil types, the conversion from forest or grassland to cropland can lead to up to 50 % native carbon loss in 10 years due to the acceleration of erosion, runoff, and/or mineralization (Lal, 2004; Guillaume et al., 2021; Ramesh et al., 2019; Fourie et al., 2005; López-Piñeiro, 2013). Cropped Arenosols that have lost a large percentage of their pre-cultivation soil organic carbon (SOC) thereby represent a large potential sink for C uptake through the adoption of proper management strategies in the framework of the 4 per 1000 objectives (Zomer et al., 2017). Furthermore, Arenosols are present in key areas for future food production to meet food security objectives (FAO, 2018). Understanding the carbon dynamics in Arenosols is therefore a significant societal challenge. However, few studies to date have focused on C dynamics for this type of soil (Kögel-Knabner and Amelung, 2021).
Soils in a Mediterranean climatic condition that have inherited a long history of viticulture are representative of situations where land use is likely to have affected C dynamics in a very significant way, since vineyards are among the most degraded agricultural crop systems (Giagnoni et al., 2019; Panagos et al., 2015). Nevertheless, SOC studies in vineyards have received less attention as compared to arable and pasture systems (Payen et al., 2021), while viticulture is now a major agricultural growth sector under Mediterranean climatic conditions worldwide (Eldon and Gershenson, 2015). High C losses in Mediterranean vineyards are due to accelerated mineralization, decreased nutrient content, topsoil compaction and reduced water infiltration capacity, enhanced soil erosion rates, accumulation of metals and organic pollutants, and associated loss of soil biodiversity (Bogunovic et al., 2019; Bordoni et al., 2019; Eldon and Gershenson, 2015; Ferreira et al., 2020, 2018; Kratschmer et al., 2018). These degradations are a result of traditional wine-growing practices which involve frequent tillage to minimize weed cover and soil compaction, postharvest removal of crop residues, and high mineral fertilizer and phytopharmaceutical compound application rates (Ferreira et al., 2020).
In order to study the effects of long-term vineyard use on the C dynamics of a soil, it is thus relevant to (1) compare a long-term vine-cultivated soil with its undisturbed native vegetation cover counterpart (paired site strategy, as defined by Eldon and Gershenson, 2015) and, (2) use a geochemical timescale proxy (C isotopes). A rigorous site pair is defined as two plots with different uses on the same soil before land use, under the same climatic conditions, on the same bedrock, and on a flat landscape. However, as these conditions are hard to meet, few studies have been carried out on pairs of soils in strict compliance with the above criteria, let alone over a long period of time to assess significant differences in carbon content between cultivated and forest soils. In the metaanalysis of Eldon and Gershenson (2015), for example, the study times did not exceed 50 years, i.e., a timescale that seems limited in the case of vines where replanting periods are about 70 years.
Concerning the timescale proxy, C isotopes have been used in many studies to study C dynamics at the profile scale. For example, Balesdent et al. (2018) studied paired sites with a change in vegetation from C3 to C4, or vice versa, to assess the age of deep carbon stocks. This is an efficient method but only applicable to specific conditions (difference in 13C isotopic signature between two successive vegetation types). Otherwise, 14C may be applicable to any system to assess the impact of cultivation on carbon dynamics at the decadal (or longer) scale, as it is a function of the carbon age (Trumbore, 2009). Studies that used 14C in a paired soil context showed that cultivation mainly affects young (short turnover) carbon pools in topsoil by promoting their mineralization. Yet more stable (long turnover) carbon pools may also be impacted via their transfer to carbon pools with faster turnover (Poeplau and Don, 2013), thus leading to overall aging of soil organic matter (OM), at least in topsoil (Wang et al., 1999). However, likely due to the high cost of 14C analysis which only allows for a single measurement, studies that also focus on the effect of agricultural practices at the scale of soil layers remain limited (Anon, 2020; Lawrence et al., 2020; Chiti et al., 2016; van der Voort et al., 2016). These samples are often pooled into a single composite sample to overcome heterogeneity issues (Jiang et al., 2020).
The present study was therefore carried out to highlight the impact of the long-term conversion (> 100 years) of a forest to a vineyard on the C dynamics at the profile scale, while focusing on an Arenosol under a Mediterranean climate. We hypothesized that the combination of Arenosol, vineyard, and conventional practices would, overall, have a major impact on C stocks and the dynamics of C remaining in the topsoil and subsoil. To test our hypothesis, we worked on paired soils, measuring the carbon contents and stocks, vertical and intra-horizon heterogeneity of carbon, as measured by 14C, and correlating the C:N ratio and radiocarbon (F14C). These parameters enabled us to (1) determine how vineyard cultivation and deep plowing impact carbon stocks and dynamics in a Mediterranean Arenosol, both at the soil layer and in entire soil profile scales, and (2) use this case study to estimate, according to different calculation hypotheses, the time required for the vineyard soil to recover a C stock equivalent to that prevailing pre-cultivation.
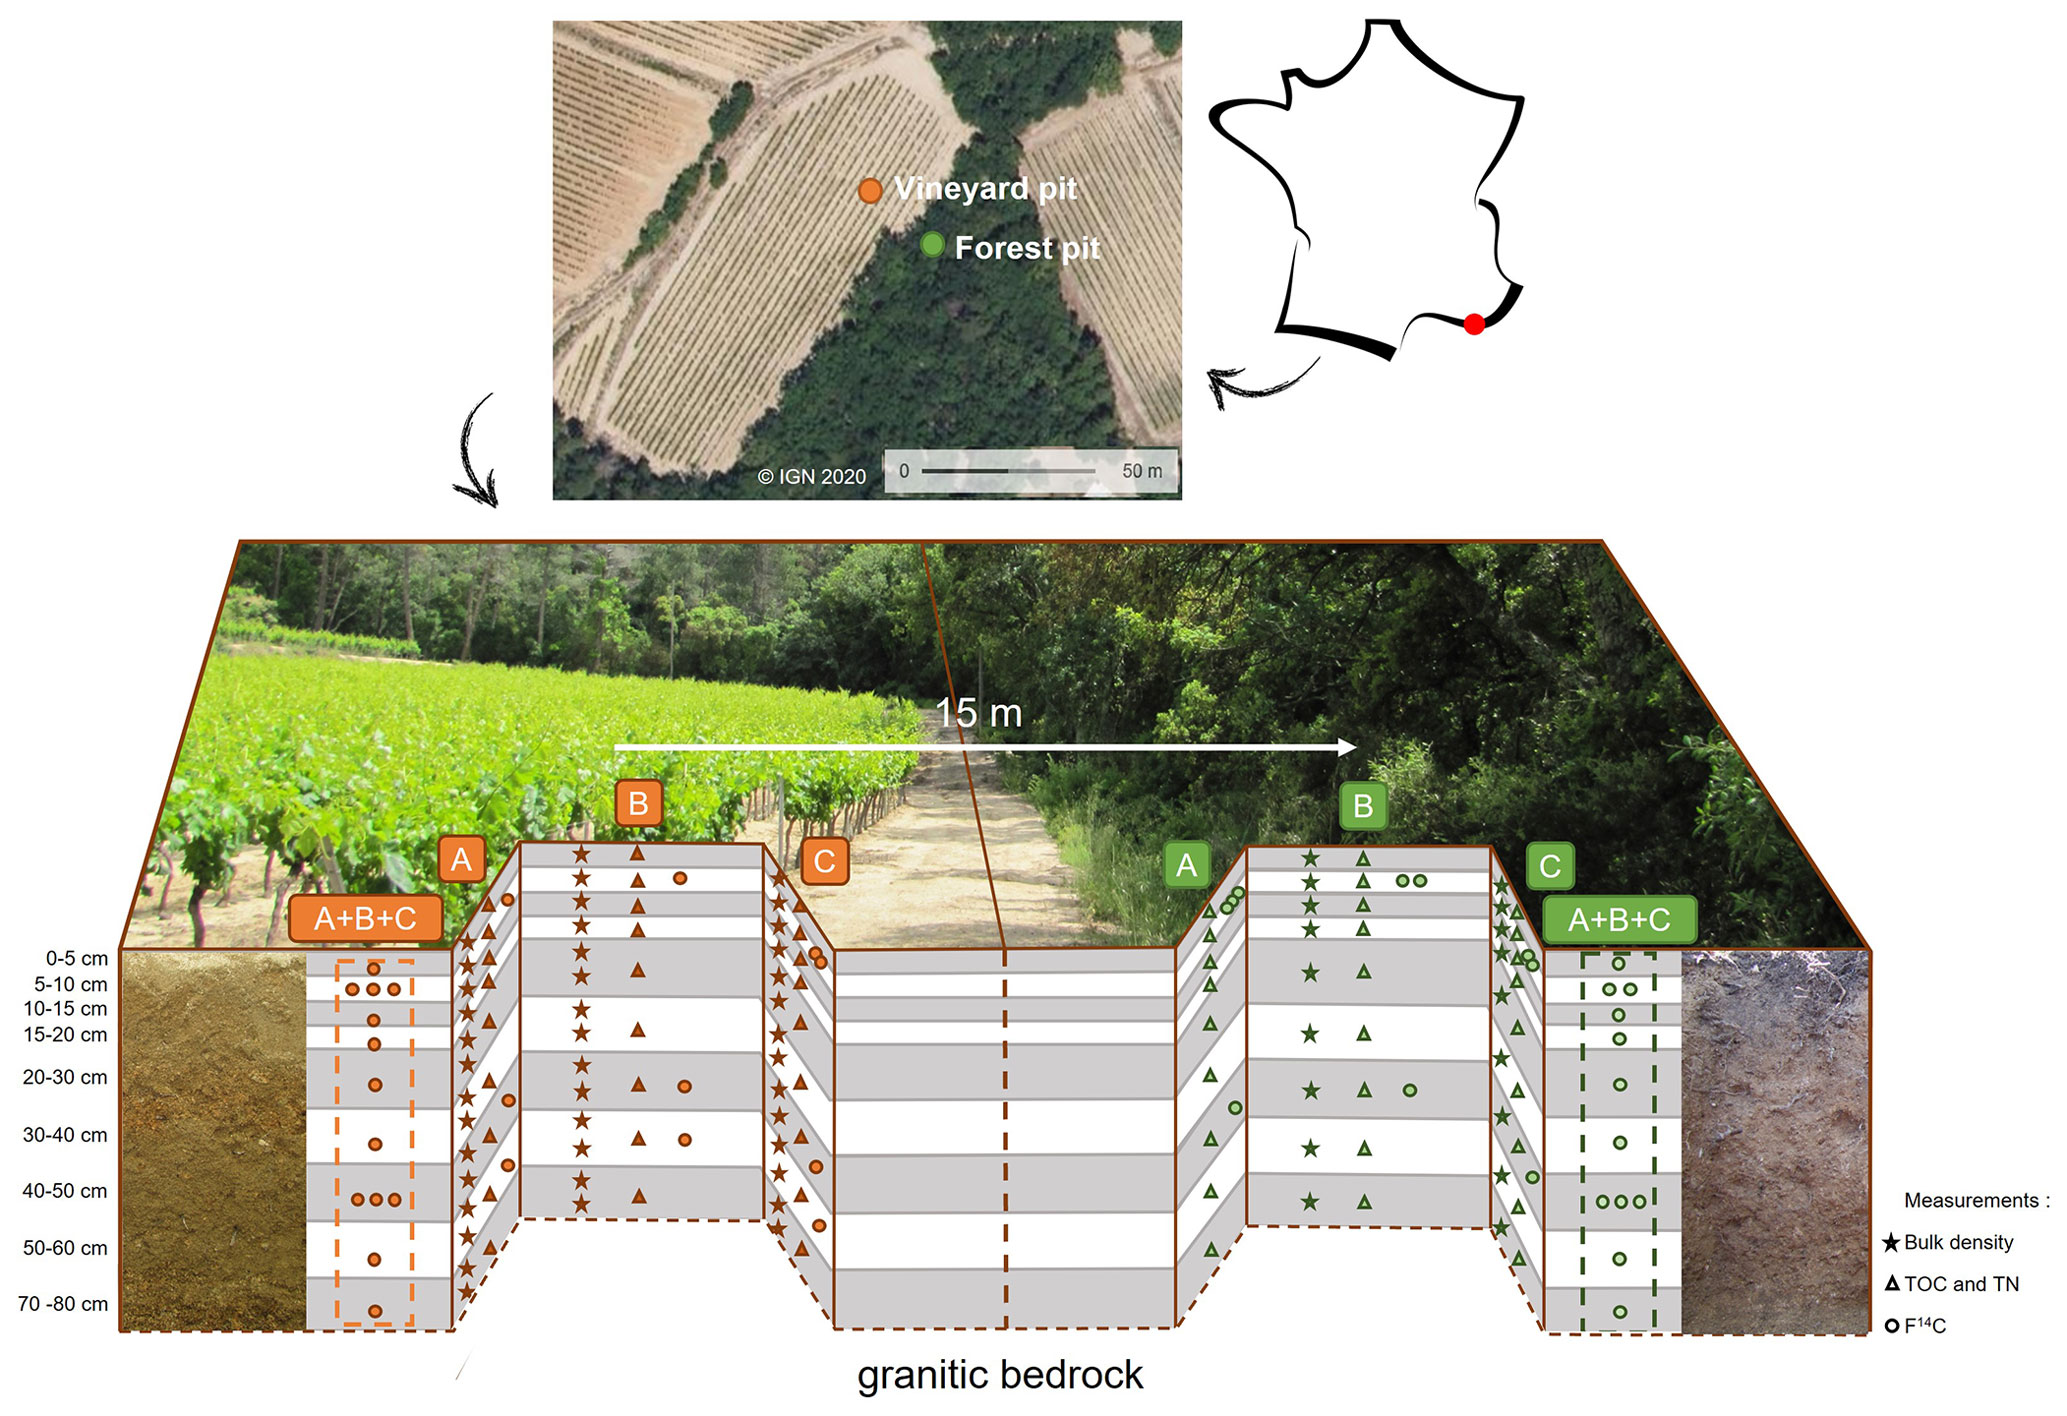
Figure 1Scheme of the pits and sampling in the Brugassières Arenosol under a Mediterranean climate. On the left is a vineyard site (orange symbols), and on the right is forest site (green symbols). A, B, and C represent the three different sampled sides of each pit. Symbols indicate the sampling and analysis for each sampled layer, where stars indicate the sampling in cylinders for bulk density, triangles indicate the sampling for total organic carbon and total nitrogen (TOC and TN), granulometry, and mineralogy, and circles indicate the sampling for analysis in 14C. (A + B + C) represent composite samples resulting from the mixture of samples from the three faces at equal proportions.
2.1 Study area
The study site was located at Le Plan de la Tour, in the Maures Massif (France), under a Mediterranean climate, where −3 ∘C < TWinter < 18 ∘C and TSummer > 22 ∘C, Pdriest month < 40 mm (warm and dry summer Mediterranean climate as per the World Map of the Köppen–Geiger climate classification). The site selection process was carried out in seven successive stages. (1) In the French Mediterranean area, a granitic pluton outcrop was sought to ensure the presence of Arenosols (Fig. A7). (2) In the Le Plan de la Tour granite area, places with adjacent vineyard and forest plots were identified on the basis of satellite images. (3) To ensure that the forest C dynamics were representative of a forest pedogenesis process and not the result of recent afforestation, we only selected sites that were already forested in the 1800s (Napoleonic land register, 1808–1848, and Ordnance Survey map, 1820–1866; see Fig. A8). (4) Among these sites, we only selected those with a comparable topographic situation for the two land uses, ideally with the flattest possible landscape (using topographic map at 1:25 000 scale) in order to minimize differences in C dynamics that could result from differential erosion between vineyards and forests. (5) On the basis of the fieldwork on the five sites selected according to the above criteria, we selected a site (Les Brugassières) according to its accessibility and sampling authorizations. (6) A structural analysis, as is conventionally done in pedology studies (e.g., Humbel, 1987) was performed to identify areas within the plots where the soil had undergone an identical pedogenic evolution process prior to vine planting. The sampling zones were selected with (i) relatively deep soil (about 80 cm), (ii) equivalent soil depths for the two land uses, and (iii) with a short distance (less than 20 m) between the forest and vineyard sampling zones. (7) Finally, we performed a screening (0–30 cm topsoil layer) to assess the homogeneity of the total organic carbon contents in the vineyard plots and adjacent forest. This selection process eliminated all soil variation factors, other than the land use and agricultural practices, at the soil profile scale (according to a paired site strategy, as defined by Eldon and Gershenson, 2015). The soil was a poorly differentiated Arenosol on granite. An analysis of aerial photographs and cadastral maps (from 1813 to present day) showed that these two plots had a history of continuous soil use for at least ∼ 100 years in the case of the forest (with an age of 91 years, as measured by dendrochronology on a cork oak) and more than 150 years in the case of the vineyard (Fig. A3). Additional fieldwork ruled out the effects of terracing at the selected sampling sites. Concerning practices, the vineyard plot had undergone vine uprooting and deep plowing (∼ 50 cm) every 70 years on average. The last plowing was carried out between 1998 and 2003. The soil was bare between rows (Figs. 1 and A3).
2.2 Sampling
There were two pits dug down to the underlying granite parent rock, namely the forest pit (43∘19′37.35′′ N, 6∘32′12.89′′ E), which was 70 cm deep, and the vineyard pit (43∘19′37.74′′ N, 6∘32′11.90′′ E), which was 80 cm deep (Fig. 1). The pits were 15 m apart. The soil particle size and mineralogy were similar at both sites (Figs. B1 and B2). A total of three faces were sampled per pit (A, B, and C). A further nine layers were sampled on each face. Then, 100 mL soil cylinders were taken from the three faces in the vineyard pit and from two faces in the forest pit to determine the bulk density. Above 20 cm, in the forest soil, the water measurement technique was preferred over the cylinder technique due to the high abundance of tree roots. Bulk density samples were oven-dried at 105 ∘C for 3 d before weighing. The profile samples were air-dried (25 ∘C) for 1 week, sieved (2 mm) and weighed to determine the proportion of coarse elements (CEs). Fine soil samples were ground in a planetary mill (50 g for 5 min, including 1 min direction reversal, at 400 rpm, revolutions per minute) down to < 200 µm, and the samples were then quartered. For the 14C analysis, a 3 g composite sample (i.e., a mix of 1 g of A, B, and C) was prepared for each depth range. To test the intra-horizon variability in topsoil and subsoil, 5–10 and 40–50 cm samples in the forest and vineyard, as well as 50–60 cm samples in the vineyard (below the plowing sole), were selected for further analyses (Fig. 1). This variability was used to extrapolate the variability at all depths in the vineyard and forest soils.
2.3 Methods
2.3.1 Carbon and nitrogen measurement and stocks calculation
Approximately 50 mg of fine soil samples were weighted in tin cups for total organic carbon and nitrogen measurements by dry combustion with an elemental analyzer (NF ISO 10694 and 13878, respectively). Soil organic carbon stocks (SOC stocks, t C ha−1) were calculated as follows:
Here i is considered as the layer, and n is the number of layer increments. TOC is carbon concentration in fine soil (g C kg−1), BD is the bulk density (g cm−3), CE is the proportion of coarse elements (0 < CE < 1), and e is the layer thickness (cm; Poeplau et al., 2017).
A correction (Eq. 3) was then applied to compare carbon stocks at equivalent mass and thus eliminate differences in bulk density between the two sites for the same depth (Ellert and Bettany, 1995; Poeplau and Don, 2013; Barré et al., 2020).
The reference soil mass was the layer with the heaviest density. A correction was applied for all cumulative increments from 0 to 60 cm (0–5, 0–10, 0–15, etc.). The correction was performed as follows:
Here n is the number of layer increments. SOC stockcorr is the corrected cumulative SOC stock (t C ha−1), SOC stockn is the uncorrected cumulative SOC stock (t C ha−1), TOCn+1 is the fine soil carbon concentration of the underlying layer, CEn+1 is the proportion of coarse elements (0 < CE < 1) of the underlying layer, Mn-heaviest is the heaviest cumulative fine soil mass (g cm−2) at both sites, and Mn is the cumulative fine soil mass (g cm−2).
2.3.2 Radiocarbon dating
The 14C contents were measured in fine soil using the MIni CArbon DAting System, ECHoMICADAS (Synal et al. 2007; Tisnérat-Laborde et al., 2015). Soil samples were weighed (20–200 mg) in tin capsules and converted into CO2. There were two measurement modes (solid source or gas source) used. (1) The solid source was used for C-rich samples (TOC > 4 g C kg−1 to achieve a C mass of about 1000 µg). CO2 was reduced to C in the presence of H2, using automated graphitization equipment (AGE3) connected to an elemental analyzer (EA; Wacker et al., 2010). Pure graphite was then pressed in the presence of ultrapure iron into a target to be introduced in the solid source. (2) The gas source required less C (30–140 µg) and could be used for both C-rich and C-poor samples. CO2 was directly injected into the ECHoMICADAS gas source through the gas ion source interface (GIS; Ruff et al., 2010) connected to an EA. The radiocarbon data are expressed in a modern F14C fraction, as recommended by Reimer (2004). The range of the variation in the analytical error, expressed as F14C, was between 0.002 and 0.014 and decreased with increasing carbon mass (Fig. C1). The difference between the highest and lowest F14C values for the same depth is expressed by ΔF14C. Many authors have used the Δ14C or conventional radiocarbon age to express 14C (Lawrence et al., 2020); the data expressed in Δ14C and conventional age are thus also shown in the Appendix to facilitate comparison with the literature. All equations for the different units can be found in Appendix C.
Due to the high analytical cost, we opted to use composite samples for all depths. We, thus, obtained a mean 14C value (mean of profiles A, B, and C). However, the composite samples did not enable us to determine the variability in 14C at the scale of the soil layer. We estimated this variability in three layers, i.e., a C-rich topsoil layer (5–10 cm) in the forest and its equivalent depth in the vineyard, a C-poor subsoil layer in the plowed horizons (40–50 cm), and a layer below the plowing horizon for which only the soil in the vineyard was measured (50–60 cm; in view of the 5–10 and 40–50 cm results in the forest, we did not expected that there would be any variability in the forest 50–60 cm F14C).
2.3.3 Statistical analyses
Statistical analyses were performed using the R statistical environment. A Student t test was used to compare, depth by depth, the TOC between the vineyard and forest soils. This test is applicable if the variances are of the same order of magnitude. We therefore performed the test on log 10(TOC) to have similar orders of magnitude in the variances between vineyard and forest soils. A Student t test was also used to compare the C:N levels between the vine and forest soils. We used Spearman's test (no data normality) for the linear regression between F14C and C:N.
We tested the intra-layer variability with a limited number of data, by applying a permutation test on the ratio (with RMS being the residual mean square) calculated on the F14C data. We repeated a permutation test of the RMS ratios 1000 times between forest and vineyard (simulation). The RMS ratio allowed us to compare the degrees of variance between the forest and vineyard findings, which we then compared to the observed ratio value. The permutation test allowed us to test whether the ratio result was significant or not (Manly, 2006).
3.1 Carbon content, C:N ratio, and stocks
The results of the carbon content profiles are presented in Fig. 2a and Table D1. Under the forest, the carbon content and variability were high in topsoil, with 32–51 g C kg−1 in the 0–5 cm layer (mean 42.4 ± 9 g C kg−1), but it decreased with depth down to 1.89–2.70 g C kg−1 in the 50–60 cm layer (mean 2.3 ± 0.4 g C kg−1). Under vines, the carbon content was comparatively very low and equivalent in the A, B, and C profiles throughout the depth. In topsoil (0–5 cm), the TOC ranged from 0.9 to 2.4 g C kg−1 (mean 1.8 ± 0.8 g C kg−1), and at depth (50–60 cm), it ranged from 0.8 to 0.9 g C kg−1 (mean 0.9 ± 0.05 g C kg−1). The TOC values under vines were thus extremely low compared to those under the forest (p < 0.01; Table D2), and this depletion was even observed in subsoil. Under the forest, the average C:N ratio was high, i.e., around 16 in the 0–5 cm layer, and decreased with depth to 10 in the 60–70 cm layer (Fig. 2b). The C:N ratio under vines was significantly different from C:N in the forest horizon (p < 0.1; Table D3) in the 0–50 cm layer. Beyond this depth, the vineyard profile became similar to that under the forest. Finally, stocks in the 0–30 cm layer in the forest soil contained 53.3 t C ha−1, while the vineyard soil contained only 3.3 t C ha−1 (Fig. 2c).
3.2 Radiocarbon dating
The radiocarbon profile results are presented in Fig. 2d (Table D4; Figs. D1 and D2). Young carbon, i.e., younger than the 1960 bomb peak (F14C > 1), was detected in the forest topsoil profile. The carbon age then increased with depth (F14C < 1 around 40 cm). The forest soil profile indicated a conventional undisturbed soil (Jreich, 2018; Mathieu et al., 2015; van der Voort et al., 2016). It showed a belly-shaped curve between 5 and 20 cm depth, which corresponded to penetration of the 14C signal of the bomb peak in the profile. Concerning the variability in a single soil layer, F14C ranged from 1.095 to 1.124 (ΔF14C = 0.029) at 5–10 cm. Meanwhile, at 40–50 cm depth, F14C ranged from 0.974 to 1.005 (ΔF14C = 0.031).
Conversely, the vineyard profile revealed the presence of old carbon from the top to the bottom of the pit (F14C = 0.893 at the top and 0.990 at depth), despite the heterogeneity within the horizons (one point with an F14C > 1 at 40–50 cm). The variation pattern in the profile was not progressive from the topsoil to the depth, contrary to the pattern noted in the forest profile. Under vines, the intra-horizon variability was much more marked than under the forest. In the 0–10 cm layer, F14C ranged from 0.880 to 0.969 (ΔF14C = 0.089), and from 0.909 to 1.081 (ΔF14C = 0.172) at 40–50 cm depth.

Figure 2TOC variations (a), C:N ratio (b), cumulative stocks corrected for equivalent mass (c), and F14C profiles (d) as a function of depth, under vines (orange) and under forest (green), for an Arenosol under a Mediterranean climate. The corrected cumulative SOC stocks error bar represents the standard deviation. The F14C measurement variability (d) is represented by green (forest) and orange (vine) bands.
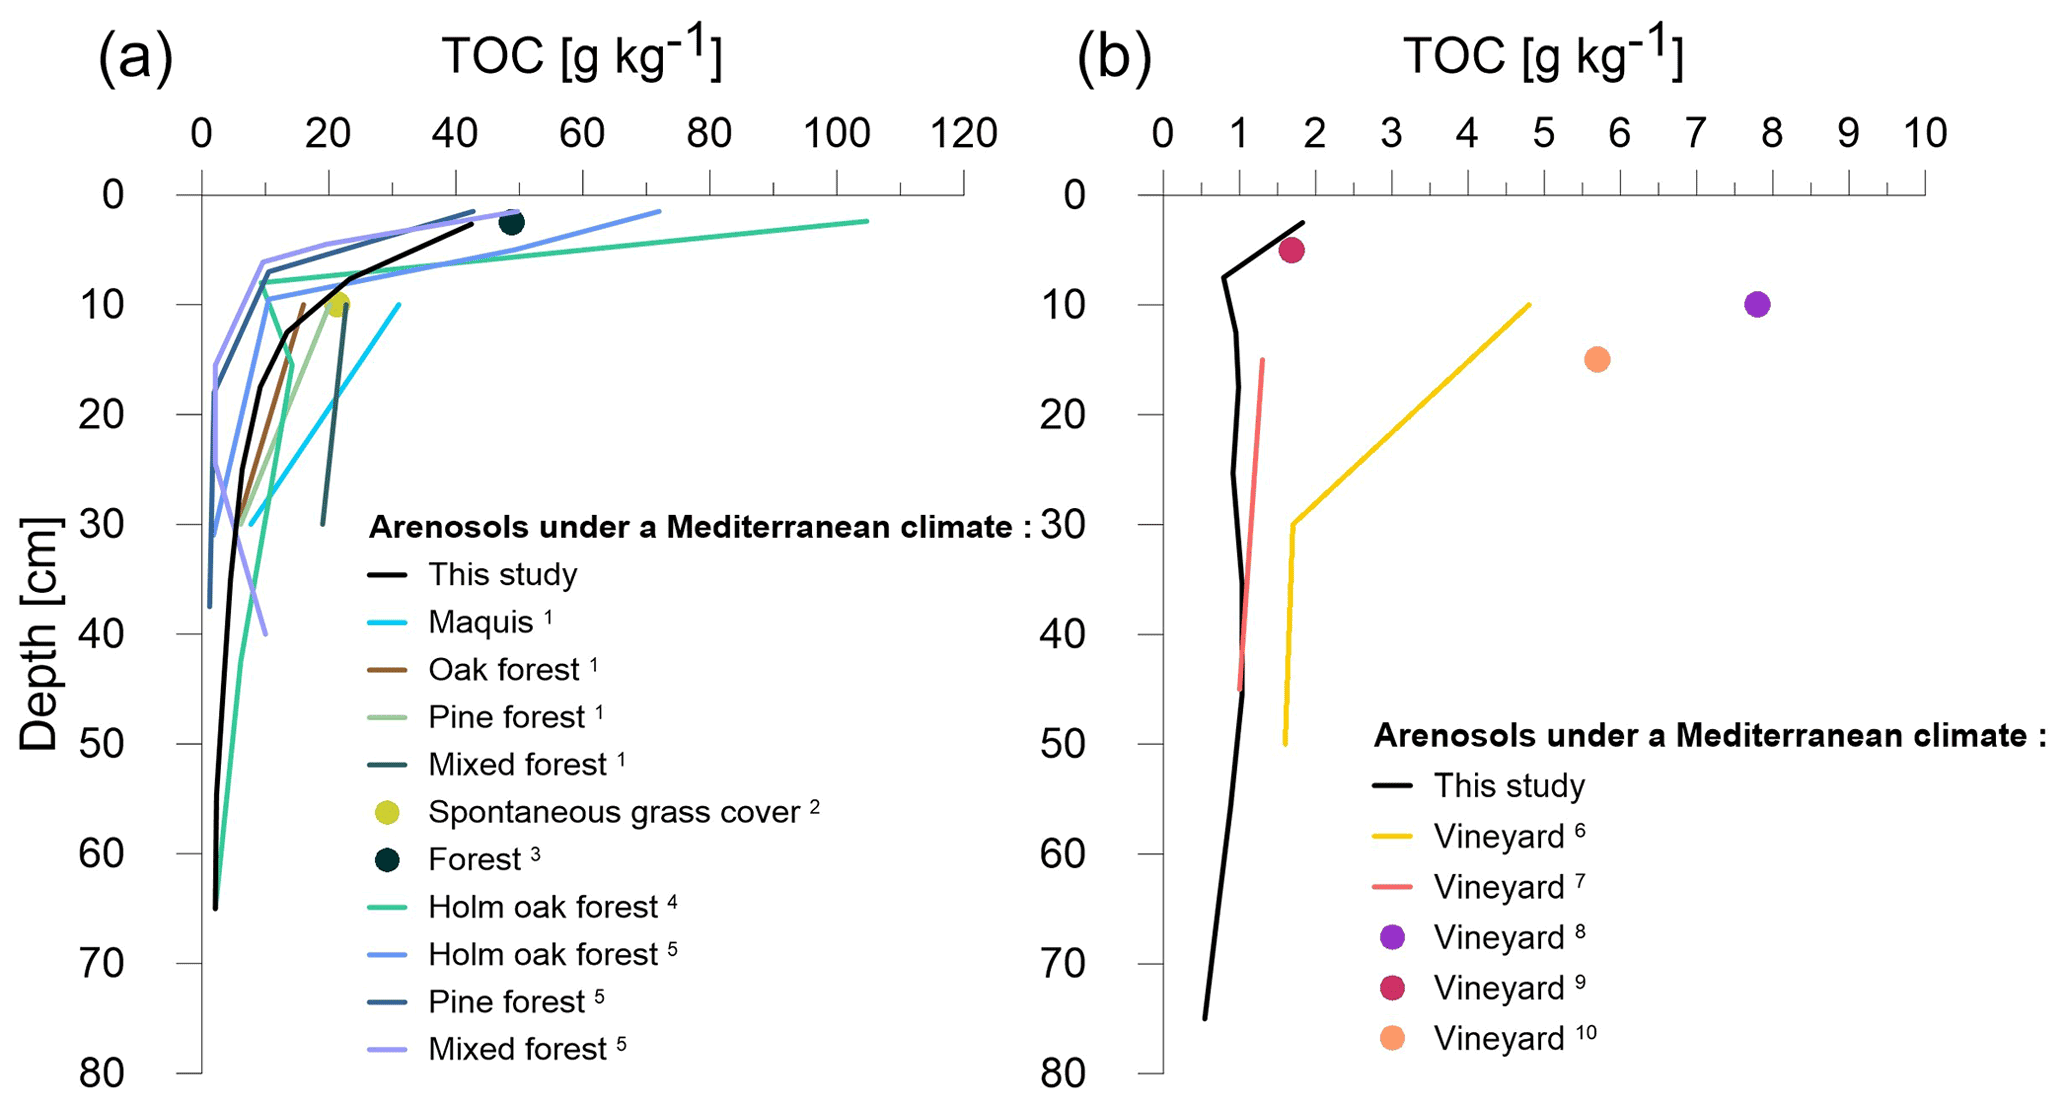
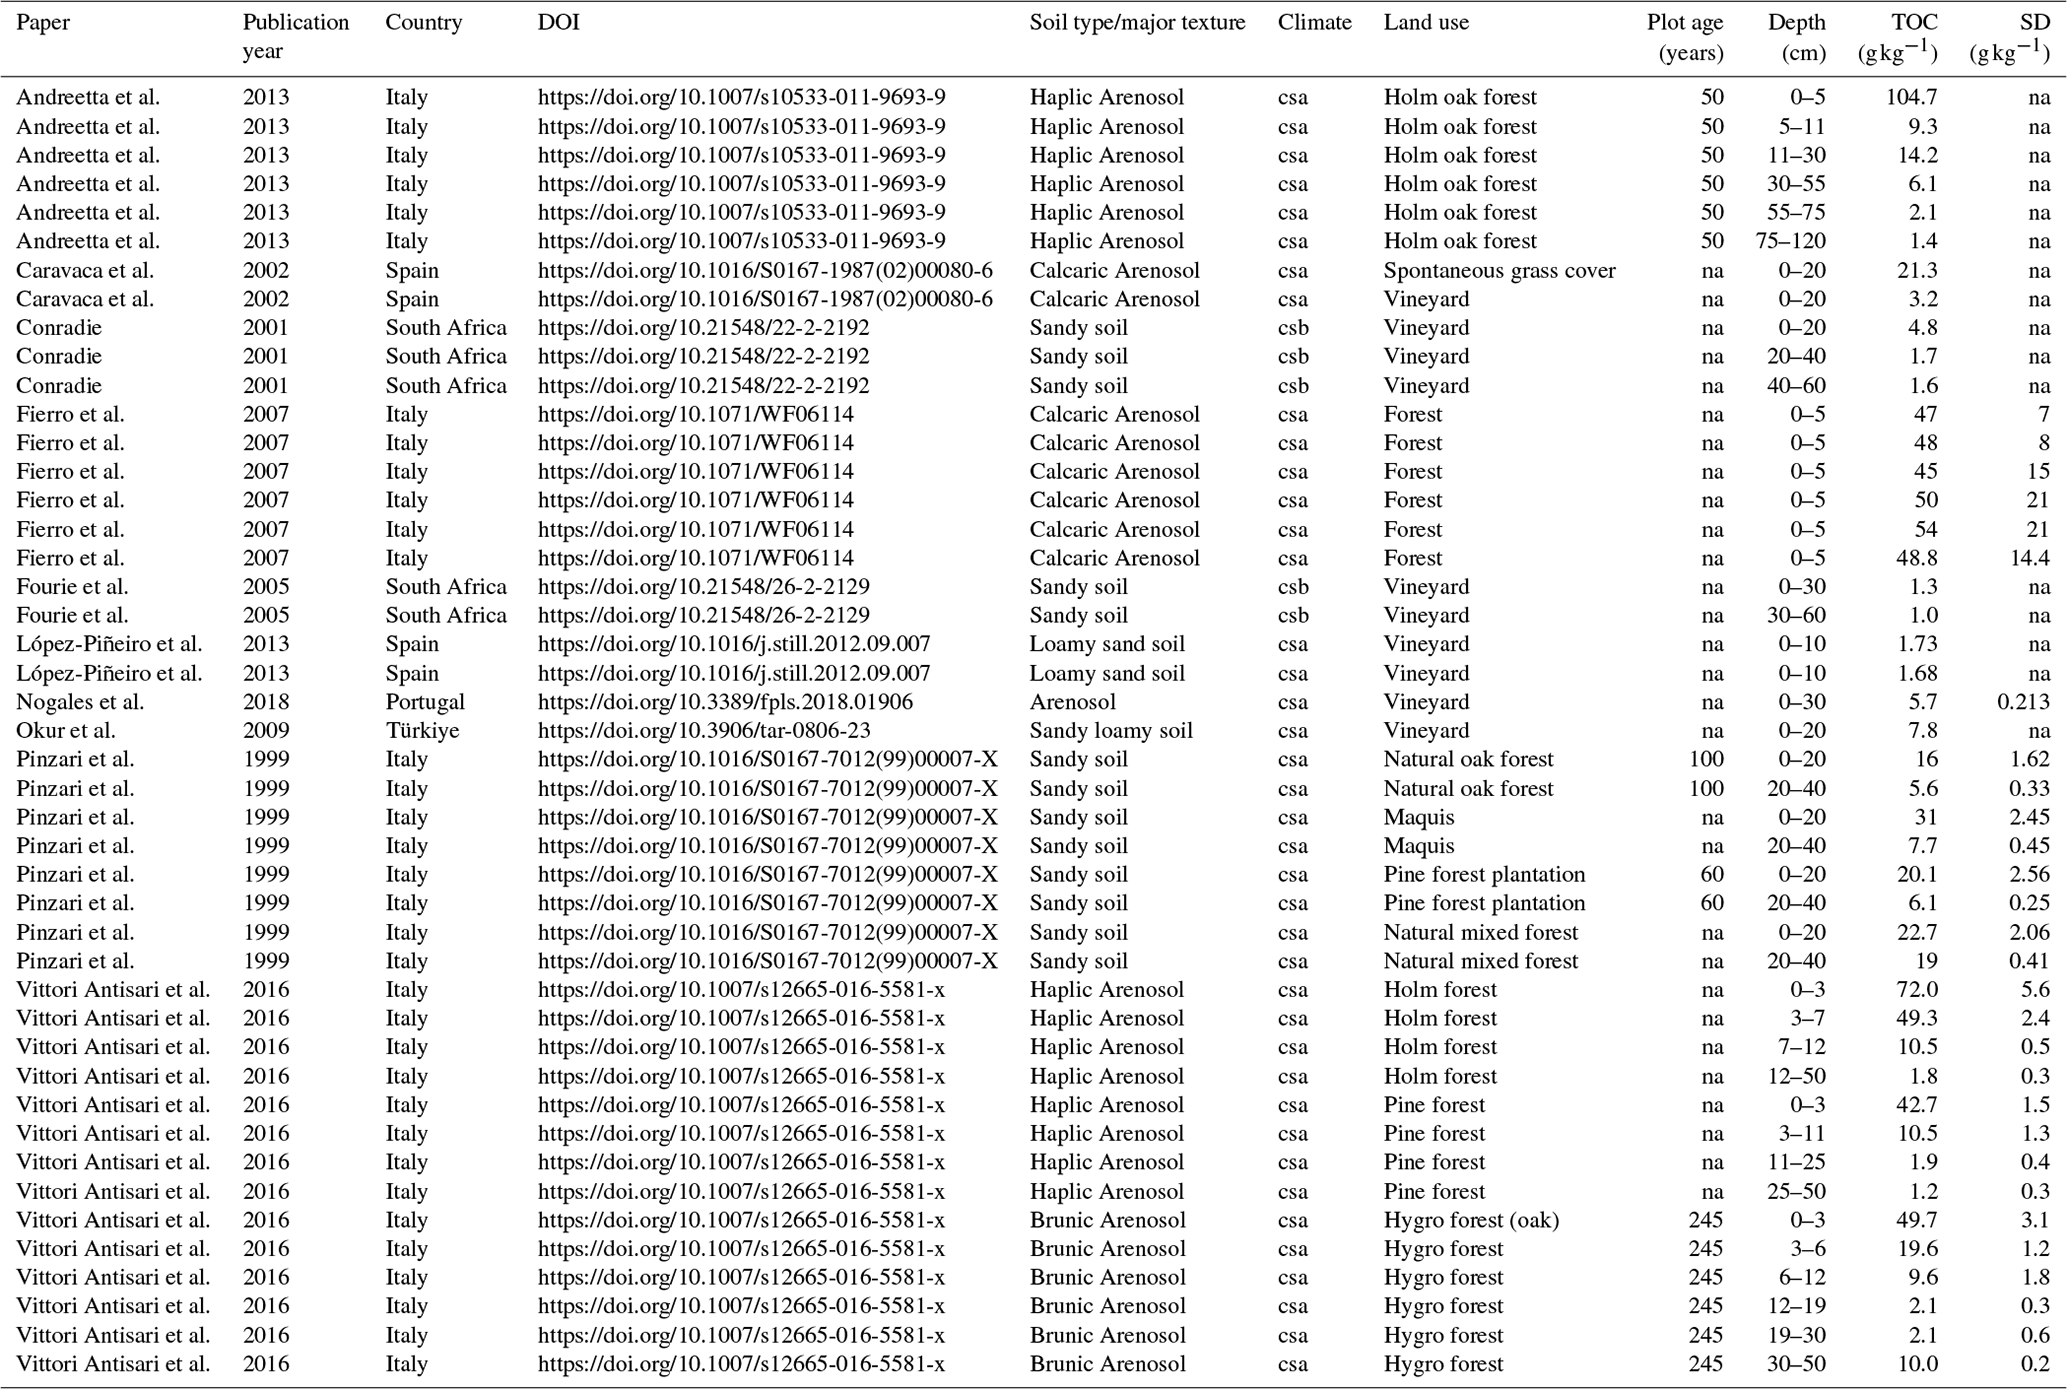
Figure 3TOC comparison between the Brugassières Arenosol and other forest Arenosols (a) and vineyard Arenosols (b) under a Mediterranean climate. (1) Pinzari et al. (1999); (2) Caravaca et al. (2002); (3) Fierro et al. (2007); (4) Andreetta et al. (2013); (5) Vittori Antisari et al. (2016); (6) Conradie (2001); (7) Fourie et al. (2005); (8) Okur et al. (2009); (9) López-Piñeiro (2013); (10) Nogales et al. (2019). Data are available in Table E1 (with details about Mediterranean climate in Table E2).
4.1 Comparison with Mediterranean Arenosols
Under the forest, the TOC profiles (22 ± 5 g C kg−1 in the 0–20 cm layer and 3.94 ± 0.25 g C kg−1 in the 30–50 cm layer) obtained for topsoil and subsoil were comparable to those obtained for other Arenosols under Mediterranean climatic conditions (Fig. 3a; Andreetta et al., 2013; Caravaca et al., 2002; Fierro et al., 2007; Pinzari et al., 1999; Vittori Antisari et al., 2016). However, to our knowledge, very little data are available beyond 30 cm soil depth. For the vineyard, we only identified five references of studies concerning Arenosols in Mediterranean climatic conditions (Conradie, 2001; Fourie et al., 2005; López-Piñeiro, 2013; Nogales et al., 2019; Okur et al., 2009). The Brugassières Arenosol was found to be among the soils with the lowest organic carbon content values (Fig. 3b). This trend was visible in topsoil and at depth. Some Arenosols under vines had low carbon contents that were comparable to those of the soil studied here, both in the topsoil and at depth (Fourie et al., 2005; López-Piñeiro, 2013). The Arenosol in this study, although very depleted in C, does not seem to represent a unique case of organic matter (OM) depletion after Arenosol vineyard cultivation.
4.2 Drastic carbon stock loss: a combination of land use change, agricultural practices, and unfavorable soil texture
These very low carbon contents in the vineyard resulted in a 12-fold lower carbon stock in the vineyard than in the forest throughout the profile (e.g., in the 0–30 cm layer, the SOC stock was 3.3 t C ha−1 in the vineyard compared to 53.5 t C ha−1 in the forest; Fig. 2c). Arenosol carbon stocks under the forest, in the 0–30 cm layer, were lower than stocks under the forest, irrespective of the soil type (80 t C ha−1; Mousset, 2014). The difference between the national forest average and that of the studied forest was 80–50.8 = 29.2 t C ha−1. The difference between the national mean for French vineyards (30 t C ha−1; Mousset, 2014) and that of the studied vineyard was 30–3.2 = 26.8 t C ha−1. Consequently, Arenosols had about 30 t C ha−1 less than the French average under both forests and vines.
Cultivation in the vineyard plot resulted in a very high carbon stock loss throughout the entire depth, with 94 % in the 0–30 cm layer and 76 % in the 30–60 cm layer. Although this carbon stock loss phenomenon has already been widely reported (Guillaume et al., 2021; Ramesh et al., 2019), it has generally been found to be around 50 % in topsoil during a forest (or grassland) to vineyard transition under all climatic conditions (Carlisle et al., 2006; Eldon and Gershenson, 2015). Moreover, contrary to our findings here, the loss is usually much greater in topsoil than in subsoil layers, ranging from 30 % to 63 % on average in the 30–100 cm horizon (Batjes, 2014; Poeplau and Don, 2013). However, if we focus the comparison on Arenosols under a Mediterranean climate, losses (in TOC) during a natural vegetation to vine transition can reach 85 % in the 0–20 cm layer over a 1-year period (Caravaca et al., 2002). The soil carbon loss noted in this study thus resulted in extremely high carbon loss after more than 150 years of grapevine cultivation, which does not seem to be out of line with observations described in the Arenosol literature.
This extreme carbon loss throughout the cultivated soil profile could be explained by a combination of the following four aggravating factors at the Brugassières site: (1) the initial disturbance of the Arenosol, due to the forest to vineyard land use change in the 19th century (Caravaca et al., 2002; Tsozué et al., 2020), and (2) the absence of vegetation cover (apart from vines) for more than 150 years was probably also an important factor. Carbon inputs were almost nil in topsoil (soil kept bare; Fig. 1). Deep inputs were limited to the depth of the grapevine root system, while the vine plants were uprooted every 70 years. However, the age of the carbon distribution as a function of depth proposed by Balesdent et al. (2018) shows that almost half of the carbon in a soil is on average younger than 150 years at the soil profile scale. Although this distribution concerns soils under tropical climates, the drastic long-term reduction of carbon inputs to the soil could likely largely explain the carbon stocks observed in the vineyard throughout the soil profile. (3) Deep plowing (50 cm), carried out every 70 years at the same time as the grapevine plant uprooting, was probably a third factor favoring carbon loss via accelerated SOC mineralization. (4) The Arenosol texture, characterized by a low proportion of fine particles (< 20 µm fraction; Fig. B1) is also an unfavorable factor for C storage within the mineral-associated OM pool.

Figure 4Comparison of intra-layer F14C heterogeneity at three depths (5–10, 40–50, and 50–60 cm) in forest and vineyard soils. F14C data were obtained for profiles A (star), B (diamond), C (square), composites A + B + C (triangle), and the average of these data (round) in forest (green) and vineyard (orange) soils. Error bars represent the analytical error for the profiles A, B, and C and the standard deviation for the mean.
4.3 Intra-layer radiocarbon variability
Carbon spatial heterogeneity is generally not taken into account in soil studies on carbon dynamics using the 14C proxy (van der Voort et al., 2016). Chiti et al. (2016) and van der Voort et al. (2016) showed that the intra-layer radiocarbon signature under forests is relatively homogeneous in topsoil and at depth. This finding is in line with our forest soil results (Figs. 2d and 4), where the low intra-layer F14C variability (represented by the standard deviation, SD) in the forest soil was noted both in the 5–10 cm layer with a high carbon concentration ( = 0.008; TOCaverage = 42.4 g C kg−1 and SDTOC = 9.1 g C kg−1) and in the 40–50 cm layer with a low carbon concentration ( = 0.011; TOCaverage = 3.4 g C kg−1 and SDTOC = 0.1 g C kg−1). Below the plowing depth, low intra-layer variability was also observed in the vineyard soil (Figs. 2d and 4; 50–60 cm layer – = 0.012, TOCaverage = 0.9 g C kg−1, and SDTOC = 0.1 g C kg−1). Thus, in a horizon undisturbed by agricultural cultivation, 14C showed little intra-layer variability on a metric scale, even when measurements were carried out on samples with a very low TOC (Fig. 1a and Table D1).
In cultivated systems, to our knowledge, no studies have reported measurements of intra-layer 14C variability. Our findings therefore cannot be compared with those of previous studies. In comparison to undisturbed horizons, much higher intra-layer variability was observed at 5–10 cm depth ( = 0.029) and within the 40–50 cm plowing depth ( = 0.058), with both layers being characterized by low total carbon (over 5–10 cm – TOC = 0.79 g C kg−1, with SD = 0.26 g C kg−1; over 40–50 cm – TOC = 1.03 g C kg−1 with SD = 0.42 g C kg−1). The variance under vines was significantly different from that under forest, both in the topsoil (ppermutation test = 0.02) and subsoil (ppermutation test = 0.01; Figs. D3 and D4). Furthermore, the F14C measurements at 40–50 cm depth in the B profile and in vineyard pit composite soils had a post-bomb value (F14Cmean = 1.001) which was higher than that obtained in the forest soil (F14Cmean = 0.990). At 40–50 cm depth, and only for this horizon, OM in the vineyard was younger than that in the forest soil for some samples. This highly suggests that the variability in F14C measured between samples on sides A, B, and C was a consequence of multiple plowing whereby the soil is mixed vertically but also horizontally on a metric scale.

Figure 5Comparison of the Δ14C average at 0–30 and 30–100 cm depth between this study forest soil (green triangle), this study crop soil (orange triangle), and the Δ14C average from 185 papers, extracted using R software from the International Soil Radiocarbon Database (ISRaD) database, version 1.7.8.2021-01-04 (Anon, 2020; Lawrence et al., 2020). Black dots represent outliers. Crop soil is n = 34 papers, and forest soil is n = 151 papers. The central value of the box plot is the median, the edges are the quartiles, and the ends of the whiskers represent the maximum and minimum values. In total, 50 % of the observations are inside the box plot. Values outside the whiskers are represented by dots.
4.4 OM in Arenosols: younger C than in other soil types
The Δ14C of soil profiles reported in 185 papers culled from version 1.7.8.2021-01-04 of the International Soil Radiocarbon Database (ISRaD) database (Anon, 2020; Lawrence et al., 2020), under forest and cultivation, in topsoil (0–30 cm) and at depth (30–100 cm), are compared in Fig. 5. The Arenosol studied here had a higher Δ14C than the median Δ14C (all soil types combined) in topsoil and even more marked in subsoil layers, e.g., in topsoil, the Δ14Cforest = 84.88 ± 22.5 ‰, relative to a median around 7 ‰ from the literature review, and Δ14Ccrop = −32.7 ± 21.8 ‰, relative to a median of −20 ‰. This was probably due to the lower fine particle (< 2 µm) content than the overall average in the meta-analysis. Indeed, Arenosols have few reactive mineral phases that stabilize OM in the long term, which is in line with the above discussion on stocks. The fact that the OM fractions were systematically younger than those generally described in the literature could thus be explained by the soil type (i.e., the fine fraction was minimal in the Arenosol) and by the long cropland history (> 150 years).
4.5 Land use impact on OM borne 14C
In the plowed horizon, with the exception of the 40–50 cm layer, Δ14C was always more negative in cultivated soils than in forest soils. Cultivation therefore led to carbon aging (by loss of the most recent carbon pool) to 40 cm depth. This impact of cultivation had already been highlighted in a plowed horizon by Wang et al. (1999), where the carbon of a cultivated soil in the 0–30 cm layer was older than its equivalent in forest soils. This trend was also revealed in a meta-analysis (Fig. 5; cropland soil is n = 34 papers, and forest soil is n = 151 papers). The median values confirmed that the carbon age of soil organic matter (SOM) was older in cultivated soils in both top and deep horizons. Cultivation affects the mean carbon turnover mainly by removing carbon from fast-turnover pools and mostly retaining slow-turnover carbon pools (Poeplau and Don, 2013). It is likely that these slow-turnover OM pools are organic compounds associated with the mineral-associated OM (MAOM) pool (Cotrufo et al., 2019). Furthermore, the findings in the 40–50 cm horizon, with a younger post-bomb OM than all other horizons in the vineyard profile, showed that the full inversion tillage practiced effectively dragged surface OM down to 50 cm. Cultivating the deep plowed Arenosol under vines therefore led to the (1) loss of the young and poorly stabilized OM pools and (2) redistribution of the remaining MAOMs throughout the plowed horizon and, as shown in Sect. 4.3, in a horizontally heterogeneous way.
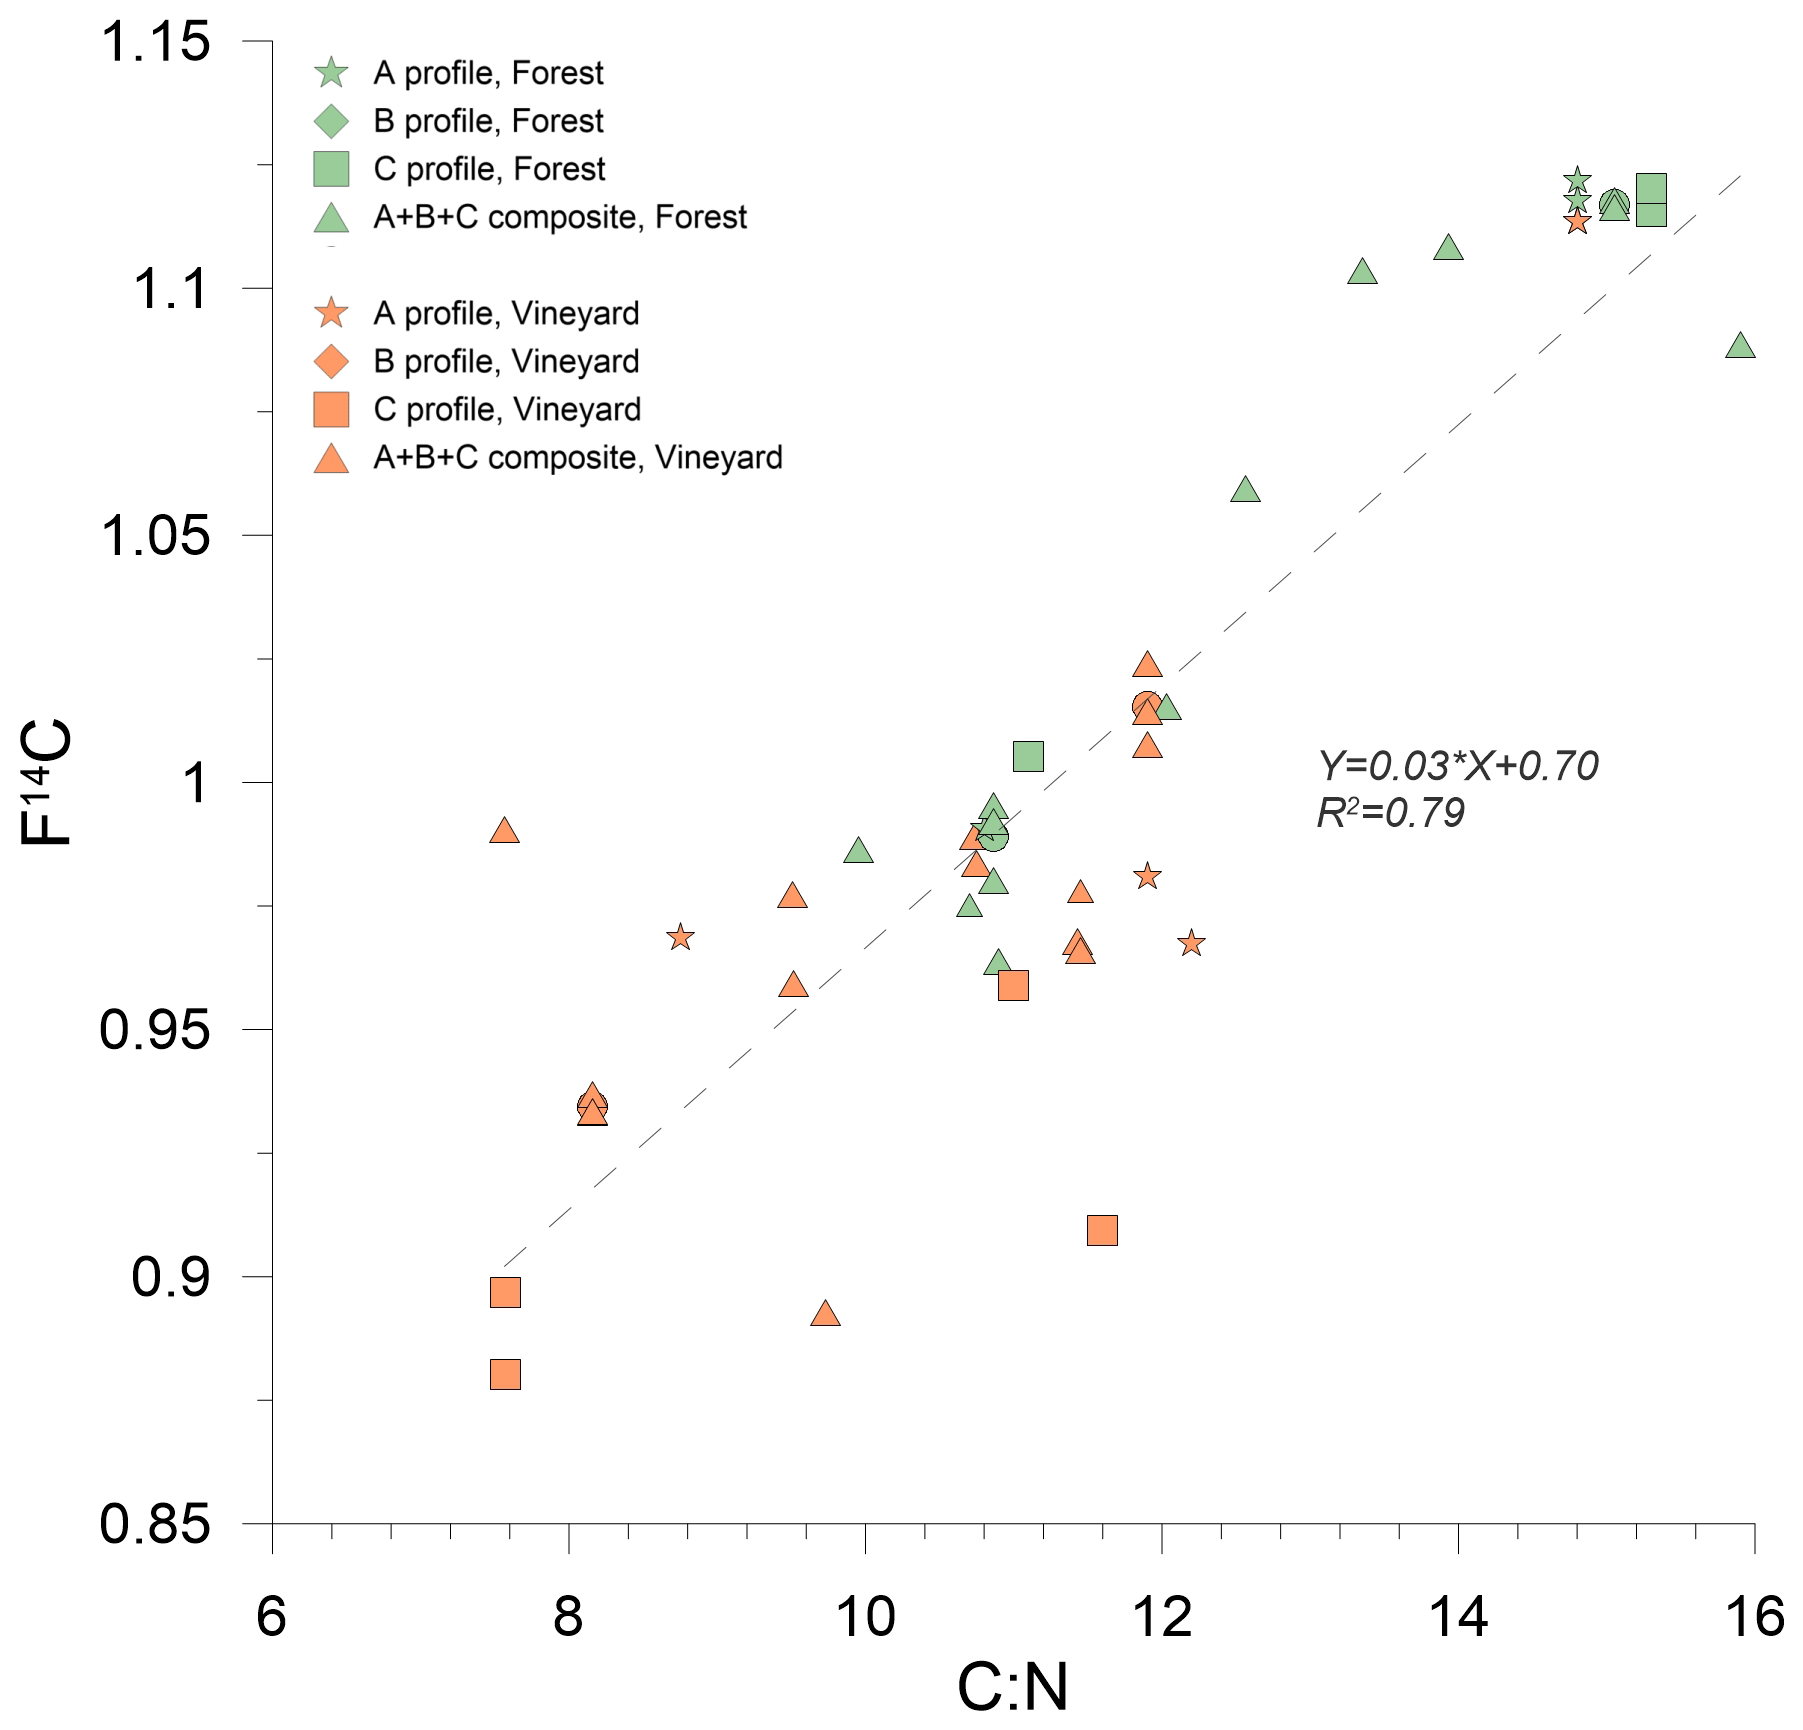
Figure 6Correlation between the F14C and C:N ratio. The correlation was calculated on composite samples (F14C) and the average for the three profiles A, B, and C (C:N), as well as on samples of profiles A, B, and C only, from the forest (green) and vineyard (orange).
4.6 Possible microbial origin of OM in the vineyard
The C:N profile of the forest soil was a classic profile, with a C:N ratio that tended to decrease with depth. This decrease reflects an enrichment in N of the SOM in connection with an increased proportion of the contribution of molecules of microbial origin (Cotrufo et al., 2013). The vineyard profile did not follow a similar trend but was the result, as for F14C, of disturbances linked to tillage. However, there was a positive linear correlation ( = 0.78) between C:N and F14C in that the microbial signature was higher in older SOM (Fig. 6). This suggests that the ancient carbon in the soil was mainly borne by molecules originating from N-rich microbial metabolism and presumably stabilized within MAOM (Cotrufo et al., 2019; Kleber et al., 2015; Rumpel and Kögel-Knabner, 2011). The change in vineyard use associated with conventional practices (absence of inter-row cover crops and deep plowing) thus only seemed allow maintenance of this small MAOM pool, to the detriment of other less stable OM pools lost through erosion, leaching, or mineralization.
4.7 Is Arenosol a good target for the 4 per 1000 (4p1000) initiative?
To restore OM stocks in soils and meet the 4p1000 objectives, the land use may be changed (cropland returned to grassland or forest), or cropland may be maintained by adopting practices that foster C storage, e.g., establishment of permanent grasslands, application of organic amendments, grassing of vineyards, etc. (Pellerin et al., 2019). Arenosols, whose carbon stocks are very low in cultivated systems (Fig. 2c), thus seem to be good candidates for the 4p1000 initiative because they have a high C storage potential. Storage experiments conducted on Arenosols measured an increase of 40.2 to 45.6 and 39.4 to 49.0 t C ha−1 of carbon stocks in the 0–30 cm layer in 20 years following, respectively, cropland abandonment (+0.27 ) and a change in grassland management (+0.48 ; Kazlauskaite-Jadzevice et al., 2019). In these experiments, the annual increase in carbon stock was +5.9 ‰ and +9.8 ‰, respectively, i.e., more than twofold higher than the 4 ‰ annual increase targeted by the 4p1000 initiative.
In the case of the studied Arenosols, the potentially achievable reference stock could be considered equal to the forest soil stock. In the 0–30 cm range, the C storage potential was therefore 50 t ha−1 (Fig. 2c). If we consider an annual C stock increase rate equivalent to that obtained by Kazlauskaite-Jadzevice et al. (2019; about 8 ‰), it could be calculated that an Arenosol could recover this stock in 117 years under appropriate practices. If calculated differently, i.e., not considering the same storage proportion as Kazlauskaite-Jadzevice et al. (2019) but the same storage rate (a mean of +0.37 ), an Arenosol could recover its C stock in 131 years of storage. Even if the system would probably not respond linearly in terms of C storage rate, these simple calculations show that the additional C storage potential in cultivated Arenosols is high, but the timing to recover a stock level equivalent to that of the forest is around a century. Although this timing is long in comparison to policy-defined C neutrality urgency timetables, low C cultivated Arenosols are likely to represent a sustainable annual C sink upon the adoption of C storage practices – a sink that could exceed the 4p1000 targets.
Land use change from a Mediterranean forest to a vineyard on an Arenosol resulted in loss of a very high proportion of the soil's carbon throughout the entire depth of the soil profile, leading to 93.7 % less SOC in topsoil and 76.2 % at depth. Few papers in the literature showed comparable levels of carbon under forests and in vineyards. The radiocarbon study highlighted the very high vertical homogeneity (as a function of depth), together with horizontal heterogeneity (intra-layer) of the carbon distribution, induced by deep plowing. The carbon remaining in the 0–50 cm of the vineyard soil layer was old stabilized microbial carbon that was, for some samples, mixed with younger carbon at depth. The study of 14C data and the C:N ratio revealed a link between the degree of OM biotransformation by the microbial compartment and its age, i.e., F14C (old and stabilized carbon) decreased with N enrichment. Finally, Arenosols are soils for which the adoption of C stocking practices can meet ambitious annual soil carbon storage objectives. The findings of this study thus generated fresh knowledge on the carbon dynamics of Arenosols following a land use change, with a view to application of the 4p1000 initiative. In the case of vineyards, cover cropping is an effective carbon storage practice and economically interesting for farmers (Payen et al., 2021; Pellerin, 2019). The large area of land devoted to viticulture worldwide (7.45 Mha) means that the widespread use of this practice would be a significant step towards the adoption of carbon storage practices on a global scale.
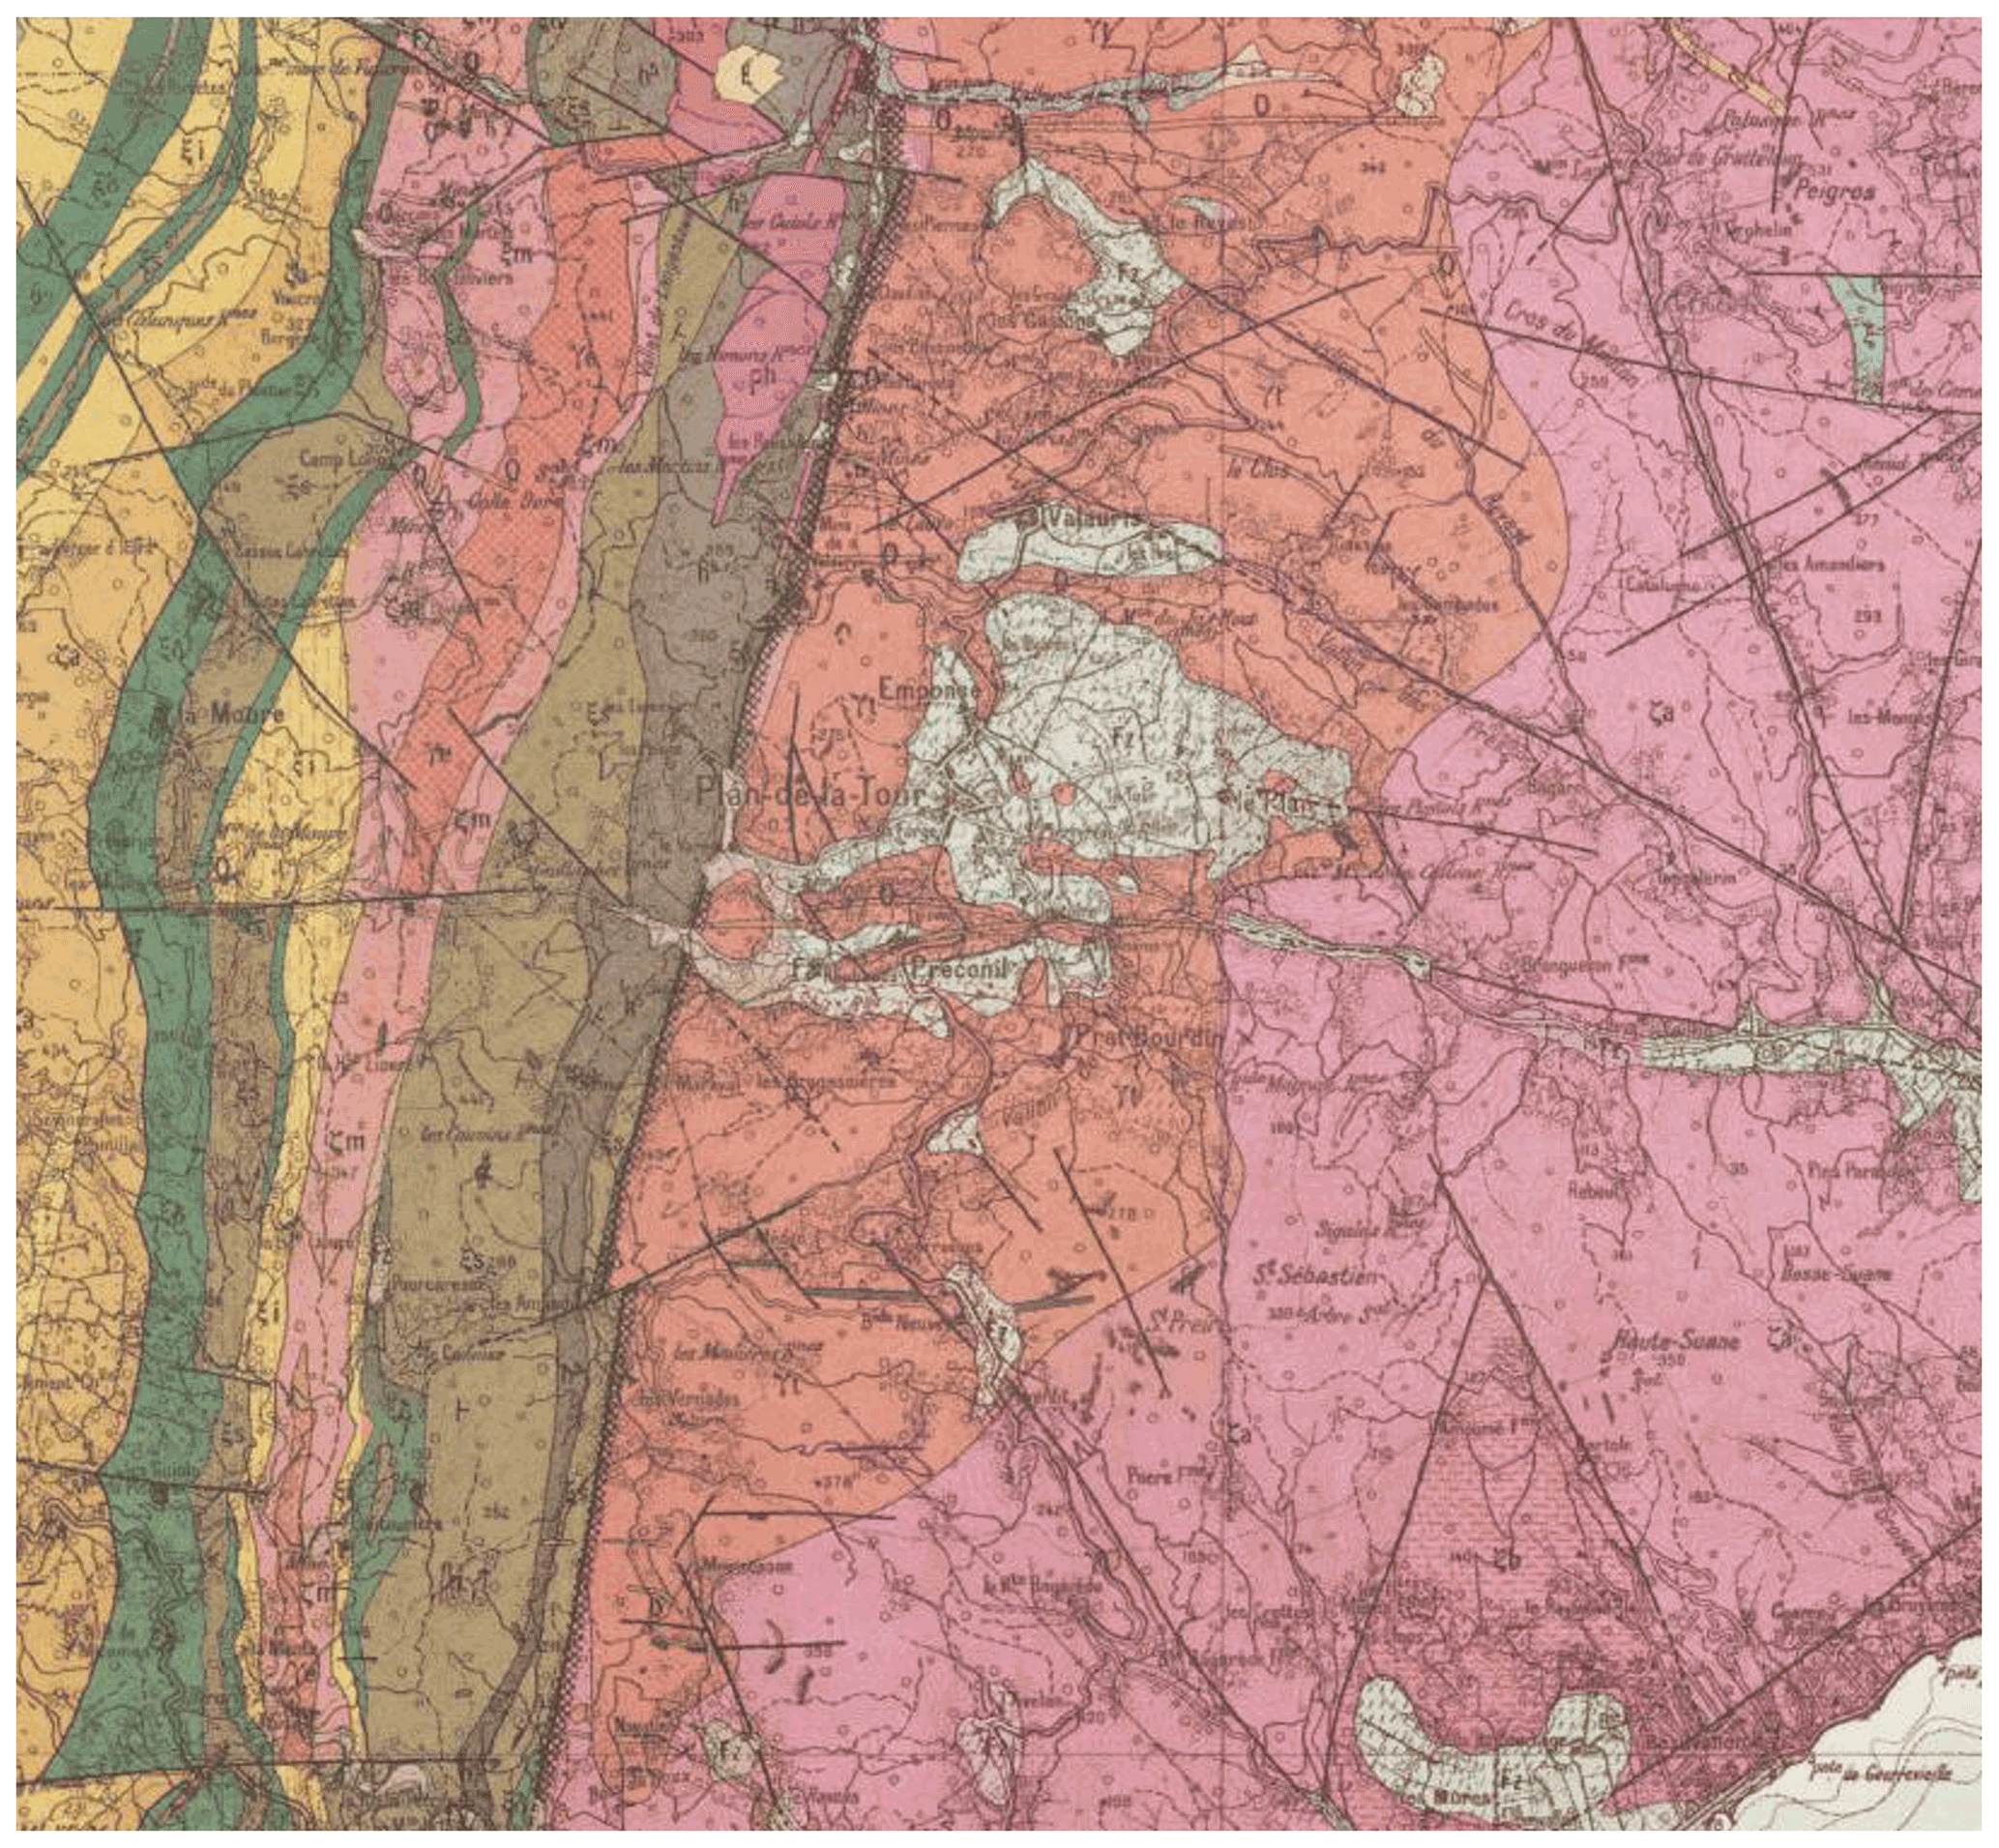
Figure A1Geological map of the granite of Le Plan de la Tour (Maures, South of France), represented by the north–south elongated red zone in the center of the geological map (source https://www.geoportail.gouv.fr/carte, last access: 19 January 2022).
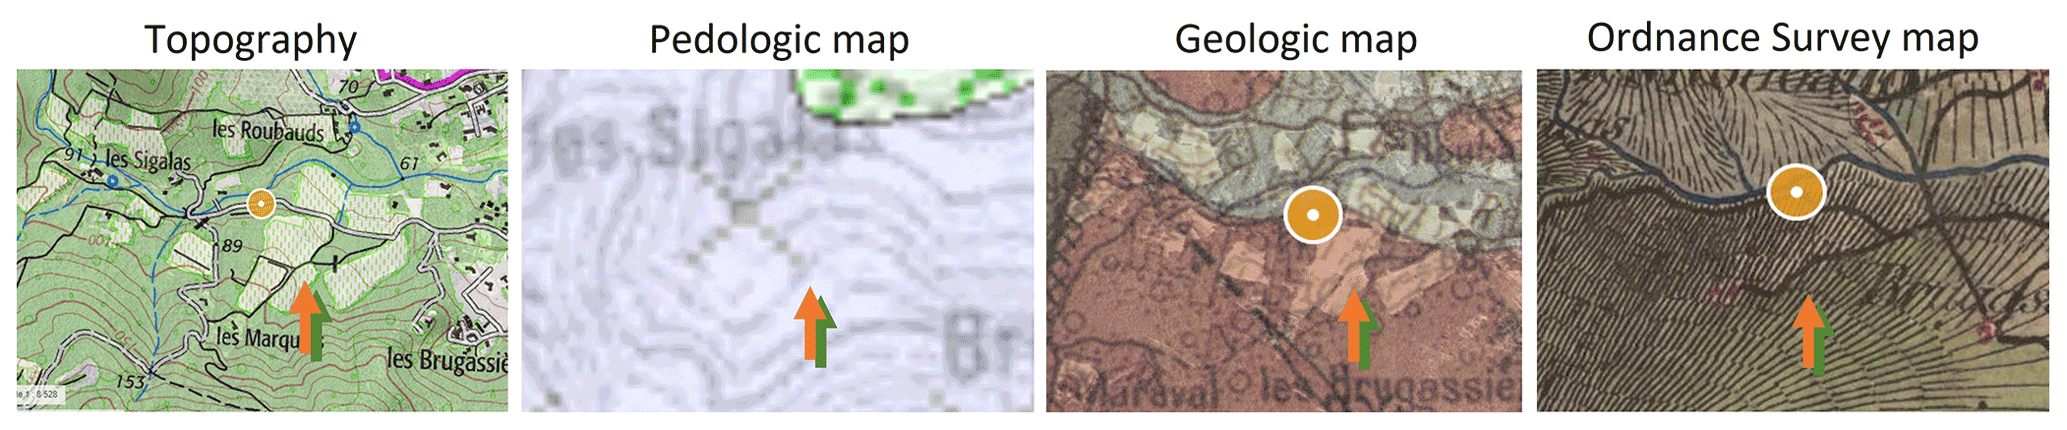
Figure A2Topographic, pedologic (source: soil reference system of the VAR), geologic, and ordnance survey map, 1820–1866 (source: https://www.geoportail.gouv.fr, last access: 8 November 2019). The brown arrow is the crop, and the green arrow is the forest.
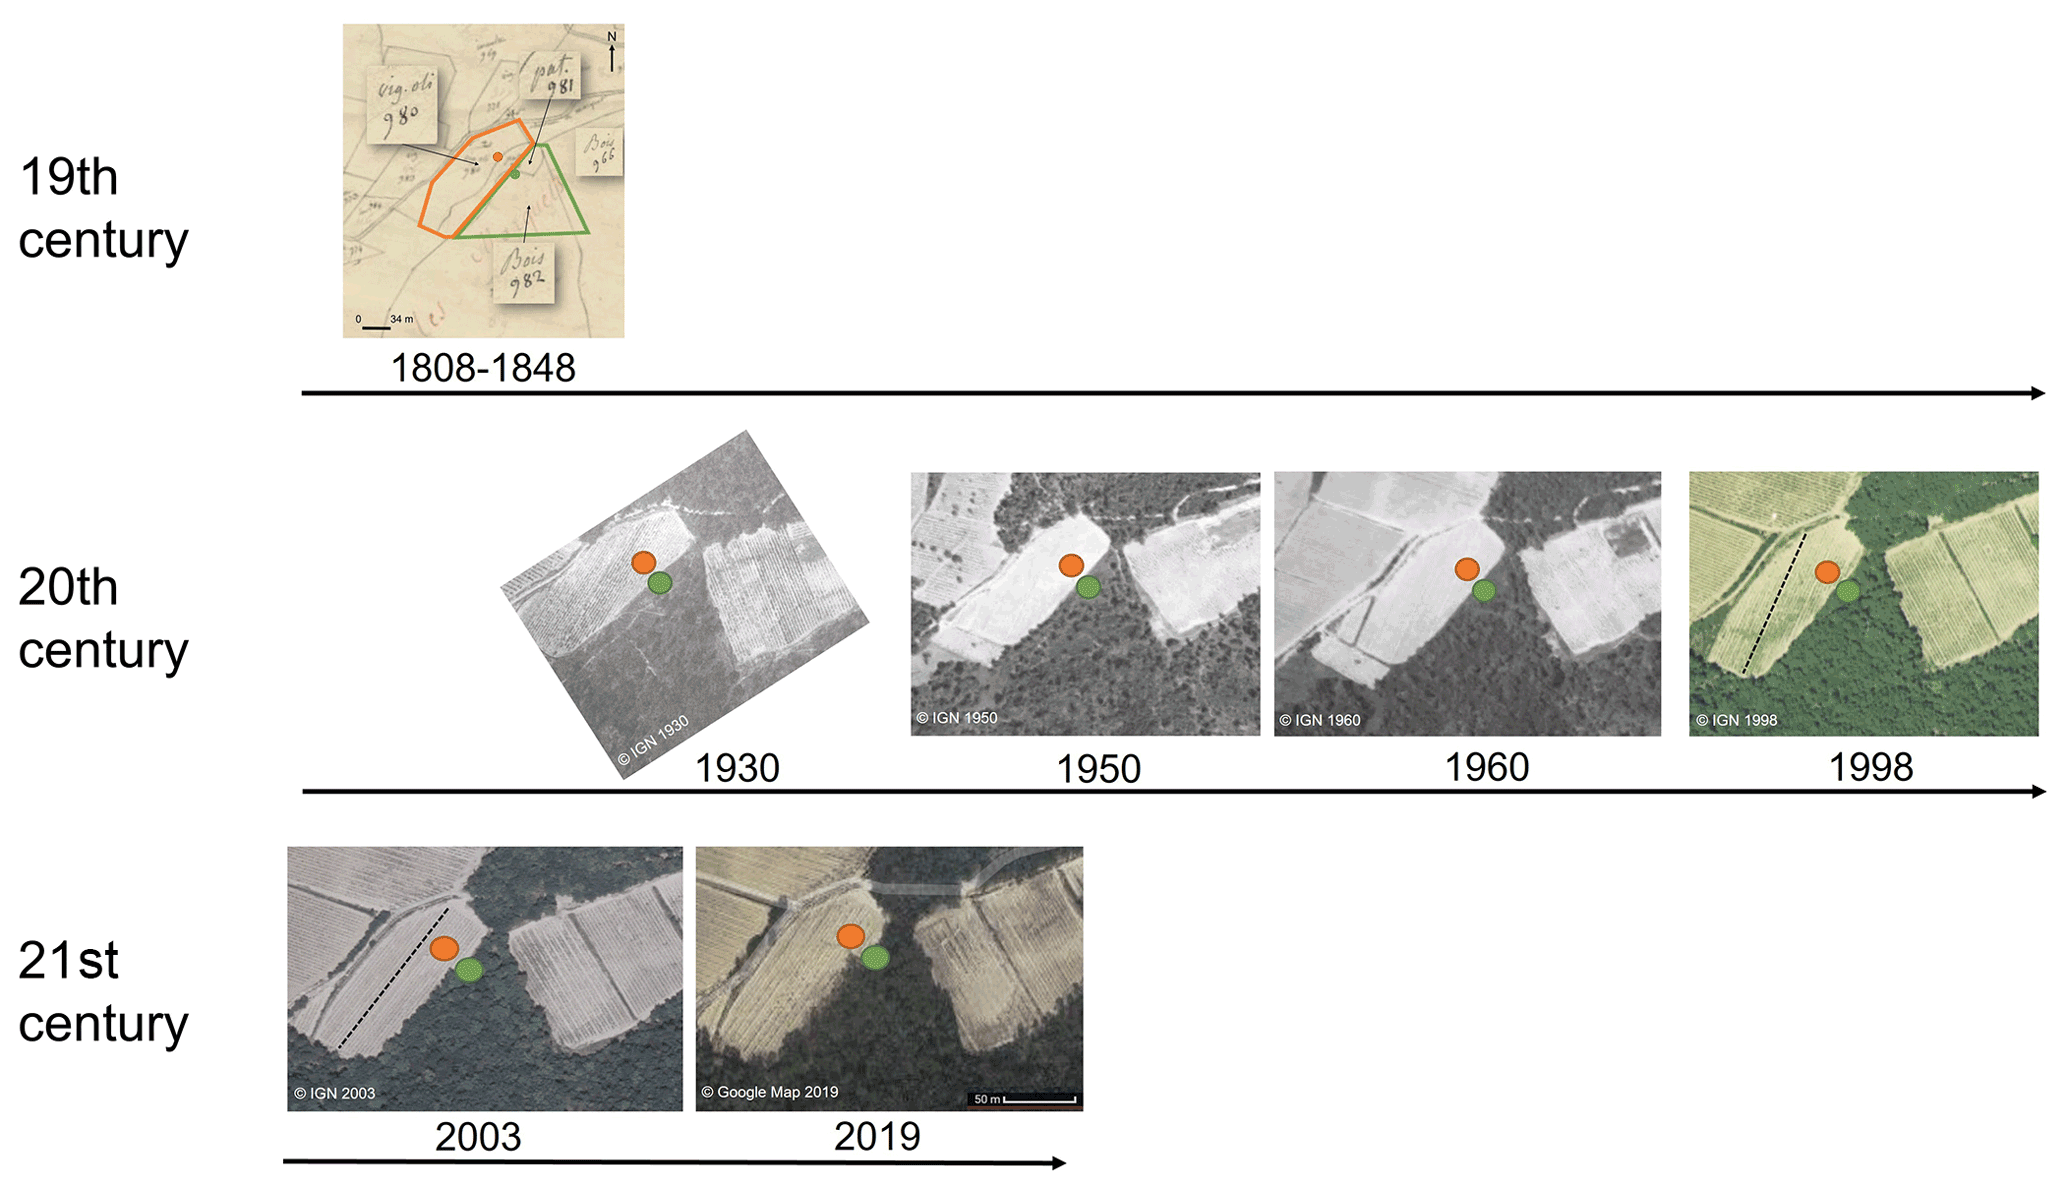
Figure A3History of land use at the Les Brugassières site from the 19th century to the present day through the study of old maps and aerial photos. The boundaries of the forest (green) and vineyard (orange) plots were shown on the Napoleonic land register (1808–1848; https://archives.var.fr, last access: 12 November 2020). All aerial photos from the 20th century to the present day were from the IGN Remonter le temps website (https://remonterletemps.ign.fr/, last access: 12 November 2020). The pit locations are indicated by orange and green circles.
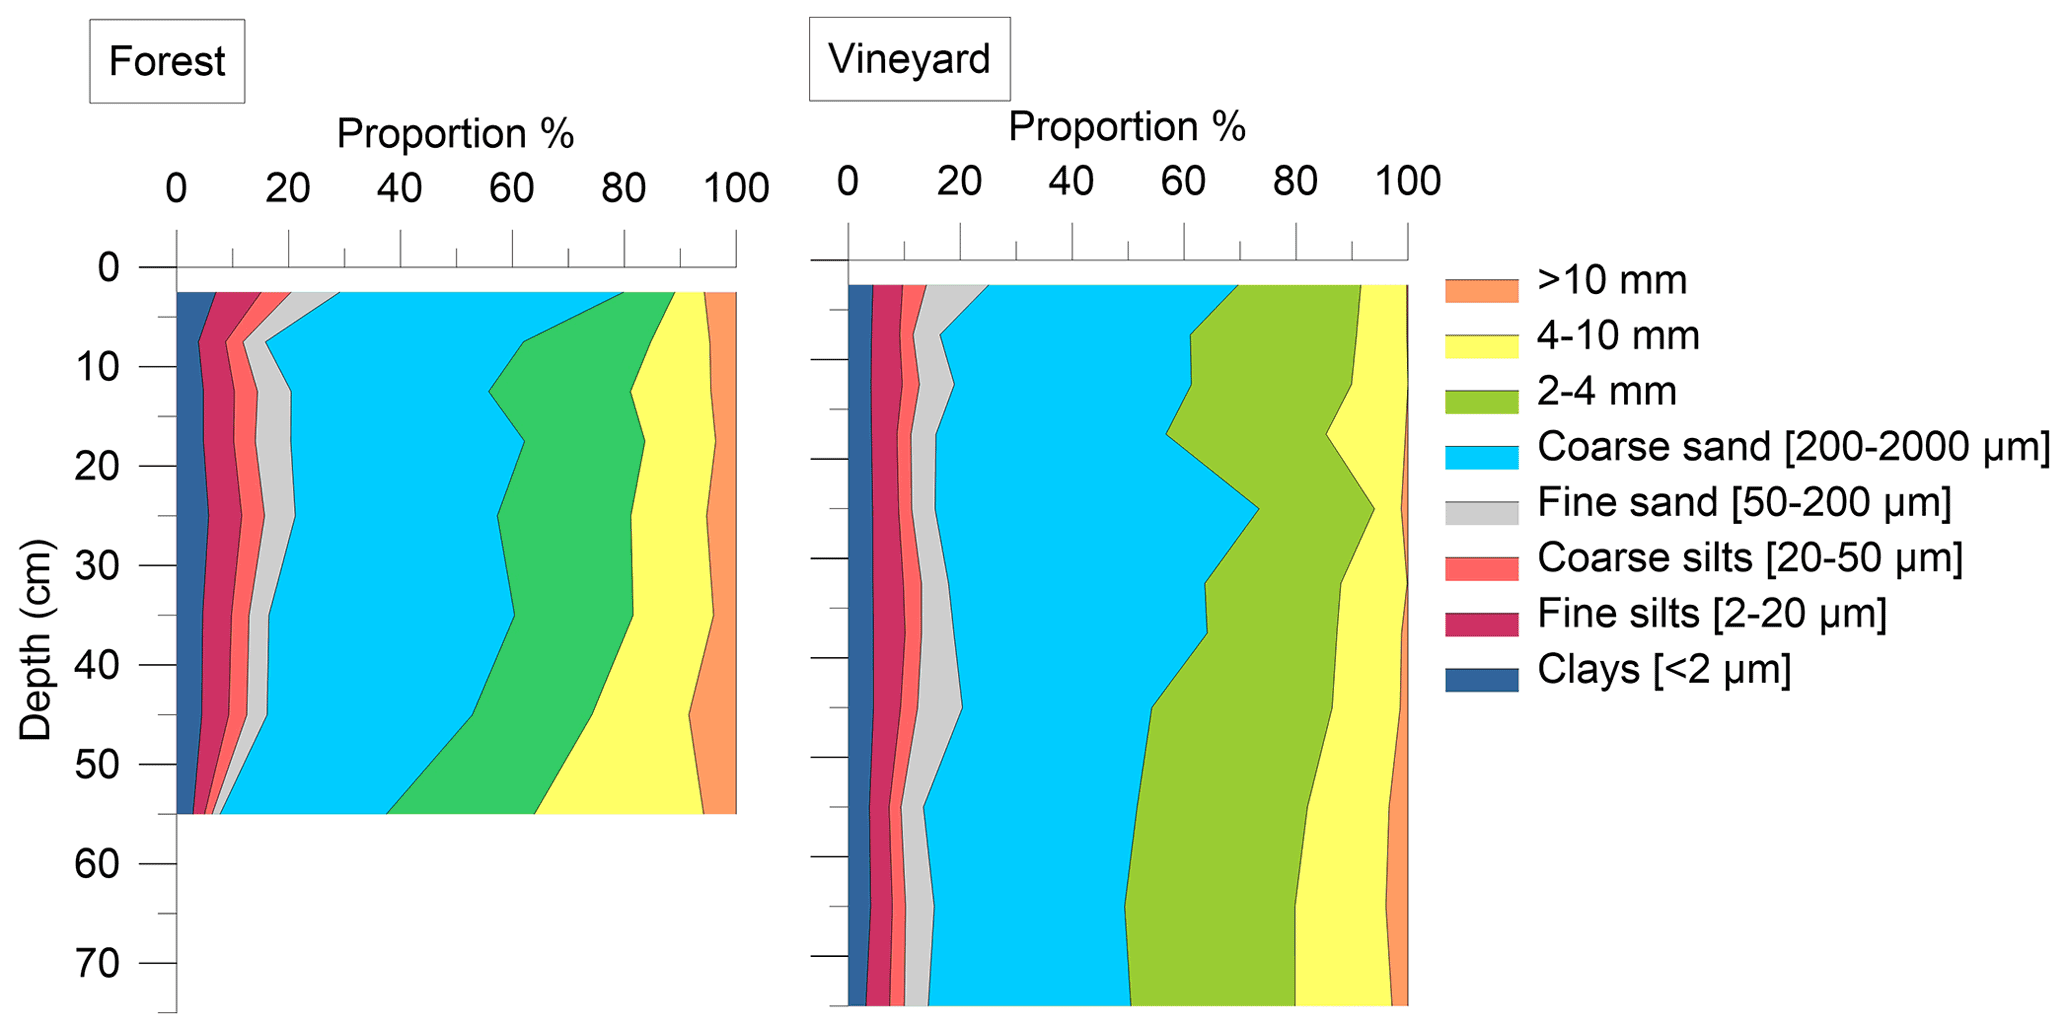
Figure B1Soil particle size distribution of the pit samples under the forest and under the vineyard, as a function of depth. The eight particle size fractions are clay < 2 µm (dark blue), fine silt 2–20 µm (burgundy), coarse silt 20–50 µm (pink), fine sand 50–200 µm (gray), coarse sand 200–2000 µm (sky blue), 2–4 mm (green), 4–10 mm (yellow), and > 10 mm (orange). The different fractions are expressed in percent of the mineral phase. The particle size profiles in the forest and vineyard soils showed about 50 % coarse sand and did not vary significantly with depth. There was no significant difference in soil particle size distribution between the forest and vineyard plots.
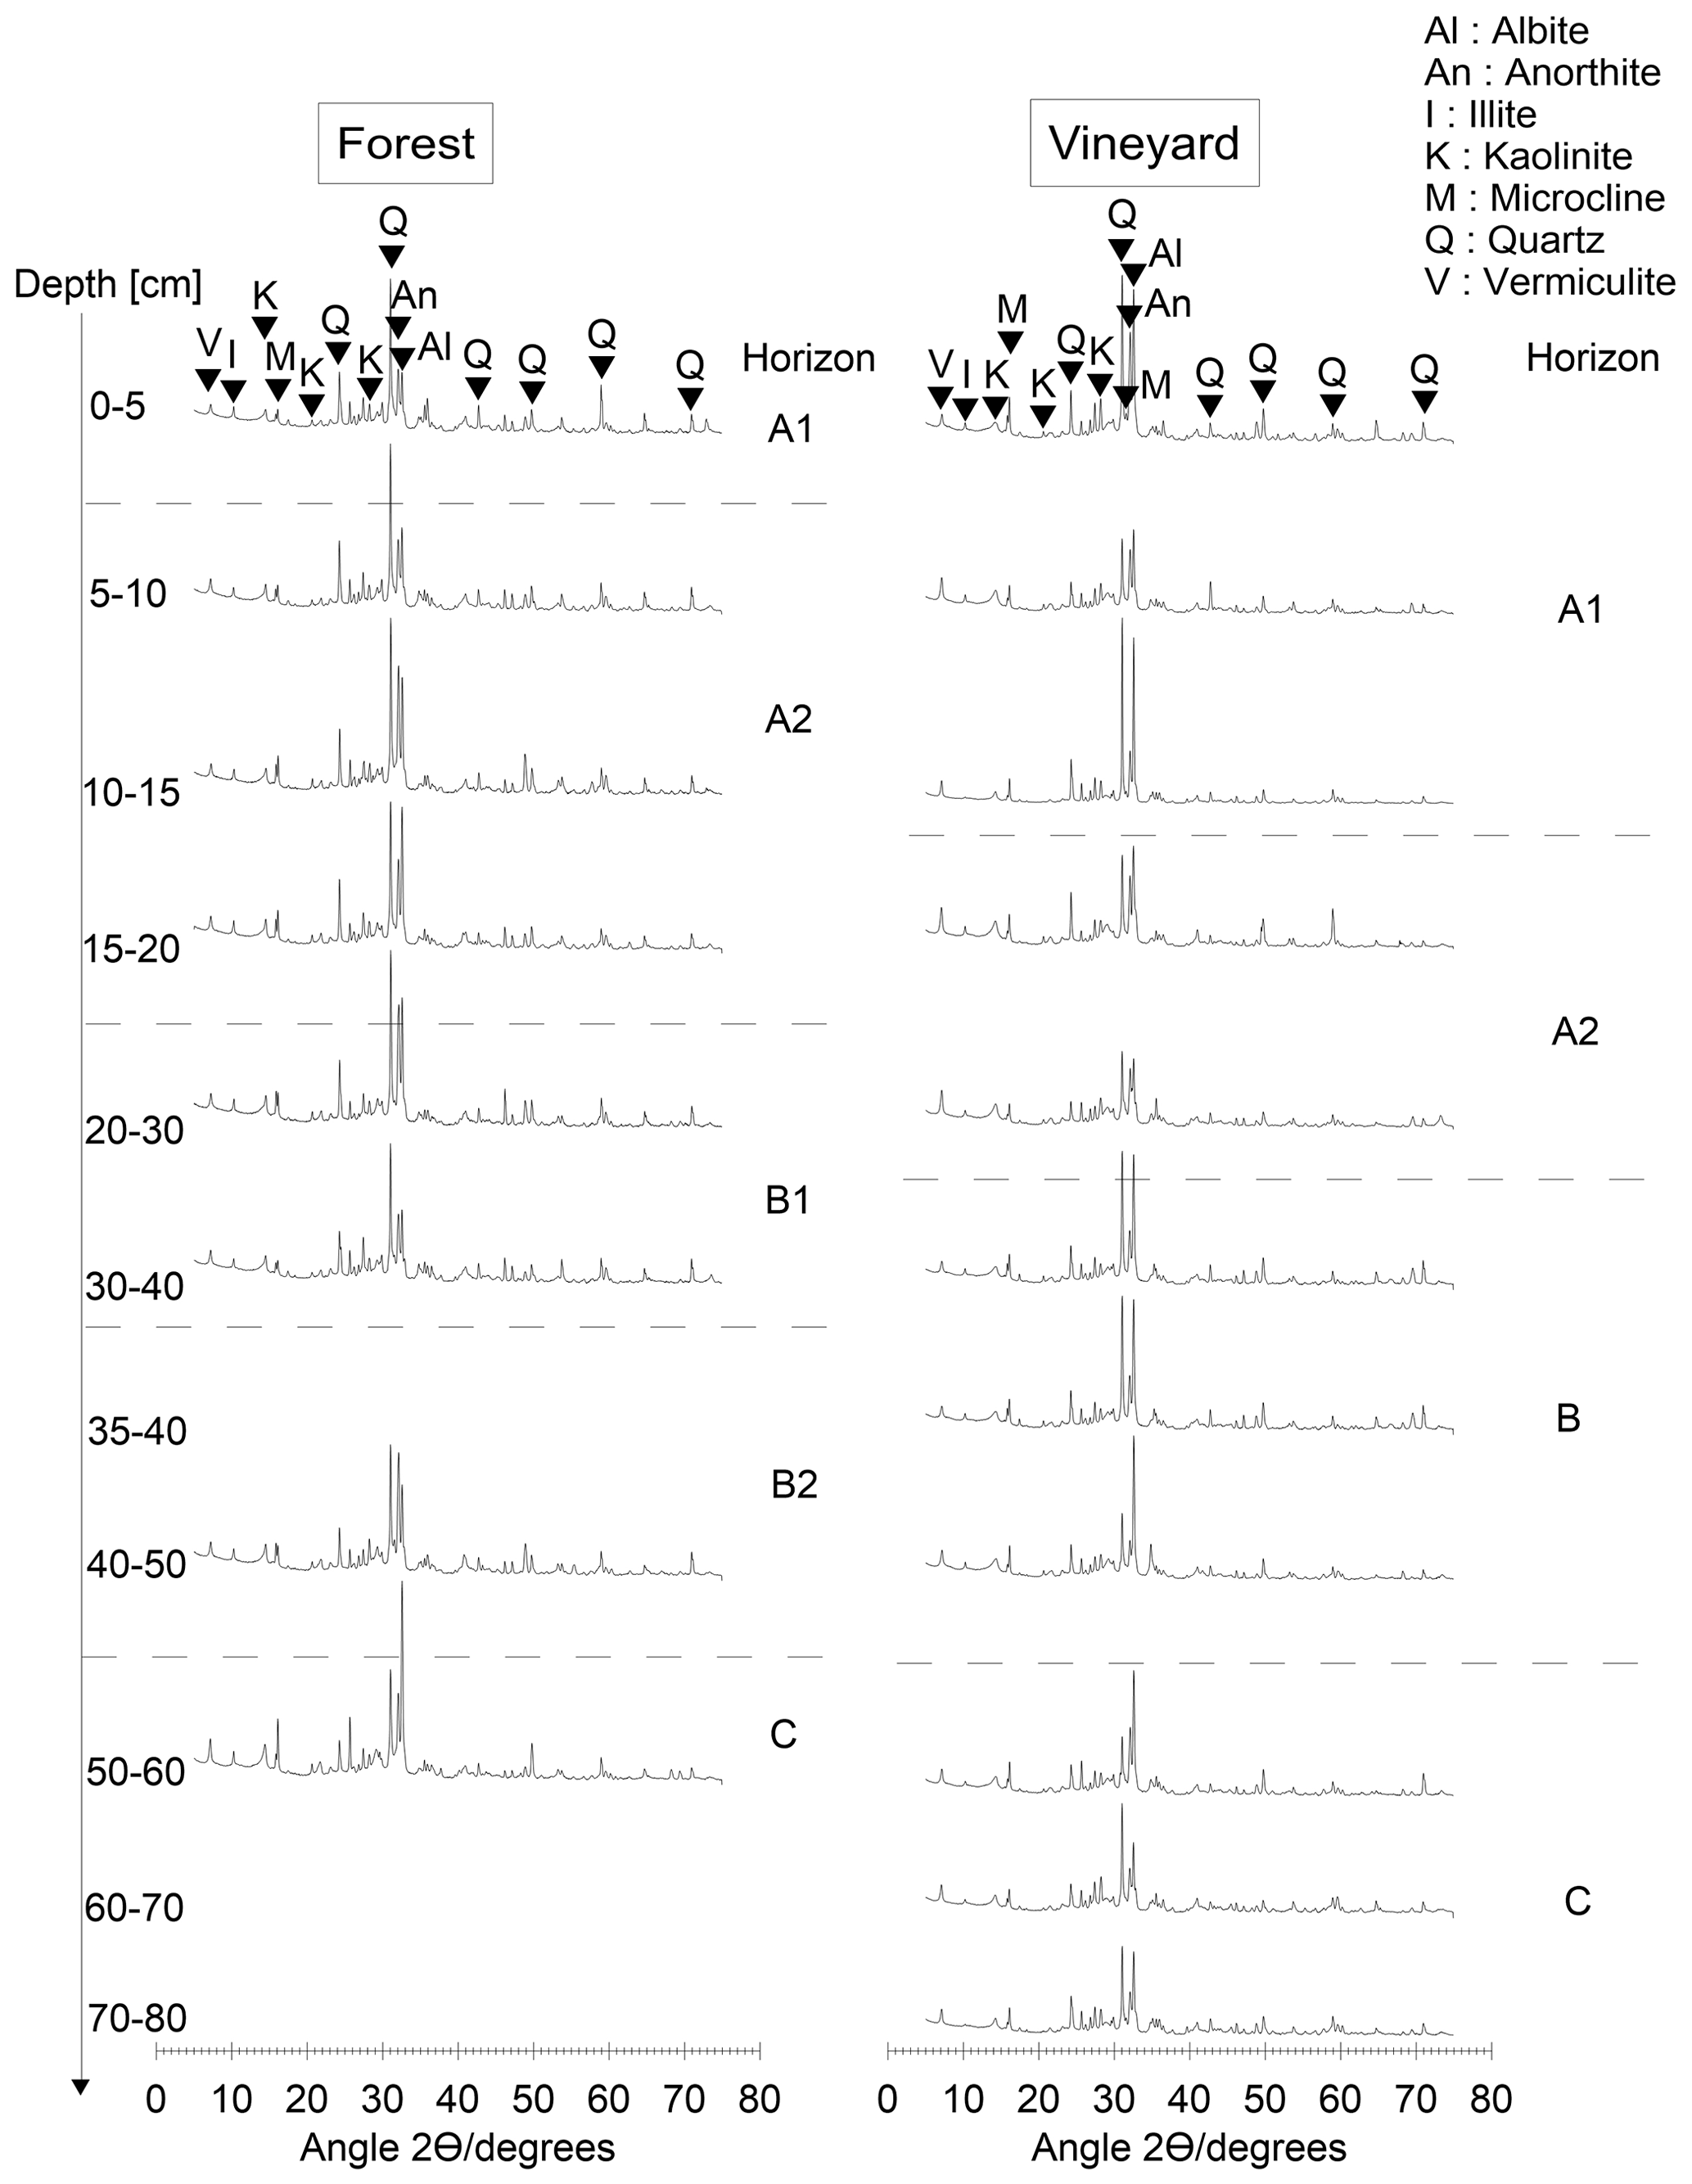
Figure B2Forest/vineyard comparison of X-ray diffractograms as a function of soil depth. The rhombs indicate the peak considered, and the letters above are the corresponding minerals. The mineralogy was determined by X-ray diffraction on powder samples, deposited on a silicon plate, and measured using a PANalytical X'pert PRO diffractometer with a cobalt radiation source. The range of 2θ was between 5 and 75∘, with a step size of 0.033∘ and a measurement time of 5 h 10 min per sample. The forest and cultivated soil mineralogy is characteristic of a granitic bedrock with quartz, feldspar, and secondary minerals (illite and vermiculite) throughout the entire profile. The mineralogy was equivalent in both soils.
The data expressed in Δ14C are shown in Fig. D1 to facilitate comparison with the literature findings and Eq. (A1), as follows:
From the radiocarbon data, it is possible to access a relative age, expressed in years before present (BP). The starting date of the age scale is 1 January 1950, which was before the bomb peak, and corresponds to the first publications with radiocarbon dates. The BP age takes the radiocarbon decay equation into account and was calculated according to the Libby half-life of 5568 years as follows (Libby et al., 1949; Eq.A2):
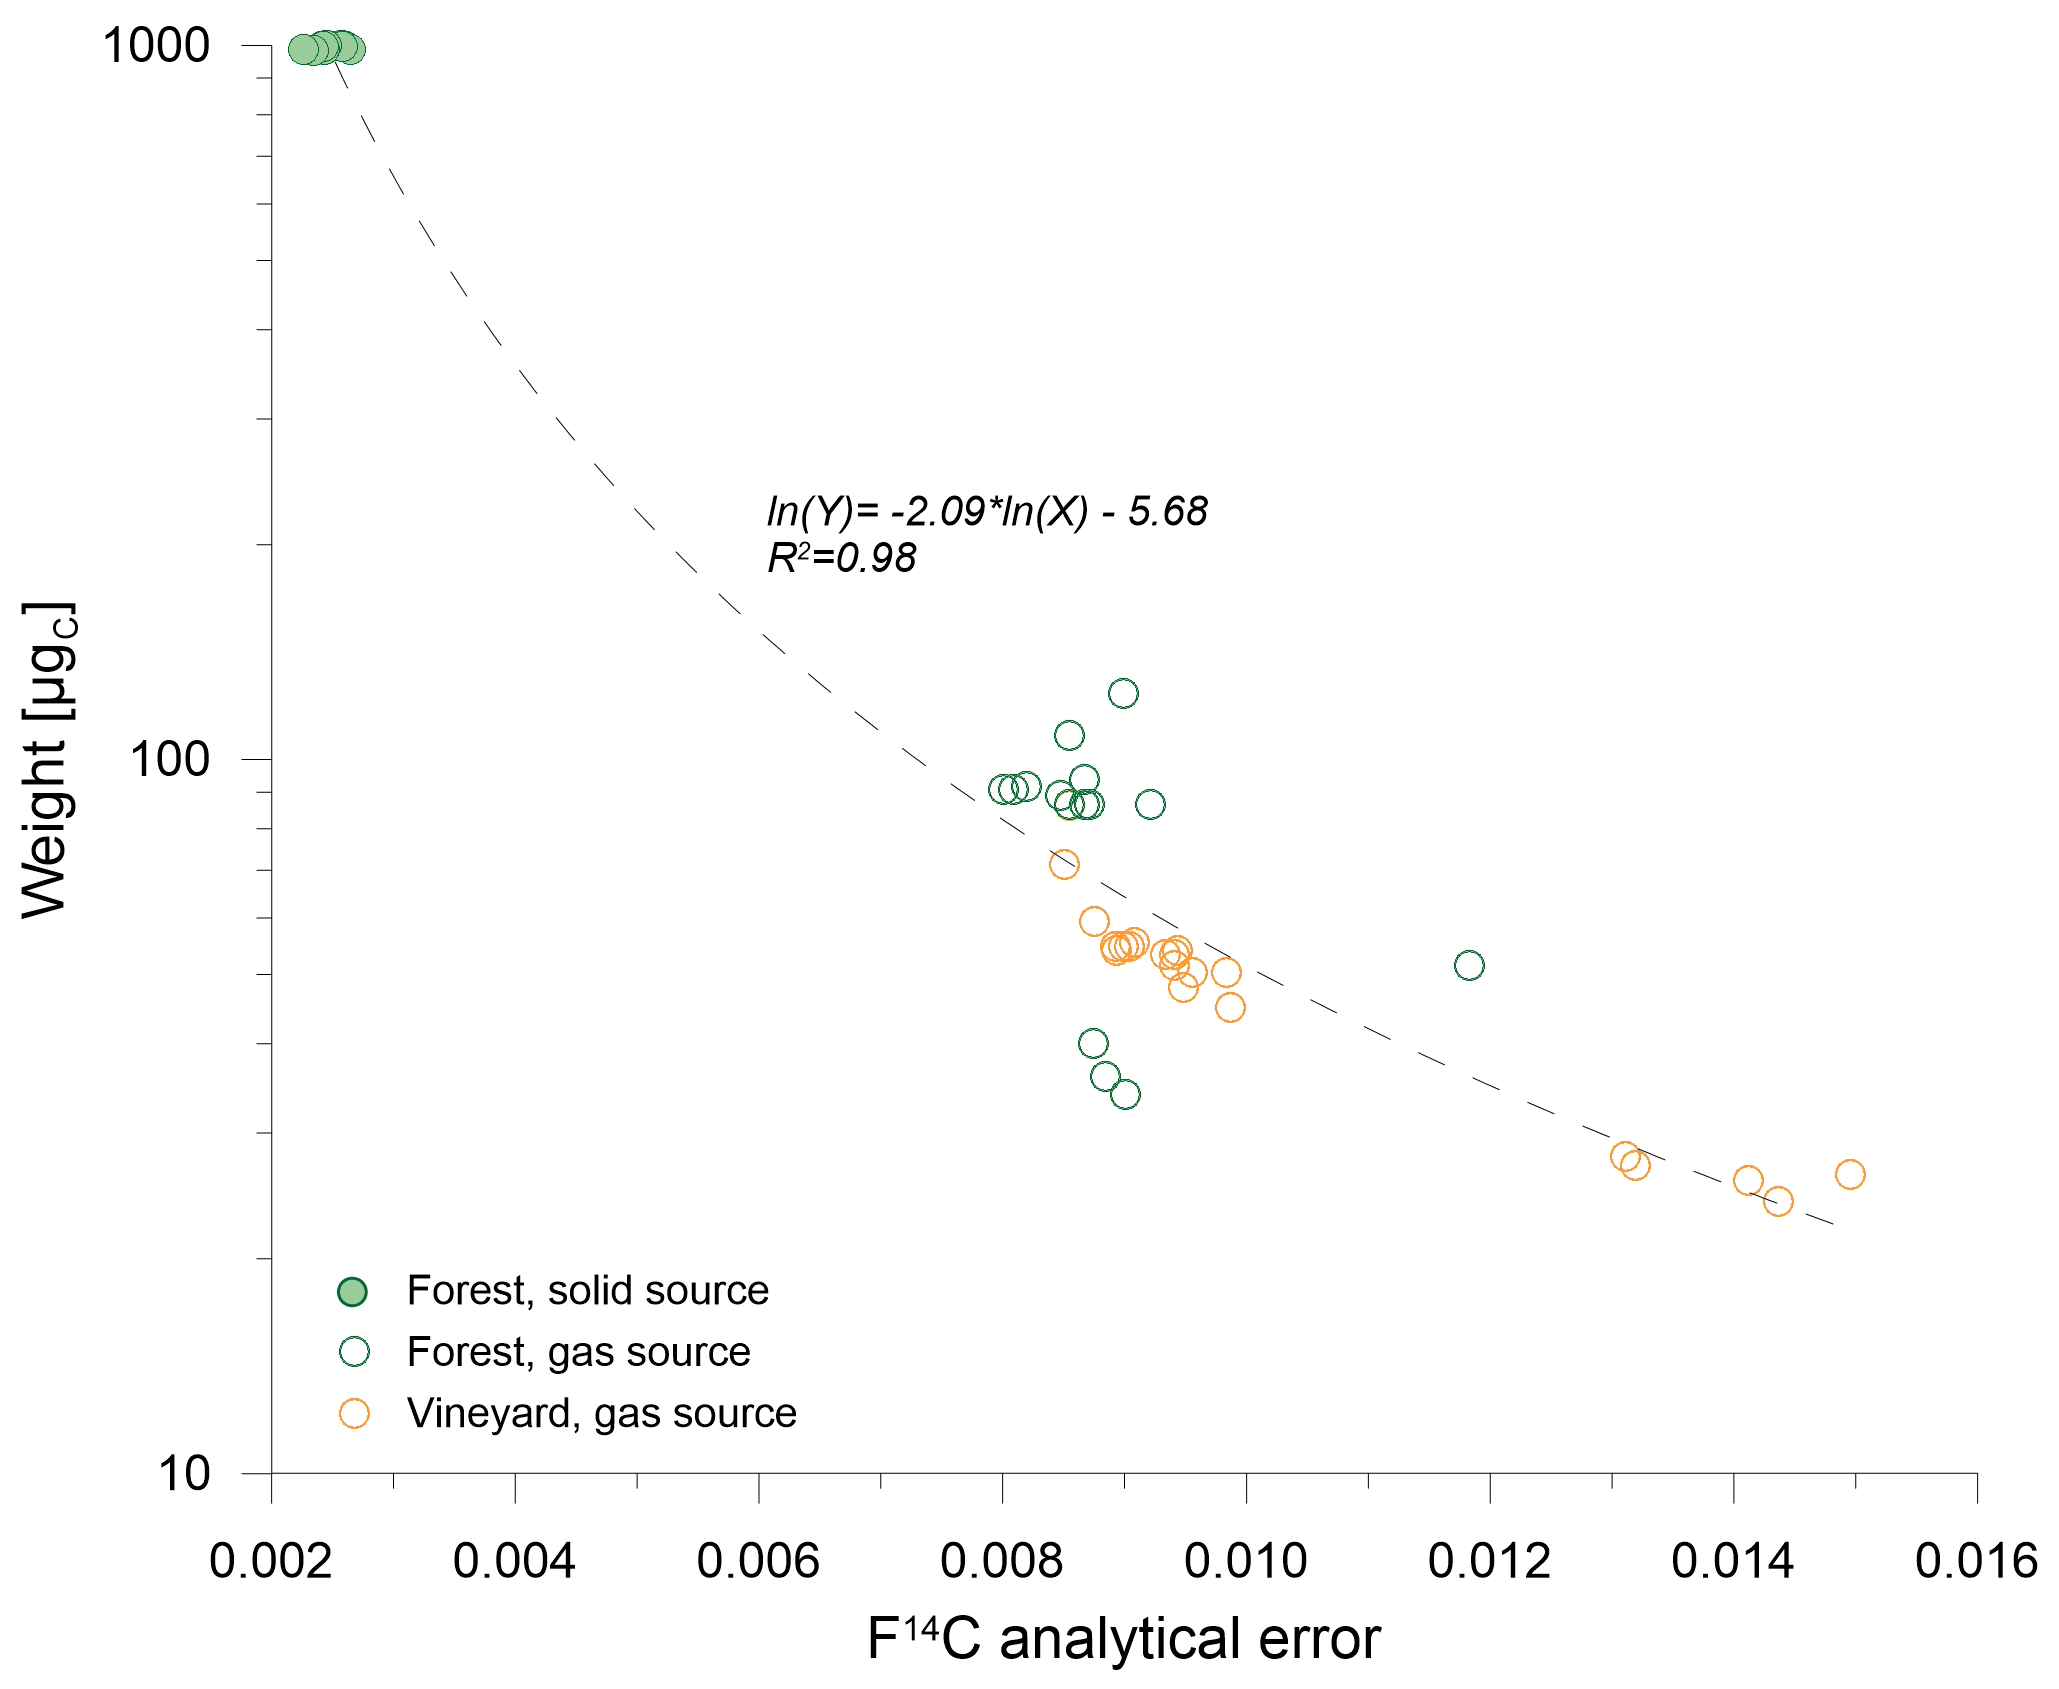
Figure C1Influence of the carbon mass of the measured sample on the analytical error of ECHoMICADAS. The solid green circles represent soil samples obtained under the forest analyzed with the solid source, the empty green circles those analyzed with the gas source, and the empty orange circles are the soil samples obtained under vines analyzed with the gas source.
The p values showed a significant difference (< 0.01) in TOC between forest and vineyard soils to 60 cm depth.
Table D1Table of bulk density (g cm−3), coarse elements (%), TOC (g C kg−1), C:N ratio as a function of plant cover and depth. A, B, and C are the pit profiles, BD is the bulk density, CE is the coarse element, ± is the analytical error, X is the mean of the three A, B, and C profiles, and SD is the standard deviation.
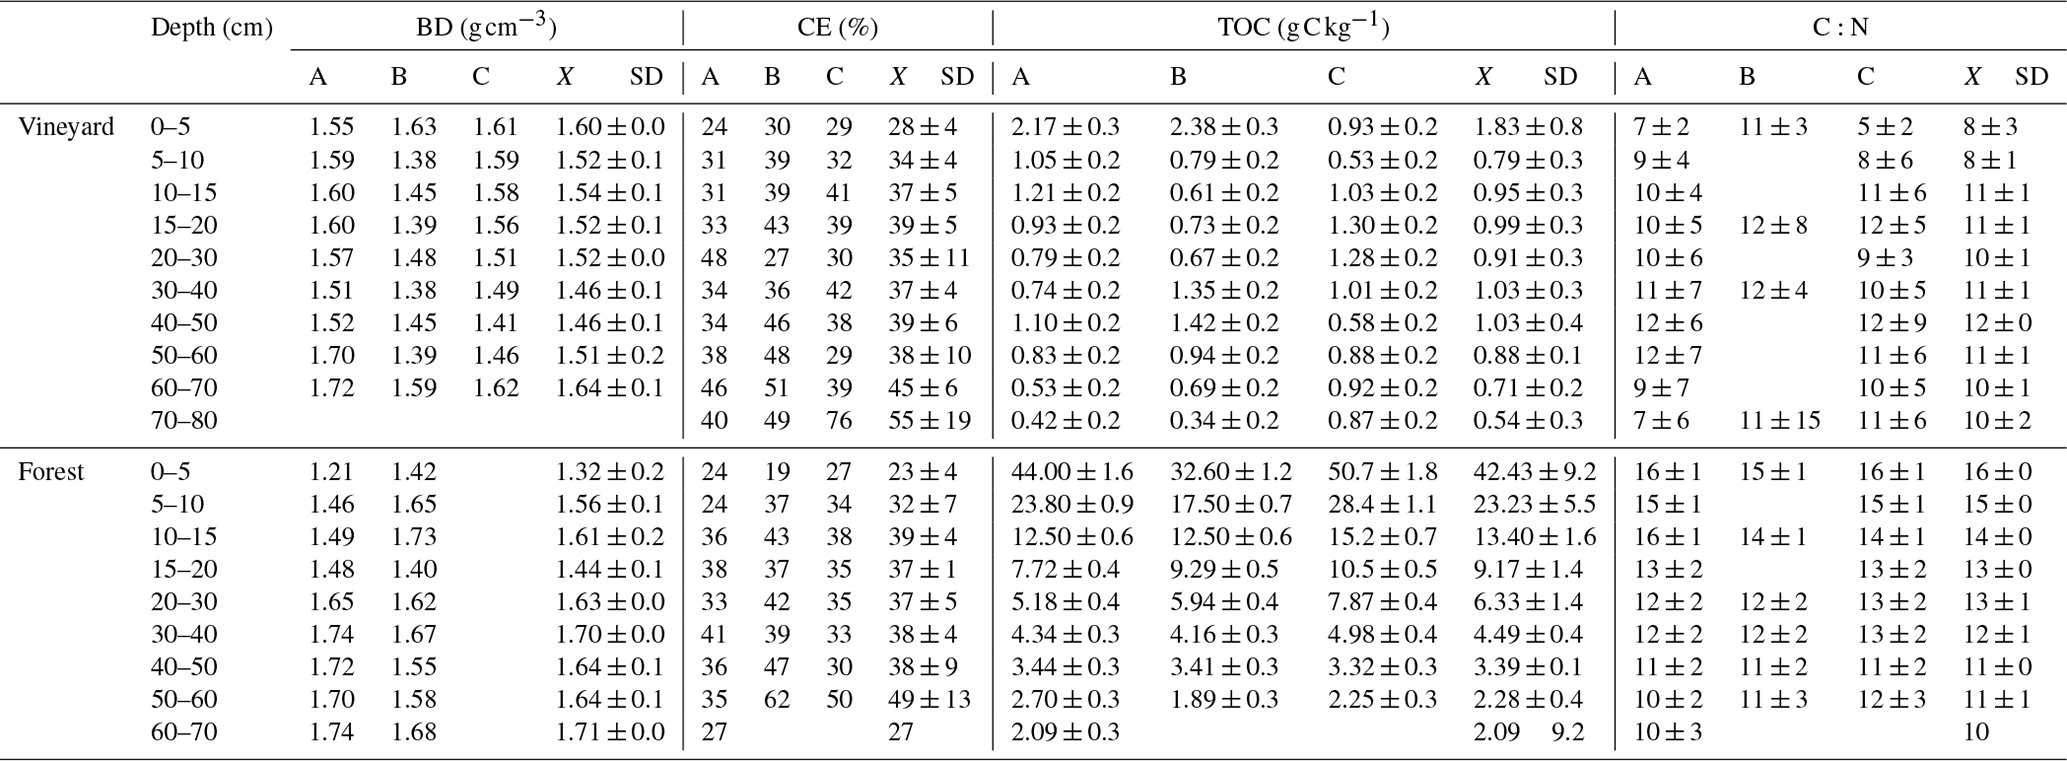
Table D2We use p values from Student's t test to compare, depth by depth, the TOC between vineyard and forest soils. This test is applicable if the variances are in the same order of magnitude. We therefore performed the test on log 10(TOC) to have similar orders of magnitude of variances between vineyard and forest soils. The p value results are shown below.
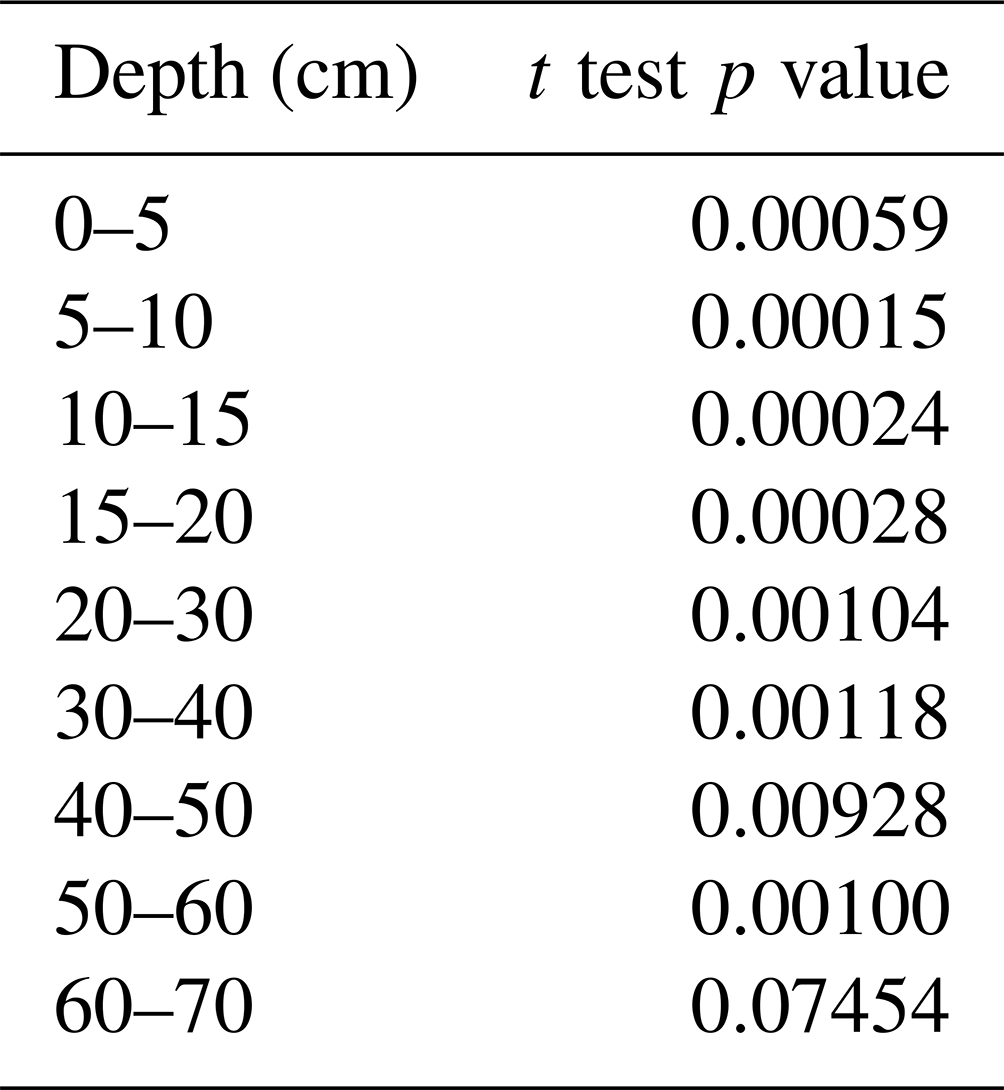
Table D3We use p values from Student's t test to compare the C:N ratio between vine and forest soils. Up to 50 cm depth, the p values were under 0.05, except for the 15–20 and 30–40 cm horizons where they were less than 0.1. This result shows that there was a significant difference in C:N, with lower values in the vineyard than in the forest soils. This result tended to confirm that, at equivalent depth, the C pool remaining in the vineyard had a more marked microbial signature than the C pool in the forest soil.
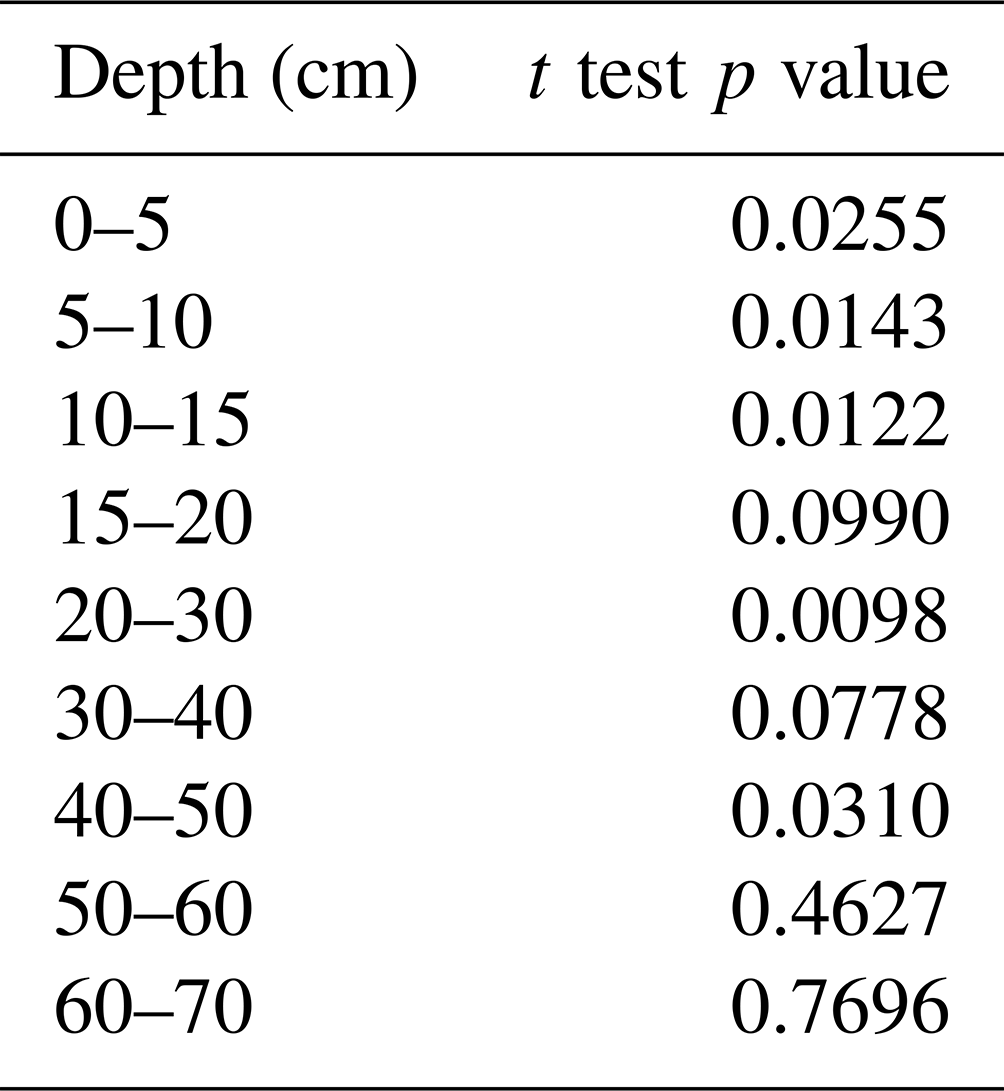
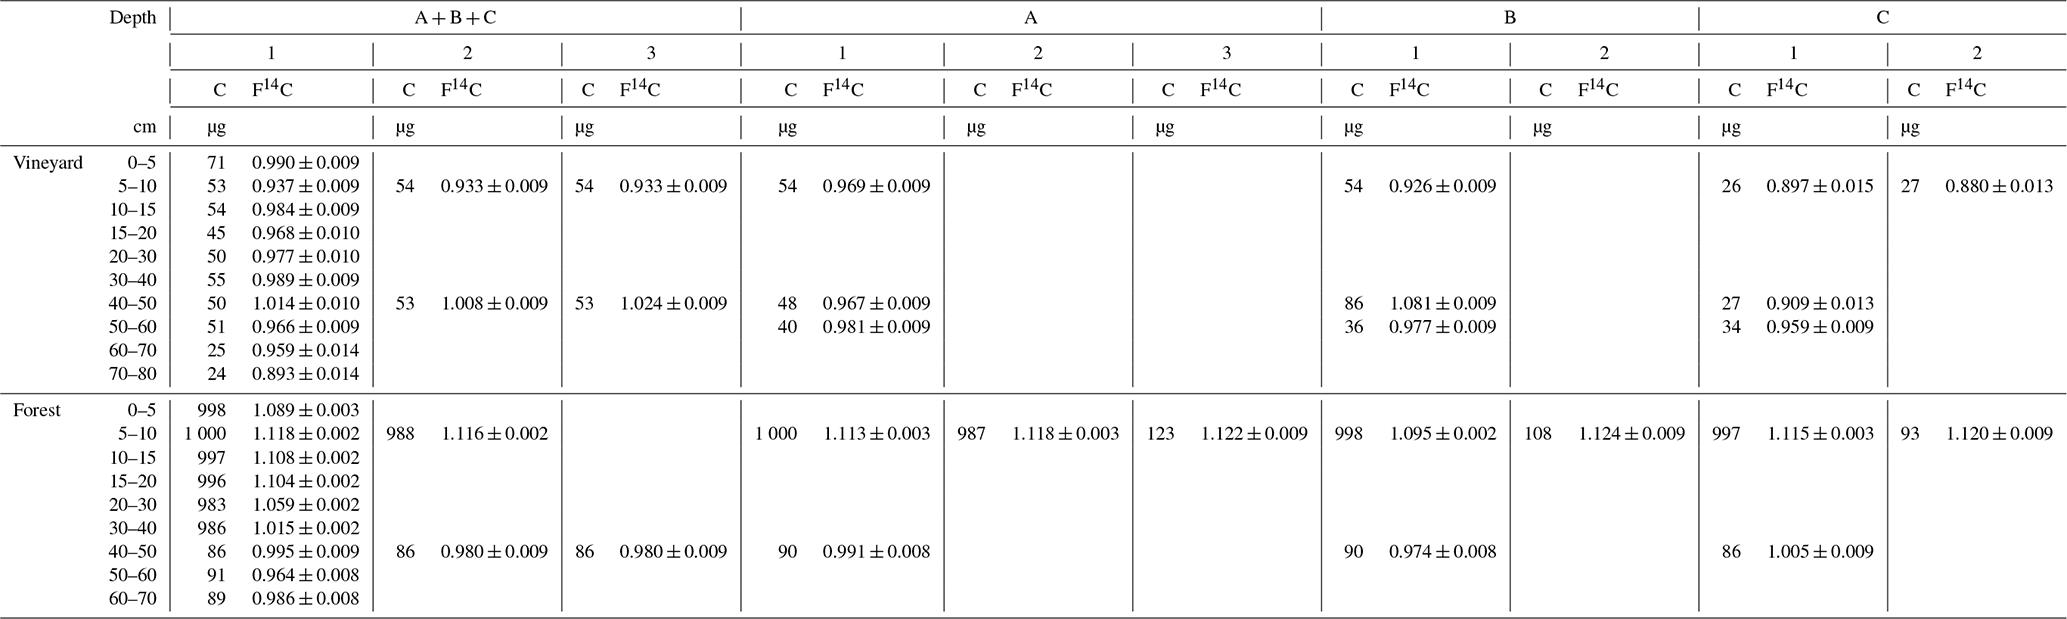
Table D4Amount of C measured (µg) and F14C per composite sample (A + B + C) or per profile (A, B, and C) according to soil depth. The numbers 1, 2, or 3 indicate the repetitions, and ± is the analytical error.
Figures D3 and D4: permutation tests
At 5–10 cm depth, the observed ratio was 9.16 (≠ 1). We repeated a permutation test of the RMS ratios between forest and vines (simulation) 1000 times, which we then compared to the observed ratio value (Fig. D3). The observed value was outside the simulated critical values with p = 0.02 (< 0.05). This showed that the variance under vines was significantly different from the variance under the forest.
At 40–50 cm depth, the observed ratio is 27.53 (≠ 1). Similarly, we repeated a permutation test 1000 times. The observed value was within the simulated critical values (Fig. D4), with a p = 0.01 (≪ 0.05). This showed that the variance under vines was significantly different from the variance under the forest.
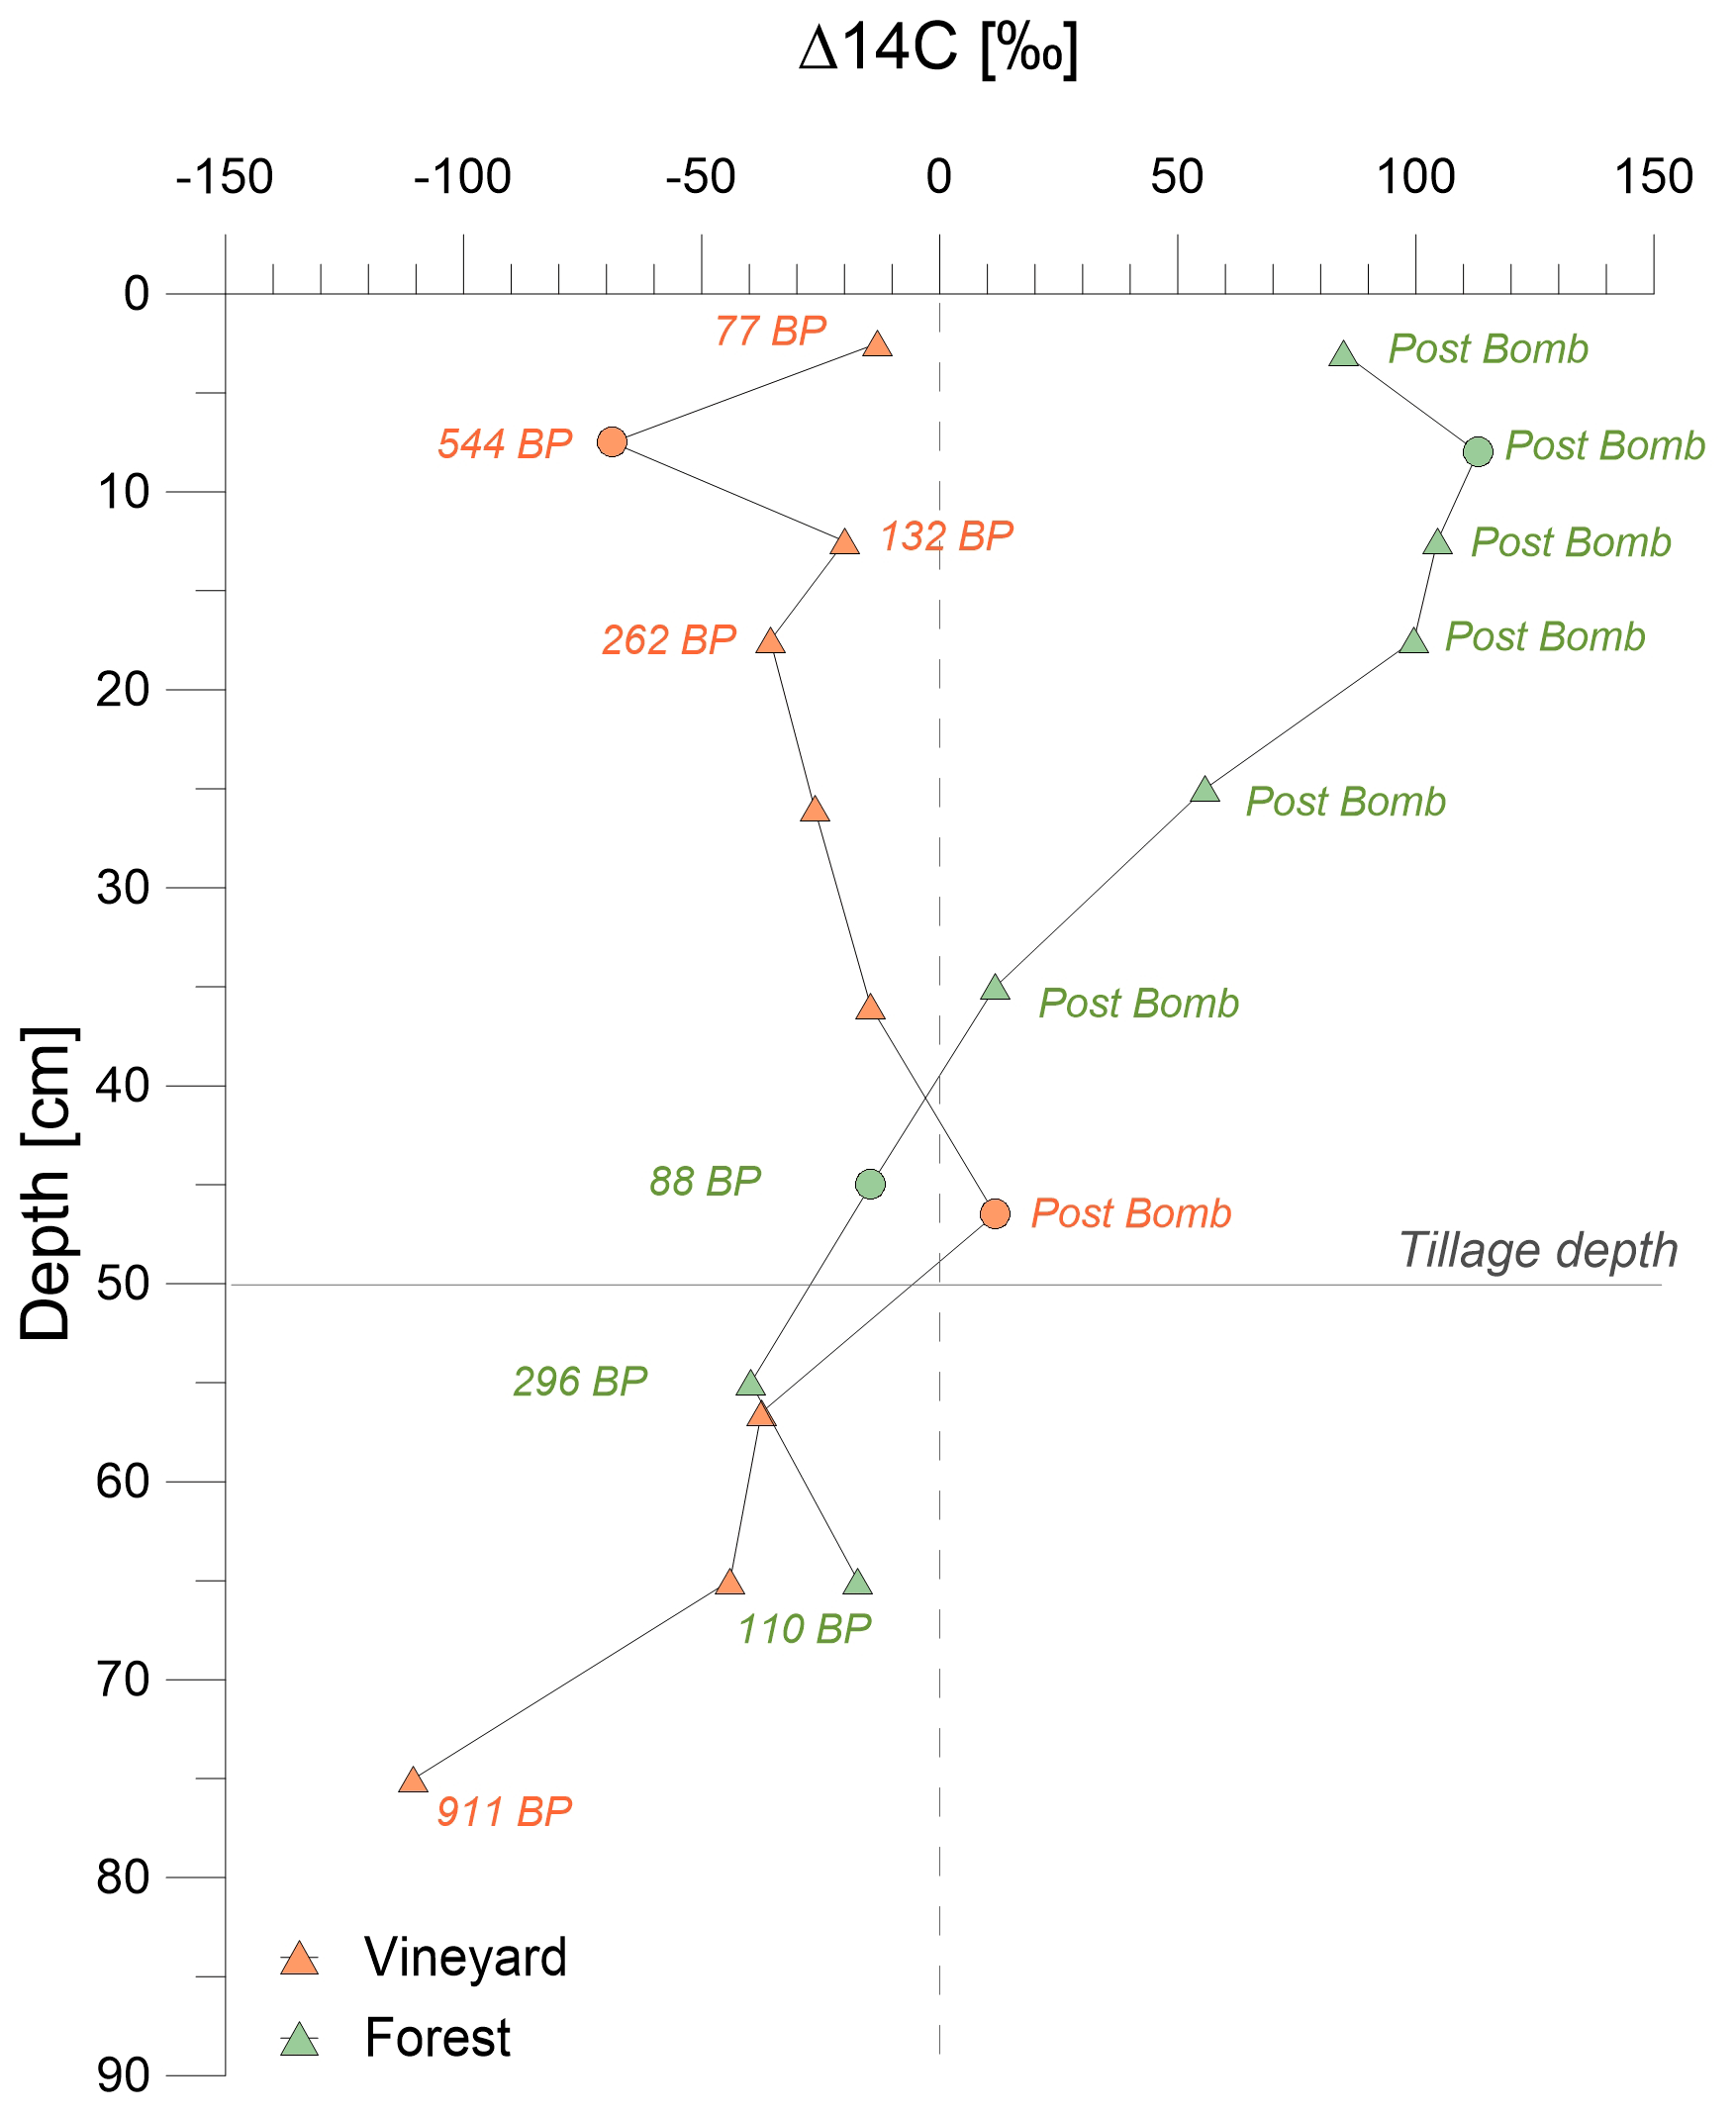
Figure D1Comparison of the BP age patterns, via Δ14C (‰), as a function of the soil depth and vegetation cover.
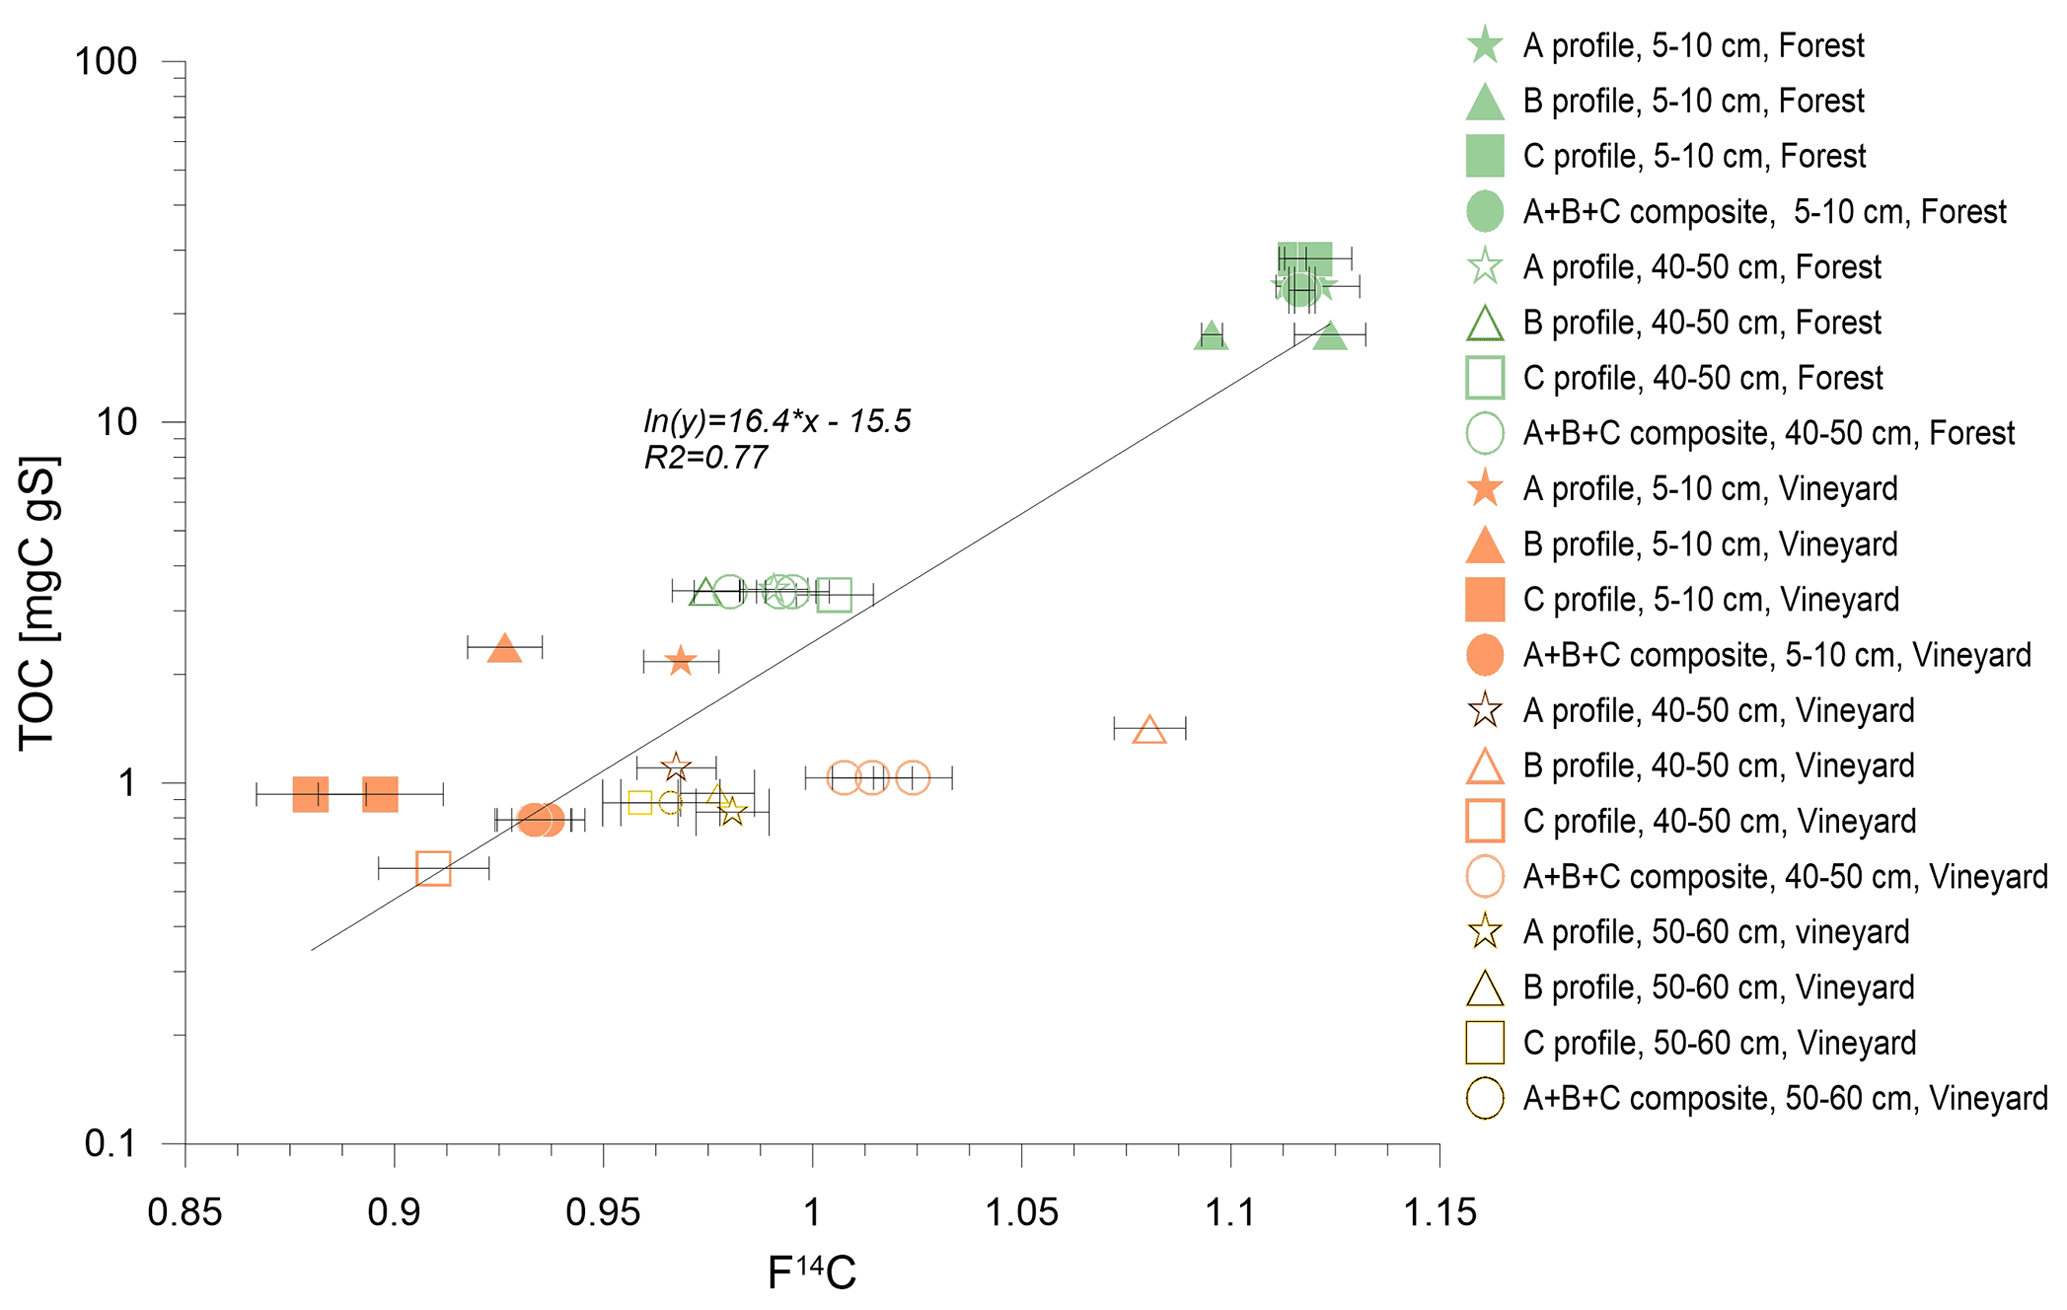
Figure D2Variations in carbon content as a function of F14C. Profiles A, B, and C are represented by stars, triangles, and squares, respectively. These symbols are solid when they represent topsoil samples (5–10 cm) and empty when they represent deep samples (40–50 cm). Soil samples obtained under the forest are green and those under vines are orange. The error bars represent the analytical error. The TOC values were higher with younger F14C (usually topsoil samples), and R2 = 0.77. Under the vineyard, plowing had eliminated the young carbon pools.
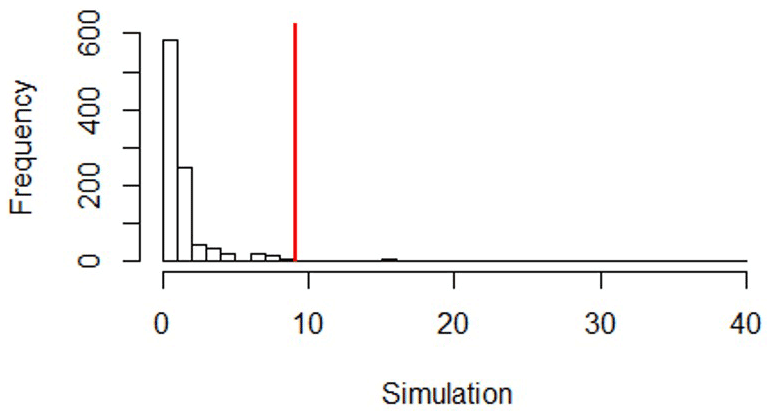
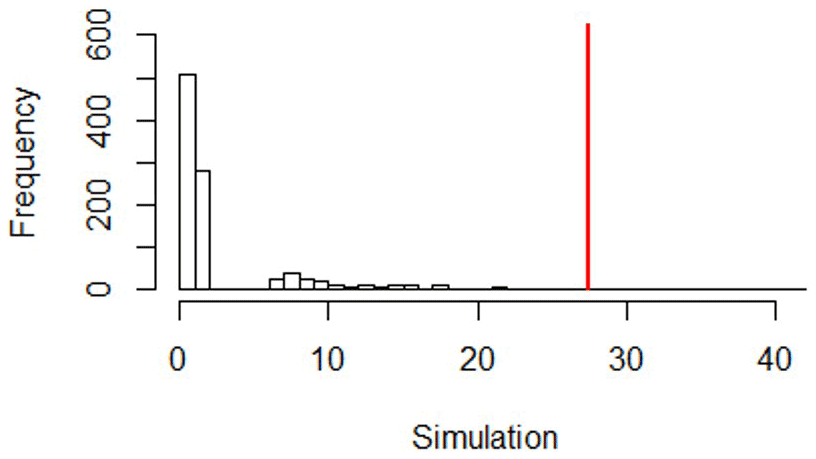
Table E1Here is a list of the papers used in this study, with land use type for each soil and associated TOC as a function of depth. These papers all deal with Arenosols, or at least sandy soils, in Mediterranean climates according to the Köppen–Geiger criteria (csa means temperate climate and dry and hot summer, and csb means a warm, temperate climate with a warm and dry summer). They were found by accessing the ISRaD database or the Web of Science with the keywords “14C Arenosol heterogeneity”.
NA: not available.
Table E2The Köppen–Geiger Mediterranean climate classes, including the defining criteria, adapted from (Beck et al., 2018). MAT is the mean annual air temperature (∘C), Tcold is the air temperature of the coldest month (∘C), Thot is the air temperature of the warmest month (∘C), Tmon10 is the number of months with air temperature > 10 ∘C (unitless), MAP is the mean annual precipitation (mm yr−1), Psdry is the precipitation in the driest month in summer (mm per month), Pwwet is the precipitation in the wettest month in winter (mm per month), and Pthreshold is the 2 × MAT if > 70 % of precipitation falls in winter, Pthreshold is the 2 × MAT + 28 if > 70 % of precipitation falls in summer, or otherwise Pthreshold is the 2 × MAT + 14. Summer (winter) is the 6-month period that is warmer (colder) between April–September and October–March.

The data used in this paper are included in the Appendix. The R scripts used in this paper are available on request.
The conceptualization of the study for this paper was done by SQ, SC, and IBD, with input from NC, FJ, DB, AD, and CH. All authors participated in the resource collection. The data curation and formal analysis and methodology were done by SQ, IBD, and CH. The visualization for the paper was performed by SQ, with substantial input from IBD and CH, as well as feedback from all authors. SQ and IBD wrote the initial draft, and all authors were involved in the review and editing of the paper.
The contact author has declared that none of the authors has any competing interests.
Publisher's note: Copernicus Publications remains neutral with regard to jurisdictional claims in published maps and institutional affiliations.
We would like to thank Jérôme Balesdent, who sadly left us too soon, for his precious support. We would also like to thank Joël Chadoeuf, for his invaluable expertise in statistics. We thank Frank Février and Bernard Coulomb, president of the Vignerons du Plan de la Tour cooperative, for allowing us to sample soils in their plots. Finally, we would like to thank Frédéric Guibal, for his dendrochronology expertise. We would also like to thank the editor, Estela Nadal Romero and the reviewer, M. Julian Campo. We also thank CNRS INSU, for the additional financial support to Solène Quero (doctoral researcher) in the context of the COVID-19 pandemic.
This research has been funded by the Agence Nationale de la Recherche (NanoSoilC project; grant no. ANR-16-CE01-0012-02) and supported by the University of Aix-Marseille.
This paper was edited by Estela Nadal Romero and reviewed by Julian Campo and one anonymous referee.
Andreetta, A., Dignac, M.-F., and Carnicelli, S.: Biological and physico-chemical processes influence cutin and suberin biomarker distribution in two Mediterranean forest soil profiles, Biogeochemistry, 112, 41–58, https://doi.org/10.1007/s10533-011-9693-9, 2013.
Anon: ISRaD: International Soil Radiocarbon Database, https://soilradiocarbon.org/ (last access: 17 May 2021), 2020.
Balesdent, J., Basile-Doelsch, I., Chadoeuf, J., Cornu, S., Derrien, D., Fekiacova, Z., and Hatté, C.: Atmosphere–soil carbon transfer as a function of soil depth, Nature, 559, 599–602, https://doi.org/10.1038/s41586-018-0328-3, 2018.
Barré, P., Cécillon, L., Chenu, C., Martin, M., and Vidal-Beaudet, L., and Eglin, T.: La séquestration de carbone dans les sols agricoles, forestiers et urbains : état des lieux des méthodes d’évaluation et de quantification, Etude et Gestion des Sols, 27, 305–320, 2020.
Batjes, N. H.: Total carbon and nitrogen in the soils of the world, Eur. J. Soil Sci., 65, 10–21, https://doi.org/10.1111/ejss.12114_2, 2014.
Beck, H. E., Zimmermann, N. E., McVicar, T. R., Vergopolan, N., Berg, A., and Wood, E. F.: Present and future Köppen–Geiger climate classification maps at 1-km resolution, Sci. Data, 5, 180214, https://doi.org/10.1038/sdata.2018.214, 2018.
Bogunovic, I., Pereira, P., Kisic, I., Birkás, M., and Rodrigo-Comino, J.: Spatiotemporal Variation of Soil Compaction by Tractor Traffic Passes in a Croatian Vineyard, J. Agr. Sci. Tech., 21, 1921–1932, 2019.
Bordoni, M., Vercesi, A., Maerker, M., Ganimede, C., Reguzzi, M. C., Capelli, E., Wei, X., Mazzoni, E., Simoni, S., Gagnarli, E., and Meisina, C.: Effects of vineyard soil management on the characteristics of soils and roots in the lower Oltrepò Apennines (Lombardy, Italy), Sci. Total Environ., 693, 133390, https://doi.org/10.1016/j.scitotenv.2019.07.196, 2019.
Caravaca, F., Masciandaro, G., and Ceccanti, B.: Land use in relation to soil chemical and biochemical properties in a semiarid Mediterranean environment, Soil Till. Res., 68, 23–30, https://doi.org/10.1016/S0167-1987(02)00080-6, 2002.
Carlisle, E. A., Steenwerth, K. L., and Smart, D. R.: Effects of Land Use on Soil Respiration: Conversion of Oak Woodlands to Vineyards, J. Environ. Qual., 35, 1396–1404, https://doi.org/10.2134/jeq2005.0155, 2006.
Chiti, T., Certini, G., Forte, C., Papale, D., and Valentini, R.: Radiocarbon-Based Assessment of Heterotrophic Soil Respiration in Two Mediterranean Forests, Ecosystems, 19, 62–72, https://doi.org/10.1007/s10021-015-9915-4, 2016.
Conradie, W. J.: Timing of Nitrogen Fertilisation and the Effect of Poultry Manure on the Performance of Grapevines on Sandy Soil. I. Soil Analysis, Grape Yield and Vegetative Growth, S. Afr. J. Enol.Vitic., 22, 53–59, https://doi.org/10.21548/22-2-2192, 2001.
Cotrufo, M. F., Wallenstein, M. D., Boot, C. M., Denef, K., and Paul, E.: The Microbial Efficiency-Matrix Stabilization (MEMS) framework integrates plant litter decomposition with soil organic matter stabilization: do labile plant inputs form stable soil organic matter?, Glob. Change Biol., 19, 988–995, https://doi.org/10.1111/gcb.12113, 2013.
Cotrufo, M. F., Ranalli, M. G., Haddix, M. L., Six, J., and Lugato, E.: Soil carbon storage informed by particulate and mineral-associated organic matter, Nat. Geosci., 12, 989–994, https://doi.org/10.1038/s41561-019-0484-6, 2019.
Eldon, J. and Gershenson, A.: Effects of Cultivation and Alternative Vineyard Management Practices on Soil Carbon Storage in Diverse Mediterranean Landscapes: A Review of the Literature, Agroecol. Sustain. Food Syst., 39, 516–550, https://doi.org/10.1080/21683565.2015.1007407, 2015.
Ellert, B. H. and Bettany, J. R.: Calculation of organic matter and nutrients stored in soils under contrasting management regimes, Can. J. Soil. Sci., 75, 529–538, https://doi.org/10.4141/cjss95-075, 1995.
FAO: World reference base for soil resources 2014: international soil classification system for naming soils and creating legends for soil maps, FAO, Rome, 2014.
FAO: The future of food and agriculture – Alternative pathways to 2050, Rome, 224 pp., Licence: CC BY-NC-SA 3.0 IGO, 2018.
Ferreira, C. S. S., Keizer, J. J., Santos, L. M. B., Serpa, D., Silva, V., Cerqueira, M., Ferreira, A. J. D., and Abrantes, N.: Runoff, sediment and nutrient exports from a Mediterranean vineyard under integrated production: An experiment at plot scale, Agr. Ecosyst. Environ., 256, 184–193, https://doi.org/10.1016/j.agee.2018.01.015, 2018.
Ferreira, C. S., Veiga, A., Caetano, A., Gonzalez-Pelayo, O., Karine-Boulet, A., Abrantes, N., Keizer, J., and Ferreira, A. J.: Assessment of the Impact of Distinct Vineyard Management Practices on Soil Physico-Chemical Properties, Air Soil Water Res., 13, 1–13, https://doi.org/10.1177/1178622120944847, 2020.
Fierro, A., Rutigliano, F. A., Marco, A. D., Castaldi, S., and Santo, A. V. D.: Post-fire stimulation of soil biogenic emission of CO2 in a sandy soil of a Mediterranean shrubland, Int. J. Wildland Fire, 16, 573, https://doi.org/10.1071/WF06114, 2007.
Fourie, J. C., Louw, P. J. E., Agenbag, G. A., and Infruitec-Nietvoorbij, A.: Cover crop management in a Sauvignon blanc/Ramsey vineyard in the semi-arid Olifants River Valley, South Africa. 1. Effect of management practices on selected grass and broadleaf species, S. Afr. J. Enol. Vitic., 26, 131–139, https://doi.org/10.21548/26-2-2129, 2005.
Giagnoni, L., Maienza, A., Baronti, S., Vaccari, F. P., Genesio, L., Taiti, C., Martellini, T., Scodellini, R., Cincinelli, A., Costa, C., Mancuso, S., and Renella, G.: Long-term soil biological fertility, volatile organic compounds and chemical properties in a vineyard soil after biochar amendment, Geoderma, 344, 127–136, https://doi.org/10.1016/j.geoderma.2019.03.011, 2019.
Guillaume, T., Bragazza, L., Levasseur, C., Libohova, Z., and Sinaj, S.: Long-term soil organic carbon dynamics in temperate cropland-grassland systems, Agr. Ecosyst. Environ., 305, 107184, https://doi.org/10.1016/j.agee.2020.107184, 2021.
Humbel, F. X.: STRUCTURAL ANALYSIS OF SOIL MANTLES AND ORIENTATED DESIGNS OF AGRONOMIC EXPERIMENTS, IBSRAM, ISBN 974-87467-5-5, 153–162, 1987.
Jiang, Y., Luo, C., Zhang, D., Ostle, N. J., Cheng, Z., Ding, P., Shen, C., and Zhang, G.: Radiocarbon evidence of the impact of forest-to-plantation conversion on soil organic carbon dynamics on a tropical island, Geoderma, 375, 114484, https://doi.org/10.1016/j.geoderma.2020.114484, 2020.
Jreich, R.: Vertical dynamics of soil carbon – Combined use of isotopic tracers and statistical meta-analysis, Paris Saclay, Paris, 2018.
Kazlauskaite-Jadzevice, A., Tripolskaja, L., Volungevicius, J., and Baksiene, E.: Impact of land use change on organic carbon sequestration in Arenosol, Agr. Food Sci., 28, 9–17, https://doi.org/10.23986/afsci.69641, 2019.
Kleber, M., Eusterhues, K., Keiluweit, M., Mikutta, C., Mikutta, R., and Nico, P.: Mineral–Organic Associations: Formation, Properties, and Relevance in Soil Environments, Adv. Agron., 30, 1–140, https://doi.org/10.1016/bs.agron.2014.10.005, 2015.
Kögel-Knabner, I. and Amelung, W.: Soil organic matter in major pedogenic soil groups, Geoderma, 384, https://doi.org/10.1016/j.geoderma.2020.114785, 2021.
Kratschmer, S., Pachinger, B., Schwantzer, M., Paredes, D., Guernion, M., Burel, F., Nicolai, A., Strauss, P., Bauer, T., Kriechbaum, M., Zaller, J. G., and Winter, S.: Tillage intensity or landscape features: What matters most for wild bee diversity in vineyards?, Agr. Ecosyst. Environ., 266, 142–152, https://doi.org/10.1016/j.agee.2018.07.018, 2018.
Lal, R.: Soil Carbon Sequestration Impacts on Global Climate Change and Food Security, Science, 304, 1623–1627, https://doi.org/10.1126/science.1097396, 2004.
Lawrence, C. R., Beem-Miller, J., Hoyt, A. M., Monroe, G., Sierra, C. A., Stoner, S., Heckman, K., Blankinship, J. C., Crow, S. E., McNicol, G., Trumbore, S., Levine, P. A., Vindušková, O., Todd-Brown, K., Rasmussen, C., Hicks Pries, C. E., Schädel, C., McFarlane, K., Doetterl, S., Hatté, C., He, Y., Treat, C., Harden, J. W., Torn, M. S., Estop-Aragonés, C., Asefaw Berhe, A., Keiluweit, M., Della Rosa Kuhnen, Á., Marin-Spiotta, E., Plante, A. F., Thompson, A., Shi, Z., Schimel, J. P., Vaughn, L. J. S., von Fromm, S. F., and Wagai, R.: An open-source database for the synthesis of soil radiocarbon data: International Soil Radiocarbon Database (ISRaD) version 1.0, Earth Syst. Sci. Data, 12, 61–76, https://doi.org/10.5194/essd-12-61-2020, 2020.
Libby, W. F., Anderson, E. C., and Arnold, J. R.: Age Determination by Radiocarbon Content: World-Wide Assay of Natural Radiocarbon, Science, 109, 227–228, https://doi.org/10.1126/science.109.2827.227, 1949.
López-Piñeiro, A.: Influence of the management regime and phenological state of the vines on the physicochemical properties and the seasonal fluctuations of the microorganisms in a vineyard soil under semi-arid conditions, Soil Till. Res., 126, 119–126, https://doi.org/10.1016/j.still.2012.09.007, 2013.
Manly, B. F. J.: Randomization, Bootstrap and Monte Carlo Methods in Biology, third edn., Chapman and Hall/CRC, New York, 488 pp., https://doi.org/10.1201/9781315273075, 2006.
Marschner, B. and Waldemar Wilczynski, A.: The effect of liming on quantity and chemical composition of soil organic matter in a pine forest in Berlin, Germany, Plant Soil, 137, 229–236, https://doi.org/10.1007/BF00011201, 1991.
Mathieu, J. A., Hatté, C., Balesdent, J., and Parent, É.: Deep soil carbon dynamics are driven more by soil type than by climate: a worldwide meta-analysis of radiocarbon profiles, Glob. Change Biol., 21, 4278–4292, https://doi.org/10.1111/gcb.13012, 2015.
Mousset, J.: ADEME: Carbone des sols: enjeu pour le climat et l’agronomie, ADEME, 28 pp., 2014.
Muñoz-Rojas, M., Jordán, A., Zavala, L. M., De la Rosa, D., Abd-Elmabod, S. K., and Anaya-Romero, M.: Organic carbon stocks in Mediterranean soil types under different land uses (Southern Spain), Solid Earth, 3, 375–386, https://doi.org/10.5194/se-3-375-2012, 2012.
Nogales, A., Santos, E. S., Abreu, M. M., Arán, D., Victorino, G., Pereira, H. S., Lopes, C. M., and Viegas, W.: Mycorrhizal Inoculation Differentially Affects Grapevine's Performance in Copper Contaminated and Non-contaminated Soils, Front. Plant Sci., 9, 1906, https://doi.org/10.3389/fpls.2018.01906, 2019.
Okur, N., Altindişli, A., Çengel, M., Göçmez, S., and Kayikçioğlu, H. H.: Microbial biomass and enzyme activity in vineyard soils under organic and conventional farming systems, Turk. J. Agric. For., 33, 413–423, https://doi.org/10.3906/tar-0806-23, 2009.
Panagos, P., Borrelli, P., Poesen, J., Ballabio, C., Lugato, E., Meusburger, K., Montanarella, L., and Alewell, C.: The new assessment of soil loss by water erosion in Europe, Environ. Sci. Policy, 54, 438–447, https://doi.org/10.1016/j.envsci.2015.08.012, 2015.
Payen, F. T., Sykes, A., Aitkenhead, M., Alexander, P., Moran, D., and MacLeod, M.: Soil organic carbon sequestration rates in vineyard agroecosystems under different soil management practices: A meta-analysis, J. Clean., 13, https://doi.org/10.1016/j.jclepro.2020.125736, 2021.
Pellerin, S., Bamière, L., Launay, C., Martin, R., Schiavo, M., Angers, D., Augusto, L., Balesdent, J., Basile-Doelsch, I., Bellassen, V., Cardinael, R., Cécillon, L., Ceschia, E., Chenu, C., Constantin, J., Daroussin, J., Delacote, P., Delame, N., Gastal, F., Gilbert, D., Graux, A.-I., Guenet, B., Houot, S., Klumpp, K., Letort, E., Litrico, I., Martin, M., Menasseri-Aubry, S., Meziere, D., Morvan, T., Mosnier, C., Roger-Estrade, J., Saint-André, L., Sierra, J., Therond, O., Viaud, V., Grateau, R., Perchec, S.L., Savini, I., and Rechauchère, O.: Stocker du carbone dans les sols français : quel potentiel au regard de l’objectif de 4 pour 1000 et à quel coût?, Rapport scientifique de l’étude, Étude réalisée pour l’ADEME et le ministère de l’Agriculture et de l’Alimentation, [Autre] INRA (France), 114 pp., 2019.
Pinzari, F., Trinchera, A., Benedetti, A., and Sequi, P.: Use of biochemical indices in the mediterranean environment: comparison among soils under different forest vegetation, J. Microbiol. Meth., 36, 21–28, https://doi.org/10.1016/S0167-7012(99)00007-X, 1999.
Poeplau, C. and Don, A.: Sensitivity of soil organic carbon stocks and fractions to different land-use changes across Europe, Geoderma, 192, 189–201, 2013.
Poeplau, C., Vos, C., and Don, A.: Soil organic carbon stocks are systematically overestimated by misuse of the parameters bulk density and rock fragment content, SOIL, 3, 61–66, https://doi.org/10.5194/soil-3-61-2017, 2017.
Ramesh, T., Bolan, N. S., Kirkham, M. B., Wijesekara, H., Kanchikerimath, M., Srinivasa Rao, C., Sandeep, S., Rinklebe, J., Ok, Y. S., Choudhury, B. U., Wang, H., Tang, C., Wang, X., Song, Z., and Freeman II, O. W.: Soil organic carbon dynamics: Impact of land use changes and management practices: A review, in: Advances in Agronomy, vol. 156, edited by: Sparks, D. L., Elsevier, 1–107, https://doi.org/10.1016/bs.agron.2019.02.001, 2019.
Reimer, P. J., Brown, T. A., and Reimer, R. W.: Discussion: Reporting and Calibration of Post-Bomb 14C Data, Radiocarbon, 46, 1299–1304, 2004.
Ruff, M., Szidat, S., Gäggeler, H. W., Suter, M., Synal, H.-A., and Wacker, L.: Gaseous radiocarbon measurements of small samples, Nucl. Instrum. Methods Phys. Res. B, 268, 790–794, https://doi.org/10.1016/j.nimb.2009.10.032, 2010.
Rumpel, C. and Kögel-Knabner, I.: Deep soil organic matter—a key but poorly understood component of terrestrial C cycle, Plant Soil, 338, 143–158, https://doi.org/10.1007/s11104-010-0391-5, 2011.
Synal, H. A., Stocker, M., and Suter, M.: MICADAS: A new compact radiocarbon AMS system, Nucl. Instrum. B, 259, 7–13, https://doi.org/10.1016/j.nimb.2007.01.138, 2007.
Tisnérat-Laborde, N., Thil, F., Synal, H.-A., Cersoy, S., Hatté, C., Gauthier, C., Massault, M., Michelot, J.-L., Noret, A., Siani, G., Tombret, O., Vigne, J.-D., and Zazzo, A.: ECHoMICADAS: A new compact AMS system to measuring 14C for Environment, Climate and Human Sciences, Dakar, Senegal, 16–20 pp., 2015.
Trumbore, S.: Radiocarbon and Soil Carbon Dynamics, Annu. Rev. Earth Planet. Sc., 37, 47–66, https://doi.org/10.1146/annurev.earth.36.031207.124300, 2009.
Tsozué, D., Nafissa, B., Basga, S. D., and Balna, J.: Soil change in Arenosols under long term cultivation in the sudano-sahelian zone of Cameroon, Geoderma Regional, 23, e00338, https://doi.org/10.1016/j.geodrs.2020.e00338, 2020.
van der Voort, T. S., Hagedorn, F., McIntyre, C., Zell, C., Walthert, L., Schleppi, P., Feng, X., and Eglinton, T. I.: Variability in 14C contents of soil organic matter at the plot and regional scale across climatic and geologic gradients, Biogeosciences, 13, 3427–3439, https://doi.org/10.5194/bg-13-3427-2016, 2016.
Vittori Antisari, L., Laudicina, V. A., Falsone, G., Carbone, S., Badalucco, L., and Vianello, G.: Native and planted forest species determine different carbon and nitrogen pools in Arenosol developed on Holocene deposits from a costal Mediterranean area (Tuscany, Italy), Environ. Earth Sci., 75, 776, https://doi.org/10.1007/s12665-016-5581-x, 2016.
Wacker, L., Němec, M., and Bourquin, J.: A revolutionary graphitisation system: Fully automated, compact and simple, Nucl. Instrum. Meth. B, 268, 931–934, https://doi.org/10.1016/j.nimb.2009.10.067, 2010.
Wang, Y., Amundson, R., and Trumbore, S.: The impact of land use change on C turnover in soils, Global Biogeochem. Cy., 13, 47–57, https://doi.org/10.1029/1998GB900005, 1999.
Zomer, R. J., Bossio, D. A., Sommer, R., and Verchot, L. V.: Global Sequestration Potential of Increased Organic Carbon in Cropland Soils, Sci. Rep., 7, 15554, https://doi.org/10.1038/s41598-017-15794-8, 2017.
- Abstract
- Introduction
- Materials and methods
- Results
- Discussion
- Conclusion
- Appendix A: Site identification
- Appendix B: Textural and mineralogical comparison of vineyard and forest soil profiles
- Appendix C: Radiocarbon equations and analytical errors according the type of source used in ECHoMICADAS
- Appendix D: Data
- Appendix E: Comparison with the literature data
- Data availability
- Author contributions
- Competing interests
- Disclaimer
- Acknowledgements
- Financial support
- Review statement
- References