the Creative Commons Attribution 4.0 License.
the Creative Commons Attribution 4.0 License.
 | 10 May 2022
Potential effect of wetting agents added to agricultural sprays on the stability of soil aggregates
Antonín Kintl
Vítězslav Vlček
Martin Brtnický
Jan Nedělník
A potential effect of adjuvants/wetting agents added to the spray mixture on the water stability of soil aggregates (WSA) in agricultural soil was studied. Nine sites were chosen in the Czech Republic. Each site was mapped using representative soil pits (depth min. 1.3 m). A total of 54 mixed samples were collected from topsoil horizons on the selected sites. The samples were exposed to the action of four different types of wetting agents (organosilicone wetting agent; methyl ester of rapeseed oil; mixture of methyl ester palmitic and oleic acids; isodecyl alcohol ethoxylate), which are the most common wetting agents used in agriculture in the Czech Republic. WSA was determined before and after the addition of wetting agents (WA). Initial WSA values were at the same level in a majority of sampling points. Two sites were an exception, on which Haplic Luvisols and Relictistagnic Fluvisols occurred. These soil types featured the lowest WSA values. After the addition of WA across the sampling points, average WSA values exhibited a demonstrable trend: WSA of control sample (without the WA application) was at all times higher than in samples with the addition of WA. If the measured WSA values are compared in terms of overall means, it is evident that the control variant always exhibited the highest WSA value (on average 44.04 %) and the variants with the application of WA showed always WSA values lower by min. 16 %. The worst effect on WSA was that of wetting agents whose basic component was methyl ester of rapeseed. These wetting agents caused a decrease in WSA by more than 50 %. All soil samples were also analysed for basic soil parameters (glomalin, oxidizable carbon – Cox, pH, Na, P, Ca, K, Mg) in order to determine their potential influence on aggregate stability and to possibly eliminate the negative impact of WA. In this respect, only a significant influence of Cox content on WSA was recorded, which positively correlated with the stability of soil aggregates.
- Article
(6965 KB) - Full-text XML
- BibTeX
- EndNote


The main current threat to soil quality is global climate change and inappropriate arable land management, which reduces the resilience of the soil environment to fluctuations in meteorological phenomena (intensive rainfall, long periods of drought etc.). The consequence of these effects is water erosion, loss of nutrients from the soil and decreased content of soil organic matter (SOM) (Trnka et al., 2011; Panagos et al., 2015; Borreli et al., 2017). The most readily manageable of all mentioned impacts on the soil health and quality is management of arable land, which includes not only the mechanical processing of the soil but also the use of pesticides. Effects, disintegration and persistence of these pesticides into individual parts of the environment have been described very extensively in many studies (Floch et al., 2011; Burauel and Bassmann, 2005; Jacobsen and Hjelmsø, 2014). From this point of view, however, substances serving as carriers of these pesticides (Floch et al., 2011; Jacobsen and Hjelmsø, 2014) and their interactions with the environment that are still not known in detail can appear much more interesting. Pesticides are most often applied in the form of sprays, and very frequently in a mixture of several substances (Mesnage and Antoniou, 2018).
The mixture usually consists of water, active substance (pesticide) and improving substance (wetting agent, buffer solution etc.), the task of which is to enhance characteristics of the spray and to increase its efficiency (Hao et al., 2019; Mesnage and Antoniou, 2018). However, wetting agents can also be used for example in irrigation (Lehrsch et al., 2012, 2013).
Active substances (pesticides) are dissolved in water either separately or in combination with nutrient preparations. However, due to its high surface tension, water exhibits low retention capacity when applied on targets with waxy and hydrophobic surfaces such as the cuticle of plants (Castro et al., 2018). Therefore, substances are added to the spray mixture, which are called adjuvants or wetting agents. They serve to modify the spray viscosity (Slezak, 2015), to reduce the surface tension of the prepared fluid (Castro et al., 2018) and to enhance the capacity of spray mixture to cling to plant leaves. This also increases the efficiency of the used pesticide and reduces the amount that would have to be applied without the adjuvants (Hao et al., 2018; Castro et al., 2018). Apart from this, some pesticides (e.g., soil herbicides) can be applied together with the wetting agent directly into the soil where they gradually become degraded and may affect the whole soil environment (Hao et al., 2018; Baratella et al., 2018).
The addition of adjuvants to the spray mixture contributes to reduce the amount of used pesticides through the increased efficiency of their application. Accelerating the penetration, the adjuvants increase the permeability of cuticle and may alter the cuticular barrier to water loss (Räsch et al., 2018). In Europe, the first professional wetting agents were introduced for growing vegetables, namely species with a thick way layer on the leaves. The main goal was to reduce the surface tension of liquid so that pesticides would stay on the leaves. These adjuvants were simple surfactants. Later, higher alcohols and polymerizing substances started to be added to them in order to improve their resistance to be washed down from the plant leaves (by rain or irrigation). General evaluation of the safety of using pesticides is nearly exclusively focused on active substances contained in them. Nevertheless, adjuvants which are included in the spray mixture and are added in order to reduce the consumption of pesticides can be potentially dangerous as their negative impacts were observed both in humans and in the environment particularly in terms of their potential toxicity (Mesnage and Antoniou, 2018). Despite the existing knowledge about the negative impacts, adjuvants are not supervised and tested as for systems pesticides are (Mesnage and Antoniou, 2018; Mesnage et al., 2013). By the principle of their action, adjuvants alter the surface tension of water as a solvent of pesticides. This is why an assumption exists that they could affect the wetting capacity of soil aggregates (SAs) because the soil hydrophobicity increases the stability of SA (Mataix-Solera and Doerr, 2004). If the soil hydrophobicity is reduced due to changes in the surface tension of soil particles (reduced hydrophobicity of individual particles) due to the action of adjuvants, the stability of SA might decrease through the impact on the hydrophobicity of soil particle bonds (Zheng et al., 2016; Mao et al., 2019). A stability of SA reduction due to the acting of spray mixture may occur only if the mixture reaches the soil surface. This may happen when the density of growth to which it is applied is low and plant stems and leaves do not perfectly cover the soil surface. Thus, growth density not only affects the direct contact between the soil aggregates and the spray mixture but also the soil resilience to erosion (Brant et al., 2017).
Soil aggregates were defined as “naturally” occurring clumps or groups of soil particles in which forces holding the particles together are much greater than forces between the neighbouring aggregates (Martin et al., 1955). Soil aggregates comprise primary particles in an arrangement which allows the exchange of water and gases, biological activity and forms their stability. Soil aggregate stability is a property of soil aggregates to resist external forces acting on them at soil swelling, shrinkage and tillage (Papadopoulos, 2011; Angers, 1992). Stability of soil aggregates is an important feature of the entire agro-ecosystem because it is strongly related to soil functions such as carbon storage, SOM stabilization, water management and soil resilience to erosion (Joshi et al., 2020; Vadas and Sims, 2014). In addition, there are specific soil substances such as glomalin (a mixture of proteins, lipids and inorganic substances created by arbuscular fungi) that can stabilize the soil aggregates and thus enhance the soil structure. Apart from the original purpose to protect hyphae of arbuscular mycorrhizal fungi from losing water and nutrients, glomalin has a significant influence on the formation and stability of soil aggregates. When the hyphae of these fungi die and their fibres disintegrate, glomalin is released into the soil where its action is similar to that of soil glue which joins soil particles into larger aggregates. Thus, its presence in the soil significantly increases the resistance of soil aggregates to disintegration (Rillig et al., 2001; Emran et al., 2012; Holátko et al., 2021). Combined with the occurrence of mycorrhizal fungi, the content of SOM (living and inanimate organic matter, proteins – glomalin) and the base saturation (Ca2+, K+, Na+, Mg2+) have an essential influence on the degree of soil aggregate stability (Holátko et al., 2021; Bronick and Lal, 2005).
The formation of soil aggregate is necessary for the development of an optimum soil structure, which is one of primary prerequisites for soil fertility, i.e., production function of the soil. Aggregation directly relates to soil–root interactions, hydrological soil characteristics and soil capability of providing non-production functions (Papadopoulos, 2011). Thus, the presence of soil aggregates and the capability of aggregation are indispensable for agricultural production (Brtnický et al., 2017), and applied agrotechnological methods should promote them (Zheng et al., 2018; Brtnický et al., 2017). Intensive tillage without using regenerative methods such as, e.g., intermediate cropping and application of organic fertilizers results in the deterioration of soil structure and in the reduced stability of soil aggregates (Zheng et al., 2018). The most dramatic turning point in agriculture occurred in the second half of the 20th century thanks to the widespread use of pesticides, plant breeding, mineral fertilizers and modern agricultural machines (Dornbush and von Haden, 2017; Mens̆ík et al., 2020). However, the intensive soil tillage in combination with the excessive supply of mineral N into the soil leads to reduced stability of soil aggregates and hence to the degradation of soil structure (Brtnický et al., 2017). Another potential problem is the application of pesticides, for example herbicides which are dissolved in water prior to the application, and solution properties are modified using further preparations. If applied outside the intended plant or at an inappropriate dose, such a solution can affect the surrounding environment by different ways (changes in soil chemism and biological activity) (Castro et al., 2018).
Our goal was to analyse the effect of wetting agents added to the spray mixture on the stability of soil aggregates. Specifically, we assessed how the recommended dose of conventionally used wetting agents (L ha−1) for the preparation of agricultural sprays would affect the resilience of soil aggregates to disintegration upon a contact of the wetting agent with the soil. We also studied whether some soil properties could influence the effect in some way.
2.1 Soil sampling and characterization of sampling points
Soil was sampled in three regions of the Czech Republic (Fig. 1), on three farms in each of them, giving a total of nine sites (Table 1). Each region belongs in a different geomorphological unit, and sampling points were determined on each site (Table 1). All selected sites were subjected to a pedological survey – a total of nine soil pits were excavated to a depth of 1.3–1.5 m for the characterization of soil conditions on the given site on a specific agricultural plot. Each site was given a name after the village in the cadastral area of which it is situated. Six soil samples were then collected from the topsoil horizon at different sampling points (A–I) on each site in accordance with the methodology for sampling soil quality (ISO 10381: guidance on the collection, handling and storage of soil for subsequent testing under aerobic conditions in the laboratory). The sampling was made in 2019, at the end of the growing season, prior to the harvest of grown crops. As the measured water stability of soil aggregates (WSA) values did not differ at the individual sampling points (Figs. A1, A2 in the Appendix), this designation (A–I) was used in the text for individual variants.
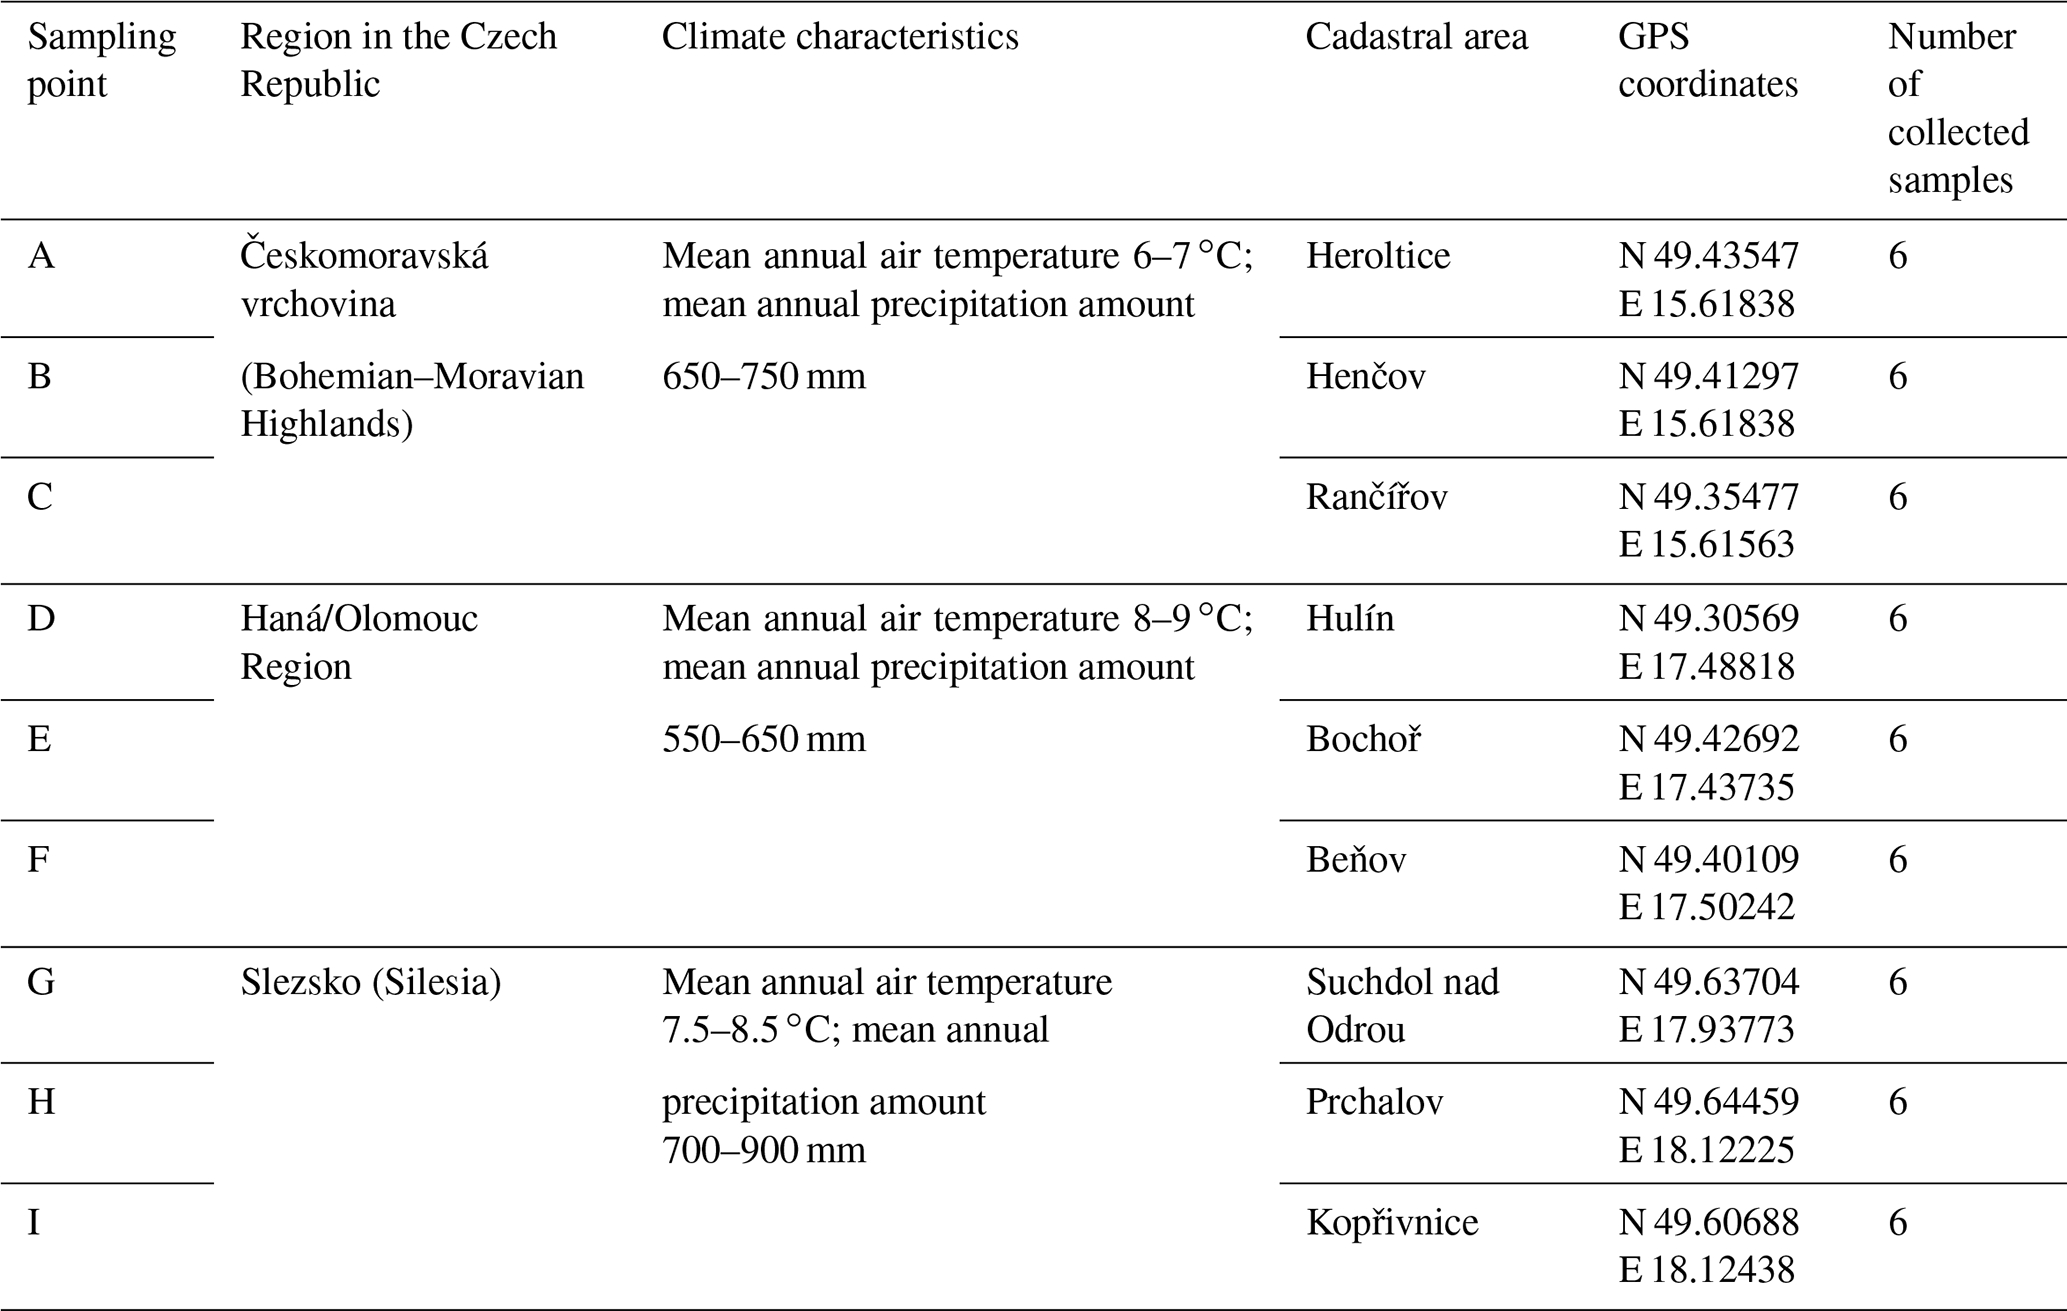
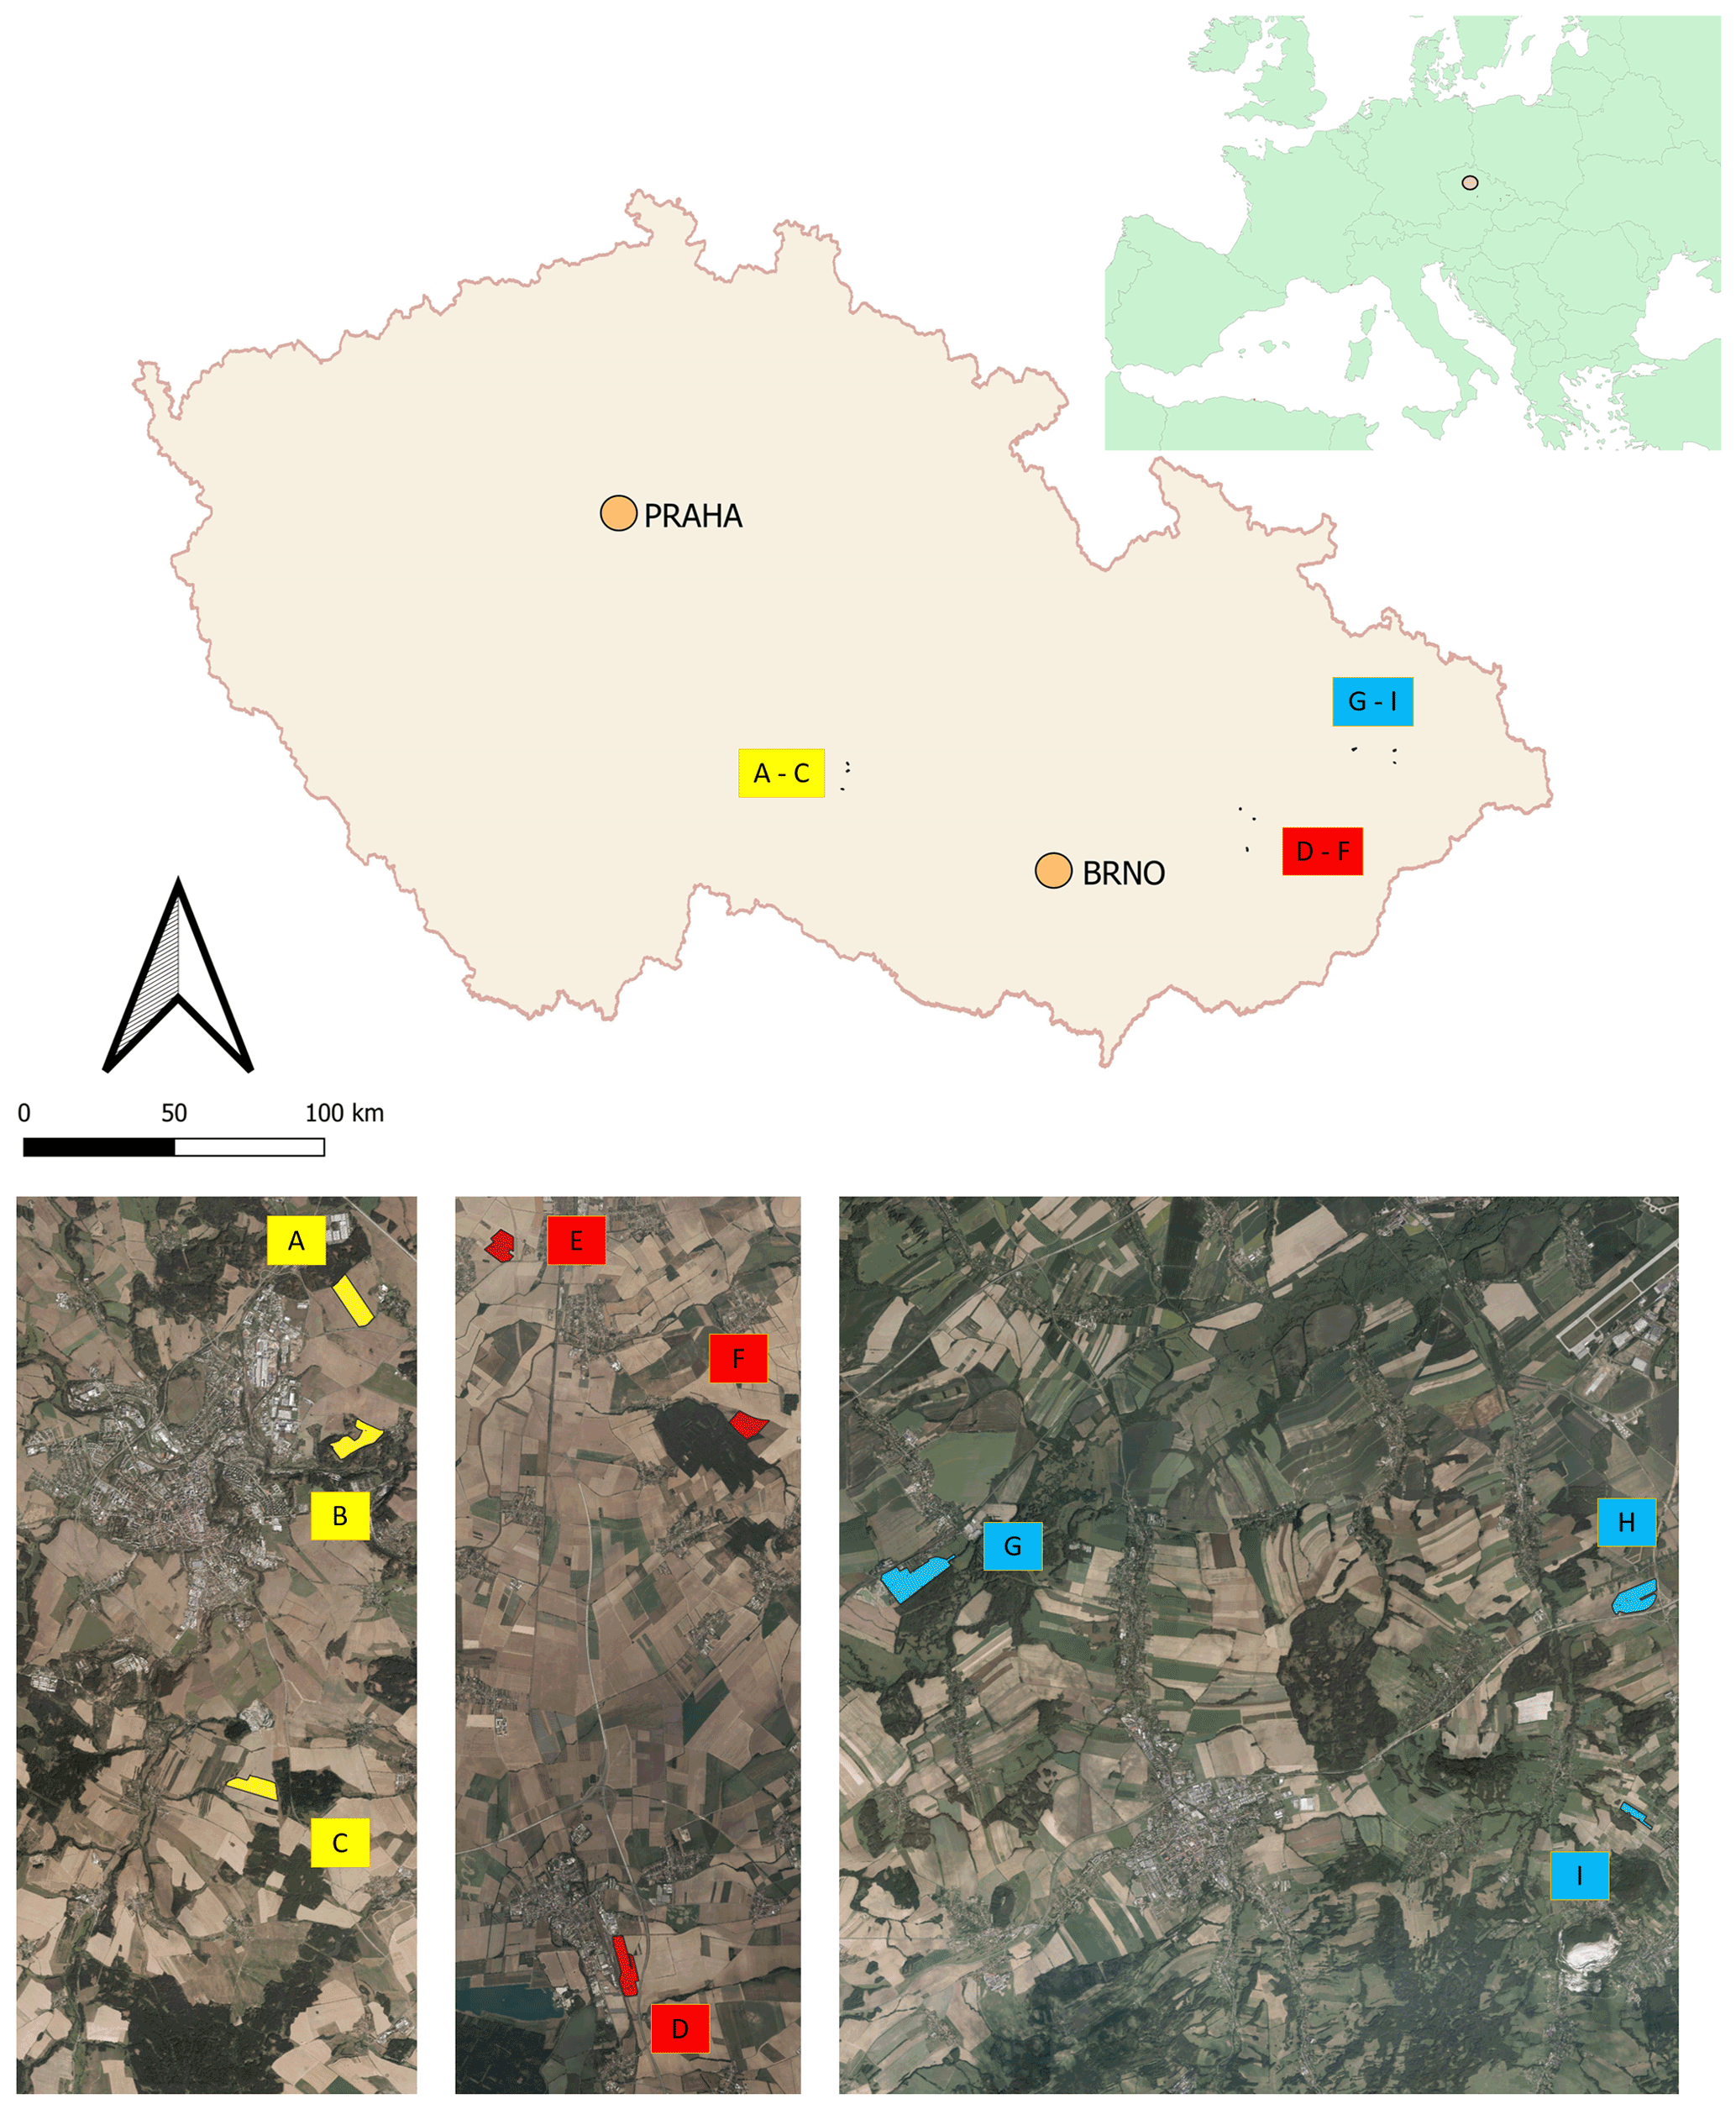
Figure 1Location of sampling points and soil pits in the Czech Republic. Note that the map was prepared in QGIS software (QGIS Development Team; licence: GNU GPLv2) on the basis of data from the Czech Office for Surveying, Mapping and Cadastre (CUZK). Spatial data (background map and aerial images) belonging to the category of open data (including metadata) were used; these data were used free of charge under the Creative Commons CC-BY 4.0 License.
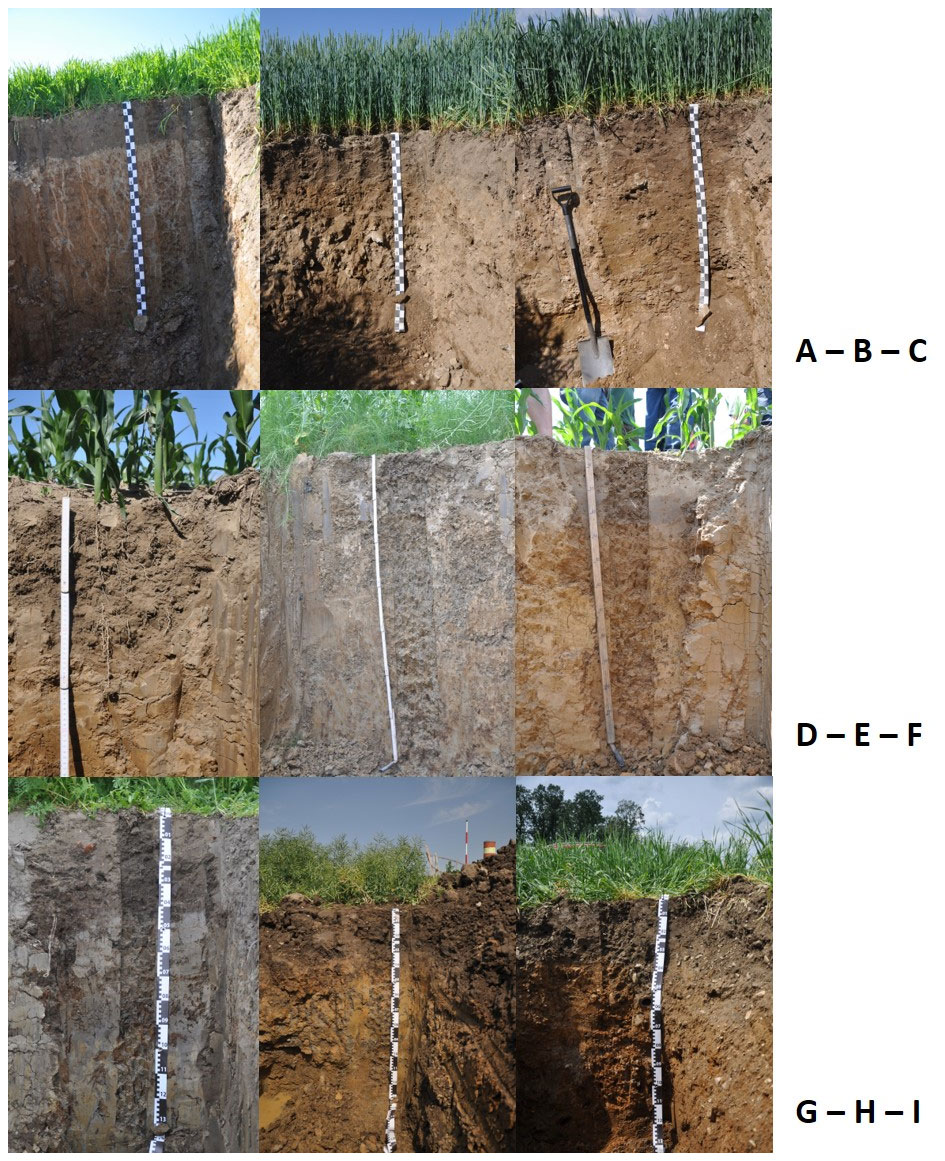
Detailed descriptions of sampling points are presented below; information on basic soil parameters and soil structure is presented in Table B1. All sampling points were subjected to a pedological survey at which soil pits were excavated (Fig. B1) for the purpose of a detailed characterization of topsoil horizons in the respective localities. Subsoil horizons are described in detail in Appendix C.
-
Sampling point A is Henčov Dystric Relictistagnic Regosols (Siltic, Aric, Densic) with the topsoil layer (qualifier Aric) at a depth from 0.00 to 0.32 m: 7.5YR4/2 (w) brown; to 0.07 m granular structure, deeper sub-angular structure, texture class silt loam, small amount of coarse sand and small number of Fe–Mn nodules. There is a sharp transition to the deeper horizon. The final soil pit depth was 1.50 m.
-
Sampling point B is Heroltice Skeletic Cambisols (Loamic, Aric) with the topsoil layer (qualifier Aric) at a depth from 0.00 to 0.33 m: brown7.5YR4/2 (w); granular structure, texture class sandy loam, approx. 20 % of soil skeleton, sharp transition to the deeper horizon. The final soil pit depth was 1.30 m.
-
Sampling point C is Rančířov Regosols (Loamic, Aric) with the topsoil layer (qualifier Aric) at a depth from 0.00 to 0.28 m: dark yellowish brown 10YR3/4 (w); granular structure to 0.09 m, texture class sandy loam with approx. 25 % of soil skeleton. There is a sharp transition to the deeper horizon. The final soil pit depth was 1.35 m.
-
Sampling point D is Hulín Haplic Luvisols (Amphiloamic, Aric, Densic) at a depth from 0.00 to 0.32 m: 10YR3/3 (w) dark brown; according to the soil structure, this layer can be divided into sublayer 1: 0.00–0.07 m with granular structure, very crumbly, and sublayer 2: 0.07–0.32 m with sub-angular blocky structure (qualifier Densic). Texture class is silt loam. There is a sharp transition to the deeper horizon. The final soil pit depth was 1.40 m.
-
Sampling point E is Bochoř Relictistagnic Fluvisols (Loamic, Aric, Densic) with the topsoil layer (qualifier Aric) in the depth from 0.00 to 0.29 m: 10YR4/1 (w), dark grey; loam, according to the soil structure we can divide this layer into sublayer 1: 0.00–0.13 m with granular structure, very crumbly, and sublayer 2: 0.13–0.29 m with strong angular blocky structure (qualifier Densic). Texture class is clay loam. There is a sharp transition to the deeper horizon. The final soil pit depth was 1.40 m.
-
Sampling point F is Beňov Eutric Regosols (Siltic, Aric, Densic) with the topsoil layer (qualifier Aric) at a depth from 0.00 to 0.33 m: 10YR3/2 (w) very dark greyish brown; according to the soil structure, this layer can be divided into sublayer 1: 0.00–0.08 m with granular structure, and sublayer 2: 0.08–0.33 m with sub-angular blocky structure (qualifier Densic). Texture class is silt loam. There is a sharp transition to the deeper horizon. The final soil pit depth was 1.50 m.
-
Sampling point G is Suchdol nad Odrou Fluvic Stagnic Phaeozems (Siltic, Aric) with the topsoil layer (qualifier Aric) at a depth from 0.00 to 0.27 m: 7.5YR2/2 (w), very dark brown/black; granular structure, texture class silt loam, a small admixture of stones, <10 % of artefacts (pieces of bricks, polyethylene). This meets criteria for mollic horizon. There is a sharp transition to the deeper horizon. The final soil pit depth was 1.50 m; depth of groundwater was 1.70 m (by core drill).
-
Sampling point H is Prchalov Stagnic Umbrisols (Loamic, Aric, Densic), with the topsoil layer (qualifier Aric) at a depth from 0.00 to 0.30 m: 7.5YR3/2 (w) dark brown; granular structure, texture class clay loam. There is a clear transition to the deeper horizon. This meets criteria for umbric horizon. The final soil pit depth was 1.30 m.
-
Sampling point I is Kopřivnice Stagnic Regosols (Loamic, Aric, Drainic) with the topsoil layer (qualifier Aric) at a depth from 0.00 to 0.36 m: 10YR3/4 dark yellowish brown; granular structure, texture class loam, <10 % rounded soil skeleton, >0.224 m, a small number of Fe–Mn nodules. There is a sharp transition to the deeper horizon. The final soil pit depth was 1.35 m.
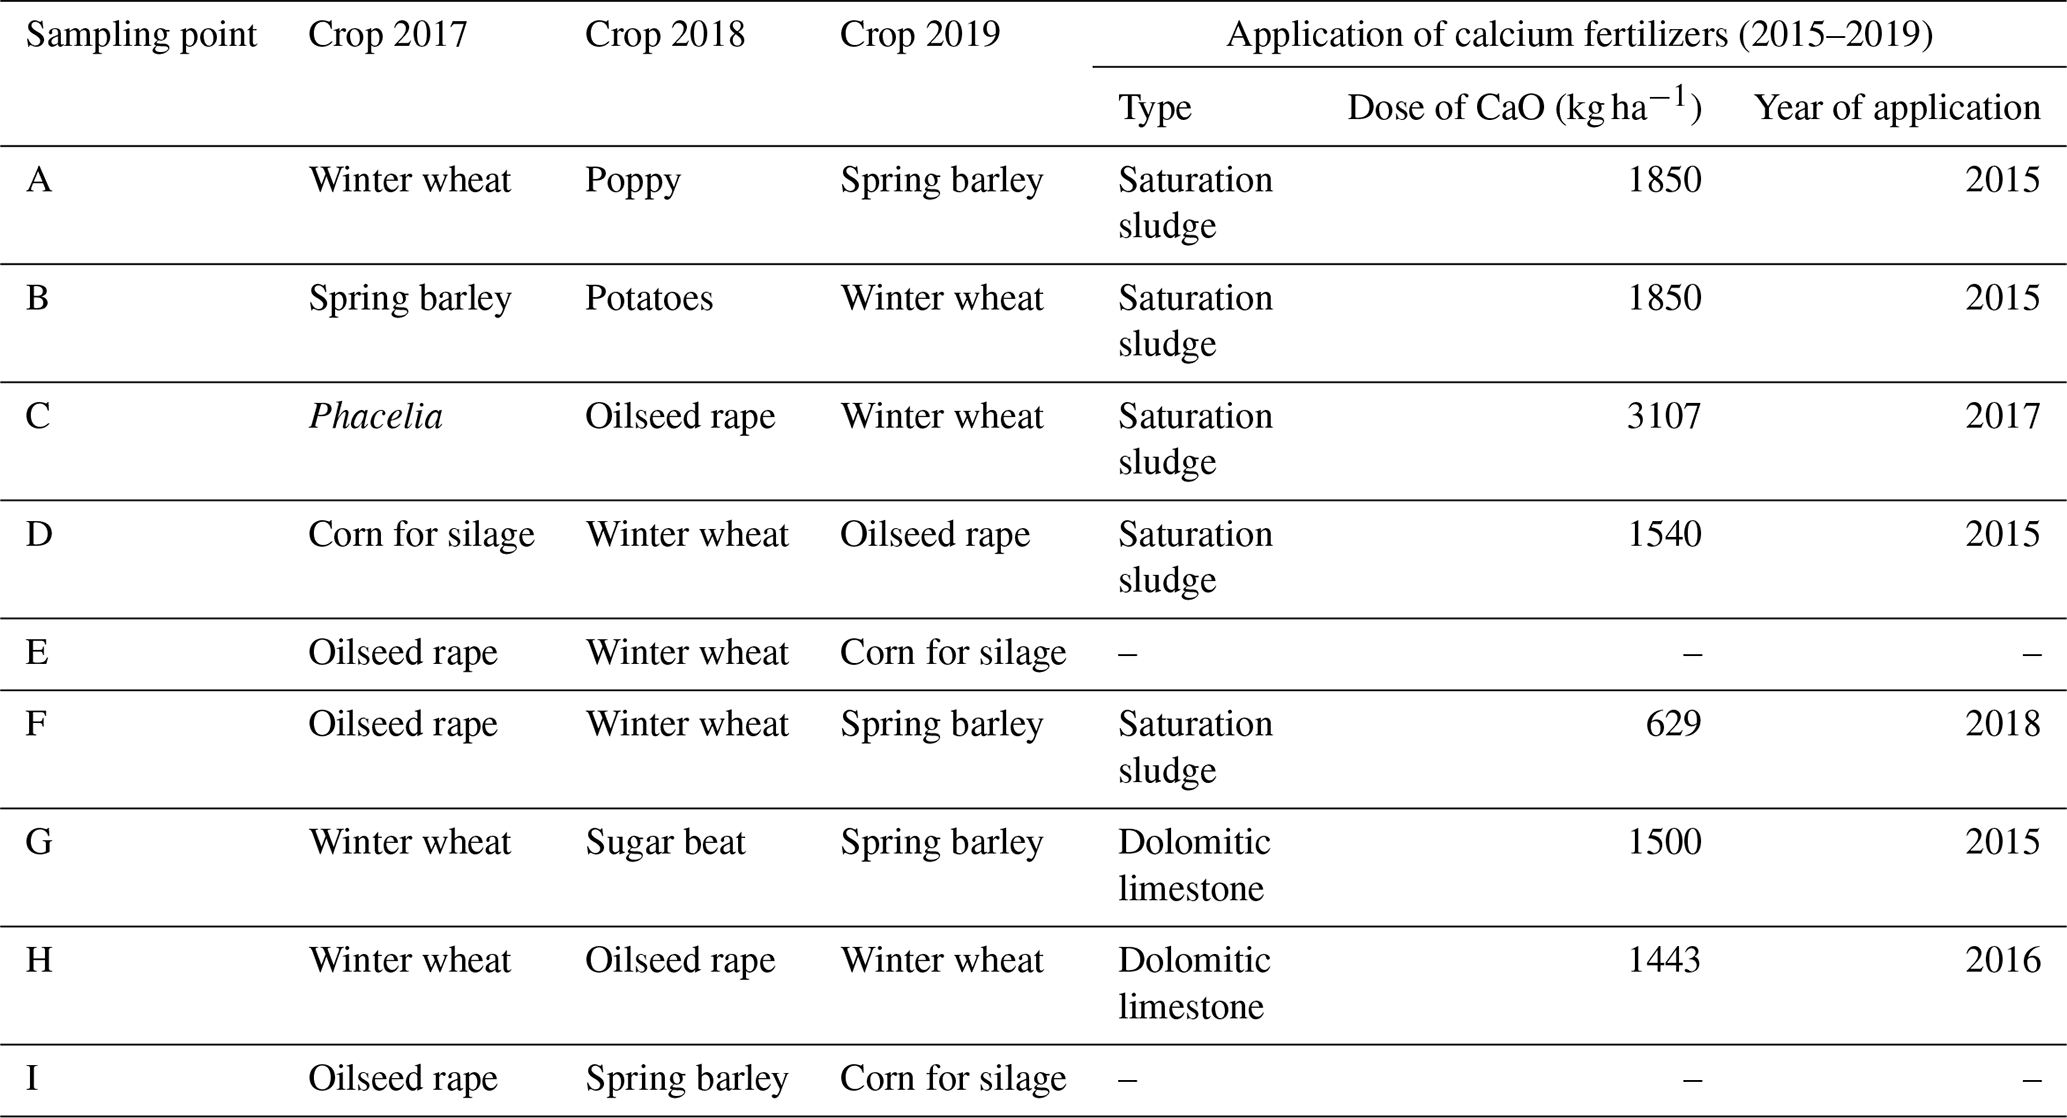
All selected plots (Table 2) were managed by conventional methods; i.e., crops on them were grown with the use of mineral fertilizers and plant protection preparations. Dominant crops in the rotation were cereals and oilseeds. Calcium fertilizers to adjust pH were usually applied on average once in 5 years. The CaO dose was calculated based on the actual pH value on individual plots. The applied calcium fertilizers included sugar factory sewage sludge and dolomitic limestone. Sugar factory sewage sludge (saturation sludge) is a waste from the processing of sugar beet and contains Ca2+ in the form of CaCO3.
Table 2Overview of grown crops and applied calcium fertilizers at the respective sampling points.
2.2 Determining the content of basic nutrients, glomalin, Cox and Na in the soil
In addition to WSA, other parameters were measured: contents of basic nutrients (P, K, Ca, Mg), oxidizable carbon (Cox) and Na in the soil. Exchange soil reaction (pH) was determined, too.
The soil contents of P, K, Ca and Mg were established according to Schroder et al. (2009); the individual elements were extracted using the Mehlich III reagent and then analysed using atomic emission spectroscopy (The Agilant55B AA, Agilent, CA, USA). The content of Cox (oxidizable carbon) was established according to Nelson and Sommers (1996) using the wet oxidation of chromic acid. Cox contained in the soil sample was oxidized by potassium dichromate (0.167 M) in the concentrated sulfuric acid (a so-called chrome–sulfate mixture). The content of Cox (wt %) Cox in the soil sample was calculated based on the consumption of titrant.
Glomalin was established according to the extraction method by Wright and Upadhyaya (1996): 1 g of soil sample + 8 mL of 20 mm sodium citrate solution. The mixture was homogenized for 30 min on the GFL3015 shaker. Then the sample was autoclaved (60 min at 121 ∘C). After cooling, it was centrifuged for 15 min at 3900 rpm. Until the time of measurement, the supernatant was kept frozen at −18 ∘C. Easy extracted glomalin (EG) was determined as EE-BRSP (easy extracted Bradford reactive soil protein) using the method by Bradford (1976). The measurement was at all times repeated three times for each sample. Poorly extractable glomalin (total glomalin – TG) was extracted in a similar way using 50 mm of potassium citrate solution instead of 20 mm.
2.3 Determining the effect of wetting agent application on the stability of soil aggregates
The collected soil samples were transported to the laboratory where they were analysed. All samples from each site were divided into five parts of identical weight for the establishment of water-stable aggregates. Based on studies published by Kandeler and Murer (1993), Kandeler (1996), and Bartlová et al. (2015), we selected the following procedure: soil aggregates sized 1–2 mm were separated from the soil sample after the soil had been dried at a laboratory temperature. Then they were washed for 5 min in 100 mL of distilled water on the sieve washer (Adolf Herzog GmbH, Vienna, Austria) with the washing speed being 42 strokes per minute. Upon the end of washing, the samples were immediately placed onto evaporation dishes and dried at a temperature of 105 ∘C in the dryer (HS 32 A, Chirana Ltd., CZ) to constant weight. The dried and cooled samples (in desiccator) were added 50 mL of pyrophosphate solution, and the resulting suspension was manually mixed. After 120 min, the samples were washed again on the same sieve washer for 5 min. The reason for this repeated washing was to wash out clay particles so that only sand would remain on the bottom of washer sieves, which was rinsed into an evaporation dish and dried to constant weight at 105 ∘C. After cooling in the desiccator, the dried-up material was weighed again, and the percentage of aggregates unwashed down from the total sample weight was determined according to the following Eq. (1):
where % WSA is the percentage of water stable soil aggregates; M1 the weight of dish (g); M2 the weight of dish, water-stable aggregates and sand (g); M3 the weight of dish and sand (g); (M2−M3) the weight of water stable soil aggregates (g); (M3−M1) the weight of sand (g); and W the weight of sample (4 g). WSA was always measured five times: (1) without the WA addition – control value; (2)–(5) after adding a specific wetting agent (WA) to the solution used for the WSA measurement. The individual WAs were applied directly into the liquid that was used as a solution for the dispersion of soil particles (Table 3). All chosen wetting agents are freely available on the EU market and are used for the application directly into the spray mixture or as a component of soil herbicides. The reason was to test conventionally used products which can be and are applied directly onto the soil surface (in spray mixture) or into the soil environment (with soil herbicides). There were altogether four wetting agents used (Table 3); their description is based on data provided by manufacturers on the labels or package leaflets of given products:
-
WA 1. Organosilicone wetting agent is a non-ion excipient for the enhancement of the degree of coverage of plant parts treated with the application fluid. It improves the wetting power and adhesive capacity of the fluid and allows better distribution also onto plant parts that are not directly reached by the application. As it significantly reduces the surface tension of liquids, high-quality treatment can be achieved on plants whose surface does not allow an even adhesion of the application fluid. It increases resistance to washing with rain, enhances efficiency of pesticides and allows the reduction of the amount of application fluid per 1 ha. It features reduced foaming and a low point of congelation.
-
WA 2. Methyl ester of rapeseed oil (MERO) is an adjuvant used together with preparations for plant protection including herbicides based on sulfonyl urea MaisTer, Atlantis WG, Chevalier and Husar, the effect of which it increases and stabilizes. By itself it has no herbicide effect. MERO reduces the surface tension of applied pesticide liquids by which it improves their contact with the surface of plants as well as the secondary distribution of active substances on the surface of plants, thus accelerating their entry into plant tissues.
-
WA 3. This represents a wetting agent which, when added to the spray mixture, increases the wetting power and adhesive capacity of preparations for plant protection as well as the resistance to washing with rain and slows down the evaporation of application fluid. By this, it prolongs and increases the effectiveness of herbicides permitted in the Czech Republic. The wetting agent features a dominant representation of methyl ester palmitic and oleic acids.
-
WA 4. The addition of the wetting agent isodecyl alcohol ethoxylate into the application fluid (spray mixture) increases the wetting power of the latter, thus facilitating adhesion and penetration of used preparations for plant protection.
The dosing of adjuvants to the soil samples in the WSA determination followed the information on recommended dosage from the package leaflets (Table 3). The dosage of wetting agents was converted to 100 mL of distilled water used for WSA measurements.
Table 3List of used wetting agents.
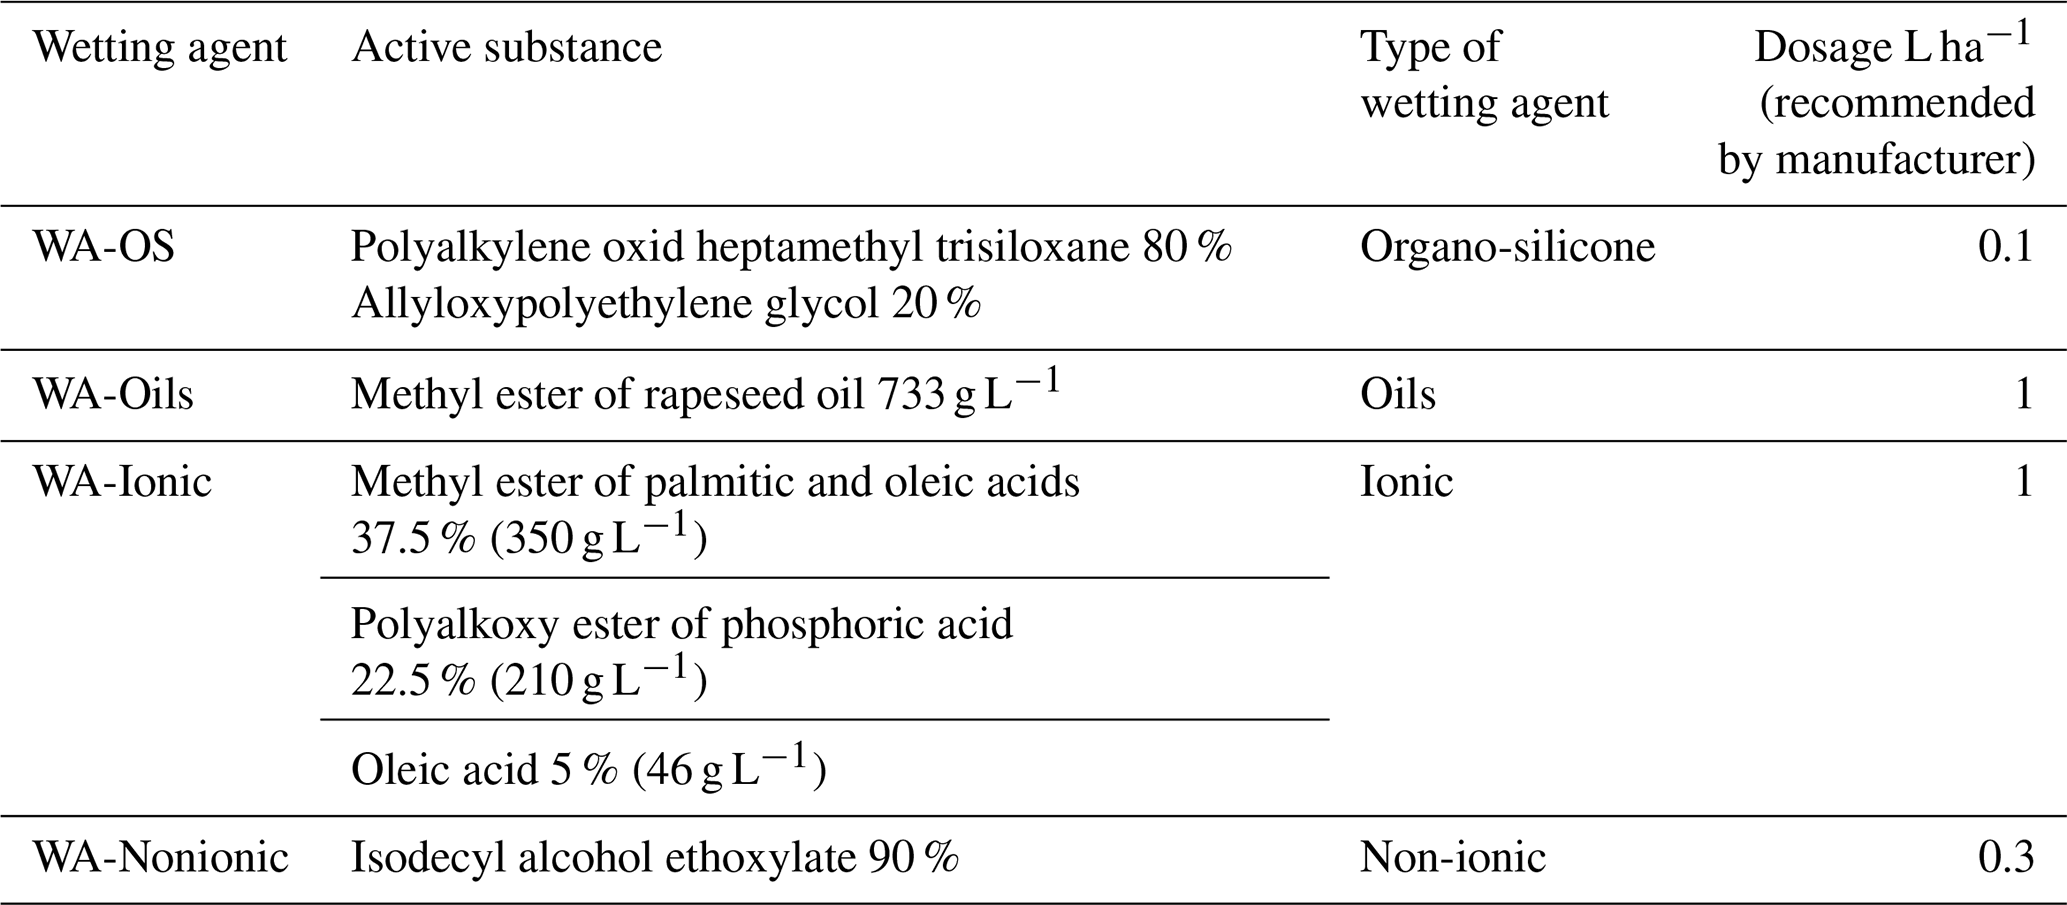
The respective wetting agents were applied into 100 mL of distilled water, which was used in the measurement of WSA. Dosing of the wetting agent was calculated according to the dosage per 1 ha for 300 L of spray mixture recommended by the manufacturer. The applied amounts of wetting agents in the experiment were as follows: WA-OS: 0.033 mL per 100 mL of distilled water; WA-Oils: 0.33 mL per 100 mL; WA-Ionic: 0.33 mL; WA-Nonionic: 0.1 mL.
2.4 Statistical data processing
First, all data were subjected to an input exploratory data analysis in order to establish the presence of extreme points and data normality. Then, one-way analysis of variance (ANOVA) was used in combination with the Tukey's HSD test to determine significant differences in WSA among the respective sampling points and to compare mean WSA values before and after the addition of WA. Further on, a pair t test was used to confirm the difference in WSA before and after the application of WA. Finally, a principal component analysis (PCA) was used to analyse the relationship between individual soil parameters and WSA values. Program Statistica 12 (Dell Software, Round Rock, TX, USA) was used for the implementation of the analyses and for the graphical data processing. The level of significance selected for all analyses was P<0.05.
3.1 Soil aggregates stability – initial condition and condition after the addition of wetting agents
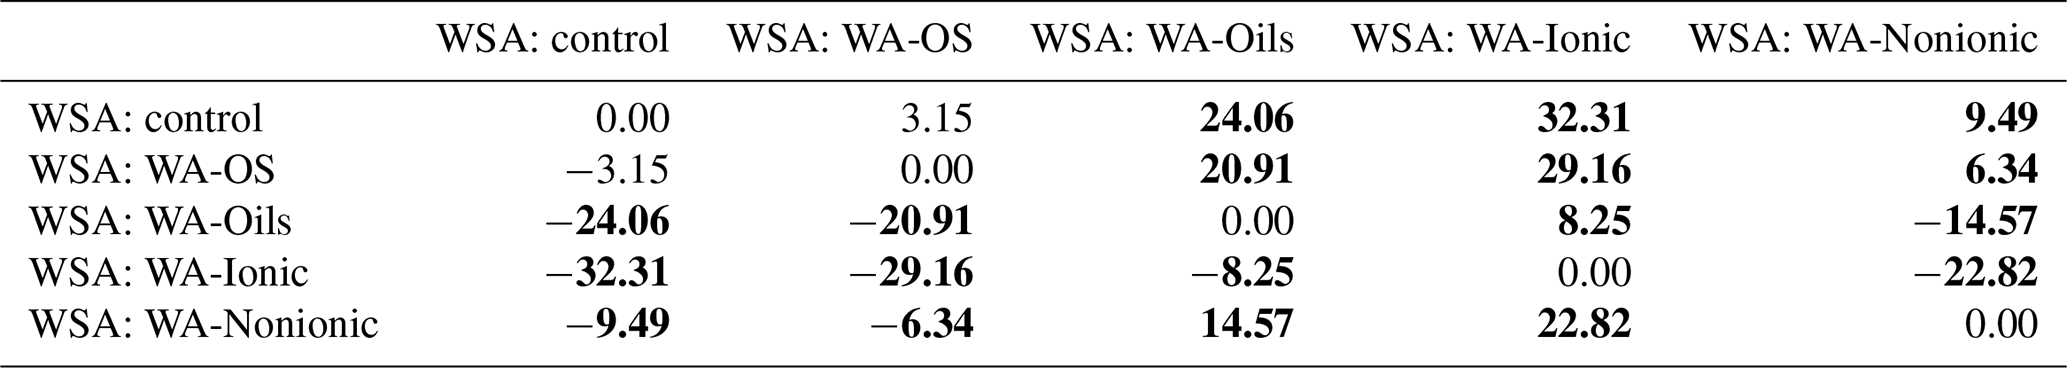
WSA of control samples without addition of WA demonstrably differed between the sampling points (Figs. A1, D1 and Table D1). The highest value was measured in the sampling point A, and the lowest one was measured in the sampling points D and E, which was significantly different than in the other sampling points. Comparing the measured WSA values in Table 4, we can see that the control variant exhibited the highest WSA value (44.04 %), while the variants with the applied WA showed lower WSA values at all times. The WSA value changed in the following order: control > WA-OS > WA-Nonionic > WA-Oils > WA-Ionic with the measured difference being demonstrable after the application of WA-Oils, WA-Ionic and WA-Nonionic. Thus, the measured values clearly show the influence of WA application on the decreased WSA values. Furthermore, WA-OS apparently exhibited the least negative influence on WSA, whereas WA-Ionic exhibited the worst influence on WSA.
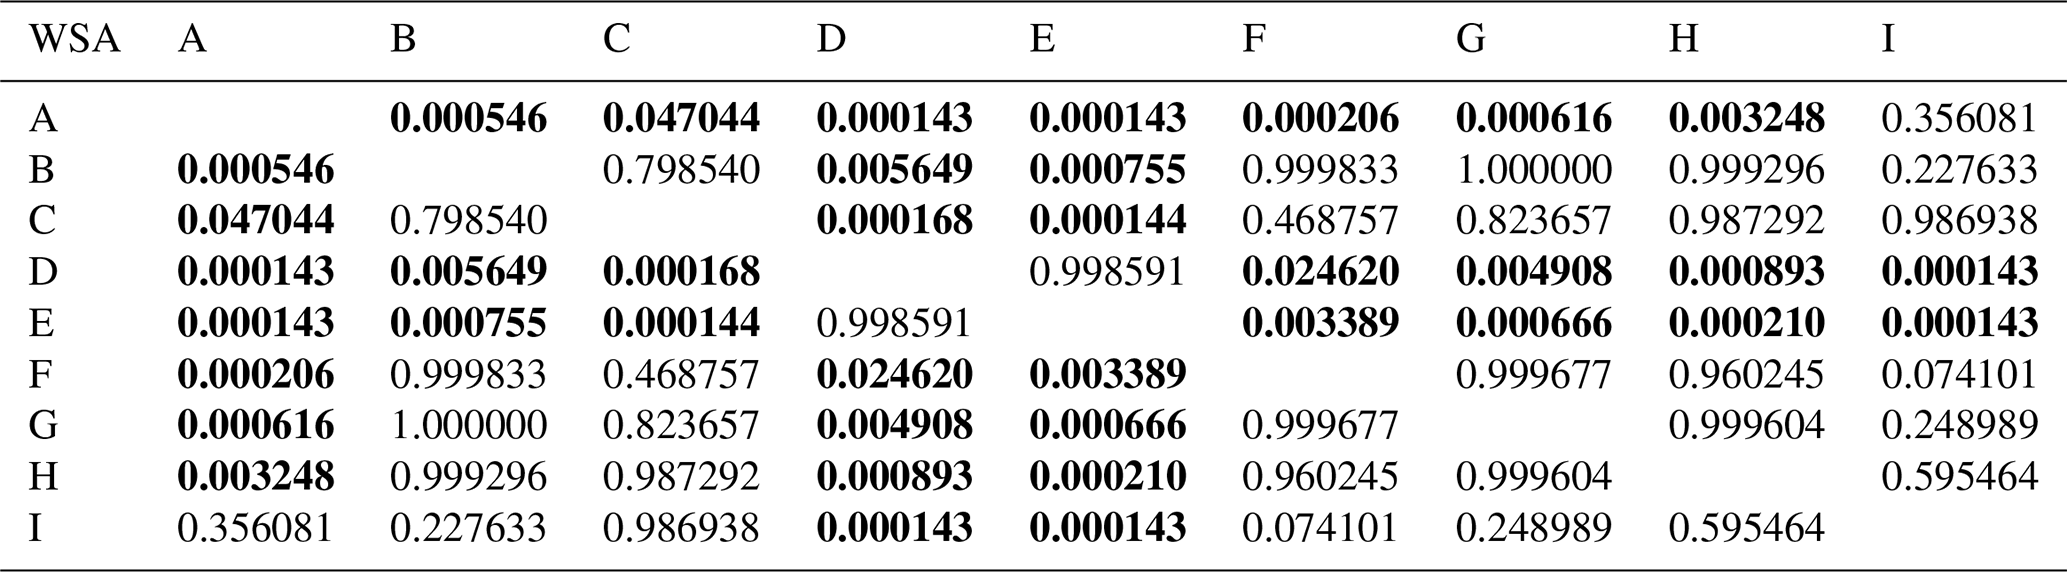
Table 4Results of post hoc Tukey's HSD test (P<0.05) – comparison of average WSA values before and after the addition of WA within all sampling points.

Statistically significant differences (P<0.05) are in bold.
Average values of WSA across the sampling points exhibited a clear trend: the value of WSA in the control sample (WSA – control) was at all times higher than in the samples with added WA-OS, WA-Ionic and WA-Nonionic by more than 15 % at all sites (Fig. 2). In addition, in the case of WA-OS application, a significant decrease in WSA was found in the soil samples from sampling points B and G as compared with the control variant on average by 12 %. In the samples from the other sampling points, the level of WSA was identical as in the control sample.
In the case of WA-Oils application, significant differences were observed in WSA, which were negative as compared with the control samples in all variants with the exception of variant A (B–I) with the differences being from 10 % in samples from site B, over 50 % in samples from site H up to more than 65 % in samples from site E. The fact is very interesting as it shows that WA-Oils had the most different effect in dependence on the soil sampling point. Another specific is a difference in WSA between the individual sampling points, which is obvious across all variants (A–I). The greatest WSA fluctuations were recorded at sampling points D and E where the WSA values were always lower than in all other variants, sometimes even by more than 50 %. These differences were observed both in the soil samples with the addition of WA and in the soil samples without it. The addition of WA at all times amplified (P<0.05) the WSA decrease. Site A exhibited the demonstrably highest values of WSA as compared with all other variants (Fig. D1 and Table D1). However, the addition of WA always decreased WSA on the given site, the only exception being the wetting agent WA-Oils, which did not have a negative influence on the decrease in WAS as compared with the control variant.
WA-Ionic was observed to have the most negative influence on WSA of all wetting agents. Compared with the control variant, the decrease was at all times significant, and the average decrease of WSA was by more than 73 %. On the other hand, although the application of WA-Nonionic had a significantly negative influence on WSA across all sites, too, the decrease was demonstrably lower than after the addition of WA-Ionic (on average by 22 %) compared to the control variant.

Figure 2Water stability of soil aggregates (WSA) – initial values
on the respective sites and values after the addition of different wetting
agents (WA). Note that average WSA values (n=6) from the individual sampling points are illustrated before and after the application of respective WA (OS, Oil, Ionic, Nonionic).
Different symbols were chosen for each sampling point
(A: ![]() ; B:
; B: ![]() ; C:
; C: ![]() ; D:
; D: ![]() ; E:
; E: ![]() ; F:
; F: ![]() ; G:
; G: ![]() ; H:
; H: ![]() ; I:
; I: ![]() ).
Their presence at the WSA value indicates a demonstrable difference between the particular variant (with the addition of WA) and the control (WSA – control) at a level of significance of P<0.05 in one specific sampling point. Different lowercase letters indicate differences in WSA among the individual sampling points within the control collections of samples without the addition of WA.
).
Their presence at the WSA value indicates a demonstrable difference between the particular variant (with the addition of WA) and the control (WSA – control) at a level of significance of P<0.05 in one specific sampling point. Different lowercase letters indicate differences in WSA among the individual sampling points within the control collections of samples without the addition of WA.
To obtain a further confirmation of the negative influence of WA application on WSA in the soil samples collected from the experimental sites, the individual values were compared using the pair t test (P<0.05). We always compared WSA values from one site – the control sample and the sample to which a wetting agent was added within the WSA measurement (Table 5). Differences among the individual experimental variants are obvious both from the result of the pair t test and from the box charts (Fig. D2) with median and mean values. The most conspicuous effect was that of WA-Oils and WA-Ionic additions as the values of WSA median were always lower in these variants as compared with the WSA median of the control variant. Moreover, total differences between the control variant and variants with the addition of WA (Oils and Ionic) across all sampling points were demonstrably significant with the average WSA value being at all times markedly lower in those variants. Other significant differences were found after the application of WA-Nonionic where a clearly negative influence on WSA after the application of the wetting agent was exhibited namely in the soil samples from sampling points E–I. The measured values indicated clearly that the application of WA decreased the average WSA value as well as the WSA median (Table D2).
Table 5T-test results (P<0.05) – comparison of differences among the average WSA values.
The comparison includes average WSA values from all sampling points. T-test results are shown – analysis of significant differences between the respective variants. The average WSA in controls was compared with the average WSA of all other variants from all sampling points. Statistically significant differences (P<0.05) are in bold.
3.2 Basic soil parameters of sampling points
Prior to the establishment of WSA in the individual soil samples before and after the addition of WA, basic parameters were determined that could indicate the soil environment condition and resistance to external effects – the contents of glomalin, Cox, sodium and basic nutrients available to plants in particular (Tables 6, D3, E1 and Fig. D3).
We determined two basic forms of EG and TG glomalin. Mean values of their contents (mg kg−1) were 0.9 for EG and 1.4 for TG (Table 6). The contents of both glomalin forms exhibited increased variability across the sampling points, ranging from min. 0.4 to max. 1.6 for EG and from 0.6 to 2.3 for TG (Table D3). On the other hand, it is possible to claim that the variability did not indicate a data anomaly, which was confirmed also by the analysis of data using the Shapiro–Wilk test of normality. The distribution of measured values was graphically illustrated by using a probability graph (Fig. D3). Further, significant differences were found among the individual sampling points (Table 6). The demonstrably highest values of glomalin EG were recorded in sampling points A, B, C and G, and the highest values of glomalin TG were recorded in sampling points A, B and H.
Another monitored parameter was Cox in the soil, whose values ranged from 1.1 wt % to 3.3 wt % with the mean content being 2.2 wt %. Similarly, as glomalin (EG, TG), the measured values of Cox exhibited some variability among the sampling points. Significant differences among the respective sampling points (Table 6) copied the trend of the development of glomalin content in the soil. The demonstrably highest Cox content was recorded in sampling points A, B and H, where the highest content of glomalin was measured, too. The correlation was corroborated also by the regression and factor analyses (Table 7) described below. The lowest values of Cox in the soil (<1.62 wt %) were found at sampling points D, E and F. The values copied the trend of glomalin content in the soil only partly and only at sampling points E and F.
Apart from the above parameters, we monitored also the soil content of Na and contents of basic nutrients available to plants, i.e., P, K, Ca and Mg (Table E1). The Na content was the most balanced of all parameters. Its values ranged from 223 to 369 mg kg−1, with an average value in the soil being 273 mg kg−1 across the sampling points (Table E1). The low variability of values is also documented by the presence of merely two significant differences between sites G, H and all the other sites. As to the content of available nutrients, differences were apparent between the groups of sampling points A, B, C–D, E, F–G, H and I (Figs. A1 and A2). Values of Ca content in the soil were very variable with their minimums and maximums being 1259 and 4743 mg kg−1, respectively (Table D3). The highest values (>3000 mg Ca kg−1) were measured in sampling points E and G. The lowest values (<2030 mg Ca kg−1) were recorded in the soil samples from sampling points A, B, C and I. The contents of remaining nutrients available to plants (P, Mg and K) were more balanced, with a lower variance of values (Table E1). The lowest content of P in the soil was recorded in sampling points E, F, G and I, where its value was lower than 100 mg kg−1. The highest contents were measured on sites C and H. As to the content of Mg, the lowest and highest concentrations in the soil were recorded on site I and on sites G and H (<200 mg kg−1), respectively. The content of K in the soil exhibited the second lowest variability of values (after Na) of all measured parameters. Sampling points B, D, G and H showed the highest contents (<279 mg kg−1) as compared with the remaining sampling points (A, C, E, F, I) where the average content of K in the soil ranged from 172 to 243 mg kg−1.
Table 6Contents of glomalin forms and oxidizable carbon in the soil, exchange soil reaction.
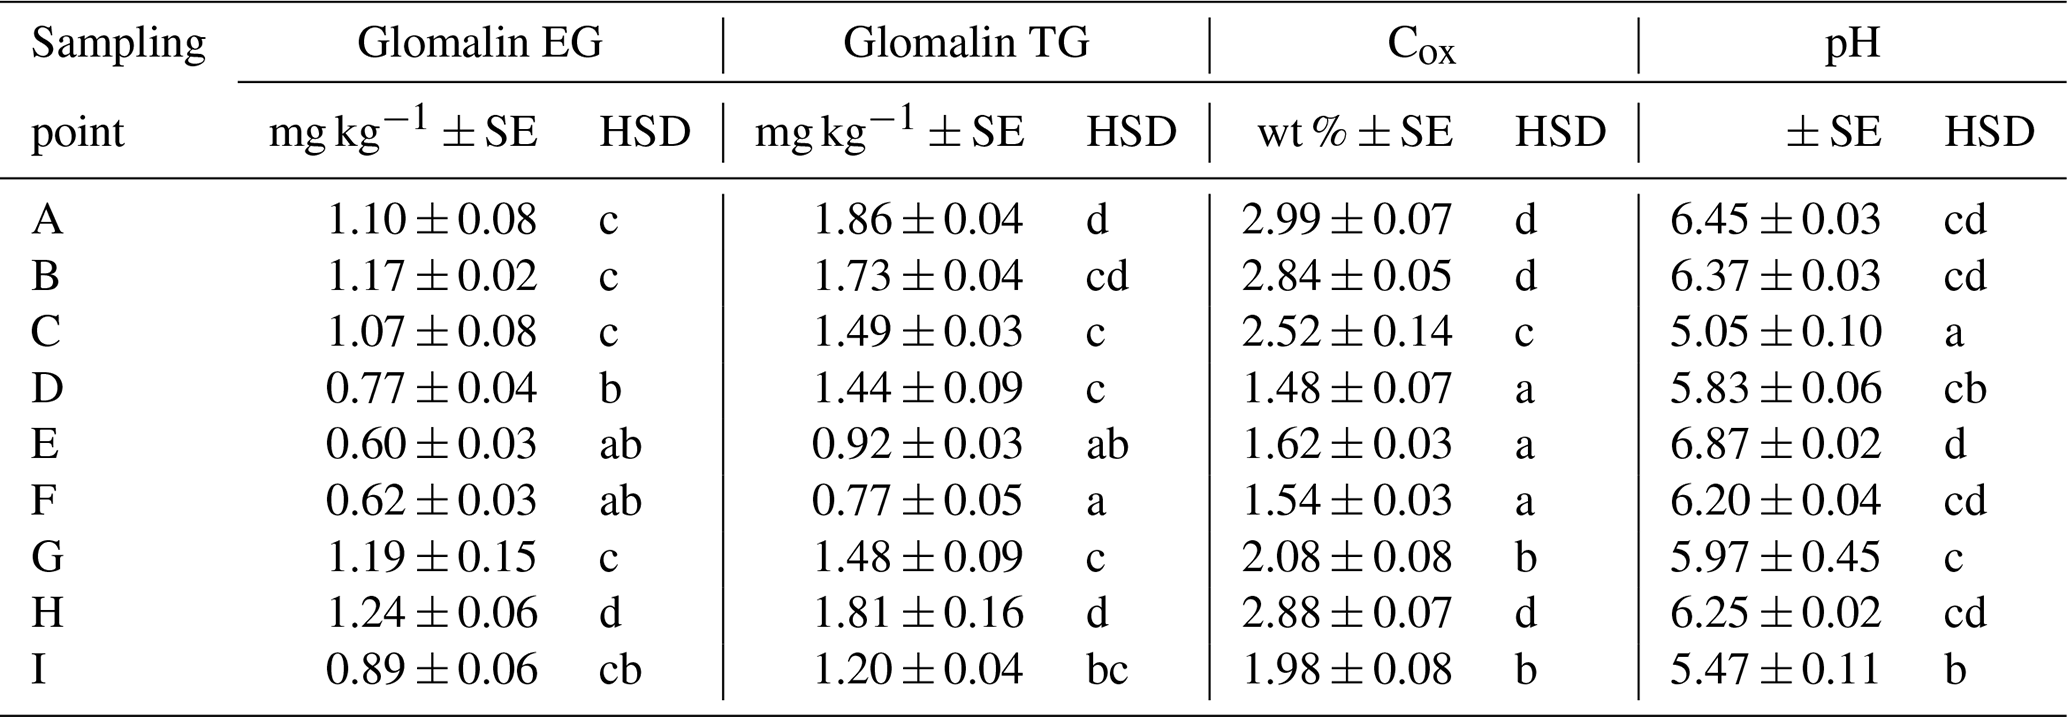
Different small letters indicate significant differences (P<0.05) within individual variants. Individual letters were allocated alphabetically from the “a” letter which was set up for the lowest value.
3.3 Analysis of the potential influence of basic soil parameters on the water stability of soil aggregates
Relations between the individual soil parameters and WSA values before and after the application of WA were subject to the regression and PCA analyses. The correlation matrix is presented in Table 7. The presented R values show that the contents of basic nutrients in the soil (P, K, Ca, Mg) had no influence on WSA before the application of WA (control variant) as the R values ranged from −0.11 to −0.38. Similar values were recorded when comparing WSA after the addition of WA with the initial values of soil nutrient contents.

An analysis of the relation of WSA with the soil reaction (pH) and Na content in the soil did not reveal any dependence either, not even between WSA in the control variant without the addition of WA. With only one exception, the R values ranged within negative numbers from min. −0.06 to max. 0.24.
Significant dependences between the parameters were found only in the comparison of individual WSA values before and after the addition of WA together with the values of Cox content in the soil and glomalin (EG and TG). In this case, the R value reached 0.7 and this is why it can be stated that the content of Cox positively affected WSA.
Another possibility for how to characterize the relation of individual values and explain their variability is a biplot graph which illustrates the projection of variables into the factor level (Fig. 3). The highest eigenvalue (Fig. F1) explains 63.42 % of the variability of measured values, and the second number covers 15.89 % of data variability. The graph of component weights (Fig. 4) for the first two factors (components) shows correlations among WSA, Cox and glomalin (EG, TG) value levels. At the same time, these variables exhibit a very weak positive correlation with the P values and a negative correlation with the values of Ca, Mg and K.
Table 7Correlation matrix.
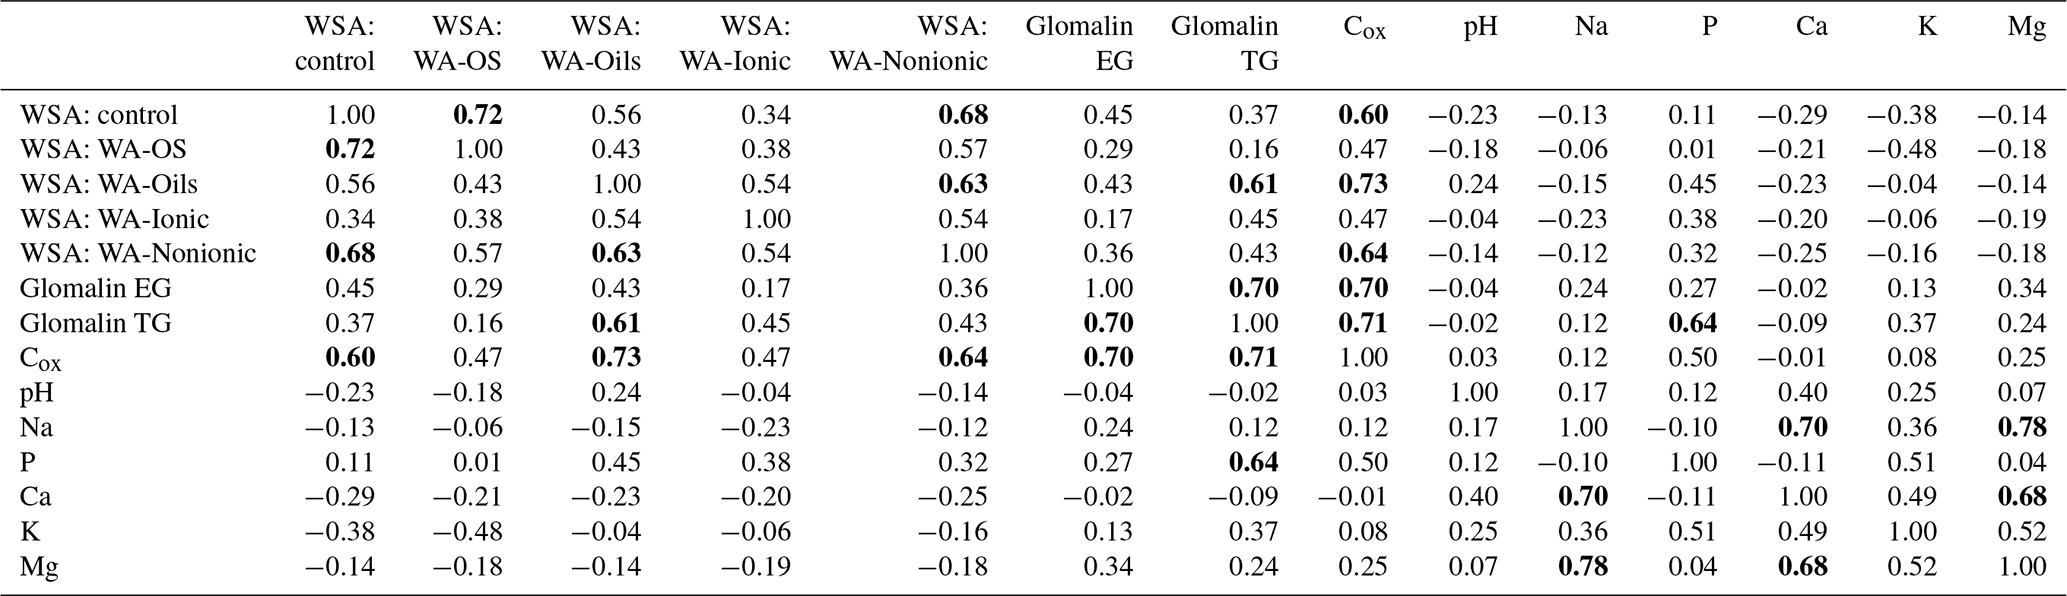
Spearman coefficients are presented. Values in bold indicate a statistical dependence (P<0.05) between two quantities. The correlation matrix was calculated as a part of the factor analysis.
There were altogether four types of wetting agents tested: organo-silicone, oils, ionic and nonionic. A majority of the tested WA (WA-Oils, WA-Ionic and WA-Nonionic) had a demonstrably negative influence on WSA with the effect of individual WA being very likely depending on the soil type and method of arable land management. Namely the soil type can have a great influence on the resistance of soil particles to disintegration when these are exposed to some external forces (Papadopoulos, 2011; Lerch et al., 2012). Stability of soil aggregates was demonstrably affected by the addition of WA to the analysed soil samples with all wetting agents causing decreased WSA at least in one soil sample across the sampling points (A–I). Thus, the measured values confirmed that certain changes in water resistance of aggregates occur regardless of climate, soil type or crop rotation if the natural soil properties (e.g., soil aggregates stability) are affected by an abiotic factor. In our experiment, wetting agents were such a factor. Values measured in the control variant without the addition of adjuvants amounted on average to 44 %, while the mean WSA values for variants with the addition of adjuvants dropped below 40 %, even to 11.74 %. If we expressed the differences between the control and the individual variants with the application of WA using relative percent, the effect of WA application would be as follows: WA-OS 92.8 %, WA-Oils 45.4 %, WA-Ionic 26.6 % and WA-Nonionic 78.45 %. Thus, the individual variants with the application of WA reached max. 92.8 % of WSA value recorded in the control variant. None of the variants with the addition of WA showed values identical with the control variant, and the effect was at all times significant in the WA-Oils, WA-Ionic and WA-Nonionic variants. According to Bartlova et al. (2015), WSA values ranging from 34.1 % to 50 % indicate the medium quality of soil structure. In our experiment, the average WSA value in the control variant was 44 % and in the variants with the wetting agent (WA-Oils, WA-Ionic and WA-Nonionic) it decreased below 40 %, i.e., less than 78 % of the value in the control variant. Therefore, based on Bartlova et al. (2015), it can be stated that the stability of aggregates in the control variant was moderate rather than optimal. In contrast, the WA-Oils, WA-Ionic and WA-Nonionic variants exhibited already a noticeable decrease in the soil structure stability. Almajmaie et al. (2017) favour a similar evaluation, considering the WSA values around 50 % as average but depending on the chosen method of determination and concrete soil conditions. WSA values below 34.1 % then indicate the low and very low soil structure quality. WSA is most frequently affected by the soil type and by soil management practices (Emerson and Greenland, 1990; Šimanský et al., 2015). In our experiment, however, the WSA value was clearly affected also by the addition of adjuvants. Values recorded in the control variant could be considered as slightly below average while values detected in the wetting agents WA-Oils, WA-Ionic and WA-Nonionic variants already as very low.
Although there were differences between the sampling points, it was impossible to determine whether these differences (Fig. D1 and Table D1) were caused only by different soil types or whether there were some other factors which affected the results, for example the already mentioned management practices. Relatively few studies exist that would explain the influence of soil surface active substances on WSA; Lehrsch et al. (2012) and Lehrsch (2013) are exceptions. In their studies, these authors claim that aggregate tensile strength differs primarily in dependence on the soil structure and depth rather than on the type of surfactants which the soil particles come into contact with (e.g., during irrigation or application of spray mixture). This was corroborated in our study only partly because WSA was at the same level on most of the sites (before the addition of WA); only the sites D and E exhibited relatively low values. One of several possible reasons to the low water resistance on sites D and E could have been the impact of water. Site D with Haplic Luvisols was affected by the process of illimerization or depletion of the surface horizon of colloidal particles due to mildly acidic soil reaction. Site E with Relictistagnic Fluvisols developed through the activity of alluvial sediments, further affected by water (stagnic properties). The following addition of WA (type WA-Oils, WA-Ionic and WA-Nonionic) resulted in the demonstrable decrease of WSA at all sites. Further, a majority of sampling points were limed in the last 5 years, with a CaO application ranging from 600 to 3100 kg ha−1. No direct dependence was however found between the content of Ca2+ in the soil and the WSA values (either before or after the WA application). Although this is in contradiction with some scientific studies (Wuddivira and Camps-Roach, 2007) claiming that the application of Ca2+ into arable land has a positive effect on WAS, it should be pointed out that the content of Ca2+ did not show deficit values for the given soil types at any of the sampling points because the plots were regularly limed in the past.
We tested four types of WA which differed in their composition, but the principle of action on the spray mixture was at all times the same. WA-Oils and WA-Nonionic types of wetting agents had the most negative influence on WSA. The basic substance of these WA types is methyl ester, methyl ester of rapeseed oil in the case of WA2 (733 g L−1), and methyl esters of palmitic and oleic acids with polyalkoxy ester of phosphoric acid in the case of WA 3. The type of WA-Ionic wetting agent is interesting as it contains both oleic and ionic components. This could explain why its potential influence on the decrease of soil aggregate stability was the highest of all studied WA.
Methyl esters are substances derived from esters which are functional derivatives of carboxylic acids. They are prepared by carboxylic acids reacting with alcohols or phenols. Methyl ester of rapeseed oil (Fatty acid methyl ester – FAME) that was the main substance in WA-Oils is produced by the trans-esterification of triacylglycerols with methyl alcohol (Canoira et al., 2010). The other wetting agent (WA-Ionic) contained palmitic acid methyl ester (PAME) and oleic acid methyl ester (OAME). Similarly, as FAME, they are esters in chemical terms, namely methyl esters of vegetable oils, and their production is similar, too (Canoira et al., 2010; Martínez et al., 2014). Nevertheless, a difference between the substances consists in their structure, which is obvious from their molecular formulas: C17H34O2 (PAME) and C2H3O2 (FAME). These substances have typically similar characteristics, density lower (<900 kg m−3) than water and hydrophilous effect which depends on the number of carboxyl groups and atoms of carbon in the chain of the given substance. Solubility of these substances increases with the increasing number of carboxyl groups and with the lower amount of carbon (Hazen, 2000; Simsek et al., 2015). In general, esters can be both hydrophobic and hydrophilous and this is why they are very often used as detergents (Miyake and Yamashita, 2017). Thus, it can be assumed that the addition of these wetting agents (WA-Oils and WA-Ionic) in the solution used for testing WSA affected the hydrophobicity of soil particles and hence their capability to hold together much more than wetting agents WA-OS and WA-Nonionic, the reason being exactly the chemical composition and physical properties of methyl esters which exhibit a stronger detergent effect as compared with substances contained in WA-OS and WA-Nonionic (substances based on organic silicones and fatty alcohols) (Hazen, 2000; McMullan, 2000). This effect was then responsible for the disruption of bonds between the soil particles.
Furthermore, basic soil parameters measured on the individual sampling sites did not exhibit any extremes, and their values were presumably affected primarily by the method of management and by the soil type in the given region. Potential contents of glomalin and OM in the soil were markedly affected by the soil texture and type (Rilling et al., 2001). This partly explains the fluctuation of values measured across the sampling points. As to the content of nutrients available to plants, the most conspicuous differences were found in P and Ca. Together with N, these nutrients represent biogenic substances significantly affecting the growth of plants as well as the soil fertility (Rodriguez-Moreno et al., 2014). Thus, it can be assumed that the fluctuation of their contents across the sampling points resulted from the grown crops (crop rotation) because each of the crops (winter wheat, winter rape, sugar beet, spring barley etc.) had different requirements for these nutrients (Lošák et al., 2010; Handlirova et al., 2017). The fertilization certainly was mirrored also in the soil contents of K, Mg and Na, and apart from the beneficial influence on the yield and quality of bulbs or soil characteristics, it also caused worse correlability of these elements with WSA because all calcium supplied “in addition” above the threshold of colloidal coagulation worsens the correlation with WSA, too. However, the threshold of coagulation depends on other soil properties such as Cox, texture etc. The other sampling points (A–C) were situated in regions with the increased representation of cereals and oilseeds in the crop rotation, i.e., with the crops that are considerable consumers of P and K (Sun et al., 2021; Hlisnikovský et al. 2021). This is why the contents of these nutrients were lower at the experimental sites. Moreover, soils in those regions exhibit lower potential fertility and hence also naturally lower contents of nutrients (Gebeltova et al., 2020). The above facts are presumably further exacerbated by differences in the particle-size distribution (and hence by differences in sorption capacity) or by altitudes with higher mean annual precipitation amounts (see Table 1).
Interesting was the absence of correlation between the two forms of glomalin (EG and TG) and WSA; the only exception was the WSA in the WA-Oils variant where the WSA value demonstrably increased on the site even after the addition of the wetting agent. According to Kaczorek et al. (2013), this was caused by the content of hydrophobic compounds in FAMEs (it can generally be caused by oils) which were a significant component of WA-Oils. FAMEs could have contributed to the hydrophobic nature of the surface of aggregates and increased their water resistance. Causation between WSA in the respective variants (with or without WA) and the contents of Ca2+ and Na+ ions in the collected soil samples was not demonstrated. This is rather interesting as there are studies (Emerson and Smith, 1970; Rengasamy and Marchuk, 2011; Bronick and Lal, 2005) which confirm the negative effect of the presence of Na+ on WSA due to the effect of monovalent cations of sodium (Na) or potassium (K) as these may induce development of dispersion and clay swelling, which results in soil structure degradation (Rengasamy et al., 2016). According to Smiles (2006), K+ can be considered as an Na+ equivalent. Arienzo et al. (2012) recorded a higher stability of soil aggregates in the presence of K+ compared with Na+. On the other hand, there are long-term experiments (Almajmaie et al., 2017; Rengasamy and Marchuk, 2011) which confirm that Ca2+ ions are essential for the coagulation of soil particles and hence for the development of fixed connections between individual particles.
It should be added, however, that all types of wetting agents had a negative effect on WSA at least in one case compared with the control variant. If WSA depends on the presence of hydrophobic bonds between the soil particles (Mao et al., 2019), then the wetting agents have to cause its decrease by the principle of their action on the spray mixture. It follows out from the very essence of all wetting agents, the main goal of which is to increase the wetting ability of spray (capacity of liquid to adhere to the plant surface = decrease is hydrophobicity) which consists of water and active substance of pesticide (Pacanoski, 2015). The surface of soil aggregates is covered with clay and organoclay coatings which may affect the preferential flow of water in individual aggregates (Gerke and Köhne, 2002). Soil aggregates can be also understood as independent units whose hydraulic properties may affect the flow of water between the pores and the inside of aggregates and hence their stability. A change in surface tension can alter the hydraulic properties of water in relation to the hydrophobicity of soil aggregates (Zheng et al., 2016). Thus, there is a presumption that if a spray fluid with the addition of wetting agent enters such an environment, it has a potential to affect the hydrophobicity of soil particles, which is subsequently manifested in WSA changes. Another potential risk consists in the organo-mineral sorption complex of the soil based on SOM as hydrophobic substances (e.g., organic pollutants) can be adsorbed on the surface of soil particles when interacting with SOM components and create a complex affecting other soil properties (Ahmed et al., 2015).
There are scientific studies which deal with the significance of wetting agents in agriculture (Pacanoski, 2015; Baratella and Trinchera, 2018) and warn at the same time about potential negative effects of their application on the environment (Mesnage and Antoniou, 2018; Mesnage et al., 2013). There are however no detailed studies that would describe their potential impacts on the soil environment with respect to WSA, mineralization of SOM, or quantity and quality of microbial biomass. Therefore, a follow-up research will be necessary. It is known that appropriate and targeted application of spray mixture with the addition of adjuvants increases the efficiency of used pesticides (their active substances) and suppresses their potential adverse effect on the environment because the applied concentrations of pesticides can be reduced (Pacanoski, 2015; Mirgorodskaya et al., 2020). It should not be forgotten, however, that key factors responsible for the effectiveness of herbicides are not only the structure and concentration of substances active on the surface but also the treatment time, wetting effect of spray mixture and air temperature during the spray application on the crop growth (Mirgorodskaya et al., 2020). Thus, it follows that if the spray is applied in a targeted manner and using technologies of precision agriculture, it should reach only parts of the plot with the plant biomass; then a greater part of the applied wetting agents should affect only the leaves of plants. The presumed negative impact of wetting agents is thus conditioned by their contact with the soil environment. A question is at what amount and concentration – this should be a subject of the further research. The above data show that wetting agents can reduce WSA even at a recommended dosage if they are applied inappropriately on the bare soil without the cover of plants (low leaf area index). Another important aspect explored was the influence of some soil parameters on WSA both in the absence of adjuvants (control) and with their application. It was found out in our experiment that the Cox content in the soil positively correlated with WSA in most variants (control, WA-OS, WA-Oils and WA-Nonionic). Thus, it can be expected that if the content of SOM increases in the soil, WSA would increase too. This was corroborated also by Zhao et al. (2017), who describe and confirm a direct connection between SOM and WSA
Another important aspect which should be taken into account when discussing the research results is that the experiment took place in the laboratory. Recommended doses of wetting agents were applied in laboratory conditions on the soil samples in which WSA was then monitored. Song et al. (2019) inform for example that the application of wetting agents can affect soil water repellency and microbial community in the soil but that this effect significantly depends on the soil moisture content which is directly influenced by meteorological conditions. Important is also the amount of WA coming into contact with the soil, duration of its action (effect of meteorological conditions again), frequency of application in the region (Song et al., 2019) and the way of how WA get into contact with the soil. However, a fundamental difference in the (intensity) action on the soil environment exists between the WA which gets into the soil with the pre-emergence application, e.g., of herbicides, and the WA which is applied on the plants together with pesticides and has to reach the soil environment through the topsoil layer (Tominack and Tominack, 2000; Song et al., 2019). The presence of WA in the soil environment subsequently affects soil hydrophobicity and hence infiltration of water into the soil environment (Leighton-Boyce et al., 2007). The laboratory results point to the influence of WA on WSA, and hence to the disintegration of soil aggregates. In natural conditions, aggregation of soil particles is a complex process controlled by abiotic factors (soil texture, climatic conditions) and mediated by the action of plants and other biotic factors (SOM, activity of microorganisms) (Rilling et al., 2014). Based on the above facts, it can be deduced that the effect of WA on WSA in field conditions can be influenced by the initial condition of the soil, e.g., by the amount of SOM, or by the growth of plants on the site as these factors affect soil aggregation in a complex way (Six et al., 2004; Rilling, 2014). Thus, it can be presumed that WA can act negatively on WSA and affect other soil properties, but the degree of this action will depend on their chemical composition (Castro et al., 2018; Song et al., 2019), weather conditions (Song et al., 2019), application method and frequency (Song et al., 2019), factors affecting the process of aggregation, and hence also resistance of soil particles to their disintegration (Rillig et al., 2014).
In the laboratory experiment, a negative influence of wetting agents added to the soil samples on the stability of soil aggregates was recorded. Thus, further research should be conducted to analyse the probability of spray mixture reaching the soil without the plant cover. Exactly such an application of spray mixture with the content of pesticides appears to be the most riskiest with respect to WSA because in a majority of cases, the individual types of adjuvants exhibited a negative effect on WSA as compared with the control variant. This adverse effect was however observed upon the direct contact of adjuvants with the soil aggregates which is why further research is needed. In addition to this impact, potential differences were recorded in the action of individual adjuvant types in dependence on their composition. If they contained hydrophobic substances (partly at least), their negative action was less severe. To have detailed and exact conclusions about the action of adjuvants on WSA and other soil properties, it will be necessary to thoroughly analyse their chemical nature. This is however very difficult as the exact composition of adjuvants is rarely available and a detailed action of their individual components on the environment is not tackled either. Another important finding is a possibility to mitigate the adverse effect of adjuvants on WSA through the increased SOM content. The presence of organic matter in the soil appears to be crucial, and in the case of studied localities, it was more significant than the presence of Ca2+ ions in the soil sorption complex.
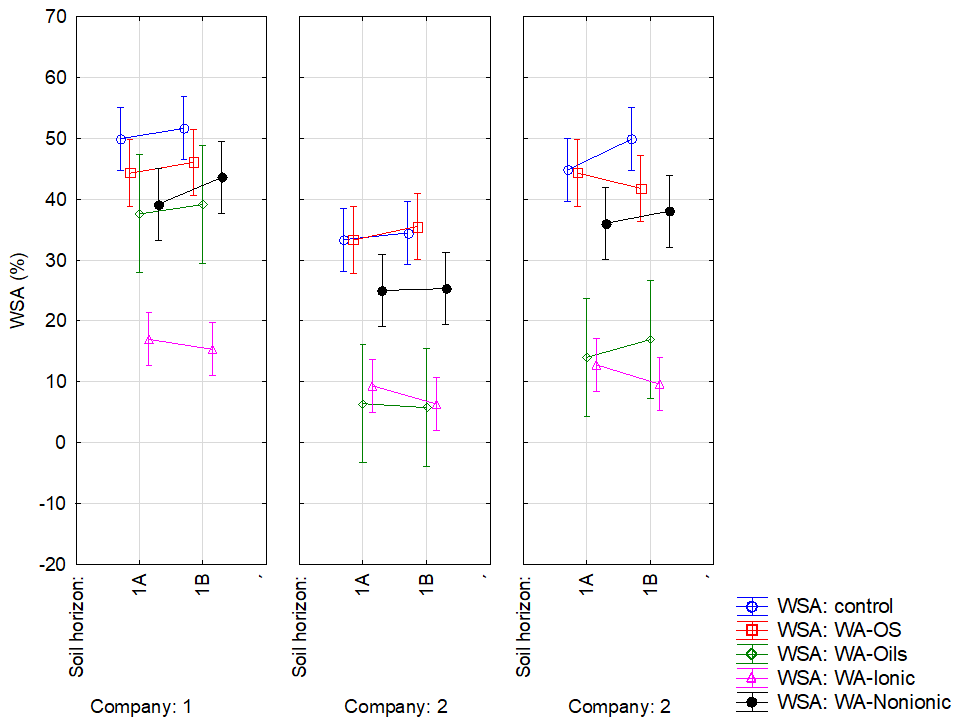
Figure A1Effect of sampling point on WSA in the respective variants. Note that average WSA values (n=18) from the individual sampling points of topsoil layer within companies 1–3 are illustrated before (WSA – control) and after the application of respective WA (OS, Oil, Ionic and Nonionic). Verticals denote 0.95 confidence intervals.
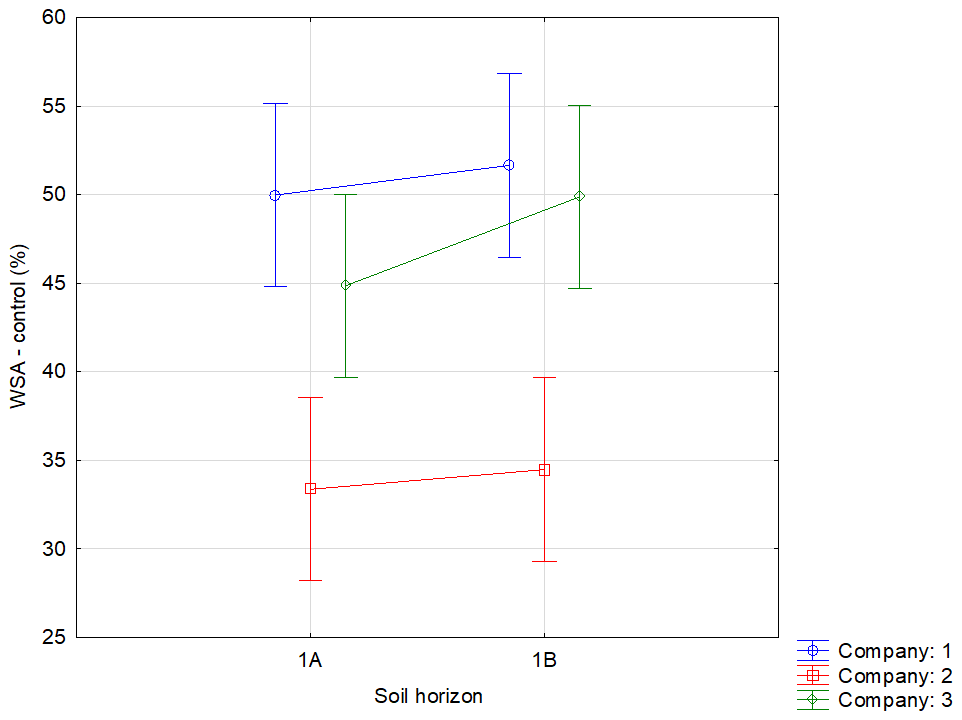
Figure A2Effect of sampling point on WSA in the control variants. Note that average WSA values (n=54) from the individual sampling points of topsoil layer within companies 1–3 are illustrated before (WSA – control) the application of respective WA (OS, Oils, Ionic and Nonionic). Verticals denote 0.95 confidence intervals.
Table B1Basic information about soils in the respective sampling points.
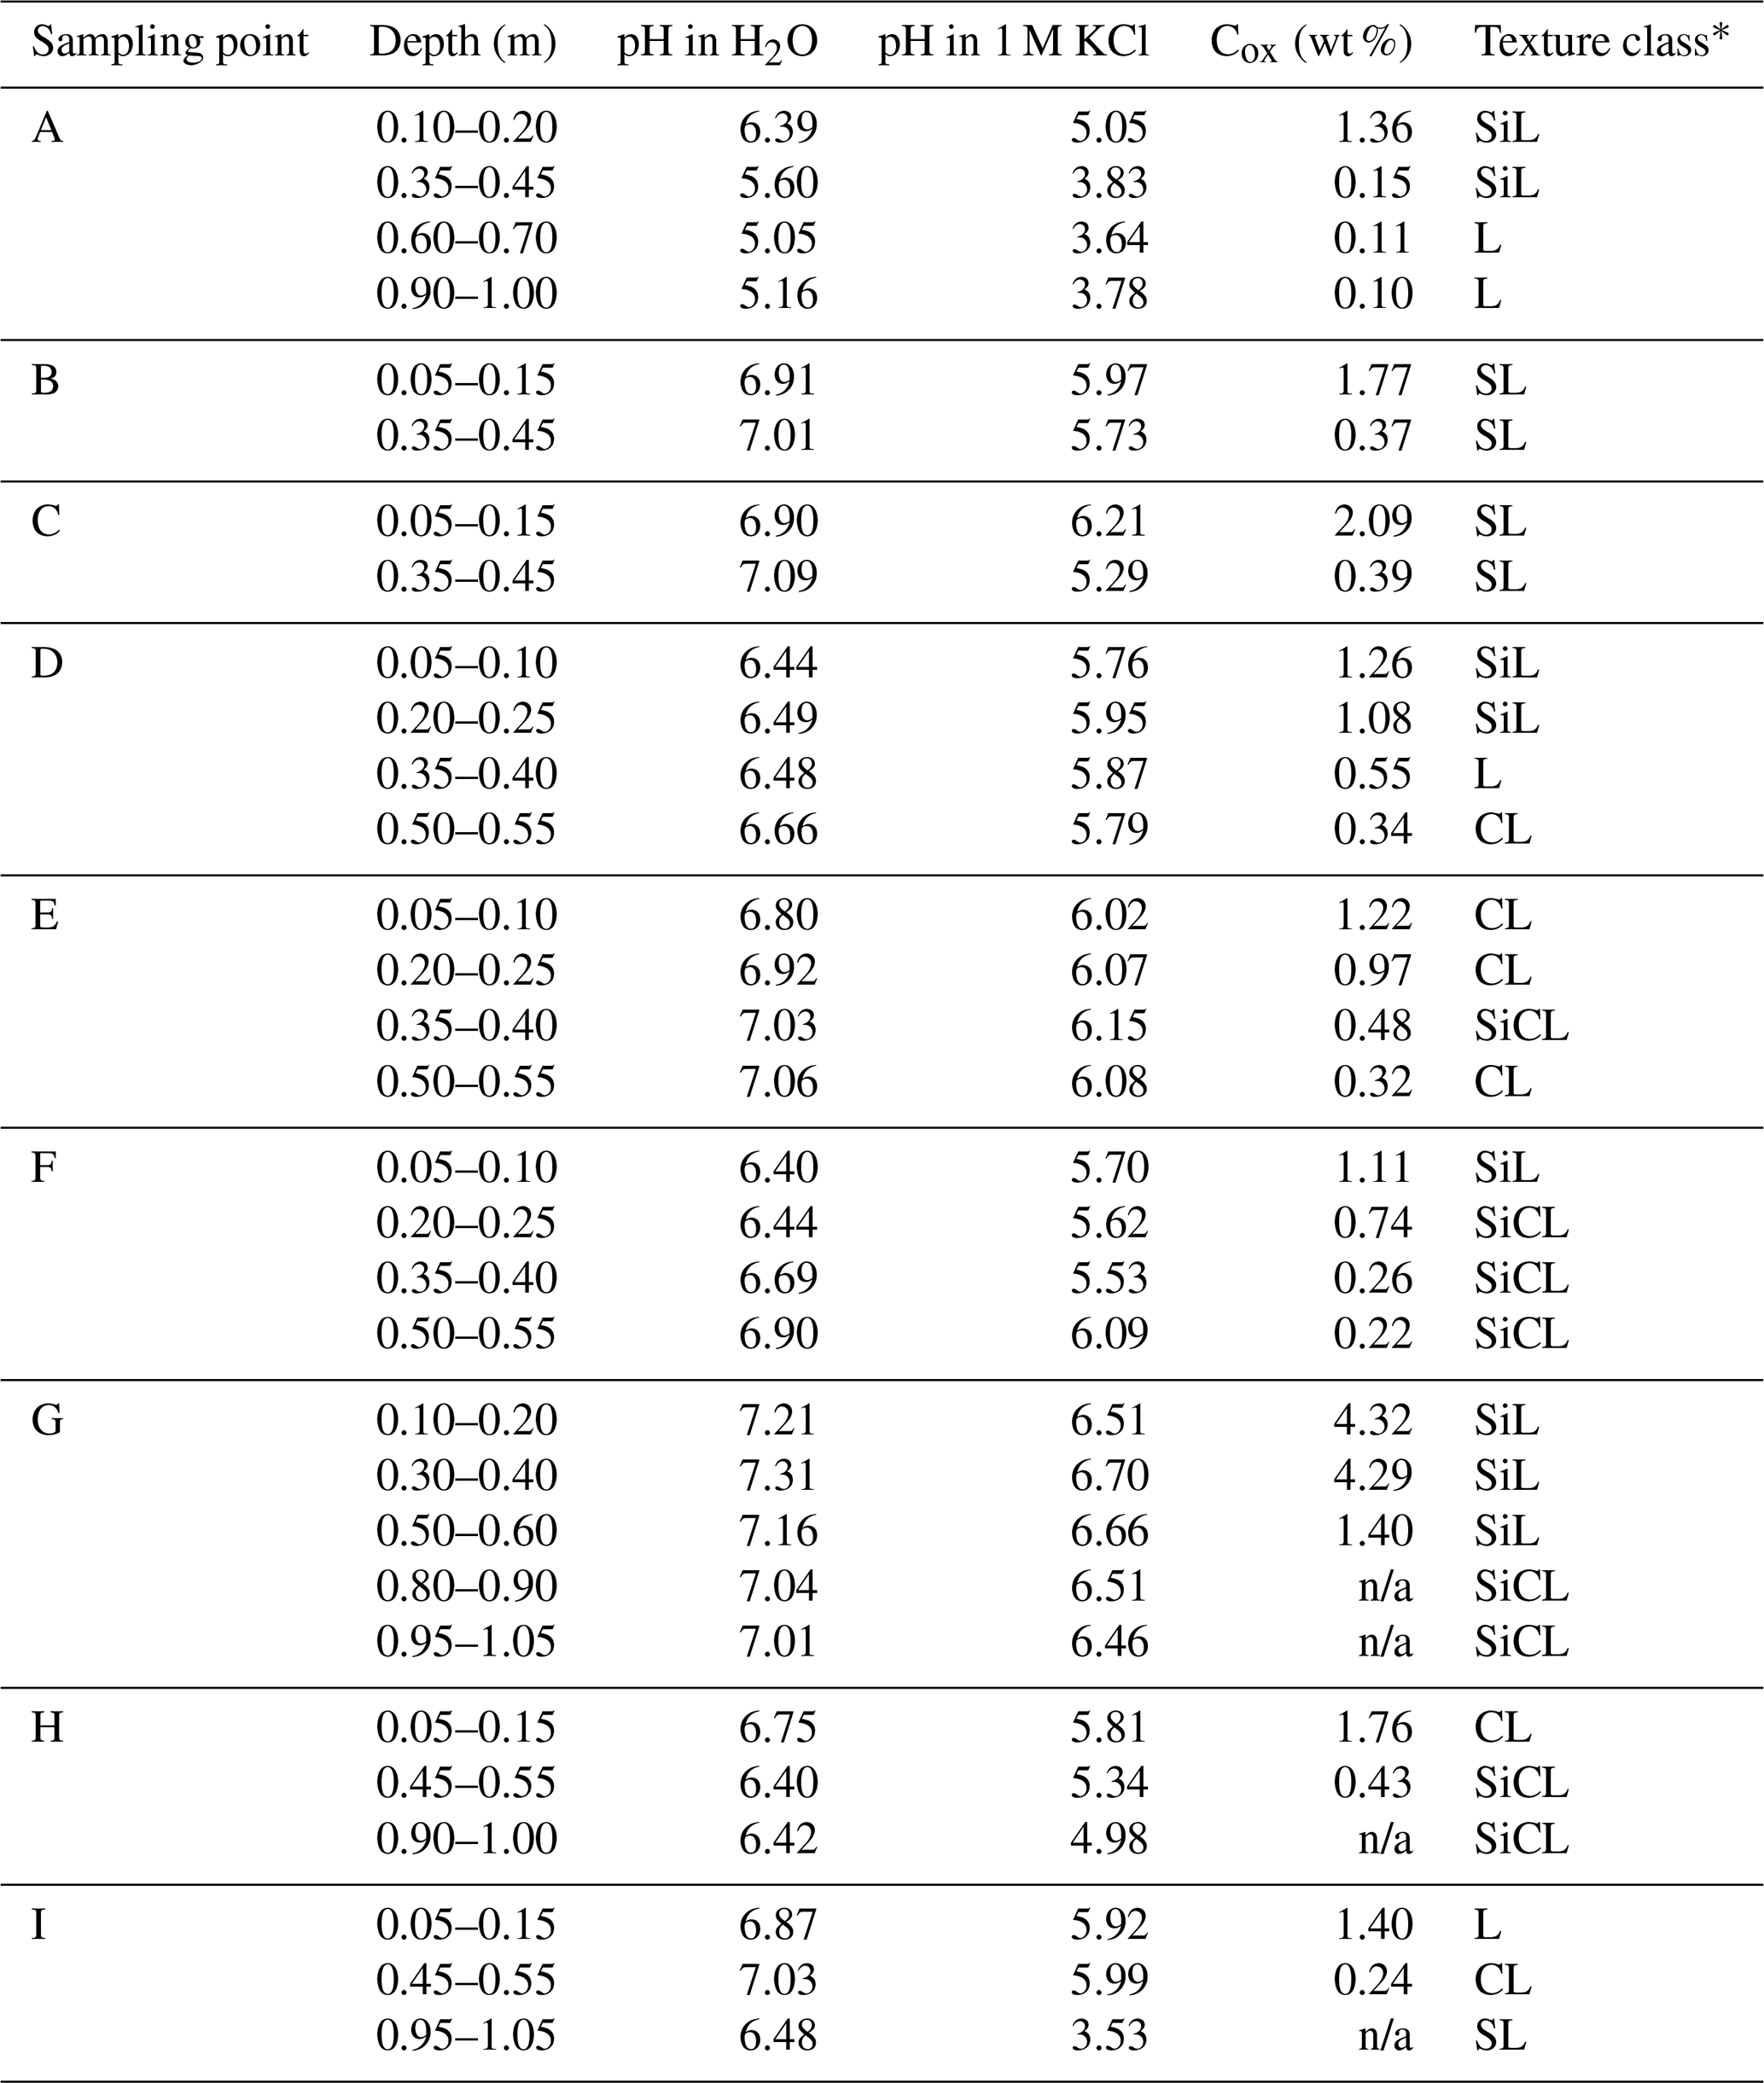
∗ SiL – silt loam, SiCL – silty clay loam, L – loam, CL – clay loam, SL – sandy loam. n/a = non available.
C1 Sampling point A
-
0.32–(0.43–0.65) m mottled layer 1: combination of pinkish white 7.5YR8/2 (w) and reddish yellow 7.5YR6/6 (w); angular structure, texture class silt loam, the layer contains a small amount of coarse sand and a high number of Fe-Mn nodules Ø5 mm. Transition to the deeper horizon is undulated.
-
(0.43–0.65)–1.12 m mottled layer 2: combination of grey 5YR5/1(w) and yellowish red 5YR5/6 (w); angular structure, texture class loam, admixture of coarse sand, a high number of Fe–Mn nodules.
-
>1.12 m (to 1.50 m) transition layer to the parent rock material: alternation of colours grey 5YR6/1 (w) and yellowish red 5YR4/6 (w); without a clear structure, texture class loam, the content of soil skeleton (mica schist) very quickly growing with the soil depth.
C2 Sampling point B
-
0.33–0.58 m cambic horizon: brown 7.5YR4/4 (w); angular structure, texture class sandy loam, approx. 20 % of soil skeleton. There is a clear transition to the deeper horizon.
-
>0.58 m (to the 1.30 m) parent (rock) material: >90 % of soil skeleton (stones), roots recognizable to 0.95 m.
C3 Sampling point C
-
0.28–0.60 m endopedon: colour brown 10YR4/3 (w) to dark yellowish brown 10YR4/4 (w), angular structure, texture class sandy loam, 25 % of soil skeleton.
-
>0.60 m transition horizon to the parent rock material: yellowish brown 10YR5/6 (w); without clear structure, texture class sandy class, the amount of soil skeleton growing with the depth from 30 % to 100 %, tight placement of weathered stones from a depth of 1.10 m (to the final depth of soil pit 1.35 m).
C4 Sampling point D
-
0.32–0.60 m argic horizon (clay coats; clay ratio with surface horizon 1.8): angular blocky structure, surface of aggregates 10YR3/4 (w) dark yellowish brown, inside of aggregates 10YR4/6 (w) dark yellowish brown; Fe–Mn nodules. Texture class is clay loam.
-
>0.60 m (to the final depth 1.40 m) transition horizon to the parent rock material.
C5 Sampling point E
-
0.29–0.62 m mottled layer 1 with stagnic properties: 70 % 10YR4/2 (w) dark greyish brown and 30 % 10YR5/6 (w) yellowish brown; small angular blocky structure, a small number of Fe–Mn nodules. Texture class is silty clay loam (0.35 m) and clay loam (>0.50 m) – qualifier Loamic.
-
>0.62 m mottled layer 2 with stagnic properties (qualifier Relictistagnic): 50 % 10YR5/2 (w), greyish brown and 50 % 10YR4/6 (w), dark yellowish brown; a large number of Fe–Mn nodules. 0.62–0.93 m, small angular blocky structure, >0.93 m (to the final depth 1.40 m), without structure,
C6 Sampling point F
-
0.33–0.57 m: 10YR5/6 (w) yellowish brown and <10 % 10YR4/1 (w) dark grey; small angular blocky structure. Texture class is silt loam (qualifier Siltic).
-
0.57–0.93 m: 10YR4/3(w) brown; to 0.74m small angular blocky structure, from 0.74 to 0.93 m structure prismatic; from 0.65 m a small number of Fe–Mn nodules. Texture class is silty clay loam. Clay coats on aggregates surface, but do not meet criteria for argic horizon.
-
>0.93 m (to the final depth 1.50 m) transition horizon to the parent rock material: 10YR4/6(w) dark yellowish brown; angular blocky structure, a weak number of roots to a depth of 1.30 m.
C7 Sampling point G
-
0.27–0.43 m topsoil layer 2: 7.5YR2/2–3/2 (w), very dark brown/dark brown; granular structure, texture class silt loam; artefacts (pieces of bricks, polyethylene) are uncommonly in this layer (<5 %). There is a sharp transition to the deeper horizon.
-
0.43–0.79 m layer 1: fluvic material with stagnic properties, <10 % of surface with colour 5YR5/6 (w) yellowish red and >90 % of surface with 7.5YR from 4/1 to 5/1 (w) dark grey /grey; angular structure, texture class silt loam, a small number of Fe–Mn nodules.
-
0.79–0.92 m layer 2: fluvic material with stagnic properties approx. 20 % of surface with mottles 5YR4/8-5/8 (yellowish red), other space with 2.5YR3/2 dusky red; angular structure, texture class silty clay loam.
-
>0.92 m layer 3 (to the final depth 1.50 m): fluvic material with stagnic properties 60 %–70 % of surface with mottles 2.5YR4/5 (reddish brown/red) and 5YR5/8 (w) (red), other space 5Y6/2 (w) light olive grey; prismatic structure, silty clay loam, a small number of Fe–Mn nodules, a small number of roots to a depth of 1.00 m.
C8 Sampling point H
-
0.30–0.85 m mottled layer 1: 7.5YR4/1 (w) dark grey, 7.5YR6/8 (w) reddish yellow; prismatic structure, texture class silty clay loam, random dark coats on aggregates, a small number of Fe–Mn nodules. There is a clear transition to the deeper horizon.
-
>0.85 m (to the final depth 1.30 m) mottled layer 2: grey 7.5YR6/1, reddish yellow7.5YR6/8; without clear structure, texture class silty clay loam.
C9 Sampling point I
-
0.36–0.94 m mottled layer 1: >90 % of surface 10YR5/8 yellowish brown, partly 10YR6/1 grey; without clear structure, texture class clay loam, 15 %–20 % rounded soil skeleton (gravel), a small number of Fe–Mn nodules, randomly dark Mn coats, roots to 0.72 m, a drainage pipe in the depth 0.53 m. There is a clear transition to the deeper horizon.
-
>0.94 m mottled layer 2 (to the final depth 1.35 m): >90,% of surface 7.5YR4/6 strong brown, partly 7.5YR7/1 light grey; without clear structure, texture class sandy loam, to 1.12 m approx. 15 % rounded soil skeleton (gravel), deeper <5 % soil skeleton (predominantly coarse sand).
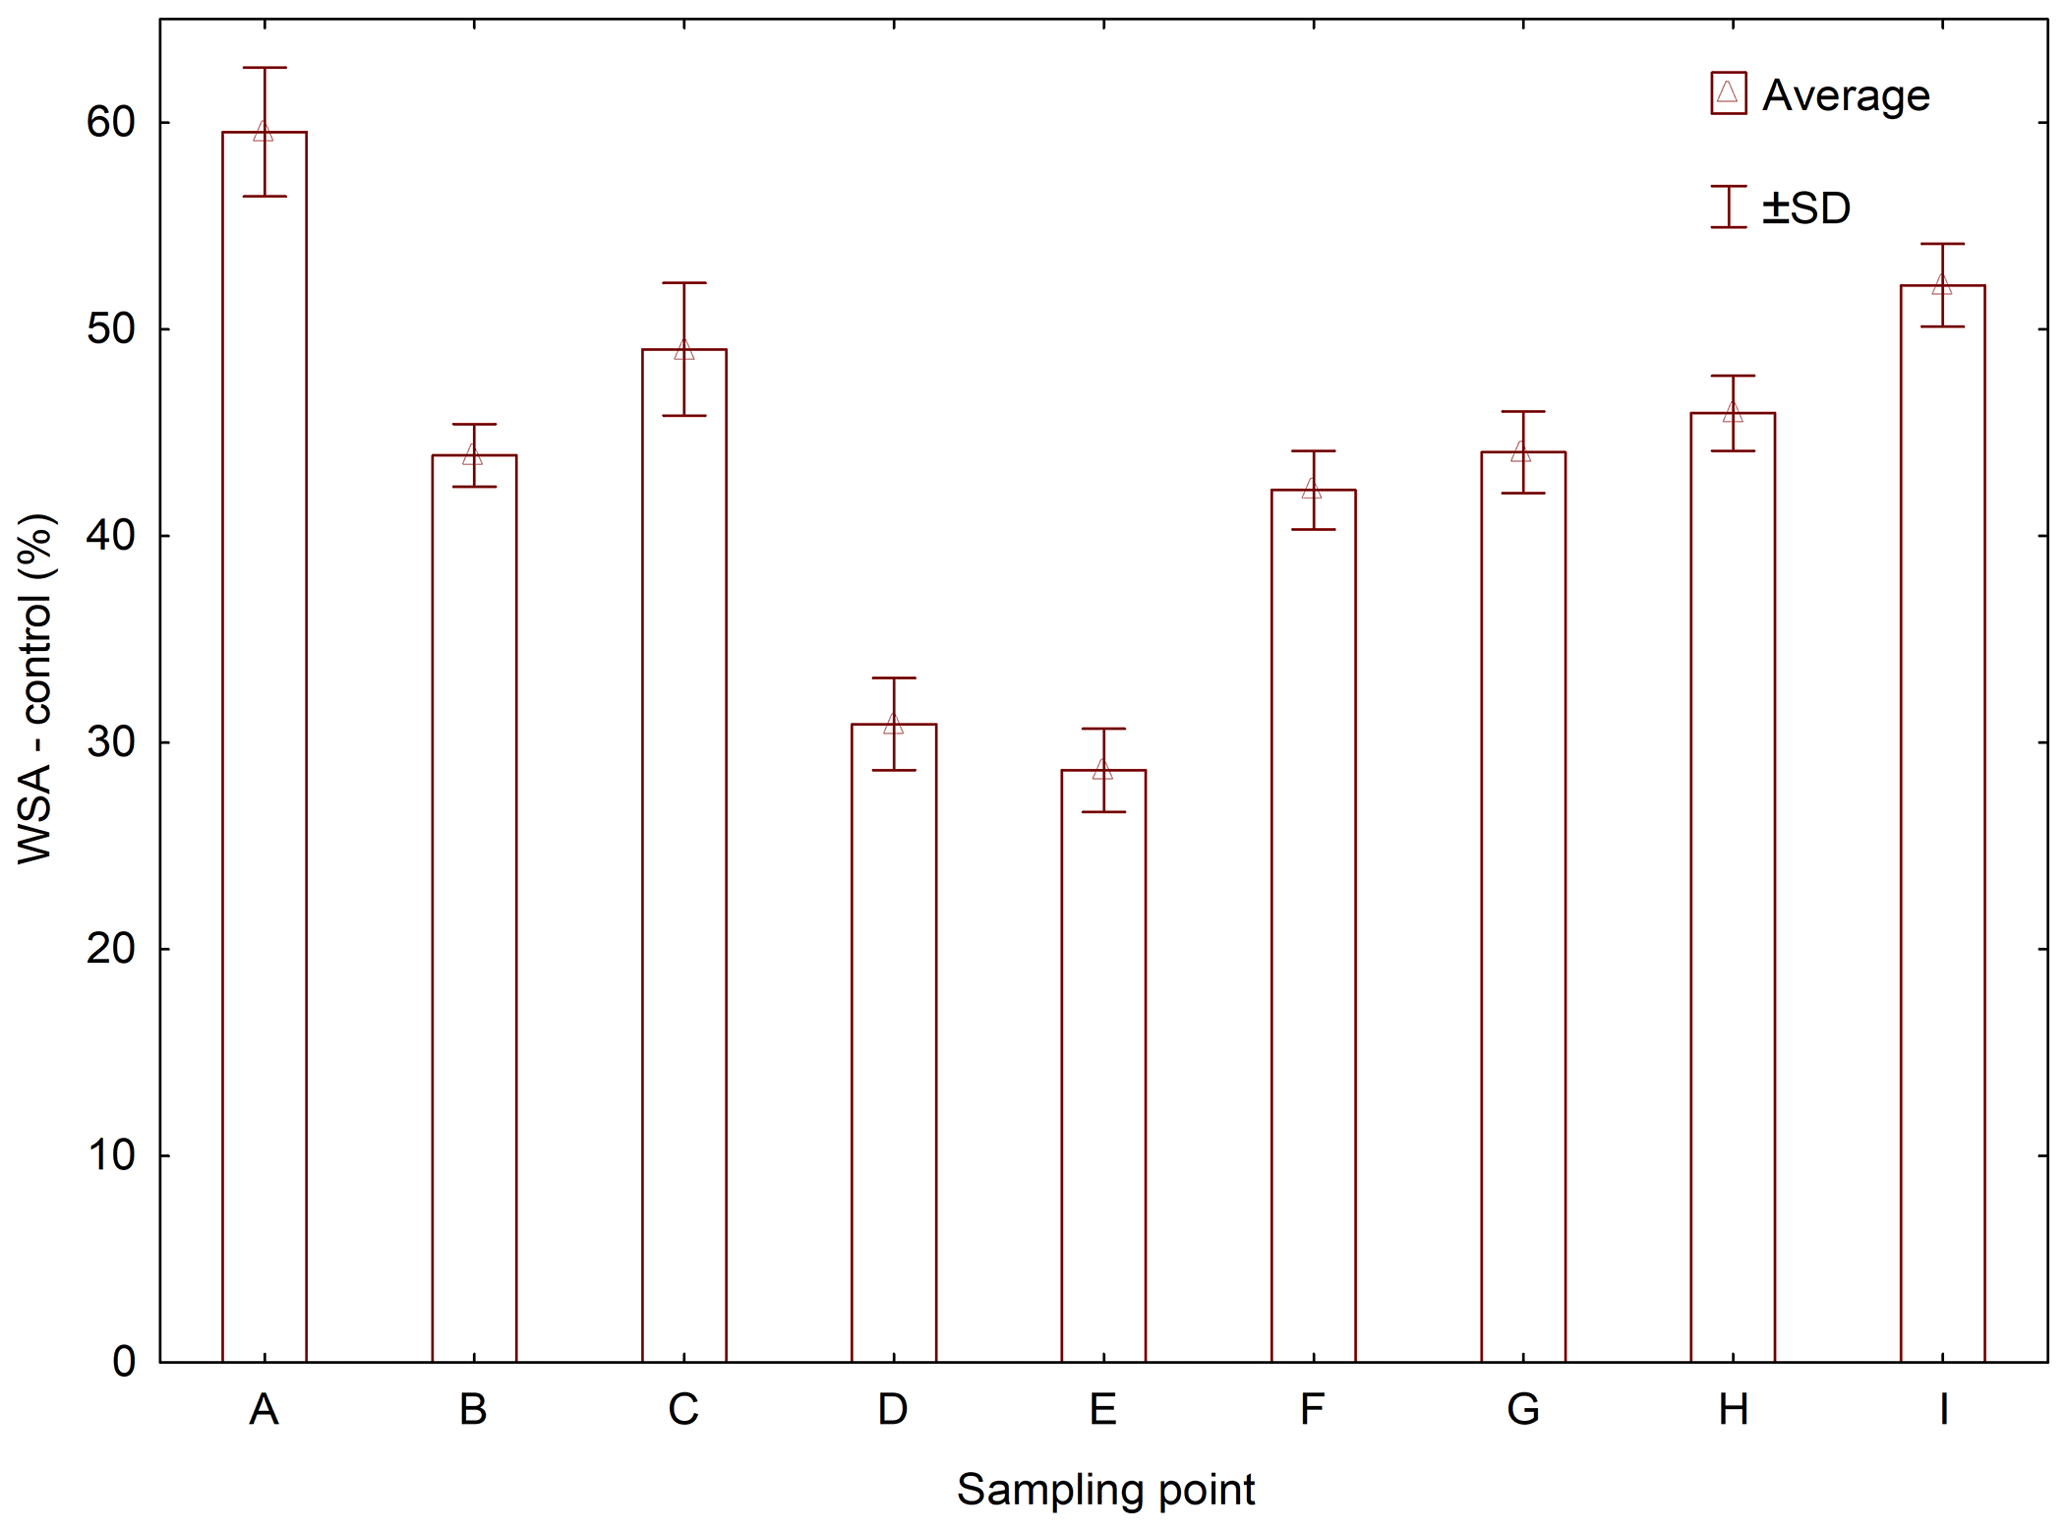
Figure D1Comparison of initial soil aggregates stability (WSA) at individual sampling points.
Table D1Comparison of initial soil aggregates stability (WSA) at individual sampling points – results of Tukey's post hoc HSD test.
Statistically significant differences (P<0.05) are in bold.
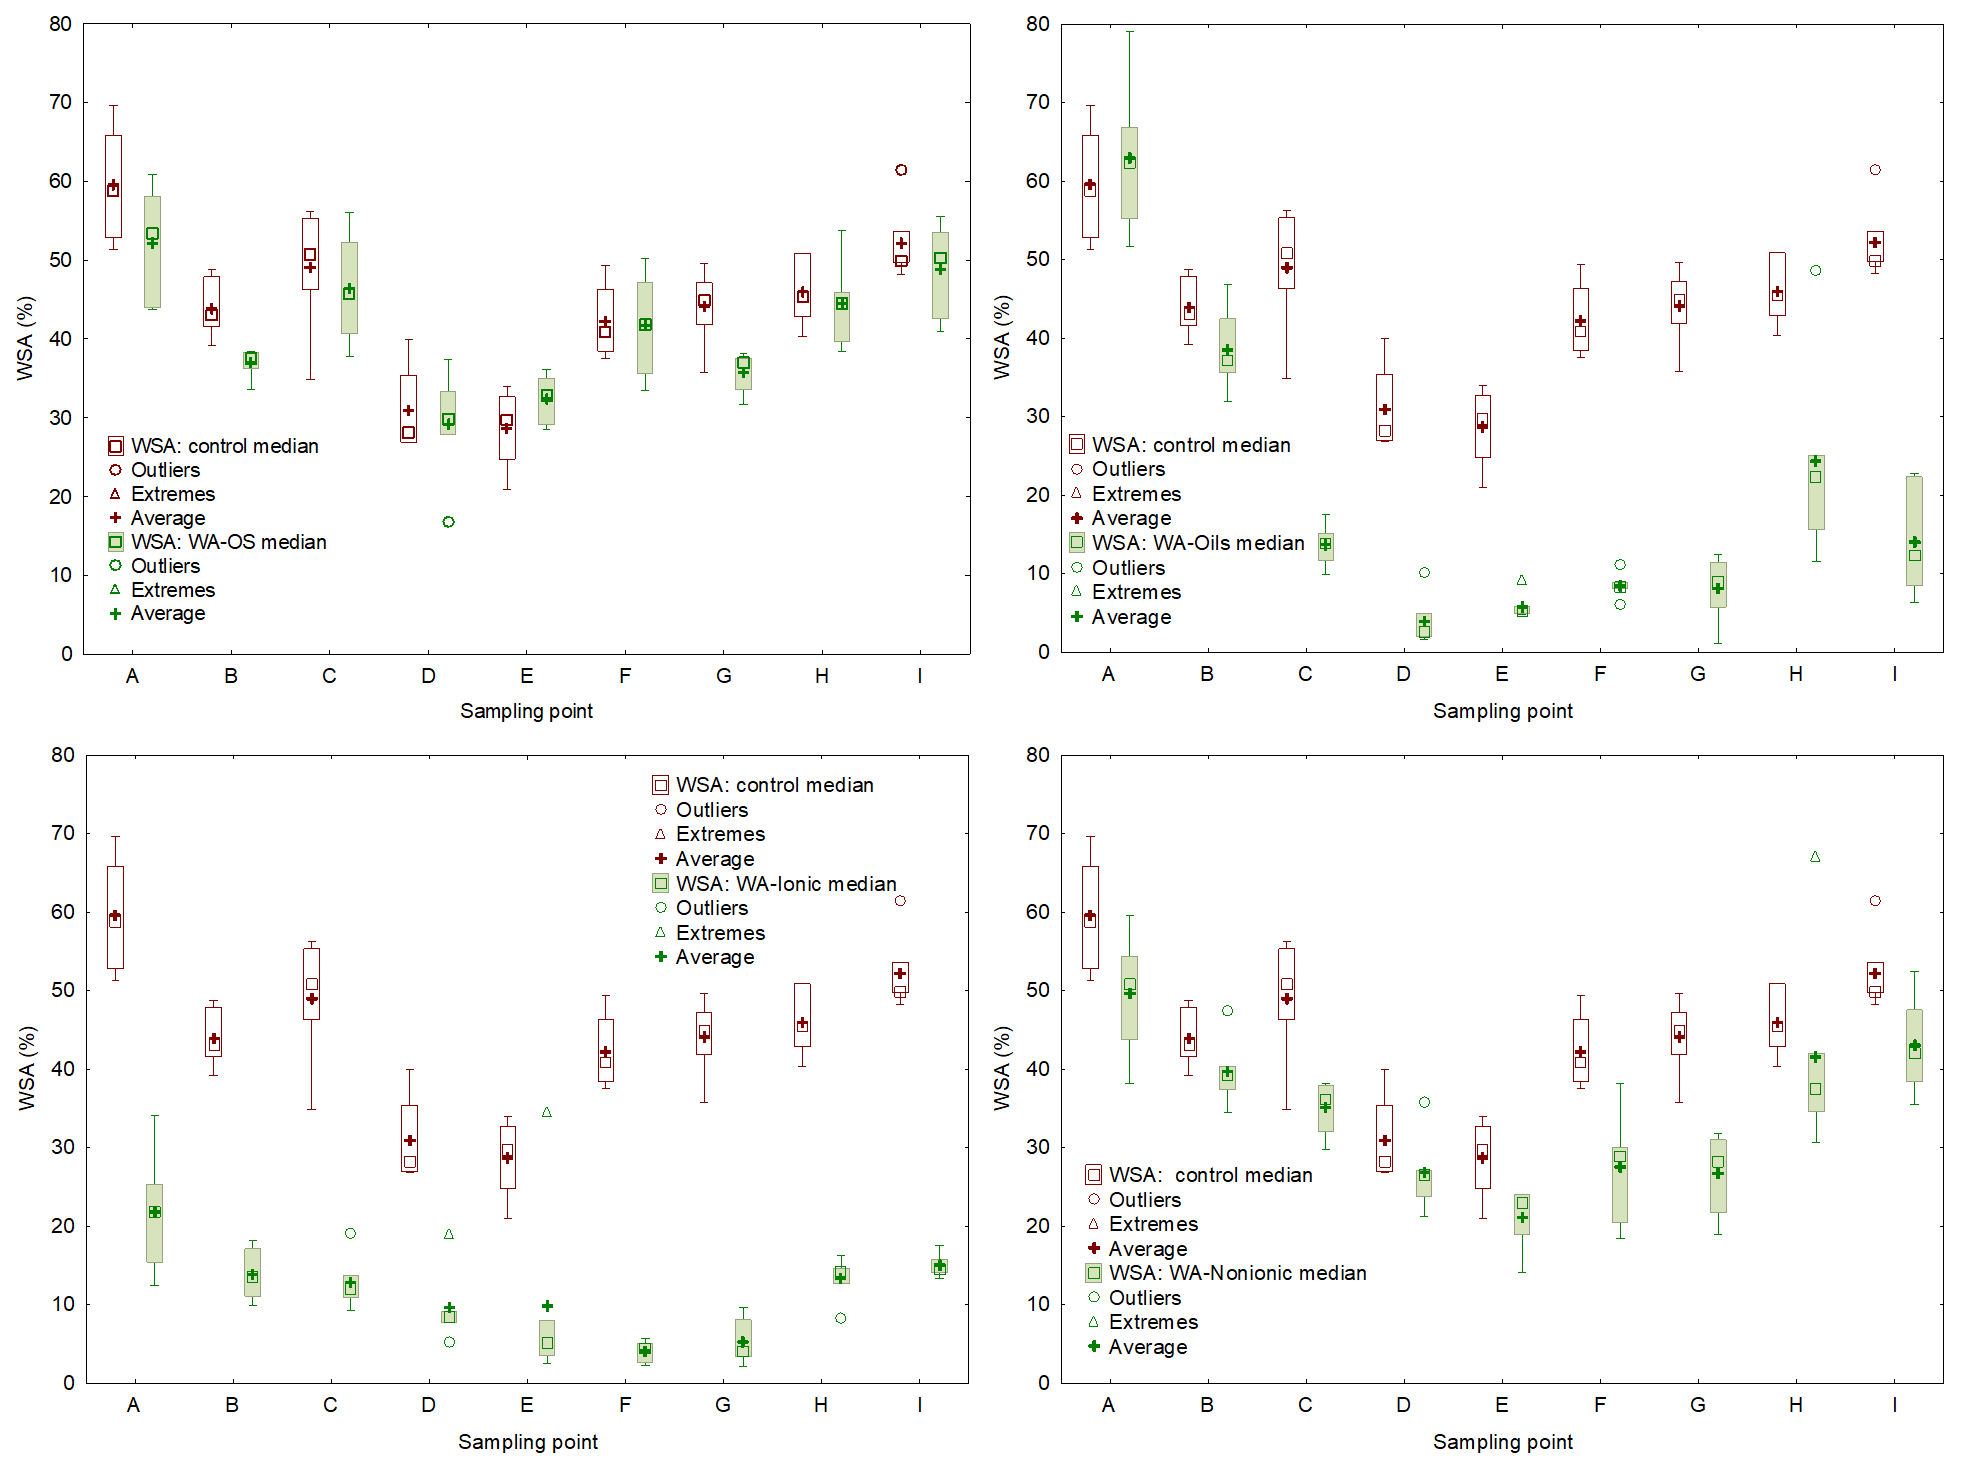
Figure D2Comparison of initial soil aggregates stability (WSA) and effect of the application of individual wetting agents (WA-OS, Oils, Ionic and Nonionic). WSA values are expressed by box plots. Each graph consists of upper (75th percentile) and lower (25th percentile) quartiles; each graph is added information about the maximum (upper whisker) and minimum (lower whisker).
Table D2Descriptive statistics for the stability of soil aggregates.
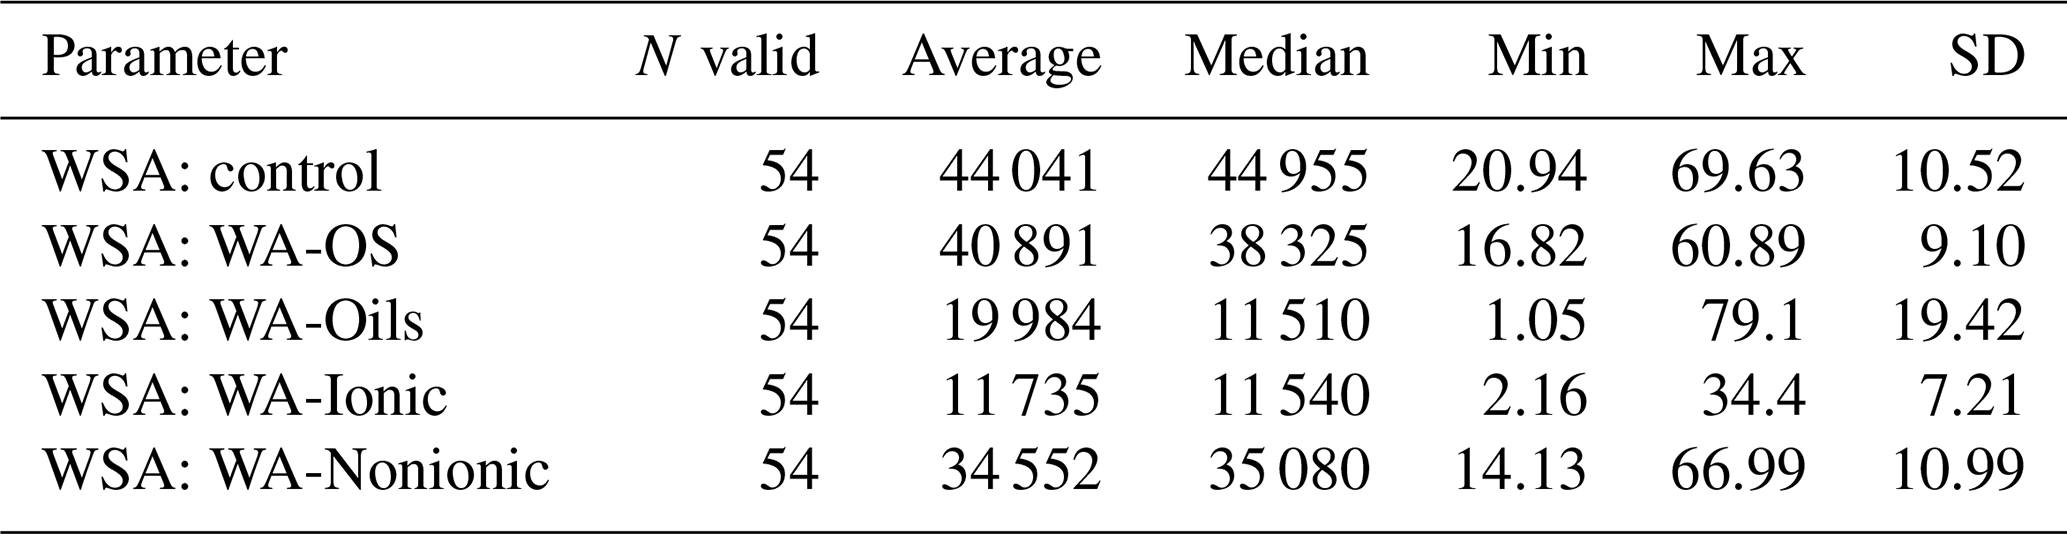
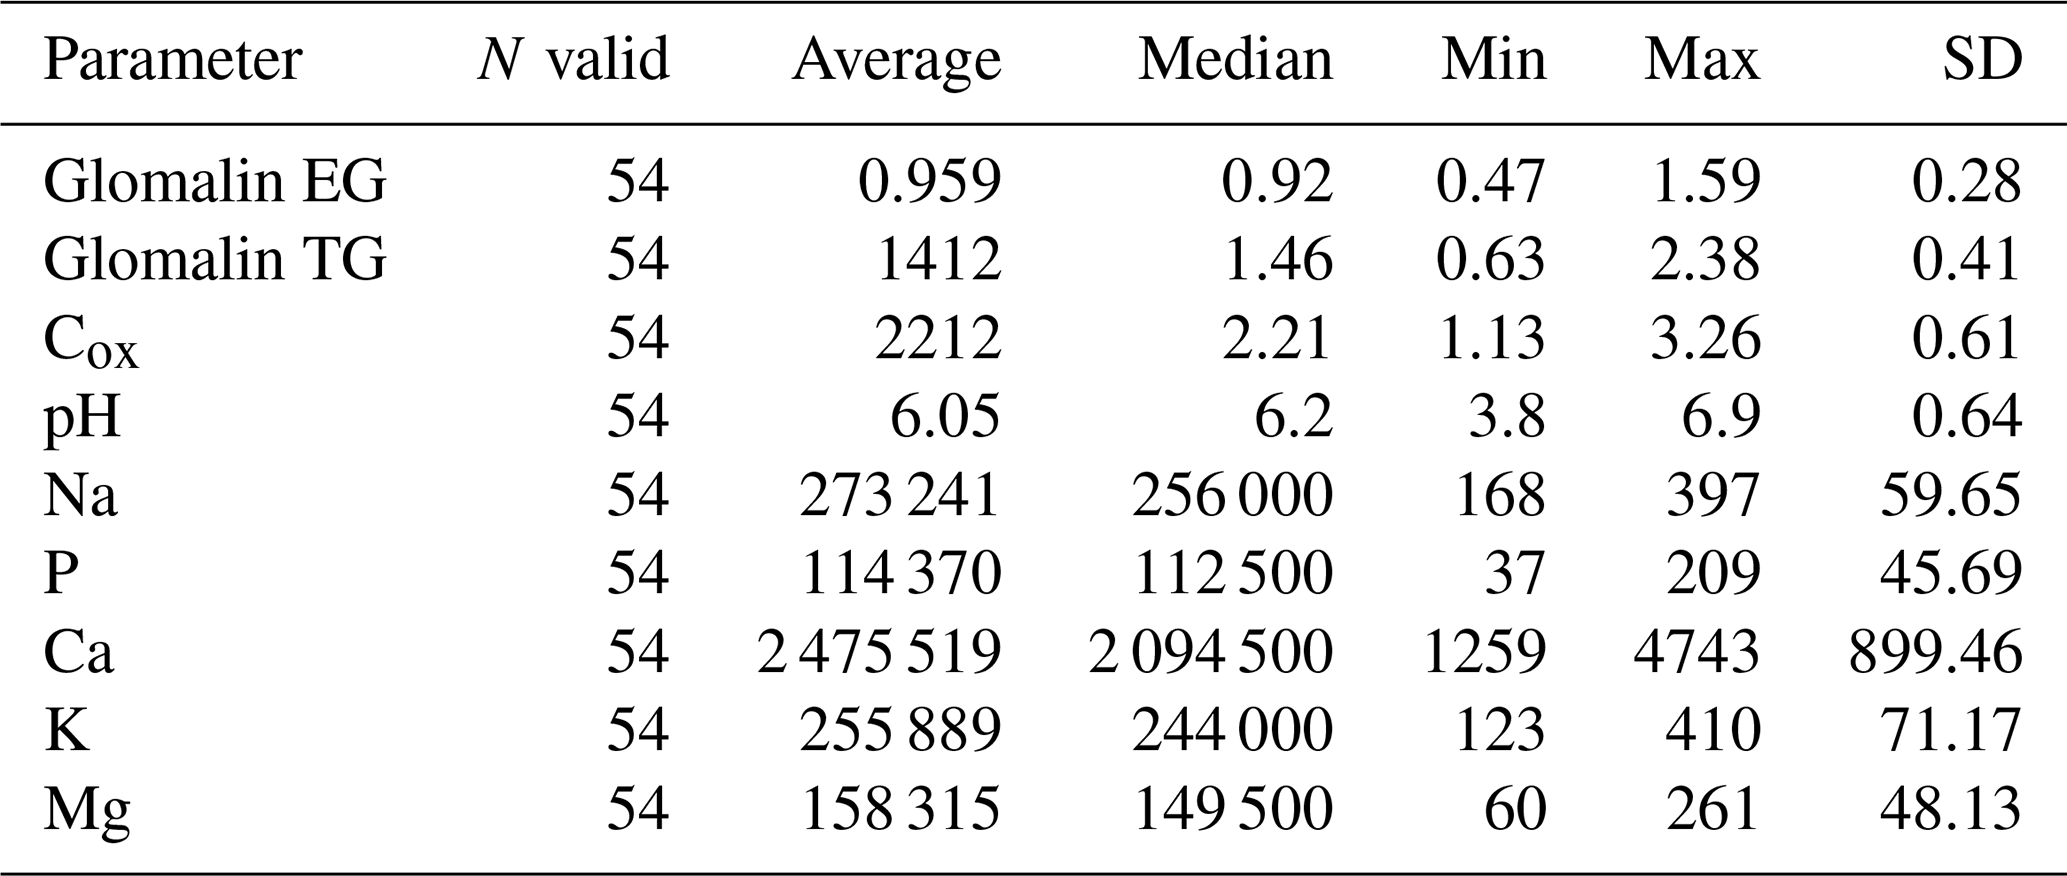
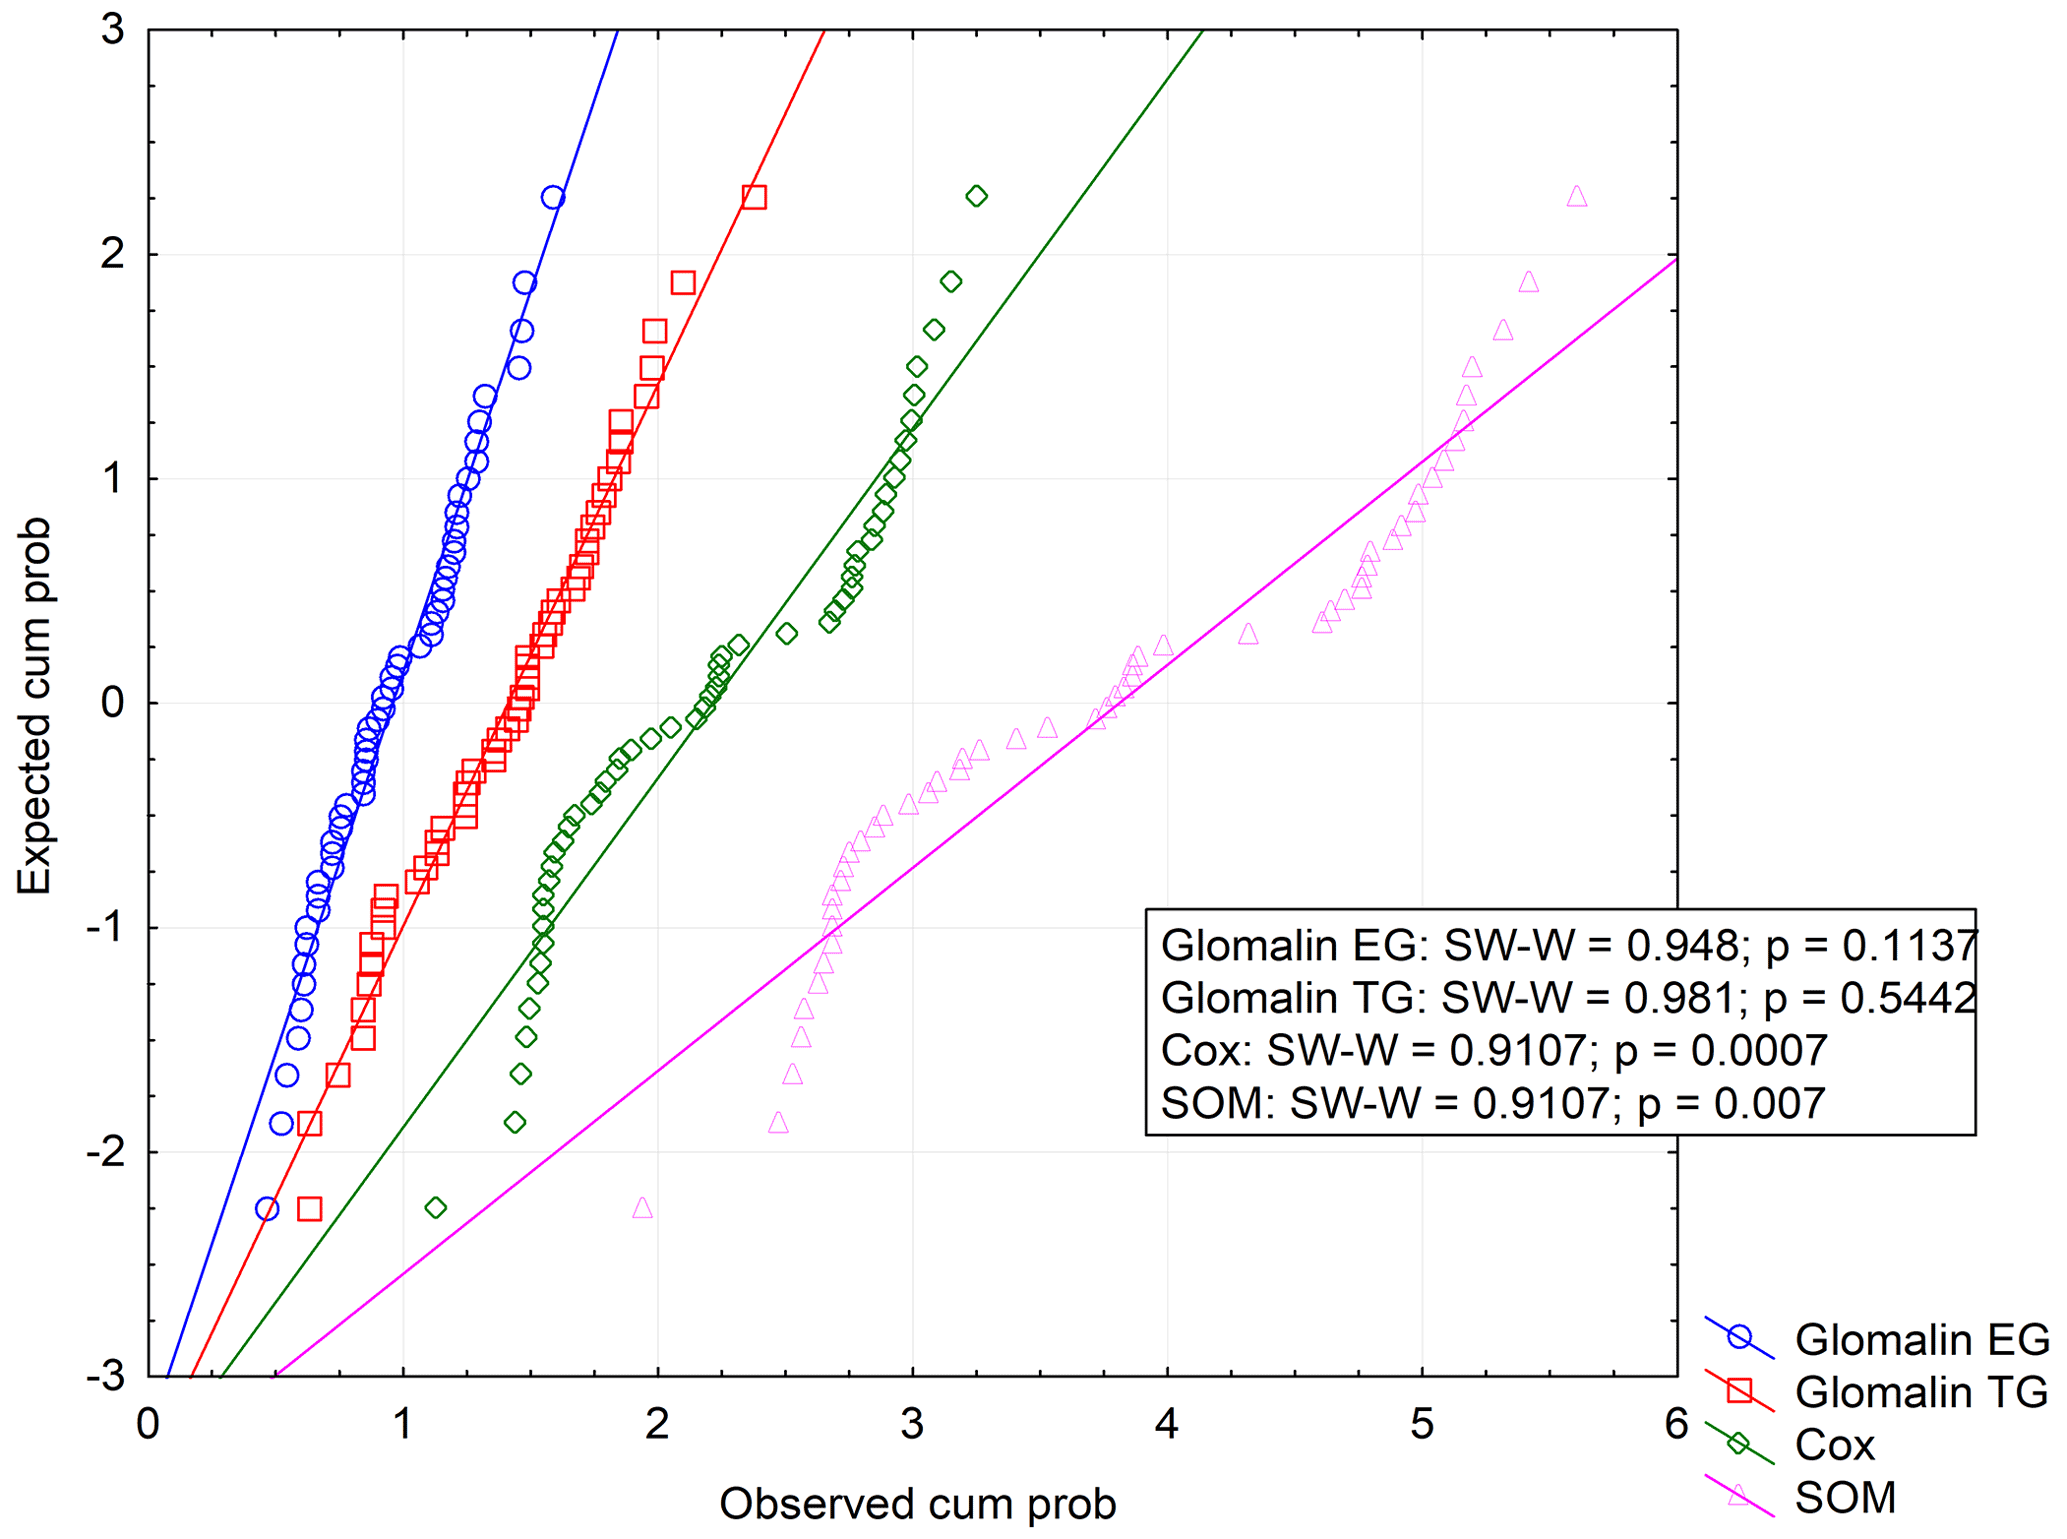
Table E1Contents of sodium and soil nutrients available to plants.
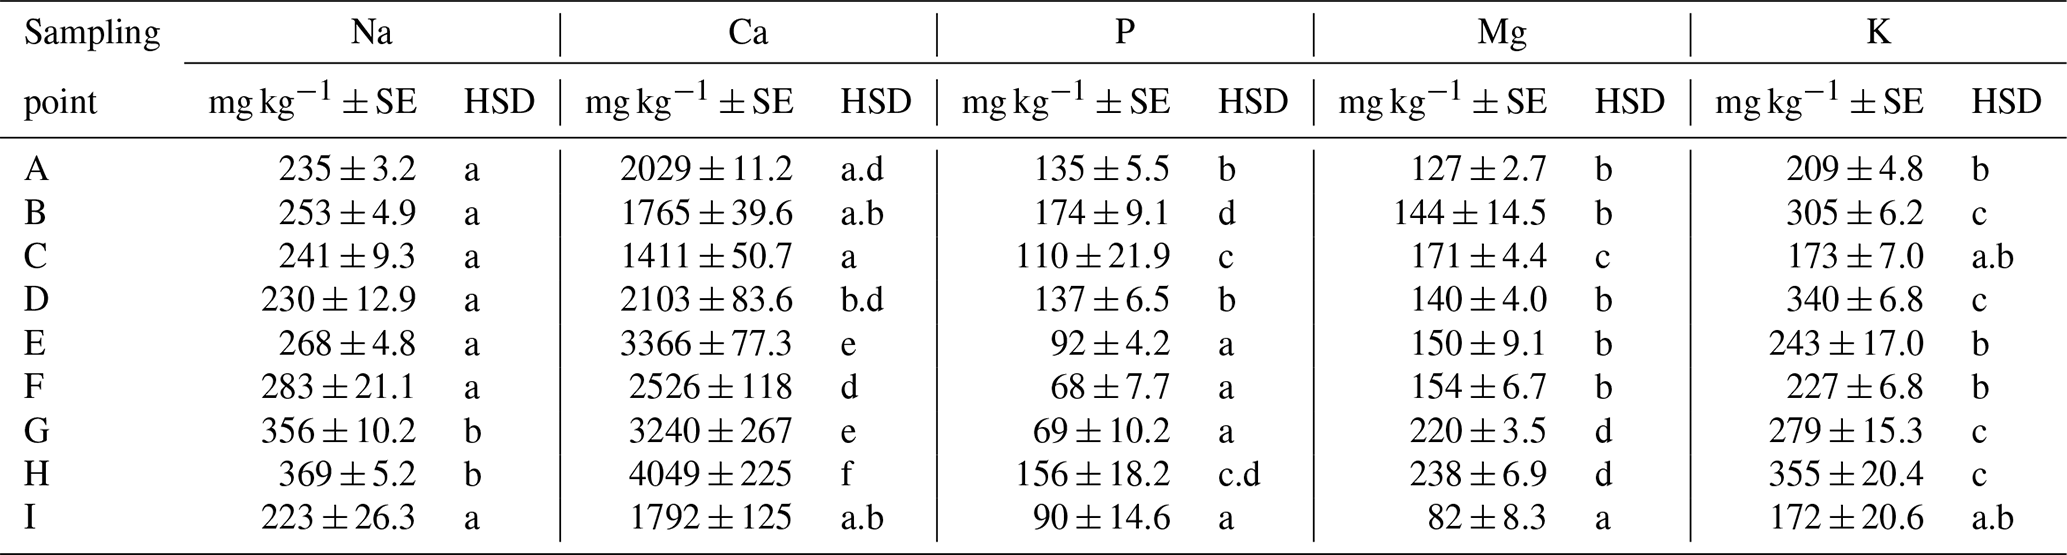
Different small letters indicate significant differences (P<0.05).
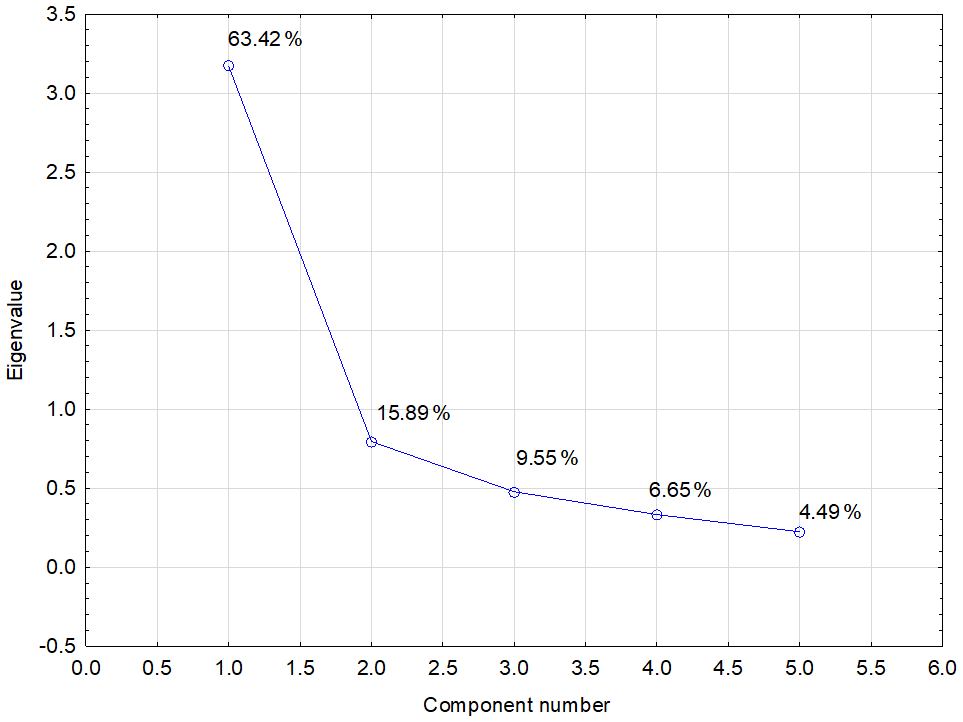
Figure F1PCA scree plot – graph of eigenvalues (variances) of all factors. Note that the diagram serves to determine the number of significant main components. If an eigenvalue is greater than 1, the given component explains more variance of total dispersion than one original variable. The first two components (1.0 and 2.0) explain nearly 80 % of the total variance of original data.
The data that support the findings of this study are available from the corresponding author upon request.
Conceptualization was done by AK and JE; methodology by JE and AK; formal analysis by MB and JE; investigation by AK, JE and VV; resources by AK; data curation by JE; writing, including original draft preparation, by AK, VV and JE; writing, including review and editing, by JE; visualization by JE, VV and MB; supervision by AK, JE and JN; project administration by AK; and funding acquisition by AK.
The contact author has declared that neither they nor their co-authors have any competing interests.
Publisher’s note: Copernicus Publications remains neutral with regard to jurisdictional claims in published maps and institutional affiliations.
The research was financially supported by TA CR, project no. TH030300236 – “Growing maize for grain in the controlled system of mixed culture with the use of clovers” and by Ministry of Agriculture of the Czech Republic – institutional support MZE RO1722.
This paper was edited by Stefan Doerr and reviewed by Paul Hallett and G. Peter Matthews.
Ahmed, A. A., Thiele-Bruhn, S., Aziz, G. S., Hilal, R.F ., Elroby, S. A., Al-Youbi, A. O., Leinweber, P., and Kühn, O.: Interaction of polar and nonpolar organic pollutants with soil organic matter: Sorption experiments and molecular dynamics simulation, Sci. Total Environ., 508, 276–287, https://doi.org/10.1016/j.scitotenv.2014.11.087, 2015.
Almajmaie, A., Hardie, M., Acuna, T., and Birch, C.: Evaluation of methods for determining soil aggregate stability, Soil Till. Res., 167, 39–45, https://doi.org/10.1016/j.still.2016.11.003, 2017.
Angers, D. A.: Changes in Soil Aggregation and Organic Carbon under Corn and Alfalfa, Soil Sci. Soc. Am. J., 56, 1244–1249, https://doi.org/10.2136/sssaj1992.03615995005600040039x, 1992.
Arienzo, M., Christen, E. W., Jayawardane, N. S., and Quayle, W. C.: The relative effects of sodium and potassium on soil hydraulic conductivity and implications for winery wastewater management, Geoderma, 173, 303–310, https://doi.org/10.1016/j.geoderma.2011.12.012, 2012.
Baratella, V. and Trinchera, A.: Organosilicone surfactants as innovative irrigation adjuvants: Can they improve water use efficiency and nutrient uptake in crop production?, Agric. Water Manage., 204, 149–161, https://doi.org/10.1016/j.agwat.2018.04.003, 2018.
Bartlová, J., Badalíková, B., Pospíšilová, L., Pokorný, E., and Šarapatka, B.: Water stability of soil aggregates in diystemt systém of tillage, Soil Water Res., 3, 147–154, https://doi.org/10.17221/132/2014-SWR, 2015.
Borrelli, P., Robinson, D. A., Fleischer, L. R., and Lugato, E.: An assessment of the global impact of 21st century land use change on soil erosion, Nat. Commun., 8, 2013, https://doi.org/10.1038/s41467-017-02142-7, 2017.
Bradford, M. M.: A Rapid and Sensitive Method for the Quantitation of Microgram Quantities of Protein Utilizing the Principle of Protein-Dye Binding, Anal. Biochem., 72, 248–254, https://doi.org/10.1016/0003-2697(76)90527-3, 1976.
Brant, V., Zábranský, P., Škeříková, M., Pivec, J., Kroulík, M., and Procházka, L.: Effect of row width on splash erosion and throughfall in silage maize crops, Soil Water Res., 12, 39–50, https://doi.org/10.17221/121/2015-SWR, 2017.
Bronick, C. J. and Lal, R.: Soil structure and management: a review, Geoderma, 124, 3–22, https://doi.org/10.1016/j.geoderma.2004.03.005, 2005.
Brtnický, M., Elbl J., Dvořáčková, H., Kynický, J., and Hladký, J.: Changes in soil aggregate stability induced by mineral nitrogen fertilizer application, Acta Univ. Agric. Silvic. Mendelianae Brun., 65, 1477–1482, https://doi.org/10.11118/actaun201765051477, 2017.
Burauel, P. and Bassman F.: Soils as filter and buffer for pesticides – experimental concepts to understand soil functions, Environ. Pollut., 133, 11–16, https://doi.org/10.1016/j.envpol.2004.04.011, 2005.
Canoira, L., Galeán, J. G., Alcántara, R., Lapuerta, M., and Contreras, R. G.: Fatty acid methyl esters (FAMEs) from castor oil: Production process assessment and synergistic effects in its properties, Renew. Energy, 35, 208–217, https://doi.org/10.1016/j.renene.2009.05.006, 2010.
Castro, E. B., Carbonari, C. A., Velini, E. D., Gomes, G. L. G. C., and Belapart, D.: Influence of Adjuvants on the Surface Tension, Deposition and Effectiveness of Herbicides on Fleabane Plants, Planta Daninha, 36, e018166251, https://doi.org/10.1590/S0100-83582018360100067, 2018.
Dornbush, M. E. and von Haden, A. C.: Chapter 8 – Intensified Agroecosystems and Their Effects on Soil Biodiversity and Soil Functions, Soil Health Intensif. Agroecosyt., 173–193, https://doi.org/10.1016/B978-0-12-805317-1.00008-7, 2017.
Emerson, W. W. and Smith, B. H.: Magnesium, Organic Matter and Soil Structure, Nature, 228, 453–454, https://doi.org/10.1038/228453b0, 1970.
Emerson, W. W. and Greenland, D. J.: Soil Aggregates – Formation and Stability, in: Soil Colloids and Their Associations in Aggregates, edited by: De Boodt, M. F., Hayes, M. H. B., Herbillon, A., De Strooper, E. B. A., and Tuck, J. J., NATO ASI Series (Series B: Physics), Springer, Boston, MA, 214, https://doi.org/10.1007/978-1-4899-2611-1_18, 1990.
Emran, M., Gispert, M., and Pardini, G.: Patterns of soil organic carbon, glomalin and structural stability in abandoned Mediterranean terraced lands, Eur. J. Soil Sci., 63, 637–649, https://doi.org/10.1111/j.1365-2389.2012.01493.x, 2012.
Floch, C., Chevremont, A. C., Joanico, K., Capowiez, Y., and Criquet, S.: Indicators of pesticide contamination: Soil enzyme compared to functional diversity of bacterial communities via Biolog® Ecoplates, Eur. J. Soil Biol., 47, 256–263, https://doi.org/10.1016/j.ejsobi.2011.05.007, 2011.
Gebeltova, Z., Malec, K., Maitah, M., Smutka, L., Appiah-Kubi, S. N. K., Maitah, K., and Sahatqija, J.: The Impact of crop mix on decreasing soil price and soil degradation: a case study of selected regions in Czechia (2002–2019), Sustainability, 12, 444, https://doi.org/10.3390/su12020444, 2020.
Gerke, H. H. and Köhne, J. M.: Estimating Hydraulic Properties of Soil Aggregate Skins from Sorptivity and Water Retention, Soil Sci. Soc. Am. J., 66, 26–36, https://doi.org/10.2136/sssaj2002.2600, 2002.
Handlirova, M., Lukas, V., and Smutny, V.: Yield and soil coverage of catch crops and their impact on the yield of spring barely, Plant Soil Environ., 63, 195–200, https://doi.org/10.17221/801/2016-PSE, 2017.
Hao, Y., Zhang, N., Xu, W., Gao, J., Zhang, Y., and Tao, L.: A natural adjuvant shows the ability to improve the effectiveness of glyphosate application, J. Pestic. Sci., 44, 106–111, https://doi.org/10.1584/jpestics.D18-066, 2019.
Hazen, J. L.: Adjuvants – Terrminology, Classification, and Chemistry, Weed Technol., 14, 773–784, https://doi.org/10.1614/0890-037X(2000)014[0773:ATCAC]2.0.CO;2, 2000.
Hlisnikovský, L., Menšík, L., Křížová, K., and Kunzová, E.: The effect of farmyard manure and mineral fertilizers on sugar beet beetroot and top yield and soil chemical parameters, Agronomy, 11, 133, https://doi.org/10.3390/agronomy11010133, 2021.
Holátko J., Brtnicky, M., Kucerik, J., Kotianova, M. Elbl, J., Kintl, A., Kynicky, J., Benada, O., Datta, R. and Jansa, J.: Glomalin – Truths, myths, and the future of this elusive soil glycoprotein, Soil Biol. Biochem., 153, 108116, https://doi.org/10.1016/j.soilbio.2020.108116, 2021.
Jacobsen, C. S. and Hjelmsø, M. H.: Agricultural soils, pesticides and microbial diversity, Curr. Opin. Biotechnol, 27, 15–20, https://doi.org/10.1016/j.copbio.2013.09.003, 2014.
Joshi, H., Shourie, A., and Singh, A.: Chapter 25 – Cyanobacteria as a source of biofertilizers for sustainable agriculture, Methods in Soil Biology, ISBN 978-3-642-60966-4, edition no. 1, 2020.
Kaczorek, E., Sałek, K., Guzik, U., and Dudzińska-Bajorek, B.: Cell surface properties and fatty acids composition of Stenotrophomonas maltophilia under the influence of hydrophobic compounds and surfactants, New Biotechnol., 30, 173–182, https://doi.org/10.1016/j.nbt.2012.09.003, 2013.
Kandeler, E.: Aggregate stability, in: Methods in Soil Biology, edited by: Schinner, F., Öhlinger, R., Kandeler, E., and Margesin, R., Berlin, Springer-Verlag, 390–395, 1996.
Kandeler, E. and Murer, E.: Aggregate stability and soilprocesses in a soil with different cultivation, Geoderma, 56, 503–513, https://doi.org/10.1016/0016-7061(93)90130-D, 1993.
Leighton-Boyce, G., Doerr, S. H., Shakesby, R. A., and Walsh, R. P. D.: Quantifying the impact of soil water repellency on overland flow generation and erosion: a new approach using rainfall simulation and wetting agent on in situ soil, Hydrol. Process., 21, 2337–2345, https://doi.org/10.1002/hyp.6744, 2007.
Lehrsch, G. A.: Surfactant effects on the water-stable aggregation of wettable soils from the continental USA, Hydrol. Process, 27, 1739–1750, https://doi.org/10.1002/hyp.9320, 2012.
Lehrsch, G. A., Sojka, R. E., and Koehn, A. C.: Surfactant effects on soil aggregate tensile strength. Geoderma, 189, 199–206, https://doi.org/10.1016/j.geoderma.2012.06.015, 2012.
Lošák, T., Vollman J., Hlušek J., Peterka, J., Filipcik R., and Praskova, L.: Influence of combined nitrogen and sulphur fertilization on false flax (Camelina sativa [L.] Crtz.) yield and quality, Acta Alimentaria, 39, 431–444, https://doi.org/10.1556/aalim.39.2010.4.5, 2010.
Mao, J., Nierop, K. G. J., Dekker, S. C., Dekker, L. W., and Chen, B.: Understanding the mechanisms of soil water repellency from nanoscale to ecosystem scale: a review, J. Soils Sediments, 19, 171–185, https://doi.org/10.1007/s11368-018-2195-9, 2019.
McMullan, P. M.: Utility adjuvants, Weed Technol., 14, 792–797, https://www.jstor.org/stable/3988670 (last access: 25 January 2022), 2000.
Martínez, G., Sánchez, N., Encinar, J. M., and González, J. F.: Fuel properties of biodiesel from vegetable oils and oil mixtures, Influence of methyl esters distribution, Biomass Bioenerg., 63, 22–32, https://doi.org/10.1016/j.biombioe.2014.01.034, 2014.
Martin, J. P., Martin, W. P., Page, J. B., Raney, W. A., and de Ment, J. D.: Soil Aggregation, Adv. Agron., 7, 1–37, https://doi.org/10.1016/S0065-2113(08)60333-8, 1955.
Mataix-Solera, J. and Doerr, S. H.: Hydrophobicity and aggregate stability in calcareous topsoils from fire-affected pine forests in southeastern Spain, Geoderma, 118, 77–88, https://doi.org/10.1016/S0016-7061(03)00185-X, 2004.
Menšík, L., Kincl, D., Nerušil, P., Srbek, J., Hlisnikovský, L., and Smutný, V.: Water erosion reduction using different soil tillage approaches for Maize (Zea mays L.) in the Czech Republic, Land, 9, 358, https://doi.org/10.3390/land9100358, 2020.
Mesnage, R. and Antoniou, M. N.: Ignoring Adjuvant Toxicity Falsifies the Safety Profile of Commercial Pesticides, Front. Public Health, 5, 361, https://doi.org/10.3389/fpubh.2017.00361, 2018.
Mesnage, R., Bernay, B., and Séralini, G.-E.: Ethoxylated Adjuvants of Glyphosate-Based Herbicides Are Active Principles of Human Cell Toxicity, Toxicology, 313, 122–128, https://doi.org/10.1016/j.tox.2012.09.006, 2013.
Mirgorodskaya, A. B., Kushnazarova, R. A., Lukashenko, S. S., Nikitin, E. N., Sinyashin, O., Nesterova, L. M., and Zakharova, L. Y.: Carbamate-bearing surfactants as effective adjuvants promoted the penetration of the herbicide into the plant, Colloids Surf. A Physicochem. Eng. Asp., 586, 124252, https://doi.org/10.1016/j.colsurfa.2019.124252, 2020.
Miyake, M. and Yamashita, Y.: Molecular Structure and Phase Behavior of Surfactants, in: Cosmetic Science and Technology, edited by: Sakamoto, K., Lochhead, R. Y., Maibach, H. I., and Yamashita, Y., Cosmetic Science and Technology, ISBN 9780128020050, edition no. 1, 2017.
Nelson, D. W. and Sommers, L. E.: Total carbon, organic carbon and organic matter, in: Soil Science Society of America, Book Series 5. Methods of Soil Analysis Part 3, edited by: Sparks, D. L., Chemical Methods, Madison, Wisconsin: Soil Science Society of America, Inc., https://doi.org/10.2136/sssabookser5.3.c34, 1996.
Pacanoski, Z.: Herbicides and adjuvants, in: Physiology of action and safater, edited by: Price, A., Kelton, J., and Sarunaite, L., IntechOpen, https://www.intechopen.com/chapters/48607 (last access: 15 November 2021), 2015.
Panagos, P., Borrelli, P., Poesen, J., Ballabio, C., Lugato, E., Meusburger, K., Montanarella, L., and Alewell, C.: The new assessment of soil loss by water erosion in Europe, Environ. Sci. Policy, 54, 438–447, https://doi.org/10.1016/j.envsci.2015.08.012, 2015.
Papadopoulos, A.: Soil Aggregates, Structure, and Stability, in: Encyclopedia of Agrophysics, edited by: Gliński, J., Horabik, J., and Lipiec, J., Encyclopedia of Earth Sciences Series, Springer, Dordrecht, https://doi.org/10.1007/978-90-481-3585-1_142, 2011.
Räsch, A., Hunsche, M., Mail, M., Burkhardt, J., Noga, G., and Pariyar, S.: Agricultural adjuvants may impair leaf transpiration and photosynthetic activity, Plant Physiol. Biochem., 132, 229–237, https://doi.org/10.1016/j.plaphy.2018.08.042, 2018.
Rengasamy, P. and Marchuk, A.: Cation ratio of soil structural stability (CROSS), Soil Res., 49, 280–285, 2011.
Rengasamy, P., Tavakkoli, E., and McDonald, G. K.: Exchangeable cations and clay dispersion: net dispersive charge, a new concept for dispersive soil, Soil Sci., 67, 659–665, https://doi.org/10.1111/ejss.12369, 2016.
Rillig, M. C., Wright, S. F., Nichols, K. A., Schmidt, W. F., and Torn, M. S.: Large contribution of arbuscular mycorrhizal fungi to soil carbon pools in tropical forest soils, Plant Soil, 233, 167–177, https://doi.org/10.1023/A:1010364221169, 2001.
Rillig, M. C., Aguliar-Trigueros, C. A., Bergmann, J., Verbruggen, E., and Veresoglou, S. D.: Plant root and mycorrhizal fungal traits for understanding soil aggregation, New Phytol., 205, 1385–1388, https://doi.org/10.1111/nph.13045, 2014.
Schroder, J. L., Zhang, H., and Richards, J. R.: Interlaboratory Validation of the Mehlich 3 Method as a Universal Extractant for Plant Nutrients, J. AOAC Int., 92, 995–1008, https://doi.org/10.1093/jaoac/92.4.995, 2009.
Simsek, S., Ovando-Martinez, M., Marefati, A., and Rayner, M.: Chemical composition, digestibility and emulsification properties of octenyl succinic esters of various starches, Food Res. Int., 75, 41–49, https://doi.org/10.1016/j.foodres.2015.05.034, 2015.
Six, J., Bossuyt, H., Degryze, S., and Denef, K.: A history of research on the link between (micro)aggregates, soil biota, and soil organic matter dynamics, Soil Tillage Res, 79, 7–31, https://doi.org/10.1016/j.still.2004.03.008, 2004.
Smiles, D. E.: Sodium and potassium in soils of the Murray–Darling Basin: a note, Aust. J. Soil Res., 44, 727–730, https://doi.org/10.1071/SR06057, 2006.
Song, E., Pan, X., Kremer, R. J., Goyne, K. W., Anderson, S. H., and Xiong, X.: Influence of repeated application of wetting agents on soil water repellency and microbial community, Sustainability, 11, 4505, https://doi.org/10.3390/su11164505, 2019.
Sun, Z., Qin, W., Wang, X., Zhang, Y., Li, G, and Wang, Z.: Effects of manure on topsoil and subsoil organic carbon depend on irrigation regimes in a 9-year wheat-maize rotation, Soil Till. Res., 205, 104790, https://doi.org/10.1016/j.still.2020.104790, 2021.
Šimanský, V., Balashov, E., and Horák, J.: Water stability of soil aggregates and their ability to sequester carbon in soils of vineyards in Slovakia, Arch. Acker Pflanzenbau Bodenkd., 62, 177–197, https://doi.org/10.1080/03650340.2015.1048683, 2015.
Rodriguez-Moreno, F., Lukas, V., Neudert, L., and Dryšlová, T.: Spatial interpretation of plant parameters in winter wheat, Precis. Agric., 15, 447–465, https://doi.org/10.1007/s11119-013-9340-7, 2014.
Slezak, M.: Mathematical Models For Calculating The Value Of Dynamic Viscosity Of A Liquid, Arch. Metall. Mat., 60, 581–589, https://doi.org/10.1515/amm-2015-0177, 2015.
Trnka, M., Olesen, J. E., Kersebaum, K. C., Skjelvåg, A. O., Eitzinger, B., Seguin, B., Peltonen-Sainio, P., Rötter, R. Iglesias, A., Orlandini, S., Dubrovský, M., Hlavinka, P., Balek, J., Eckersten, H., Cloppet, E., Calanca, P., Gobin, A., Vučetić, V., Nejedlik, P., Kumar, S., Lalic, B., Mestre, A., Rossi, F., Kozyra, J., Alexandrov, V., Semerádová, D. and Žalud, Z.: Agroclimatic conditions in Europe under climate change, Glob. Change Biol. Bioenergy, 17, 2298–2318, https://doi.org/10.1111/j.1365-2486.2011.02396.x, 2011.
Tominack, R. L. and Tominack, R.: Herbicide formulations, J. Toxicol. Clin. Toxicol., 38, 129–135, https://doi.org/10.1081/CLT-100100927, 2000.
Vadas, P. and Sims, J. T.: Soil Fertility: Phosphorus in Soils, Reference Module in Earth Systems and Environmental Sciences, Elsevier, ISBN 9780124095489, https://doi.org/10.1016/B978-0-12-409548-9.09116-8, 2014.
Volikov, A. B., Kholodov, V. A., Kulikova, N. A., Philippova, O. I., Ponomarenko, S. A., Lasereva, E. V., Parfyonova, A. M., Hatfield, K., and Perminova, I. V.: Silanized humic substances act as hydrophobic modifiers of soil separates inducing formation of water-stable aggregates in soils, Catena, 137, 229–236, https://doi.org/10.1016/j.catena.2015.09.022, 2016.
Wright, S. F. and Upadhyaya, A.: Extraction of an Abundant and Unusual Protein from Soil and Comparison with Hyphal Protein of Arbuscular Mycorrhizal Fungi, Soil Sci., 161, 575–586, 1996.
Zhao, G., Mu, X., Wen, Z., Wang, F., and Gao, P.: Soil erosion, conservation, and eco-environment changes in the loess plateau of China, Land. Degrad. Dev., 24, 499–510, https://doi.org/10.1002/ldr.2246, 2013.
Zhao, J., Chen, S., Hu, R., and Li, Y.: Aggregate stability and size distribution of red soils under different land uses integrally regulated by soil organic matter, and iron and aluminum oxides, Soil Till. Res., 167, 73–79, https://doi.org/10.1016/j.still.2016.11.007, 2017.
Zheng, H., Liu, W., Zheng, J., Luo, Y., Li, R., Wang, H., and Qi, H.: Effect of long-term tillage on soil aggregates and aggregate-associated carbon in black soil of Northeast China, Plos One, 13, e0199523, https://doi.org/10.1371/journal.pone.0199523, 2018.
Zheng, W., Morris, E. K., Lehmann, A., and Rillig, M. C.: Interplay of soil water repellency, soil aggregation and organic carbon, A meta-analysis, Geoderma, 283, 39–47, https://doi.org/10.1016/j.geoderma.2016.07.025, 2016.
- Abstract
- Introduction
- Material and methods
- Results
- Discussion
- Conclusions
- Appendix A: Testing the effect of sampling point.
- Appendix B: Information about soils
- Appendix C: A detailed characterization of other soil horizons
- Appendix D: Descriptive statistics and tests of statistical significance
- Appendix E: Basic soil parameters
- Appendix F: PCA analysis
- Data availability
- Author contributions
- Competing interests
- Disclaimer
- Financial support
- Review statement
- References