the Creative Commons Attribution 4.0 License.
the Creative Commons Attribution 4.0 License.
 | 01 Apr 2022
Land use impact on carbon mineralization in well aerated soils is mainly explained by variations of particulate organic matter rather than of soil structure
Steffen Schlüter
Tim Roussety
Lena Rohe
Vusal Guliyev
Evgenia Blagodatskaya
Thomas Reitz
Land use is known to exert a dominant impact on a range of essential soil functions like water retention, carbon sequestration, organic matter cycling and plant growth. At the same time, land use management is known to have a strong influence on soil structure, e.g., through bioturbation, tillage and compaction. However, it is often unclear whether the differences in soil structure are the actual cause of the differences in soil functions or if they only co-occur.
This impact of land use (conventional and organic farming, intensive and extensive meadow, extensive pasture) on the relationship between soil structure and short-term carbon mineralization was investigated at the Global Change Exploratory Facility, in Bad Lauchstädt, Germany. Intact topsoil cores (upper 10 cm, n=75) were sampled from all land use types at the early growing season. Soil structure and microbial activity were measured using X-ray-computed tomography and respirometry, respectively.
Differences in microstructural properties between land uses were small in comparison to the variation within land uses. The most striking difference between land uses was larger macropore diameters in grassland soils due to the presence of large biopores that are periodically destroyed in croplands. Grasslands had larger amounts of particulate organic matter (POM), including root biomass, and also greater microbial activity than croplands, both in terms of basal respiration and rate of carbon mineralization during growth. Basal respiration among soil cores varied by more than 1 order of magnitude (0.08–1.42 µg CO2-C h−1 g−1 soil) and was best explained by POM mass (R2=0.53, p<0.001). Predictive power was only slightly improved by considering all bulk, microstructure and microbial properties jointly. The predictive power of image-derived microstructural properties was low, because aeration did not limit carbon mineralization and was sustained by pores smaller than the image resolution limit (<30 µm). The frequently postulated dependency of basal respiration on soil moisture was not evident even though some cores were apparently water limited, as it was likely disguised by the co-limitation of POM mass. This finding was interpreted in regards to the microbial hotspots which form on decomposing plant residues and which are decoupled from water limitation in bulk soil. The rate of glucose mineralization during growth was explained well by substrate-induced respiration (R2=0.84) prior to growth, which in turn correlated with total microbial biomass, basal respiration and POM mass, and was not affected by pore metrics.
These findings stress that soil structure had little relevance in predicting carbon mineralization in well-aerated soil, as mineralization appeared to by predominantly driven by the decomposition of plant residues in intact soil. Land use therefore affects carbon mineralization in well-aerated soil mainly in the amount and quality of labile carbon.
- Article
(4072 KB) - Full-text XML
-
Supplement
(820 KB) - BibTeX
- EndNote


Soil respiration is an important link in the global carbon (C) cycle as it releases soil-borne organic carbon back into the atmosphere. Organic C is protected against mineralization by reduced bioavailability through sorption on reactive minerals and physical protection in the soil pore network (Dungait et al., 2012; Schmidt et al., 2011). The balance between C storage and C mineralization is thought to arise from an interplay between the molecular diversity of organic compounds and the spatial heterogeneity and temporal variability of environmental conditions in soil (Lehmann et al., 2020). Soil moisture and temperature are considered to be the environmental factors that exert a dominant control on C mineralization. The influence is either direct through their control on reaction and diffusion rates or indirect through their effect on biomass production including plants and microfauna (Davidson et al., 2006). Land use-related changes in soil management can affect carbon mineralization in all of the aforementioned ways, i.e., through changes in thermal properties, water retention and consumption, as well as through biomass production. The variability in carbon mineralization is thought to arise from differences in substrate accessibility and soil aeration due to soil structure changes that modify the size and spatial distribution of pores and, as a consequence, the exposure of organic carbon to microbial decomposition (Dungait et al., 2012; Schmidt et al., 2011). Despite their obvious importance, larger-scale C cycling models have just started to incorporate these microscale interactions (Yan et al., 2018; Ebrahimi and Or, 2018; Meurer et al., 2020).
A major hurdle to fully accounting for structural constraints of C mineralization is the methodological challenge of combining incubation studies with the investigation of soil microenvironments in identical samples. A viable option in this respect has emerged with the microstructure analysis of incubated soil samples via X-ray-computed microtomography (X-ray CT). By employing this combination of methods, the mineralization rate of the stable soil C pool was found to correlate with the average pore neck diameter as a proxy for soil aeration for a loamy forest soil with a range of bulk densities that was brought to the same water saturation and incubated for 35 d (Bouckaert et al., 2013). Long-term incubation (127 d) of silt–loam soils with fixed bulk soil densities (1.4 g cm−3) and soil water content (matric potential pF 2.5, water content 25 vol %), but very different internal structure (undisturbed, sieved, slaked), exhibited no differences in C mineralization rate irrespective of substrate amendment (fructose, vanillin; Juarez et al., 2013). Even though the macropore space scanned at a coarse resolution (32 µm) differed vastly between the structure treatments, the pore space scanned at the finer resolution of 3 µm was quite similar. This indicated that the continuity of air and water at this soil moisture and thus the supply with oxygen and dissolved substrates was too similar to evoke differences in C mineralization despite differences in microbial abundance and community composition at the end of incubation. Two months of pre-incubation were chosen by Juarez et al. (2013) to omit the initial CO2 flush caused by disturbance that is known to last for more than 1 week (Herbst et al., 2016). Soil aggregates (5–6 mm) from a clay soil, adjusted to a matric potential of pF 2.7 and incubated for 1 day showed a six-fold variation in soil respiration (normalized for differences in organic C content) at only a two-fold difference in organic carbon content (Rawlins et al., 2016). The internal pore surface area was best suited to explain the difference in respiration, yet only at a fairly moderate correlation coefficient (r=0.44). It has been suggested that the magnitude of protection of soil organic C against mineralization results from the interplay of how much C enters the soil as plant biomass and exudates and how much of this newly added C is subsequently protected (Kravchenko et al., 2019). This balance may be very different between different land uses and was shown, in a case study comparing continuous corn (maize), switchgrass, and native succession, to depend on the plant-stimulated pore formation in the size range of 30–150 µm. These pores are associated with the highest enzyme activities and thus the highest capacity for microbial transformation of carbon sources (Kravchenko et al., 2019). In summary, microstructure analysis may help to improve the prediction of carbon mineralization rates in intact soil. However, from the previous findings it is already evident that a true gain in predictability is not always warranted and depends on the environmental conditions encountered during incubation.
We therefore measured soil respiration under contrasting land uses (cropland vs. grassland) that are known to induce various soil structures. Soil respiration was measured in intact soil cores after exposing them to very different environmental conditions: (1) basal respiration at field water saturation and (2) substrate-induced respiration (SIR) at higher soil moisture. The rationale for repeated incubation of intact soil cores at different moisture and substrate availability was to provide a more complete picture of the links between microstructural properties and carbon mineralization. Our objectives were to (1) investigate differences in soil structure and C mineralization induced by land use and (2) to explore to what extent microstructural properties explain the variation in carbon mineralization rates. Bearing in mind that such microstructure analyses are laborious and time consuming, we (3) aimed to assess how these microstructural properties can be substituted by easily available bulk properties like water saturation, bulk density or particulate organic matter (POM) content.
2.1 Site description
The Global Change Experimental Facility (GCEF) is situated at the field research station of the Helmholtz Centre for Environmental Research in Bad Lauchstädt, Germany (51∘23′33.1′′ N 11∘52′56.5′′ E, 121 m a.s.l.). The site is characterized by a sub-continental, temperate climate with an annual mean temperature of 9.7 ∘ C (1993–2013) and a mean annual precipitation of 525 mm (1993–2013). The soil type is a fertile Haplic Chernozem with on average 21 % clay, 69 % silt and 10 % sand in the topsoil layer (Altermann et al., 2005). The GCEF platform was established in 2013 and combines five land use types with two climate treatments (Schädler et al., 2019). The full design comprises 50 large field plots (16×24 m), which are arranged in 10 blocks. Five of the blocks are subjected to ambient climate, while five are exposed to conditions of a projected future climate. The five land use types in each climate scenario are replicated five times, randomly assigned to the five plots of each block. They include (1) conventional farming (CF), (2) organic farming (OF), (3) intensively managed grassland cut by mowing (IM), (4) extensively managed grassland cut by mowing (EM) and (5) extensively managed grassland used as sheep pasture (EP). The land use types are managed according to common practices for central Europe and include a set of respective management measures (fertilizer and pesticide application, soil and plant cultivation). On CF plots a rapeseed–wheat–barley crop rotation is cultivated, whereas rapeseed is replaced by a legume in OF. The management of both croplands include conventional soil cultivation. For IM, a species-poor mixture of forage grasses was established, consisting of Lolium perenne (20 %), “Festulolium” (50 %), Dactylis glomerata (20 %) and Poa pratensis (10 %). In contrast, a mixture of 56 plants species from the local gene pool, containing legumes, grasses and non-leguminous dicots species, was sown in both extensively managed grasslands (EM, EP). For further details on treatments and management, we refer the reader to Schädler et al. (2019). Importantly, both croplands were plowed (18 February) and further cultivated with a rotary cultivator (4 March) a few months before sampling.
2.2 Field sampling
We focused on the 25 plots (5 land use types × 5 field replicates) exposed to ambient climatic conditions. Sampling took place in early May 2020, when plants in the cropland plots (CF: rapeseed, OF: white clover) were at the beginning of the vegetation season. Intact soils cores were sampled with aluminum rings (v=100 cm3, h=4 cm) at a depth between 3 and 10 cm. Three soil cores were taken from each plot, totaling 75 samples. After sampling, the soil cores were stored in bags under cool conditions, including during image acquisition, until respirometry.
2.3 Bulk properties
Bulk density (ρ) and initial water saturation () were determined by weighing the soil cores before respirometry, as well as after drying the cores at 105 ∘C for 48 h following respirometry. Thereby, bulk density was calculated with the final soil dry weight divided by the core volume (100 cm3). Water content (θ) in the collected soil cores was determined by the mass differences in the initial and final soil weights. Water saturation levels were obtained by normalizing the water content (θ) with total soil porosity (ϕ). Air content (θa) during substrate-induced respiration was calculated from the difference between ϕ and θ+θgl after substrate-induced respirometry, with θgl representing the volumetric glucose solution content. Finally, soil cores were dispersed during a wet sieving procedure (0.63 mm mesh size) to extract inorganic (sand, stones) and organic (roots, plant litter) components. Inorganic and organic components were subsequently separated by hand and POM mass (mr) was determined after drying for 48 h at 70 ∘C. This POM mass not only includes organic material from previous years, but also the fresh root biomass that was cut off during sampling and which only started to decay during incubation. Additional explanatory variables, i.e., total C and C:N ratio, were determined for all plots using soil samples collected on 20 March 2020 in the course of the continuous GCEF monitoring program. Total carbon and nitrogen content were measured from sieved (2 mm) fine soil using an elemental analyzer (Elementar Vario EL III, Elementar, Hanau, Germany) and were used to calculate C:N ratios. Total carbon was reported as total organic carbon (TOC) content as the inorganic carbon content in the topsoil is negligible.
2.4 Microstructure analysis
All soil cores were scanned with X-ray-computed tomography (X-tek XT H 225; Nikon Metrology) at 150 kV and 170 µA with 2500 projections and two frames per projection. A 0.3 mm copper filter was used to reduce beam hardening artifacts. Tomograms were reconstructed in 8 bit grayscale and with 30 µm voxel size with the X-tek CT Pro software (Nikon Metrology). Grayscale contrast was stretched by setting the darkest and brightest 0.2 percentiles to 0 and 255, respectively.
All image processing was carried out with the Fiji bundle for ImageJ (Schindelin et al., 2012) and associated plugins. Image noise was reduced with a non-local means filter (Buades et al., 2005) prior to edge enhancement with an unsharp mask filter (Schlüter et al., 2014). The grayscale images were segmented into pores and background with Otsu's method (Otsu, 1975) for pore structure analysis at the original resolution. Pore metrics of interest include visible porosity (ϕvis), surface area density (a), mean breadth (b) and the Euler number density (χ), which were determined with the MorphoLibJ plugin (Legland et al., 2016). The pore topology metric χ counts the number of isolated pore objects positively and the number of redundant connections negatively, so that poorly connected and well-connected pore structures induce positive and negative χ, respectively (Vogel et al., 2010). A complementary connectivity metric is the connection probability Γ, which reflects the probability of two randomly chosen pore voxels to belong to the same pore cluster. Pore clustering was carried out with connected components labeling in MorphoLibJ (Legland et al., 2016). The average pore distance (d) was determined based on the Euclidean distance transform of soil voxels, i.e., the shortest distance to a pore for all background voxels. The average pore diameter (∅) was determined with the maximum inscribed sphere method, termed local thickness in ImageJ (Fig. 1b). The critical pore diameter ∅c reflects the bottleneck diameter at which pore continuity from top to bottom is lost (Koestel, 2018).
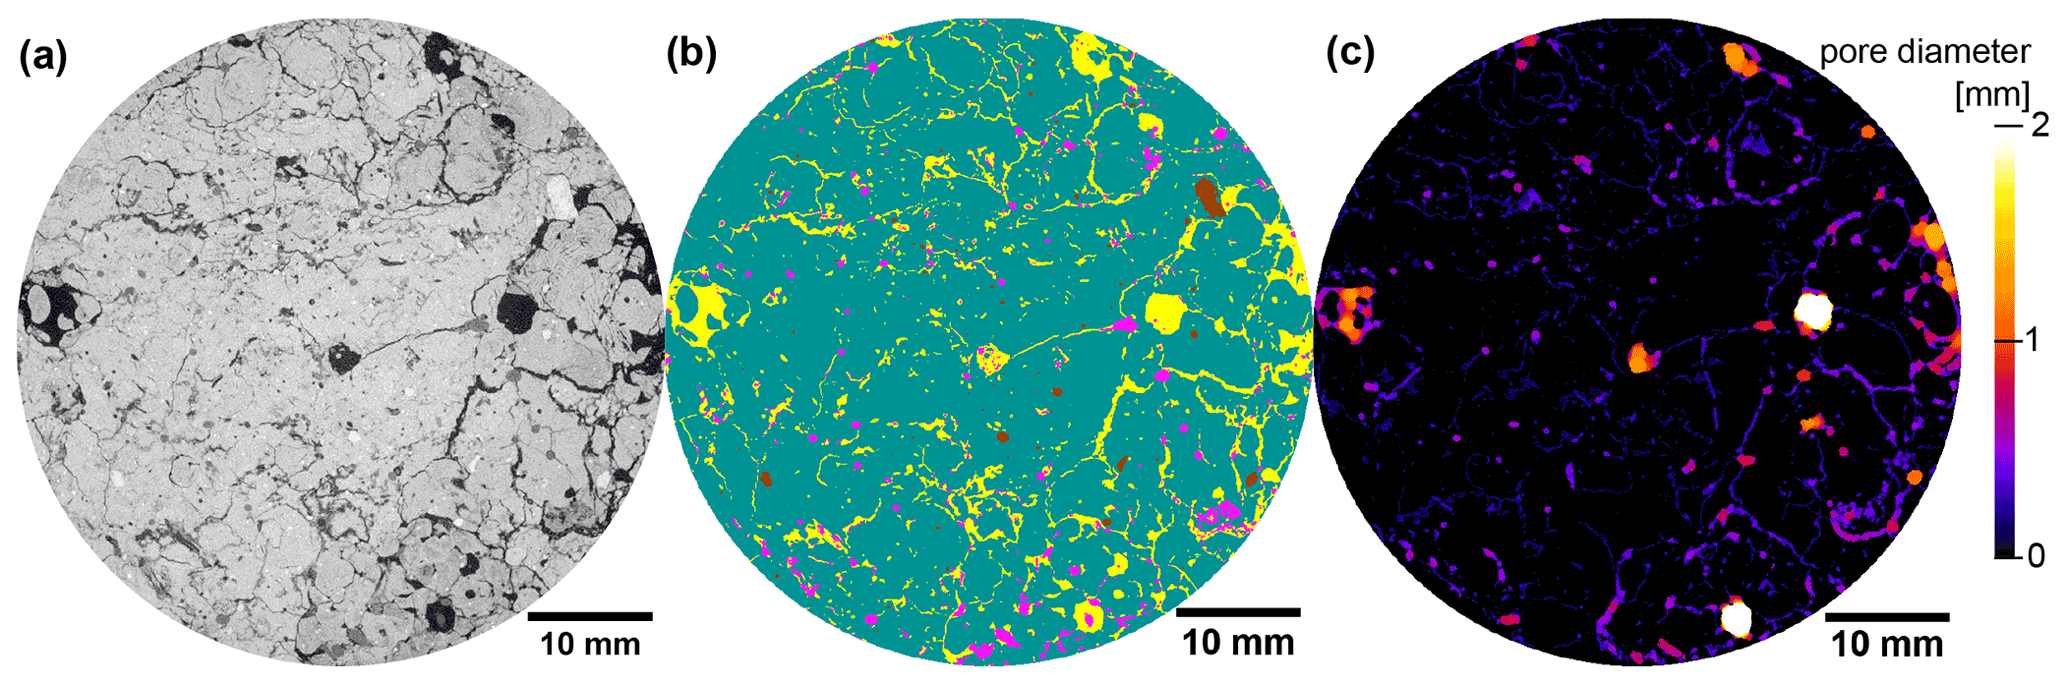
Figure 1Visualization of image processing steps for a 2D section of an X-ray CT image from (a) the grayscale data to (b) image segmentation results based on supervised, machine-learning-based segmentation (pores yellow, POM pink, matrix green, rocks brown) and (c) pore diameters based on local thickness. The sample was selected from an extensive pasture plot.
In addition to these pore metrics, the volume fraction of POM was determined via supervised, machine-learning-based image segmentation with the ilastik tool (Berg et al., 2019). A parallel random forest classifier was used to segment pores, POM, soil matrix and rocks (Fig. 1b) by deploying a multi-dimensional feature space that included the original gray values as well as gradient (first derivative of gray values) and texture information (second derivative of gray values) after Gaussian smoothing with a strength of σ= [0.3, 0.7, 1.0]. In this way, the characteristic traits of each material, like the aperture of cracks, the inherent heterogeneity of the organic fabric or the homogeneity of quartz grains, was harnessed for material detection. The classifier was trained with a few test lines for each material class in a small number of images (6 out of 75). The images had to be downscaled to a voxel size of 60 µm to make segmentation tractable.
2.5 Respirometry
Basal respiration (pB) rates were determined from intact soil cores (100 cm3) at 22 ∘C and the water saturation in the field at the date of sampling using an automated respiration analyzer (Respicond V, Sweden). Emitted CO2 was trapped in 10 mL of 0.6 M KOH solution and measured through the increase in electric impedance at a given voltage. Soil cores were incubated for 2 days, and the average respiration rate was determined for the period after some initial equilibration. Respirometry was conducted on 60 out of 75 soil cores distributed evenly among cropland (CF and OF, 15 each) and grassland soil (IM, EM and EP, 10 each).
The same 60 soil cores were subsequently amended with a glucose-containing mineral salt solution (glucose – 0.28 M; (NH4)2SO4 – 0.07 M; KH2PO4 – 0.025 M; MgSO4 – 0.125 M) to measure substrate-induced respiration (SIR; Anderson and Domsch, 1978) and to infer microbial growth kinetics from it (Stenström et al., 1998; Panikov, 1995). The solution was added to the field moist soil cores in two steps. First, the bottom of the soil cores was covered with a textile before placing them for 30 min in the glucose–nutrient bath with a shallow water table so that the solution was sucked in by capillary rise. Thereafter, 4 mL of the glucose–nutrient solution was added from the top of the core with a pipette and allowed to infiltrate for 10 min. Finally, the fully saturated soil cores were drained from macropores with low capillarity by placing the soil cores on a dry sand bed for 10 min. After drainage, soil cores were placed into the Respicond for 48 h at 22 ∘C. The absorbed volume of glucose–nutrient solution was measured after the SIR approach via weight loss upon oven-drying as described above while accounting for the antecedent field water saturation. The amount of absorbed glucose solution was different for every soil core and increased with decreasing field water content θ and increasing porosity ϕ. However, for all soil cores, glucose-C was provided in excess, i.e., the CO2 uptake capacity of the respirometer was exceeded with only a fraction of the mineralized C. The time, texc, until the capacity of the respirometer was exceeded (73 mg CO2-C at the given KOH concentration) was determined for every soil core (Fig. 2). In addition, an empirical model for microbial growth kinetics (Wutzler et al., 2012) of the form
was fitted to the substrate-induced growth respiration stage of each time series using ModelMaker-3 software (SB Technology Ltd). Here, pSI is the substrate-induced respiration rate at time t, A is the growth-independent CO2 release rate, B is the growth-dependent CO2 release rate and μ is the microbial-specific growth rate. The identification of a lag phase and initial substrate-induced respiration prior to growth () was obstructed by uncertain data during initial equilibration of the CO2 readings and had to be substituted by data extrapolation and a subjective definition of a lag phase as shown in Fig. 2. The active microbial fraction was determined as
where AMB is the active microbial biomass participating in growth, TMB is the total microbial biomass and λ is a basic stoichiometric constant of 0.9 during unlimited growth (Akimenko et al., 1983).

Figure 2Example of a time series of CO2 release after glucose addition at h and first measurement at t=0 h. The fluctuations in CO2 readings during the first hours (empty circles) were discarded and replaced by a constant substrate-induced respiration rate p0 during an initial lag phase. The parameters μ, A, B and p0 are derived from a model fit, whereas texc (time until a total of 73 mg CO2-C was respired) is directly calculated from the time series.
2.6 Statistical analysis
Statistical analyses were performed with R (R Core Team, 2020) and figures were produced with package ggplot2 (Wickham, 2016). Normality of residuals and homogeneity of variances were tested with a Shapiro–Wilk test and Levene's test at a level of p>0.05, respectively. If these criteria were met, then a one-factorial ANOVA was carried out, followed by a post hoc Tukey HSD test, to identify significant differences between land use types at a level of p<0.05 using the agricolae package (de Mendiburu, 2021). If the criteria were not met, then a non-parametric Kruskal–Wallis test was carried out at a level of p<0.05 with the same package. For simplicity, Pearson correlations between two variables are reported, irrespective of whether or not normality in the residuals is fulfilled.
Partial least square regression was conducted in order to identify the amount of explained variability of a target variable (pB, texc) by a combination of explanatory variables. Pseudo-replicates, i.e., the 2–3 soil cores from the same plot, were considered individually to explore the full range of variation in target variables. Explanatory variables, which were only available as plot averages (TOC, C:N ratio) were therefore not considered. Partial least square regression was either done for the pooled data set (all land uses, n=60) or individually for grassland soil cores (IM + EM + EP; n=30) and cropland soil cores (CF + OF, n=30). To do so, the target variables (pB, texc) and explanatory variables (ρ, , mr, ϕvis, a, b, χ, Γ, d, ∅, ∅c, po, μ and ro, as well as pB for target variable texc; see Table 1 for symbols' meaning) were tested for normal distribution. If needed, they were transformed to reach normal distributions and linear relationships of data (i.e., a logarithmic transformation or a logistic transformation ().
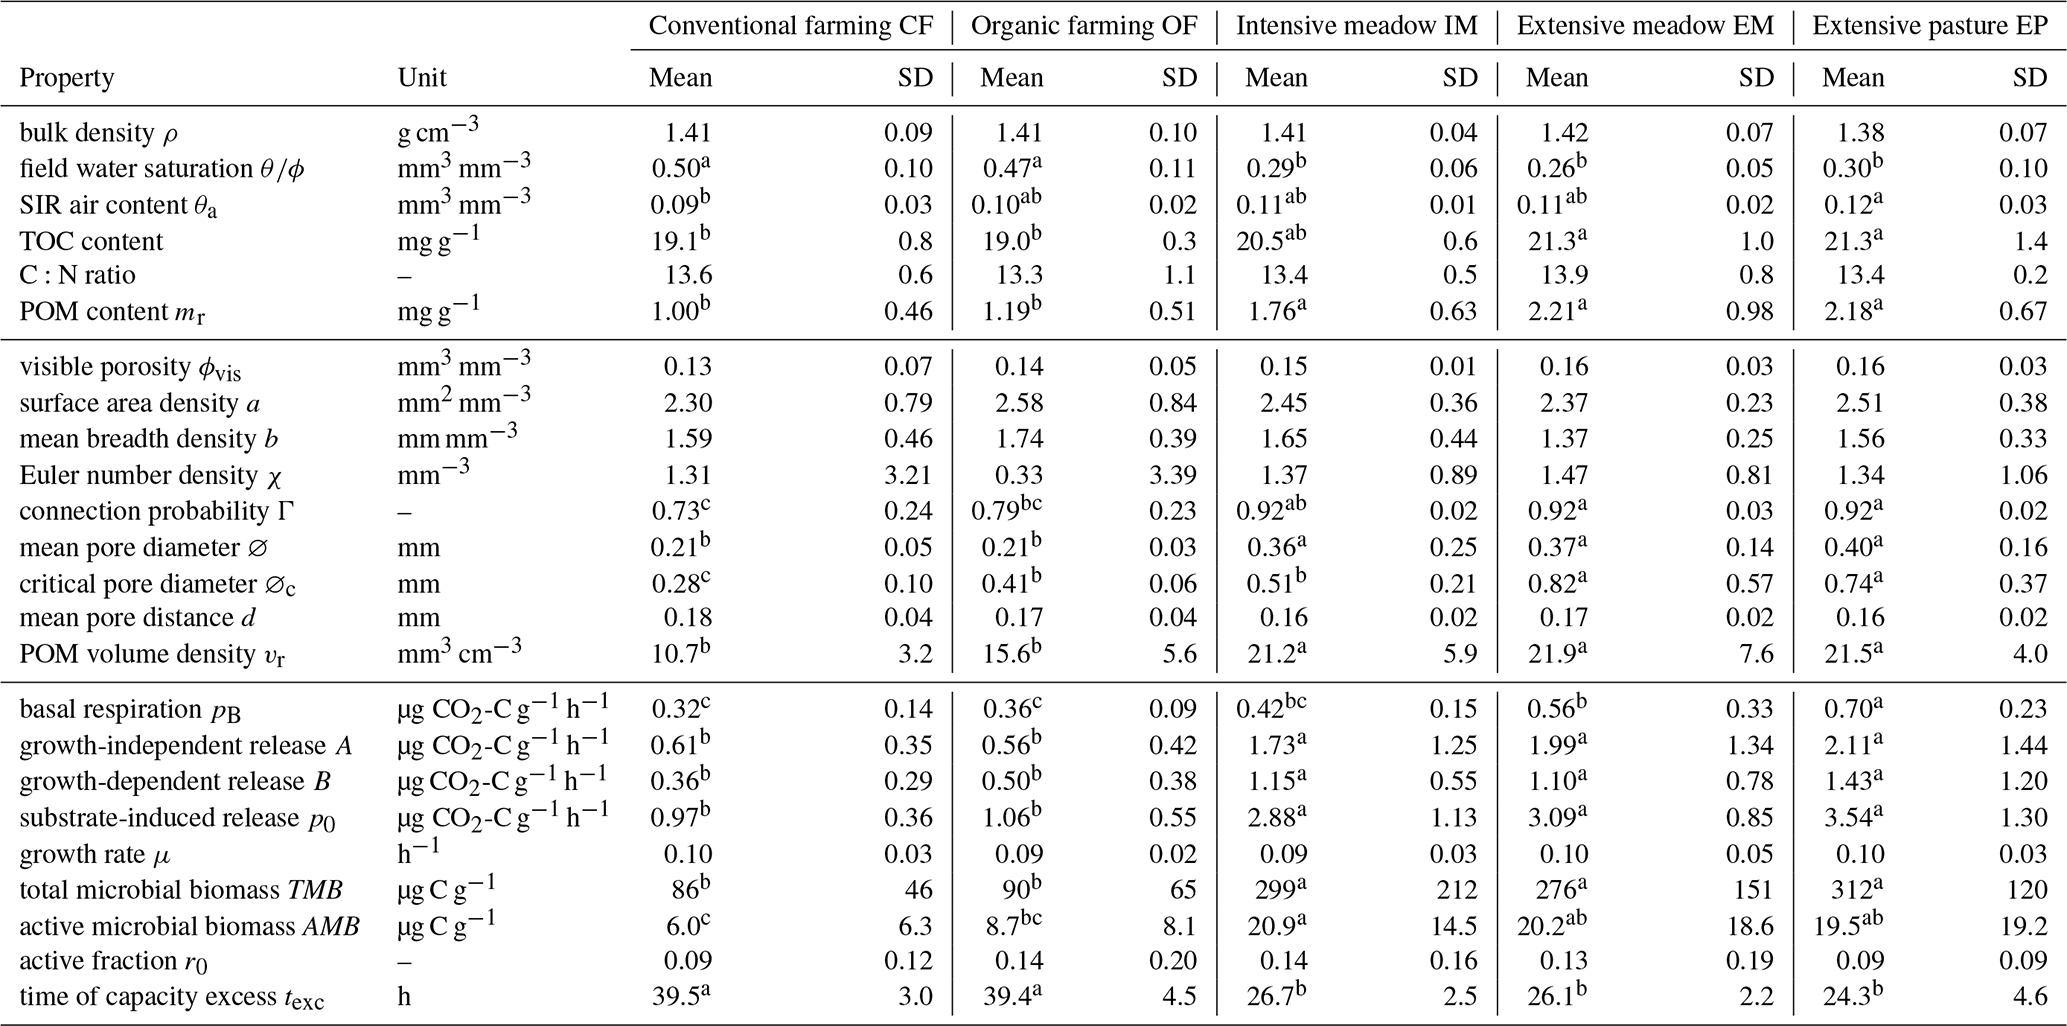
Table 1Arithmetic mean (mean) and standard deviation (SD) of variables for five different land uses grouped according to bulk properties, image-derived microstructure properties and respiration properties. TOC and C:N are based on plot averages, all others are directly at the soil core level. Small letters represent significant differences among treatments (p<0.05). TOC: total organic carbon, POM: particulate organic matter.
There was collinearity between many variables of the present study, which excludes simple linear regressions to explore the variability of basal and substrate-induced respiration. Partial least square regression (PLSR) with leave-one-out cross-validated R2 allows for collinearity between variables and identifies the most important explanatory variables to predict the target variables. Permutation testing served to describe components that best explained pB and texc. Robust confidence intervals against deviations from normality were obtained from bootstrapping (R package boot v. 1.3-24; Davison and Hinkley, 1997; Canty and Ripley, 2019). The smoothed bootstrap was used by resampling from multivariate kernel density (R package kernelboot v. 0.1.7; Wolodzko, 2020) as sample sizes were relatively small (60 in pooled and 30 in grouped data). The bias-corrected and accelerated bootstrap confidence interval of 95 % of R2 was used as a measure to explain the variability in each response variable (Efron, 1987).
PLSR was repeated for a series of simplifications: (a) complex model with all bulk, microstructural and microbial explanatory variables ( for pB and θa as well as pB for texc); (b) complex model including only bulk and microstructural properties (n=11 for pB and n=12 for texc, excluding po, μ, ro), (c) a VIP model that includes only the most informative variables identified by PLSR (n=3–5; composition varies between target variables and land use combinations) and (d) pairs of explanatory variables selected based on expert knowledge that serve as a base line reference (n=1–2; choice depends on target variables).
3.1 Bulk properties
In the early growing season (May), the young plants in both croplands (CF, OF) had transpired less water than the permanent vegetation cover in the three grasslands (IM, EM, EP) resulting in a significant difference in field water saturation (Table 1). In fact, the water content in grassland was already close to the permanent wilting point at that soil depth (θ= 0.09 mm3 mm−3 at pF 4.2, Max Köhne, personal communication, 2021). The POM content (>0.63 mm), mainly comprising roots and old plant residues incorporated by plowing, was significantly lower in the cropland plots (CF, OF) than in the grassland plots (IM, EM, EP; Table 1). The TOC content followed the identical order, whereas soil C:N ratios did not differ significantly between any of the land uses (Table 1). Surprisingly, there was no difference in average bulk density between any of the land uses (Table 1). However, in cropland plots the variability in bulk density was greater than in grasslands. This was triggered by randomized sampling locations within a plot that may either fall into areas loosened by plowing or areas compacted by traffic. The volumetric air content in the soil cores after the uptake of the glucose solution was on average around 0.1 (mm3 mm−3) for all land uses. Thus, if oxygen supply was limited during growth on glucose in intact soil cores, it was on average the same for all land uses.
3.2 Microstructure properties
The visible microstructure in the topsoil differed vastly between land uses but also among soil cores of the same land use. The 2D slices of selected X-ray CT images in Fig. 3f are not meant to be representative for the land use. Instead, they cover the entire variability in size and volume fraction of pores as well as the volume fraction of POM. The visible porosity did not differ across land uses, but had a much higher variability in cropland plots (Fig. 3a, Table 1). The regression between visible porosity (>0.03 mm) and bulk density had a high goodness of fit (Fig. 3b, R2=0.74, p<0.001), since it is mainly the macroporosity that is affected by soil management. There was a number of other pore metrics like surface area, mean breadth, Euler number and mean pore distance that also did not differ between land uses (Table 1). The mean pore diameter was significantly larger in grassland than in cropland plots (Fig. 3c, Table 1), because a certain fraction of the pore space was contributed by large biopores including taproot channels and earthworm burrows, which are periodically destroyed by plowing in farming plots. Likewise, the critical pore diameter was significantly larger in EP and EM than in OF and even lower in CF. Interestingly, the critical pore diameter in IM was more similar to that in OF, indicating that biopores in intensive meadow are less often continuous from top to bottom. Following the pattern of the POM content (mr), the POM volume was significantly higher in grassland than in cropland soil (Fig. 3d, Table 1). The goodness of fit between image-derived POM volume and POM content determined by wet sieving (Fig. 3e, R2=0.53) was somewhat lower than that for independently determined proxies for porosity discussed above. This was likely caused by incomplete POM detection by both methods and the differences in the lower size cut-off (downscaled image resolution of 0.06 mm vs. 0.63 mm mesh size of sieve) as well as between mass density and volume density.

Figure 3Selected microstructure properties (a, c, d) and relation to selected bulk properties (b, e) for different land uses. Columns and error bars represent mean and standard deviation at the plot level (n=5), whereas dots represent individual soil cores. Numbered dots in subfigures (a)–(e) correspond to the five selected X-ray CT samples, for which 2D sections are shown below. Different letters in bar plots (a, c, d) indicate significant differences (p<0.05) between land use types.
3.3 Respiration properties
Basal respiration at field water saturation was highest in extensive pasture and lowest in both cropland plots with intermediate rates for both meadows (Fig. 4a, Table 1). Variation in basal respiration could be well explained with variations in POM content (Fig. 4b, R2=0.53, p<0.001) and only slightly less with POM volume density (R2=0.35, not shown). Surprisingly, basal respiration was completely independent of initial water saturation when pooled across land uses, even though the entire range between supposedly critical dryness and optimal conditions was covered (Fig. 4c). Furthermore, basal respiration was independent of visible porosity (Fig. 4d).
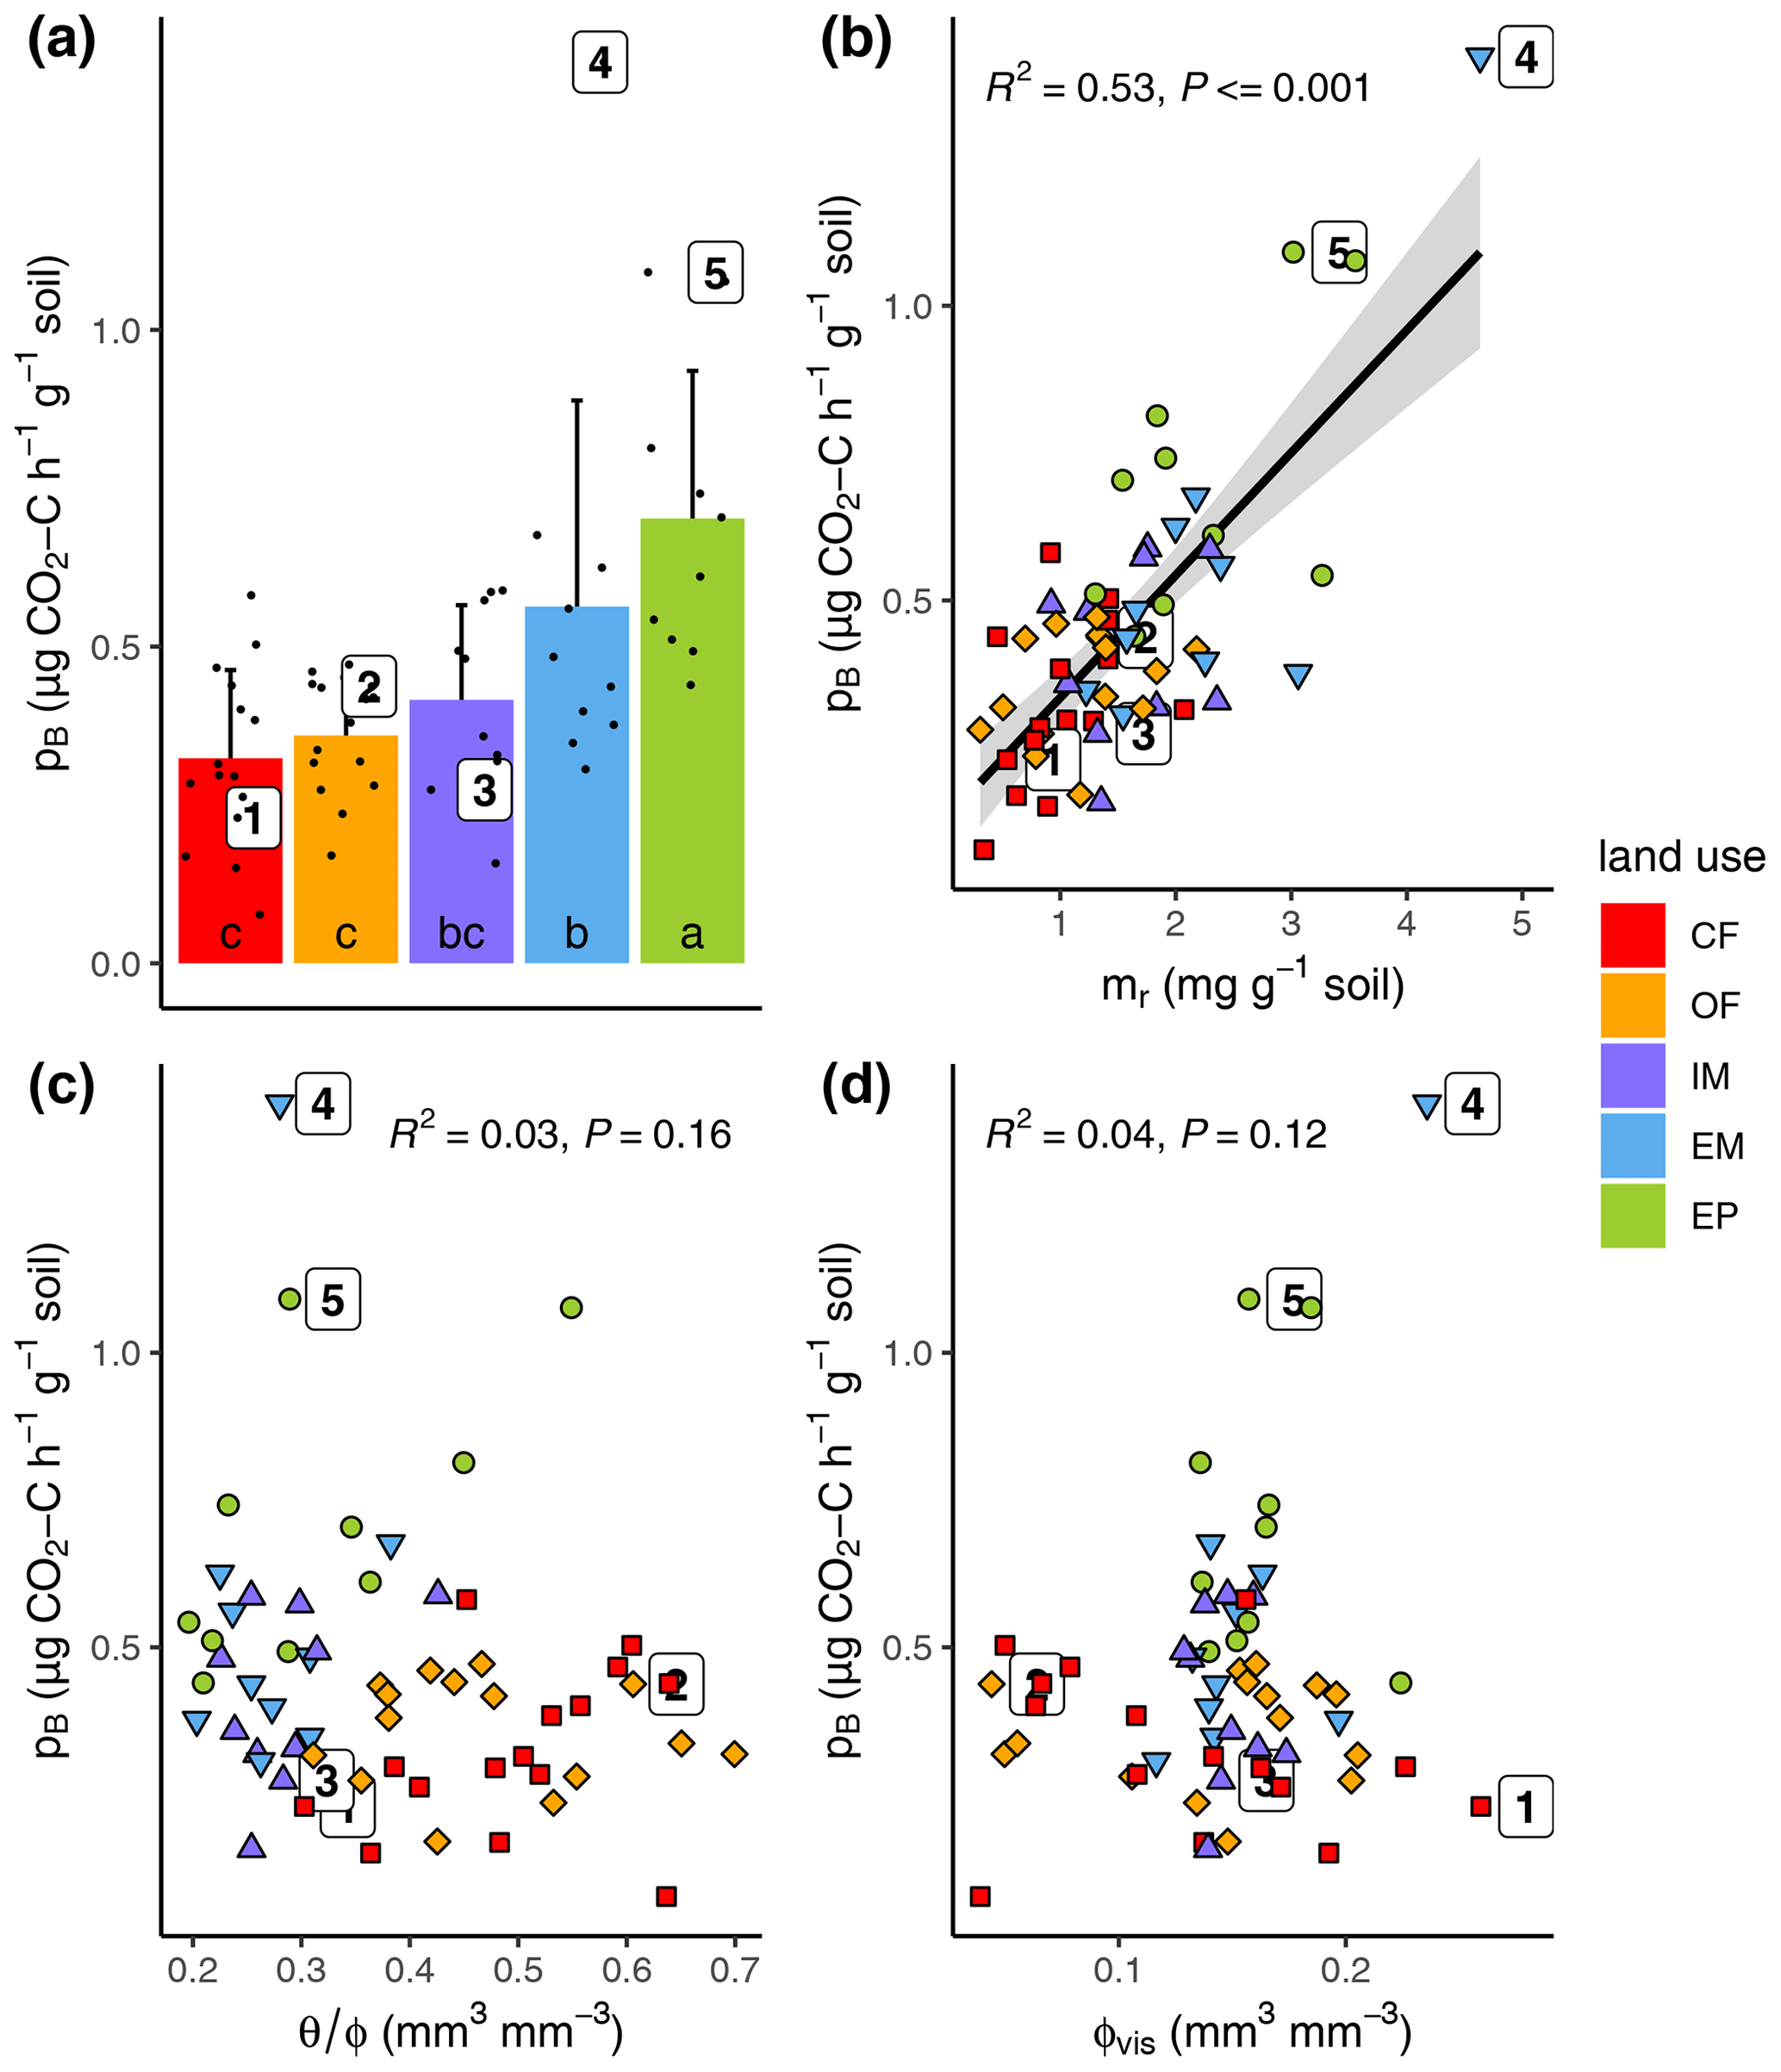
Figure 4(a) Basal respiration (pB) as a function of (a) land use, (b) POM mass (mr), (c) field water saturation () and (d) visible porosity (>30 µm; ϕvis). The numbered dots correspond to the samples depicted in Fig. 3f. Different letters in the bar plot (subfigure a) indicate significant differences (p<0.05) between land use types.
Substrate-induced respiration in the first hours after glucose addition () was up to 3.5 times higher in all grasslands than in both cropland treatments (Fig. 5a). The correspondence of basal respiration and initial substrate-induced respiration prior to growth was highly significant (Fig. 5b, R2=0.59, p<0.001). The glucose addition resulted in a six-fold increase in respiration rates, which is in agreement with previous incubation studies (Wardle and Ghani, 1995; Hund and Schenk, 1994). This increase indicated previous limitation of microbial activity in all collected soils due to substrate deficiency (Blagodatskaya and Kuzyakov, 2013). The goodness of fit deteriorated slightly (R2=0.31, p<0.001), when those samples with exceptionally high pB due to high root biomass and those samples with exceptionally low p0 that might have been caused by insufficiently precise estimation of lag time were disregarded.
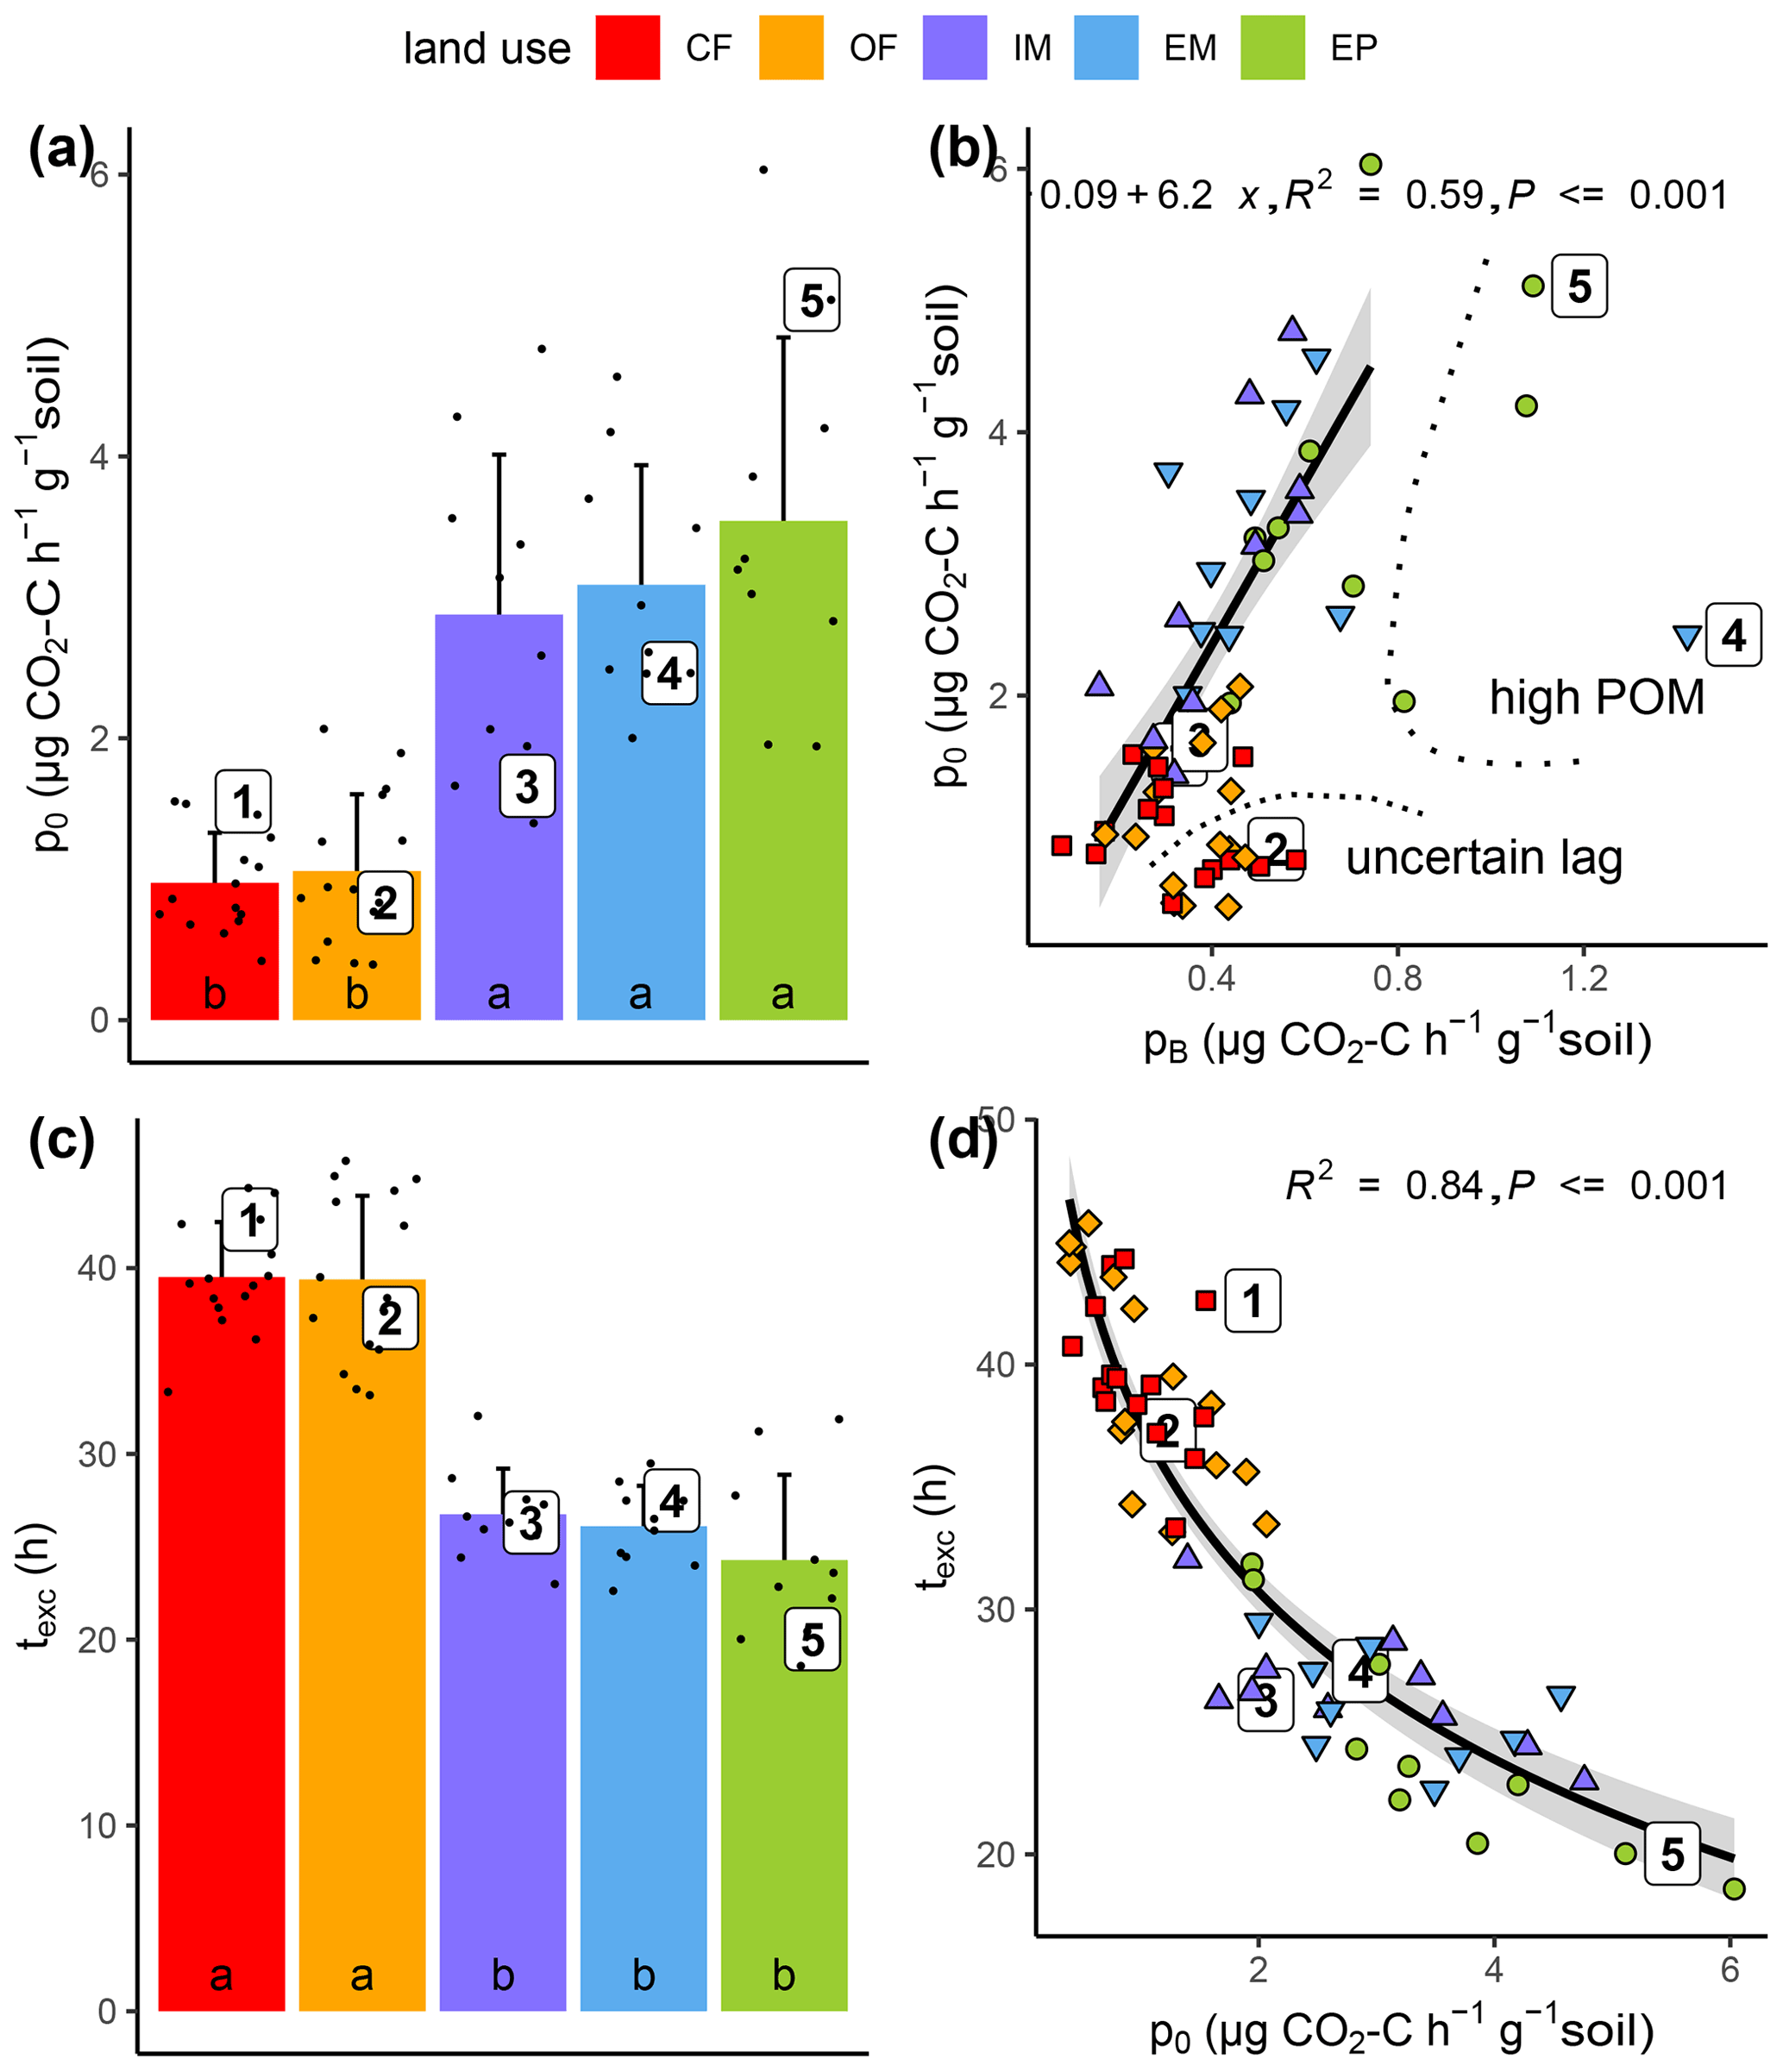
Figure 5Initial substrate-induced respiration prior to growth (po) as a function of (a) land use and (b) basal respiration (pB) as well as time until capacity excess of the respirometer (texc) as a function of (c) land use and (d) substrate-induced respiration (po). High POM and uncertain lag in (b) indicate the samples that have been excluded from regression analysis. Different letters in bar plots (a, c) indicate significant differences (p<0.05) between land use types.
Due to higher initial microbial activity, the added glucose was consumed much faster in grassland soils and reached the CO2 uptake capacity of the respirometer much sooner as compared to cropland soils (Figs. 5c, S1). The logarithm of this time of capacity excess, texc was tightly linked to p0 (Fig. 5d, R2=0.84, p<0.001) and to a similar extent to total microbial biomass TMB (not shown, R2=0.60, p<0.001). TMB is coupled with p0 through Eq. (2). Only two parameters of the model (Eq. 1) that were fitted to the exponential increase in the CO2 release were different between grasslands and croplands (Table 1). The growth-independent respiration rate A and the growth-dependent respiration rate B (just as its sum p0) were both significantly smaller in cropland soils, which accounts for the fact that the initial CO2 release rate directly after glucose addition was lower. The microbial growth constant μ did not differ between land uses. Following the pattern of the total biomass, the active microbial biomass was higher in grasslands than in croplands. The variability in the active fraction of microbial biomass was, however, too high among replicates to evoke significant differences between land uses.
3.4 Prediction of respiration properties
Not all bulk and microstructure properties were relevant for explaining the observed variation soil respiration across land uses. In fact, many microstructural properties correlated significantly with each other and with the bulk properties (complete correlation matrix in Fig. S2). Likewise, many respiration properties correlated with each other (partly by definition and accounted for by only considering the independent variables pB, p0, r0 and μ in the following) and with microstructural and bulk properties (Fig. S2). This collinearity among microstructural, bulk and microbial parameters is directly accounted for by partial least squares regression (PLSR) and quantified in biplots in the Supplement (Figs. S3, S4).
Simple regressions of basal respiration with selected bulk or microstructure properties in the previous section highlighted the importance of POM content, mr, in explaining the variability in basal respiration pB (R2=0.53, p<0.001). The predictive power of mr on pB is reduced to a median R2 of 0.34 by PLSR with data normalization and boot strapping. The predictive power of the complex model for basal respiration among all land uses only increased to R2=0.43 when all abiotic and microbial variables were considered as explanatory variables (Fig. 6). This increase can mainly be attributed to a higher degree of explained variability in grassland soils (from R2=0.27 to R2=0.53). This gain in the predictive power of the complex model was caused by the added information content of microbial parameters. This follows from the fact that a complex model in which microbial parameters are excluded (all-p0-r0-μ) had low predictive power, similar to the simplest model with mr only. Indeed, the VIP model for grasslands includes po, mr, , ρ and μ in descending order of importance. In general, the explained variability was higher for grasslands and very poor for cropland soils. The explained variability is increased by 0.1–0.2 in comparison to the bootstrapping median and reaches R2>0.60 if outlier samples are discarded using the leave-one-out procedure. The surprisingly low information content of water saturation in the field is confirmed.
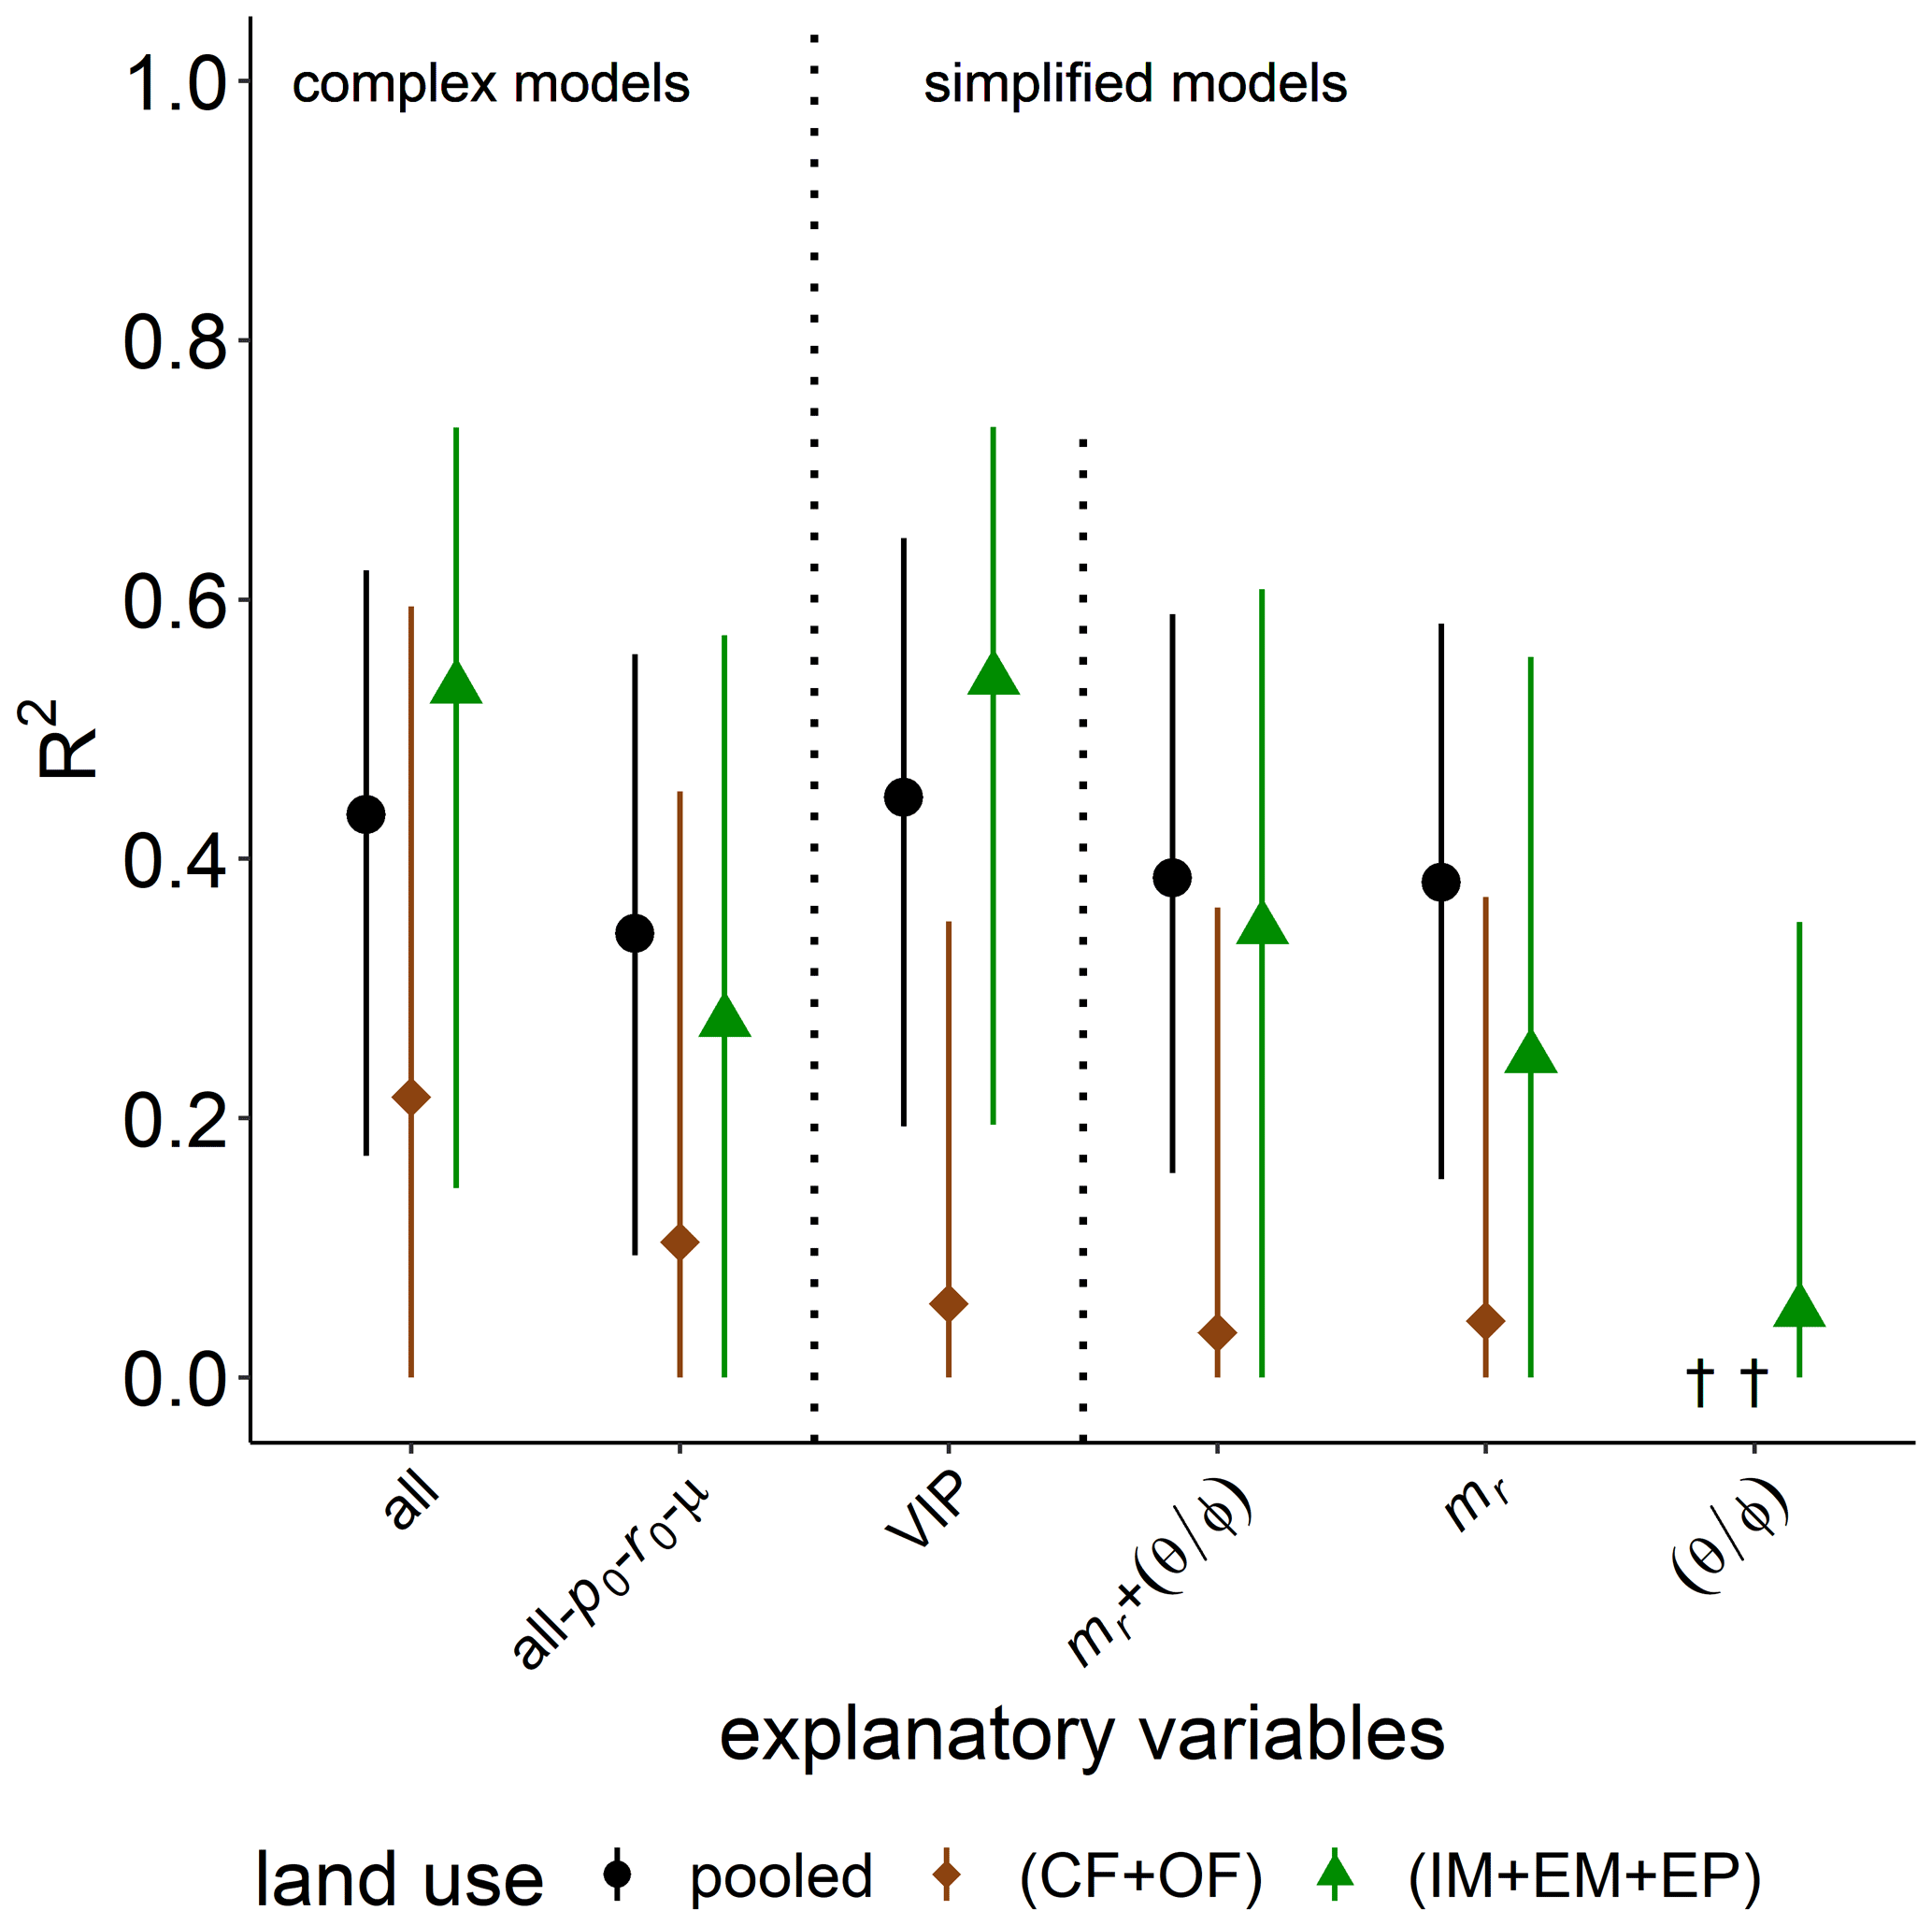
Figure 6Explained variability (R2) of basal respiration, pb, by different combinations of explanatory variables for all land uses (pooled) or only cropland (CF + OF) and grassland (IM + EM + EP), respectively. The all-po-ro-μ model includes all explanatory variables except for microbial variables. The VIP model include the variables of importance in predicting pb (please see the text for more information). † No variability explained.
The explained variability observed for the time of capacity excess, texc, after glucose addition is excellent for the full complexity model in the pooled data set (R2=0.93, Fig. 7). The model is better suited to explain the differences between grassland and cropland soils than to explain the variability within the two groups. A reduction in model complexity to the VIP model and even p0 as the only explanatory variable only slightly reduce predictive power. The omission of microbial parameters (all-p0- r0-μ) reduced the explained variability in texc of the pooled land uses to R2=0.58. The coefficient of determination is lower because bulk and microstructure variables could only explain the variability between grassland and cropland, and to a lower degree within grasslands, but not at all the variability in texc among cropland soils. This is shown exemplarily for pore surface area a. Differences in metabolic pathways due to different aeration of soil cores, e.g., between loosened and compacted soil in croplands, could be ruled out as an unaccounted source of variability, as these should have been clearly reflected in image-derived pore metrics like ϕvis and Γ and even more directly in air content θa. In fact, θa after glucose addition correlated less with the speed of glucose mineralization texc than did in the field prior to glucose addition (Fig. S2).
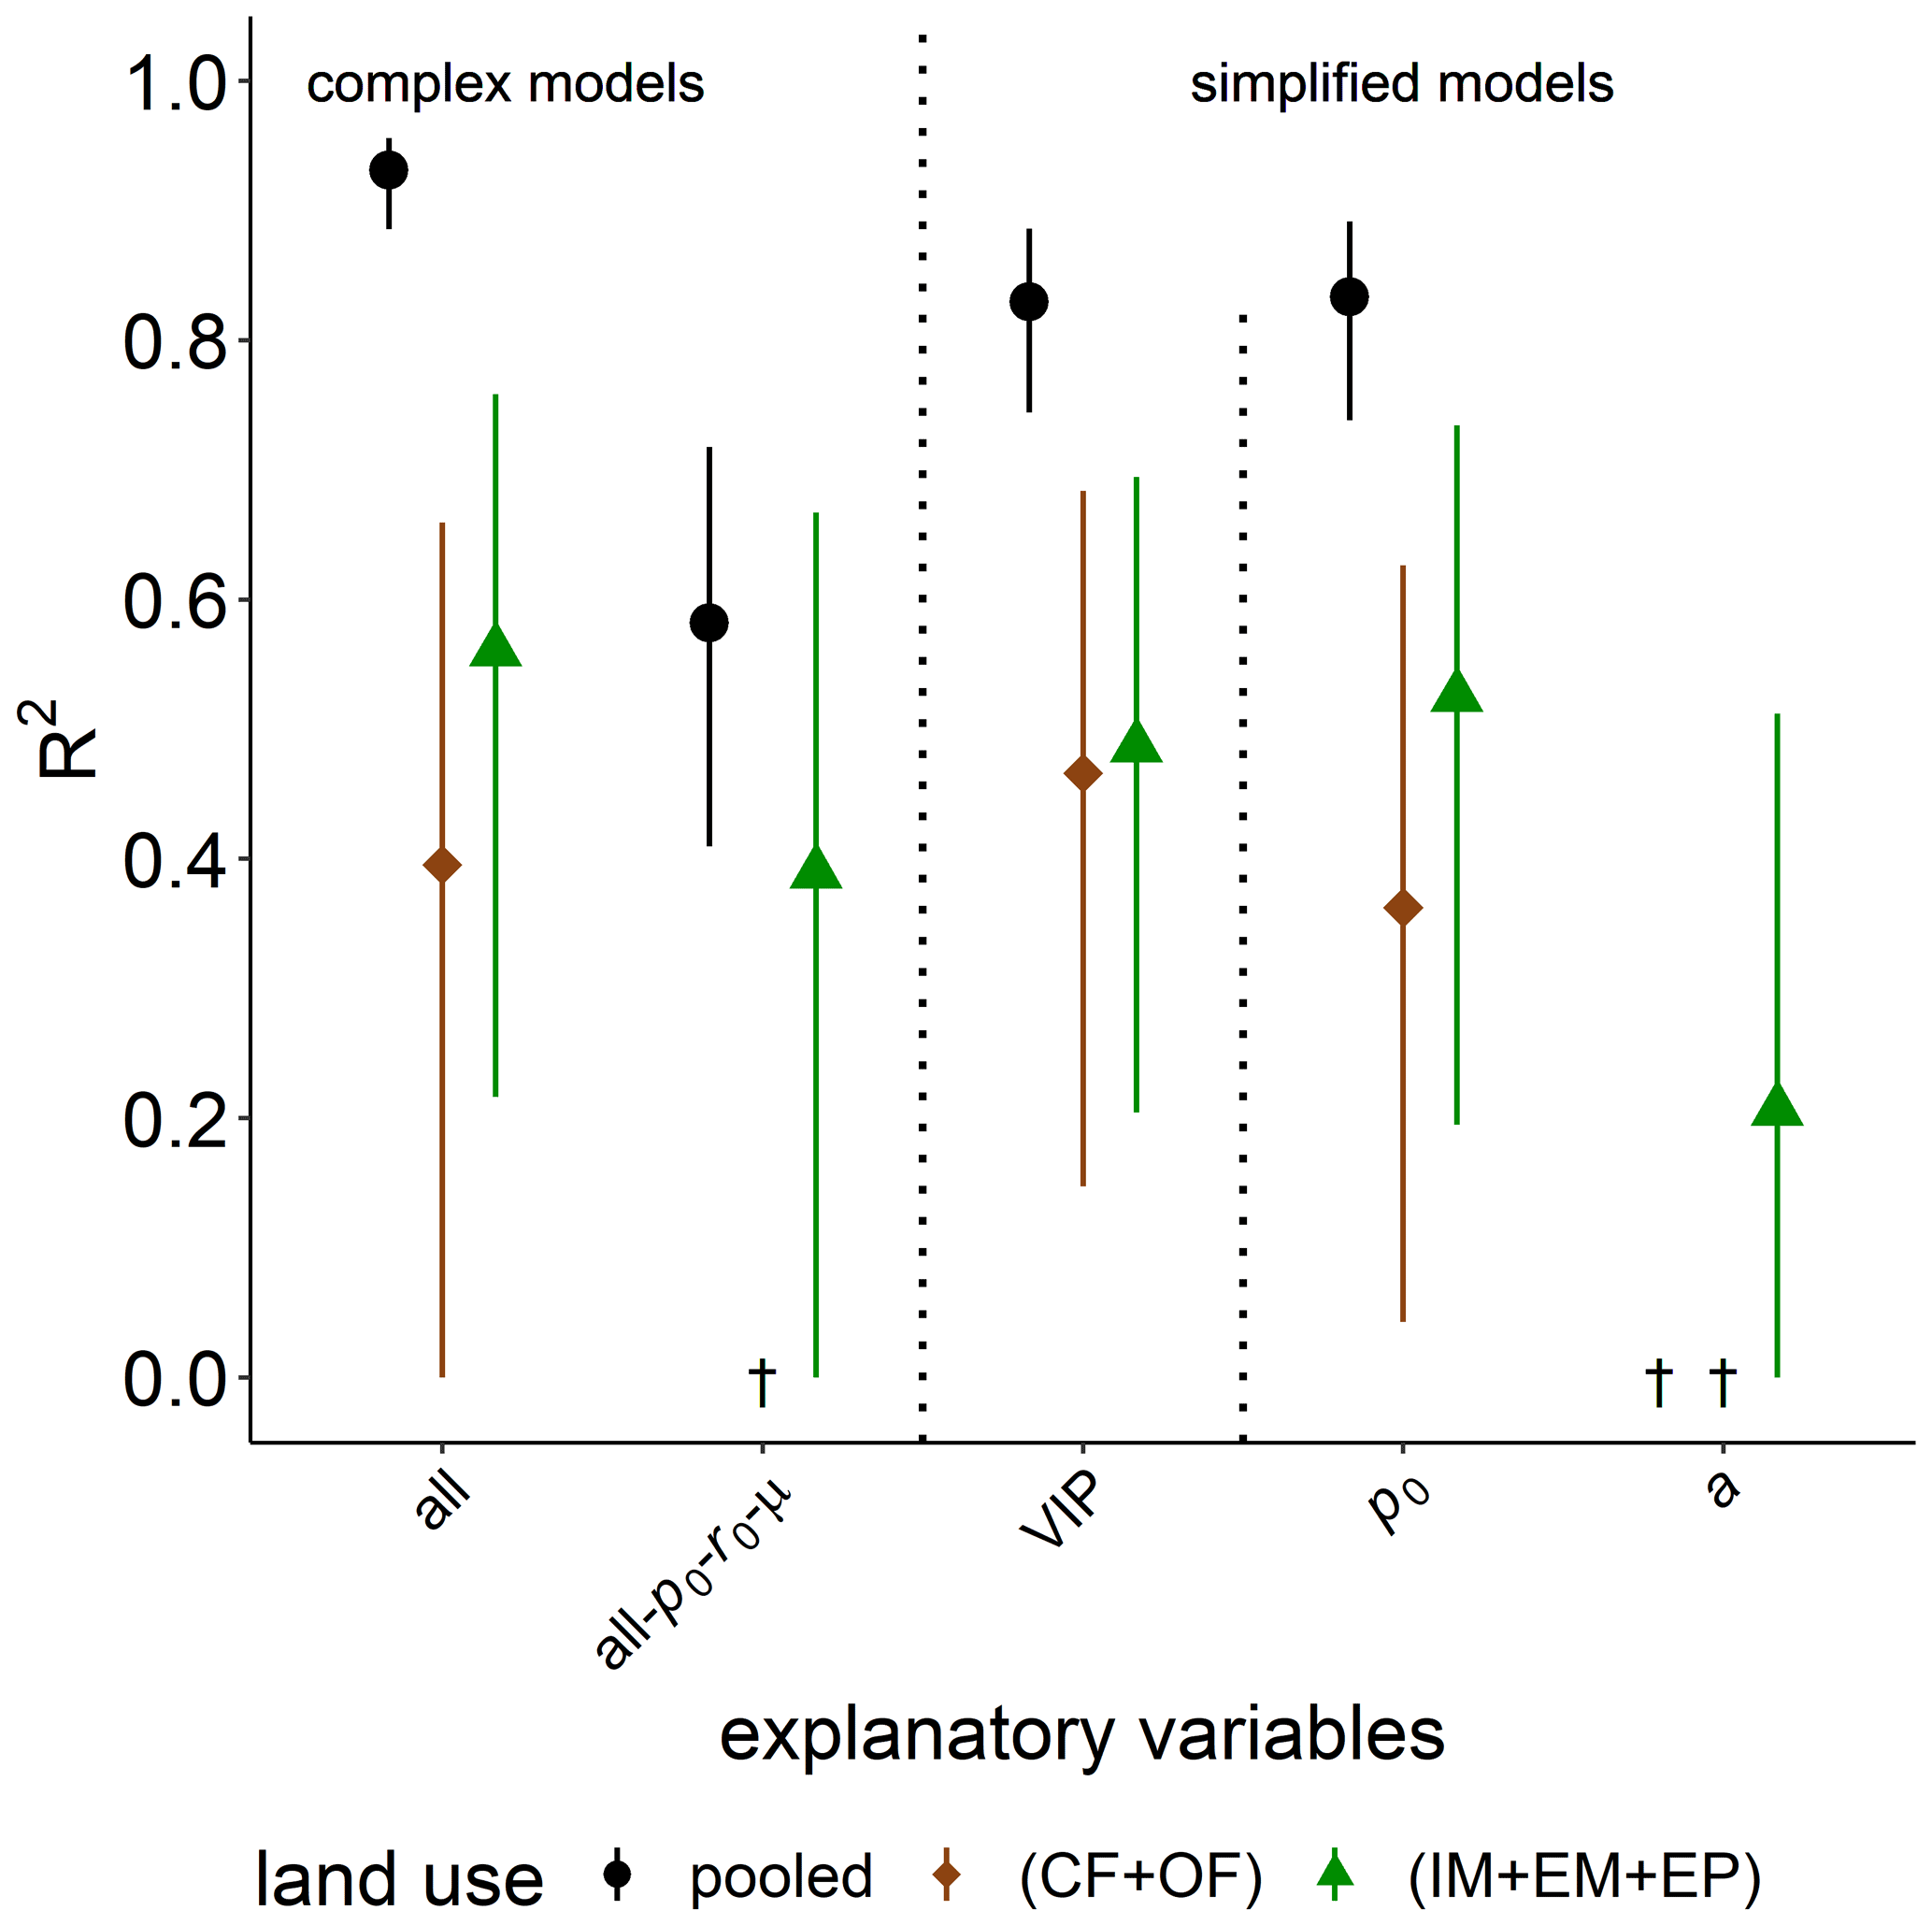
Figure 7Explained variability (R2) of time of capacity excess, texc, during substrate-induced respiration (tave) by different combinations of explanatory variables for all land uses (pooled) or only cropland (CF + OF) and grassland (IM + EM + EP), respectively. The all-po-ro-μ model includes all explanatory variables except for microbial variables. The VIP model include the variables of importance in predicting texc (please see the text for more information). † No variability explained.
4.1 Land use impact on soil properties and respiration
Land use-specific soil management affected soil structural properties, which showed particularly large differences between grasslands and croplands. The lack of tillage in grasslands promoted the continuity of large biopores formed by taproots and earthworms, which was reflected in larger average and critical macropore diameters (∅, ∅c, Table 1; Schlüter et al., 2020). At the same time, the continuous cover with perennial vegetation and the lack of mechanical disturbance by tillage promoted the build-up of soil organic C in grassland topsoils (TOC; Table 1; Poeplau and Don, 2013). Differences between grassland and cropland soil in terms of plant residues, root biomass and water saturation in the topsoil (mr, vr, , Table 1) were likely related to the fact that crops were still in an early growth stage and that they had not established a dense root network, which limited water uptake and transpiration at the time of sampling in May. This discrepancy would have been smaller for winter crops (Thorup-Kristensen et al., 2009) and is likely to vanish during the growing season (Schlüter et al., 2013; Perkons et al., 2014). A somewhat surprising result was the equal average bulk densities in all land uses, as tillage is known to reduce bulk density in topsoils (Strudley et al., 2008; Palm et al., 2014). A bulk density of 1.4 g cm−3 is rather typical for grasslands at the Bad Lauchstädt site (Altermann et al., 2005), whereas previously reported bulk densities of tilled soils in other field trials on site tended to be higher, in the range of 1.46–1.62 g cm−3 (Eden et al., 2012) or lower, in the range of 1.12–1.27 g cm−3 (Max Köhne, personal communication, 2021) depending on soil management and sampling time. Bulk densities not only undergo a seasonal variation, but are also spatially quite variable depending on whether or not the remnants of old or recent wheel tracks are sampled (Roger-Estrade et al., 2004).
There were also subtle, but consistent differences within cropland and grassland treatments. Organic farming had significantly larger critical pore diameters (∅c) and tended to have slightly higher POM volume densities (vr, p=0.106), presumably due to the more prominent presence of large crop residues from the previous growing seasons. Indeed, OF had a 7.5 % higher straw production compared to CF in 2019 (data from continuous GCEF monitoring program). This however, did not entail significant differences in carbon mineralization under field water saturations. In grasslands, basal respiration differed significantly in the order IM < EM < EP (Table 1), even though there were no clear differences in bulk properties, microstructural properties or microbial parameters derived from subsequent substrate-induced respiration between the two meadows and the pasture. The lower basal respiration of IM soil, compared to EM and EP soils, is likely caused by the lower root biomass, represented by the lower POM content in our study. However, none of the available data sets could explain the observed differences between EM and EP. Thus, this difference is possibly caused by the microbial community structure and its trait composition, which is known to affect C mineralization rates (Guo et al., 2020; Nazaries et al., 2015; Auffret et al., 2016). In addition, nutrient availability and C:N ratios of the decaying plant residues, in particular the cut-off roots, might have implications on carbon mineralization, but are not well represented by the C:N ratios measured in soil (Table 1).
In summary, 6 years of different land use led to significant changes in some soil properties that had been expected to change slowly (TOC content), while others remained unchanged (bulk density, C:N ratio). In addition, some land uses differed in soil properties that has been expected to follow a seasonal pattern (e.g., POM volume, pore diameter) induced by different vegetation cover during the growing season and the presence or absence of tillage. Finally, plots from different land uses also varied in terms of spatial heterogeneity. The combination of all these effects constitute a comprehensive dataset of soil structures for testing which minimum set of bulk and microstructure properties is required to predict soil respiration across a range of heterotrophic respiration rates in intact soil cores differing by at least 1 order of magnitude (0.08–1.42 µg CO2-C h−1 g−1 soil).
4.2 Controlling factors of respiration
The variation of basal respiration rates was best described by the POM content of the sample, confirming that residue C mineralization directly in the residues or in the detritusphere exerts a dominant control on microbial activity (Védère et al., 2020; Gaillard et al., 2003). The POM content differed by more than 1 order of magnitude (0.3–4.6 mg g−1 soil) because (1) in croplands, roots were still young and POM predominantly contributed through plant residues from the last growing season and (2) due to spatial variability in root length density, especially within grassland plots. Macroporosity (ϕvis) had no impact on basal respiration. This apparently contradicts previous studies, which showed that soil compaction reduced soil respiration under various levels of water saturation (Liebig et al., 1995). A subsequent study revealed that this reduction of carbon mineralization was particularly strong in a loamy and sandy soil when bulk densities were higher than 1.5 g cm−3 and plant residues were present at the same time (De Neve and Hofman, 2000). Unamended soil or less compacted soil showed less of a response. In the present study, soil cores with high POM content had low bulk density and vice versa, implying countervailing environmental impacts on basal respiration, which may have caused its indifference to macroporosity (ϕvis). Surprisingly, water saturation had no measurable effect on carbon mineralization, even though it was very low () in some grassland cores. It is likely that the decaying root material retained enough water through natural absorbance (Kravchenko et al., 2017) and released easily degradable substrates through cell lysis after sampling to act as microbial hotspots despite the onset of substrate limitation in an otherwise dry soil. In general, drier soil cores were associated with higher POM volume (R2=0.39, p<0.001), which counterbalanced the substrate limitation effect in bulk soil. In none of the soil cores was the initial water saturation high enough to induce a deficiency of soil aeration. A large part of air-filled porosity was not even resolved at a voxel size of 30 µm. This is why visible macroporosity (ϕvis) and all other pore metrics that are highly correlated with ϕvis (Fig. S2) do not add any substantial predictive power for basal respiration, which is in accordance with previous findings (Juarez et al., 2013). In addition, since image-derived ϕvis and vr are highly correlated with ρ and mr (Figs. 3, S2), they can be substituted by simple bulk properties without a loss in predictive power. Our findings indicate that carbon mineralization in well-aerated topsoils that contain fresh POM is biologically driven and mainly governed by carbon availability (Kuzyakov et al., 2009) and less by abiotic processes as proposed by the regulatory gate hypothesis (Kemmitt et al., 2008), at least not by access or diffusion limitation imposed by the soil structure.
The question remains as to which additional parameters could have substantially improved predictive power with respect to basal respiration. It is unlikely that the POM distribution in space (clustering vs. even distribution; Schlüter et al., 2019), which in principal could also be analyzed with X-ray CT, would have mattered, since the supply with oxygen for basal respiration was sufficient in all samples. Information on microbial diversity such as microbial functional gene abundance related to oxidative and hydrolytic enzymes was recently reported to add another 5 %–19 % to predictive power and reduce model uncertainty by 55 %–71 % (Guo et al., 2020). Furthermore, different microbial communities may exert different C mineralization rates due to different carbon use efficiency (Domeignoz-Horta et al., 2020). Local variations in organic matter quality and nutrient availability could also have played a role in carbon mineralization that was not accounted for in the PLSR analysis as that information was not available at the soil core level. For instance, the biodegradability of old crop residues and freshly cut roots are likely to be very different.
The speed of CO2 release (texc) after glucose addition was chosen as an additional target variable to provide a more complete picture of the links between microstructural properties and carbon mineralization. The logarithm of this release time was highly correlated with the respiration rate at the beginning of incubation (log(texc) ∼ p0, R2=0.84, Fig. 5d) and total microbial biomass, which is derived from it (TMB, R2=0.60, not shown). This causal relationship has to be log-linear, since the substrate is consumed with exponential dynamics after growth sets in. The growth itself seems to be similar for all treatments (in terms of μ), indicating similarity in the functional structure of the microbial community and in the intrinsic traits of the dominating decomposers. In addition, the limited oxygen supply at an air content of approx. 0.1 mm3 mm−3 irrespective of land use (Table 1) likely impaired unlimited aerobic growth and thus inhibited differences in μ. If the growth rate μ, as the second driver of CO2 efflux next to initial activity (in terms of p0 or TMB), would have differed more among the soil cores, it presumably would have reduced the predictive power of the initial microbial biomass and required that they be jointly taken into account. The maximum microbial-specific growth rate for unlimited aerobic growth in sieved, unconsolidated soils is considered an eco-physiological indicator sensitive to climate conditions (Lipson et al., 2009; Salazar-Villegas et al., 2016), nutrient availability (Loeppmann et al., 2020), soil types (Loeppmann et al., 2018) and stages of plant residues decomposition. However, the sensitivity of μ to different land uses within the same soil type still remains to be tested. Destroying the intact structure is known to have a tremendous impact on microbial activity. Heterotrophic respiration is very different for sieved and intact soil at the same bulk density and soil moisture in the first weeks after disturbance (Herbst et al., 2016). Our results indicated that the capacity to grow on glucose is also constrained in intact soil structures, presumably by diffusion limitations of the substrate or oxygen. Likewise, faster growth in microsites may be disguised by a delayed CO2 release due to CO2 diffusion limitations in intact soil. Future studies that focus on this direct comparison will have to clarify this. The prediction of texc from independent bulk or pore metrics without microbial variables derived from the glucose experiment is still fairly good (all-p0-r0-μ in Fig. 8, R2=0.58) thanks to the correlation of total microbial biomass with POM content (mr), basal respiration (pb) and even antecedent water saturation () despite being changed by glucose addition (Fig. S2). There are some significant correlations between texc and microstructural parameters like connection probability (Γ), average and critical pore diameter (∅, ∅c) and POM volume density (vr; Fig. S2). However, it is evident that the causal relationship is in fact linked to substrate-induced respiration as a function of total microbial biomass, and that these microstructural properties do not carry any additional information. If only simple bulk properties are used as explanatory variables, then mr is again the most relevant parameter.
Additional incubation experiments after repeated sampling of the plots at different stages of the crop rotation, growing season and different precipitation history, including the different climate scenarios of the GCEF, will provide a more comprehensive data set in the future. Here, the governing state variables responsible for carbon mineralization vary greatly due to seasonally changing soil POM content brought about by roots and fresh litter, different soil moisture and varying shoot-to-root C allocation ratios of plants. Finally, a sizable amount of basal respiration was likely contributed by the decay of cut-off roots that would not have occurred if soil respiration was measured on site. Such field CO2 measurements with comparable spatial footprint and environmental conditions like in laboratory incubation would be an important step to gauge the effect of an intact rhizosphere vs. a decaying detritusphere on carbon mineralization.
To conclude, our findings confirmed the influence of land use on carbon mineralization and revealed the underlying drivers. Surprisingly, neither water saturation in the field, which is one of the main drivers of basal respiration known for disturbed soil, nor land use-specific microstructural soil properties improved the prediction of carbon mineralization. When strong correlations between microstructural variables and carbon mineralization were observed, then they did not arise from causation but collinearity, and could easily be replaced with bulk properties that are less costly to measure without a substantial loss in predictive power. The POM content, including root biomass and other plant residues, was the bulk property that best described the variation in basal respiration across all land uses under well-aerated conditions. Thus, our findings indicated that in intact soil cores, the decomposition of POM, in particular the root residues that started to degrade after sampling, contributed a large share of CO2 emissions, which masked the commonly described variation of C mineralization related to soil water saturation. The POM content also exerted a strong impact on the speed of glucose mineralization. This is because POM governed the initial microbial biomass, whereas the growth on glucose was equally constrained in all soil cores by diffusion limitations imposed by the intact pore structure.
The data are available from the authors upon request.
The supplement related to this article is available online at: https://doi.org/10.5194/soil-8-253-2022-supplement.
StS, EB and ThR designed the research. StS, TiR, VG and ThR carried out the experiments. StS, TiR, VG, LR, EB and ThR analyzed the data. StS, EB and ThR prepared the manuscript with contributions from LR and VG.
The contact author has declared that neither they nor their co-authors have any competing interests.
Publisher’s note: Copernicus Publications remains neutral with regard to jurisdictional claims in published maps and institutional affiliations.
We thank the staff of the Bad Lauchstädt Experimental Research Station (especially Ines Merbach and Konrad Kirsch) and Martin Schädler for their work in maintaining the plots and infrastructures of the Global Change Experimental Facility (GCEF), and Harald Auge, François Buscot, Stefan Klotz and Martin Schädler for their role in setting up the GCEF.
The article processing charges for this open-access publication were covered by the Helmholtz Centre for Environmental Research – UFZ.
This paper was edited by Ingrid Lubbers and reviewed by two anonymous referees.
Akimenko, V. K., Trutko, S. M., Medentsev, A. G., and Korobov, V. P.: Distribution of cyanide-resistant respiration among yeasts and bacteria and its relation to oversynthesis of metabolites, Arch. Microbiol., 136, 234–241, https://doi.org/10.1007/BF00409851, 1983.
Altermann, M., Rinklebe, J., Merbach, I., Körschens, M., Langer, U., and Hofmann, B.: Chernozem – Soil of the Year 2005, J. Plant Nutr. Soil Sc., 168, 725–740, 2005.
Anderson, J. P. E. and Domsch, K. H.: A physiological method for the quantitative measurement of microbial biomass in soils, Soil Biol. Biochem., 10, 215–221, https://doi.org/10.1016/0038-0717(78)90099-8, 1978.
Auffret, M. D., Karhu, K., Khachane, A., Dungait, J. A. J., Fraser, F., Hopkins, D. W., Wookey, P. A., Singh, B. K., Freitag, T. E., Hartley, I. P., and Prosser, J. I.: The Role of Microbial Community Composition in Controlling Soil Respiration Responses to Temperature, PLOS ONE, 11, e0165448, https://doi.org/10.1371/journal.pone.0165448, 2016.
Berg, S., Kutra, D., Kroeger, T., Straehle, C. N., Kausler, B. X., Haubold, C., Schiegg, M., Ales, J., Beier, T., Rudy, M., Eren, K., Cervantes, J. I., Xu, B., Beuttenmueller, F., Wolny, A., Zhang, C., Koethe, U., Hamprecht, F. A., and Kreshuk, A.: ilastik: interactive machine learning for (bio)image analysis, Nat. Method., 16, 1226–1232, https://doi.org/10.1038/s41592-019-0582-9, 2019.
Blagodatskaya, E. and Kuzyakov, Y.: Active microorganisms in soil: Critical review of estimation criteria and approaches, Soil Biol. Biochem., 67, 192–211, https://doi.org/10.1016/j.soilbio.2013.08.024, 2013.
Bouckaert, L., Sleutel, S., Van Loo, D., Brabant, L., Cnudde, V., Van Hoorebeke, L., and De Neve, S.: Carbon mineralisation and pore size classes in undisturbed soil cores, Soil Res., 51, 14–22, https://doi.org/10.1071/SR12116, 2013.
Buades, A., Coll, B., and Morel, J.-M.: A non-local algorithm for image denoising, in: Computer Vision and Pattern Recognition, 2005, CVPR 2005, IEEE Computer Society Conference on, San Diego, California, https://doi.org/10.1109/CVPR.2005.38, 2005.
Canty, A. and Ripley, B.: boot: Bootstrap R (S-Plus) Functions, R package version 1.3-24 [code], avaliable at: https://cran.r-project.org/web/packages/boot/, last access: 9 June 2019.
Davidson, E. A., Janssens, I. A., and Luo, Y.: On the variability of respiration in terrestrial ecosystems: moving beyond Q10, Glob. Biol., 12, 154–164, https://doi.org/10.1111/j.1365-2486.2005.01065.x, 2006.
Davison, A. C. and Hinkley, D. V.: Bootstrap methods and their application, Cambridge Series in Statistical and Probabilistic Mathematics, Cambridge University Press, Cambridge, ISBN 0521574714, 1997.
de Mendiburu, F.: Agricolae: statistical procedures for agricultural research, in: R package version 1.3-5 [code], avaliable at: https://cran.r-project.org/web/packages/agricolae/, last access: 7 June 2021.
De Neve, S. and Hofman, G.: Influence of soil compaction on carbon and nitrogen mineralization of soil organic matter and crop residues, Biol. Fert. Soils, 30, 544–549, https://doi.org/10.1007/s003740050034, 2000.
Domeignoz-Horta, L. A., Pold, G., Liu, X.-J. A., Frey, S. D., Melillo, J. M., and DeAngelis, K. M.: Microbial diversity drives carbon use efficiency in a model soil, Nat. Commun., 11, 3684, https://doi.org/10.1038/s41467-020-17502-z, 2020.
Dungait, J. A. J., Hopkins, D. W., Gregory, A. S., and Whitmore, A. P.: Soil organic matter turnover is governed by accessibility not recalcitrance, Glob. Change Biol., 18, 1781–1796, https://doi.org/10.1111/j.1365-2486.2012.02665.x, 2012.
Ebrahimi, A. and Or, D.: On Upscaling of Soil Microbial Processes and Biogeochemical Fluxes From Aggregates to Landscapes, J. Geophys. Res.-Biogeo., 123, 1526–1547, https://doi.org/10.1029/2017JG004347, 2018.
Eden, M., Moldrup, P., Schjønning, P., Vogel, H.-J., Scow, K. M., and de Jonge, L. W.: Linking Soil Physical Parameters Along a Density Gradient in a Loess-Soil Long-Term Experiment, Soil Sci., 177, 1–11, https://doi.org/10.1097/SS.0b013e31823745a9, 2012.
Efron, B.: Better bootstrap confidence intervals, J. Am. Stat. Assoc., 82, 171–185, https://doi.org/10.2307/2289144, 1987.
Gaillard, V., Chenu, C., and Recous, S.: Carbon mineralisation in soil adjacent to plant residues of contrasting biochemical quality, Soil Biol. Biochem., 35, 93–99, https://doi.org/10.1016/S0038-0717(02)00241-9, 2003.
Guo, X., Gao, Q., Yuan, M., Wang, G., Zhou, X., Feng, J., Shi, Z., Hale, L., Wu, L., Zhou, A., Tian, R., Liu, F., Wu, B., Chen, L., Jung, C. G., Niu, S., Li, D., Xu, X., Jiang, L., Escalas, A., Wu, L., He, Z., Van Nostrand, J. D., Ning, D., Liu, X., Yang, Y., Schuur, E. A. G., Konstantinidis, K. T., Cole, J. R., Penton, C. R., Luo, Y., Tiedje, J. M., and Zhou, J.: Gene-informed decomposition model predicts lower soil carbon loss due to persistent microbial adaptation to warming, Nat. Commun., 11, 4897, https://doi.org/10.1038/s41467-020-18706-z, 2020.
Herbst, M., Tappe, W., Kummer, S., and Vereecken, H.: The impact of sieving on heterotrophic respiration response to water content in loamy and sandy topsoils, Geoderma, 272, 73–82, https://doi.org/10.1016/j.geoderma.2016.03.002, 2016.
Hund, K. and Schenk, B.: The microbial respiration quotient as indicator for bioremediation processes, Chemosphere, 28, 477–490, https://doi.org/10.1016/0045-6535(94)90292-5, 1994.
Juarez, S., Nunan, N., Duday, A.-C., Pouteau, V., and Chenu, C.: Soil carbon mineralisation responses to alterations of microbial diversity and soil structure, Biol. Fert. Soil., 49, 939–948, https://doi.org/10.1007/s00374-013-0784-8, 2013.
Kemmitt, S. J., Lanyon, C. V., Waite, I. S., Wen, Q., Addiscott, T. M., Bird, N. R. A., O'Donnell, A. G., and Brookes, P. C.: Mineralization of native soil organic matter is not regulated by the size, activity or composition of the soil microbial biomass – a new perspective, Soil Biol. Biochem., 40, 61–73, https://doi.org/10.1016/j.soilbio.2007.06.021, 2008.
Koestel, J.: SoilJ: An ImageJ Plugin for the Semiautomatic Processing of Three-Dimensional X-ray Images of Soils, Vadose Zone J., 17, 170062, https://doi.org/10.2136/vzj2017.03.0062, 2018.
Kravchenko, A. N., Toosi, E. R., Guber, A. K., Ostrom, N. E., Yu, J., Azeem, K., Rivers, M. L., and Robertson, G. P.: Hotspots of soil N2O emission enhanced through water absorption by plant residue, Nat. Geosci., 10, 496, https://doi.org/10.1038/ngeo2963, 2017.
Kravchenko, A. N., Guber, A. K., Razavi, B. S., Koestel, J., Quigley, M. Y., Robertson, G. P., and Kuzyakov, Y.: Microbial spatial footprint as a driver of soil carbon stabilization, Nat. Commun., 10, 3121, https://doi.org/10.1038/s41467-019-11057-4, 2019.
Kuzyakov, Y., Blagodatskaya, E., and Blagodatsky, S.: Comments on the paper by Kemmitt et al. (2008) “Mineralization of native soil organic matter is not regulated by the size, activity or composition of the soil microbial biomass – A new perspective” [Soil Biology & Biochemistry 40, 61–73]: The biology of the Regulatory Gate, Soil Biol. Biochem.y, 41, 435–439, https://doi.org/10.1016/j.soilbio.2008.07.023, 2009.
Legland, D., Arganda-Carreras, I., and Andrey, P.: MorphoLibJ: integrated library and plugins for mathematical morphology with ImageJ, Bioinformatics, 32, 3532–3534, 2016.
Lehmann, J., Hansel, C. M., Kaiser, C., Kleber, M., Maher, K., Manzoni, S., Nunan, N., Reichstein, M., Schimel, J. P., Torn, M. S., Wieder, W. R., and Kögel-Knabner, I.: Persistence of soil organic carbon caused by functional complexity, Nat. Geosci., 13, 529–534, https://doi.org/10.1038/s41561-020-0612-3, 2020.
Liebig, M. A., Jones, A. J., Doran, J. W., and Mielke, L. N.: Potential Soil Respiration and Relationship to Soil Properties in Ridge Tillage, Soil Sci. Soc. Am. J., 59, 1430–1435, https://doi.org/10.2136/sssaj1995.03615995005900050032x, 1995.
Lipson, D. A., Monson, R. K., Schmidt, S. K., and Weintraub, M. N.: The trade-off between growth rate and yield in microbial communities and the consequences for under-snow soil respiration in a high elevation coniferous forest, Biogeochemistry, 95, 23–35, https://doi.org/10.1007/s10533-008-9252-1, 2009.
Loeppmann, S., Semenov, M., Kuzyakov, Y., and Blagodatskaya, E.: Shift from dormancy to microbial growth revealed by RNA:DNA ratio, Ecol. Indic., 85, 603–612, https://doi.org/10.1016/j.ecolind.2017.11.020, 2018.
Loeppmann, S., Breidenbach, A., Spielvogel, S., Dippold, M. A., and Blagodatskaya, E.: Organic Nutrients Induced Coupled C- and P-Cycling Enzyme Activities During Microbial Growth in Forest Soils, Front. Forest. Glob. Change, 3, 100, https://doi.org/10.3389/ffgc.2020.00100, 2020.
Meurer, K. H. E., Chenu, C., Coucheney, E., Herrmann, A. M., Keller, T., Kätterer, T., Nimblad Svensson, D., and Jarvis, N.: Modelling dynamic interactions between soil structure and the storage and turnover of soil organic matter, Biogeosciences, 17, 5025–5042, https://doi.org/10.5194/bg-17-5025-2020, 2020.
Nazaries, L., Tottey, W., Robinson, L., Khachane, A., Al-Soud, W. A., Sørensen, S., and Singh, B. K.: Shifts in the microbial community structure explain the response of soil respiration to land-use change but not to climate warming, Soil Biol. Biochem., 89, 123–134, https://doi.org/10.1016/j.soilbio.2015.06.027, 2015.
Otsu, N.: A threshold selection method from gray-level histograms, Automatica, 11, 23–27, 1975.
Palm, C., Blanco-Canqui, H., DeClerck, F., Gatere, L., and Grace, P.: Conservation agriculture and ecosystem services: An overview, Agr. Ecosyst. Environ., 187, 87–105, 2014.
Panikov, N.: Microbial Growth Kinetics, Chapman & Hall, London-Glasgow-Weinheim, ISBN 0412566303, 1995.
Perkons, U., Kautz, T., Uteau, D., Peth, S., Geier, V., Thomas, K., Lütke Holz, K., Athmann, M., Pude, R., and Köpke, U.: Root-length densities of various annual crops following crops with contrasting root systems, Soil Till. Res., 137, 50–57, https://doi.org/10.1016/j.still.2013.11.005, 2014.
Poeplau, C. and Don, A.: Sensitivity of soil organic carbon stocks and fractions to different land-use changes across Europe, Geoderma, 192, 189–201, https://doi.org/10.1016/j.geoderma.2012.08.003, 2013.
R Core Team: R: A language and environment for statistical computing version 4.0.2, R Foundation for Statistical Computing, Vienna, Austria, https://www.R-project.org/, last access: 30 June 2020.
Rawlins, B. G., Wragg, J., Reinhard, C., Atwood, R. C., Houston, A., Lark, R. M., and Rudolph, S.: Three-dimensional soil organic matter distribution, accessibility and microbial respiration in macroaggregates using osmium staining and synchrotron X-ray computed tomography, SOIL, 2, 659–671, https://doi.org/10.5194/soil-2-659-2016, 2016.
Roger-Estrade, J., Richard, G., Caneill, J., Boizard, H., Coquet, Y., Defossez, P., and Manichon, H.: Morphological characterisation of soil structure in tilled fields: from a diagnosis method to the modelling of structural changes over time, Soil Till. Res., 79, 33–49, 2004.
Salazar-Villegas, A., Blagodatskaya, E., and Dukes, J. S.: Changes in the Size of the Active Microbial Pool Explain Short-Term Soil Respiratory Responses to Temperature and Moisture, Front. Microbiol., 7, 524, https://doi.org/10.3389/fmicb.2016.00524, 2016.
Schädler, M., Buscot, F., Klotz, S., Reitz, T., Durka, W., Bumberger, J., Merbach, I., Michalski, S. G., Kirsch, K., Remmler, P., Schulz, E., and Auge, H.: Investigating the consequences of climate change under different land-use regimes: a novel experimental infrastructure, Ecosphere, 10, e02635, https://doi.org/10.1002/ecs2.2635, 2019.
Schindelin, J., Arganda-Carreras, I., Frise, E., Kaynig, V., Longair, M., Pietzsch, T., Preibisch, S., Rueden, C., Saalfeld, S., and Schmid, B.: Fiji: an open-source platform for biological-image analysis, Nat. Method., 9, 676–682, 2012.
Schlüter, S., Vogel, H.-J., Ippisch, O., and Vanderborght, J.: Combined Impact of Soil Heterogeneity and Vegetation Type on the Annual Water Balance at the Field Scale, Vadose Zone J., 12, 1–17, https://doi.org/10.2136/vzj2013.03.0053, 2013.
Schlüter, S., Sheppard, A., Brown, K., and Wildenschild, D.: Image processing of multiphase images obtained via X-ray microtomography: A review, Water Resour. Res., 50, 3615–3639, 2014.
Schlüter, S., Zawallich, J., Vogel, H.-J., and Dörsch, P.: Physical constraints for respiration in microbial hotspots in soil and their importance for denitrification, Biogeosciences, 16, 3665–3678, https://doi.org/10.5194/bg-16-3665-2019, 2019.
Schlüter, S., Albrecht, L., Schwärzel, K., and Kreiselmeier, J.: Long-term effects of conventional tillage and no-tillage on saturated and near-saturated hydraulic conductivity – Can their prediction be improved by pore metrics obtained with X-ray CT?, Geoderma, 361, 114082, https://doi.org/10.1016/j.geoderma.2019.114082, 2020.
Schmidt, M. W. I., Torn, M. S., Abiven, S., Dittmar, T., Guggenberger, G., Janssens, I. A., Kleber, M., Kögel-Knabner, I., Lehmann, J., Manning, D. A. C., Nannipieri, P., Rasse, D. P., Weiner, S., and Trumbore, S. E.: Persistence of soil organic matter as an ecosystem property, Nature, 478, 49–56, 2011.
Stenström, J., Stenberg, B., and Johansson, M.: Kinetics of Substrate-Induced Respiration (SIR), Theory, Ambio, 27, 35–39, 1998.
Strudley, M. W., Green, T. R., and Ascough, J. C.: Tillage effects on soil hydraulic properties in space and time: State of the science, Soil Till. Res., 99, 4–48, 2008.
Thorup-Kristensen, K., Salmerón Cortasa, M., and Loges, R.: Winter wheat roots grow twice as deep as spring wheat roots, is this important for N uptake and N leaching losses?, Plant Soil, 322, 101–114, 2009.
Védère, C., Vieublé Gonod, L., Pouteau, V., Girardin, C., and Chenu, C.: Spatial and temporal evolution of detritusphere hotspots at different soil moistures, Soil Biol. Biochem., 150, 107975, https://doi.org/10.1016/j.soilbio.2020.107975, 2020.
Vogel, H.-J., Weller, U., and Schlüter, S.: Quantification of soil structure based on Minkowski functions, Comput. Geosci., 36, 1236–1245, https://doi.org/10.1016/j.cageo.2010.03.007, 2010.
Wardle, D. A. and Ghani, A.: A critique of the microbial metabolic quotient (qCO2) as a bioindicator of disturbance and ecosystem development, Soil Biol. Biochem., 27, 1601–1610, https://doi.org/10.1016/0038-0717(95)00093-T, 1995.
Wickham, H.: ggplot2: Elegant Graphics for Data Analysis, Springer-Verlag New York, Springer, 260 pp., ISBN 978-3-319-24275-0, 2016.
Wolodzko, T.: Kernelboot: Smoothed bootstrap and random generation from kernel densities version 0.1.7, https://cran.r-project.org/web/packages/kernelboot/, last access: 1 June 2020.
Wutzler, T., Blagodatsky, S. A., Blagodatskaya, E., and Kuzyakov, Y.: Soil microbial biomass and its activity estimated by kinetic respiration analysis – Statistical guidelines, Soil Biol. Biochem., 45, 102–112, https://doi.org/10.1016/j.soilbio.2011.10.004, 2012.
Yan, Z., Bond-Lamberty, B., Todd-Brown, K. E., Bailey, V. L., Li, S., Liu, C., and Liu, C.: A moisture function of soil heterotrophic respiration that incorporates microscale processes, Nat. Commun., 9, 2562, https://doi.org/10.1038/s41467-018-04971-6, 2018.