the Creative Commons Attribution 4.0 License.
the Creative Commons Attribution 4.0 License.
 | 17 Mar 2022
Long-term impact of cover crop and reduced disturbance tillage on soil pore size distribution and soil water storage
Jeffrey P. Mitchell
Jan W. Hopmans
Teamrat A. Ghezzehei
We studied the long-term impact of contrasting tillage and cover cropping systems on soil structure and hydraulic properties. Complete water retention and conductivity curves for the top (0–5 cm) and subsurface (20–25 cm) soils were characterized and contrasted. Dynamic water storage and retention were evaluated using numerical simulations in HYDRUS-2D software. Compared with standard-till (ST) and no-cover-crop (NO) systems, soils under no-till (NT) and cover cropping (CC) systems showed improved soil structure in terms of pore size distribution (PSD). Changes in hydraulic conductivity (K) under these systems led to an increased infiltration rate and water retention. However, NT and CC plots had lower water content at field capacity (33 kPa suction) and lower plant-available water (PAW) compared with ST and NO plots. Numerical simulations, however, showed that NT and CC plots have higher water storage (albeit marginal in magnitude) and water availability following irrigation. Because the numerical simulations considered retention and conductivity functions simultaneously and dynamically through time, they allow the capture of hydraulic states that are arguably more relevant to crops. The study concludes that the long-term practices of NT and CC systems were beneficial in terms of changes to the PSD. NT and CC systems also marginally improved soil water conductivity and storage at the plot scale.
- Article
(2103 KB) - Full-text XML
- BibTeX
- EndNote


Improving soil health – the vitality of a soil in sustaining the socio-ecological functions of its enfolding land (Janzen et al., 2021) – is one of the main challenges of our time as we grapple with the demands of growing population and changing climate. The tools at our disposal to achieve this goal in agricultural lands are collectively known as conservation agriculture practices. Conservation agriculture is characterized by a combination of three linked principles: (1) reduced mechanical soil disturbance, (2) preservation of a permanent organic soil cover, and (3) diversification of crop species (Kassam et al., 2019; Li et al., 2018; Mitchell et al., 2019). The adoption of conservation agriculture has been growing worldwide at an increasing rate since the 1960s. Between 2008 and 2015, the global area under conservation agriculture increased by 69 % to 180 Mha (Blanco-Canqui and Ruis, 2018; Kassam et al., 2019). In California's highly productive Central Valley region, the cultivated area under conservation agriculture for tomato and corn production has increased from less than 5000 ha in 2004 to over 140 000 ha in 2012 (Mitchell et al., 2016a).
Conservation agriculture promises two main categories of benefits to soil health and soil functions. First, conservation agriculture (specifically reduced tillage) eliminates the negative effects associated with standard (conventional) tillage (ST), such as the degradation of soil structure, increased erosion, loss of nutrients, reduction in soil organic matter, and reduction in soil microbial diversity (Lal et al., 2007; Zuber and Villamil, 2016). Second, conservation agriculture supports the development of healthy soils. For example, several studies have shown that reduced disturbance tillage systems sequester more carbon and decrease greenhouse gas emission (Reicosky and Allmaras, 2003; Palm et al., 2014; Sanz-Cobena et al., 2017); improve soil physical properties such as soil bulk density and penetration resistance (Veenstra et al., 2006, 2007); increase microbial biomass, richness, and activity (Zuber and Villamil, 2016; Martens, 2001; Johnson and Hoyt, 1999); and reduce dust and air particle pollution (Baker et al., 2005; Madden et al., 2008; Reicosky and Allmaras, 2003). While some studies show that reduced disturbance tillage reduced yield (Pittelkow et al., 2015), others have found that the yield is unaffected (Naab et al., 2017; Rasmussen, 1999; Alvarez and Steinbach, 2009) while reducing cost (Upadhyaya et al., 2001; Mitchell et al., 2009; González-Sánchez et al., 2016). Cover cropping – planting between cropping seasons to maintain soil cover year-round and often to replenish soil nitrogen – provides many beneficial services, including soil cover, residues, and biological diversity (Mitchell et al., 2019). Benefits of cover cropping include reduced erosion (Reicosky and Forcella, 1998; Shelton et al., 2000), diseases, and pest pressure (Mitchell et al., 2017) as well as increased soil fertility (Büchi et al., 2018; Abdalla et al., 2019) and increased microbial biomass, richness, and activity (Fernandez et al., 2016; Duchene et al., 2017).
Conservation agriculture practices are also credited with various beneficial changes to soil hydrology, including increases in macroporosity (Abdollahi et al., 2014; Burr-Hersey et al., 2017), water storage (Liu et al., 2019; Basche et al., 2016a; Duchene et al., 2017; Finney et al., 2017; Ashworth et al., 2017), and infiltration (Hudson, 1994; Johnson and Hoyt, 1999; Basche and DeLonge, 2017; Mitchell et al., 2017). Based on a meta-analysis from 27 studies, Basche and DeLonge (2017) concluded that cover cropping was effective in enhancing soil water storage and other soil hydrologic properties when practiced longer term (>10 years) and in drier environments (<900 mm annual rainfall).
However, conservation agriculture can also lead to undesired negative outcomes. Without tillage to loosen the soil, reduced tillage systems can cause soil consolidation and compaction that can reverse the beneficial physical soil health outcomes (Blanco-Canqui and Ruis, 2018; Pittelkow et al., 2015). Several studies have noted the critical lack of field studies and the need for evaluation of the long-term effects of conservation agriculture on the soil physical and hydraulic properties and soil hydrological processes (Peña-Sancho et al., 2016; Basche and DeLonge, 2017; Blanco-Canqui and Ruis, 2018; Bacq-Labreuil et al., 2019). In this study, we assess the long-term impact of reduced tillage and cover crop practices on soil structure and associated hydrologic properties. We evaluated soils that have been under a mix of reduced tillage and cover crop treatments since 1999. Specifically, we aimed to test whether long-term conservation agriculture significantly alters water retention, pore size distribution, density, hydraulic conductivity, and steady-state and dynamic field capacity.
2.1 Study site and experimental design
The study site is part of the California Conservation Agricultural Systems Innovation Center (CASI) is located at the University of California West Side Research and Extension Center in Five Points, California (36.34066∘ N, 120.1207∘ W; Fig. 1). The experimental field has two-factor replicated treatments of tillage and winter cover cropping: standard till with and without cover crops (ST-NO and ST-CC, respectively) and conservation tillage (no till) with and without cover crops (NT-NO and NT-CC, respectively). CASI defines conservation tillage as a range of production practices that reduce primary intercrop tillage operations and either preserve 30 % or more residue cover or reduce the total number of tillage passes by 40 % or more (Mitchell, 2016). Throughout this paper, we refer to these tillage practices with the more descriptive term “no till” (NT) instead of conservation tillage.
Each treatment combination was replicated eight times in a randomized complete block implemented on a 9 m ×82 m dimension plot with an approximately 10 m buffer guard between the tillage treatments. While the operations used varied from year to year, the number of tractor passes for the NT plots was always reduced by 40 % or more relative to the ST plots (Mitchell et al., 2012). The NT systems were managed from the principle of reducing primary intercrop tillage to the greatest extent possible. Controlled traffic farming practices that restrict tractor traffic to certain furrows were used. The planting beds in the NT systems were not moved nor destroyed since the start of the project. The only soil disturbance in the NT systems was shallow cultivation during the first 8 years of the project. From 2012 onwards, soil disturbing activity in the NT systems only occurred at times of seeding or transplanting. In contrast, the ST systems consisted of multiple conventional intercrop tillage operations that broke down and established new beds following harvest. These practices represent the normal operations of farming the San Joaquin Valley in terms of intensity, depth, and timing of tillage. Detailed descriptions of the ST and the NT systems have previously been published (e.g., Veenstra et al., 2006; Mitchell et al., 2016b).
The soil type at the study site is a Panoche clay loam (fine-loamy, mixed, superactive, thermic Typic Haplocambids) which is representative of much of California's Central Valley. Textures range from clay loam (32 % clay, 33 % silt, 35 % sand) at the southern end to sandy clay loam (23 % clay, 23 % silt, 54 % sand) at the northern end. Treatment replicate plots are laid out north–south in alternating fashion, and all treatments are equally represented in the northern and southern parts. Based on 2012–2014 measurements, the organic carbon content of the top 15 cm of the soils is 13.9 g kg−1 for ST-NO, 16.95 g kg−1 for ST-CC, 21.56 g kg−1 for NT-NO, and 25.53 g kg−1 for NT-CC plots (Mitchell et al., 2017). For the first 12 years of the conservation agriculture experiment (between 2000 and 2012), tomato and cotton were grown in rotation; this has been followed by a rotation of sorghum with garbanzo beans since 2012. All plots were irrigated by subsurface drip.
The cover crops were a mix of triticale (Triticosecale Wittm.), cereal rye (Secale cereale L.), common vetch (Vicia sativa), radish (Raphanus sativus L.), and clover (Trifolium incarnatum) seeded in 20 cm rows at 89.2 kg ha−1 in late October. The cover crops are terminated in late March of the following year using a stalk chopper followed by disk incorporation in the ST system, or they are sprayed with a 2 % solution application of glyphosate after chopping and left on the surface as a mulch in the NT systems.
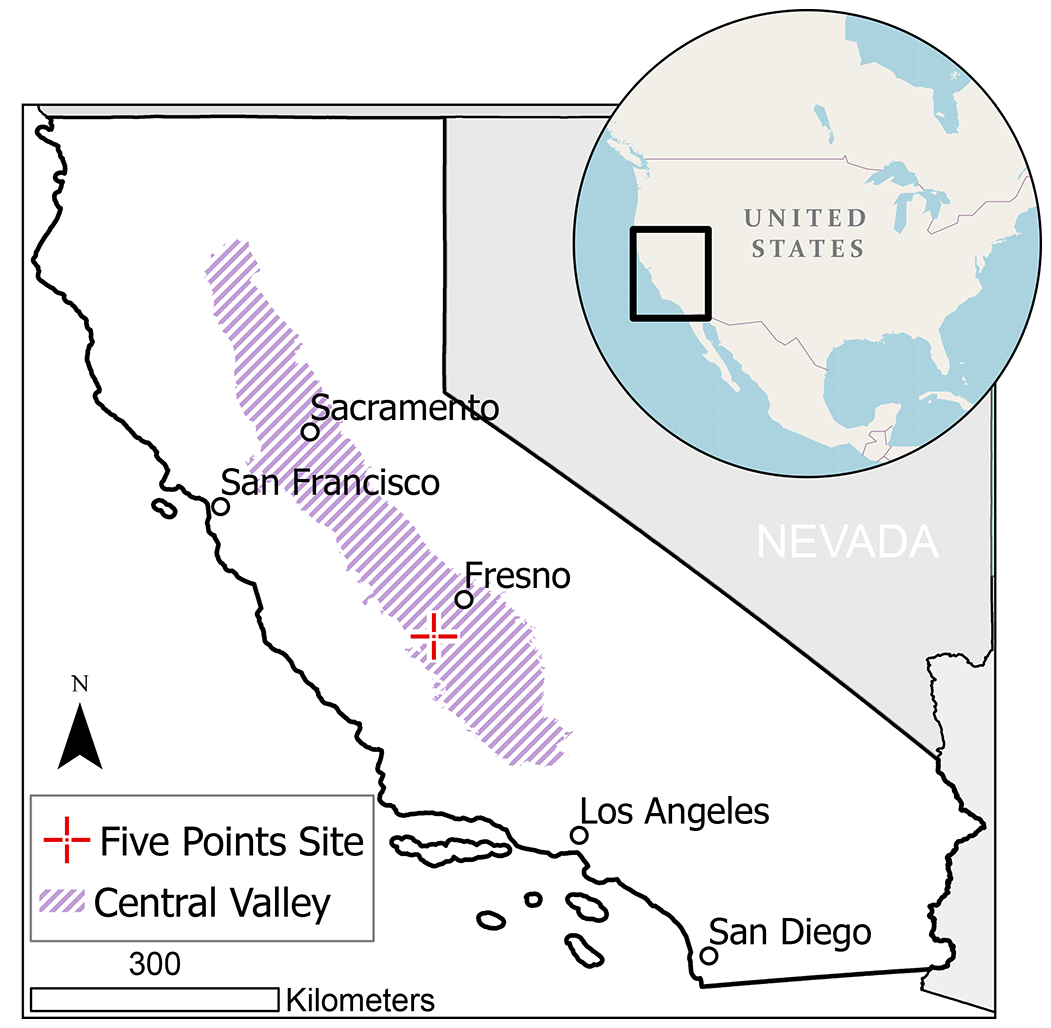
Figure 1Location of the study site at Five Points, California (California's Central Valley extent map from Faunt, 2012).
2.2 Sampling
Sampling was done in mid-November 2017 – approximately 5 months after tillage in the ST treatment plots – in order to avoid the immediate effects of tillage, as we were primarily interested in the long-term effects of the treatments. Tillage operations have a transitory effect on porosity and associated soil hydraulic properties as structures collapse, mainly driven by wetting and drying cycles post-tillage (Or et al., 2000; Mapa et al., 1986). The immediate alterations of tillage on soil porosity and hydraulic properties have been shown to diminish rapidly following only a few wetting and drying cycles (Strudley et al., 2008; Alletto et al., 2015; Green et al., 2003).
Undisturbed soil samples from the top (0–5 cm) and subsurface (20–25 cm) layers were collected carefully using a 250 cm3 volume sampling ring (8 cm diameter × 5 cm height). The depths were chosen to correspond with the depth disturbed by disking in order to incorporate residue in the ST plots (i.e., 0–20 cm depth) (Mitchell et al., 2015; Veenstra et al., 2006) and the deeper layer. Samples were collected along the strip ridges within the plots away from the trafficked furrows but slightly off-center to avoid drip irrigation tubes buried at the center of ridges. Thirty-two samples were collected by taking one surface, and one subsurface sample from four of the eight treatment replicate plots. This resulted in four replicates of surface and subsurface samples per treatment. The samples were stored at 4 ∘C before laboratory analysis.
2.3 Laboratory measurements
To assess the long-term impact of NT and CC practices on soil structure, we measured soil bulk densities (ρb), total porosities, pore size distributions (PSD), and soil hydraulic properties of water retention (WRC) and hydraulic conductivity functions (HCF).
The saturated hydraulic conductivity (Ks) was measured using the falling-head method. For this method, soils were saturated by immersing sample cores in degassed, 0.01 M CaCl2 solution so that the water level was close to the rim. Ks of the saturated soil was then measured using a KSAT instrument (METER Group, Inc., Munich, Germany) by allowing a 5 cm column of degassed, 0.01 M CaCl2 solution to flow through the soil core. The cores were set up so that the flow direction was in the downward direction. Following the Ks measurement, soil WRC and HCF were determined simultaneously using the evaporation method by the HYPROP instrument (METER Group, Inc., Munich, Germany). The HYPROP simultaneously measures, at high frequency (10 min), suction inside the soil cores at two different depths along with weight loss while saturated soil cores dry. This allows for the calculation of WRC, θ(ψ), and HCF, K(ψ). Following the HYPROP measurements, soil water retention in the range of water suction from 103 to 106 cm was determined using the WP4C instrument (Decagon Devices, Inc, Pullman, WA, USA). Throughout this paper, the term water suction, h, is used to represent the soil water matric potential, ψ, such that (cm).
We define field capacity (θFC) and permanent wilting point (θPWP) as the volumetric water content with the corresponding volume of water retained in the soil at 330 and 15 000 cm suction, respectively. θFC and θPWP are approximations of water retained after internal drainage has ceased, θFC, and the soil water content limit beyond which plants cannot recover their turgidity, θPWP (Hillel, 1998). We calculated plant-available water (PAW) as the difference between θFC and θPWP (i.e., PAW = θFC−θPWP). In addition to the saturated hydraulic conductivity, we also compared the unsaturated hydraulic conductivity near-field-capacity water content at 100 cm suction. A near-field-capacity hydraulic conductivity may be taken as a better representation of field condition infiltration. A 100 % saturation is unlikely under field conditions due to factors such as air entrapment.
2.4 Soil porosity determination
Total soil porosity (P) was calculated as , where ρp is the particle density of soil, taken as 2650 kg m−3, and ρb is the soil bulk density determined using the standard core method (Grossman and Reinsch, 2002).
The effective pore size distribution (PSD) was estimated from the slope of the WRC using the differential water capacity (Klute, 1986). For this, the WRC, θ(h), was first transformed into a curve of effective saturation (S) as a function of effective pore radius (r), S(r). S was calculated as ), where θs and θr are the respective saturated and residual volumetric water contents estimated from a bimodal constrained van Genuchten model fit (Durner, 1994) of measured WRC. The draining pore radius was approximated using the Young–Laplace equation (Eq. 1):
where r (µm) is pore radius; h (cm) is the suction; and 1490 is a factor that contains unit conversions, the surface tension of water, the mass density of water, and the acceleration due to gravity. The contact angle is assumed to be zero. The PSD curves were then calculated as follows:
where fp (−) is the density function of effective pore sizes. Prior to calculating PSD, the S(ln (r)) curve was fitted with a cubic smoothing spline to remove noise in the measurement data (Kastanek and Nielsen, 2001; Pires et al., 2008). For a deeper insight, we divided pore sizes into four ranges: intra-microaggregates (<0.2 µm), intra-aggregates (0.2–10 µm), small macropores (10–50 µm), and large macropores (50–1000 µm). These range categories allowed us to perform quantitative comparisons on the relative abundance of the pore size ranges among the different treatments.
2.5 Soil water storage simulations
To measure the interactive impact of changes in WRC and HCF on profile water dynamics and storage, we conducted a numerical simulation of field irrigation. We performed 16 independent simulations, 1 for each treatment plot, using soil hydraulic properties derived from the respective treatment soil samples. The fate of irrigation water applied on the different treatment plots was simulated in HYDRUS-2D software, where water flow is modeled using a modified form of the Richards equation (Eq. 3) that incorporates a sink term to account for water uptake by plant roots (Simunek et al., 2012).
where θ (L3 L−3) is the volumetric water content, t (T) is time, xi (L) are the spatial coordinates, K (LT−1) is the unsaturated hydraulic conductivity, (−) are the components of a dimensionless anisotropy tensor, H (L) is the total hydraulic head (sum of pressure head and elevation), and Sr (T−1) is the sink term representing the rate of water volume removed due to plant water uptake.
The domain was set up as an axisymmetric cylinder of 18 cm radius and 100 cm depth. Figure 2 illustrates the model domain sketch and the domain setup in HYDRUS-2D. The domain was discretized with 1473 nodes and 2788 triangular elements. This discretization mesh was refined to have more nodes around the emitter (0.5 cm spacing) and soil layer boundaries (1 cm spacing) to capture expected high rates of changes in soil moisture. The material distribution in terms of soil hydraulic properties was such that the top 0–20 cm and the subsurface 20–30 cm were those measured in this study (Sect. 3.3 and 3.4). Soil hydraulic properties for the bottom layers (30–60 and 60–100 cm layers) were predicted from soil characteristics using the Rosetta-H5 pedotransfer function (Schaap et al., 2001) and the van Genuchten–Mualem hydraulic model (van Genuchten, 1980). Soil characteristics for these layers were based on soil properties of the C1 and C2 soil horizons (41–58 and 58–91 cm depths, respectively) for Panoche soils, Pedon ID S1978CA029001 (National Cooperative Soil Survey, https://ncsslabdatamart.sc.egov.usda.gov/, last access: 1 July 2020).
The subsurface irrigation emitter was represented with a sphere of 1 cm radius buried 10 cm below the surface. We simulated the fate of irrigation applied at a depth equivalent to 4.8 cm and at an emitter discharge rate of 0.61 L h−1 (0.60 cm h−1 equivalent irrigation depth) in each of the 16 sampled plots.
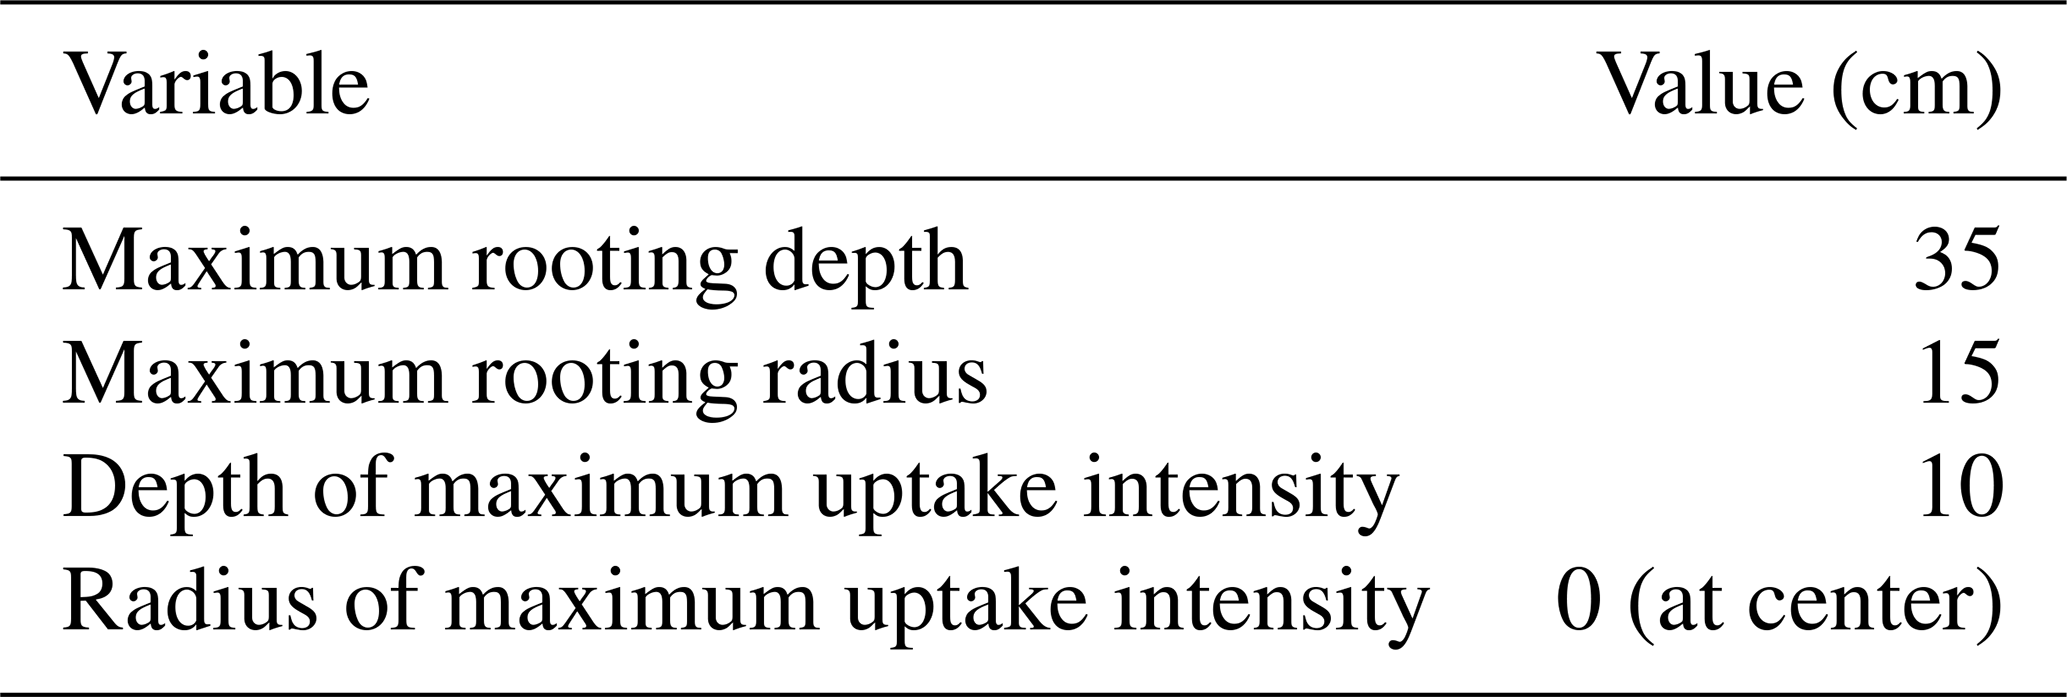
The entire domain surface area (1017.9 cm2) was associated with transpiration, and the root water uptake (Sr in Eq. 3) was modeled by the HYDRUS-2D default Feddes parameters for a tomato plant. The plant root water uptake spatial distribution model was implemented using Vrugt et al. (2001) functions with the parameters given in Table 1.
An atmospheric boundary condition was set for the surface layer, and a free drainage lower boundary was set for the bottom layer. The atmospheric boundary condition was defined by potential crop evapotranspiration (ETc) which was calculated based on Eq. (4).
where ETc (LT−1) is potential crop evapotranspiration, Kc (−) is the crop coefficient (1.15 for tomato mid-season, according to Allen et al., 1998), and ET0 (LT−1) is the reference potential evapotranspiration.
Hourly reference potential evapotranspiration (ET0) values for a week (6–12 May 2018) were retrieved from the nearest weather station (the CIMIS Five Points Station, https://cimis.water.ca.gov/, last access: 3 January 2020).
The starting pressure head of the entire model domain was set to −1000 cm, and simulation was initialized by a 14-week spin-up period. The model was run recursively with 2.5 cm equivalent depth irrigation applied at the start of every week for 14 weeks after which the final simulation was run with irrigation applied at a depth equivalent to 4.8 cm (at a rate of 0.6 cm h−1 for 8 h)(Fig. 3). The amount of water retained in a given soil profile layer following irrigation is calculated as the equivalent water depth change using Eq. (5).
where ΔWt (L) is the equivalent water depth retained in the soil profile t hours after irrigation application, Wt is the equivalent water depth in the soil profile t hours after irrigation, and Wt0 is the equivalent water depth immediately before irrigation application.
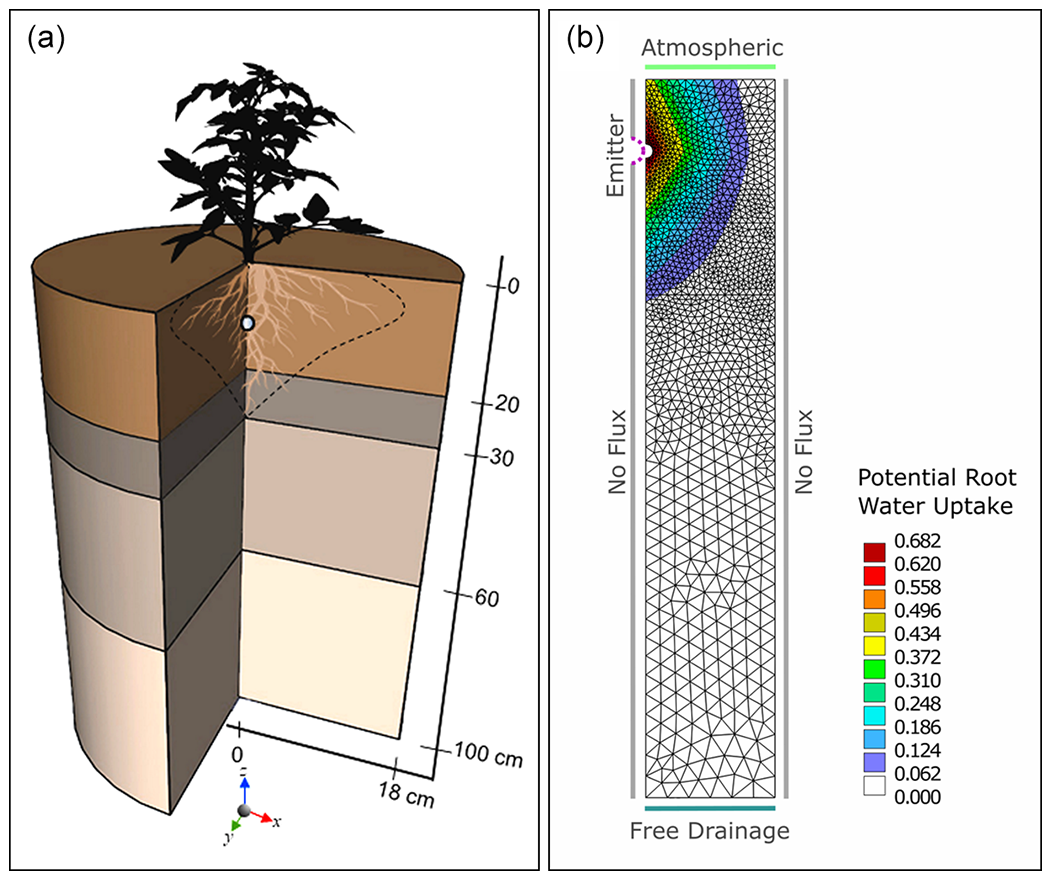
Figure 2(a) A 3D schematic representation of the domain geometry and material distribution. (b) The domain setup in HYDRUS-2D showing the finite element mesh, related boundary conditions, and potential root water uptake rate distribution.
2.6 Statistical analysis
All quantitative results are expressed as the means of four replicates ± standard error unless otherwise indicated. Differences in means were tested by analysis of variance (ANOVA) and pairwise comparison of treatments done using Tukey's honest significant difference (HSD) test at a p<0.15 significance level unless otherwise stated (a least significant difference table is provided in the Appendix, Table B1). Hydraulic conductivity values were log-transformed before statistical analysis to make their distribution more normal. The normality of the data and the homogeneity of variances were checked using Shapiro–Wilk's and Levene's tests, respectively. All statistical analyses were performed using R statistical software (R Core Team, 2019).

Figure 3Daily cumulative irrigation and potential crop evapotranspiration through the 14 weeks of spin-up period (gray background) and the final simulation.
An example of water conductivity and retention measurement for a single soil sample is shown in Fig. 4. The HCF and WRC values for all of the samples are provided in Figs. A1 and A2.
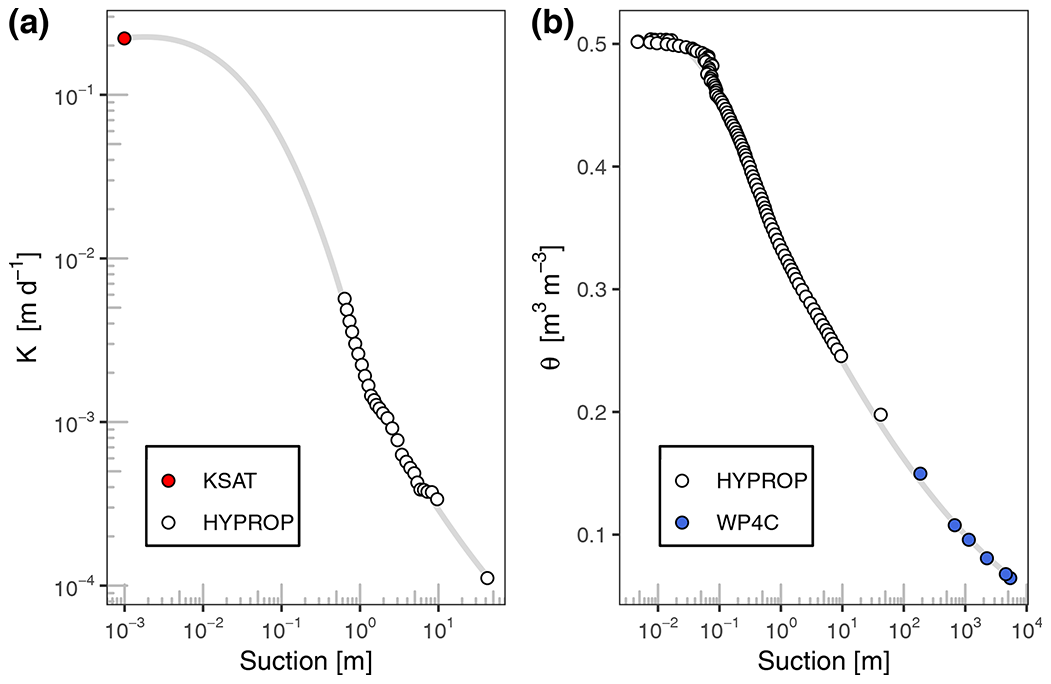
Figure 4Plot of measured hydraulic conductivity (a) and water retention (b) for one of the topsoil ST-CC samples with the measurement instrument labeled. Gray lines are trend lines smoothed using LOESS (locally weighted smoothing).
3.1 Pore size distribution
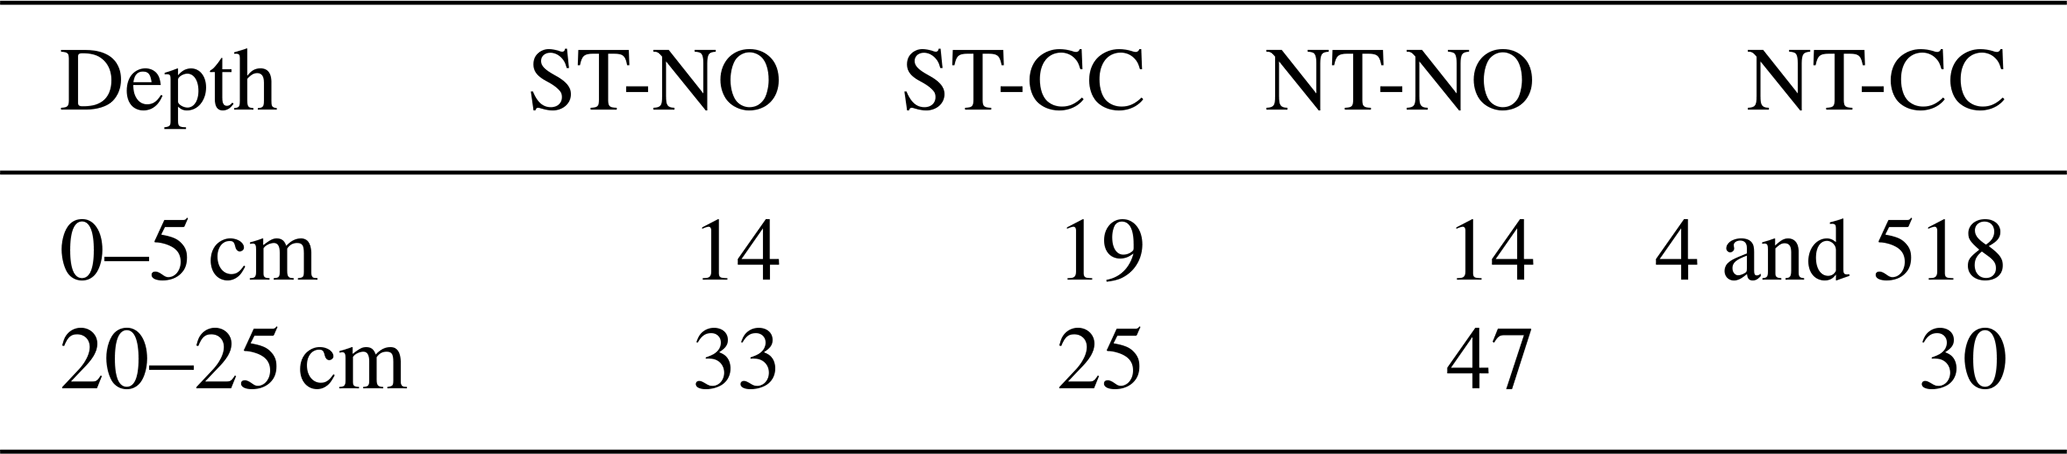
The mean soil PSD values for the different systems are shown in Fig. 5a. PSD curves for the individual samples are provided in Fig. A3. A wider spread of PSD values implies a heterogeneous mix of pore sizes and indicates soil with a more developed structure. The maximum pore volume density for the topsoils occurred between pore size diameters of 15 and 20 µm except for NT-CC soils which showed a bimodal distribution with a maximum pore volume density of around 4 and 518 µm (Table 2).
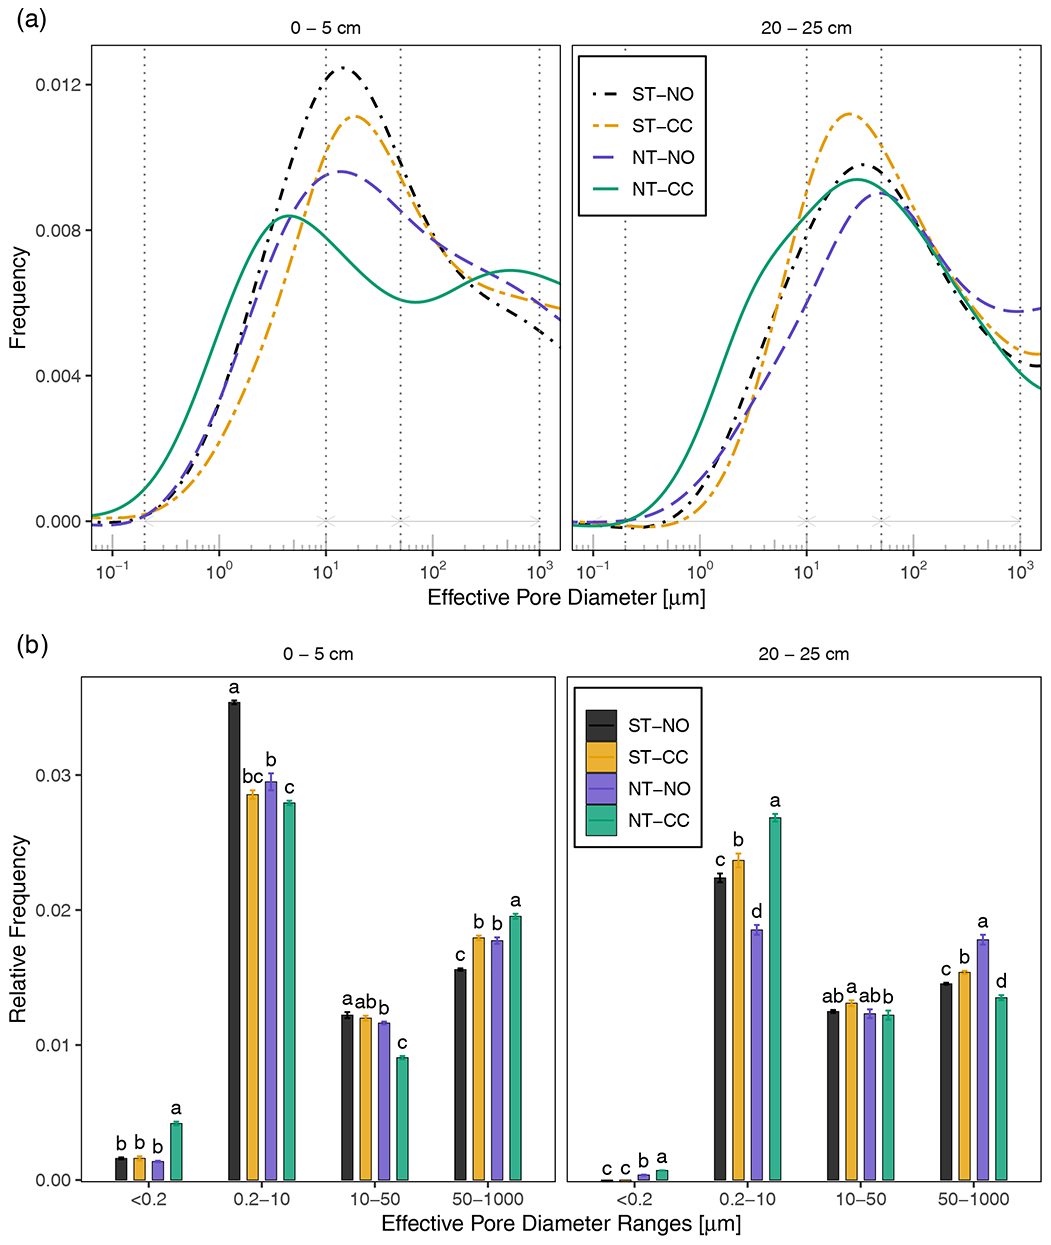
Figure 5(a) Pore size distribution for the top (0–5 cm) and subsurface (20–25 cm) soil layers. Dotted vertical lines and horizontal arrows indicate the characteristic pore diameter ranges of <0.2, 0.2–10, 10–50, and 50–1000 µm. (b) The relative abundance of the four characteristic pore diameter ranges. Bars indicate standard errors. Different letters within the same pore size range indicate differences at p<0.15.
One interesting observation is that the topsoils under NT-CC practices have the widest spread of PSD values. These topsoils have higher proportions of the smaller (<0.2 µm) and larger (50–1000 µm) diameter pores (p<0.15) and a bimodal distribution that is not present in the other systems (Fig. 5b). Several studies have similarly observed an increase in the proportion of larger pores in NT systems (Tavares Filho and Tessier, 2009; Pires et al., 2017; Gao et al., 2019, 2017). The reason for the abundance of small and large pores for the NT-CC systems suggests the formation of tightly packed aggregates with smaller pores and larger interaggregate pores between them. This would be consistent with results from a previous study of our site and other work that has found higher aggregate stability for the NT-CC systems (Mitchell et al., 2017; Gao et al., 2019). Greenland (1977) suggests soil pore size classification based on equivalent diameter into three groups as transmission (50–500 µm), storage (0.5–50 µm), and residual pores (<0.5 µm). Larger transmission pores are essential for infiltration, drainage, and aeration, whereas smaller storage pores are important in retaining water. Increased soil aeration is beneficial for many soil processes, including soil organic matter cycling (Lehmann and Kleber, 2015; Janzen, 2015) and other biogeochemical processes (Ekschmitt et al., 2008; Schmidt et al., 2011). ST-NO plots had the lowest relative abundance of larger macropores (50–1000 µm), whereas NT-CC had the highest proportion (Fig. 5b).
Table 2Modal diameter (µm) of the pore size distribution curves.
For the subsurface soils, the combined effect of NT and CC increased the spread of PSD; however, NT without CC showed a narrower PSD with the highest PSD mode and highest abundance of large macropores compared with other treatments. NT-CC plots showed a higher proportion of intra-aggregate size pores and smaller size pores (<10 µm) at p<0.15. Plant roots are important actors in soil structure development; they enhance aggregation by compacting soils through growth and exudation of segmenting materials and fragmenting aggregates to create larger interaggregate pores (Jarvis, 2007; Angers and Caron, 1998; Meurer et al., 2020). Given the reduced tillage in the NT plots, it could be that CC plays a more critical role in forming more diverse aggregate sizes and a wider PSD. The effect of the CC species should also be considered in this interpretation, as it has recently been shown that the effect of CC on soil structure and porosity varies significantly with root morphology and architecture of the CC plant (Bacq-Labreuil et al., 2019).
3.2 Bulk density
There were marked differences in ρb between the top and the subsurface layers regardless of the treatment type. The average ρb for the top- and subsurface-layer soils were 1.19 and 1.46 g cm−3, respectively (equivalent to total porosities of 55 % and 45 %). Between the treatments, there was no statistically significant difference in ρb of subsurface soils at p<0.15. For topsoils, only NT-NO soils showed a markedly higher ρb particularly compared with ST-NO (p=0.078) and NT-CC (p=0.141) (Fig. 6). This observation tends to support one of the concerns of NT practice which is that NT practices may lead to soil consolidation and an increase in compaction because of the lack of intensive tillage (Blanco-Canqui and Ruis, 2018; Moret and Arrúe, 2007). Compaction reduces soil pore volume and affects soil fertility by reducing water flow and aeration, which negatively affect soil biological activity and redox potential (Vereecken et al., 2016). Our findings show that continued long-term NT led to a slight increase in compaction. This effect, however, was not found when NT was practiced with CC. The PSD values that we observed in NT systems (see Sect. 3.1) appear to imply that NT systems led to PSD values indicative of a better-developed soil structure with primary and secondary structures.
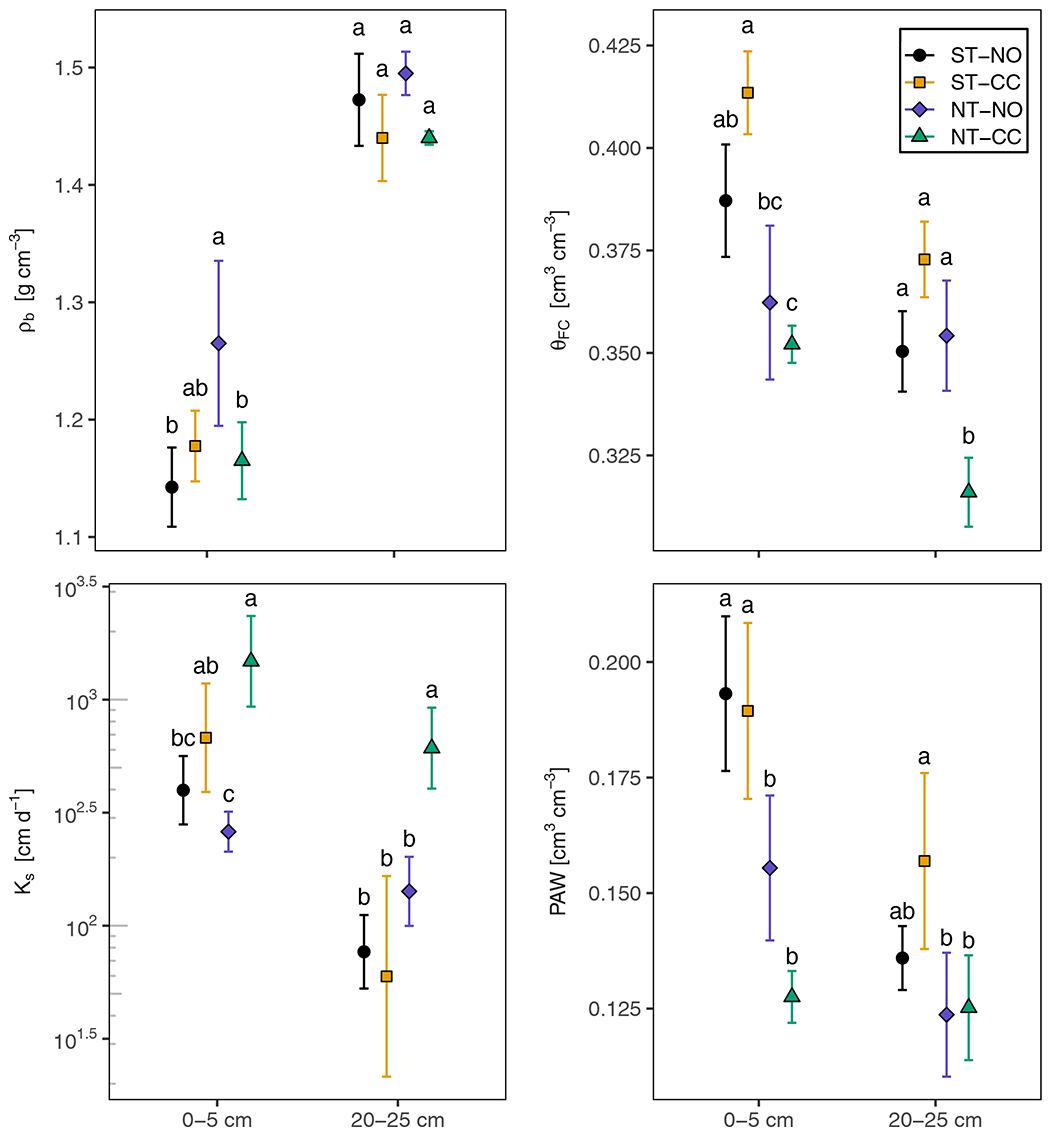
Figure 6Mean bulk density (ρb), saturated hydraulic conductivity (Ks), water content at field capacity (θFC), and plant-available water (PAW) of the top (0–5 cm) and subsurface (20–25 cm) layer soils. Bars indicate standard errors. Different letters within the same depth indicate differences at p<0.15.
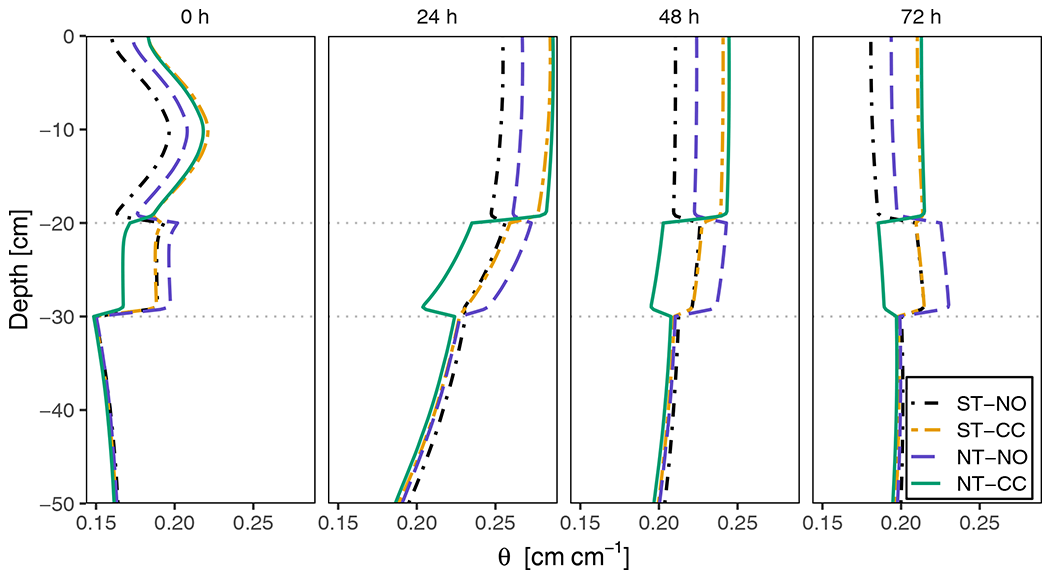
Figure 7Vertical soil water content distribution 0, 24, 48, and 72 h after irrigation (treatment means). The gray, dotted horizontal lines indicate the different soil boundaries.
3.3 Hydraulic conductivity
The CC treatments tended to have greater impact on Ks than the tillage treatment for the top-layer soils (Fig. 6). This is consistent with the increase in infiltration for these CC plots reported by Mitchell et al. (2017), who noted a factor of 2.8 increase compared with the plots without CC. Mitchell et al. (2017) suggested several possible explanations, including increased slaking associated with ST; better formation of macropores; and better continuity of soil pores, possibly due to better-established soil structure and biology (Pires et al., 2017; Schwen et al., 2011). Both the top and subsoil layer under NT-CC systems showed higher Ks compared with all of the other treatments. These results suggest that CC is even more important in NT systems in order to increase infiltration. We also compared conductivity at 100 cm suction, K(100 cm), as this may be a better representation of flow that is controlled by smaller pores as opposed to Ks. There were no apparent differences in K(100 cm) among the treatments.
3.4 Water retention
The NT treatments had lower θFC compared with ST (Fig. 6). The larger values of θFC for ST plots are consistent with a more loose soil due to tillage increasing the capillary size pores. The θFC for the top-layer NT soils were lower by more than 5 % with respect to volumetric water content (p<0.016) compared with ST-CC. The ST-NO treatments had intermediate values that were not statistically different (p<0.15) from other treatments except for NT-CC. The θFC showed similar trends for the subsurface-layer soils but with smaller magnitudes of differences. CC appeared to enhance the effects of NT in terms of the θFC and PAW of topsoil layers (Fig. 6). The NT-NO top-layer soils showed values between NT-CC and the ST soils. The top layers of NT-CC plots showed a marked decrease in PAW (p<0.014) compared with the ST treatments. Assuming the top-sample PAW represents 0–20 cm depth and the subsurface PAW represents 20–40 cm depth, the NT-CC soils would store 5.05 cm of equivalent surface water in plant-available form in the top 40 cm soil profile. This is 1.70 cm less plant-available equivalent surface water per 40 cm depth than the average of the ST systems. The differences in PAW among the systems was mainly driven by θFC rather than θPWP. On both layers, the CC treatment increased the θFC of ST soils but had the opposite effect on the NT soils. While some studies have reported an increase in θFC and PAW with CC (Basche et al., 2016b; Steele et al., 2012; Villamil et al., 2006), our findings are consistent with the observations from a recent meta-analysis of 93 paired observations of CC (Basche and DeLonge, 2017) which showed that CC did not affect total porosity for treatments practiced longer than 7 years or clay contents >25 %, which match the parameters of our study site. In terms of θFC, our findings also agree with the conclusions of Basche and DeLonge (2017), who found that while long-term CC tends to increase θFC, it actually tends to decrease it for soils with >25 % clay. Our results showed that while this was the case with ST, it was not the case for NT. For the subsurface layer of NT treatments, θFC was significantly lower for the NT-CC compared with NT-NO treatments. This difference suggests that roots from cover crops extend below our surface layer and have the potential to significantly alter the soil structure. This subsurface effect of CC may be masked by frequent disturbance in the ST treatments. This observation is consistent with recent studies that have shown that the effect of cover crops extends below the so-called “plough layer” (rooting depth of approximately 30 cm) (Rath et al., 2022; Veloso et al., 2018; Sastre et al., 2018; Tautges et al., 2019).
3.5 Simulated water storage
The simulation results showed that the difference in soil water content between the treatments is most distinct in the top 40 cm. Figure 7 shows the vertical distribution of soil moisture following the irrigation for selected times. The 2D distribution of soil moisture is shown in Figs. A4 and A5. The CC plots maintain higher volumetric water content in the top 20 cm throughout the dry down period following irrigation. However, in the underlying 20–30 cm depth layers, the NT-CC plots maintain the lowest soil moisture. While the NT-NO plots maintain a moderate soil water content in the top 20 cm compared with the other treatments, these plots maintain the highest water content in the 20–30 cm depth layers.

Figure 8Change in water storage across soil layers (treatment means). The gray, dotted vertical line indicates day 3 after irrigation.
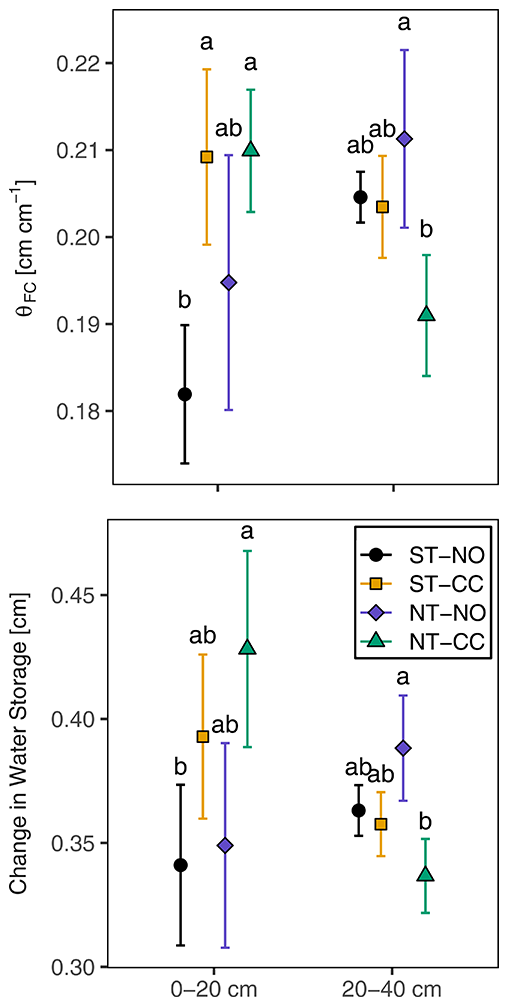
Figure 9Dynamic field capacity (θFC) and water storage change on day 3 after irrigation. Bars indicate standard errors. Different letters indicate differences at p<0.15.
Changes in water storage over time following 4.8 cm equivalent water depth irrigation (see Eq. 5) are shown in Fig. 8. The results show that while the layers in the top 40 cm start to lose water immediately following irrigation (to evapotranspiration and drainage), the deepest layer (60–100 cm) continues to gain water more than 5 days after irrigation.
The conventional measure of plant-available water storage (PAW = θFC−θPWP) relies only on the WRC. Because WRC is a description of soil water status at equilibrium, this measure of plant-available water does not account for the dynamic interactions of water retention and hydraulic conductivity (Twarakavi et al., 2009). An alternative measure of field capacity is the “dynamic field capacity” which can be defined as the amount of water maintained in the soil after excess gravitational water is drained and the rate of downward movement is minimal (Veihmeyer and Hendrickson, 1931). This dynamic field capacity is commonly taken as the water content after 3 (or sometimes even 5) days of drainage (Twarakavi et al., 2009; Assouline and Or, 2014). In our simulation, the rate of water drainage for the top and middle layers had significantly decreased after 3 days (Fig. 8).
Comparisons of the treatment average with respect to volumetric water content and the amount of water retained 3 days after irrigation (that is, the dynamic field capacity and water storage at time of field capacity) are shown in Fig. 9. The differences among all treatments were marginal (in the order of millimeters) but tended to favor the NT and CC treatments. In terms of change in water storage, soils in the top 20 cm of the NT-CC plots retained the most water, whereas the ST-NO plots retained the least amount of water. The water content at dynamic field capacity for the soils in the top 20 cm was marginally higher for the CC plots than for the NO plots, with the ST-NO plots showing the lowest water content (p<0.09). For the 20–40 cm depths, there was a contrast between NT-NO and NT-CC plots, with NT-NO holding the most water and NT-CC holding the least. Among the 20–40 cm depth ST plots, there were no apparent differences in water content or water storage change 3 days after irrigation. These findings regarding the water content at field capacity contrast with the θFC and PAW estimated from the conventional equilibrium measures (see Fig. 6), which showed that the ST plots generally had higher water contents at field capacity and higher PAW. The dynamic water content at field capacity for the subsurface layers 20–30 cm shows similarity with that of the conventional field capacity for soils at 20–25 cm depth. The NT-CC plots have lower water contents than NT-NO (p<0.06). The ST plots for the 20–40 cm depth have a water content at dynamic field capacity that is closer to that of NT-NO. Unlike the conventional equilibrium measures, the dynamic water storage and water contents at field capacity capture the interaction between water retention curve and hydraulic conductivity functions; therefore, these measures likely capture soil hydrology more accurately.
Soils under long-term NT and CC practices showed a marked difference in soil pore size distribution (PSD). When practiced independently, soils under either NT or CC systems showed only moderate increases in the PSD range and a very small or negligible effect on the measured and simulated soil hydraulic properties. When practiced together, soils under NT-CC systems showed the most pronounced changes in soil structure and hydraulic properties. NT-CC systems showed a bimodal PSD in the top (0–5 cm) soils with modes at effective diameter sizes of around 4 and 500 µm. These modes are in the storage and transmission pore size categories. While ST practices are done mainly to loosen the topsoil and improve soil structure for crops, their effect is transitory. Our results suggest that long-term NT and CC practices increase soil aggregation and the proportion of larger pores while also maintaining total porosity.
CC practices, with or without tillage, tended to increase the saturated hydraulic conductivity (Ks) but appeared particularly effective when practiced in conjunction with NT. When practiced without CC, top-layer soils (0–5 cm) under NT systems showed lower Ks, even more so than ST soils. The Ks of the NT-CC subsurface layer (20–25 cm) tended to be higher than all other systems.
The measured water retention suggested that soils under NT-CC practices have a lower ability to store water. The NT-CC practices had lower plant-available water (PAW) and water content at field capacity (θFC). While these equilibrium measures of field capacity and PAW indicate a soil's ability to store water, the dynamically simulated water storage in soils results from the interaction between a soil's water retention characteristics and its hydraulic conductivities. Both the water retention and conductivity are accounted for in the HYDRUS-2D irrigation simulation. The results showed that when both retention and conductivity properties are considered together, the top layers of NT systems do not show a disadvantage but instead have a marginally increased ability to store water compared with ST plots.
The changes in PSD values associated with long-term NT and CC systems that we observed suggest that these systems improved soil structure. NT and CC systems also marginally improved soil water conductivity and storage at the plot scale.
These soil measurements and simulation results reveal significant changes that result from long-term conservation management. Future studies with a wider variety of soils and climates as well as larger sample sizes could further elucidate the nuanced implications of the long-term effects of conservation agriculture.

Figure A1Hydraulic conductivity functions of top and subsurface layers by treatment. Gray curves are individual soil core measurements, and thick red curves are the treatment means.

Figure A2Water retention curves of top and subsurface layers by treatment. Gray curves are individual soil core measurements, and thick red curves are the treatment means.
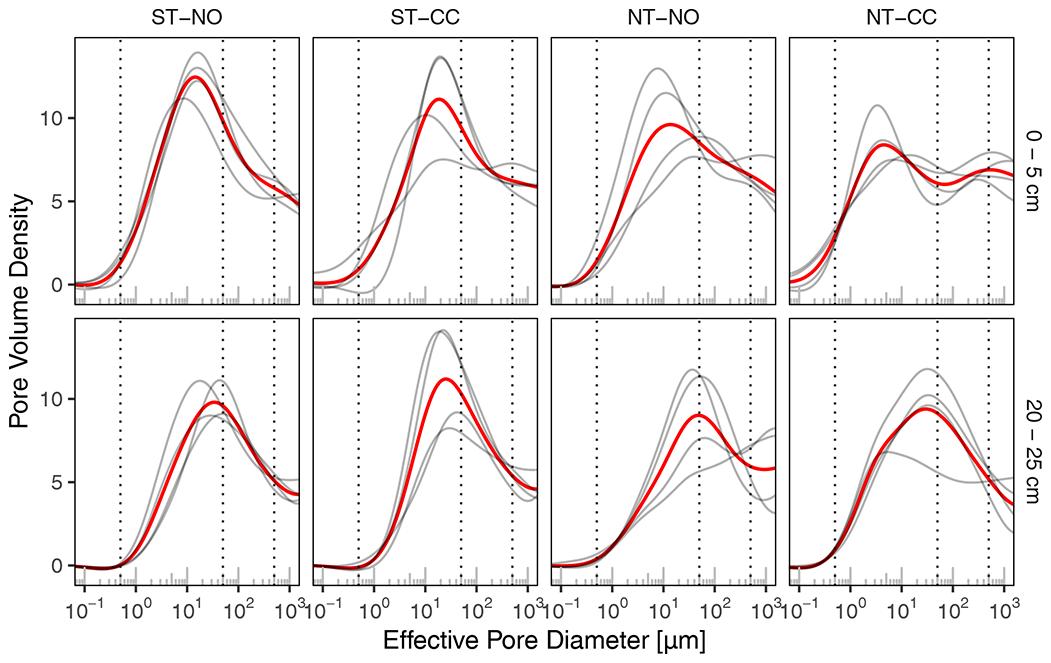
Figure A3Effective pore size distribution. Gray curves are individual soil core measurements, and thick red curves are the treatment means. Vertical dotted lines indicate pore diameter sizes of 0.5, 50, and 500 µm.
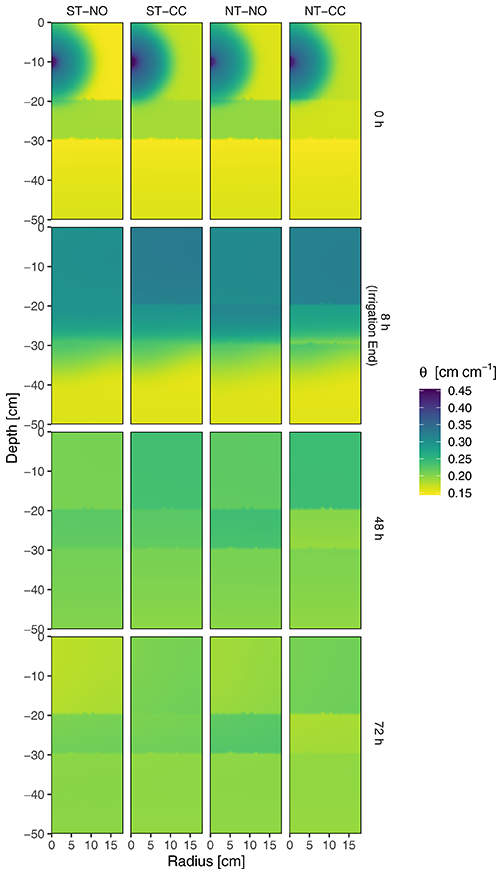
Figure A4Soil water content distribution in the model domain at selected times during and after irrigation (treatment means).
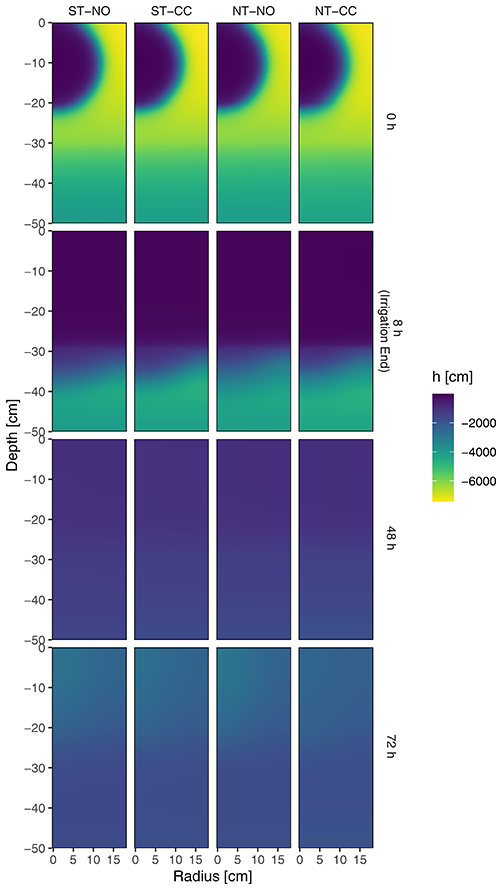
Figure A5Hydraulic head distribution in the model domain at selected times during and after irrigation (treatment means).
Table B1Tukey's HSD test comparison of means for soil hydraulic properties. p values <0.15 are shown using bold font, and p values <0.05 are shown using italic font. LCL and UCL are lower and upper control intervals, respectively.
| CC | Cover crop |
| HCF | Hydraulic conductivity function |
| NT | No till |
| PAW | Plant-available water content |
| PSD | Pore size distribution |
| ST | Standard till |
| WRC | Water retention curve |
| Ks | Saturated hydraulic conductivity |
| θFC | Volumetric water content at field capacity |
| θPWP | Volumetric water content at permanent |
| wilting point (−15 MPa suction) | |
| ρb | Bulk density |
| h | Negative water suction () |
| K | Hydraulic conductivity |
| θ | Volumetric water content |
| ψ | Matric potential |
The data and processing code used in this study are available at https://doi.org/10.5281/zenodo.5974038 (Araya, 2022).
All co-authors contributed to the study design. Sampling was carried out by SNA and TAG. Soil analysis and modeling were carried out by SNA with supervision from TAG. SNA prepared the paper with contributions from all co-authors.
The contact author has declared that neither they nor their co-authors have any competing interests.
Publisher’s note: Copernicus Publications remains neutral with regard to jurisdictional claims in published maps and institutional affiliations.
This work was made possible with support from the Conservation Agriculture Systems Project and the California Department of Water Resources.
This research has been supported by the California Department of Water Resources (grant no. 4600012156).
This paper was edited by Jan Vanderborght and reviewed by two anonymous referees.
Abdalla, M., Hastings, A., Cheng, K., Yue, Q., Chadwick, D., Espenberg, M., Truu, J., Rees, R. M., and Smith, P.: A critical review of the impacts of cover crops on nitrogen leaching, net greenhouse gas balance and crop productivity, Glob. Chang. Biol., 25, 2530–2543, https://doi.org/10.1111/gcb.14644, 2019.
Abdollahi, L., Schjønning, P., Elmholt, S., and Munkholm, L. J.: The effects of organic matter application and intensive tillage and traffic on soil structure formation and stability, Soil Tillage Res., 136, 28–37, https://doi.org/10.1016/j.still.2013.09.011, 2014.
Allen, R. G., Pereira, L. S., Raes, D., and Smith, M.: Crop evapotranspiration: Guidelines for computing crop water requirements – FAO Irrigation and drainage paper 56, Food and Agriculture Organization of the United Nations, Rome, Italy, ISBN 92-5-104219-5, 1998.
Alletto, L., Pot, V., Giuliano, S., Costes, M., Perdrieux, F., and Justes, E.: Temporal variation in soil physical properties improves the water dynamics modeling in a conventionally-tilled soil, Geoderma, 243–244, 18–28, https://doi.org/10.1016/j.geoderma.2014.12.006, 2015.
Alvarez, R. and Steinbach, H. S.: A review of the effects of tillage systems on some soil physical properties, water content, nitrate availability and crops yield in the Argentine Pampas, Soil Tillage Res., 104, 1–15, https://doi.org/10.1016/J.STILL.2009.02.005, 2009.
Angers, D. A. and Caron, J.: Plant-induced Changes in Soil Structure: Processes and Feedbacks, Biogeochemistry, 42, 55–72, https://doi.org/10.1023/A:1005944025343, 1998.
Araya, S.: Long-Term Impact of Cover Crop and Reduced Disturbance Tillage on Soil Pore Size Distribution and Soil Water Storage (v1.0), Zenodo [data set and code], https://doi.org/10.5281/zenodo.5974038, 2022.
Ashworth, A. J., DeBruyn, J. M., Allen, F. L., Radosevich, M., and Owens, P. R.: Microbial community structure is affected by cropping sequences and poultry litter under long-term no-tillage, Soil Biol. Biochem., 114, 210–219, https://doi.org/10.1016/J.SOILBIO.2017.07.019, 2017.
Assouline, S. and Or, D.: The concept of field capacity revisited: Defining intrinsic static and dynamic criteria for soil internal drainage dynamics, Water Resour. Res., 50, 4787–4802, https://doi.org/10.1002/2014WR015475, 2014.
Bacq-Labreuil, A., Crawford, J., Mooney, S. J., Neal, A. L., and Ritz, K.: Cover crop species have contrasting influence upon soil structural genesis and microbial community phenotype, Sci. Rep., 9, 7473, https://doi.org/10.1038/s41598-019-43937-6, 2019.
Baker, J. B., Southard, R. J., and Mitchell, J. P.: Agricultural Dust Production in Standard and Conservation Tillage Systems in the San Joaquin Valley, J. Environ. Qual., 34, 1260, https://doi.org/10.2134/jeq2003.0348, 2005.
Basche, A. and DeLonge, M.: The Impact of Continuous Living Cover on Soil Hydrologic Properties: A Meta-Analysis, Soil Sci. Soc. Am. J., 81, 1179, https://doi.org/10.2136/sssaj2017.03.0077, 2017.
Basche, A. D., Archontoulis, S. V., Kaspar, T. C., Jaynes, D. B., Parkin, T. B., and Miguez, F. E.: Simulating long-term impacts of cover crops and climate change on crop production and environmental outcomes in the Midwestern United States, Agr. Ecosyst. Environ., 218, 95–106, https://doi.org/10.1016/J.AGEE.2015.11.011, 2016a.
Basche, A. D., Kaspar, T. C., Archontoulis, S. V., Jaynes, D. B., Sauer, T. J., Parkin, T. B., and Miguez, F. E.: Soil water improvements with the long-term use of a winter rye cover crop, Agr. Water Manage., 172, 40–50, https://doi.org/10.1016/j.agwat.2016.04.006, 2016b.
Blanco-Canqui, H. and Ruis, S. J.: No-tillage and soil physical environment, Geoderma, 326, 164–200, https://doi.org/10.1016/j.geoderma.2018.03.011, 2018.
Büchi, L., Wendling, M., Amossé, C., Necpalova, M., and Charles, R.: Importance of cover crops in alleviating negative effects of reduced soil tillage and promoting soil fertility in a winter wheat cropping system, Agric. Ecosyst. Environ., 256, 92–104, https://doi.org/10.1016/j.agee.2018.01.005, 2018.
Burr-Hersey, J. E., Mooney, S. J., Bengough, A. G., Mairhofer, S., and Ritz, K.: Developmental morphology of cover crop species exhibit contrasting behaviour to changes in soil bulk density, revealed by X-ray computed tomography, PLoS One, 12, e0181872, https://doi.org/10.1371/journal.pone.0181872, 2017.
Duchene, O., Vian, J.-F., and Celette, F.: Intercropping with legume for agroecological cropping systems: Complementarity and facilitation processes and the importance of soil microorganisms. A review, Agr. Ecosyst. Environ., 240, 148–161, https://doi.org/10.1016/J.AGEE.2017.02.019, 2017.
Durner, W.: Hydraulic conductivity estimation for soils with heterogeneous pore structure, Water Resour. Res., 30, 211–223, https://doi.org/10.1029/93WR02676, 1994.
Ekschmitt, K., Kandeler, E., Poll, C., Brune, A., Buscot, F., Friedrich, M., Gleixner, G., Hartmann, A., Kästner, M., Marhan, S., Miltner, A., Scheu, S., and Wolters, V.: Soil-carbon preservation through habitat constraints and biological limitations on decomposer activity, J. Plant Nutr. Soil Sci., 171, 27–35, https://doi.org/10.1002/jpln.200700051, 2008.
Faunt, C. C.: Alluvial Boundary of California's Central Valley [Map]. Scale Not Given, https://water.usgs.gov/lookup/getspatial?pp1766_Alluvial_Bnd (last access: 3 August 2022), 2012.
Fernandez, A. L., Sheaffer, C. C., Wyse, D. L., Staley, C., Gould, T. J., and Sadowsky, M. J.: Structure of bacterial communities in soil following cover crop and organic fertilizer incorporation, Appl. Microbiol. Biotechnol., 100, 9331–9341, https://doi.org/10.1007/s00253-016-7736-9, 2016.
Finney, D. M., Buyer, J. S., and Kaye, J. P.: Living cover crops have immediate impacts on soil microbial community structure and function, J. Soil Water Conserv., 72, 361–373, https://doi.org/10.2489/jswc.72.4.361, 2017.
Gao, L., Becker, E., Liang, G., Houssou, A. A., Wu, H., Wu, X., Cai, D., and Degré, A.: Effect of different tillage systems on aggregate structure and inner distribution of organic carbon, Geoderma, 288, 97–104, https://doi.org/10.1016/j.geoderma.2016.11.005, 2017.
Gao, L., Wang, B., Li, S., Wu, H., Wu, X., Liang, G., Gong, D., Zhang, X., Cai, D., and Degré, A.: Soil wet aggregate distribution and pore size distribution under different tillage systems after 16 years in the Loess Plateau of China, Catena, 173, 38–47, https://doi.org/10.1016/j.catena.2018.09.043, 2019.
González-Sánchez, E. J., Kassam, A., Basch, G., Streit, B., Holgado-Cabrera, A., and Triviño-Tarradas, P.: Conservation Agriculture and its contribution to the achievement of agri-environmental and economic challenges in Europe, AIMS Agr. Food, 1, 387–408, https://doi.org/10.3934/agrfood.2016.4.387, 2016.
Green, T. R., Ahuja, L. R., and Benjamin, J. G.: Advances and challenges in predicting agricultural management effects on soil hydraulic properties, Geoderma, 116, 3–27, https://doi.org/10.1016/S0016-7061(03)00091-0, 2003.
Greenland, D. J.: Soil Damage by Intensive Arable Cultivation: Temporary or Permanent?, Philos. T. Roy. Soc. B, 281, 193–208, https://doi.org/10.1098/rstb.1977.0133, 1977.
Grossman, R. B. and Reinsch, T. G.: Bulk Density and Linear Extensibility, in: Methods of Soil Analysis, Part 4 – Physical Methods, edited by: Dane, J. H. and Topp, G. C., Soil Science Society of America, Madison, Wisconsin, 201–228, https://doi.org/10.2136/sssabookser5.4.c9, 2002.
Hillel, D.: Environmental Soil Physics, Academic Press, San Diego, CA, ISBN 9780080544151, 1998.
Hudson, B. D.: Soil organic matter and available water capacity, J. Soil Water Conserv., 49, 189–194, 1994.
Janzen, H. H.: Beyond carbon sequestration: soil as conduit of solar energy, Eur. J. Soil Sci., 66, 19–32, https://doi.org/10.1111/ejss.12194, 2015.
Janzen, H. H., Janzen, D. W., and Gregorich, E. G.: The “soil health” metaphor: illuminating or illusory?, Soil Biol. Biochem., 108167, https://doi.org/10.1016/j.soilbio.2021.108167, 2021.
Jarvis, N. J.: A review of non-equilibrium water flow and solute transport in soil macropores: principles, controlling factors and consequences for water quality, Eur. J. Soil Sci., 58, 523–546, https://doi.org/10.1111/j.1365-2389.2007.00915.x, 2007.
Johnson, A. M. M. and Hoyt, G. D. D.: Changes to the soil environment under conservation tillage, Horttechnology, 9, 380–393, https://doi.org/10.21273/HORTTECH.9.3.380, 1999.
Kassam, A., Friedrich, T., and Derpsch, R.: Global spread of Conservation Agriculture, Int. J. Environ. Stud., 76, 29–51, https://doi.org/10.1080/00207233.2018.1494927, 2019.
Kastanek, F. J. and Nielsen, D. R.: Description of Soil Water Characteristics Using Cubic Spline Interpolation, Soil Sci. Soc. Am. J., 65, 279, https://doi.org/10.2136/sssaj2001.652279x, 2001.
Klute, A.: Water Retention: Laboratory Methods, in: Methods of Soil Analysis: Part 1, Physical and Mineralogical Methods, 5.1, edited by: Klute, A., Madison, Wisconsin, USA, 635–662, https://doi.org/10.2136/sssabookser5.1.2ed.c26, 1986.
Lal, R., Reicosky, D. C., and Hanson, J. D.: Evolution of the plow over 10,000 years and the rationale for no-till farming, Soil Tillage Res., 93, 1–12, https://doi.org/10.1016/j.still.2006.11.004, 2007.
Lehmann, J. and Kleber, M.: The contentious nature of soil organic matter, Nature, 528, 60–68, https://doi.org/10.1038/nature16069, 2015.
Li, Y., Chang, S. X., Tian, L., and Zhang, Q.: Conservation agriculture practices increase soil microbial biomass carbon and nitrogen in agricultural soils: A global meta-analysis, Soil Biol. Biochem., 121, 50–58, https://doi.org/10.1016/j.soilbio.2018.02.024, 2018.
Liu, J., Macrae, M. L., Elliott, J. A., Baulch, H. M., Wilson, H. F., and Kleinman, P. J. A.: Impacts of Cover Crops and Crop Residues on Phosphorus Losses in Cold Climates: A Review, J. Environ. Qual., 48, 850–868, https://doi.org/10.2134/jeq2019.03.0119, 2019.
Madden, N. M., Southard, R. J., and Mitchell, J. P.: Conservation tillage reduces PM10 emissions in dairy forage rotations, Atmos. Environ., 42, 3795–3808, https://doi.org/10.1016/j.atmosenv.2007.12.058, 2008.
Mapa, R. B., Green, R. E., and Santo, L.: Temporal Variability of Soil Hydraulic Properties with Wetting and Drying Subsequent to Tillage, Soil Sci. Soc. Am. J., 50, 1133, https://doi.org/10.2136/sssaj1986.03615995005000050008x, 1986.
Martens, D. A.: Nitrogen cycling under different soil management systems, Adv. Agron., 70, 143–192, https://doi.org/10.1016/s0065-2113(01)70005-3, 2001.
Meurer, K., Barron, J., Chenu, C., Coucheney, E., Fielding, M., Hallett, P., Herrmann, A. M., Keller, T., Koestel, J., Larsbo, M., Lewan, E., Or, D., Parsons, D., Parvin, N., Taylor, A., Vereecken, H., and Jarvis, N.: A framework for modelling soil structure dynamics induced by biological activity, Glob. Chang. Biol., 26, 5382–5403, https://doi.org/10.1111/gcb.15289, 2020.
Mitchell, J. P.: Conservation agriculture: systems thinking for sustainable farming, Calif. Agr., 70, 53–55, 2016.
Mitchell, J. P., Klonsky, K. M., Miyao, E. M., and Hembree, K. J.: Conservation tillage tomato production in California's San Joaquin Valley, Agric. Nat. Resour., https://doi.org/10.3733/ucanr.8330, 2009.
Mitchell, J. P., Klonsky, K. M., Miyao, E. M., Aegerter, B. J., Shrestha, A., Munk, D. S., Hembree, K. J., Madden, N. M., and Turini, T. A.: Evolution of Conservation Tillage Systems for Processing Tomato in California's Central Valley, Horttechnology, 22, 617–626, 2012.
Mitchell, J. P., Shrestha, A., Horwath, W. R., Southard, R. J., Madden, N. M., Veenstra, J. J., and Munk, D. S.: Tillage and Cover Cropping Affect Crop Yields and Soil Carbon in the San Joaquin Valley, California, Agron. J., 107, 588, https://doi.org/10.2134/agronj14.0415, 2015.
Mitchell, J. P., Carter, L. M., Reicosky, D. C., Shrestha, A., Pettygrove, G. S., Klonsky, K. M., Marcum, D. B., Chessman, D., Roy, R., Hogan, P., and Dunning, L.: A history of tillage in California's Central Valley, Soil Tillage Res., 157, 52–64, https://doi.org/10.1016/j.still.2015.10.015, 2016a.
Mitchell, J. P., Shrestha, A., and Munk, D. S.: Cotton response to long-term no-tillage and cover cropping in the San Joaquin Valley, J. Cotton Sci., 20, 8–17, 2016b.
Mitchell, J. P., Shrestha, A., Dahlberg, J. A., Munk, D. S., and Hembree, K. J.: Prospect of No-till Planting of Sorghum with and without Cover Cropping in the San Joaquin Valley, Crop. Forage Turfgrass Manag., 2, 1–3, https://doi.org/10.2134/cftm2015.0208, 2016c.
Mitchell, J. P., Shrestha, A., Mathesius, K., Scow, K. M., Southard, R. J., Haney, R. L., Schmidt, R., Munk, D. S., and Horwath, W. R.: Cover cropping and no-tillage improve soil health in an arid irrigated cropping system in California's San Joaquin Valley, USA, Soil Tillage Res., 165, 325–335, https://doi.org/10.1016/j.still.2016.09.001, 2017.
Mitchell, J. P., Reicosky, D. C., Kueneman, E. A., Fisher, J., and Beck, D.: Conservation agriculture systems, CAB Rev. Perspect. Agr. Vet. Sci. Nutr. Nat. Resour., 14, 001, https://doi.org/10.1079/PAVSNNR201914001, 2019.
Moret, D. and Arrúe, J. L.: Dynamics of soil hydraulic properties during fallow as affected by tillage, Soil Tillage Res., 96, 103–113, https://doi.org/10.1016/j.still.2007.04.003, 2007.
Naab, J. B., Mahama, G. Y., Yahaya, I., and Prasad, P. V. V: Conservation Agriculture Improves Soil Quality, Crop Yield, and Incomes of Smallholder Farmers in North Western Ghana., Front. Plant Sci., 8, 996, https://doi.org/10.3389/fpls.2017.00996, 2017.
National Cooperative Soil Survey: National Cooperative Soil Survey Characterization Database, http://ncsslabdatamart.sc.egov.usda.gov/, last access: 8 January 2020.
Or, D., Leij, F. J., Snyder, V., and Ghezzehei, T. A.: Stochastic model for posttillage soil pore space evolution, Water Resour. Res., 36, 1641–1652, https://doi.org/10.1029/2000WR900092, 2000.
Palm, C., Blanco-Canqui, H., DeClerck, F., Gatere, L., and Grace, P.: Conservation agriculture and ecosystem services: An overview, Agr. Ecosyst. Environ., 187, 87–105, https://doi.org/10.1016/J.AGEE.2013.10.010, 2014.
Peña-Sancho, C., López, M. V., Gracia, R., and Moret-Fernández, D.: Effects of tillage on the soil water retention curve during a fallow period of a semiarid dryland, Soil Res., 55, 114, https://doi.org/10.1071/SR15305, 2016.
Pires, L. F., Cássaro, F. A. M., Reichardt, K., and Bacchi, O. O. S.: Soil porous system changes quantified by analyzing soil water retention curve modifications, Soil Tillage Res., 100, 72–77, https://doi.org/10.1016/j.still.2008.04.007, 2008.
Pires, L. F., Borges, J. A. R., Rosa, J. A., Cooper, M., Heck, R. J., Passoni, S., and Roque, W. L.: Soil structure changes induced by tillage systems, Soil Tillage Res., 165, 66–79, https://doi.org/10.1016/j.still.2016.07.010, 2017.
Pittelkow, C. M., Linquist, B. A., Lundy, M. E., Liang, X., van Groenigen, K. J., Lee, J., van Gestel, N., Six, J., Venterea, R. T., and van Kessel, C.: When does no-till yield more? A global meta-analysis, F. Crop. Res., 183, 156–168, https://doi.org/10.1016/J.FCR.2015.07.020, 2015.
R Core Team: R: A Language and Environment for Statistical Computing, version 3.6.0, https://www.r-project.org/, 2019.
Rasmussen, K. J.: Impact of ploughless soil tillage on yield and soil quality: A Scandinavian review, Soil Tillage Res., 53, 3–14, https://doi.org/10.1016/S0167-1987(99)00072-0, 1999.
Rath, D., Bogie, N., Deiss, L., Parikh, S. J., Wang, D., Ying, S., Tautges, N., Berhe, A. A., Ghezzehei, T. A., and Scow, K. M.: Synergy between compost and cover crops in a Mediterranean row crop system leads to increased subsoil carbon storage, SOIL, 8, 59–83, https://doi.org/10.5194/soil-8-59-2022, 2022.
Reicosky, D. C. and Allmaras, R. R.: Advances in Tillage Research in North American Cropping Systems, J. Crop Prod., 8, 75–125, https://doi.org/10.1300/J144v08n01_ 05, 2003.
Reicosky, D. C. and Forcella, F.: Cover crop and soil quality interactions in agroecosystems, J. Soil Water Conserv., 53, 224–229, 1998.
Sanz-Cobena, A., Lassaletta, L., Aguilera, E., Prado, A. del, Garnier, J., Billen, G., Iglesias, A., Sánchez, B., Guardia, G., Abalos, D., Plaza-Bonilla, D., Puigdueta-Bartolomé, I., Moral, R., Galán, E., Arriaga, H., Merino, P., Infante-Amate, J., Meijide, A., Pardo, G., Álvaro-Fuentes, J., Gilsanz, C., Báez, D., Doltra, J., González-Ubierna, S., Cayuela, M. L., Menéndez, S., Díaz-Pinés, E., Le-Noë, J., Quemada, M., Estellés, F., Calvet, S., van Grinsven, H. J. M., Westhoek, H., Sanz, M. J., Gimeno, B. S., Vallejo, A., and Smith, P.: Strategies for greenhouse gas emissions mitigation in Mediterranean agriculture: A review, Agr. Ecosyst. Environ., 238, 5–24, https://doi.org/10.1016/J.AGEE.2016.09.038, 2017.
Sastre, B., Marques, M. J., García-Díaz, A., and Bienes, R.: Three years of management with cover crops protecting sloping olive groves soils, carbon and water effects on gypsiferous soil, Catena, 171, 115–124, https://doi.org/10.1016/j.catena.2018.07.003, 2018.
Schaap, M. G., Leij, F. J., and van Genuchten, M. T.: Rosetta: A computer program for estimating soil hydraulic parameters with hierarchical pedotransfer functions, J. Hydrol., 251, 163–176, https://doi.org/10.1016/S0022-1694(01)00466-8, 2001.
Schmidt, M. W. I., Torn, M. S., Abiven, S., Dittmar, T., Guggenberger, G., Janssens, I. A., Kleber, M., Kogel-Knabner, I., Lehmann, J., Manning, D. A. C., Nannipieri, P., Rasse, D. P., Weiner, S., and Trumbore, S. E.: Persistence of soil organic matter as an ecosystem property, Nature, 478, 49–56, https://doi.org/10.1038/Nature10386, 2011.
Schwen, A., Bodner, G., Scholl, P., Buchan, G. D., and Loiskandl, W.: Temporal dynamics of soil hydraulic properties and the water-conducting porosity under different tillage, Soil Tillage Res., 113, 89–98, https://doi.org/10.1016/j.still.2011.02.005, 2011.
Shelton, D., Jasa, P., Brown, L., and Hirschi, M.: Water Erosion, in: Conservation Tillage Systems and Management, edited by: Ames, I., MidWest Plan Service, Iowa State University, MWPS-45, ISBN 0-089373-088-2, 2000.
Simunek, J., van Genuchten, M. T., and Sejna, M.: The HYDRUS Software Package for Simulating Two- and Three-Dimensional Movement of Water, Heat, and Multiple Solutes in Variably-Saturated Porous Media, Technical Manual, Version 2.0, https://www.pc-progress.com/downloads/Pgm_Hydrus3D2/HYDRUS3D Technical Manual.pdf (last access: 3 August 2022), 2012.
Steele, M., Coale, F., and Hill, R.: Winter Annual Cover Crop Impacts on No-Till Soil Physical Properties and Organic Matter, Soil Sci. Soc. Am. J., 76, 2164–2173, https://doi.org/10.2136/sssaj2012.0008, 2012.
Strudley, M., Green, T., and Ascough II, J.: Tillage effects on soil hydraulic properties in space and time: State of the science, Soil Tillage Res., 99, 4–48, https://doi.org/10.1016/j.still.2008.01.007, 2008.
Tautges, N. E., Chiartas, J. L., Gaudin, A. C. M., O'Geen, A. T., Herrera, I., and Scow, K. M.: Deep soil inventories reveal that impacts of cover crops and compost on soil carbon sequestration differ in surface and subsurface soils, Glob. Chang. Biol., 25, 3753–3766, https://doi.org/10.1111/gcb.14762, 2019.
Tavares Filho, J. and Tessier, D.: Characterization of soil structure and porosity under long-term conventional tillage and no-tillage systems, Rev. Bras. Ciência do Solo, 33, 1837–1844, https://doi.org/10.1590/S0100-06832009000600032, 2009.
Twarakavi, N. K. C., Sakai, M., and Simunek, J.: An objective analysis of the dynamic nature of field capacity, Water Resour. Res., 45, 1–9, https://doi.org/10.1029/2009WR007944, 2009.
Upadhyaya, S. K., Lancas, K. P., Santos-Filho, A. G., and Raghuwanshi, N. S.: One-pass tillage equipment outstrips conventional tillage method, Calif. Agric., 55, 44–47, https://doi.org/10.3733/ca.v055n05p44, 2001.
van Genuchten, M. T.: A Closed-form Equation for Predicting the Hydraulic Conductivity of Unsaturated Soils, https://doi.org/10.2136/sssaj1980.03615995004400050002x, 1980.
Veenstra, J. J., Horwath, W. R., Mitchell, J. P., and Munk, D. S.: Conservation tillage and cover cropping influence soil properties in SanJoaquin Valley cotton-tomato crop, Calif. Agr., 60, 146–153, 2006.
Veenstra, J. J., Horwath, W. R., and Mitchell, J. P.: Tillage and Cover Cropping Effects on Aggregate-Protected Carbon in Cotton and Tomato, Soil Sci. Soc. Am. J., 71, 362, https://doi.org/10.2136/sssaj2006.0229, 2007.
Veihmeyer, F. J. and Hendrickson, A. H.: The moisture equivalent as a measure of the field capacity of soils, Soil Sci., 32, 181–193, https://doi.org/10.1097/00010694-193109000-00003, 1931.
Veloso, M. G., Angers, D. A., Tiecher, T., Giacomini, S., Dieckow, J., and Bayer, C.: High carbon storage in a previously degraded subtropical soil under no-tillage with legume cover crops, Agr. Ecosyst. Environ., 268, 15–23, https://doi.org/10.1016/j.agee.2018.08.024, 2018.
Vereecken, H., Schnepf, A., Hopmans, J. W., Javaux, M., Or, D., Roose, T., Vanderborght, J., Young, M. H., Amelung, W., Aitkenhead, M., Allison, S. D., Assouline, S., Baveye, P., Berli, M., Bruggemann, N., Finke, P., Flury, M., Gaiser, T., Govers, G., Ghezzehei, T., Hallett, P., Hendricks Franssen, H. J., Heppell, J., Horn, R., Huisman, J. A., Jacques, D., Jonard, F., Kollet, S., Lafolie, F., Lamorski, K., Leitner, D., McBratney, A., Minasny, B., Montzka, C., Nowak, W., Pachepsky, Y. A., Padarian, J., Romano, N., Roth, K., Rothfuss, Y., Rowe, E. C., Schwen, A., Simunek, J., Tiktak, A., Van Dam, J., van der Zee, S. E. A. T. M., Vogel, H. J., Vrugt, J. A., Wohling, T., and Young, I. M.: Modeling Soil Processes: Review, Key Challenges, and New Perspectives, Vadose Zo. J., 15, 1–57, https://doi.org/10.2136/vzj2015.09.0131, 2016.
Villamil, M. B., Bollero, G. A., Darmody, R. G., Simmons, F. W., and Bullock, D. G.: No-Till Corn/Soybean Systems Including Winter Cover Crops, Soil Sci. Soc. Am. J., 70, 1936, https://doi.org/10.2136/sssaj2005.0350, 2006.
Vrugt, J. A., van Wijk, M. T., Hopmans, J. W., and Šimunek, J.: One-, two-, and three-dimensional root water uptake functions for transient modeling, Water Resour. Res., 37, 2457–2470, https://doi.org/10.1029/2000WR000027, 2001.
Zuber, S. M. and Villamil, M. B.: Meta-analysis approach to assess effect of tillage on microbial biomass and enzyme activities, Soil Biol. Biochem., 97, 176–187, https://doi.org/10.1016/j.soilbio.2016.03.011, 2016.
- Abstract
- Introduction
- Methods
- Results and discussion
- Conclusions
- Appendix A: Individual samples' measurement curves and supplemental figures
- Appendix B: Statistical comparison of treatments
- Appendix C: List of acronyms and symbols
- Code and data availability
- Author contributions
- Competing interests
- Disclaimer
- Acknowledgements
- Financial support
- Review statement
- References