the Creative Commons Attribution 4.0 License.
the Creative Commons Attribution 4.0 License.
 | 12 Jan 2022
Phosphorus dynamics during early soil development in a cold desert: insights from oxygen isotopes in phosphate
Zuzana Frkova
Chiara Pistocchi
Yuliya Vystavna
Katerina Capkova
Jiri Dolezal
Federica Tamburini
At the early stages of pedogenesis, the dynamics of phosphorus (P) in soils are controlled by microbial communities, the physicochemical properties of the soil and the environmental conditions. While various microorganisms involved in carrying out biogeochemical processes have been identified, little is known about the actual contribution of microbial processes, such as organic P hydrolysis and microbial P turnover, to P cycling. We thus focused on processes driven by microbes and how they affect the size and cycling of organic and inorganic soil P pools along a soil chronosequence in the Chamser Kangri glacier forefield (Western Himalayas). The rapid retreat of the glacier allowed us to study the early stages of soil formation under a cold arid climate. Biological P transformations were studied with the help of the isotopic composition of oxygen (O) in phosphate (δ18OP) coupled to sequential P fractionation performed on soil samples (0–5 cm depth) from four sites of different age spanning 0 to 100–150 years. The P bound to Ca, i.e., 1 M HCl-extractable P, still represented 95 % of the total P stock after approximately 100 years of soil development. Its isotopic composition was similar to the parent material at the most developed site. Primary phosphate minerals, possibly apatite, mostly comprised this pool. The δ18OP of the available P and the NaOH-extractable inorganic P instead differed from that of the parent material, suggesting that these pools underwent biological turnover. The δ18OP of the available P was mostly controlled by the microbial P, suggesting fast exchanges occurred between these two pools possibly fostered by repeated freezing–thawing and drying–rewetting cycles. The release of P from organic P becomes increasingly important with soil age, constituting one-third of the P flux to available P at the oldest site. Accordingly, the lighter isotopic composition of the P bound to Fe and Al oxides at the oldest site indicated that this pool contained phosphate released by organic P mineralization. Compared to previous studies on early pedogenesis under alpine or cold climate, our findings suggest a much slower decrease of the P-bearing primary minerals during the first 100 years of soil development under extreme conditions. However, they provide evidence that, by driving short-term P dynamics, microbes play an important role in controlling the redistribution of primary P into inorganic and organic soil P pools.
- Article
(957 KB) - Full-text XML
-
Supplement
(512 KB) - BibTeX
- EndNote


Microorganisms, together with climate, relief, parent material and time, drive the transformation of chemical elements, and thus nutrients like phosphorus (P), in the early stages of soil formation (Paul and Clark, 1989; Dietrich and Perron, 2006; Egli et al., 2011). The amount of inorganic nutrients released depends on carbon (C) availability, the mineral nutrient demand of the microorganisms and the nutrient content of the substrate (Mooshammer et al., 2014; Moorhead et al., 2012).
During the early stages of pedogenesis, inorganic P (Pi) from the parent material accounts for most of soil total P and progressively declines, while available P (i.e., readily utilized by plants or microorganisms) initially increases due to weathering of P-bearing minerals. In later stages of soil development, Pi decreases as P becomes sequestered in organic forms, occluded in secondary minerals or is lost via leaching/erosion (Walker and Syers, 1976). Organic P (Po) might rapidly become an important source of available P through the mediation of soil microorganisms (Egli et al., 2012). Wang et al. (2016) showed that Po mineralization was coupled to C mineralization in a glacier forefield and hypothesized that Po mineralization was driven by the microbial need of C. The microbial P pool could also contribute to available P via the turnover of microbial cells determined by biological (e.g., grazing) or abiotic (e.g., freezing–thawing) factors (Oberson and Joner, 2005). However, little is known about the actual contribution of microbial processes to P availability, especially during the early pedogenesis (Schulz et al., 2013).
The study of isotopic composition of oxygen (O) in phosphate (expressed here as δ18OP in the delta per mil notation) is a relatively new approach to trace P biogeochemical transformation processes overcoming limitations of approaches that depend on radioisotopes (Frossard et al., 2011). The P–O bond in phosphate is resistant to inorganic hydrolysis under natural temperature and pressure (O'Neil et al., 2003); therefore negligible O atom exchange occurs between phosphate and water without biological mediation (Tudge, 1960; Blake et al., 2001). Two main enzyme-mediated processes can alter the δ18OP. First, intracellular metabolism of Pi (reversible conversion of pyrophosphate to two phosphate ions mediated by inorganic pyrophosphatase) causes a complete and fast exchange of O atoms between phosphate and water molecules (Cohn, 1958; Blake et al., 2005). This results in a temperature-dependent equilibrium between O in the phosphate molecule and O of the intracellular water (Fricke et al., 1998). The δ18OP at equilibrium can be predicted, based on the measured isotopic ratio of oxygen in water (δ18OW) and temperature (Longinelli and Nuti, 1973; Kolodny et al., 1983; Chang and Blake, 2015). Therefore, the difference between the calculated equilibrium value and the measured δ18OP in an environmental sample can provide insights into the extent to which Pi has been cycled by the soil microorganisms through intracellular metabolic reactions (Davies et al., 2014). The second process is the hydrolysis of Po compounds by phosphohydrolase-mediated reactions (Liang and Blake, 2006). During Po hydrolysis, P–O bonds are cleaved, and one to two O atoms in the phosphate are replaced with O from the water with a specific fractionation factor (ε). The ε of main phosphohydrolase enzymes is often negative; e.g., alkaline phosphatases have an ε of −30 ‰ and acid phosphatases −10 ‰, resulting in depleted δ18OP in the released phosphate (Liang and Blake, 2009; von Sperber et al., 2015).
Glacier forefields are ideal sites to study the initial steps of soil formation as neighboring sites represent a soil chronosequence of different soil developmental stages. The general assumption is the space for time substitution, implying that each site along a glacier forefield chronosequence was subject to the same initial conditions and followed the same sequence of changes. We studied the early stages (0 to approximately 100–150 years) of soil development in a glacier forefield located in the Western Himalayas. In this environment, microorganisms may be subjected to drought, intense solar radiation (Blumthaler et al., 1997) and high temperature fluctuations (Janatková et al., 2013; Rehakova et al., 2011). Direct forefield observations on the role of microorganisms in P cycling are rare, especially under cold arid conditions (Prietzel et al., 2019). A study in the forefield of the Damma glacier in the Swiss Alps revealed that at the early stages of soil development (< 150 years), the microbial P was the main contributor to available P, which carried the isotopic equilibrium signature (Tamburini et al., 2012). More recently, it has been shown that under P-limiting conditions, instead, available P might show nonequilibrium lower δ18OP as a result of tight Po recycling through phosphohydrolase-mediated reactions (Pistocchi et al., 2020).
In this study, we applied a sequential fractionation method to identify loosely to strongly bound Pi and Po pools and analyzed the δ18OP values in these pools (Tamburini et al., 2018) to quantify biological P contribution to available P during early soil formation. Given that sequentially extracted P pools differ in their availability and turnover time (Helfenstein et al., 2020), we hypothesized that (1) the influence of biological cycling will increase with increasing soil age; (2) the main contribution to available P, at the early development stages, will derive from microbial P rather than Po mineralization; and (3) the contribution to available P from Po mineralization will increase with soil age as observed in an older chronosequence (Roberts et al., 2015). We will therefore (i) quantify sequentially extracted P pools and potential enzymatic activities linked to C, nitrogen (N) and P mineralization in soils along the forefield chronosequence and (ii) determine the δ18OP values of these pools, including Po, and compare them to the calculated isotopic equilibrium and expected isotopic values from Po hydrolysis, in order to assess their relative contribution to available P.
2.1 Study site description
The glacier forefield of Chamser Kangri was chosen as it has been studied within a long-term interdisciplinary research project (Dolezal et al., 2016). Since 2008, the local environmental conditions have been monitored, and changes in vegetation and relationships between vascular plants and soil microbial communities have been studied (Dvorský et al., 2015, 2011; Janatková et al., 2013; Řeháková et al., 2017; Rehakova et al., 2011; Čapková et al., 2016; Aschenbach et al., 2013). The Chamser Kangri glacier is located in Ladakh, northwest India, in the southwestern extension of the Tibetan Plateau on the northern slope of Chamser Kangri peak (6645 m a.s.l.), belonging to the Lungser range above the lake of Tso Moriri. The glaciated area of the Lungser range decreased from 61.2 km2 in 1969 to 55.4 and 50.4 km2 in the years 2003 and 2014, respectively. The estimated average retreat of the glacier based on the measurements in 39 valleys indicated 2.6 m yr−1 between 1969 and 2003 and almost double that between 2003 and 2014 (Schmidt and Nüsser, 2017). The climate in mountain areas of the Northwest Himalayan region, at an altitude of > 5000 m a.s.l., is arid and characterized by annual precipitation in the range of 50–150 mm yr−1, rarely affected by monsoonal precipitation (Customized Rainfall Information System (CRIS) – Hydromet Division, 2012–2016; Harris, 2006).
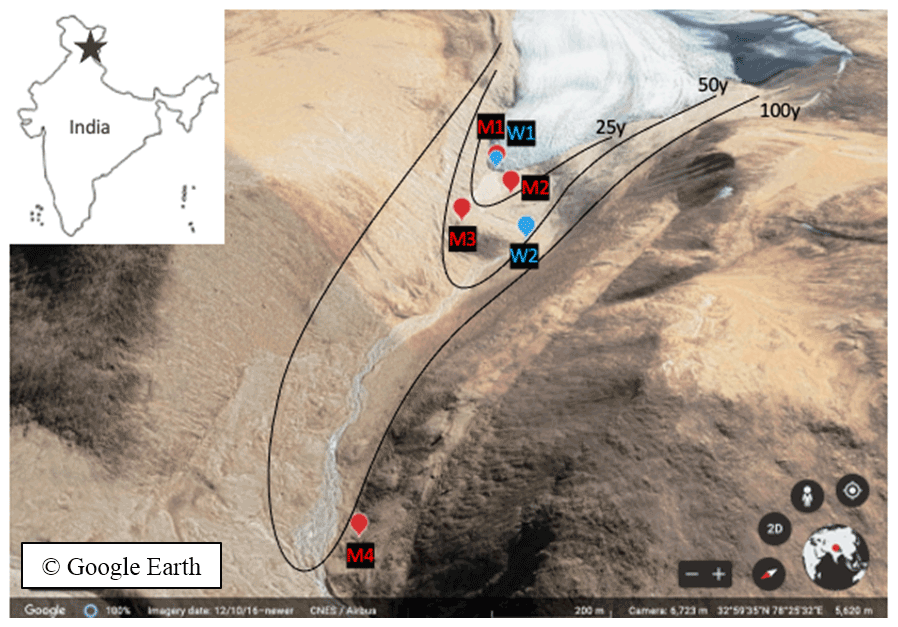
Figure 1Chamser Kangri glacier forefield chronosequence in India (adapted outline map from coloringhome.com) with sampling sites (M for soils and W for stream water and glacier snout) indicated on a satellite map (35∘57′55′′ N, 78∘24′25′′ E. © Google Earth, CNES/Airbus, 12 April 2016).
The soils had a coarse-grained structure, with 30 %–50 % of gravel and a pH between 7.8 and 8.5 (Rehakova et al., 2011). They can be classified as Leptosols according to the WRB (Anon, 2006). The parent rock consists mainly of metasedimentary siliceous rocks, the Tso Morari granite gneiss (Epard and Steck, 2008). The cold steppe vegetation cover is sparse, characterized by alpine grasslands mainly comprised of hemicryptophytes (Dvorský et al., 2015, 2011). The environmental conditions give rise to an extensive development of soil biological crusts dominated by cyanobacteria, which cover up to 40 % of the soil surface in this area and facilitate the initial establishment of vascular plants (Čapková et al., 2016; Řeháková et al., 2017). Cyanobacterial communities (Nostocales, Chroococcales and Oscillatoriales) were observed to be more abundant and species-rich in bare than vegetated soils (Řeháková et al., 2017). Together with Cyanobacteria, Gram-positive spore-forming bacteria (Actinobacteria and Firmicutes) were the main recorded bacterial clades (Řeháková et al., 2015).
2.2 Sampling description
Soil samples were collected along the frontal (M1–3) and lateral (M4) moraines of the Chamser Kangri glacier chronosequence (5711, 5710, 5700 and 5598 m a.s.l., M1–M4 respectively) from the A1 horizon. The age of the chosen soils was estimated to be < 1, 25, 50 and > 100 years, for M1 to M4, respectively, according to the slope and relative ice cover loss of 0.4 % km−2 yr−1 (Dvorský et al., 2015). Sites M1 and M2 had no vegetation cover, M2 and M3 had weakly and well-developed soil biological crusts, respectively, M3 was sparsely covered by Thylacospermum caespitosum (Caryophyllaceae family) plants and M4 had vegetation cover of Poa attenuata and T. caespitosum (Fig. S2). The average soil temperature (5 cm below surface) during the week of sampling (23/2017) was 0.18 ∘C, which corresponded to previous years' values (based on long-term data collected from installed microclimatic stations TOMST®; Fig. S1a). The average soil moisture for that week was around 0.25 cm3 cm−3 and was 25 %–42 % higher in respect to the corresponding period in the previous years (Fig. S1b). The sampling period represented the first moist period with above-zero temperatures after a long dry spell (Fig. S3).
A representative sample per site (M1–4; Fig. 1) was obtained by pooling ∼ 100 g of upper soil surface 0–5 cm, collected at 10 different spots, i.e., approximately 1 kg of soil.
To evaluate the hydrological and evaporation influence on water oxygen (δ18OW) and hydrogen (δ2HW) isotopic composition, samples of the glacier snout and the stream water (covered by ice) coming from the glacier (W1–2, Fig. 1) were taken. Samples were stored in zip-lock plastic bags/HDPE bottles and a thermo-bag to minimize biological activity during transport to the laboratory. Soils were sieved after removing the gravel material (2 mm mesh) and homogenized. Subsamples for cryogenic distillation, dry-weight measurement and enzymatic activities were taken and stored at 4 ∘C until processed.
2.3 General soil characteristics
The general soil characteristics were measured using standard laboratory procedures on the sieved samples. Soil pH was measured in 1:5 soil : water suspensions (ISO, 2005), total organic carbon and total nitrogen were measured on a TOC/TN analyzer (Formacs) and total P and other major elements were analyzed by ICP-OES after digestion by HNO3 and HClO4, although total P might be underestimated because of incomplete dissolution of silicates during the digestion (Kopacek et al., 2001). Soil texture was estimated based on particle size analysis (Afnor, 1994). Additionally, Fe pools were characterized by a sequential extraction (Claff et al., 2010) on soil samples collected in 2011 at sites M1 to M3 (no material was left from site M4). Bulk density of soil, used to calculate P stocks, was estimated using a pedotransfer function (BD = ; Abdelbaki, 2018), corresponding to eluvial deposits.
2.4 Extraction and purification of phosphate in different pools
Phosphorus was sequentially extracted from the soil following a modified Hedley fractionation, which was upscaled to obtain a sufficient amount of phosphate for isotopic analyses according to Tamburini et al. (2018a). Because of the large requirement of soil material (150–270 g), only one sample per site was extracted and purified. We estimated the variability introduced by the extraction-purification procedure to be approximately ±0.5 ‰ according to our field sample datasets, and we considered twice this value as a conservative threshold for significant differences (Pistocchi et al., 2017; Helfenstein et al., 2018; Tamburini et al., 2018b). Five different P pools were defined: resin- and hexanol-extractable P (bioavailable and microbial, respectively), NaOH-EDTA-extractable organic and inorganic P (NaOH-Po and NaOH-Pi; the latter is supposed to contain P bound to oxyhydroxides), and HCl-extractable P (HCl-P, targeting mostly P bound to Ca). Additionally, parent material samples were crushed and extracted directly with 1M HCl. To measure the δ18OP values, all soil extracts were purified following the protocols of Tamburini et al. (2010, 2018). The inorganic P concentration in each pool was determined by the malachite green method (Ohno and Zibilske, 1991). For some samples, the soil available was not enough to extract and purify enough P to measure δ18OP reliably for all pools. The δ18OP value is missing for the microbial P pool at sites M1 and M2 and for the NaOH-Pi pool at site M2 (see Fig. 2 and dataset in Frkova et al., 2021). Similarly, only the NaOH-Po pool of sample M4 contained enough material for δ18OP analyses.
2.5 Stable isotope analysis of oxygen in water and phosphates
Soil water was extracted by cryogenic vacuum extraction from one sample per sampling site (Orlowski et al., 2013). Analyses of stable isotopes in samples from glacier snout and glacier stream water (δ18OW and δ2HW) were performed using the L2120i laser instrument (Picarro Inc.) at the Institute of Hydrology, Slovakia. Hydrogen and oxygen isotope analyses were calibrated against the V-SMOW (Vienna Standard Mean Ocean Water) and were reported in the standard per mil notation. Typical precisions are better than ± 0.1 ‰ for δ18OW and ± 1.0 ‰ for δ2HW, respectively. The oxygen isotopes in soil water were measured by equilibration with CO2 (Seth et al., 2006) using a gas bench (Thermo Scientific Gas Bench II) connected to an isotope ratio mass spectrometer (Thermo Scientific Delta V plus) at the Stable Isotope Laboratory of the Geological Institute of the ETH Zurich. The system was calibrated against V-SMOW, SLAP (Standard Light Antarctic Precipitation) and GISP (Greenland Ice Sheet Precipitation). Reproducibility of repeated measurements of internal standards was better than ± 0.06 ‰.
To distinguish between evaporated and non-evaporated stream water sources, we used deuterium excess (d-excess) that is associated with kinetic isotopic fractionation and calculated as d-excess =δ2H–8×δ18O (Dansgaard, 1964). Samples with d-excess value < 10 suggest a deviation from the equilibrium fractionation conditions, indicating that the water may have been subject to evaporation (Dansgaard, 1964).
The stable oxygen isotope signature in silver phosphate was determined on a Vario Pyro Cube (Elementar, GmbH, Hanau, Germany) coupled in a continuous flow to an Isoprime 100 isotopic ratio mass spectrometer (Isoprime, Manchester, UK). Samples (250–400 µg) were run in duplicates whenever possible. Calibration and corrections for instrumental drifts were done by repeated measurements of a Ag3PO4 internal standard (with a value of +14.20 ‰) and benzoic acids IAEA 601 and 602. The δ18O values are expressed in the standard delta notation with respect to V-SMOW. Reproducibility of the measurements based on repeated measurements of the internal standard was within 0.4 ‰, and the average standard deviation of samples replicates analyses was 0.5 ‰.
2.6 Calculations of isotopic equilibrium values and box model
The equilibrium between oxygen in phosphate and water, given by intracellular P turnover by pyrophosphatase (PPase), was computed using the revised Chang and Blake equation (Chang and Blake, 2015):
where T is the temperature in degrees Celsius (∘C), and δ18OW is the isotopic composition of water in per mil notation (‰). To integrate the variability at different timescales, Eq. (1) was solved using values from two reference periods: (i) the 10 d preceding the sampling (from 6 June 2017, hereafter short-term equilibrium), using on-site soil temperatures and the δ18OW of soil water as the upper limit and δ18OW of June monthly rainfall adjusted for the altitudinal gradient as by Lone (2019) as lower limit; and (ii) a multi-annual average (hereafter long-term equilibrium), calculated using a temperature range spanning the mean soil temperature of warm months (years 2013–2017) and 0 ∘C, considering biological activity as negligible below 0 ∘C. We took a weighted average of seasonal precipitations, again adjusted for altitude (Lone, 2019) with or without the evaporative enrichment observed in soil water. In using rainfall δ18OW as a proxy for soil water isotopic composition, we assumed that soil water reflects a mass balance of seasonal precipitation short of an evaporative enrichment (Roberts et al., 2015; Sprenger et al., 2017).
The expected δ18OP values of phosphate mineralized from phosphomonoesters (PME, δ18OPME) were calculated as follows (Liang and Blake, 2006):
using the fractionation factor (ε) of −30 ‰ for hydrolysis of Po by alkaline phosphatases, as the pH range of studied soils is alkaline (Table 1), and a δ18OP-org value of +12.84 ‰. This value corresponds to the NaOH-Po pool in site M4, assuming similar values for the other soils. At younger sites, only microbes contribute to Po, while at site M3 and M4, residues from vascular plants, which usually are enriched in the heavy O isotope (Tamburini et al., 2018b; Pfahler et al., 2013), most likely also represent a source of organic P. Therefore, at younger sites, the δ18OP-org might be lower.
To determine the contribution to available P from the mineral, organic and microbial P pools, we estimated P fluxes and calculated the expected isotopic composition of the available P as follows (box model approach; Tamburini et al., 2012):
where fPmic is the P flux from microbial P turnover (mg P m−2 d−1, see below) and δ18OPmic the isotopic composition of the microbial P; fPo is the P flux from the mineralization of Po and δ18OPME the expected δ18OP values of released phosphate; and fPmineral is the flux from the HCl-P and δ18OPmineral the corresponding isotopic composition.
When the expected isotopic signatures matched the measured ones, we assumed P fluxes were estimated correctly. The flux from the hydrolysis of Po was estimated both from microbial respiration rates measured at 10 ∘C in the same area (comparable period of sampling, distance to the glacier, age; Katerina Capkova, personal communication, 2019) and from potential phosphatase activities (Phillips et al., 2005) (Table 2). The first approach assumes that the mineralized P is proportional to the organic C released as CO2, according to their stoichiometric ratio in nonliving organic matter (Achat et al., 2010; Bünemann, 2015):
where C–CO2 is the carbon released through soil respiration (µmol C m−2 d−1) adjusted for the average soil temperature during the sampling period according to Lloyd and Taylor (1994), the microbial efficiency was set at 0.4 (Murphy et al., 2003), C:Po is the molar ratio between the Po (NaOH-Po) and the soil organic carbon and AMP is the atomic mass of P.
The second approach yielded very high Po mineralization rates, and consequently the δ18OP expected of available P were strongly depleted compared to the measured values. This confirms that measured phosphomonoesterase activities reflected potential rather than actual rates (Bünemann, 2015). This second approach was, therefore, discarded.
To estimate P fluxes from microbial P (fPmic), we considered two different turnover times for microbial P: 15 d (as reported for microbial N and microbial P in P-depleted forest soil; Fisk et al., 1998; Schmidt et al., 2007; Pistocchi et al., 2018) and 70 d (as reported for microbial P in arable soils; Oehl et al., 2001). Finally, the flux from the HCl-P (fPmineral) was estimated by dividing the difference in stock concentrations by the difference in age of sites M4 and M1, as in Tamburini et al. (2012).
To account for uncertainties introduced with calculations, the mean and standard deviation of the expected isotopic signatures were obtained with a Monte Carlo error propagation simulation (Anderson, 1976). Calculations were repeated 10 million times by varying the variables (δ18O and P fluxes) according to their mean and standard deviation from analytical replicates. When the δ18OP of microbial P was missing (site M1 and M2), we used the entire range of values measured at sites M3 and M4. The used range (5.2 ‰) encompasses half of the natural occurring variation of δ18OP of soil microbial P from very different temperate and tropical ecosystems (+11.5 ‰ to +20.6 ‰; Tamburini et al., 2018).
2.7 Soil enzyme activities
To understand the regulation of enzyme activity in our soil chronosequence, we assessed five enzymes involved in mineralization of organic C, N and P (β-glucosidase, cellobiosidase, chitinase, leucine aminopeptidase and acid/alkaline phosphatase) (Marx et al., 2001; Bárta et al., 2014). Briefly, 0.5 g of soil was homogenized in 10 mL of MQ water using an IKA ULTRA-TURRAX T 10 homogenizer (IKA-Werke GmbH & Co. KG, Germany). Soil suspensions of 200 µL were transferred to a 96-well microplate in four analytical replicates. Then 50 µL of corresponding labeled substrate according to the soil enzyme (4-methylumbelliferyl-β-D-glucopyranoside, 4-methylumbelliferyl-N-cellobiopyranoside, 4-methylumbelliferyl-N-acetglucosaminide, L-leucine-7-amido-4-methylcoumarin or 4-methylumbelliferyl-phosphate) was added. Microplates were incubated at 30 ∘C. Fluorescence time-related measurements were performed after 30, 90 and 150 min on an INFINITE F200 (TECAN, Crailsheim, Germany) microplate reader using the excitation and emission wavelength of 365 and 450 nm, respectively. Enzyme efficiencies were calculated as enzyme activities in nanomoles per hour per gram of soil dry weight (nmol h−1 g−1), using an eight-point calibration curve.
3.1 General soil characteristics
Particle size analysis revealed all forefield soils to be sandy, with 78.0 %–85.5 % of sand (Table 1). M1 had the highest portion of clay, silt and fine sand, 4.1 %, 17.8 % and 58.6 %, respectively. The soil at the M3 site was the poorest in clay, with only 0.5 %. The estimated bulk density ranged between 1.4 and 1.7 Mg m−3 from the oldest soil to the youngest, respectively. The total organic carbon concentration increased with soil age, from 0.6 g kg−1 in the youngest soil M1 to 21.7 g kg−1 at M4. The soil N content was low in the young soils at M1–M3, ranging from 0.03 to 0.6 mg kg−1 and was higher at M4 with 2.4 mg kg−1. The total P did not show a particular trend along the chronosequence, ranging from 0.72 to 0.93 g kg−1, with the lowest content at M2 and highest at M3.
The molar C:N ratio was relatively constant along the chronosequence, averaging 9, except at the youngest site M1, where total nitrogen concentration was very low and the C:N ratio the highest (Table 1). The C:Po and N:Po molar ratios increased along the chronosequence from 527 to 932 and from 24 to 86, respectively. This increase was greater between 0 and 25 years (M1 and M2) and 50 and 100 years (M3 and M4).
The soil pH gradually decreased from 8.7 at the youngest site M1 to 7.7 at the oldest site M4.
Table 1General characteristics of the soil top 5 cm along the glacier forefield chronosequence (n=3): soil age, texture, bulk density, pH, nutrient content, stoichiometric ratios, soil P pools and enzyme activities.
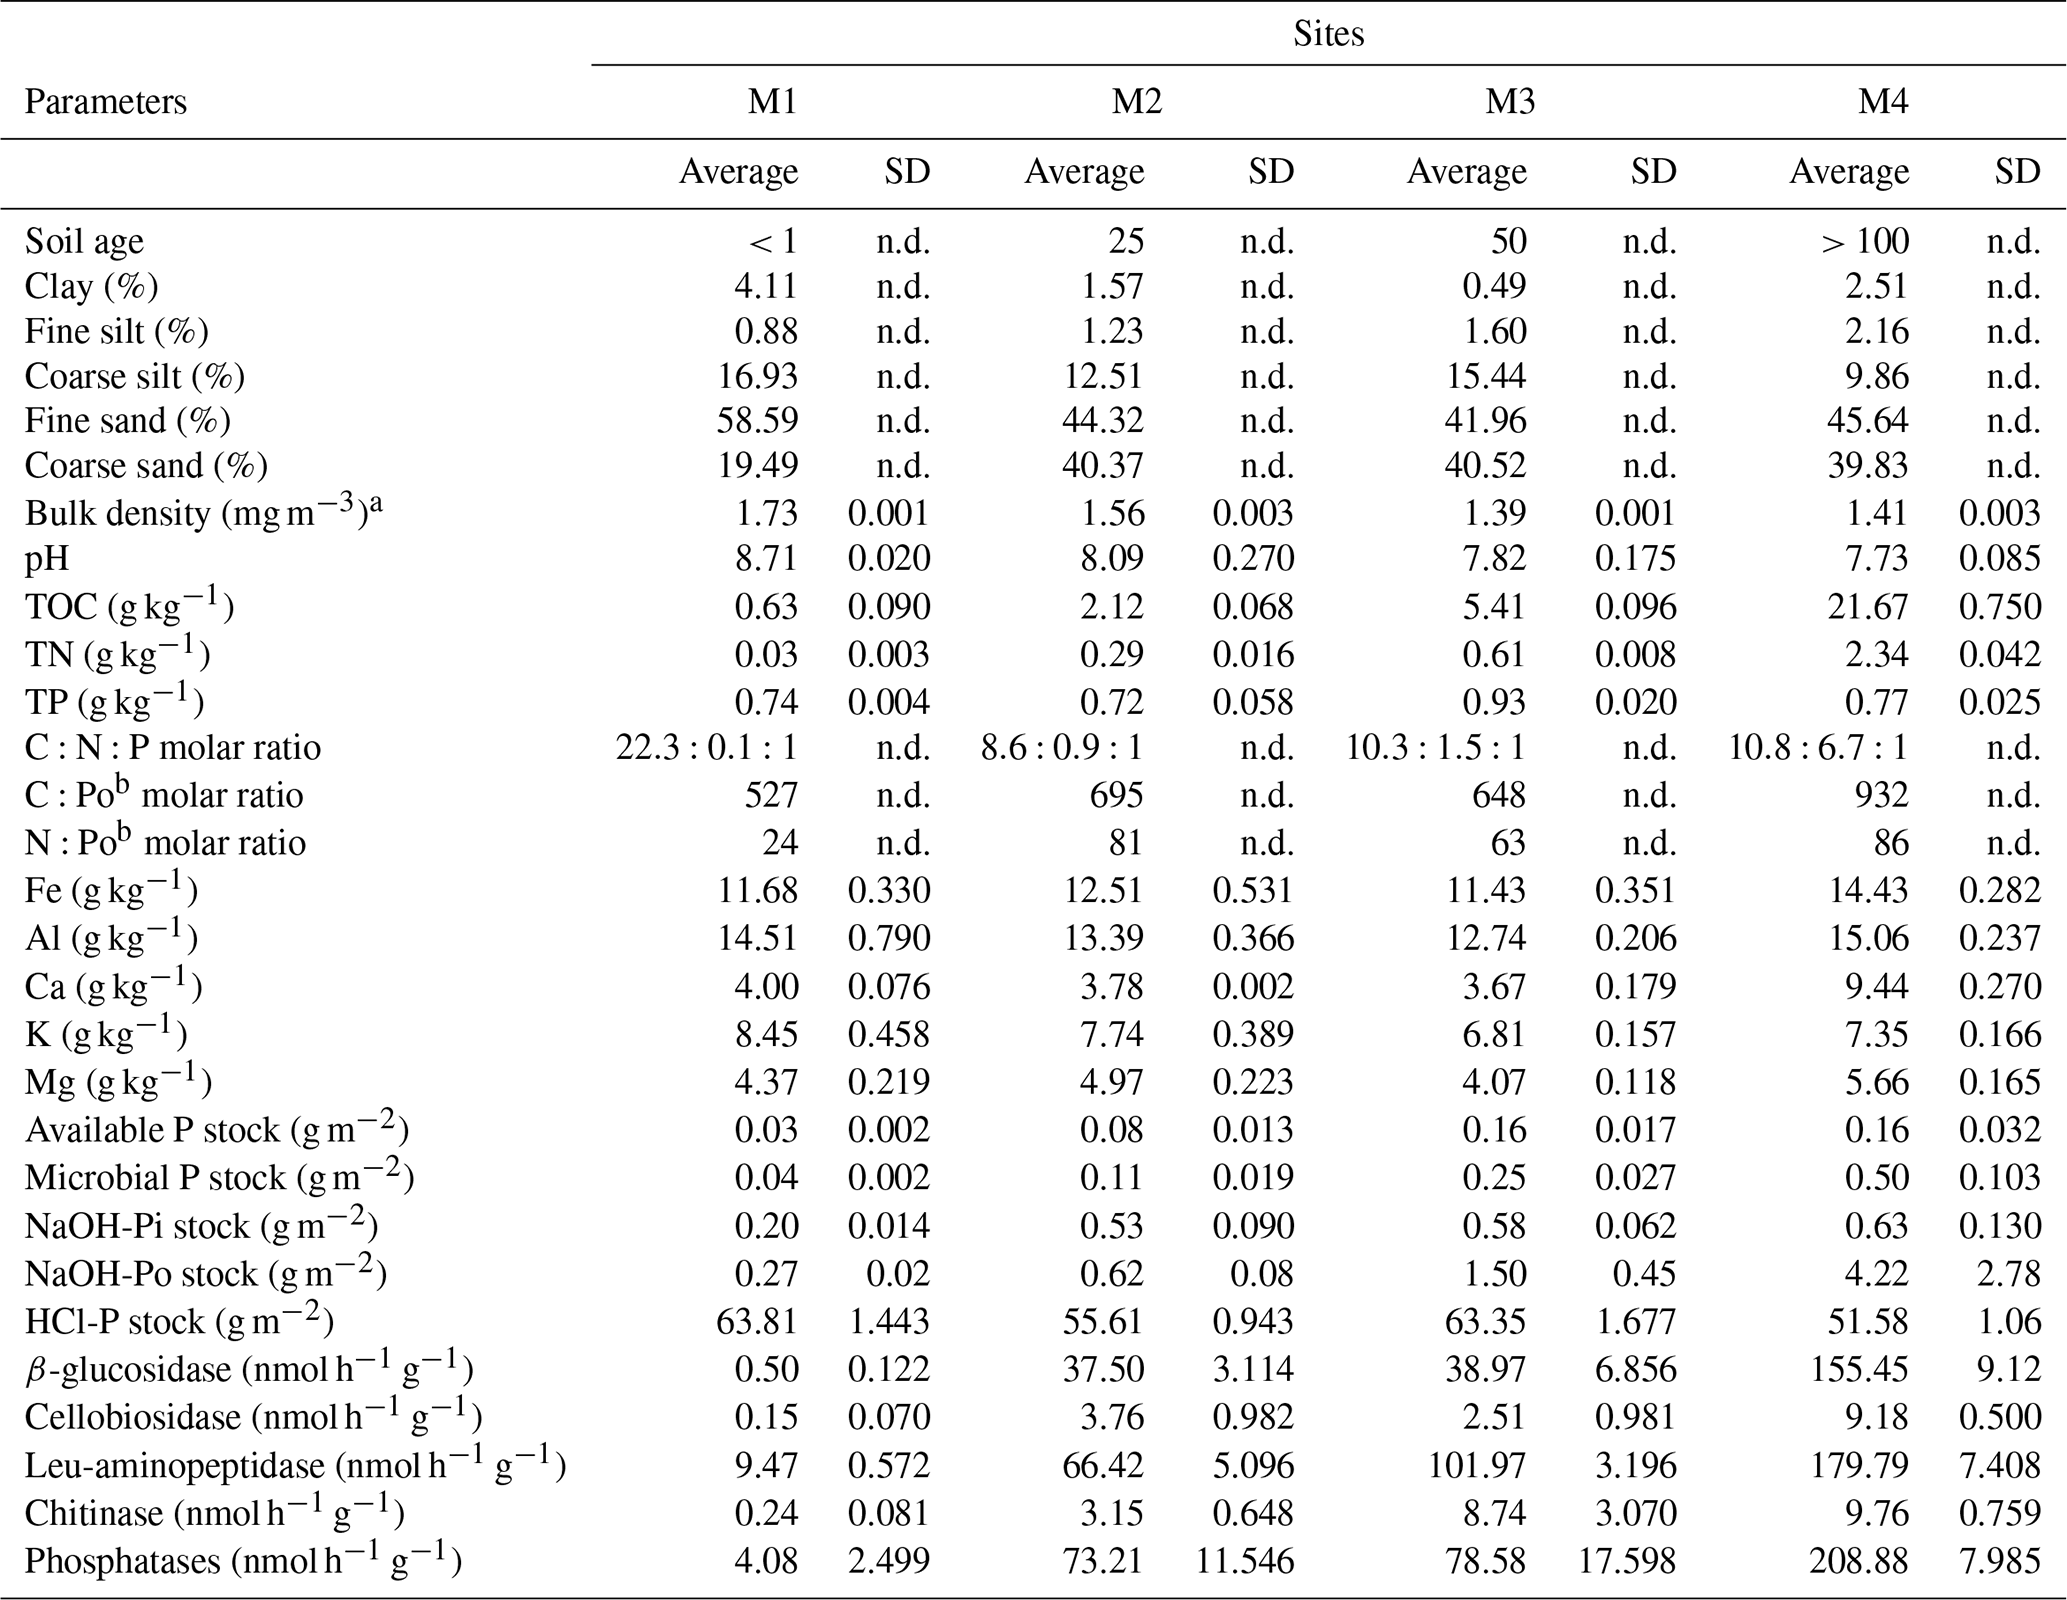
a Derived according to Abdelbaki (2018). b The Po is the NaOH-EDTA-extractable Po. n.d. = not determined.
3.2 Enzyme activity
The activity of all enzymes involved in C, N and P mineralization increased with site age (R2=0.91, 0.97 and 0.88 respectively; Tables 1, S2). The sum of the C-decomposing (β-glucosidase and cellobiosidase) and N-decomposing enzymes (leucine aminopeptidase and chitinase) was positively correlated with TOC and TN, respectively (R2=0.97 and 0.93). Phosphatase activities were positively correlated with activities of other enzymes and several soil characteristics (TOC, TN, fine silt content, total P, Ca, Fe and Mg). The activities increased with soil age and were inversely correlated with the HCl-extractable P and positively with all other P pools (Table S2). Overall, the lowest activity was measured for chitinase and cellobiosidase enzymes responsible for the hydrolysis of glycosidic bonds in chitin and cellulose, respectively, ranging from 0.2 to 9.8 nmol h−1 per gram of soil. The highest enzyme activity was measured for phosphatases, with 208.9 nmol h−1 g−1 at M4. Despite the increasing activity from less to more developed soils, very similar activities were observed at M2 and M3 for β-glucosidase and phosphatases, enzymes responsible for the hydrolysis of glucose from cellobiose, and for phosphate from phosphosaccharides, nucleotides and phospholipids, respectively (Table 1).
3.3 Stable isotopes in glacier snout, stream and soil water and isotopic equilibrium
The isotopic values at the glacier snout were −15.8 ‰ for δ18OW and −116.3 ‰ for δ2HW and −12.4 ‰ for δ18OW and −94.3 ‰ for δ2HW in the glacier stream water. The d-excess at the glacier snout was 10.1 %, suggesting that there was no evaporation bias. However, d-excess for the stream water was 4.9 %, which is indicative of a strong evaporation signal. The δ18OW values of the soil water from the four sites were variably enriched compared to the glacier snout. They ranged from −12.6 ‰ for site M1, located the glacier snout, to around −3.0 ‰ and −5.6 ‰ for sites M2–M3 and M4, respectively, more distant from the retreating glacier (Table 2).
The δ18OP(eq) values expected at equilibrium (Eq. 1) ranged from +9.8 ‰ to +23.4 ‰ for the short-term equilibrium and from +9.0 ‰ to +23.4 ‰ for the long-term equilibrium (Table 2). The upper range of the isotopic equilibrium varied according to the δ18OW values of the soil water and was therefore significantly higher at the intermediate sites M2–M3 than that at sites M1 and M4, due to heavier δ18OW (Table 2).
3.4 Phosphorus soil pools concentrations and their oxygen isotopic value
The sequentially extracted P pools are shown in Table S1. The HCl-P pool accounted for 95.1 % to 99.5 % of total P (spanning 643.3 to 909.7 mg kg−1). The concentrations of the other pools were low and increased with soil age. The available P ranged between 0.3 and 2.3 mg P kg−1 (0.1 % to 0.3 % of total P) and the microbial P between 0.4 and 7.1 mg P kg−1 (0.1 % to 0.9 % of total P), and the NaOH-Pi increased from 2.3 to 9.0 mg P kg−1 (0.3 % to 1.2 % of total P) and NaOH-Po from 3.1 to 60.0 mg P kg−1 (0.4 % to 7.8 % of total P).
The δ18OP of the available P ranged from +4.66 ‰ at site M1 to +8.90 ‰ at site M3. The isotopic value of the microbial P was higher compared to the available P and equal to +12.9 ‰ at site M3 and +7.63 ‰ at site M4 (Fig. 2). The HCl-P pool displayed the closest value to the isotopic composition of the parent material and varied very little between +7.95 ‰ and +8.72 ‰, with the exception of site M3, where it was slightly lower compared to the parent material signature. Only the NaOH-Pi at site M1 showed isotopic values similar to the parent material, while at M3 and M4 this pool carried a δ18OP of +15.40 ‰ and +6.05 ‰, respectively. The NaOH-Po pool at site M4 had a δ18OP of +12.84 ‰. Most of the measured δ18OP values did not fall within the short-term isotopic equilibrium with ambient water.
Table 2Isotopic equilibrium values δ18OP(eq) calculated according to Eq. (1). “Short-term” represents the sampling period 10 d equilibrium. “Long-term” represents a multi-annual equilibrium average.

a Years 2013–2017.
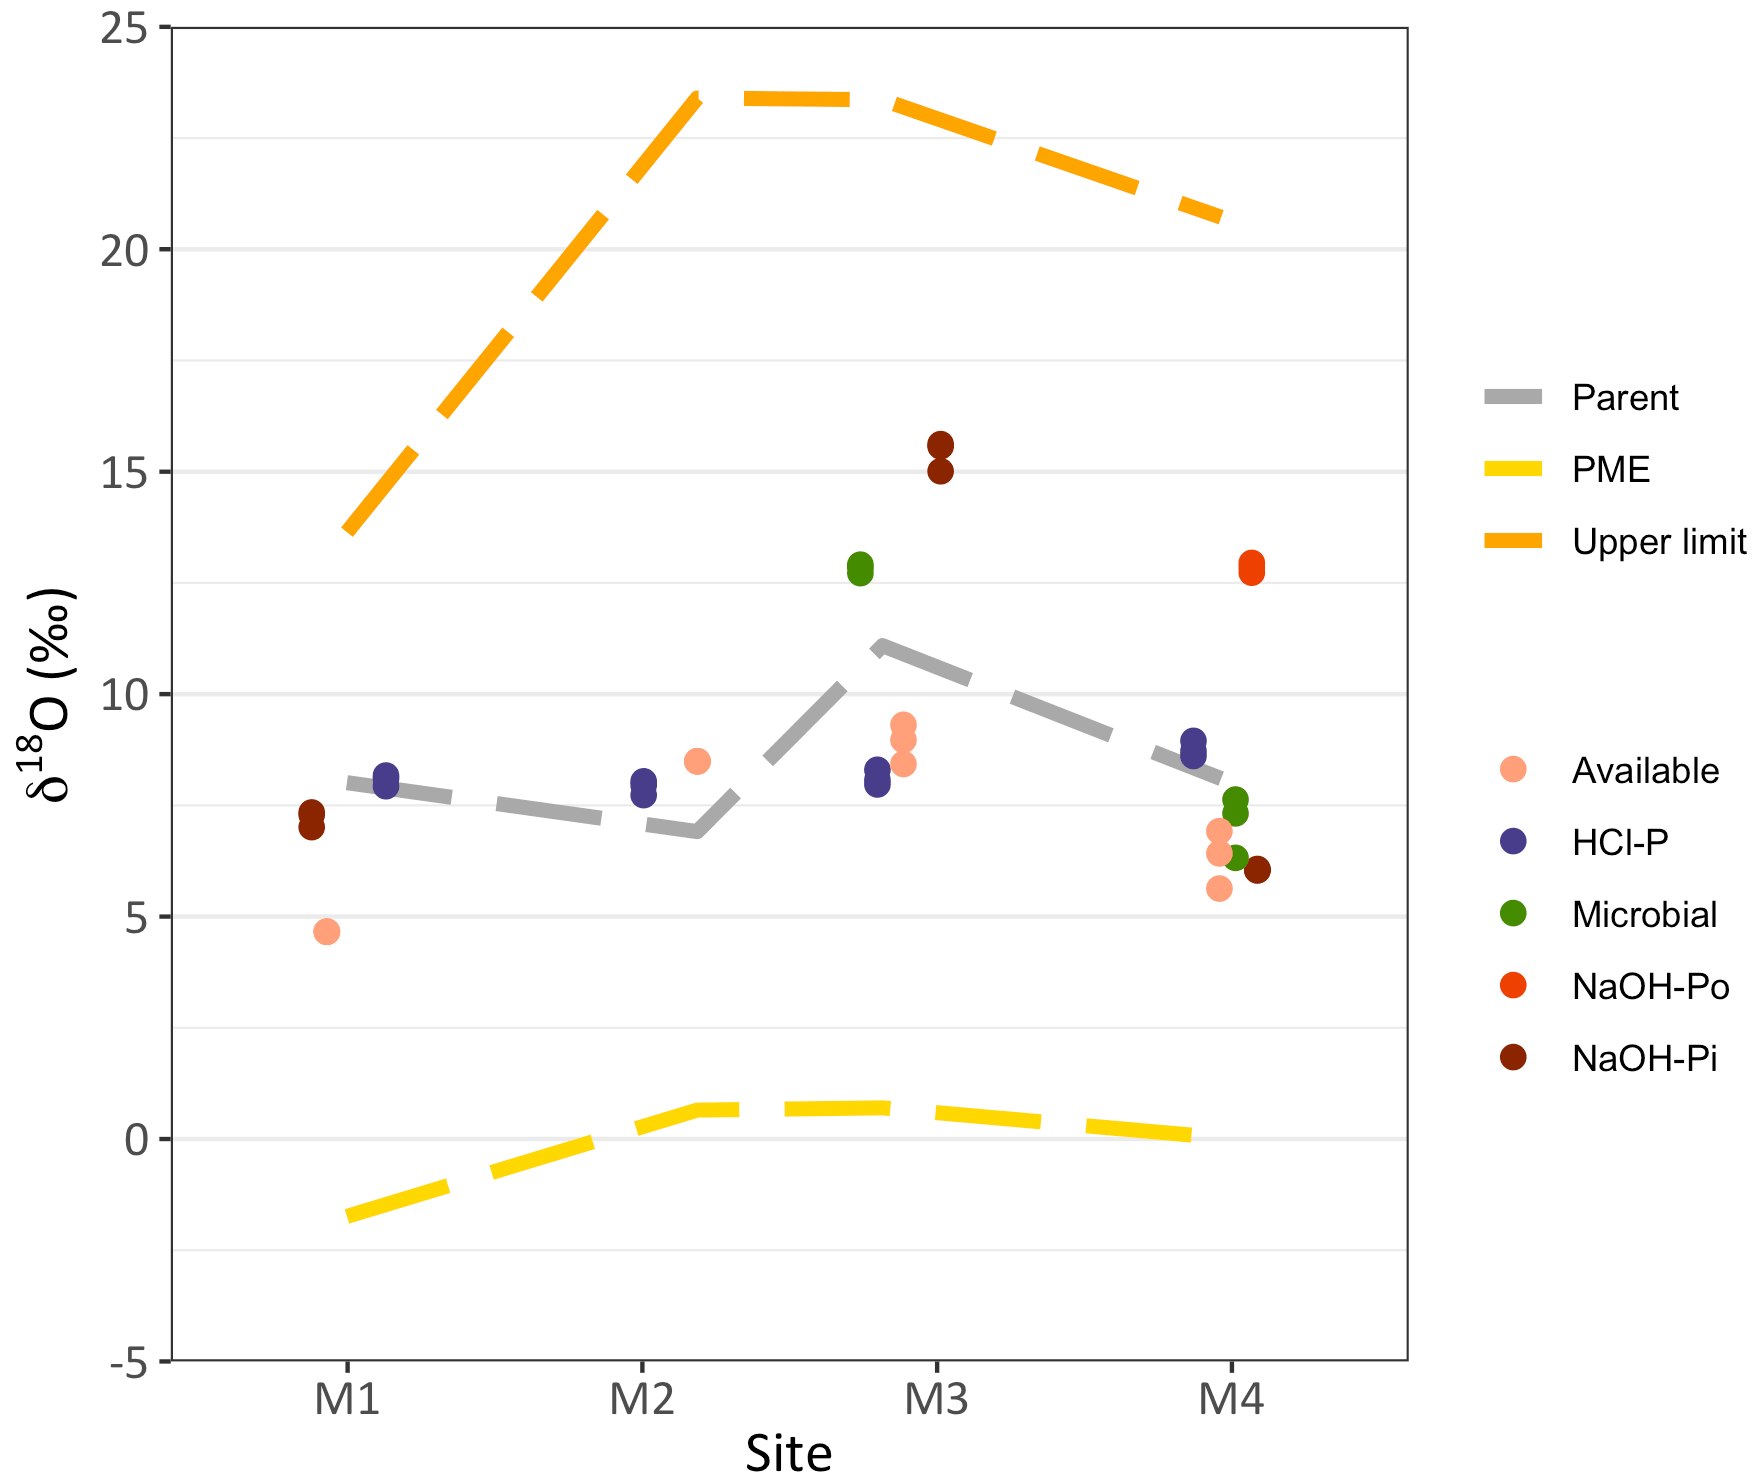
Figure 2Isotopic values of oxygen in phosphate (δ18OP) in different soil P pools along the Chamser Kangri glacier forefield chronosequence (< 1, 25, 50 and > 100 years, for M1, M2, M3 and M4, respectively). The expected δ18O value of phosphate derived from Po hydrolysis due to phosphomonoesterases (PME, δ18OPME; Eq. 2) is shown by the yellow discontinuous line, while the grey discontinuous line stays for the isotopic value of the parent material and the orange discontinuous line for the upper limit of the short-term isotopic equilibrium. Symbols represent analytical replicates of the same sample.
4.1 Nutrient limitation and microbial P dynamics during the early stages of pedogenesis
Nitrogen is absent from most parent materials but increases across the stages of ecosystem development through biological N2 fixation (Smittenberg et al., 2012). Increased C and N availability along with soil development may eventually result in P becoming the secondary limiting nutrient (Göransson et al., 2011).
Accordingly, total topsoil N concentration in the Chamser Kangri forefield increased with soil age, along with the potential activity of C- and N-decomposing enzymes. The C:N ratio, consequently, decreased (Table 1). While Kaye and Hart (1997) found a shift from C to N limitation at a C:N ratio between 8 and 16, Göransson et al. (2011) reported a clear N limitation in most soils with a C:N ratio above 13. We concluded that the most limiting nutrient to primary production at the youngest site was N (cf. ratios in Table 1). This conclusion is supported by the occurrence of N-fixing cyanobacteria in soil biological crusts at the younger sites (Couradeau et al., 2016). These N-fixing species could provide a significant N input in subnival soils (Janatková et al., 2013).
The increasing trend of the C:Po and N:Po molar ratios indicates that C and N accumulated faster than P in the soil organic matter (Table1). On the pedogenesis timescale, assuming inputs to soil organic matter to be mainly derived from microbial products, C and Po accumulate at a similar rate when P is not limiting and the mineralization of Po is driven by the need for carbon rather than the need of P (Wang et al., 2016). The increase in C:Po and N:Po ratios may, therefore, suggest the progressive onset of P limitation or co-limitation. Alternatively, it may point to a shift in the quality (stoichiometry and recalcitrance) of organic matter inputs. However, the available P concentrations along the Chamser Kangri chronosequence were rather low relative to comparably young chronosequences (Tamburini et al., 2012; Wang et al., 2016; Zhou et al., 2019). Moreover, the microbial P pool increasingly exceeded the available P pool, and the potential phosphatases activity increased with soil age, which can be interpreted as indications of P limitation (Lajtha and Schlesinger, 1988). With the progressive colonization by vascular plants at sites M3 and M4 (20 %–50 % to 70 %–80 % plant cover, respectively; Fig. S2), it is likely that microbes started to compete effectively with plants for the available P (Lajtha and Schlesinger, 1988; Seeling and Zasoski 1993; Zhou et al., 2013).
Contrary to what has been found previously in an alpine glacier forefield (Tamburini et al., 2012), the δ18OP of microbial P at sites M3 and M4 was well below the isotopic equilibrium with soil water (Fig. 2 and Table 2). However, the δ18OP of microbial P at site M3 did fall within the short-term equilibrium range, which includes the isotopic value of rainfall water. This suggests that microbes were only active under favorable temperature and moisture conditions, i.e., after precipitation events, and rapidly turned P over, bringing it to isotopic equilibrium. Under such extreme conditions, microbial activity might be disrupted by frequent droughts and occurrence of low temperatures. The isotopic value of microbial P might, therefore, reflect previous favorable conditions rather than those occurring at the moment sampling (Shen et al., 2020). At site M3, this translated into a δ18OP somewhere in between the equilibrium with rainwater and soil water.
At the oldest site M4, however, the δ18OP of microbial P was much lower compared to site M3 lying below the short-term equilibrium range, suggesting that other processes intervened. The difference between the two sites (about 5.2 ‰) might be determined by differences in soil water dynamics. The lower clay content characterizing site M3 potentially accelerates soil water evaporation. Indeed, at the sampling time, the δ18OW at site M4 was lower by approximately 2.6 ‰ compared to site M3 (Table 2), thus partially explaining the offset between the two microbial P isotopic compositions.
Additionally, the hydrolysis of Po compounds induces the release of Pi with low δ18O (Liang and Blake, 2006; von Sperber et al., 2014). Low δ18OP values have been observed in microbial P of forest soils and related to phosphomonoesterase catalyzed reactions induced by intracellular Po recycling in response to P limiting conditions (Pistocchi et al., 2020). Alternatively, low metabolic activity and dormancy might induce hydrolysis of Po within cells for maintenance of basic functions, thus potentially leading to low δ18OP values (Lebre et al., 2017; Blagodatskaya and Kuzyakov 2013).
Together with differences in evaporative enrichment of soil water, differences in the metabolic status of the microbial community, such as internal Po recycling in response to P limitation or adverse conditions, can, therefore, explain the lower microbial P δ18O values observed at the oldest site.
4.2 Contributions of biological P cycling to the inorganic P pools: long-term P dynamics
We observed a significant departure from the isotopic value of the parent material at sites M1 and M4 for available P, at M3 and M4 for the NaOH-Pi and at M3 for HCl-P (Fig. 2). As the exchange of O atoms between phosphate and water is negligible in the absence of biological processes (Blake et al., 2005; Lecuyer et al., 1999; Winter et al., 1940), a departure from the isotopic value of the parent material suggests that these Pi pools underwent to a certain extent biological transformations.
Conversely, the HCl-P maintained an isotopic value similar to the parent material at the oldest site (∼ 100 years). The HCl-P pool was, therefore, probably still composed of primary phosphate minerals after 100 years of soil development. This pool still represented 95 % of the total P. The decline in soil HCl-P stocks (−20 %, see Table 1) was much less pronounced than that observed in other young chronosequences in alpine or other cold environment (Egli et al., 2012; Celi et al., 2013; Zhou et al., 2019). However, these environments are sensibly more humid than the Chamser Kangri forefield. As reported by Prietzel et al., (2019) for polar cold arid soils, the weathering of primary P minerals like apatite is strongly retarded by the lack of water, which slows down soil acidification. Along our chronosequence, this effect together with the slow colonization by vascular plants prevented the rapid dissolution of primary apatite (Lajtha and Schlesinger, 1988). The low amount of Fe associated with oxides (Table S3) compared to other young chronosequence also indicates a slow soil development (Prietzel et al., 2013).
Table 3Box model estimation of phosphorus fluxes from the mineral, microbial and organic P (Po) pools to the available P.

a,b Microbial P fluxes were calculated assuming a microbial P turnover rate of 15 and 70 respectively. c Oxygen isotopic composition of phosphate released by Po hydrolysis via phosphomonoesterases (Eq. 2). d Estimated P flux from the mineralization of Po (Eq. 4). e According to Eq. (3), mean and standard deviation were calculated with the Monte Carlo simulations.
Unlike the classic Walker and Syers model (1976), there was no evident decrease of total soil P in the top 0–5 cm over the first 100 years of soil development (Table 1). However, while primary mineral P declined, an accumulation of P in organic and secondary mineral forms presumably associated with metal oxides was observed, as well as a slight increase in the available P (Table 1). The δ18OP of NaOH-Pi was initially similar to that of the parent material (Fig. 2, site M1), possibly reflecting the alteration of primary minerals with the formation of oxide-bound P by processes not cleaving the P–O bond, e.g., weathering by organic acids (Brunner et al., 2011; Mitchell et al., 2016). As this pool built up with soil development, its δ18OP deviated from that of the parent material and remained within or below the long-term isotopic equilibrium at the intermediate M3 and oldest M4 site, respectively (Fig. 2 and Table 2). Accordingly, Fe associated with poorly ordered oxides increased between the youngest sites M1 and the intermediate sites M2–3 (Table S3). The exchange of phosphate ions between the soil solution and the NaOH-Pi occurs within months to years (Helfenstein et al., 2020). The difference in δ18OP of this pool at different sites should, therefore, depend on persistent long-term differences in the contributing processes (e.g., sorption of phosphate from the soil solution vs phosphate from dissolution of parent material or persistent differences in water isotopic composition).
As reported previously, δ18OP of sorbed or mineral Pi might approach isotopic equilibrium values via sorption onto soil solid phase or precipitation as secondary minerals of biologically cycled P (Tamburini et al., 2012; Joshi et al., 2016; Helfenstein et al., 2018; Roberts et al., 2015). In a study of a coastal dunes chronosequence in New Zealand, the NaOH-extractable Pi approached equilibrium after a few millennia of soil development (Roberts et al., 2015). This apparently happened much earlier in the Chamser Kangri chronosequence (site M3 is approximately 50 years old). This might be due to the relatively high proportion of the microbial P pool to the NaOH-Pi, which additionally increased from 17 % to 79 % along the chronosequence (Table S1). Considering the large range of the long-term equilibrium (Table 2), we cannot rule out that the NaOH-Pi at this development stage (50 to 100 years) was only partially comprised of biologically cycled P and its isotopic value only partially overprinted.
Conversely, the drop of the δ18OP value of NaOH-Pi at the oldest site might be linked to the increase of Po mineralization rate. Depleted δ18OP values have been observed for NaOH-extractable Pi at the oldest sites of the mentioned coastal dune chronosequence and related to an increasing contribution of Po mineralization to P cycling as the soil develops (Roberts et al., 2015). The low δ18OP of NaOH-Pi observed at site M4 might, therefore, result from the sorption onto Fe and Al oxides of 18O-depleted Pi released after extracellular Po mineralization. This explanation is corroborated by other soil properties, such as the sharp increase of the NaOH-Po pool, which tripled compared to site M3 (Table S1), the similarly low δ18OP values of the available P and the results of the box model (see Sect. 4.3). In the Chamser Kangri chronosequence, this dynamic appeared to be faster than in the dune chronosequence, maybe because it affected a much smaller quantity of the total soil P stock compared to previous studies (Roberts et al., 2015).
4.3 Contributions of microbial P turnover and Po mineralization to the available P: short-term P dynamics
The buildup of the microbial P pool observed across the chronosequence may suggest that this pool would increasingly contribute to the available P. With the help of a box model, we try to elucidate the contributions to the available P from microbial P turnover and Po mineralization. We consider that the box model P fluxes were estimated correctly, when the calculated δ18OP of the available P (δ18OP expected, Eq. 3) closely matched the measured ones; e.g., their difference is less than twice the standard deviation of samples replicates (1 ‰). This is the case for sites M3 and M4, when assuming the lowest microbial P turnover time of 15 d (see Table 3). The difference between the δ18OP expected and the measured δ18OP was instead greater for site M1 (+2.7 ‰) and M2 (+1.7 ‰). Differences between the measured and estimated δ18OP value increase for all sites with increasing microbial P turnover time. For sites M3 and M4, the estimated fluxes from microbial P (fPmic) accounted for approximately 60 % to 80 % of the available P. Therefore, in agreement with our initial hypothesis, microbial P largely controlled the available P at these stages of pedogenesis (50 to 100 years). Accordingly, the ratio of microbial P to available P increased from approximately 1 to 3 along the chronosequence. Microbial P turnover might be accelerated by repeated freezing–thawing and drying–rewetting cycles occurring frequently in the area, thus fostering its transfer to the available P pool, especially in low-sorbing sandy soils (Chen et al., 2021). In addition, microbial grazing might potentially play a role (Bernasconi et al., 2011).
At sites M1 and M2, the measured and estimated δ18OP values of the available P do not match, indicating either incorrect assumptions or the occurrence of processes we could not account for in the box model. The δ18OP of microbial P at sites M1 and M2 was not measured, so we assumed that these values could vary within the range of values from sites M3 and M4. However, the δ18OP expected was poorly sensitive to variations in the δ18OP of the microbial P (Table S4), so we can exclude that this assumption was a source of error. Additionally, although the δ18OP of available P at site M2 was very close to that of HCl-P (+8.49 ‰ and +7.95 ‰ for available P and HCl-P, respectively), we exclude that fluxes from the HCl-P pool could have strongly influenced the isotopic composition of the available P. Indeed, the flux from HCl-P (fPmineral) should be more than 100 times the one we estimated to account for the observed δ18OP of available P. Such a net flux appears unlikely given the very slow exchange time (in the order of millennia) of the HCl-P with the soil solution at alkaline soil pH (Helfenstein et al., 2020). The flux from the P bound to soil oxides via sorption/desorption processes was not accounted for in the box model. However, at the youngest sites, this flux can be considered negligible compared to other contributions, due to the relatively small concentration of the NaOH-Pi, which is supposed to target P bound to oxides. Moreover, the measured δ18OP of available P at site M1 was clearly lower than that of the parent material and of the NaOH-Pi (Fig. 2).
As the δ18OP expected values were lower compared to the measured δ18OP of available P at sites M1 and M2, we hypothesized that either the flux from Po mineralization (fPo), which would carry a low δ18OP value, was overestimated, or the δ18OP-org was underestimated (see Eqs. 2 and 3). Since δ18OP-org was likely overestimated at these young sites (see Sect. 2.6), we concluded the first option. Organic P mineralization was calculated from the CO2 released by microbial respiration, assuming that a stoichiometric proportion of Po was mineralized from nonliving soil organic matter (see Eq. 4) (Achat et al., 2010; Bünemann, 2015). Stabilization of Po compounds by adsorption onto soil particles (Zhou et al., 2019) could lead to the mineralization of a lower proportion of Po than C. However, considering the soil sandy texture and the fact that the C:Po ratio increased along the chronosequence, we exclude that abiotic stabilization played a major role. A second possibility is that C:Po was overestimated. The C:Po used for the fPo calculation corresponded to the C:Po of the bulk soil organic matter (Eq. 4). However more labile Po pools, such as microbial biomass, might have a narrower C:Po ratio, for example, ranging between 6 and 13 (Bünemann, 2015, and references therein). The preferential mineralization of microbial necromass over mineralization of the bulk soil organic matter might, therefore, explain the observed discrepancy.
At the oldest sites (M3 and M4), the good match between δ18OP expected and measured δ18OP indicates that the fPo values were estimated correctly and accounted for approximately 10 %–30 % of the total P flux to available P. Unlike the youngest sites, Po appeared to be mineralized in stoichiometric proportion to C in the nonliving soil organic matter. This finding does not agree with the observed increase in the C:Po ratio between M3 and M4, which indicates a faster depletion of Po than C on the pedogenesis timescale. This inconsistency might be explained by the fact that the box model only captures short-term P dynamics, as it is built on the isotopic composition of the available P, which varies on a seasonal scale and therefore potentially reflects transient conditions (Angert et al., 2011).
As discussed earlier, the increase of the C:Po ratio along the chronosequence suggests that in the long run Po was mineralized faster than C. Concurrently, the colonization by vascular plants might have contributed to modification of the soil organic matter stoichiometry through inputs with higher C:P ratio. More investigation on the contribution of plant litter to soil organic matter would be needed to clarify this aspect.
In the Chamser Kangri chronosequence, only a minor fraction of the total P in the top 5 cm of the newly formed soil was affected by biological processes at early soil development stages. However, through a box model approach using stocks and δ18O of phosphate pools, we can conclude that the available P was mostly controlled by the microbial P via a rapid microbial P turnover, possibly accelerated by drying–rewetting or freezing–thawing cycles. Organic P mineralization became important in replenishing the available P pool after 50 years of soil development and also contributed to the phosphate sorbed onto secondary minerals, presumably Fe and Al oxides. Unlike previous studies in other alpine environments with humid climate, the P associated with primary minerals decreased only by 20 % after approximately 100 years of soil development, and its isotopic composition reflected negligible biological cycling and secondary minerals precipitation. Finally, although cold arid conditions slowed down the weathering of primary P minerals and controlled biological activity, microbes still played a pivotal role in controlling the P dynamics, which affected P distribution to inorganic and organic soil pools. Our study highlights that in extreme environments, integrating the analysis of the isotopic composition of oxygen in soil P pools in chronosequence studies can provide insights into short- and long-term P dynamics.
The dataset used in this work is available at https://doi.org/10.15454/TKOUKH (last access: November 2021, Frkova, 2021).
The supplement related to this article is available online at: https://doi.org/10.5194/soil-8-1-2022-supplement.
ZF designed the sampling strategy together with FT and KC. ZF, CP, YV, KC, JD and FT performed the laboratory analyses. ZF, CP and FT interpreted the data. ZF and CP performed the statistical analyses and prepared the manuscript with contributions from all co-authors.
The contact author has declared that neither they nor their co-authors have any competing interests.
Publisher’s note: Copernicus Publications remains neutral with regard to jurisdictional claims in published maps and institutional affiliations.
We would like to thank Vilem Ded for assistance with graphical data analysis in R, Iva Tomkova for analyzing soils for TP, Lenka Capkova for technical help with enzyme activity measurements in the laboratory for Ecosystem Biology at the University of South Bohemia and the Institute of Hydrology in Slovakia for the analyses of stable isotopes in samples from glacier snout and glacier stream water. We are grateful to Madalina Jaggi and Stefano Bernasconi for the analysis of oxygen isotopes in soil water at the Stable Isotope Laboratory of the Geological Institute of the ETH Zurich. Finally, we would like to thank the reviewers, Andrew Smith and Joerg Prietzel, for their helpful comments and suggestions.
This research has been supported by the Grantová Agentura České Republiky (grant nos. GACR 21-26883S and GACR 21-04987S), a long-term development project of the Czech Academy of Sciences (RVO 67985939) and the Ministry of Education, Youth and Sports CZ-MEYS (LM2015075 and EF16_013/0001782).
This paper was edited by Luisella Celi and reviewed by Andrew Smith and Jörg Prietzel.
Abdelbaki, A. M.: Evaluation of pedotransfer functions for predicting soil bulk density for U.S. soils, Ain Shams Eng. J., 9, 1611–1619, https://doi.org/10.1016/j.asej.2016.12.002, 2018.
Achat, D. L., Bakker, M. R., Zeller, B., Pellerin, S., Bienaimé, S., and Morel, C.: Long-term organic phosphorus mineralization in Spodosols under forests and its relation to carbon and nitrogen mineralization, Soil Biol. Biochem., 42, 1479–1490, https://doi.org/10.1016/j.soilbio.2010.05.020, 2010.
Association française de normalisation: Qualité des sols, in: Recueil de normes françaises (volume 1), Paris-La Défense, 227 pp., 1994.
Anderson, G. M.: Error propagation by the Monte Carlo method in geochemical calculations, Geochim. Cosmochim. Acta, 40, 1533–1538, https://doi.org/10.1016/0016-7037(76)90092-2, 1976.
Angert, A., Weiner, T., Mazeh, S., Tamburini, F., Frossard, E., Bernasconi, S. M., and Sternberg, M.: Seasonal variability of soil phosphate stable oxygen isotopes in rainfall manipulation experiments, Geochim. Cosmochim. Acta, 75, 4216–4227, https://doi.org/10.1016/j.gca.2011.05.002, 2011.
Anon: World reference base for soil resources 2006 A framework for international classification, correlation and communication, FAO, Rome, 2006.
Customized Rainfall Information System (CRIS) – Hydromet Division: available at: http://hydro.imd.gov.in/hydrometweb/ (last access: November 2019), 2012–2016.
Aschenbach, K., Conrad, R., Řeháková, K., Doležal, J., Janatková, K., and Angel, R.: Methanogens at the top of the world: Occurrence and potential activity of methanogens in newly deglaciated soils in high-altitude cold deserts in the Western Himalayas, Front. Microbiol., 4, 1–14, https://doi.org/10.3389/fmicb.2013.00359, 2013.
Bárta, J., Šlajsová, P., Tahovská, K., Picek, T., and Šantrůčková, H.: Different temperature sensitivity and kinetics of soil enzymes indicate seasonal shifts in C, N and P nutrient stoichiometry in acid forest soil, Biogeochemistry, 117, 525–537, https://doi.org/10.1007/s10533-013-9898-1, 2014.
Bernasconi, S. M., Bauder, A., Bourdon, B., Brunner, I., Bünemann, E., Chris, I., Derungs, N., Edwards, P., Farinotti, D., Frey, B., Frossard, E., Furrer, G., Gierga, M., Göransson, H., Gülland, K., Hagedorn, F., Hajdas, I., Hindshaw, R., Ivy-Ochs, S., Jansa, J., Jonas, T., Kiczka, M., Kretzschmar, R., Lemarchand, E., Luster, J., Magnusson, J., Mitchell, E. A. D., Venterink, H. O., Plötze, M., Reynolds, B., Smittenberg, R. H., Stähli, M., Tamburini, F., Tipper, E. T., Wacker, L., Welc, M., Wiederhold, J. G., Zeyer, J., Zimmermann, S., and Zumsteg, A.: Chemical and Biological Gradients along the Damma Glacier Soil Chronosequence, Switzerland, Vadose Zone J., 10, 867–883, https://doi.org/10.2136/vzj2010.0129, 2011.
Blagodatskaya, E. and Kuzyakov, Y.: Active microorganisms in soil: Critical review of estimation criteria and approaches, Soil Biol. Biochem., 67, 192–211, https://doi.org/10.1016/j.soilbio.2013.08.024, 2013.
Blake, R. E., Alt, J. C., and Martini, A. M.: Oxygen isotope ratios of PO4: An inorganic indicator of enzymatic activity and P metabolism and a new biomarker in the search for life, P. Natl. Acad. Sci. USA, 98, 2148–2153, https://doi.org/10.1073/pnas.051515898, 2001.
Blake, R. E., O'Neil, J. R., and Surkov, A. V.: Biogeochemical cycling of phosphorus: Insights from oxygen isotope effects of phosphoenzymes, Am. J. Sci., 305, 596–620, https://doi.org/10.2475/ajs.305.6-8.596, 2005.
Blumthaler, M., Ambach, W., and Ellinger, R.: Increase in solar UV radiation with altitude, J. Photochem. Photobiol. B, 39, 130–134, https://doi.org/10.1016/S1011-1344(96)00018-8, 1997.
Brunner, I., Plötze, M., Rieder, S., Zumsteg, A., Furrer, G., and Frey, B.: Pioneering fungi from the Damma glacier forefield in the Swiss Alps can promote granite weathering, Geobiology, 9, 266–279, https://doi.org/10.1111/j.1472-4669.2011.00274.x, 2011.
Bünemann, E. K.: Assessment of gross and net mineralization rates of soil organic phosphorus – A review, Soil Biol. Biochem., 89, 82–98, https://doi.org/10.1016/j.soilbio.2015.06.026, 2015.
Čapková, K., Hauer, T., Řeháková, K., and Doležal, J.: Some Like it High! Phylogenetic Diversity of High-Elevation Cyanobacterial Community from Biological Soil Crusts of Western Himalaya, Microb. Ecol., 71, 113–123, https://doi.org/10.1007/s00248-015-0694-4, 2016.
Celi, L., Cerli, C., Turner, B. L., Santoni, S., and Bonifacio, E.: Biogeochemical cycling of soil phosphorus during natural revegetation of Pinus sylvestris on disused sand quarries in Northwestern Russia, Plant Soil, 367, 121–134, https://doi.org/10.1007/s11104-013-1627-y, 2013.
Chang, S. J. and Blake, R. E.: Precise calibration of equilibrium oxygen isotope fractionations between dissolved phosphate and water from 3 to 37∘C, Geochim. Cosmochim. Acta, 150, 314–329, https://doi.org/10.1016/j.gca.2014.10.030, 2015.
Chen, H., Jarosch, K. A., Mészáros, É., Frossard, E., Zhao, X., and Oberson, A.: Repeated drying and rewetting differently affect abiotic and biotic soil phosphorus (P) dynamics in a sandy soil: A 33P soil incubation study, Soil Biol. Biochem., 153, 108079, https://doi.org/10.1016/j.soilbio.2020.108079, 2021.
Claff, S. R., Sullivan, L. A., Burton, E. D., and Bush, R. T.: A sequential extraction procedure for acid sulfate soils: Partitioning of iron, Geoderma, 155, 224–230, https://doi.org/10.1016/j.geoderma.2009.12.002, 2010.
Cohn, M.: Phosphate-water exchange reaction catalyzed by inorganic pyrophosphatase of yeast., J. Biol. Chem., 230, 369–379, 1958.
Couradeau, E., Karaoz, U., Lim, H. C., Nunes Da Rocha, U., Northen, T., Brodie, E., and Garcia-Pichel, F.: Bacteria increase arid-land soil surface temperature through the production of sunscreens, Nat. Commun., 7, 1–7, https://doi.org/10.1038/ncomms10373, 2016.
Dansgaard, W.: Stable isotopes in precipitation, Tellus, 16, 436–468, https://doi.org/10.3402/tellusa.v16i4.8993, 1964.
Davies, C. L., Surridge, B. W. J., and Gooddy, D. C.: Phosphate oxygen isotopes within aquatic ecosystems: Global data synthesis and future research priorities, https://doi.org/10.1016/j.scitotenv.2014.07.057, 2014.
Dietrich, W. E. and Perron, J. T.: The search for a topographic signature of life, Nature, 439, 411–418, https://doi.org/10.1038/nature04452, 2006.
Dolezal, J., Dvorsky, M., Kopecky, M., Liancourt, P., Hiiesalu, I., Macek, M., Altman, J., Chlumska, Z., Rehakova, K., Capkova, K., Borovec, J., Mudrak, O., Wild, J., and Schweingruber, F.: Vegetation dynamics at the upper elevational limit of vascular plants in Himalaya, Sci. Rep., 6, 24881, https://doi.org/10.1038/srep24881, 2016.
Dvorský, M., Doležal, J., De Bello, F., Klimešová, J., and Klimeš, L.: Vegetation types of East Ladakh: Species and growth form composition along main environmental gradients, Appl. Veg. Sci., 14, 132–147, https://doi.org/10.1111/j.1654-109X.2010.01103.x, 2011.
Dvorský, M., Altman, J., Kopecký, M., Chlumská, Z., Řeháková, K., Janatková, K., and Doležal, J.: Vascular plants at extreme elevations in eastern Ladakh, northwest Himalayas, Plant Ecol. Divers., 8, 571–584, https://doi.org/10.1080/17550874.2015.1018980, 2015.
Egli, M., Wernli, M., Burga, C., Kneisel, C., Mavris, C., Valboa, G., Mirabella, A., Plötze, M., and Haeberli, W.: Fast but spatially scattered smectite-formation in the proglacial area Morteratsch: An evaluation using GIS, Geoderma, 164, 11–21, https://doi.org/10.1016/j.geoderma.2011.05.001, 2011.
Egli, M., Filip, D., Mavris, C., Fischer, B., Götze, J., Raimondi, S., and Seibert, J.: Rapid transformation of inorganic to organic and plant-available phosphorous in soils of a glacier forefield, Geoderma, 189–190, 215–226, https://doi.org/10.1016/j.geoderma.2012.06.033, 2012.
Epard, J. L. and Steck, A.: Structural development of the Tso Morari ultra-high pressure nappe of the Ladakh Himalaya, Tectonophysics, 451, 242–262, https://doi.org/10.1016/j.tecto.2007.11.050, 2008.
Fisk, M. C., Schmidt, S. K., and Seastedt, T. R.: Topographic patterns of above- and belowground production and nitrogen cycling in alpine tundra, Ecology, 79, 2253–2266, https://doi.org/10.1890/0012-9658(1998)079[2253:TPOAAB]2.0.CO;2, 1998.
Fricke, H. C., Clyde, W. C., O'Neil, J. R., and Gingerich, P. D.: Evidence for rapid climate change in North America during the latest Paleocene thermal maximum: oxygen isotope compositions of biogenic phosphate from the Bighorn Basin (Wyoming), Earth Planet. Sc. Lett., 160, 193–208, https://doi.org/10.1016/S0012-821X(98)00088-0, 1998.
Frkova, Z., Pistocchi, C., Vystavna, Y., Capkova, K., Dolezal, J., and Tamburini, F.: Chamser Kangri glacier forefield dataset, [data set] https://doi.org/10.15454/TKOUKH, 2021.
Frossard, E., Achat, David, L., Bernasconi, S. M., Bünemann, E. K., Fardeau, J.-C., Jansa, J., Morel, C., Rabeharisoa, L., Randriamanantsoa, L., Sinaj, S., Tamburini, F., and Oberson, A.: The Use of Tracers to Investigate Phosphate Cycling in Soil–Plant Systems, in: Phosphorus in Action, Soil Biology, Vol. 100, edited by: Bunemann, E., Oberson, A., and Frossard, E., Springer, Berlin, 59–91, https://doi.org/10.1007/978-3-642-15271-9_ 3, 2011.
Göransson, H., Olde Venterink, H., and Bååth, E.: Soil bacterial growth and nutrient limitation along a chronosequence from a glacier forefield, Soil Biol. Biochem., 43, 1333–1340, https://doi.org/10.1016/j.soilbio.2011.03.006, 2011.
Harris, N.: The elevation history of the Tibetan Plateau and its implications for the Asian monsoon, Palaeogeogr. Palaeoclimatol. Palaeoecol., 241, 4–15, https://doi.org/10.1016/j.palaeo.2006.07.009, 2006.
Helfenstein, J., Tamburini, F., von Sperber, C., Massey, M. S., Pistocchi, C., Chadwick, O. A., Vitousek, P. M., Kretzschmar, R., and Frossard, E.: Combining spectroscopic and isotopic techniques gives a dynamic view of phosphorus cycling in soil, Nat. Commun., 9, 3226, https://doi.org/10.1038/s41467-018-05731-2, 2018.
Helfenstein, J., Pistocchi, C., Oberson, A., Tamburini, F., Goll, D. S., and Frossard, E.: Estimates of mean residence times of phosphorus in commonly considered inorganic soil phosphorus pools, Biogeosciences, 17, 441–454, https://doi.org/10.5194/bg-17-441-2020, 2020.
ISO: ISO 10390:2005, Soil Qual.-Determ. PH, 2005.
Janatková, K., Řeháková, K., Doležal, J., Šimek, M., Chlumská, Z., Dvorský, M., and Kopecký, M.: Community structure of soil phototrophs along environmental gradients in arid Himalaya, Environ. Microbiol., 15, 2505–2516, https://doi.org/10.1111/1462-2920.12132, 2013.
Joshi, S. R., Li, X., and Jaisi, D. P.: Transformation of Phosphorus Pools in an Agricultural Soil: An Application of Oxygen-18 Labeling in Phosphate, Soil Sci. Soc. Am. J., 80, 69, https://doi.org/10.2136/sssaj2015.06.0219, 2016.
Kaye, J. P. and Hart, S. C.: Competition for nitrogen between plants and soil microorganisms, Trends Ecol. Evol., 12, 139–143, https://doi.org/10.1016/S0169-5347(97)01001-X, 1997.
Kolodny, Y., Luz, B., and Navon, O.: Oxygen isotope variations in phosphate of biogenic apatites, I. Fish bone apatite-rechecking the rules of the game, Earth Planet. Sc. Lett., 64, 398–404, https://doi.org/10.1016/0012-821X(83)90100-0, 1983.
Kopacek, J., Borovec, J., Hejzlar, J., and Porcal, P.: Spectrophotometric determination of iron, aluminum, and phosphorus in soil and sediment extracts after their nitric and perchloric acid digestion, Commun. Soil Sci. Plant Anal., 32, 1431–1443, https://doi.org/10.1081/CSS-100104203, 2001.
Lajtha, K. and Schlesinger, W. H.: The Biogeochemistry of Phosphorus Cycling and Phosphorus Availability Along a Desert Soil Chronosequence, Ecology, 69, 24–39, https://doi.org/10.2307/1943157, 1988.
Lebre, P. H., De Maayer, P., and Cowan, D. A.: Xerotolerant bacteria: Surviving through a dry spell, Nat. Rev. Microbiol., 15, 285–296, https://doi.org/10.1038/nrmicro.2017.16, 2017.
Lecuyer, C., Grandjean, P., and Sheppard, S. M. F.: Oxygen isotope exchange between dissolved phosphate and water at temperatures = 135 ∘C: inorganic versus biological fractionations, Geochim. Cosmochim. Acta, 63, 855–862, https://doi.org/10.1016/S0016-7037(99)00096-4, 1999.
Liang, Y. and Blake, R. E.: Oxygen isotope signature of Pi regeneration from organic compounds by phosphomonoesterases and photooxidation, Geochim. Cosmochim. Acta, 70, 3957–3969, https://doi.org/10.1016/j.gca.2006.04.036, 2006.
Liang, Y. and Blake, R. E.: Compound- and enzyme-specific phosphodiester hydrolysis mechanisms revealed by δ18O of dissolved inorganic phosphate: Implications for marine P cycling, Geochim. Cosmochim. Acta, 73, 3782–3794, https://doi.org/10.1016/j.gca.2009.01.038, 2009.
Lloyd, J. and Taylor, J. A.: On the Temperature Dependence of Soil Respiration, Funct. Ecol., 8, 315, https://doi.org/10.2307/2389824, 1994.
Lone, S. A.: Stable isotope (δ18O and δD) dynamics of precipitation in a high altitude Himalayan cold desert and its surroundings in Indus river basin, Ladakh, Atmospheric Res., 221, 46–57, https://doi.org/10.1016/j.atmosres.2019.01.025, 2019.
Longinelli, A. and Nuti, S.: Revised phosphate-water isotopic temperature scale, Earth Planet. Sc. Lett., 19, 373–376, https://doi.org/10.1016/0012-821X(73)90088-5, 1973.
Marx, M. C., Wood, M., and Jarvis, S. C.: A microplate fluorimetric assay for the study of enzyme diversity in soils, Soil Biol. Biochem., 33, 1633–1640, https://doi.org/10.1016/S0038-0717(01)00079-7, 2001.
Mitchell, R. L., Cuadros, J., Duckett, J. G., Pressel, S., Mavris, C., Sykes, D., Najorka, J., Edgecombe, G. D., and Kenrick, P.: Mineral weathering and soil development in the earliest land plant ecosystems, Geology, 44, 1007–1010, https://doi.org/10.1130/G38449.1, 2016.
Moorhead, D. L., Lashermes, G., and Sinsabaugh, R. L.: A theoretical model of C- and N-acquiring exoenzyme activities, which balances microbial demands during decomposition, Soil Biol. Biochem., 53, 133–141, https://doi.org/10.1016/j.soilbio.2012.05.011, 2012.
Mooshammer, M., Wanek, W., Zechmeister-Boltenstern, S., and Richter, A.: Stoichiometric imbalances between terrestrial decomposer communities and their resources: Mechanisms and implications of microbial adaptations to their resources, Front. Microbiol., 5, 1–10, https://doi.org/10.3389/fmicb.2014.00022, 2014.
Murphy, D. V., Recous, S., Stockdale, E. A., Fillery, I. R. P., Jensen, L. S., Hatch, D. J., and Goulding, K. W. T.: Gross nitrogen fluxes in soil: Theory, measurement and application of N-15 pool dilution techniques, Adv. Agron., 79, 69–118, https://doi.org/10.1016/S0065-2113(02)79002-0, 2003.
Oberson, A. and Joner, E. J.: Microbial turnover of phosphorus in soil, in: Organic Phosphorus in the Environment, CABI, Wallingford, 133–164, 2005.
Oehl, F., Oberson, A., Probst, M., Fliessbach, A., Roth, H. R., and Frossard, E.: Kinetics of microbial phosphorus uptake in cultivated soils, Biol. Fertil. Soils, 34, 31–41, https://doi.org/10.1007/s003740100362, 2001.
Ohno, T. and Zibilske, L. M.: Determination of Low Concentrations of Phosphorus in Soil Extracts Using Malachite Green, Soil Sci. Soc. Am. J., 55, 892–895, https://doi.org/10.2136/sssaj1991.03615995005500030046x, 1991.
O'Neil, J. R., Vennemann, T. W., and McKenzie, W. F.: Effects of speciation on equilibrium fractionations and rates of oxygen isotope exchange between (PO4)aq and H2O, Geochim. Cosmochim. Acta, 67, 3135–3144, https://doi.org/10.1016/S0016-7037(02)00970-5, 2003.
Orlowski, N., Frede, H., G., Brüggemann, N., and Breuer, L.: Validation and application of a cryogenic vacuum extraction system for soil and plant water extraction for isotope analysis, J. Sens. Sens. Syst., 2, 179–193, https://doi.org/https://doi.org/10.5194/jsss-2-179-2013, 2013.
Paul, E. A. and Clark, F. E.: Soil Microbiology and Biochemistry, Academic Press, Inc., San Diego, CA, 273 pp., https://doi.org/10.1007/s13398-014-0173-7.2, 1989.
Pfahler, V., Dürr-Auster, T., Tamburini, F., M. Bernasconi, S., and Frossard, E.: 18O enrichment in phosphorus pools extracted from soybean leaves, New Phytol., 197, 186–193, https://doi.org/10.1111/j.1469-8137.2012.04379.x, 2013.
Phillips, D. L., Newsome, S. D., and Gregg, J. W.: Combining sources in stable isotope mixing models: Alternative methods, Oecologia, 144, 520–527, https://doi.org/10.1007/s00442-004-1816-8, 2005.
Pistocchi, C., Tamburini, F., Gruau, G., Ferhi, A., Trevisan, D., and Dorioz, J.-M.: Tracing the sources and cycling of phosphorus in river sediments using oxygen isotopes: Methodological adaptations and first results from a case study in France, Water Res., 111, 346–356, https://doi.org/10.1016/j.watres.2016.12.038, 2017.
Pistocchi, C., Mészáros, É., Tamburini, F., Frossard, E., and Bünemann, E. K.: Biological processes dominate phosphorus dynamics under low phosphorus availability in organic horizons of temperate forest soils, Soil Biol. Biochem., 126, 64–75, https://doi.org/10.1016/j.soilbio.2018.08.013, 2018.
Pistocchi, C., Mészáros, É., Frossard, E., Buenemann, E. K., and Tamburini, F.: In or out of equilibrium? How microbial activity controls the oxygen isotope signature of phosphate in forest organic horizons with low and high phosphorus availability, https://doi.org/10.15454/XOFCHY, 2020.
Prietzel, J., Dümig, A., Wu, Y., Zhou, J., and Klysubun, W.: Synchrotron-based P K-edge XANES spectroscopy reveals rapid changes of phosphorus speciation in the topsoil of two glacier foreland chronosequences, Geochim. Cosmochim. Acta, 108, 154–171, https://doi.org/10.1016/j.gca.2013.01.029, 2013.
Prietzel, J., Prater, I., Colocho Hurtarte, L. C., Hrbáček, F., Klysubun, W., and Mueller, C. W.: Site conditions and vegetation determine phosphorus and sulfur speciation in soils of Antarctica, Geochim. Cosmochim. Acta, 246, 339–362, https://doi.org/10.1016/j.gca.2018.12.001, 2019.
Pucéat, E., Joachimski, M. M., Bouilloux, A., Monna, F., Bonin, A., Motreuil, S., Morinière, P., Hénard, S., Mourin, J., Dera, G., and Quesne, D.: Revised phosphate-water fractionation equation reassessing paleotemperatures derived from biogenic apatite, Earth Planet. Sc. Lett., 298, 135–142, https://doi.org/10.1016/j.epsl.2010.07.034, 2010.
Rehakova, K., Chlumska, Z., and Dolezal, J.: Soil Cyanobacterial and Microalgal Diversity in Dry Mountains of Ladakh, NW Himalaya, as Related to Site, Altitude, and Vegetation, Microb. Ecol., 62, 337–346, https://doi.org/10.1007/s00248-011-9878-8, 2011.
Řeháková, K., Chroňáková, A., Krištufek, V., Kuchtová, B., Čapková, K., Scharfen, J., Čapek, P., and Doležal, J.: Bacterial community of cushion plant thylacospermum ceaspitosum on elevational gradient in the himalayan cold desert, Front. Microbiol., 6, 1–16, https://doi.org/10.3389/fmicb.2015.00304, 2015.
Řeháková, K., Čapková, K., Dvorský, M., Kopecký, M., Altman, J., Šmilauer, P., and Doležal, J.: Interactions between soil phototrophs and vascular plants in Himalayan cold deserts, Soil Biol. Biochem., 115, 568–578, https://doi.org/10.1016/j.soilbio.2017.05.020, 2017.
Roberts, K., Defforey, D., Turner, B. L., Condron, L. M., Peek, S., Silva, S., Kendall, C., and Paytan, A.: Oxygen isotopes of phosphate and soil phosphorus cycling across a 6500 year chronosequence under lowland temperate rainforest, Geoderma, 257, 14–21, https://doi.org/10.1016/j.geoderma.2015.04.010, 2015.
Schmidt, S. and Nüsser, M.: Changes of High Altitude Glaciers in the Trans-Himalaya of Ladakh over the Past Five Decades (1969–2016), Geosciences, 7, 1–15, https://doi.org/10.3390/geosciences7020027, 2017.
Schmidt, S. K., Costello, E. K., Nemergut, D. R., Cleveland, C. C., Reed, S. C., Weintraub, M. N., Meyer, A. F., and Martin, A. M.: Biogeochemical consequences of rapid microbial turnover and seasonal succession in soil, Ecology, 88, 1379–1385, https://doi.org/10.1890/06-0164, 2007.
Schulz, S., Brankatschk, R., Dümig, A., Kögel-Knabner, I., Schloter, M., and Zeyer, J.: The role of microorganisms at different stages of ecosystem development for soil formation, Biogeosciences, 10, 3983–3996, https://doi.org/10.5194/bg-10-3983-2013, 2013.
Seeling, B. and Zasoski, R. J.: Microbial effects in maintaining organic and inorganic solution phosphorus concentrations in a grassland topsoil, Plant Soil, 148, 277–284, https://doi.org/10.1007/BF00012865, 1993.
Seth, B., Schneider, C., and Storck, F.: Improved reliability of oxygen isotopic analysis of water using the Finnigan GasBench II periphery of a continuous flow isotope ratio mass spectrometer by backflushing of the sampling line [2], Rapid Commun. Mass. Spectrom., 20, 1049–1051, https://doi.org/10.1002/rcm.2406, 2006.
Shen, J., Smith, A. C., Claire, M. W., and Zerkle, A. L.: Unraveling biogeochemical phosphorus dynamics in hyperarid Mars-analogue soils using stable oxygen isotopes in phosphate, Geobiology, 18, 760–779, https://doi.org/10.1111/gbi.12408, 2020.
Smittenberg, R. H., Gierga, M., Göransson, H., Christl, I., Farinotti, D., and Bernasconi, S. M.: Climate-sensitive ecosystem carbon dynamics along the soil chronosequence of the Damma glacier forefield, Switzerland, Glob. Change Biol., 18, 1941–1955, https://doi.org/10.1111/j.1365-2486.2012.02654.x, 2012.
von Sperber, C., Kries, H., Tamburini, F., Bernasconi, S. M., and Frossard, E.: The effect of phosphomonoesterases on the oxygen isotope composition of phosphate, Geochim. Cosmochim. Acta, 125, 519–527, https://doi.org/10.1016/j.gca.2013.10.010, 2014.
von Sperber, C., Tamburini, F., Brunner, B., Bernasconi, S. M., and Frossard, E.: The oxygen isotope composition of phosphate released from phytic acid by the activity of wheat and Aspergillus niger phytase, Biogeosciences, 12, 4175–4184, https://doi.org/10.5194/bg-12-4175-2015, 2015.
Sprenger, M., Tetzlaff, D., and Soulsby, C.: Soil water stable isotopes reveal evaporation dynamics at the soil–plant–atmosphere interface of the critical zone, Hydrol. Earth Syst. Sci., 21, 3839–3858, https://doi.org/10.5194/hess-21-3839-2017, 2017.
Tamburini, F., Pfahler, V., Bünemann, E. K., Guelland, K., Bernasconi, S. M., and Frossard, E.: Oxygen Isotopes Unravel the Role of Microorganisms in Phosphate Cycling in Soils, Environ. Sci. Technol., 46, 5956–5962, https://doi.org/10.1021/es300311h, 2012.
Tamburini, F., Pistocchi, C., Helfenstein, J., and Frossard, E.: A method to analyse the isotopic composition of oxygen associated with organic phosphorus in soil and plant material, Eur. J. Soil Sci., 69, 816–826, https://doi.org/10.1111/ejss.12693, 2018.
Tudge, A. P.: A method of analysis of oxygen isotopes in orthophosphate – its use in the measurement of paleotemperatures, Geochim. Cosmochim. Acta, 18, 81–93, https://doi.org/10.1016/0016-7037(60)90019-3, 1960.
Walker, T. W. and Syers, J. K.: The fate of phosphorus during pedogenesis, Geoderma, 15, 1–19, https://doi.org/10.1016/0016-7061(76)90066-5, 1976.
Wang, J., Wu, Y., Zhou, J., Bing, H., and Sun, H.: Carbon demand drives microbial mineralization of organic phosphorus during the early stage of soil development, Biol. Fertil. Soils, 52, 825–839, https://doi.org/10.1007/s00374-016-1123-7, 2016.
Winter, E. R. S., Carlton, M., and Briscoe, H. V. A.: The interchange of heavy oxygen between water and inorganic oxy-anions, J. Chem. Soc. Resumed, 131–138, https://doi.org/Doi 10.1039/Jr9420000631, 1940.
Zhou, J., Wu, Y., Prietzel, J., Bing, H., Yu, D., Sun, S., Luo, J., and Sun, H.: Changes of soil phosphorus speciation along a 120-year soil chronosequence in the Hailuogou Glacier retreat area (Gongga Mountain, SW China), Geoderma, 195–196, 251–259, https://doi.org/10.1016/j.geoderma.2012.12.010, 2013.
Zhou, J., Wu, Y., Turner, B. L., Sun, H., Wang, J., Bing, H., Luo, J., He, X., Zhu, H., and He, Q.: Transformation of soil organic phosphorus along the Hailuogou post-glacial chronosequence, southeastern edge of the Tibetan Plateau, Geoderma, 352, 414–421, https://doi.org/10.1016/j.geoderma.2019.05.038, 2019.