the Creative Commons Attribution 4.0 License.
the Creative Commons Attribution 4.0 License.
 | 22 Nov 2021
Combining colour parameters and geochemical tracers to improve sediment source discrimination in a mining catchment (New Caledonia, South Pacific Islands)
Virginie Sellier
Oldrich Navratil
John Patrick Laceby
Cédric Legout
Anthony Foucher
Michel Allenbach
Irène Lefèvre
Olivier Evrard
Tracing the origin of sediment is needed to improve our knowledge of hydro-sedimentary dynamics at the catchment scale. Several fingerprinting approaches have been developed to provide this crucial information. In particular, spectroscopy provides a rapid, inexpensive and non-destructive alternative technique to the conventional analysis of the geochemical properties. Here, we investigated the performance of four multi-proxy approaches based on (1) colour parameters, (2) geochemical properties, (3) colour parameters coupled with geochemical properties and (4) the entire visible spectrum to discriminate sediment source contributions in a mining catchment of New Caledonia. This French archipelago located in the south-west Pacific Ocean is the world's sixth largest producer of nickel. Open-cast nickel mining increases soil degradation and the downstream transfer of sediments in river systems, leading to the river system siltation. The sediment sources considered in the current research were therefore sediment eroded from mining sub-catchments and non-mining sub-catchments. To this end, sediment deposited during two cyclonic events (i.e. 2015 and 2017) was collected following a tributary design approach in one of the first areas exploited for nickel mining on the archipelago, the Thio River catchment (397 km2). Source (n=24) and river sediment (n=19) samples were analysed by X-ray fluorescence and spectroscopy in the visible spectra (i.e. 365–735 nm). The results demonstrated that the individual sediment tracing methods based on spectroscopy measurements (i.e. (1) and (4)) were not able to discriminate sources. In contrast, the geochemical approach (2) did discriminate sources, with 83.1 % of variance in sources explained. However, it is the inclusion of colour properties in addition to geochemical parameters (3) which provides the strongest discrimination between sources, with 92.6 % of source variance explained. For each of these approaches ((2) and (3)), the associated fingerprinting properties were used in an optimized mixing model. The predictive performance of the models was validated through tests with artificial mixture samples, i.e. where the proportions of the sources were known beforehand. Although with a slightly lower discrimination potential, the “geochemistry” model (2) provided similar predictions of sediment contributions to those obtained with the coupled “colour + geochemistry” model (3). Indeed, the geochemistry model (2) showed that mining tributary contributions dominated the sediments inputs, with a mean contribution of 68 ± 25 % for the 2015 flood event, whereas the colour + geochemistry model (3) estimated that the mining tributaries contributed 65 ± 27 %. In a similar way, the contributions of mining tributaries were evaluated to 83 ± 8 % by the geochemistry model (2) versus 88 ± 8 % by the colour + geochemistry model (3) for the 2017 flood event. Therefore, the use of these approaches based on geochemical properties only (2) or of those coupled to colour parameters (3) was shown to improve source discrimination and to reduce uncertainties associated with sediment source apportionment. These techniques could be extended to other mining catchments of New Caledonia but also to other similar nickel mining areas around the world.
- Article
(16955 KB) - Full-text XML
- BibTeX
- EndNote


At the dawn of a fourth industrial revolution, demand for metalliferous minerals continues to increase and impact the world market (Prior et al., 2013; Highley et al., 2004). Currently, open-cast mining generates more than three-quarters of the world's metal ores. However, the extraction of these minerals is associated with deleterious impacts on the environment. In particular, these mines are responsible for the increase in soil erosion and the accelerated transfer of sediment in the river systems. Indeed, bare soil areas generated by mining activities including exploitation sites, prospection areas and access roads significantly increase runoff production (Yellishetty et al., 2013; Dumas et al., 2010; Abel et al., 2000). Moreover, the extraction of mineral ore is accompanied by a sharp production of mining waste. Until the 1980s, no environmental regulation had been implemented to store this mining waste, and it was dumped directly onto the mountain slopes (Valette-Silver, 1993). Currently, this legacy of mining waste provides an active source of sediment as it can progressively be remobilized (Coulthard and Macklin, 2003; James, 2013).
New Caledonia, an island located in the south-western Pacific Ocean and currently the world's sixth-largest producer of nickel, is in particular challenged with the problems of siltation of its river systems. Several studies outline how mining activities, which started in 1875, are generally responsible for these river morphological changes (Bird et al., 1984; Iltis, 1992; Garcin et al., 2017). In this case, excessive inputs of fine and coarse sediment triggered mainly during extreme rainfall events (e.g. cyclones and tropical depressions) have led to the disturbance of the sediment cascade in the river systems. A raising and widening of the riverbed has in particular been observed in the New Caledonian river systems by Garcin et al. (2017), leading to the increased occurrence of flooding events in these tropical regions. Owing to the occurrence of major cyclones in New Caledonia (i.e. on average one cyclone every 2.7 years; Garcin, 2010), the local population regularly has to deal with the damage generated by these flood events: damage to human settlements, public infrastructure and agricultural land and human casualties. Moreover, suspended sediment is known to transport large quantities of contaminants in river systems (Kumar and Maiti, 2015; Priadi et al., 2011; Varol, 2011). Hedouin et al. (2007), and, more recently, Baudrimont et al. (2019) observed high concentrations of trace metals, including Ni and Cr, in marine and freshwater organisms in New Caledonia. These observations raise many questions about the health impact of mining activities on populations who eat a lot of fish. On a more global level, this anthropogenic activity also threatens the second largest coral reef in the world, listed as a UNESCO World Heritage site (Davis and Fox, 2009). In particular, the increased turbidity associated with sediment supply could disrupt coral metabolism (i.e. photosynthetic processes) (Juillot, 2019). These coral reefs provide an exceptional biological diversity and deliver several essential ecosystem services to the local population, including fisheries, coastal protection and tourism (Pascal, 2010). The implementation of effective and long-term sediment control measures on mining sites (e.g. sediment retention basin, revegetation) is therefore required to reduce sediment inputs into the lagoon. To this end, quantifying the sediment source contributions from mining activities becomes particularly important as the mining industries are subject to the “polluter pays” principle applied since 1975, i.e. the obligation to fund remediation according to the extent of the damage generated by mining activity to the environment (Clarke and David, 2010). Discriminating between sediment sources generated by mining activities and other potential sediment sources is therefore a real social, environmental, political and financial challenge in New Caledonia.
Indeed, other sediment sources that are not associated with mining activities, such as deforestation, farming and pasture, may contribute to sediment inputs in river systems. The use of fires to clear landscapes also increases the area of bare soils (Dumas et al., 2010). Moreover, several invasive species such as deers or wild pigs threaten soil stability through trampling and overgrazing (Shellberg et al., 2010). Soils that are left uncovered with vegetation are more sensitive to erosion, and they may be exposed to landslides (Blake et al., 2009; Smith et al., 2011).
Sediment fingerprinting techniques have been developed since the 1970s to determine the spatial origin of sediment sources and quantify their contributions (Klages and Hsieh, 1975; Walling et al., 1979; Brown, 1985). These techniques are based on the analysis of multiple conservative properties, both in the sediments and their potential sources. The properties must necessarily be conservative; i.e. the ranges of variation of these properties in the river material have to be predictable based on those measured in the sediment sources. The ability of one or more of these properties to discriminate between sources then allows the relative contribution of each source to be estimated through the use of a mixing model (Collins and Walling, 2002). Fallout radionuclides (Wallbrink, 2004; Evrard et al., 2015, 2020; Wallbrink et al., 1998) and geochemical (Laceby and Olley, 2015; Batista et al., 2018) and mineral properties (Gruszowski et al., 2003; Motha et al., 2004) are the most frequently used tracers to quantify sediment source contributions. The use of fallout radionuclides and geochemical properties as potential tracers was investigated to quantify the sources of suspended sediment in the Thio River catchment (397 km2), one of the first catchments in New Caledonia to be mined for nickel. Fallout radionuclides proved to be unsuitable (i.e. non-discriminatory), while geochemical properties provided promising results, i.e. 83.1 % of variance explained in sources (Sellier et al., 2019). The discrimination offered by geochemical properties was particularly explained by the differences in geochemical composition outlined by Sevin (2014) between the two dominant lithologies found in the archipelago: volcano-sedimentary formations covering two-thirds of the archipelago and peridotite massifs covering the remaining third, where mining activities are located. Mining erosion dominates 95 % of eroded areas identified on peridotite massifs of the Thio River catchment according to the remote sensing study carried out by Garcin et al. (2017). As a result, using geochemical properties is effective to indirectly quantify the sediment contributions from mining activities and from areas devoid of mining activities. In this case, K provides a straightforward tracer to discriminate the sediment sources (Sellier et al., 2019). Indeed, volcano-sedimentary rock formations naturally contain high K elemental contents, whereas peridotite massifs are depleted in this element in New Caledonia (Sevin, 2014). Although these initial study results were very promising, other less expensive, faster and possibly more efficient techniques than the more conventional methods previously tested could be envisaged. For example, spectroscopy in the mid-infrared (MIR) (Poulenard et al., 2009), the visible near-infrared (VNIR) and the shortwave-infrared (SWIR) (Brosinsky et al., 2014) spectra has been used to quantify the sediment source contributions. Spectroscopy is also non-destructive and requires low quantities of sample material. Spectroscopy could therefore meet the need for a simple, inexpensive, fast and portable sediment tracing method in a context where flood events are frequent. This analysis technique could also be more easily transferred to local populations so that they can carry out long-term environmental monitoring of sedimentary contributions themselves.
Moreover, the geological specificity of the archipelago provides a strong contrast in terms of soil colours observed either on the peridotite massifs or on the volcano-sedimentary formation rocks and, by extension, on the eroded sediments derived from these soils. On the one hand, the weathering of peridotite massifs naturally enriched in Fe and transition metals such as Mn, Ni, Cr and Co results in the formation of laterite profile composed of peridotites, saprolites, yellow laterites and red laterites (from the bottom to the top). Hypermagnesian and ferrallitic ferritic soils that are rich in goethite and hematite and that are formed on the surface provide a particularly reddish-orange colour to sediment derived from these exploited soils (i.e. mining sources; Fig. 1). The weathering of volcano-sedimentary formation rocks generates the formation of altered horizons rich in goethite and clay horizons rich in kaolinite (from the bottom to the top) (Denis, 1988). The eroded sediment derived from fersiallitic soils formed on the surface is characterized by a yellow-grey colour (Fig. 1). The differences made visually between the two sources further encourage the analysis of sources by spectroscopy and especially spectroscopy in the visible region of the spectrum (i.e. 365–735 nm). In particular, the colorimetric parameters derived from the visible spectrum have been shown to be effective in discriminating sediment sources. Their discrimination power has been tested both individually (Evrard et al., 2019; Martínez-Carreras et al., 2010; Uber et al., 2019) and in combination with other tracers (e.g. geochemical properties; Tiecher et al., 2015) according to the conventional fingerprinting approach (i.e. statistical analysis and use of a mixing model) (Collins et al., 1996). A more alternative approach based on the entire visible spectrum with the partial least-squares regression (PLSR) models has also been developed to trace the origin of sediment sources in the literature (Legout et al., 2013; Tiecher et al., 2015).
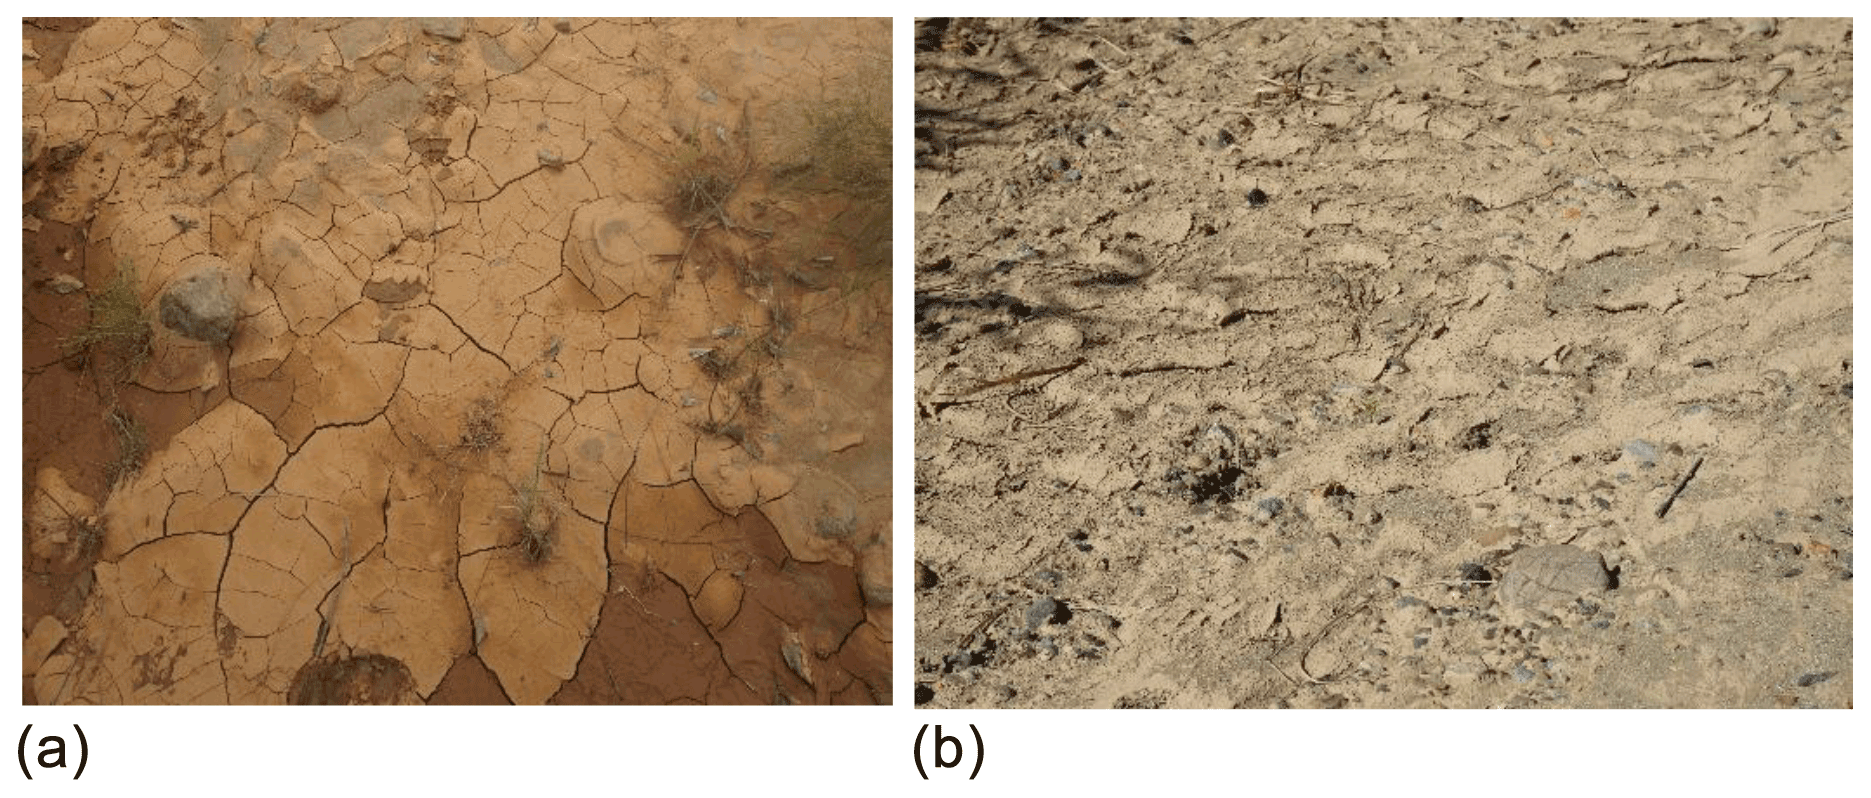
Figure 1Photographs of river material deposited on the channel banks of a mining tributary (a) and a non-mining tributary (b) in the Thio River catchment.
As part of this study, four sediment fingerprinting methods based on (1) colour parameters, (2) geochemical properties, (3) colour parameters coupled with geochemical properties and (4) PLSR models based on the whole visible spectrum were tested in the Thio River catchment. A tributary design approach was implemented to trace the origin of sediments; i.e. sediment samples collected on different tributaries were used as potential sources of the river sediment collected further downstream on the Thio River (Laceby et al., 2017). Source (n=24) and river sediment (n=19) samples were collected and analysed by X-ray fluorescence and spectroscopy in the visible spectra (i.e. 365–735 nm). For each of these sediment fingerprinting methods, the associated potential tracing properties were used in an optimized mixing model. Tests with artificial mixture samples, i.e. where the proportions of the sources were known beforehand, were carried out to evaluate the predictive performance of each model in order to select the best technique to be applied in the Thio River catchment and possibly in other mining catchments of New Caledonia.
2.1 Study area
Located in the south-western Pacific Ocean, New Caledonia (18 500 km2) is made up of several islands, the largest of which is La Grande Terre (17 000 km2). The Thio River catchment (397 km2) is located on the east coast of this island (Fig. 2a). It has a mountainous relief, with an average altitude of 416 m a.s.l. (i.e. minimum: 0 m, maximum: 1392 m; Fig. 2a) and an average slope of 45 %. Two dominant lithologies are present in the catchment: volcano-sedimentary formations, mainly located on the western part of the catchment, and peridotite massifs, concentrated in the eastern part of the catchment. Cherts (22 %), sandstone (9 %), a mix of basalt, dolerite and gabbro (6 %) and polymetamorphic rocks (6 %) mainly constitute volcano-sedimentary formations, whereas peridotite massifs are composed of laterites (18 %), peridotites (17 %), serpentines (10 %) and hazburgites (1 %) (Garcin et al., 2017) (Fig. 2b). The rock formation of these lithologies plays a key role in determining their degree of soil erodibility. In this case, Dumas (2010) described that volcano-sedimentary formations are less sensitive to soil erosion than peridotite massifs. Indeed, rocks from volcano-sedimentary formations such as basalts and cherts provide a certain resistance to erosion, whereas laterites at the top of the profile are extremely sensitive to erosion processes, which explains why most forms of concentrated erosion (e.g. gullies, rills) and mass movements are mainly observed on peridotite massifs (Fig. 3). However, the permanent vegetation covering 96 % of the Thio River catchment surface offers a relative protection against soil erosion across the catchment. Peridotite massifs naturally enriched in heavy metals have a low soil fertility, which explains why farming or pasture activities are not implemented on these soils (Quantin et al., 1997). Peridotite massifs have been exploited exclusively for their nickel resources since 1875. According to the mining registry, active and abandoned mining sites and exploration cover 21 % of the catchment area (Fig. 2c).
The Thio River catchment is subject to a tropical climate characterized by the alternation of a hot wet season (November–April; mean temperature of 27 ∘C) and a cooler dry season (May–October; mean temperature of 20 ∘C). The mean annual rainfall in the Thio River catchment is 1620 mm despite strong seasonal fluctuations, with the highest levels of precipitation recorded during the cyclonic season between January and March (700 mm, 1981–2008; Alric, 2009). Although they only occur on average once every 2.7 years, cyclones or tropical depressions may supply more than 20 % of the annual rainfall in only 1 d according to local meteorological records (Météo France).
A total of 12 major tributaries flow into the main stem of the Thio River (28 km long) (Fig. 2a). A proportion of 92 % of the river channel length is characterized by slopes lower than 5 %. According to Surell's classification (1841), the Thio River can be considered torrential, except in its estuarine section. In addition, the longitudinal connectivity is exacerbated by the 8 km2 of bare soils associated with past mining activities (∼ 10 sites), ongoing mining operations (e.g. two sites: Thio Plateau, Camps des Sapins; Fig. 2c) and the occurrence of 6 km2 of mining roads. Bare soil areas increase soil erosion processes on peridotite massifs, which, once initiated, are difficult to contain (Fig. 3). Heavy rainfall and the associated runoff exacerbate the widespread occurrence of rills, gullies and landslides (Danloux and Laganier, 1991), thus contributing to connect the sediment sources to the tributaries and consequently to the main river (Fig. 3). For low-intensity floods (i.e. <200 m3 s−1), a strong remobilization of sediments in New Caledonian river systems has been observed (Allenbach et al., 2020), thereby indicating that a lateral connectivity occurs in the Thio River catchment through the occurrence of channel bank erosion.

Figure 2Location of the rainfall and river monitoring stations (a), main lithologies (b) and location of the sediment samples collected along with tributary source classifications (c) conducted in the Thio River catchment, New Caledonia.
2.2 Hydro-sedimentary monitoring
Three rainfall stations (Thio Plateau, Thio village, Camps des Sapins; Fig. 2a) are operated by Météo France, and five others are managed by the DAVAR (Direction des Affaires Vétérinaires Alimentaires et Rurales; i.e. Kouaré, Bel-Air, Ningua, Kuenthio, Mont Do), with daily records available since 1952 for some stations (e.g. Thio village). Daily discharge has been monitored at a river gauging station located on the main stem of the Thio River (at Saint-Michel) since 1981 by the DAVAR (Fig. 2a).
2.3 Sources and river sediment sampling
In this study, two extreme events were investigated: Cyclone Murcia on 25 February 2015 and Cyclone Cook on 10 April 2017. These cyclones respectively contributed to 7 % of annual rainfall in 2015 and 25 % in 2017. They generated floods with a return period of 10 years (i.e. 3500 m3 s−1). To trace the origin of sediment, lag deposits were collected as an alternative of suspended sediment sampling on channel bars of mining tributaries (n=16), non-mining tributaries (n=8) and the Thio River (n=19) according to the tributary design approach recommended by Laceby et al. (2017) (Fig. 2c). Lag deposits were sampled after the two major floods generated by Cyclone Murcia (n=31) and Cyclone Cook (n=12). These two sample sets were respectively sampled between 30 April and 5 May 2015 and between 16 and 17 May 2017. At each sampling site, 5 to 10 subsamples of fine sediment were collected depending on the amount of observed sedimentary material. They were sampled across a 10 m2 surface with a plastic trowel at exposed subaerial sites free of vegetation on channel bars. The subsamples were composited into one sample, representative of the fine sediment deposited on the channel bars. The samples were oven-dried at 40∘ C for ∼ 48 h. Particle size selectivity may occur during the erosion, transport and deposition processes, inducing an overall finer particle size distribution in the river material compared to the sources. This selectivity can lead to a non-conservation of the fingerprinting properties. For example, certain properties are preferentially contained in a given particle size fraction, which can create a relative enrichment or conversely a relative depletion of these properties in the river material according to the particle size fraction analysed. In order to avoid this particle size effect, river sediment and source samples were sieved to 63 µm, which is the most commonly used fraction in sediment tracing research (Owens and Walling, 2002; Navratil et al., 2012).
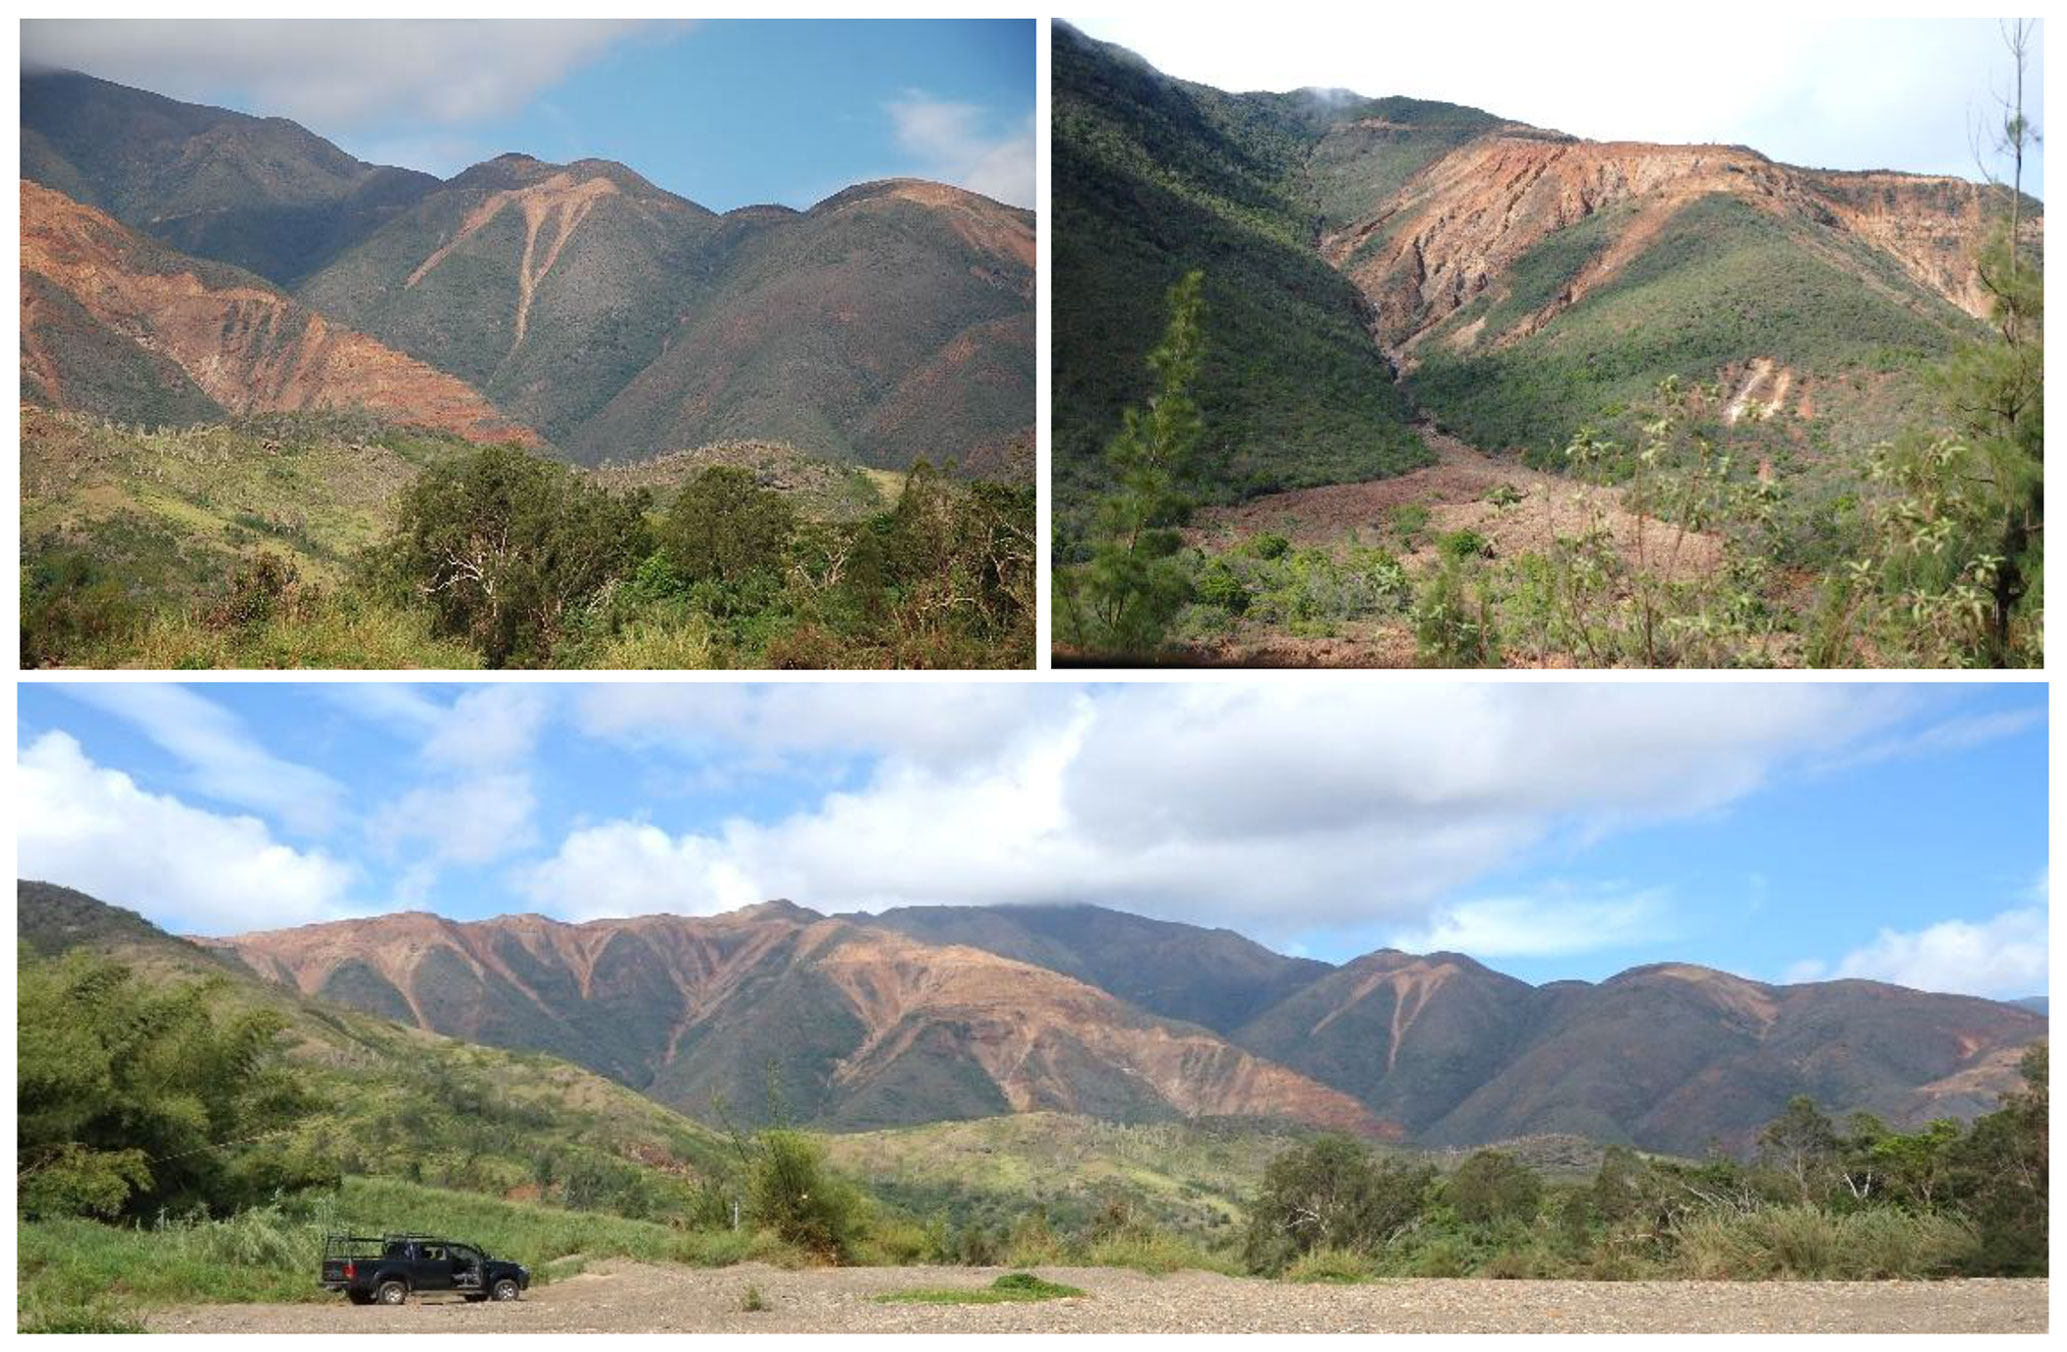
Figure 3Photographs of concentrated erosion and mass movement processes observed on peridotite massifs of the Thio River catchment.
2.4 Preparation of artificial mixture samples
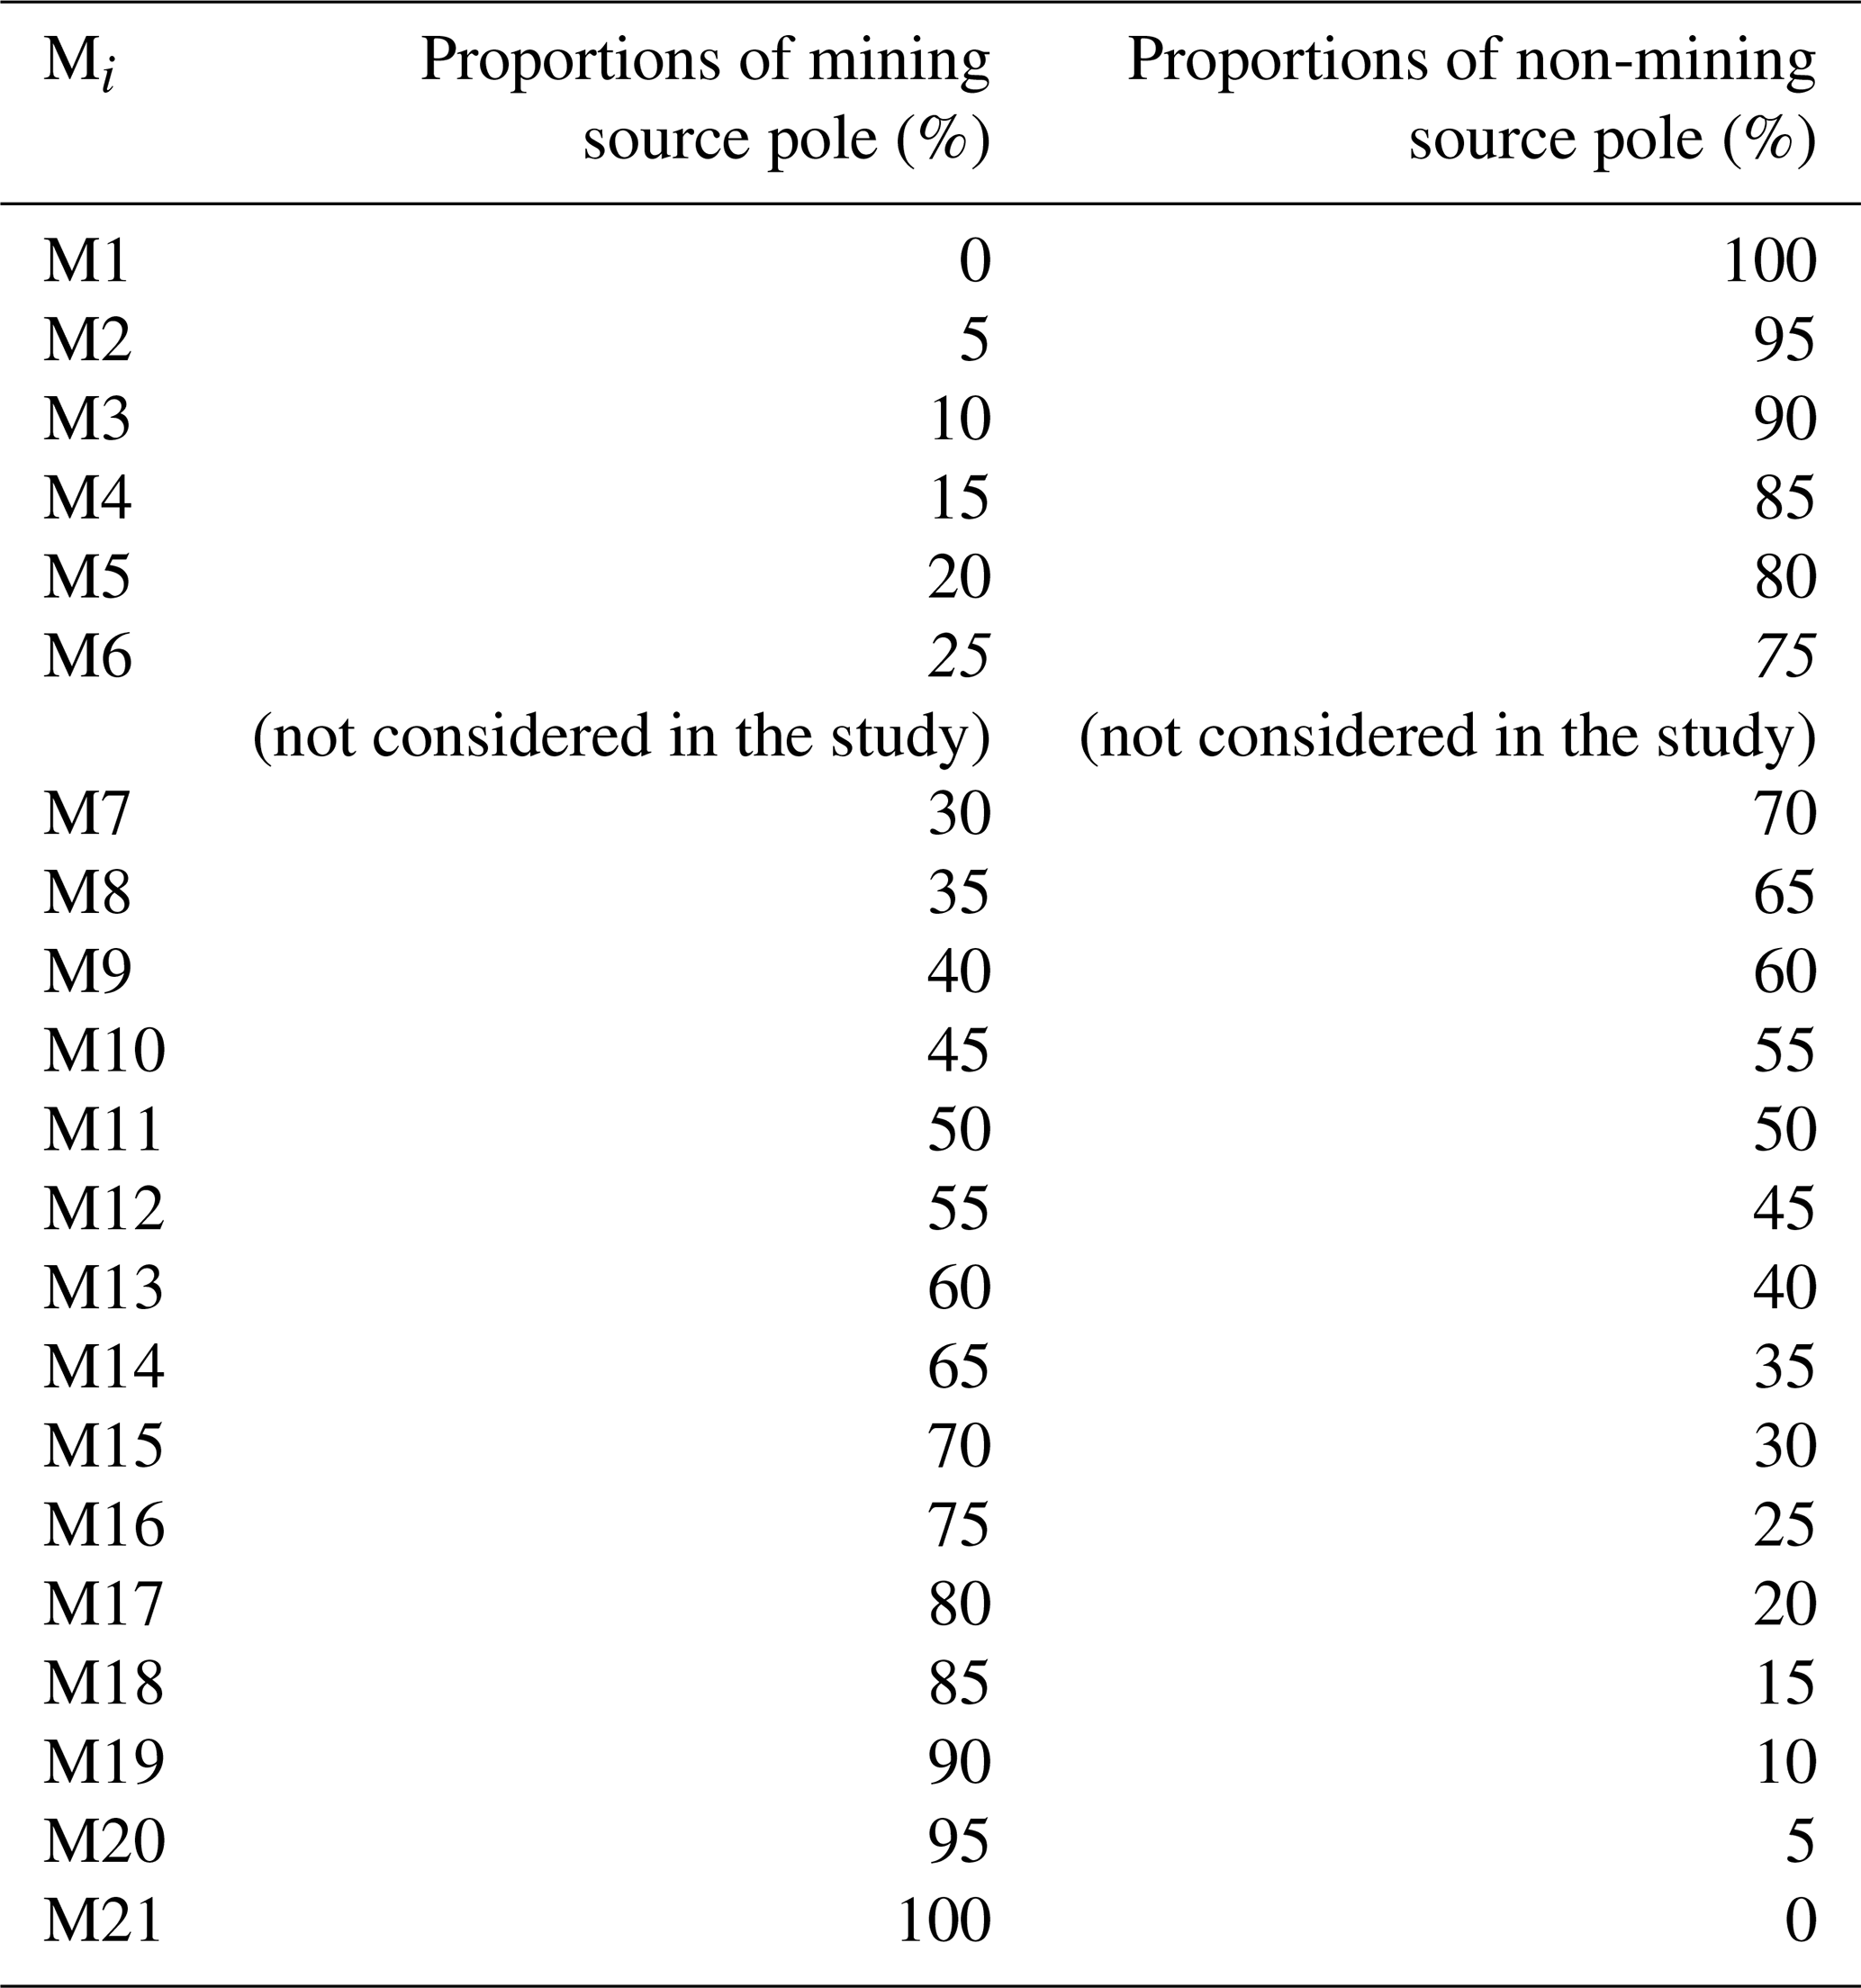
Equal quantities of all mining tributary samples (0.4 g for each sample, n=16) were mixed together to create a composite sample which would have an overall geochemical and colour signature of the mining sources in the Thio River catchment (i.e. “mining source” pole). The same process was carried out with non-mining tributary samples (0.4 g for each sample, n=8, “non-mining source” pole). Mining source and non-mining source pole samples were then mixed in known proportions to create artificial mixture samples (n=21, 0 %–100 % with a 5 % step; Table 1).
Table 1Proportions of mining and non-mining sources (%) in artificial mixture samples (Mi). M6 was withdrawn from this study because an error occurred at the time of its completion (not considered in the study, given in italics).
2.5 Source, river sediment and artificial mixture sample analyses
Spectroscopy measurements in the visible (i.e. 365–735 nm) were carried out with a portable diffuse reflectance spectrophotometer (Konica Minolta 2600d) at the Institut des Géosciences de l'Environnement (IGE, Grenoble, France). To this end, between 0.1 and 4 g of Thio River sediment (n=19), source (n=16) and artificial mixture samples (n=20) was stored in 60 mL polystyrene tubes. In order to perform the analyses, the spectrophotometer was installed on a flat surface with the measuring window facing upwards. The tubes were then placed on the 3 mm radius circle measuring cell. Because of the rather small measuring area, and to take into account the possible heterogeneity within the samples, three measurements were carried out on river sediment and sources samples for each tube. For artificial mixture samples, the experimenter who conducted the analyses performed four measurements. Spectral reflectances were measured between 365 and 735 nm with a 10 nm resolution. Several parameters were applied for each measurement: D65 illuminant, 10∘ angle observer and specular component excluded. Raw data collected correspond to the spectral reflectance percentage for each of the 39 wavelength classes. From these raw data, 15 variables of various colorimetry models were derived. Among these components, XYZ tri-stimulus values were calculated based on the colour-matching functions defined by the International Commission on Illumination (CIE 1931). The standardized tri-stimuli were then converted into CIELab and CIEL Cartesian coordinate systems using the equations provided by CIE (1976) and then into CIELch, CIEL Cartesian coordinate systems using the equations provided by CIE (1994) (Rossel et al., 2006). The first derivative reflectance of the visible spectra (FDVS) of each sample was also derived from the initial reflectance spectrum. According to Tiecher et al. (2015), the use of FDVS avoids differences in baseline positions and allows us to get rid of the small differences due to uncontrolled sources of variation, such as sample packaging. A zero and a white calibration were performed before each set of measurements. In addition, and in order to evaluate a potential drift of the device's signal, control measurements were carried with red, green and yellow panels and three contrasted sediment samples before and after each set of measurements.
Measurements of 11 geochemical elements (i.e. Mg, Al, Si , K, Ca, Ti, Cr, Mn, Fe, Ni and Zn) on the samples were conducted by pre-calibrated energy-dispersive X-ray fluorescence spectrometry (Epsilon 3, Malvern PANalytical) with certified reference samples including International Atomic Energy Agency (IAEA) standards. Correlations between the determined and the standard elemental contents were comprised between 0.90 and 0.99. The associated mean relative error was 9 % (SD 8 %). Between 0.2 and 0.5 g of the samples was packed in small mass holder (SMH) cells with an air double X-ray Mylar film and analysed at the Laboratoire des Sciences du Climat et de l'Environnement (LSCE, Gif-sur-Yvette, France). Samples were irradiated with a primary beam generated by an Rh anode X-ray tube emitting electromagnetic waves between 100 eV and 1 MeV, with a maximum power, typical current and voltage fixed to 15 W, 3 mA and 50 kV respectively. The associated Si drift detector had a Be window thickness of 8 µm and recorded the sample spectrum in a 2D optical geometry configuration. X-ray intensities were converted into concentrations using the Epsilon 3 software program through the application of the fundamental parameters method.
2.6 Statistical analysis and sediment tracing
2.6.1 Conventional mixing model
In general, the sediment source fingerprinting approach is composed of four main steps: (1) range test, (2) the Mann–Whitney U test, (3) a stepwise discriminant function analysis and (4) a mixing model (Collins et al., 1996; Laceby and Olley, 2015). For the range test, all variables exhibiting values in the river sediment samples that were outside of the range found in the potential sources (i.e. between the minimum and maximum values found in source samples) were excluded from the analysis. It is important to restrict the tracing parameters to those that show a conservative behaviour to avoid incorrect source prediction and consequently inaccurate estimations of source contributions (Sherriff et al., 2015). Thereafter, the Mann–Whitney U test (α=0.05, p value < 0.01) was performed to evaluate whether conservative variables could discriminate mining tributary samples versus non-mining tributary samples. A stepwise discriminant function analysis (DFA) was independently run on three sets of potential tracing properties: (1) colour parameters (i.e. “colour”), (2) geochemical properties (i.e. “geochemistry”) and (3) colour parameters and geochemical properties (i.e. “colour + geochemistry”). For the last set, the raw values of the variables were normalized in order to make them comparable. Indeed, several colour parameters were within an order of magnitude of around 0.01, whereas for the geochemical parameters the difference was around 106 mg kg−1, which resulted in a poorly conditioned matrix for the DFA.
The following calculation was therefore applied on the variable values to normalize them: , where xi was the value found in the source sample (i), and xmin and xmax were respectively the minimum and maximum values found in the source samples. The DFA was carried out to select the optimal number of potential tracers to discriminate the sources for each modelling approach with the optimal number of potential tracers which must provide the lowest Wilks lambda value from analysis of variance. Indeed, the closer the Wilks lambda value is to 1, the lower the variability within the sources compared to the total variability. The DFA was performed in the backward mode with a p>0.01 used to select a tracer and p<0.01 used to remove a tracer. The Statistica software was used to carry out the DFA because it has the advantage of automatically identifying and eliminating collinear variables.
Finally, a classical solver-based mixing model was used to model the source contributions from the mining and non-mining tributaries to target sediment through simultaneously minimizing the mixing model difference (MMD) (Evrard et al., 2019):
where n is the number of parameters in the model chosen by the selection process (i.e. steps 1, 2, 3); Ci is the Thio River sediment sample parameter (i); x and (1−x) were respectively the contributions of source A and B (i.e. mining and non-mining tributaries); and Ai is the mean of parameter (i) in source A and Bi is the mean of parameter (i) in source B. The proportional contribution from each source (x) was modelled by solving Eq. (1) with the Solver function in Microsoft Excel, with x being between 0 and 1 and the sum of source contributions (i.e. x and 1−x) equalling 1. The GRG non-linear solving method was used with automatic scaling in Solver, ignoring integer constraints, with a maximum run time of 5000 and allowing for 2500 iterations. For each of the 2500 iterations, the values of the variables were determined randomly with respect to their initially fixed ranges of values. A constraint precision and convergence of were selected for each of the model runs. To test the reliability of the colour, geochemistry and colour + geochemistry models, these were tested on artificial mixture samples.
2.6.2 FDVS- PLSR model
FDVS-PLSR models were built following the methodology described in Poulenard et al. (2012). The first step consisted in applying a principal component analysis (PCA) to evaluate the overall variability between FDVS values (i.e. 38 wavelength classes) of source samples. Subsequently, a discriminant analysis (DA) was conducted based on the PCA scores. The purpose of this analysis was to compare the Mahalanobis distance between sources samples and to determine if the FDVS of source samples could discriminate the sources. Relationships between FDVS (x variate) and the corresponding weight contribution of the sediment source data sets (y variate) were analysed using PLSR. The PLSR models were carried out based on the component set providing the lowest predictive error (PRESS, option on XLStat software). Two independent PLSR models were built to estimate the two sediment source contributions. As the artificial mixtures were measured four times by spectroscopy, 84 FDVS values of artificial mixture samples were generated, including 50 values that were randomly selected to build the models (training set (ST)) and 34 to validate the models (validation set (SV)). The SV : ST ratio used was approximately 1:2, which is in agreement with recommendations provided in the literature (Daszykowski et al., 2002). To evaluate the performance of PLSR models, several indicators such as the coefficient of linear regression (r2), root mean square error of calibration (RMSEC) and root mean square error of prediction (RMSEP) values were calculated. Unlike the conventional fingerprinting approach, the estimated contributions of sources were not limited to be in the range of 0 % and 100 %. In a similar way, the sum of source contributions was not constrained to be equal to 100 %. As a result, another way to control the reliability of predictions was to sum the prediction proportions of both models (Legout et al., 2013). FDVS values of river sediment samples were then introduced into these PLSR models to estimate the contribution of sediment sources.
3.1 Source description
The ranges of values of all colour parameters measured in the Thio River sediment samples systematically lay within the range of values observed in the two potential sources (i.e. mining and non-mining tributaries; Fig. 4 and Table 2). The range test results confirmed the conservative character of these parameters. For geochemical properties, elemental concentrations measured in the river sediment also plotted within the range of concentrations found in sources (Sellier et al., 2019). In a similar way, the range tests applied on geochemical properties showed that all these properties were also conservative.
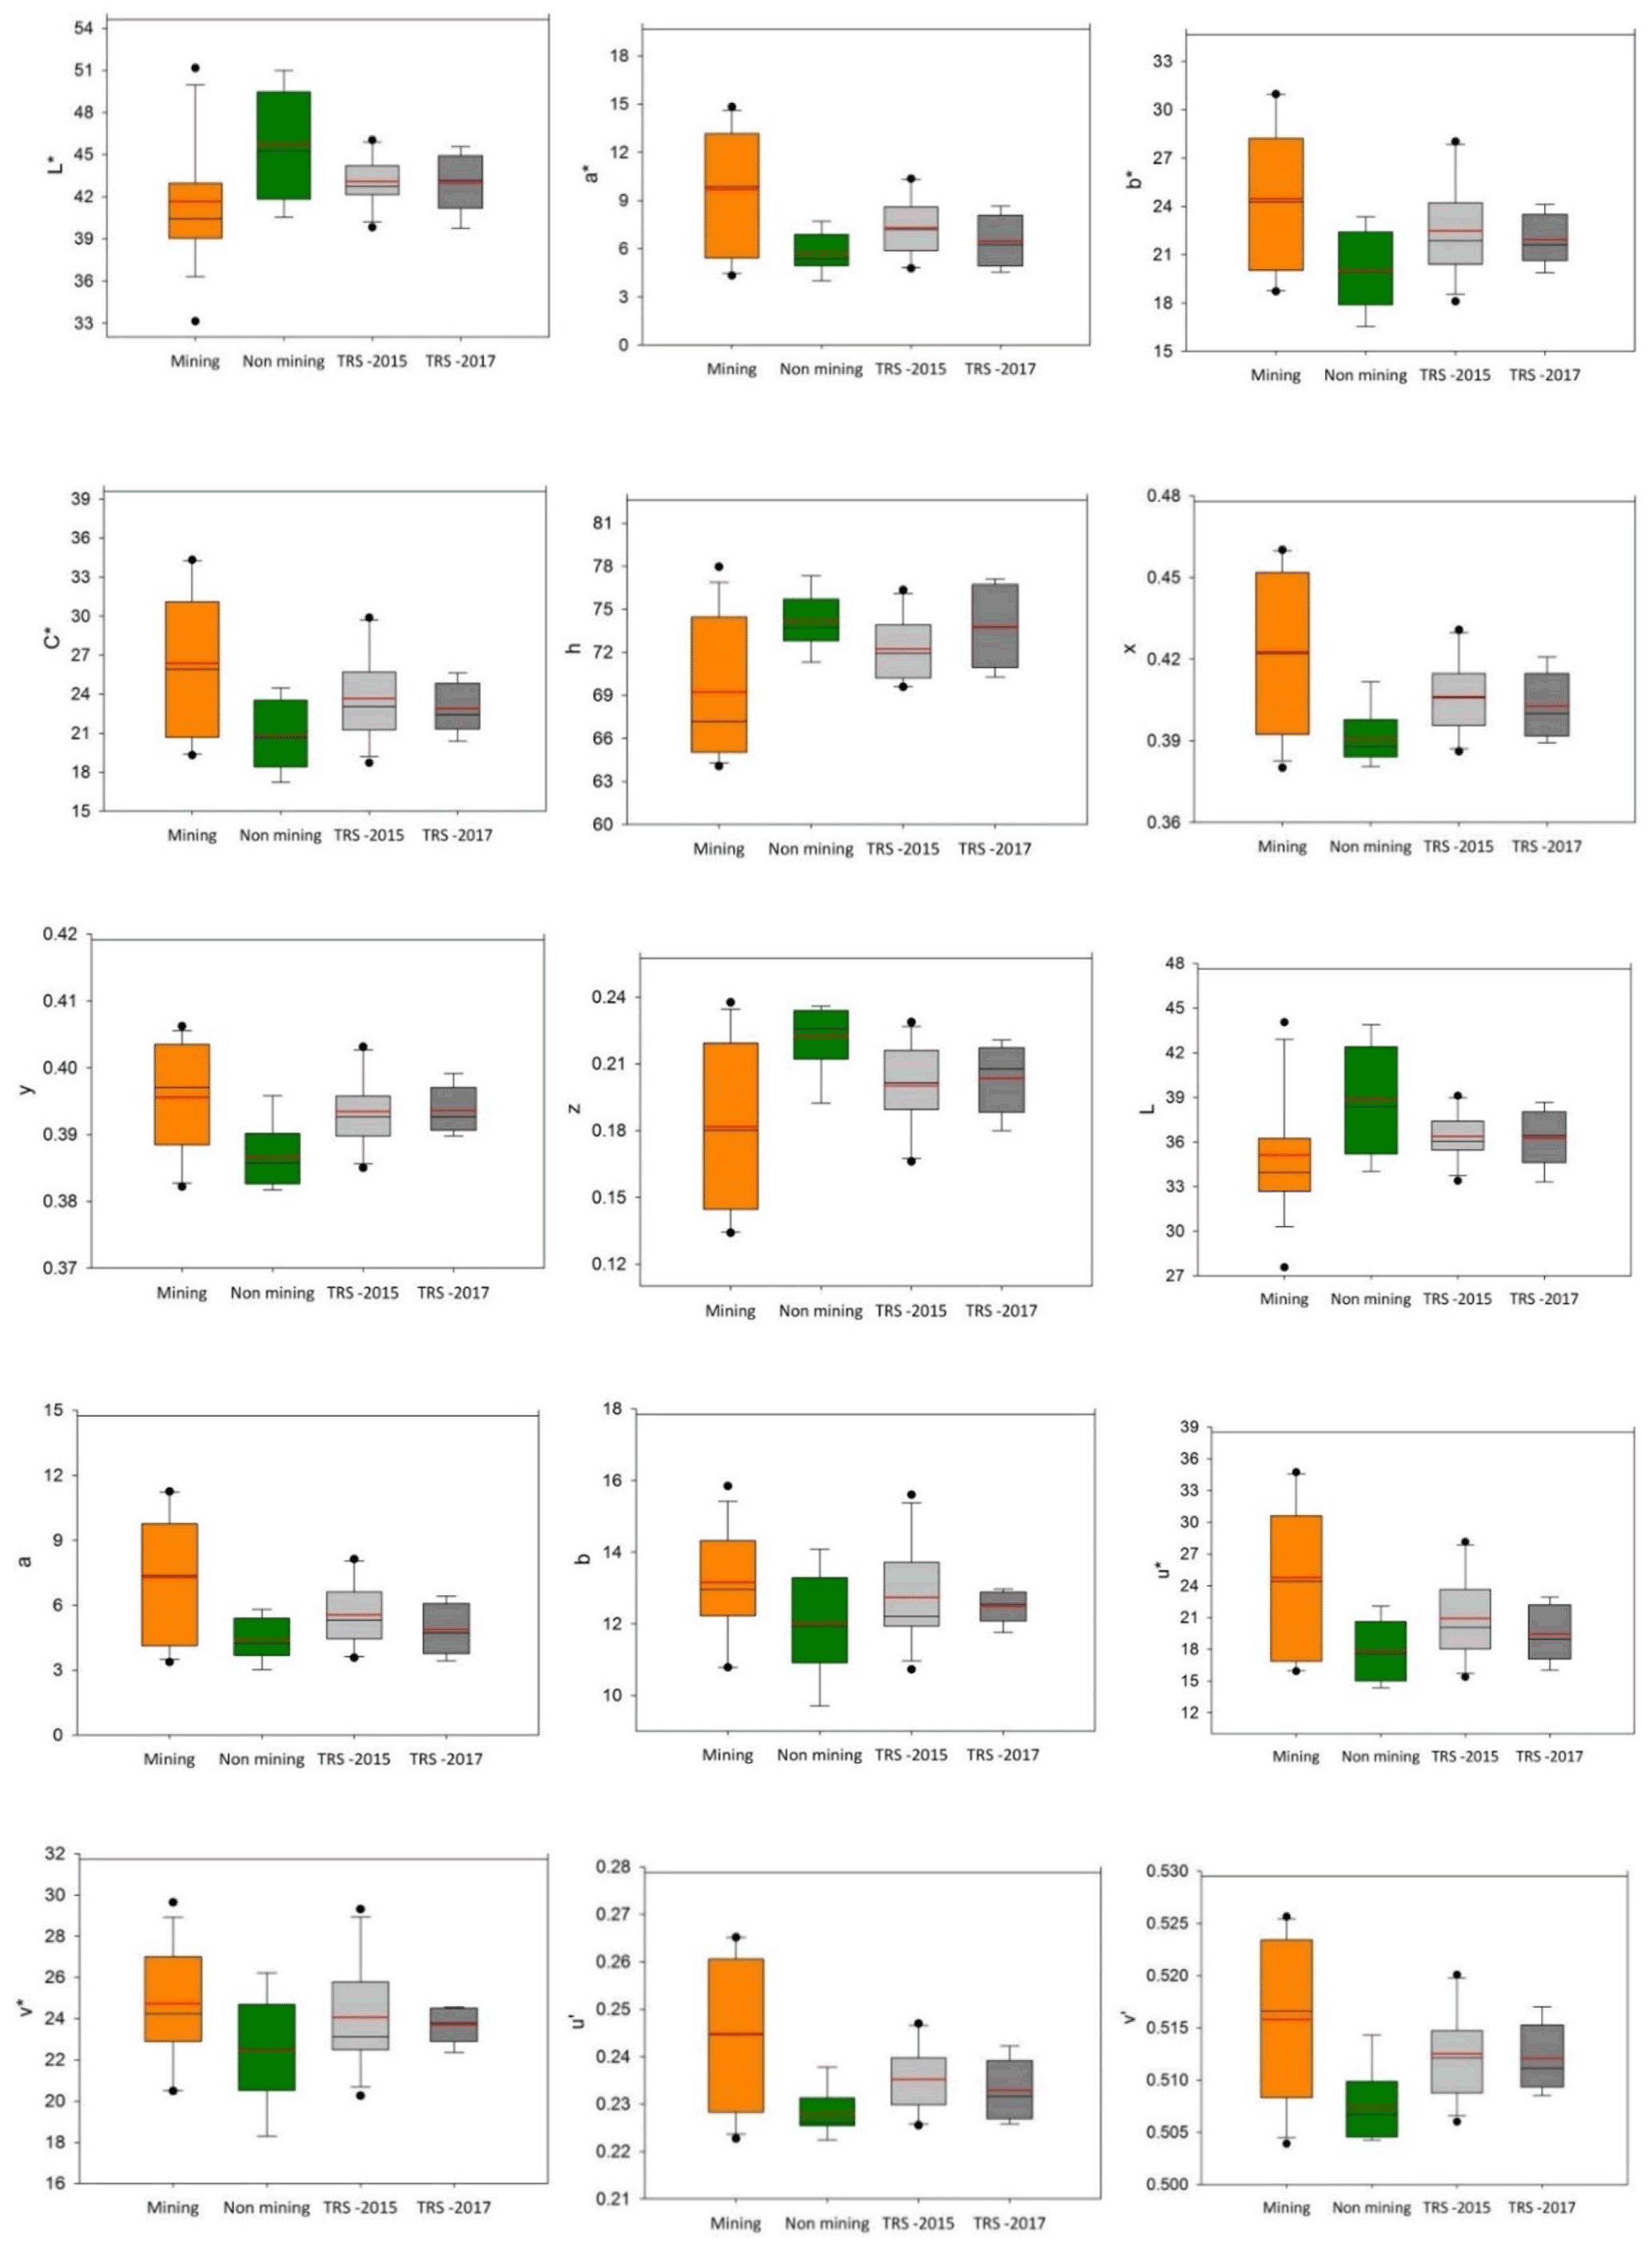
Figure 4Box plots of colour parameter values in the <63 µm fraction of sediment collected on the mining tributaries (mining), non-mining tributaries (non-mining) and the main Thio River (Thio River sediment (TRS) flood events of 2015 and 2017). The box indicates the location of the first and third quartiles; the black line indicates the median value; the red line indicates the mean value.
Table 2Mean values of geochemical element contents and colour parameters in the <63 µm fraction of sediment sources and Thio River sediment (SD: standard deviation); results of Mann–Whitney U test and individual DA used to identify the potential tracers to differentiate sources supplying sediment to the Thio River.

3.2 Selection of parameters/properties for modelling
3.2.1 Colour model
According to the Mann–Whitney U test results, six colour parameters (i.e. b∗, C∗, x, y, z, v′) provided significant discrimination between the two sediment sources (i.e. p value < 0.01; Table 2). The backward DFA selected only v′ as the optimal tracer of mining and non-mining source sediments (Fig. 4, Table 3). Although this parameter correctly classified 79.2 % of sources, the high Wilk's lambda value obtained (i.e. 0.7209, Table 3) showed that only 27.9 % of variance was explained by v′. The low Mahalanobis distance value obtained (i.e. 1.6) confirmed that sediment sources were not well separated. Accordingly, and owing to the high error percentage of the source discrimination provided by this approach (i.e. 72.1 %), source contributions were not modelled with the colour model.
3.2.2 Geochemistry model
When considering the two potential sediment sources, all geochemical properties (except Zn) were selected as potentially discriminant by the Mann–Whitney U test (i.e. p value < 0.01, Table 2). Among the 10 potential tracers, K was selected by the backward DFA to model sediment source contributions from mining and non-mining tributaries, with 95.3 % of sources correctly classified and 83.1 % of variance explained by K. This percentage of variance explained was deduced from the final Wilk's lambda value obtained (i.e. 0.1691). Moreover, the Mahalanobis distance value showed that the sediment sources were well separated from each other, with a significant distance of 20.3 (Table 3) (Sellier et al., 2019).
3.2.3 Colour + geochemistry model
When combining colour parameters and geochemical properties, the DFA selected five optimal tracers (i.e. K, Ca, Ti, b∗, C∗) able to correctly classify 100 % of the sources. A significant improvement in the source discrimination was observed with the lowest Wilk's lambda value obtained (i.e. 0.0734) and the highest percentage of variance explained (i.e. 92.6 %). Moreover, the Mahalanobis distance value obtained (i.e. 52.1) was more than 2.5 times higher than that estimated with the geochemistry model (Table 3), thus resulting in a better separation between sediment sources than the previous approach (i.e. geochemistry).
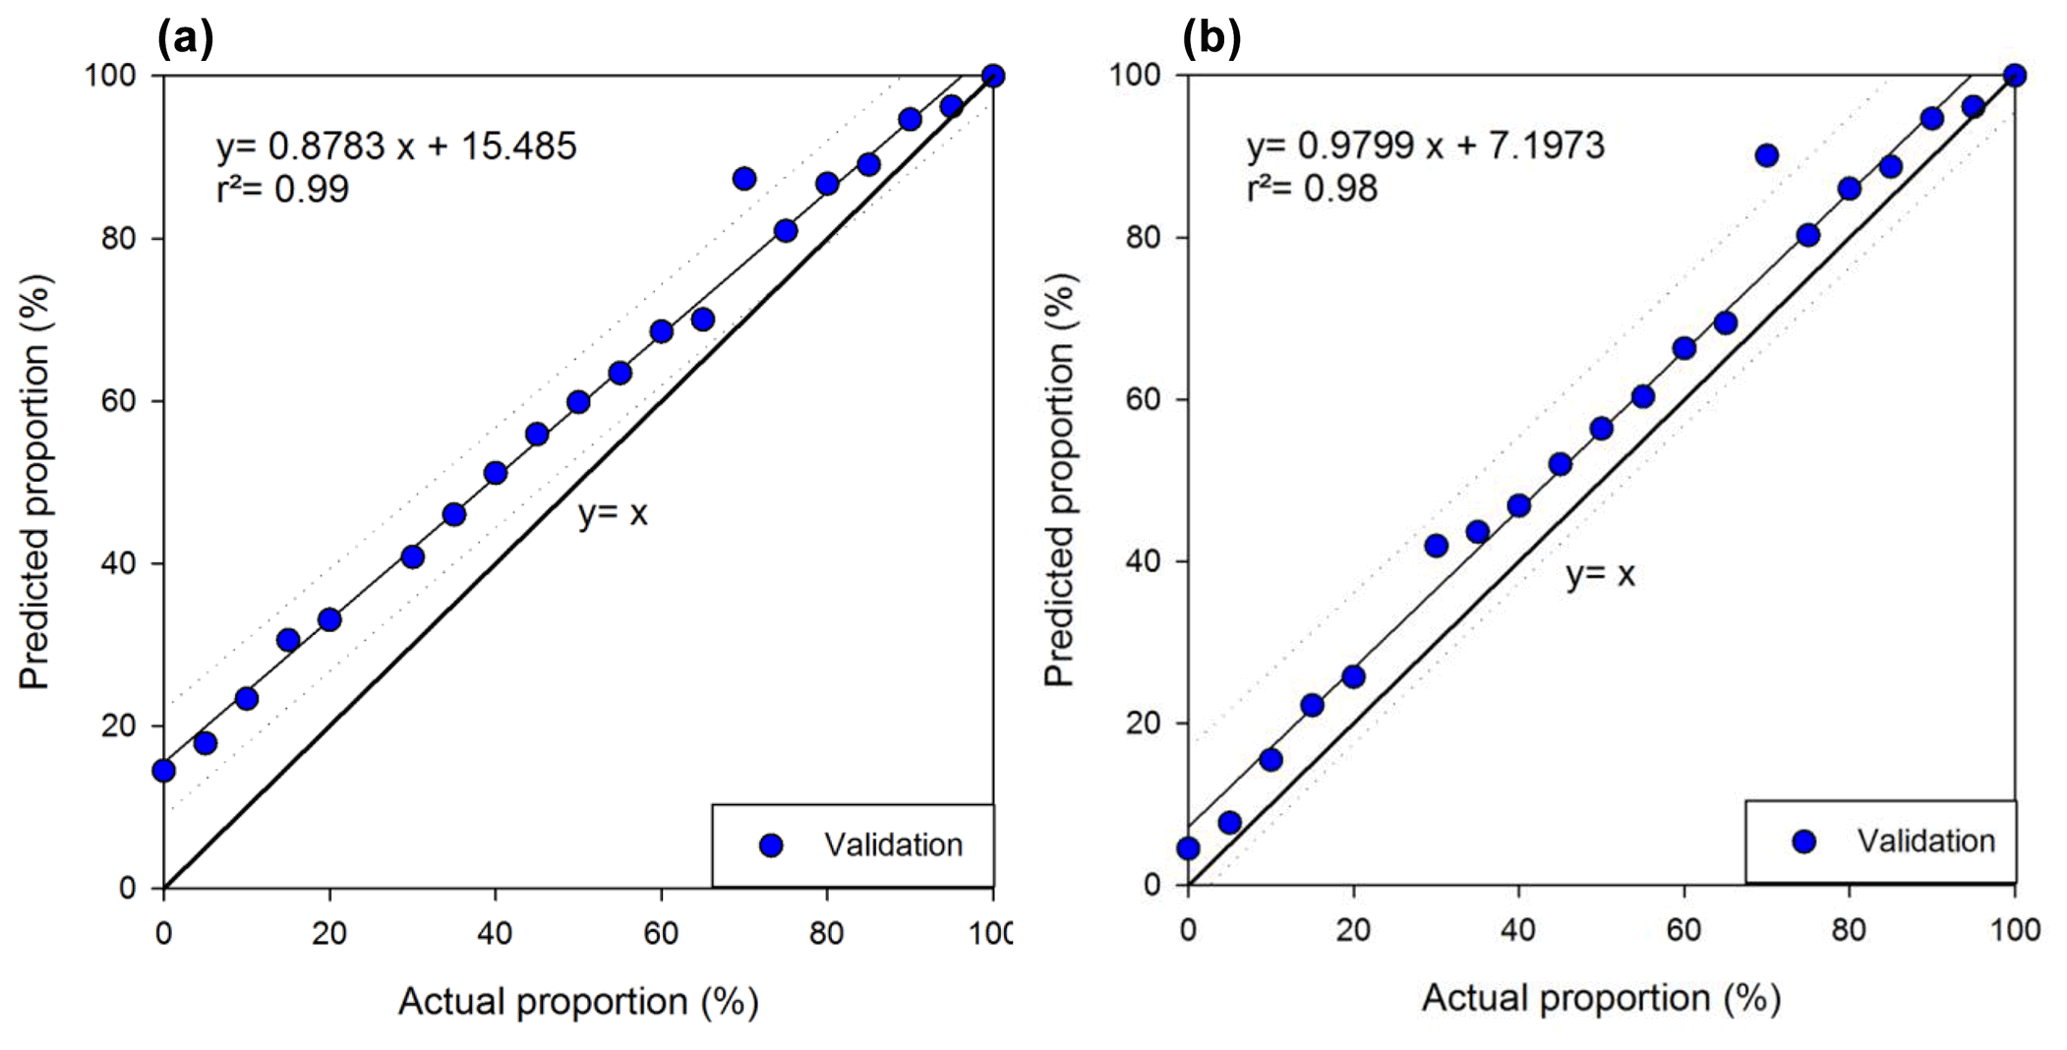
Figure 5Comparison between actual mining source proportions prepared in artificial mixtures and the mining source proportions predicted by the geochemistry (a) and colour + geochemistry (b) models.
3.3 Assessment of model performance on artificial mixture samples
Prior to applying mixing models to river sediments, preliminary tests were conducted to control the validity of the models (i.e. geochemistry and colour + geochemistry) and the associated estimations of source contribution errors. When applying these models on the artificial mixture samples, actual and predicted proportions were well correlated for both models (i.e. r2=0.99 and r2=0.98 respectively for geochemistry and colour + geochemistry models, SDmax=3 %) (Fig. 5).
However, the geochemistry model described in Fig. 5a showed that the contributions of mining tributaries were overestimated. With 100 % of actual mining contributions, 100 % of mining contribution was predicted by the model. However, instead of 0 % of actual mining contributions, a mining contribution of 15.5 % was predicted by the model. It means that the more the estimated mining source contribution tends towards 0 %, the greater the associated overestimation (i.e. maximum 15.5 %) (Fig. 5a). The colour + geochemistry model also provided a slight overestimation of the contribution of mining tributaries (i.e. 7 % intercept of the regression line; Fig. 5b). Given the slope of the regression line calculated is close to 1 (i.e. 0.98), this 7 % overestimation remains constant over the entire range of potential contributions.
3.4 Building partial least-squares models based on FDVS
Mining sources are characterized by a red-orange colour, while sediments originating from non-mining sources have a yellow-grey colour (Fig. 1). The colour contrasts may be explained by the distinct geochemical composition of these sources. Mean FDVS values indicated the presence of goethite (i.e. at 445 and 525 nm), hematite (i.e. at 555, 565 and 575 nm) and organic matter (i.e. between 600–700 nm) (Debret et al., 2011) in both mining and non-mining sources (Fig. 6). In a similar way, the Thio River sediment samples (2015, 2017) showed similar characteristics since the variations of the mean FDVS remained between those found in the sources (Fig. 6). Nevertheless, some differences can be observed between the sources. The spectral signature of goethite is slightly stronger at 445 nm in non-mining tributaries compared to mining tributaries. No difference between sources was observed at 525 nm, the second wavelengths characterizing the presence of goethite. In contrast, the spectral signature of hematite (i.e. at 555, 565 and 575 nm) was stronger in mining tributaries than in non-mining tributaries.
Table 3Results of DFA used to identify the optimum tracer combination to differentiate sources supplying sediment to the Thio River.

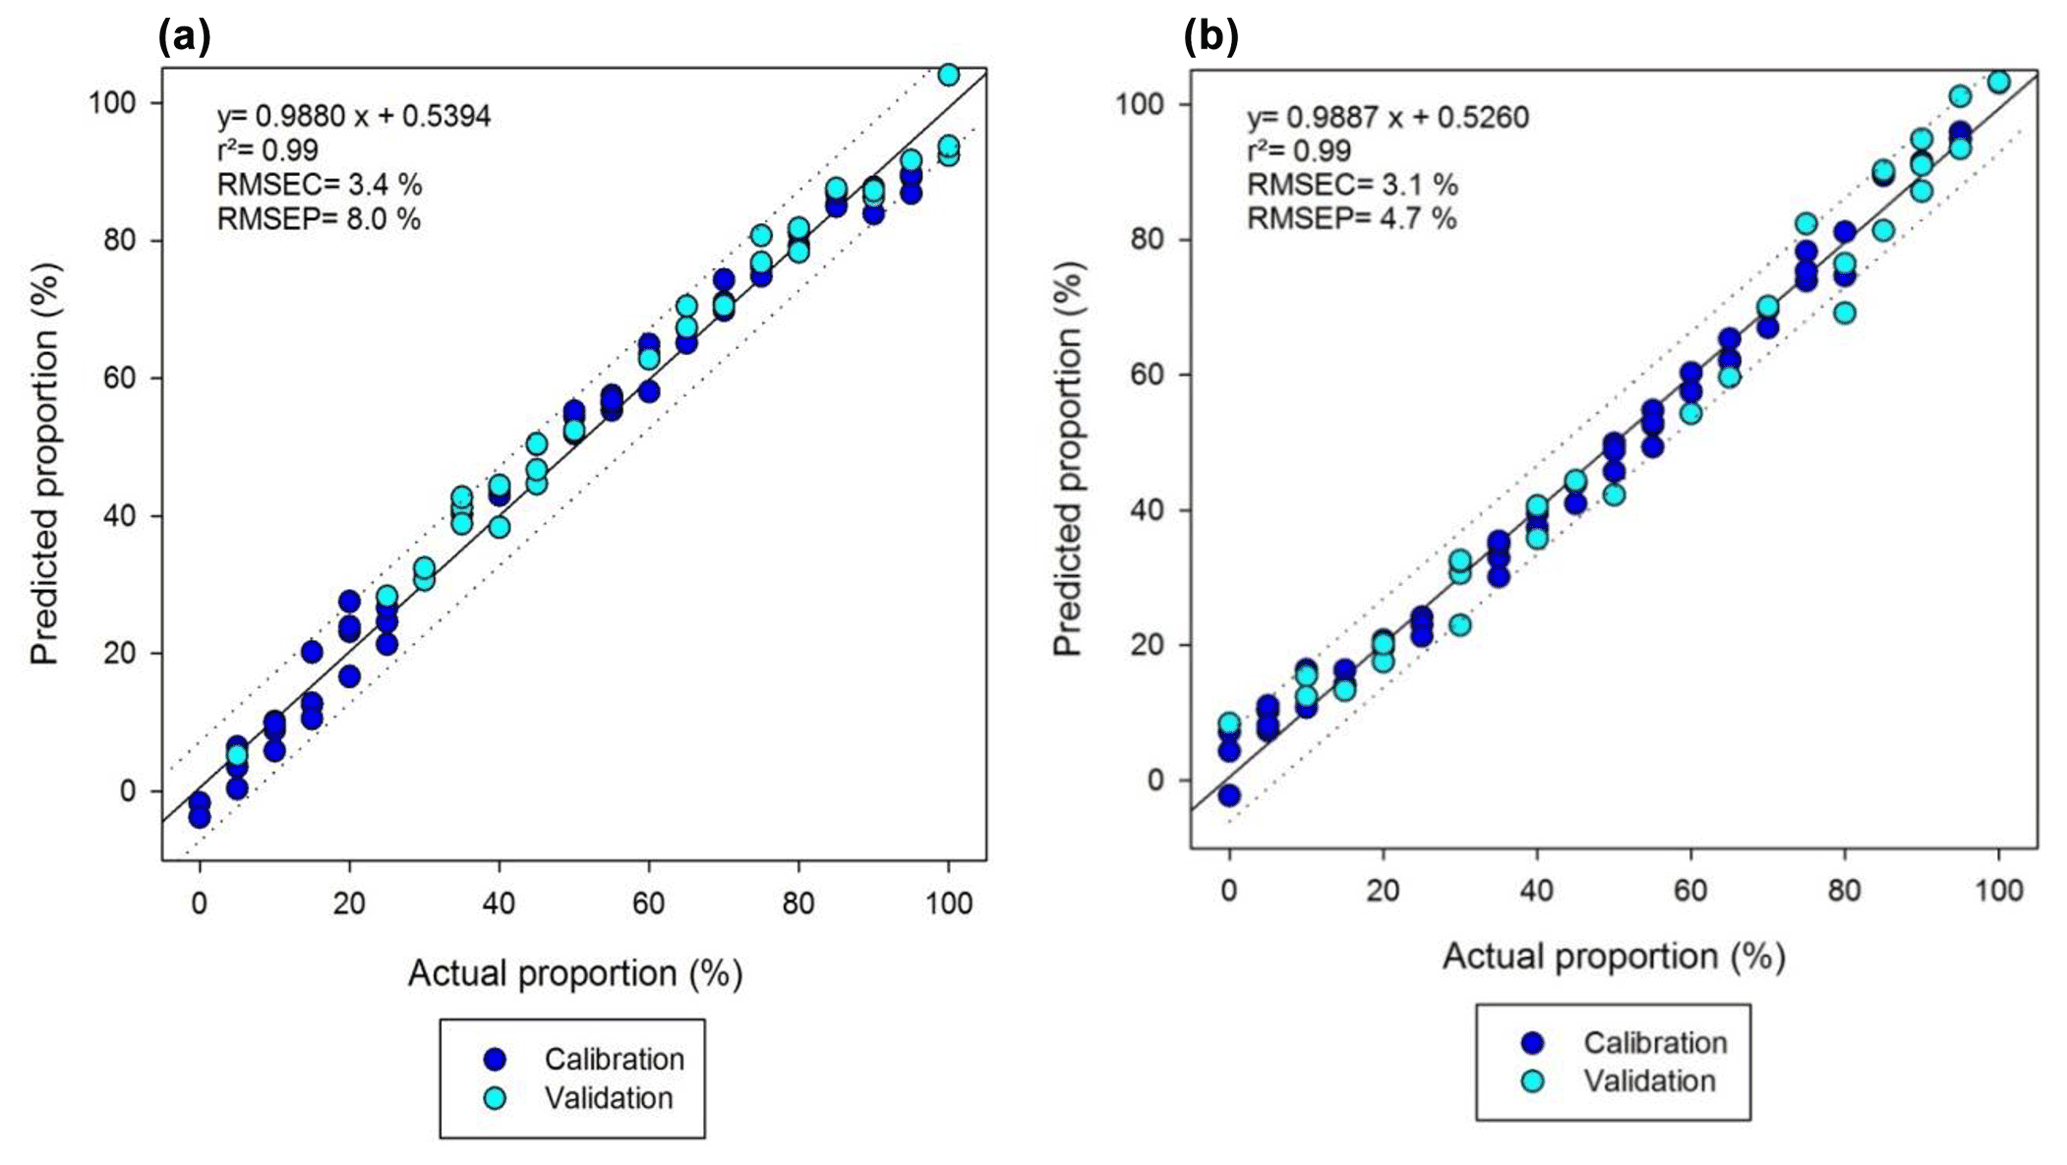
To test the potential discrimination offered by FDVS, a PCA was applied on the source data set. The first 10 principal components from PCA explained 99 % of the total variation in the spectra. The DFA performed on these components resulted in a final Wilks lambda value of 0.1585. In other words, 84.1 % of variance is explained by these 10 components. Moreover, 100 % of the source samples were correctly classified. The performances of FDVS-PLSR models are presented in Fig. 7. The mining and non-mining tributary FDVS-PLSR models provided an excellent correlation between actual and predicted proportions, with r2 and slopes close to 1 and intercepts of linear regression close to 0. The root mean square error of calibration (RMSEC) values estimated for both models were low, i.e. 3.4 % and 3.1 % respectively for mining (Fig. 7a) and non-mining tributary models (Fig. 7b). These models also provided a good predictability of source contributions, with low root mean square error of prediction (RMSEP) values (i.e. 8.0 % and 4.7 % respectively for mining and non-mining tributary models). Another way to control the reliability of predictions was to sum the predicted proportions of both models (Legout et al., 2013). Considering the whole data set used in the construction of the partial least-squares regression models (i.e. calibration and validation) led to a mean sum of the predicted source proportions of 102 % (SD 3 %, range: 98 %–114 %), thus highlighting the effective prediction performance of FDVS-PLSR models.

3.5 Source apportionment modelling
3.5.1 Geochemistry model
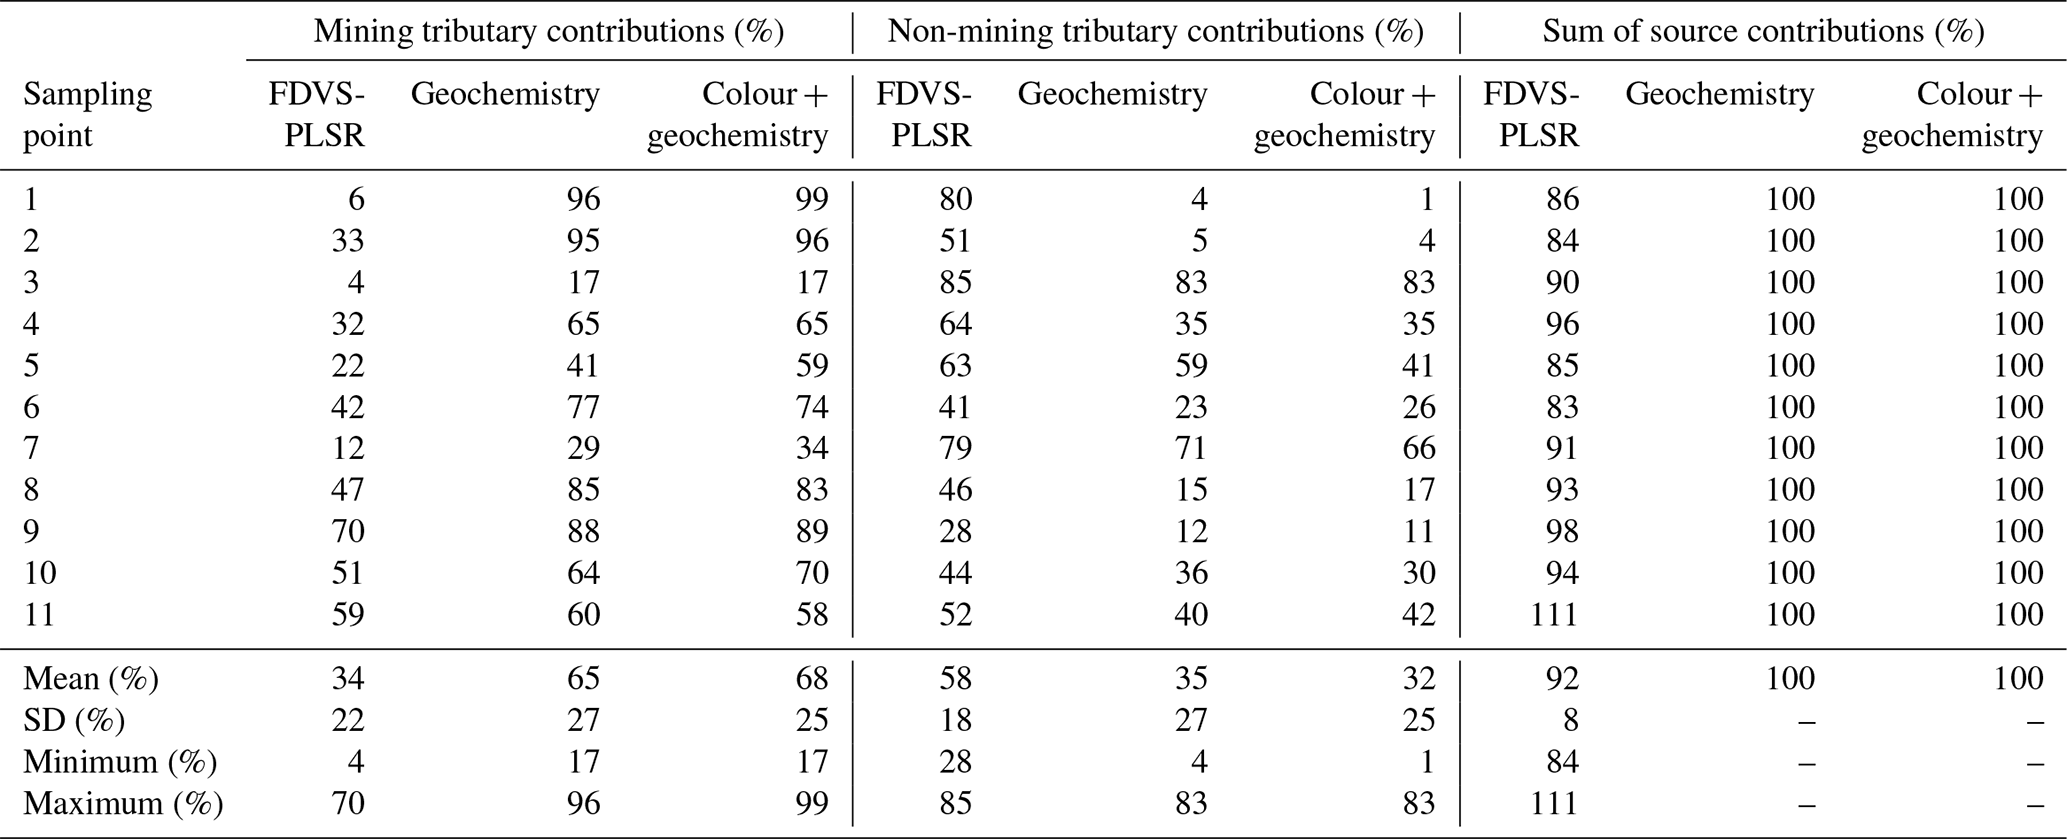
The geochemistry model estimated that the mining tributaries contributed an average of 65 ± 27 % of the Thio River sediment during the 2015 flood event; they therefore dominated sediment inputs overall during this event. Nevertheless, non-mining tributaries mainly contributed to the sediment inputs at three sampling points along the Thio River (Fig. 8a, Table 4, sampling points 3, 5, 7). These contributions did not, however, compensate for those provided by mining tributaries in the estuary (63 %–89 %). Indeed, the dominant mining contributions found in upstream river reaches (96 %, Fig. 8a, Table 4, sampling point 1) gradually decreased along the Thio River, fluctuating between 17 %–77 % before increasing again at the confluence between the Thio River and the mining tributaries draining the Thio Plateau mining area (i.e. 85 %, Fig. 8a, Table 4, sampling point 8) and reaching 60 %–64 % in the estuary.
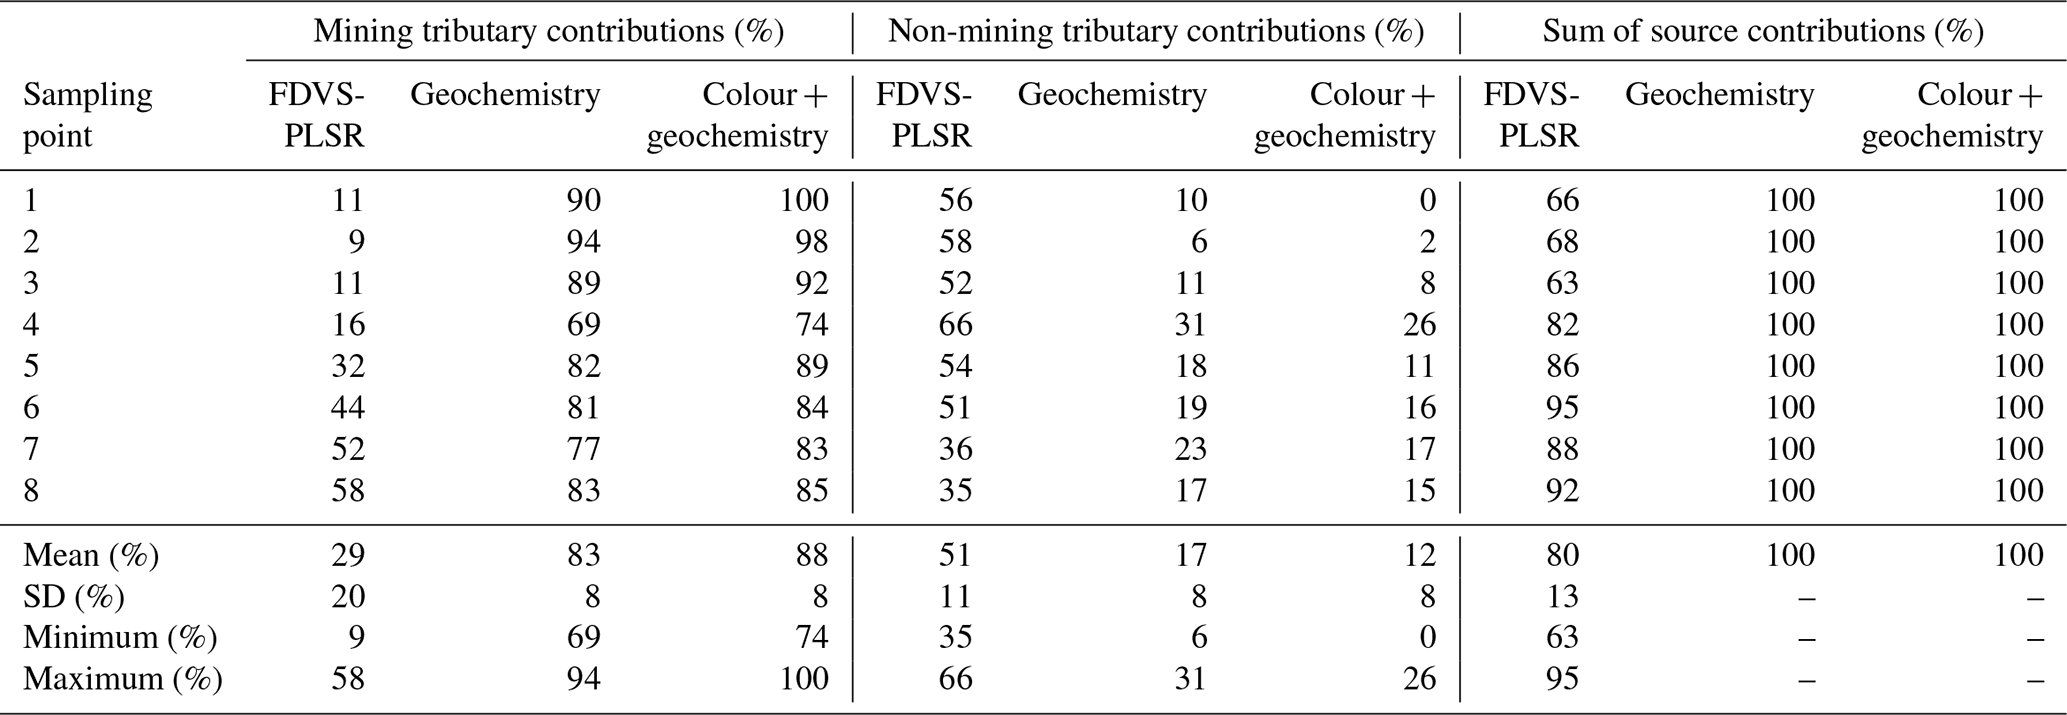
The geochemistry model also demonstrated that mining tributaries dominated sediment inputs, with a mean contribution of 83 ± 8 % during the 2017 flood event (Table 5). The lowest mining tributary contributions estimated (i.e. 69 %) was found after the confluence with the Kouaré non-mining tributary (Fig. 8b, Table 5, sampling point 4). Nevertheless, further downstream, the proportions of the mining sources increased again to reach 77 %–83 % in the estuary (Fig. 6b, Table 5, sampling points 7, 8).
3.5.2 Colour + geochemistry model
Similar results were obtained with the colour + geochemistry model. The contributions of mining tributaries were estimated to an average of 68 ± 25 % for the 2015 flood event. Mining tributary contributions provided almost all the sediment transiting the uppermost reach of the Thio River (i.e. 99 %, Fig. 9a, Table 4, sampling point 1). However, after the confluence with the Kouaré tributary, non-mining tributaries dominated, with a contribution of 83 % (Fig. 9a, Table 4, sampling point 3). Further downstream, the contribution of mining tributaries increased again, with supplies varying between 34 %–89 % to reach 58 %–70 % in the estuary (Fig. 9a, Table 4). The largest difference between geochemistry and colour + geochemistry model outputs was 18 % for the 2015 flood event.
The colour + geochemistry model also demonstrated that 88 ± 8 % of the sediment supply originated from mining tributaries during the 2017 flood event. Along the Thio River, mining tributary contributions varied between 100 % in the uppermost reach, 74 % after the Kouaré river confluence and 83 %–85 % in the estuary (Fig. 9b, Table 5). The largest difference between geochemistry and colour + geochemistry model outputs was 10 % for the 2017 flood event (Table 5).

Figure 8Relative contributions of mining and non-mining tributaries to the sediment collected in the Thio River during the 2015 (a) and 2017 (b) flood events using the geochemistry model.
3.5.3 FDVS-PLSR model
Unlike the conventional fingerprinting approach, the estimated contributions of sources were not limited to vary in the range between 0 % and 100 %. In a similar way, the sum of source contributions was not constrained to be equal to 100 %. As a result, another method to control the reliability of predictions was to sum the predicted proportions of both models and to verify that this sum was close to 100 % with an acceptable error of ±20 %. If this point is not verified, it is likely that a potential source has not been sampled and considered in the study or that the behaviour of the fingerprinting properties is not conservative (Legout et al., 2013). When applying the FDVS-PLSR models (i.e. mining and non-mining tributary contributions) to the river sediment samples (2015, 2017), the mean sums of the source contributions were 92 ± 8 % and 80 ± 13 %, respectively, for the 2015 and 2017 flood events (Tables 4 and 5), which are satisfactory results. However, for the 2017 flood events, three river sediment samples collected at sampling points nos. 1, 2 and 3 showed sums of source contributions below 70 %, indicating a lack of reliability of the model. The results obtained at these three points must therefore be interpreted with great caution. Moreover, and because the predicted sums were slightly different from the expected 100 %, a bar plot display of the source contributions has been chosen to facilitate the interpretation of the results (Fig. 10).
According to the FDVS-PLSR model results, 34 ± 22 % of sediment supply originated from mining tributaries, while non-mining tributary contribution provided 58 ± 18 % of the sediment input for the 2015 flood event (Fig. 10a, Table 4). In the upper part of the Thio River catchment, non-mining tributaries largely dominated, with a contribution of 80 % versus 6 % for mining tributaries. Along the Thio River, mining tributary contributions gradually increased to reach 70 % after the Mué tributary confluence (i.e. one of the tributaries draining the Thio Plateau mine; Fig. 8a, Table 4, sampling point 9). The non-mining tributary contributions fluctuated along the Thio River between 41 %–85 % (Fig. 8a, Table 4, sampling points 2–8) and reached a minimum of 28 % (Fig. 10a, Table 4, sampling point 9) after the Mué tributary confluence. In the estuary, sediment supply was originated from 51 %–70 % of mining tributaries and 28 %–52 % of non-mining tributaries (Fig. 10a, Table 4, sampling points 9, 10, 11).
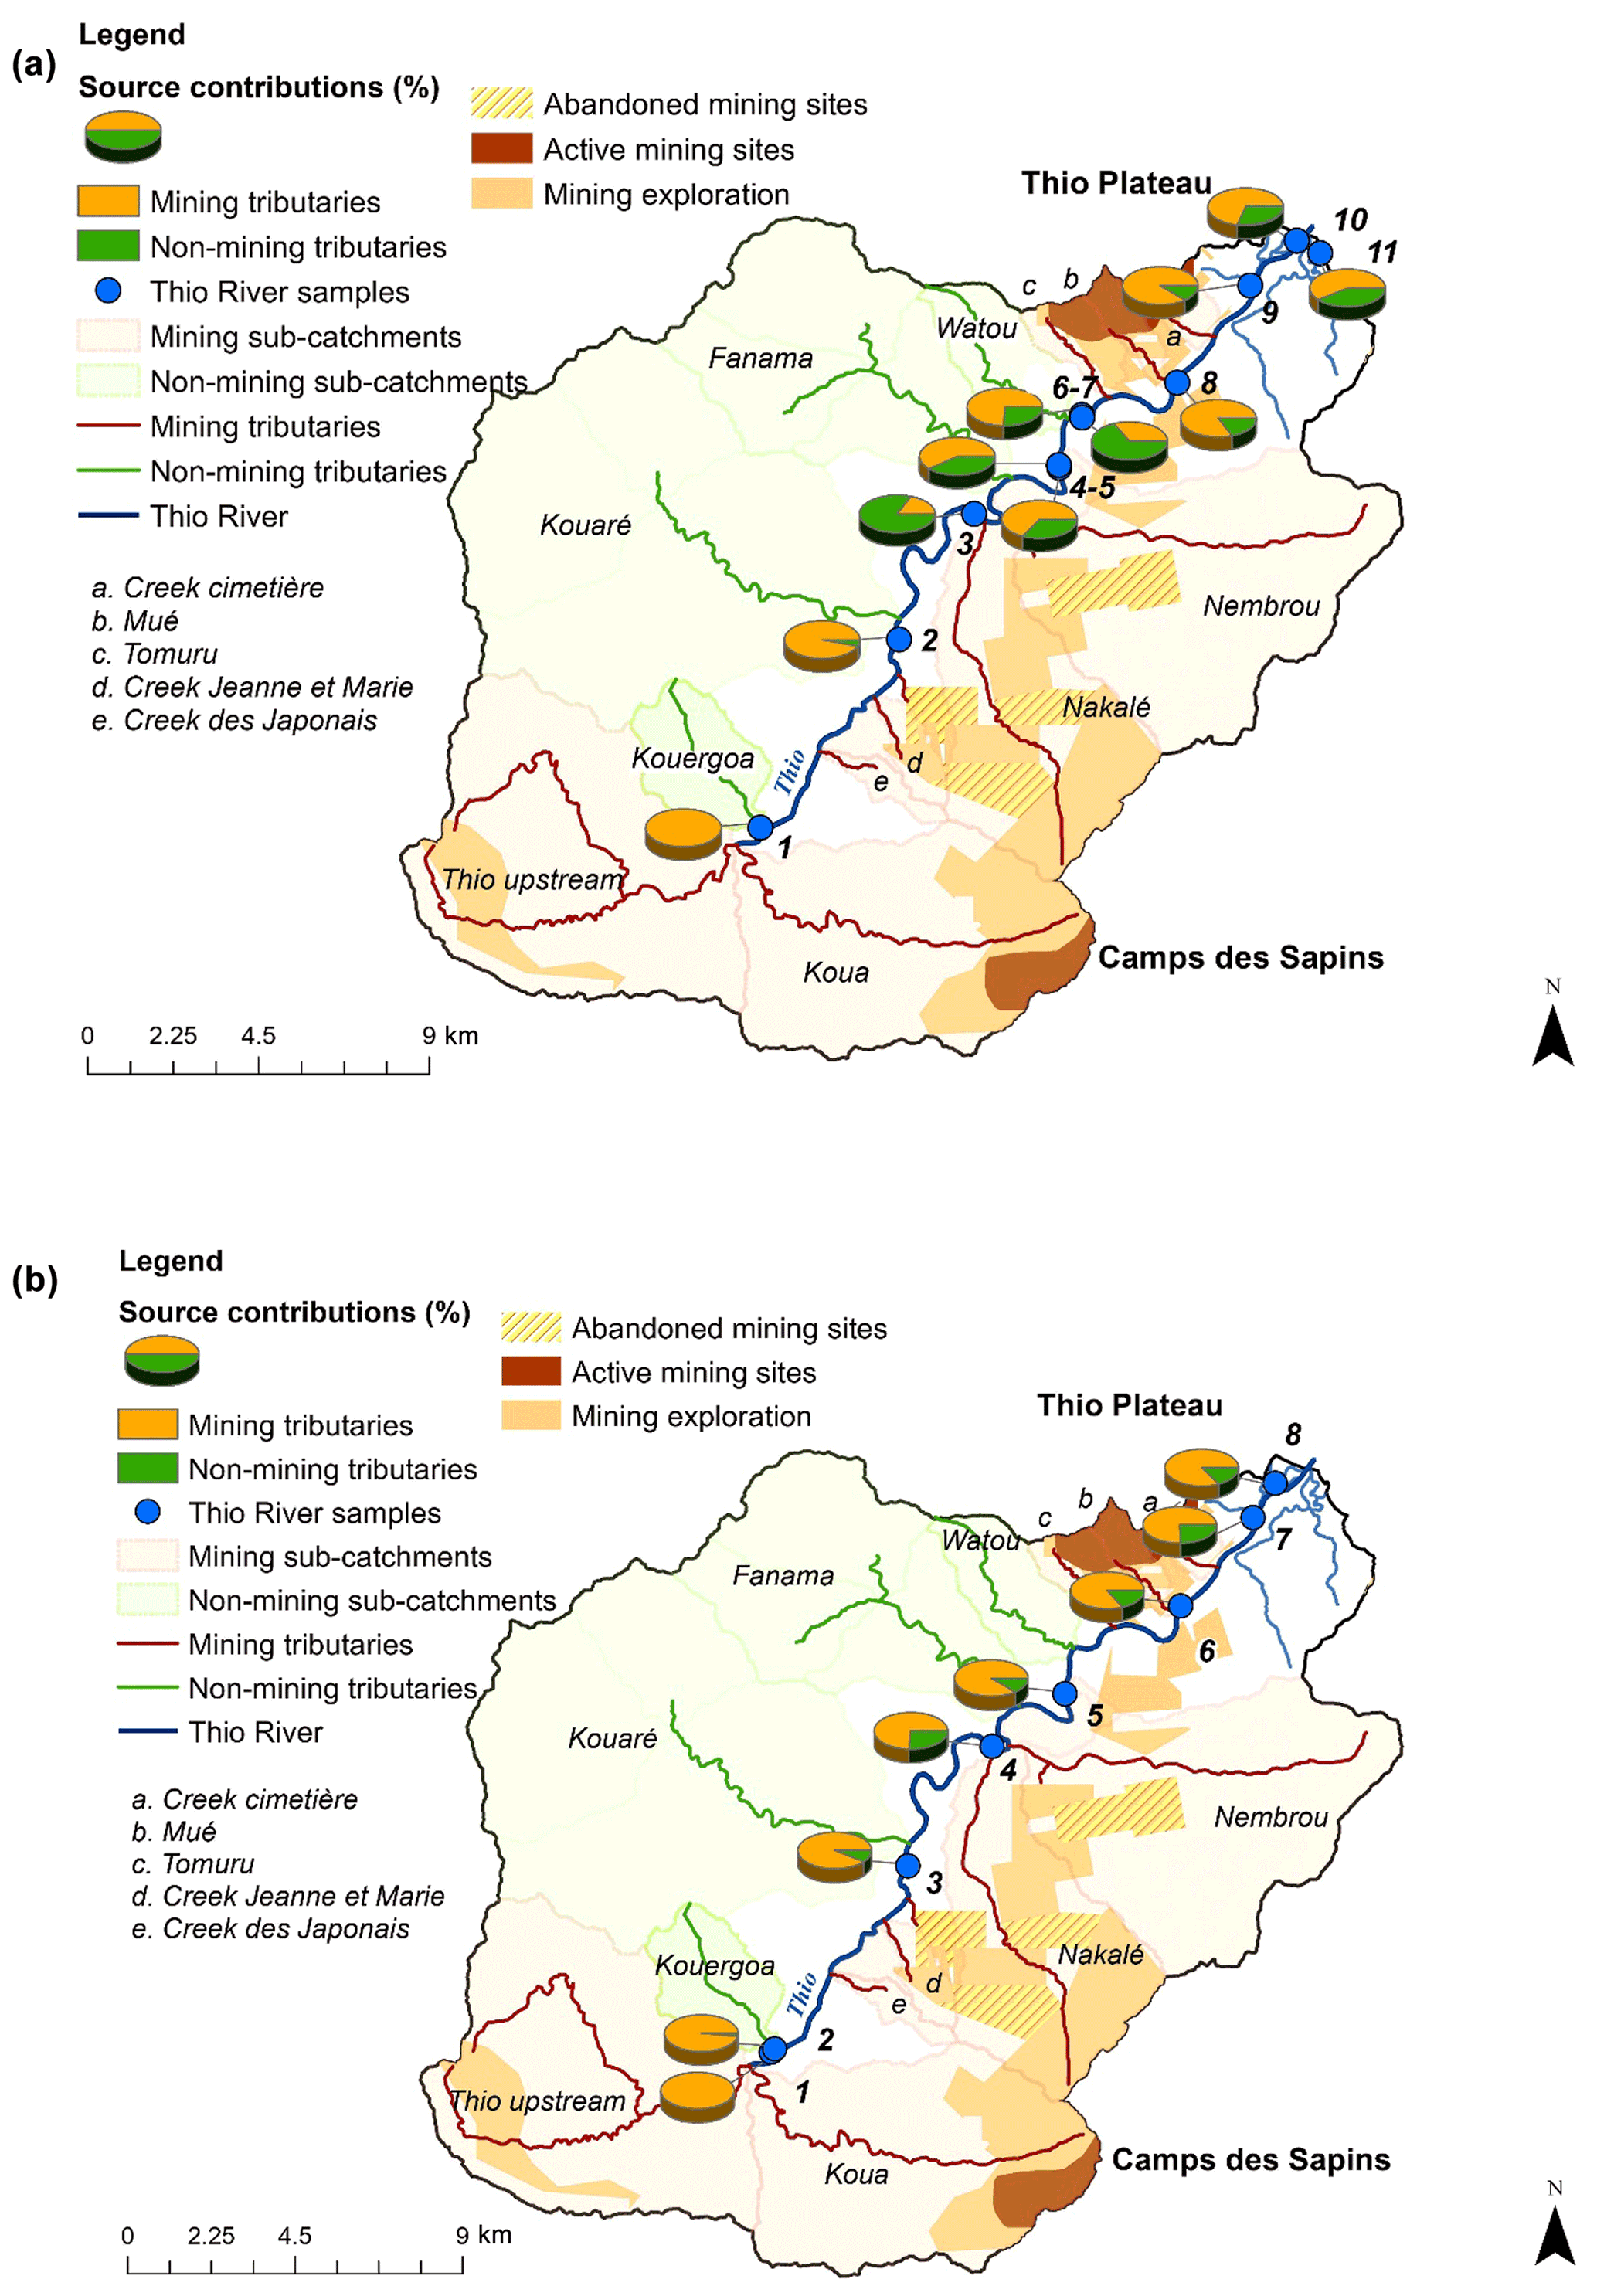
Figure 9Relative contributions of mining and non-mining tributaries to the sediment collected in the Thio River during the 2015 (a) and 2017 (b) flood events using the colour + geochemistry model.
The FDVS-PLSR models also indicated that mining and non-mining tributaries respectively contributed a mean of 29 ± 20 % and 51 ± 11 % of sediment (Fig. 10-b, Table 5) during the 2017 flood event. In a similar way, mining contributions gradually increased along the Thio River from 11 % in upper parts to reach 52 %–58 % in the estuary. On the contrary, non-mining contributions gradually decreased from 56 % in uppermost parts to reach 35 %–36 % in the estuary (Fig. 10b, Table 5).
In summary, the FDVS-PLSR models provided opposite results to those of the conventional sediment fingerprinting approach (i.e. geochemistry and colour + geochemistry models). According to the FDVS-PLSR models, non-mining tributaries contributed the majority of the sediment supply for the 2015 (58 ± 18 %) and 2017 (51 ± 11 %) flood events. In contrast, the geochemistry and colour + geochemistry models demonstrated that mining tributary contributions dominated sediment supply for the 2015 (i.e. 65 ± 27 % and 68 ± 28 % respectively) and 2017 flood events (i.e. 83 ± 8 % and 88 ± 8 % respectively).
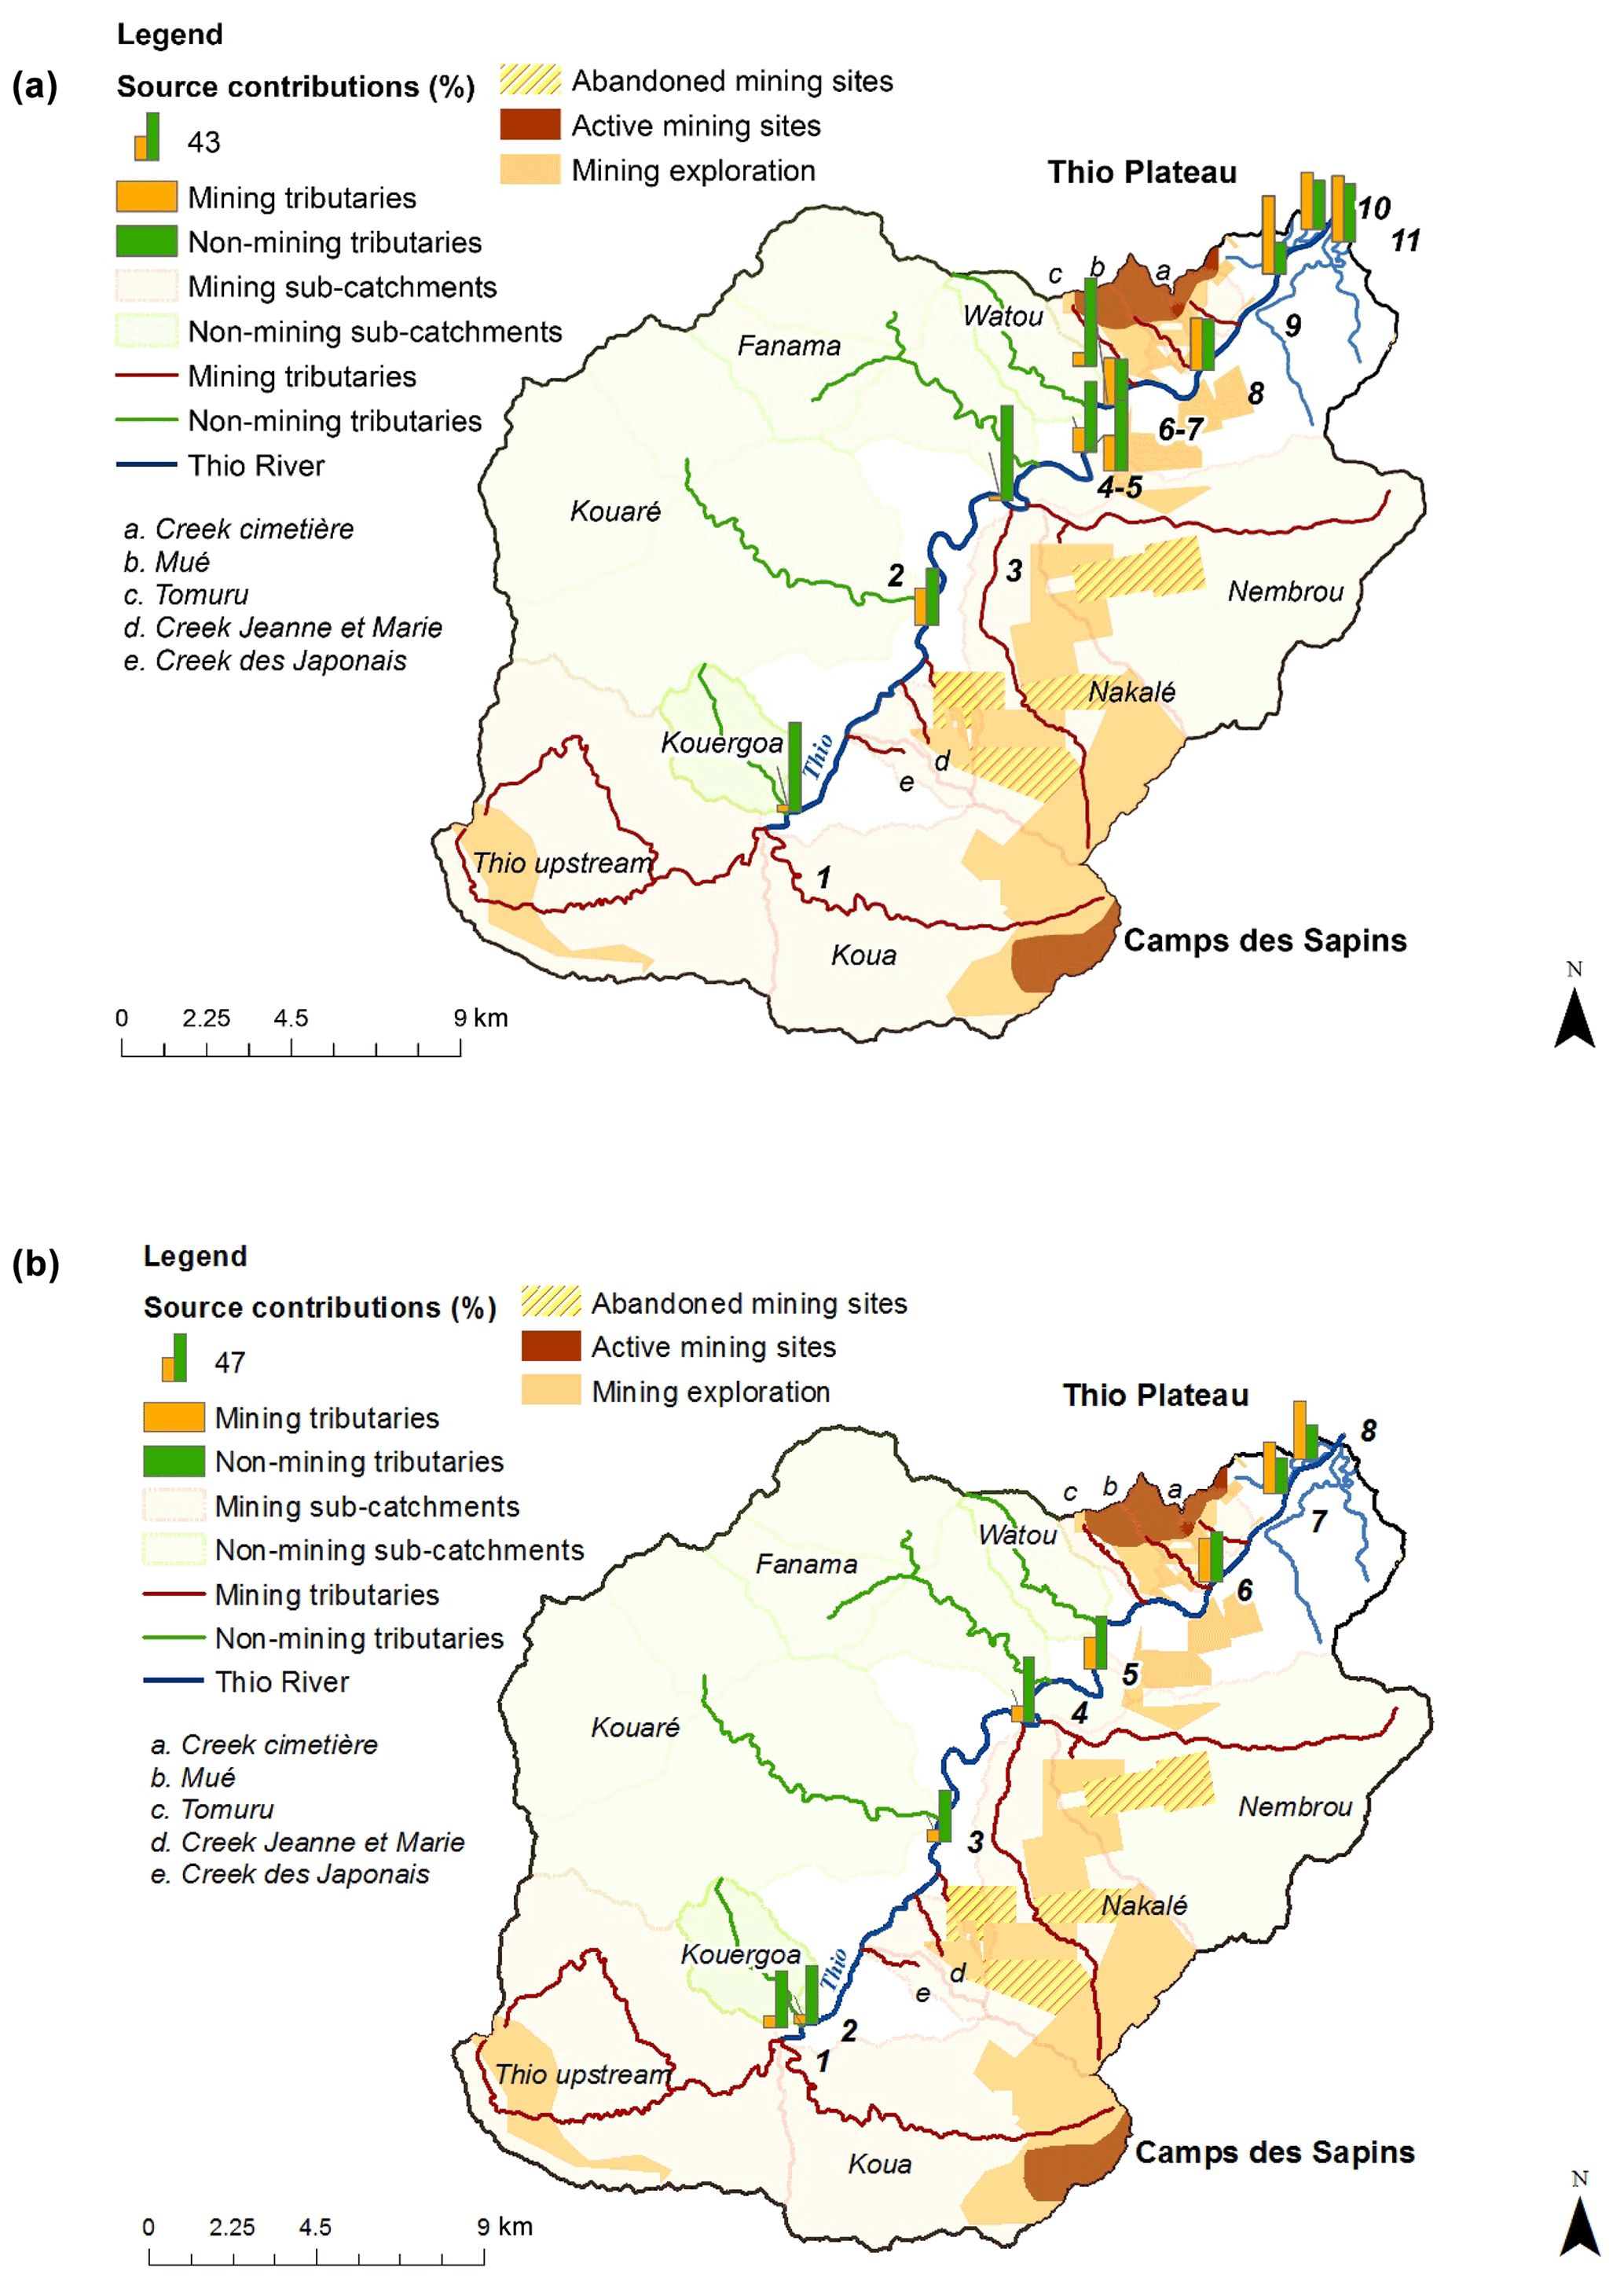
Figure 10Relative contributions of mining and non-mining tributaries to the sediment collected in the Thio River during the 2015 (a) and 2017 (b) flood events using the FDVS-PLSR models.
Table 4Source contributions calculated by FDVS-PLSR, geochemistry and colour + geochemistry approaches for sediment deposited during the flood of 25 February 2015.
SD: standard deviation.
Table 5Source contributions calculated by FDVS-PLSR, geochemistry and colour + geochemistry approaches for sediment deposited during the flood of 10 April 2017.
SD: standard deviation.
3.6 Complementary tests: representativeness of artificial mixture samples used for the FDVS-PLSR models compared to source samples
The FDVS-PLSR models provided contradictory results compared to those obtained with the geochemistry and colour + geochemistry models. In order to explain these results, complementary analyses were carried out with this model. This model was built from the mining and non-mining tributary samples (i.e. mixture of source samples > source poles > artificial mixture samples > FDVS-PLSR models). The objective of these analyses was to check whether the model is “well built”, in other words whether it is representative of the sources identified and whether it is capable of correctly “classifying” the sources. To this end, we applied the FDVS-PLSR models on source samples to estimate their composition in terms of source contributions with FDVS-PLSR models. In the same way as we did above for the river sediment samples, we assessed the reliability of predictions by summing the source contributions predicted by both models (Legout et al., 2013). A mean sum of the predicted source proportions of 94 ± 17 % was calculated from the source sample data set, which again is an excellent result. However, for the three mining tributary samples collected on the Koua tributary, the corresponding sums remained below 65 % with a minimum of 49 %, whereas for one of the non-mining tributary samples collected on the Kouaré tributary, the sum reached 131 % (Fig. 11). These results indicate that the FDVS-PLSR models provide unreliable predictions when dealing with river sediment samples with a colour signature partly impacted by these four samples. The colorimetric signature of the mining tributary samples collected on the Koua tributary in particular is not fully recognized by the models. The compositions of mining and non-mining tributary samples in Figs. 11 and 12 also show that artificial mixture samples built from a mix between the composite mining source sample and the composite non-mining source sample did not cover the range of values found in all the source samples entirely, which may explain why some source samples showed mining and non-mining tributary composition lower than 0 and/or higher than 100 %.

Figure 11Relative compositions of mining and non-mining sources estimated by the FDVS-PLSR models applied to the individual source sediment samples.
Moreover, we observed that two sub-groups of mining tributary samples can be distinguished, the first one corresponding to samples collected on the mining tributaries located in the uppermost part of the catchment and the second to samples collected on the mining tributaries located further downstream. The FDVS-PLSR differentiated the second group rather well since the mining tributary composition is dominant in these samples. In contrast, the first group referred to as “upstream” overlapped with the non-mining tributary samples (Fig. 11). Indeed, Fig. 12 shows the mining tributaries located in the upper part of the catchment were defined as “non-mining tributaries” by the FDVS-PLSR models.
Figure 12Relative compositions of mining and non-mining sources estimated by the FDVS-PLSR models applied to the individual sediment sources in the Thio River catchment.
The low K contents found in these samples confirmed, however, that they were mainly supplied by mining sources (Fig. 13). Indeed, only tributaries draining peridotite massifs (i.e. mining areas) can show such low K contents in source samples (Sellier et al., 2019). Nevertheless, a colour difference could be observed visually and through variations of the a∗ parameter: the a∗ values increased from upper to lower parts, which results in an increasingly red coloration of mining tributary samples in downstream direction. Figure 13 shows also that the a∗ values found in samples collected in the upper catchment part overlapped with those of non-mining tributary samples.
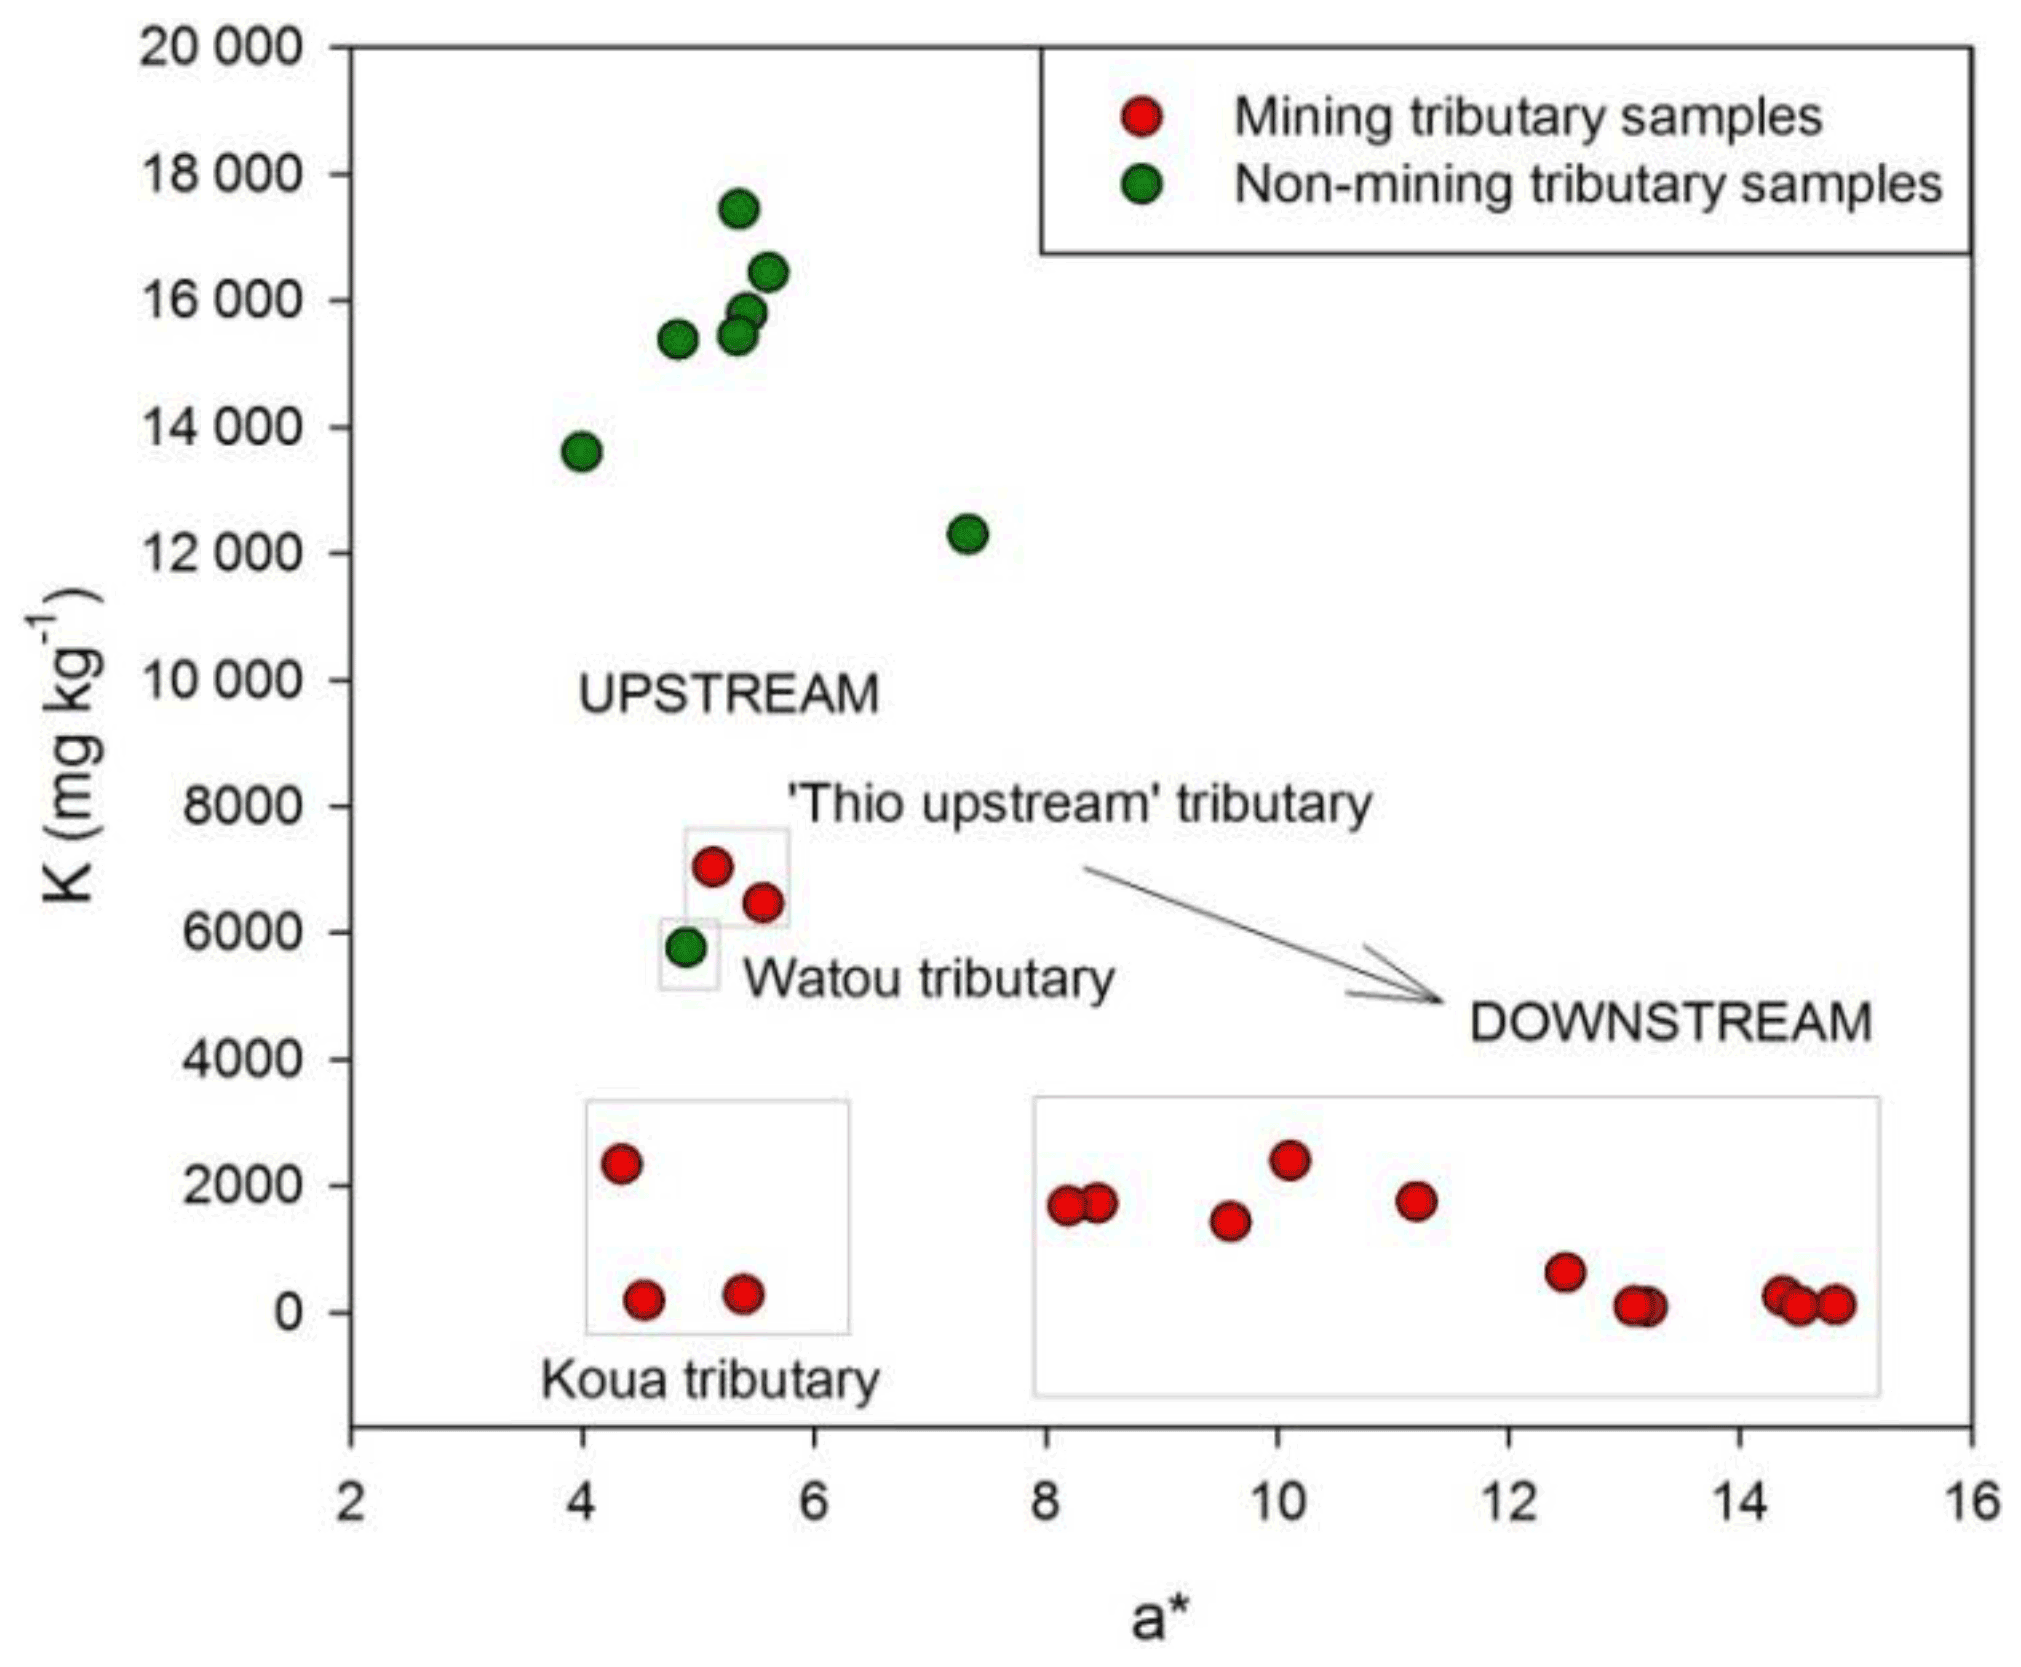
Figure 13Diagram of K contents as a function of a∗ parameter values within sediment sources and artificial mixture samples.
4.1 Advantages and limits of models
4.1.1 Colour model
One of the objectives of this study was to test the contribution of spectrocolorimetry for improving the source discrimination. Indeed, visual observations indicated that mining tributary samples were red-orange, whereas non-mining tributary samples were rather yellow-grey (Fig. 1). However, the results showed that the colour parameters, when used individually, did not provide sufficient discrimination between sources (Table 2) to meet this objective. Indeed, some mining tributary samples showed colour parameter values similar to those found in non-mining tributary samples (e.g. v′ at Table 3, or a∗ shown at Fig. 13). This overlap of value ranges could explain in particular the inability of the colour model to provide satisfactory source discrimination. In the case of mining sources, minerals such as hematite or goethite have a reddish-orange colour (Quantin et al., 1997). Indeed, hematite is a red-coloured oxidized mineral, while goethite is a yellow-coloured oxidized mineral (Trescases, 1973). According to Fig. 6, non-mining tributary samples also have high contents of goethite, which could interfere with the discrimination of the colour signatures of the two sources. The non-mining tributaries drain areas devoid of mining activities, and they are mainly located in zones which underlie the volcano-sedimentary rocks. In these zones, soil profiles are characterized by clay horizons in upper layers and oxidized horizons enriched in goethite at depth (Denis, 1988). According to Sellier et al. (2019), subsurface erosion processes were shown to dominate in the Thio River catchment. In other words, landslides provide the main supply of sediment in non-mining tributaries flowing across this catchment. As a result, the oxidized horizons found at depth of these soil profiles are likely being preferentially eroded,which may explain the widespread occurrence of goethite and material with a yellow-grey colour in non-mining tributary samples.
Results obtained with colour parameter analyses coupled to visual observations highlighted the occurrence of two groups of mining tributary samples (i.e. upstream and downstream). The coloration differences (i.e. orange–upstream and red–downstream) observed between these two groups could be due to the fact that on the one hand, the reddish colour does not provide a highly conservative signature as it may be altered by the oxidoreduction of iron minerals during the periods of submersion of sediments under water. On the other hand, the presence of different types of laterite profiles could explain these coloration differences. Indeed, the laterite profile is classically described in the literature as composed of peridotites at the bottom > saprolites > yellow laterites rich in goethite > red laterites rich in hematite at the top (Trescases, 1973). However, minor different features may be found in the laterite profile depending on the type of parent rock found at the base of the peridotite massifs (Sevin, 2014). The mineral composition found in the different layers of the laterite profile may vary depending on whether serpentines or peridotites are the source rocks. Laterite profile formation depends partly on the morphological context, for instance on whether nickel ores are located in a basin, on a plateau or on a hillslope. This morphological context influences the weathering level of peridotites and the formation of laterite profile: the more the laterite profile is altered, the higher the thickness of red laterites. In the Thio River catchment, the laterite profile from the Thio Plateau mine located in the downstream part of the catchment shows “plateau nickel ores”, whereas the laterite profiles from the Camps des Sapins mine located in the upstream part of the catchment are “slope nickel ores” (Mardhel et al., 2018). No information is provided in the literature on the types of laterite profiles that were mined in abandoned mining sites in the Thio River catchment (Fig. 2c). The red coloration of the downstream mining tributary samples could then be associated with more altered laterite profiles, with a thicker layer of red laterites characteristic of plateau nickel ores compared to the upstream mining tributary samples, which could be associated with a laterite profile, with a thinner layer of red laterites characteristic of slope nickel ores. The red laterites are the final stage of alteration of the peridotite massifs. It therefore appears likely that the less altered slope nickel ore probably contains more yellow laterites enriched in goethite compared to the plateau nickel ore. This hypothesis could explain the similar colour signature of the mining tributary samples collected on the Koua tributary draining the Camps des Sapins mine and the non-mining samples.
4.1.2 Geochemistry model
The geochemistry model based on K provided significant discrimination between sources (Table 2), regardless of the types of nickel ores that may be found in the Thio River catchment. K is a lithological tracer discriminating sediments originating from the erosion of the two dominant lithologies (i.e. peridotite massifs vs. volcano-sedimentary formations) in the Thio River catchment. As anthropogenic erosion (i.e. due to mining activities) dominates on the peridotite massifs (Garcin et al., 2017), K therefore provides an optimal discrimination between mining and non-mining tributary contributions.
The parameter K classified the source samples very well (i.e. 95.3 % of correct classification; Table 3). Indeed, the 16 mining source samples were all correctly classified (100 %), and only one non-mining source sample was not correctly classified (87.5 %); it corresponds to the Watou tributary sample (Fig. 13). This sample showed a K content similar to that found in mining tributary samples. The Watou tributary is unique because it drains both volcano-sedimentary formations and peridotite massifs that were not exploited for mining, which justifies it being considered a non-mining tributary. The K content measured in this sample could be representative of that found in sediment sources characterized by a mix between the two dominant lithologies. Again, when observing Fig. 13, two mining tributary samples (i.e. Thio upstream) showed similar K contents to those found in the Watou tributary sample. The Thio upstream tributary also drains both areas associated with volcano-sedimentary formations and exploited peridotite massifs (i.e. mining prospection), which justifies it being considered a mining tributary.
The analysis of colour parameters coupled with that of geochemical elements indicated that these samples collected on the Thio upstream tributary showed less red coloration, not because they are associated with a different type of ore, as could be the case for the samples collected on Koua tributary draining Camps des Sapins mine (Fig. 13), but because they are characterized by a mix of both lithologies. As a result, the geochemistry model showed a certain limitation in classifying source samples characterized by a mix of both lithologies. The performance of the geochemistry model described in Table 2 remains, however, excellent. The application of this model on artificial mixture samples provided very satisfactory results (Fig. 5a), with a good correlation between the predicted and the actual source proportions (r2=0.99). Estimations of mining tributary contributions may, however, be overestimated. This overestimation evaluated to a maximum at 15.5 % is greater when the mining contributions estimated by the model tend towards 0 % (maximum: 15.5 %, Fig. 3a). The geochemistry model has difficulties in discriminating sediment contributions from sub-catchments with mixed lithologies. It classifies these types of samples as originating from mining tributaries, such as the Watou River sample. As a result, as the K concentrations decrease in the samples analysed, the model will tend to overestimate the contributions of mining sources by default compared to their actual contributions.
4.1.3 Colour + geochemistry model
The colour + geochemistry (i.e. K, Ca, Ti, b∗, C∗) model provided the best discrimination between sources (Table 3). The inclusion of colour parameters in the colour + geochemistry approach allowed for the discrimination of source samples (i.e. 100 % of correctly classified source samples) that a geochemistry approach alone could not achieve. Results of the tests carried out on the artificial mixture samples also showed an excellent correlation between the predicted and the actual source proportions (i.e. r2=0.98). A slight overestimation of the mining tributary contributions (7 %) was observed with this approach, which remains rather reasonable (Fig. 3b). In this model, K is the lithological tracer which has the higher discriminant powerful (Table 2), which may explain the similarity of results obtained with the colour + geochemistry and the geochemistry models. Indeed, mining tributaries contributed an average of 65 ± 27 % for the colour + geochemistry model and 68 ± 25 % for the geochemistry model (Table 4). For the 2017 flood event, mining source contributions largely dominated the sediment production, with a mean contribution of 83 ± 8 % for the geochemistry model and 88 ± 8 % for the colour + geochemistry model.
4.1.4 FDVS-PLSR models
The FDVS-PLSR models built from artificial mixture samples showed excellent theoretical predictive performances (e.g. r2, RMSEC, RMSEP; Fig. 7). However, the application of these models on river sediment samples provided questionable results. Indeed, the artificial mixture samples did not cover the ranges of values found in all sources samples entirely, thus resulting in an overestimation (i.e. superior to 100 %) and an underestimation (i.e. inferior to 0 %) of source composition (Fig. 11) in several source samples. Similarly to what was previously observed, three sub-groups of mining tributary samples can be distinguished, one of which (i.e. Thio upstream) is partially merged with the non-mining tributary samples (Fig. 11). When modelling the source contributions with the FDVS-PLSR models, a bias was created because the contributions of the Thio upstream tributary may be mainly considered contributions of non-mining tributaries. As a result, an overestimation of non-mining tributary contributions may be found in the entire Thio River catchment and particularly in the upper part of the study area. Third, the properties measured in the Koua tributary (i.e. draining Camps des Sapins mine) samples were not in the ranges of values covered by the artificial mixture samples (Fig. 11).
Given the particular colour signature of this tributary (Fig. 13), its contributions are therefore not taken into account at all by the FDVS-PLSR models. Indeed, the sums of the source contributions by FDVS-PLSR models are lower than the expected 100 %, particularly in the uppermost part of the catchment (Tables 4 and 5), which may indicate that a source is not accounted for. Artificial mixtures were constructed from a homogenized spectral signature of all mining source samples. However, two distinct spectral signatures were observed between the upstream and downstream mining source samples. Homogenizing the spectral signature of the mining samples led to a loss of information in terms of spectral signature, in particular that of the mining samples located upstream. As a result, three-source FDVS-PLSR models (i.e. non-mining, upstream and downstream mining sources) would have been more appropriate than two-source FDVS-PLSR models in this context.
4.2 Spatial and temporal variations of sediment source contributions
Among the four models tested in this study, the colour + geochemistry model is the most appropriate to estimate mining and non-mining tributary contributions in the Thio River catchment. According to the results of this model, mining tributaries provided the main sediment supply to the river system with a mean contribution of 68 ± 25 % for the 2015 flood event and 88 ± 8 % for the 2017 flood event (Tables 4 and 5). The variability of mining tributary contributions between these two flood events with a return period of 10 years (3500 m3 s−1) could be explained in particular by the variability of rainfall distribution (Sellier et al., 2019). Indeed, during the 2015 flood event, the Kouaré River sub-catchment received twice the rainfall than observed in the rest of the Thio River catchment, which may explain a higher contribution of non-mining tributaries for this event than for the 2017 flood event, where rainfall was more intense in the eastern part of the catchment in the vicinity of the mines currently in operation (Thio Plateau, Camps des Sapins). In addition, the inhabitants of Thio reported that bushfires had occurred in the Kouaré and Fanama sub-catchments in 2015, which could have led to an increase in soil erosion processes, particularly landslides, in these sub-catchments. This could also explain why the sediment contributions of the Kouaré tributary are higher in 2015 compared to 2017. However, it is likely that, as for low-intensity floods (i.e. < 200 m3 s−1), sediment generated during previous floods has been remobilized (Allenbach et al., 2020). The current research does not allow this proportion of remobilized sediments to be quantified. Future studies based on the measurement of the 7Be 210Pbxs ratio could provide information on this question as both isotopes are supplied by rainfall and 7Be is short-lived, while 210Pbxs is much longer lived. Indeed, this ratio has been used in previous research to determine whether sediment has been eroded recently (i.e. with a high ratio of 7Be 210Pbxs) or whether it has been remobilized from the channel (i.e. with a low ratio of 7Be 210Pbxs) (Le Gall et al., 2017; Evrard et al., 2015).
Although the FDVS-PLSR models were unable to properly estimate the source contributions, they provided qualitative indications about the proportion of sediment contribution between upstream and downstream mining tributaries at the level of the estuary. Indeed, only downstream mining tributaries were finally identified by the FDVS-PLSR models as mining sources. Mining contributions gradually increased in a downstream direction. The predicted proportion sums of river sediment samples also tend to reach the expected 100 %, which could result in a better predictability of the models. As a result, these models indicated that sediment contribution from downstream reaches dominated that of upstream reaches at the level of the estuary for both events.
Moreover, the analysis of colour parameters coupled to that of geochemical elements highlighted the occurrence of three sub-groups of mining tributary samples, (1) downstream samples characterized by high a∗ values and low K contents, (2) Koua tributary samples located in the upstream characterized by low a∗ values and low K contents and (3) Thio upstream samples corresponding to a mix of both dominant lithologies (i.e. peridotite massifs and volcano-sedimentary formations) characterized by low a∗ values and higher K contents (i.e. 4 times higher than for the two previous sub-groups) (Fig. 13). Owing to the low K contents found in Thio River sediment samples collected in the uppermost part (i.e. ∼ 2200 mg kg−1 in 2015 and ∼ 2600 mg kg−1 in 2017), which were similar to those measured in samples of sub-group (2) (∼ 2400 mg kg−1), it would appear that the Koua tributary draining Camps des Sapins mine dominated the sediment supply in the upstream river reaches for both events.
One of the objectives of this study was to evaluate the performance of sediment tracing methods based on spectroscopy (i.e. colour parameters and FDVS). However, the results showed that the individual fingerprinting approaches based on spectroscopy did not provide sufficient discrimination between sources to be used for the modelling of sediment source contributions. Nevertheless, the inclusion of colour properties in addition to geochemical parameters turned out to be the optimal combination of tracers providing the highest discrimination between sediment sources. This colour + geochemistry model is, however, largely based on the discriminatory power provided by K, which explains why the results obtained between both models are so similar. Indeed, the contributions of mining tributaries were estimated to be 65 ± 27 % by the colour + geochemistry model versus 68 ± 25 % by the geochemistry model for the 2015 flood event. In a similar way, the contributions of mining tributaries were estimated to be 88 ± 8 % by the colour + geochemistry model versus 83 ± 8 % by the geochemistry model for the 2017 flood event. Moreover, both approaches have been experimentally validated through tests with artificial mixture samples. As a result, the use of these approaches could be extended to other mining catchments of New Caledonia but also possibly to other similar nickel mining areas (i.e. Ni oxidized ores based on peridotite massifs) around the world. In addition, although the individual fingerprinting approaches based on spectroscopy were not able to discriminate sediment sources in the current research, spectroscopy measurements provided complementary information to that delivered by the geochemical properties alone to discriminate between sediment sources at the estuary. In the future, additional developments could be considered to improve this technique. The concept of a two-source sediment tracing approach (i.e. mining vs. non-mining tributary contributions) is maybe too simplistic in a mining context. The initial hypothesis that red-orange eroded sediment comes from mining tributaries whereas yellow-grey material originates from non-mining tributaries could not be fully confirmed in New Caledonia. Indeed, soils found in both mining and non-mining areas are all highly weathered and share similarities in terms of oxidized mineral composition (e.g. goethite), which likely generates confusion for discriminating their respective colorimetric signatures. Soils found across all mining areas across a single catchment are not necessarily identical, as different depths of their respective weathering profiles may crop out and result in variable colorimetric signatures. A preliminary identification of these soils characteristic of different weathering stages could be considered to improve the results of sediment tracing approaches based on spectroscopic measurements, both in New Caledonia and in other similar nickel mining catchments around the world.
Underlying research data are available online at https://doi.org/10.1594/PANGAEA.923577 (Sellier et al., 2020).
ON, MA and OE designed research. VS, ON, OE and IL carried out fieldwork sampling. VS conducted the analyses. All co-authors contributed to data analysis and interpretation. JPL contributed to modelling. All co-authors contributed to the writing and approved the final version of the manuscript.
The authors declare that they have no conflict of interest.
Publisher’s note: Copernicus Publications remains neutral with regard to jurisdictional claims in published maps and institutional affiliations.
The PhD project of Virginie Sellier is also financed by the French Atomic Energy Commission (CEA, Commissariat à l'Energie Atomique et aux Energies Alternatives). The authors are grateful to Jean-Guy M'Boueri, Pierre Chanel, Jean Jean, Lorenza M'Boueri and Nicolle Mathys for their invaluable support in identifying and having access to the field sampling sites. The authors would also like to thank Magdalena Uber for her contribution to the spectrocolorimetric analyses.
This research has been supported by the National Technical Research Center (CNRT) “Nickel and its environment” (grant no. 10PS2013-CNRT.UNC/IMMILA).
This paper was edited by Nikolaus J. Kuhn and reviewed by two anonymous referees.
Abel, A., Michael, A., Zartl, A., and Werner, F.: Impact of erosion-transported overburden dump materials on water quality in Lake Cospuden evolved from a former open cast lignite mine south of Leipzig, Germany, Environmental Geology, 39, 683–688, 2000.
Allenbach, M., Bertrand, M., Despinoy, Y., Evrard, O., Garcin, M., Liébault, F., Navratil, O., Recking, A., Richard, D., Rouet, I., Sabinot, C., Sellier, V., Tessier, B., Thinon, I., Touraivane, and Worliczek, E.: Rapport scientifique, Programme “IMMILA, Impact de la mine au lagon”, CNRT Nickel & Son Environnement, 250 pp., 2020.
Batista, P. V. G., Laceby, J. P., Silva, M. L. N., Tassinari, D., Bispo, D. F. A., Curi, N., Davies, J., and Quinton, J. N.: Using pedological knowledge to improve sediment source apportionment in tropical environments, J. Soils. Sediments, 19, 3274–3289, https://doi.org/10.1007/s11368-018-2199-5, 2018.
Baudrimont, M., Dominique, Y., Feurtet-Mazel, A., Gonzalez, P., Gourvès, P.-Y., Gunkel-Grillon, P., Laporte-Magoni, C., Lefrançois, E., Letourneur, Y., Marquié, J., Maury-Brachet, R., Monna, F., Pasquet, C., Rivière, E., and Roth, E.: Rapport scientifique final, Programme “Dispersion des métaux de la mine au lagon”, CNRT Nickel & Son Environnement, 192 pp., 2019.
Bird, E. C. F., Dubois, J. P., and Iltis, J. A.: The impacts of opencast mining on the rivers and coasts of New Caledonia, Tokyo, Japan, United Nations University, 60 pp., 1984.
Blake, W. H., Wallbrink, P. J., Wilkinson, S. N., Humphreys, G. S., Doerr, S. H., Shakesby, R. A., and Tomkins, K. M.: Deriving hillslope sediment budgets in wildfire-affected forests using fallout radionuclide tracers, Geomorphology, 104, 105–116, https://doi.org/10.1016/j.geomorph.2008.08.004, 2009.
Brosinsky, A., Foerster, S., Segl, K., and Kaufmann, H.: Spectral fingerprinting: sediment source discrimination and contribution modelling of artificial mixtures based on VNIR-SWIR spectral properties, J. Soils Sediment., 14, 1949–1964, 2014.
Brown, A.: The potential use of pollen in the identification of suspended sediment sources, Earth Surf. Proc. Land., 10, 27–32, 1985.
Clarke, P. and David, C.: New Provincial Environmental Legislation in New Caledonia: Continuity and Reform in Environmental Governance in a French Pacific Territory, Asia Pac. J. Envtl. L., 13, 135, available at: https://hal.archives-ouvertes.fr/hal-02117052 (last access: 29 October 2021), 2010.
Collins, A. and Walling, D.: Selecting fingerprint properties for discriminating potential suspended sediment sources in river basins, J. Hydrol., 261, 218–244, 2002.
Collins, A. L., Walling, D. E., and Leeks, G. J. L.: Composite fingerprinting of the spatial source of fluvial suspended sediment : a case study of the Exe and Severn river basins, United Kingdom, Géomorphologie, 2, 41–53, https://doi.org/10.3406/morfo.1996.877, 1996.
Coulthard, T. J. and Macklin, M. G.: Modeling long-term contamination in river systems from historical metal mining, Geology, 31, 451–454, 2003.
Danloux, J. and Laganier, R.: Classification et quantification des phénomènes d'érosion, de transport et de sédimentation sur les bassins touchés par l'exploitation minière en Nouvelle Calédonie, Hydrologie continentale, 6, 15–28, 1991.
Daszykowski, M., Walczak, B., and Massart, D.: Representative subset selection, Anal. Chim. Ac., 468, 91–103, 2002.
Davis, C. M. and Fox, J. F.: Sediment fingerprinting: review of the method and future improvements for allocating nonpoint source pollution, J. Environ. Eng., 135, 490–504, 2009.
Debret, M., Sebag, D., Desmet, M., Balsam, W., Copard, Y., Mourier, B., Susperrigui, A.-S., Arnaud, F., Bentaleb, I., and Chapron, E.: Spectrocolorimetric interpretation of sedimentary dynamics: the new “Q7/4 diagram”, Earth-Sci. Rev., 109, 1–19, 2011.
Denis, B.: Etude de sols fersiallitiques désaturés du plateau de Tango (Nouvelle-Calédonie), Cahiers ORSTOM. Série Pédologie, 24, 61–76, 1988.
Dumas, P.: Méthodologie de cartographie de la sensibilité des sols à l'érosion appliquée à la région de Dumbéa à Païta-Bouloupari (Nouvelle-Calédonie), Les Cahiers d'Outre-Mer, Revue de géographie de Bordeaux, 63, 567–584, 2010.
Dumas, P., Printemps, J., Mangeas, M., and Luneau, G.: Developing erosion models for integrated coastal zone management: A case study of The New Caledonia west coast, Mar. Pollut. Bull., 61, 519–529, 2010.
Evrard, O., Laceby, J. P., Huon, S., Lefèvre, I., Sengtaheuanghoung, O., and Ribolzi, O.: Combining multiple fallout radionuclides (137Cs, 7Be, 210Pbxs) to investigate temporal sediment source dynamics in tropical, ephemeral riverine systems, J. Soils Sediment., 16, 1130–1144, 10.1007/s11368-015-1316-y, 2015.
Evrard, O., Durand, R., Foucher, A., Tiecher, T., Sellier, V., Onda, Y., Lefèvre, I., Cerdan, O., and Laceby, J. P.: Using spectrocolourimetry to trace sediment source dynamics in coastal catchments draining the main Fukushima radioactive pollution plume (2011–2017), J. Soils Sediment., 19, 3290–3301, 2019.
Evrard, O., Chaboche, P.-A., Ramon, R., Foucher, A., and Laceby, J. P.: A global review of sediment source fingerprinting research incorporating fallout radiocesium (137Cs), Geomorphology, 362, 107103, https://doi.org/10.1016/j.geomorph.2020.107103, 2020.
Garcin, M.: Exploitation des granulats en lit vif des cours d'eau de la Grande-Terre, Nouvelle-Calédonie, BRGM/RP-58531-FR. 114 p., 90 fig., 3 tabl., Bureau des Recherches Géologiques et Minières, 114 pp., 2010.
Garcin, M., Gastaldi, Y., and Lesimple, S.: Quantification et évolution temporelle des apports miniers dans les rivières calédoniennes, BRGM/RP-66840-FR, 44 pp., 23 fig., 5, Bureau des Recherches Géologiques et Minières, 2017.
Gruszowski, K., Foster, I. D., Lees, J., and Charlesworth, S.: Sediment sources and transport pathways in a rural catchment, Herefordshire, UK, Hydrol. Proc., 17, 2665–2681, 2003.
Hedouin, L., Pringault, O., Metian, M., Bustamante, P., and Warnau, M.: Nickel bioaccumulation in bivalves from the New Caledonia lagoon: Seawater and food exposure, Chemosphere, 66, 1449–1457, 2007.
Highley, D., Chapman, G. R., and Bonel, K.: The economic importance of minerals to the UK, British Geological Survey, 32 pp., 2004.
Iltis, J.: La mine, élement de la controverse écologique dans le Pacifique Sud, L'Espace géographique, 193–205, 1992.
James, L. A.: Legacy sediment: definitions and processes of episodically produced anthropogenic sediment, Anthropocene, 2, 16–26, 2013.
Juillot, F.: Rapport scientifique final, Programme “Dynamique des métaux de la mine au lagon”, CNRT Nickel & Son Environnement, 202 pp., 2019.
Klages, M. and Hsieh, Y.: Suspended Solids Carried by the Gallatin River of Southwestern Montana: II, Using Mineralogy for Inferring Sources 1, J. Environ. Qual., 4, 68–73, 1975.
Kumar, A. and Maiti, S. K.: Assessment of potentially toxic heavy metal contamination in agricultural fields, sediment, and water from an abandoned chromite-asbestos mine waste of Roro hill, Chaibasa, India, Environ. Earth Sci., 74, 2617–2633, 2015.
Laceby, J. P. and Olley, J.: An examination of geochemical modelling approaches to tracing sediment sources incorporating distribution mixing and elemental correlations, Hydrol. Process., 29, 1669–1685, https://doi.org/10.1002/hyp.10287, 2015.
Laceby, J. P., Evrard, O., Smith, H. G., Blake, W. H., Olley, J. M., Minella, J. P. G., and Owens, P. N.: The challenges and opportunities of addressing particle size effects in sediment source fingerprinting: A review, Earth-Sci. Rev., 169, 85–103, https://doi.org/10.1016/j.earscirev.2017.04.009, 2017.
Le Gall, M., Evrard, O., Foucher, A., Laceby, J. P., Salvador-Blanes, S., Manière, L., Lefèvre, I., Cerdan, O., and Ayrault, S.: Investigating the temporal dynamics of suspended sediment during flood events with 7Be and 210Pbxs measurements in a drained lowland catchment, Sci. Rep., 7, 42099, https://doi.org/10.1038/srep42099, 2017.
Legout, C., Poulenard, J., Nemery, J., Navratil, O., Grangeon, T., Evrard, O., and Esteves, M.: Quantifying suspended sediment sources during runoff events in headwater catchments using spectrocolorimetry, J. Soils Sediment., 13, 1478–1492, https://doi.org/10.1007/s11368-013-0728-9, 2013.
Mardhel, V., Iseppi, M., Regninger, P. A., and Sevin, B.: Connaissance de l'ophiolite, géophysique aéroportée et étude de la structure, Rapport scientifique final. Programme “OPHIOSTRUCT”, CNRT Nickel & Son Environnement, 229 pp., 2018.
Martínez-Carreras, N., Udelhoven, T., Krein, A., Gallart, F., Iffly, J. F., Ziebel, J., Hoffmann, L., Pfister, L., and Walling, D. E.: The use of sediment colour measured by diffuse reflectance spectrometry to determine sediment sources: application to the Attert River catchment (Luxembourg), J. Hydrol., 382, 49–63, 2010.
Motha, J., Wallbrink, P., Hairsine, P., and Grayson, R.: Unsealed roads as suspended sediment sources in an agricultural catchment in south-eastern Australia, J. Hydrol., 286, 1–18, 2004.
Navratil, O., Evrard, O., Esteves, M., Legout, C., Ayrault, S., Némery, J., Mate-Marin, A., Ahmadi, M., Lefèvre, I., and Poirel, A.: Temporal variability of suspended sediment sources in an alpine catchment combining river/rainfall monitoring and sediment fingerprinting, Earth Surf. Proc. Land., 37, 828–846, 2012.
Owens, P. N. and Walling, D. E.: The phosphorus content of fluvial sediment in rural and industrialized river basins, Water Res., 36, 685–701, 2002.
Pascal, N.: Ecosystèmes coralliens de Nouvelle-Calédonie. Valeur économique des services écosystémiques, Partie I: Valeur financière, IFRECOR, 2010.
Poulenard, J., Perrette, Y., Fanget, B., Quetin, P., Trevisan, D., and Dorioz, J.-M.: Infrared spectroscopy tracing of sediment sources in a small rural watershed (French Alps), Sci. Total Environ., 407, 2808–2819, 2009.
Poulenard, J., Legout, C., Nemery, J., Bramorski, J., Navratil, O., Douchin, A., Fanget, B., Perrette, Y., Evrard, O., and Esteves, M.: Tracing sediment sources during floods using Diffuse Reflectance Infrared Fourier Transform Spectrometry (DRIFTS): A case study in a highly erosive mountainous catchment (Southern French Alps), J. Hydrol., 414, 452–462, 2012.
Priadi, C., Ayrauk, S., Pacini, S., and Bonte, P.: Urbanization impact on metals mobility in riverine suspended sediment: role of metal oxides, Int. J. Environ. Sci. Tech., 8, 1–18, 2011.
Prior, T., Daly, J., Mason, L., and Giurco, D.: Resourcing the future: Using foresight in resource governance, Geoforum, 44, 316–328, 2013.
Quantin, P., Bourdon, E., and Becquer, T.: Minéralogie et contraintes édaphiques des sols ferritiques dérivés de roches ultrabasiques en Nouvelle-Calédonie: relations entre constituants minéraux et disponiblité en certains éléments (Al, Fe, Si, Mg, Mn, Ni, Co, Cr, Cu, Zn, Mo) facilement solubles, Documents Scientifiques et Techniques – ORSTOM: III; 2, Nouméa, ORSTOM 13–25, 1997.
Rossel, R. V., Walvoort, D., McBratney, A., Janik, L. J., and Skjemstad, J.: Visible, near infrared, mid infrared or combined diffuse reflectance spectroscopy for simultaneous assessment of various soil properties, Geoderma, 131, 59–75, 2006.
Sellier, V., Navratil, O., Laceby, J. P., Allenbach, M., Lefèvre, I., and Evrard, O.: Investigating the use of fallout and geogenic radionuclides as potential tracing properties to quantify the sources of suspended sediment in a mining catchment in New Caledonia, South Pacific, J. Soils Sediment., 20, 1112–1128, 2019.
Sellier, V., Navratil, O., Laceby, J. P., Legout, C., Allenbach, M., Lefèvre, I., and Evrard, O.: Color parameters and geochemical tracers used for sediment source discrimination in a mining catchment (Thio River catchment, New Caledonia, South Pacific Islands), PANGAEA [data set], https://doi.org/10.1594/PANGAEA.923577, 2020.
Sevin, B.: Cartographie du régolithe sur formation ultrabasique de Nouvelle-Calédonie: Localisation dans l'espace et le temps des gisements nickélifères, Nouvelle Calédonie, 528 pp., 2014.
Shellberg, J., Brooks, A., and Spencer, J.: Land-use change from indigenous management to cattle grazing initiates the gullying of alluvial soils in northern Australia, 19th World Congress of Soil Science: Soil Solutions for a Changing World, 1–6, 2010.
Sherriff, S. C., Franks, S. W., Rowan, J. S., Fenton, O., and Ó'hUallacháin, D.: Uncertainty-based assessment of tracer selection, tracer non-conservativeness and multiple solutions in sediment fingerprinting using synthetic and field data, J. Soils Sediment., 15, 2101–2116, https://doi.org/10.1007/s11368-015-1123-5, 2015.
Smith, H. G., Sheridan, G. J., Lane, P. N. J., Noske, P. J., and Heijnis, H.: Changes to sediment sources following wildfire in a forested upland catchment, southeastern Australia, Hydrol. Process., 25, 2878-2889, 10.1002/hyp.8050, 2011.
Surell, A.: Étude sur les torrents des Hautes-Alpes, Carilian-Goeury, 283 pp., 1841.
Tiecher, T., Caner, L., Minella, J. P., and dos Santos, D. R.: Combining visible-based-color parameters and geochemical tracers to improve sediment source discrimination and apportionment, Sci. Total Environ., 527, 135–149, https://doi.org/10.1016/j.scitotenv.2015.04.103, 2015.
Trescases, J. J.: Weathering and geochemical behaviour of the elements of ultramafic rocks in New Caledonia, BMRJ. Aust. Geol and Geophys., 141, 149–161, 1973.
Uber, M., Legout, C., Nord, G., Crouzet, C., Demory, F., and Poulenard, J.: Comparing alternative tracing measurements and mixing models to fingerprint suspended sediment sources in a mesoscale Mediterranean catchment, J. Soils Sediment., 19, 3255–3273, 2019.
Valette-Silver, N. J.: The use of sediment cores to reconstruct historical trends in contamination of estuarine and coastal sediments, Estuaries, 16, 577–588, 1993.
Varol, M.: Assessment of heavy metal contamination in sediments of the Tigris River (Turkey) using pollution indices and multivariate statistical techniques, J. Hazard. Mat., 195, 355–364, 2011.
Wallbrink, P. J., Murray, A., Olley, J., and Olive, L.: Determining sources and transit times of suspended sediment in the Murrumbidgee River, New South Wales, Australia, using fallout 137Cs and 210Pb, Water Resour. Res., 34, 879–887, 1998.
Wallbrink, P. J.: Quantifying the erosion processes and land-uses which dominate fine sediment supply to Moreton Bay, Southeast Queensland, Australia, J. Environ. Radioac., 76, 67–80, 2004.
Walling, D., Peart, M., Oldfield, F., and Thompson, R.: Suspended sediment sources identified by magnetic measurements, Nature, 281, 110, 1979.
Yellishetty, M., Mudd, G. M., and Shukla, R.: Prediction of soil erosion from waste dumps of opencast mines and evaluation of their impacts on the environment, International Journal of Mining, Reclamat. Environ., 27, 88–102, 2013.