the Creative Commons Attribution 4.0 License.
the Creative Commons Attribution 4.0 License.
 | 27 Oct 2021
Estimation of soil properties with mid-infrared soil spectroscopy across yam production landscapes in West Africa
Philipp Baumann
Juhwan Lee
Emmanuel Frossard
Laurie Paule Schönholzer
Lucien Diby
Valérie Kouamé Hgaza
Delwende Innocent Kiba
Andrew Sila
Keith Sheperd
Johan Six
Low soil fertility is challenging the sustainable production of yam and other staple crops in the yam belt of West Africa. Quantitative soil measures are needed to assess soil fertility decline and to improve crop nutrient supply in the region. We developed and tested a mid-infrared (mid-IR) soil spectral library to enable timely and cost-efficient assessments of soil properties. Our collection included 80 soil samples from four landscapes (10 km × 10 km) and 20 fields per landscape across a gradient from humid forest to savannah and 14 additional samples from one landscape that had been sampled within the Land Health Degradation Framework. We derived partial least squares regression models to spectrally estimate soil properties. The models produced accurate cross-validated estimates of total carbon, total nitrogen, total sulfur, total iron, total aluminum, total potassium, total calcium, exchangeable calcium, effective cation exchange capacity, and diethylenetriaminepentaacetic acid (DTPA)-extractable iron and clay content (R2>0.75). The estimates of total zinc, pH, exchangeable magnesium, bioavailable copper, and manganese were less predictable (R2>0.50). Our results confirm that mid-IR spectroscopy is a reliable and quick method to assess the regional-level variation of most soil properties, especially the ones closely associated with soil organic matter. Although the relatively small mid-IR library shows satisfactory performance, we expect that frequent but small model updates will be needed to adapt the library to the variation of soil quality within individual fields in the regions and their temporal fluctuations.
- Article
(2961 KB) - Full-text XML
- BibTeX
- EndNote


Yam (Dioscorea spp.) is an important food and cash crop in West Africa. The yam belt of West Africa spans across the central zone of coastal countries in West Africa, located across the humid forest zone and northern Guinean savanna. It contributes to about 92 % of total world yam production, e.g., a total yield of 73×106 t in 2017 (Food and Agriculture Organization of the United Nations, 2019). The cropping area in the West African yam belt has been expanded with accelerated population growth. The deforestation and expansion of agricultural land has in many places caused soil degradation. Furthermore, there has been a trend of shortened fallow periods in the cropping areas of West Africa over the last decades, which has further exacerbated the decline in soil fertility across the yam belt. Traditionally, yam is grown without external input in these areas. Therefore, the production of yam and other crops grown in the region depends on soil organic matter (SOM) status (Padwick, 1983), which serves as a main pool of plant-available nutrients and provides cation exchange surfaces for soil nutrients (Syers et al., 1970; Soares and Alleoni, 2008). A particularly strong positive relationship between high organic matter stocks and yam productivity is reported after fallow and when no fertilizer is added (Diby et al., 2009; Kassi et al., 2017). Thus, maintaining or increasing SOM and available nutrient levels is of utmost importance for sustainable production of yam and other crops in West Africa (Carsky et al., 2010). Furthermore, linking soil properties and yam yields (Frossard et al., 2017) and accounting for soil macro- and micronutrient status (O'Sullivan and Jenner, 2006) are fundamental to improving crop yields and soil management strategies.
Soil fertility is an integrative measure of soil attributes and their interactions that support the long-term agricultural production potential. Soil fertility is commonly decomposed into physical, chemical, and biological major components (Abbott and Murphy, 2007). Here, it is important to interpret soil fertility in the form of soil conditions and functions at an adequate resolution over time and space and in relation to the crop of interest. For yam, low tuber yields are often attributed to an unbalanced ratio of essential nutrients (i.e., N, P, K) available in the soil (Enyi, 1972) and a fast mineralization and hence depletion of organic matter (Carsky et al., 2010; Hgaza et al., 2011). Yet, the relationship between soil properties and tuber yield is not fully understood (Frossard et al., 2017). The reason is that the response of yam to mineral fertilization is highly variable because of confounding environmental and management variables, such as climate, soil type, inherent soil fertility, micronutrient deficiencies, tillage, seed tuber quality, planting date and density, staking, and disease pressure across the yam belt (Kang and Wilson, 1981; O'Sullivan and Jenner, 2006; Cornet et al., 2016; Enesi et al., 2018). Further, there are no soil fertility recommendations specific for yam under West African conditions. For this reason, establishing yam field trials designed with different organic and mineral fertilization strategies within different yam-growing regions is required to optimize yam nutrient supply targeting regional soil and environmental conditions (Frossard et al., 2017). Despite the importance of soil fertility, it is challenging to quantify soil measures at sufficient temporal and spatial resolution to relate them to yam productivity together with other management effects.
To quickly assess key soil properties, such as soil organic carbon (SOC) and cation exchange capacity (CEC), we need more cost- and time-efficient methods in addition to the traditional wet chemistry laboratory analyses that are often cost-intensive and time-consuming. Proximal sensing is a method that can provide reliable, rapid, and inexpensive soil measurements (UNEP, 2012). Soil visible and near-infrared (vis–NIR) and mid-infrared (mid-IR) diffuse reflectance spectroscopy has gained popularity over the past 30 years to assess soil properties in a complementary manner to conventional laboratory analytical methods (Nocita et al., 2015). For model development and calibration but, importantly, also for validation purposes, soil IR spectroscopy requires laboratory reference analysis data. Previous studies have shown successful spectroscopic predictions of soil properties, such as organic C, texture, cation exchange capacity (CEC), and exchangeable K (Viscarra Rossel et al., 2006; Cécillon et al., 2009; Nocita et al., 2015; Sila et al., 2016). Many soil chemical and physical properties, such as soil mineralogy and the concentration, forms, and distribution of SOM, are closely associated with IR spectral diversity. However, for determining a range of extraction-based soil properties, the predictive capability seems variable. This can be caused by complex surface chemical processes that are not directly related to soil organic matter and/or insufficient densities available at local scale to represent such locally complex relationships (Viscarra Rossel et al., 2006; Abdi et al., 2012; Sanderman et al., 2020). Further, a library that includes a broad range of soil biophysical conditions found in the region in which it is used needs to be established. Depending on the geographical extent of the study – field (e.g., Cambou et al., 2016), region, country (e.g., Clairotte et al., 2016), continent (e.g., Sila et al., 2016), world (e.g., Viscarra Rossel et al., 2016) – various statistical predictive modeling strategies are typically employed to account for geographically regional variability in soil properties and determine empirical relationships between spectra and soil attributes. Particular subsets of and features in spectra are characteristic of functional groups of soil components, and thus, elucidating spectral features that are important for the prediction of a particular soil attribute helps to understand and validate the mechanisms based on which the empirically models predict the soil properties.
In this work, we aim to develop mid-IR spectroscopy as a diagnostic tool for key analytical soil variables within four climatically, ecologically, and agriculturally distinct landscapes in Burkina Faso and Côte d’Ivoire. For yam and other cash crops, there is a lack of soil diagnostic tools to identify factors limiting yields and to derive site-specific fertilizer recommendations within and across landscapes. In these regions, yam has substantial economic importance for small-holder farmers. As land management and soil status is a key factor not only for yam but also for other high-value crops in the region, quick and cost-effective soil status assessments should be transferable to other crops with similar nutrient demands. Thus, the main objectives of this study were to (1) develop and evaluate openly accessible and reusable mid-IR spectroscopic models to estimate soil properties for selected landscapes representing major soil and climatic conditions in the West African yam belt, (2) to determine important spectral features for specific soil properties, and (3) to build a new soil spectral library in four landscapes of the West African yam belt for soil prediction and assessment. Finally, we make specific recommendations on whether and how specific mid-infrared diagnostic measures are applicable for different soil management and screening purposes. We also discuss the spectroscopic evaluation of the soil's capacity to retain and release nutrients for sustained and improved cropping in the region.
2.1 Landscapes and soil sampling
Our study area covered the climatic and soil biophysical conditions representative of the West African yam belt. We selected four landscapes, two in Côte d’Ivoire and two in Burkina Faso. Each landscape (approximately 10 km × 10 km) represents a diverse geographic ecoregion. The landscapes cover a gradient between humid forest and the northern Guinean savannah. Specifically, the landscape Liliyo in Côte d’Ivoire is at 5.88∘ N and in the humid forest zone. The predominant soil type is Ferralsol (IUSS Working Group WRB, 2015). The landscape Tiéningboué in Côte d’Ivoire is at 8.14∘ N and belongs to the forest savannah transitional zone. The soils are dominated by Nitisols and Lixisols (IUSS Working Group WRB, 2015). The landscape Midebdo is at 9.97∘ N and in the sub-humid savannah of Burkina Faso. Its dominant soil types include Lixisols, Gleysols, and Leptosols (IUSS Working Group WRB, 2015). The landscape Léo is at 11.07∘ N and in the northern Guinean savannah of Burkina Faso and has Lixisols and Vertisols as the dominant soil types (IUSS Working Group WRB, 2015). The mean annual rainfall was approximately 1300 mm in Liliyo, and 900 mm in Tiéningboué, Midebdo, and Léo.
During July and August 2016, we sampled the soil from a total of 80 fields under yam cultivation across the four landscapes, i.e., 20 yam fields in each landscape. The fields were selected in advance by taking into account visual variation in soil color and texture across the landscape. The yam fields selected contained the maximum soil variability based on soil color and cropping history, taking into account both local farmers' knowledge on soil fertility and agronomic extension expertise. Yam is typically planted on soil mounds, ranging from 5000 to 10 000 mounds ha−1 with a single yam plant per mound. Within each field, we sampled the soil at four adjacent mounds in square arrangement, which were spaced between 0.5 and 2 m. At each mound, six to eight auger cores (25 mm in diameter) to the 0.3 m depth were taken at a radius between 0.15 and 0.3 m away from the center of a mound, depending on the size of the mounds. Then the soils from the four mounds were combined into one composite sample per field (around 500 to 1000 g of soil).
An additional set of 14 composite soil samples was collected by the International Center for Research in Agroforestry (ICRAF) at Liliyo from one sentinel site called “Petit-Bouaké” (UNEP, 2012). Sampling took place between 25 and 29 August 2015 at positions that were previously selected for the Land Degradation Surveillance Framework (LDSF) in a spatially stratified manner (Vagen et al., 2010). The soil samples received from ICRAF were within the same landscape as the sampled soils in Liliyo within YAMSYS but sampled from different positions. All soil samples were air-dried and stored in plastic bags until further analysis.
2.2 Soil reference analyses
The air-dried soil samples were crushed and sieved at 2 mm. About 60 to 70 g of the sieved soil was oven-dried at 60∘C for 24 h, of which 20 g was ball-milled. All chemical analyses except soil pH were conducted both on the soils sampled in yam fields (n=80) and the LDSF soils obtained from ICRAF (n=14).
The milled soils were analyzed for total C and macronutrient (N and S) concentrations using an elemental analyzer (vario PYRO cube, Elementar Analysensysteme GmbH, Germany). For each of the four landscapes, two soils were selected and analyzed based on three analytical replicates for quantifying within-sample variance of the elemental analysis. For the remaining samples, the analysis was not repeated. Sulfanilamide was used as a calibration standard for the dry combustion. For pH determination, 10 g of air-dried soil per sample was placed in a 50 mL Falcon tube, and 20 mL of de-ionized water was added. The samples were shaken in a horizontal shaker for 1.5 h and measured for pH using a pH electrode (Benchtop pH/ISE meter model 720A, Orion Research Inc., USA).
Bioavailable micronutrient (Fe, Mn, Zn, and Cu) concentrations in soils were determined with the diethylenetriaminepentaacetic acid (DTPA) extraction method, as described in Lindsay and Norvell (1978). The extracting solution consisted of 0.0005 M DTPA, 0.01 M CaCl2, and 0.1 M triethanolamine. Briefly, 10 g of the sieved (< 2 mm) soils was extracted with 20 mL of DTPA solution. Micronutrient concentrations in the filtrates were measured by inductively coupled plasma optical emission spectroscopy (ICP-OES; using a Shimadzu ICPE-9820 plasma atomic emission spectrometer). Final DTPA-extractable concentrations of Fe, Mn, Zn, and Cu were calculated back to per kilogram of dry soil. For each landscape, two soils were selected and analyzed in triplicate to assess analytical errors. For the remaining soils the analysis was not repeated.
For each sample, the concentrations of total elements (Fe, Si, Al, K, Ca, P, Zn, Cu, and Mn) in the soil were assessed by energy dispersive X-ray fluorescence spectrometry (ED-XRF) measurements on 4 g of the milled soil with a SPECTRO XEPOS instrument (SPECTRO Analytical Instruments GmbH, Germany). The soil was mixed with an equal amount of wax using a ball mill and pressed into pellets. Exchangeable cations (Ca2+, Mg2+, K+, Na+, and Al3+) were determined with the BaCl2 method (Hendershot and Duquette, 1986). About 2 g of the air-dried soil (< 2 mm) was extracted by shaking for 2 h with 30 mL of 0.1 M BaCl2 on a horizontal shaker (120 cycles min−1). The suspension was filtered through no. 40 filter paper (Whatman, Brentford, UK). For each landscape, two soils were analyzed in analytical triplicate. The concentrations of exchangeable cations in the BaCl2 extract were measured by ICP-OES (using a Shimadzu ICPE-9820 plasma atomic emission spectrometer). Different BaCl2 extract dilutions were used in order to obtain an optimal signal intensity for the quantification of specific elements across all samples. Concentration of H+ per kilogram of dry soil was calculated based on the pH measured in the BaCl2 extractant. The BaCl2 extraction does only slightly modify pH and is therefore an appropriate method to calculate effective CEC (CECeff) at native soil pH. Using the concentrations of the BaCl2-extractable cations (i.e., Ca2+, Mg2+, K+, Na+, Al3+, and H+), CECeff was calculated as the sum of exchangeable cations in centimoles (cmol) of cation charge per kilogram of dry soil. Exchangeable acidity was defined by the sum of exchangeable Al3+ and H+. Base saturation in percent was calculated as a ratio of the sum of basic cations (Ca2+, Mg2+, K+, and Na+) in cmol(+) per kilogram of soil to the CECeff multiplied by 100.
Particle size analysis was conducted by the International Institute of Tropical Agriculture (IITA) in Cameroon, as described in Bouyoucos (1951). Briefly, 50 g of dried 2 mm sieved soil was stirred with 50 mL 4 % sodium hexametaphosphate and 100 mL of deionized water in a mixer, to break down the aggregates into individual particles. Readings with a hydrometer (ASTM 152 H, Thermco, New Jersey, USA) were taken after letting it stand in the suspension for 30 min. The silt content was calculated by subtracting the measured proportion of sand and clay from 100 %.
Spectroscopic measurements
The milled soils (n=94) were measured on a Bruker ALPHA DRIFT spectrometer (Bruker Optics GmbH, Ettingen, Germany), which was equipped with a ZnSe optics device, a KBr beamsplitter, and a DTGS (deuterated triglycine sulfate) detector. Mid-IR spectra were recorded between 4000 and 500 cm−1 with a spectral resolution of 4 cm−1 and a sampling resolution of 2 cm−1. Reflectance (R) spectra were transformed to apparent absorbance (A) using and corrected for atmospheric CO2 using macros within the OPUS spectrometer software (Bruker Corporation, US). The spectra were referenced to a IR-grade fine ground potassium bromide (KBr) powder spectrum, which was measured prior to the first soil sample and measured every hour again. All spectra were recorded by averaging 128 scans (internal measurements) to improve the signal-to-noise ratio for each of the three independent replicate samples of each soil.
2.3 Spectroscopic modeling
2.3.1 Processing of soil spectra
Three replicates of spectra were averaged for each sample. The spectra were transformed by using a Savitzky–Golay-smoothed first derivative using a third-order polynomial and a window size of 21 points (42 cm−1 at a spectrum interval of 2 cm−1) (Savitzky and Golay, 1964). Prior to spectral modeling, Savitzky–Golay-preprocessed spectra were further mean-centered and scaled (divided by standard deviation) at each wavenumber.
2.3.2 Model development and validation
The measured soil properties were modeled by applying partial least squares regression (PLSR) (Wold et al., 1983) with the preprocessed spectra as predictors. The models were fitted using the orthogonal scores' PLSR algorithm. A 10-fold cross-validation, repeated five times, was performed to provide unbiased and precise assessment of PLSR model performance (Molinaro et al., 2005; Kim, 2009). For each individual soil property, the number of factors for the most accurate PLSR model was tuned separately. For each soil property model, the sample set was repeatedly randomly split into k=10 (approximately) equally sized subsets without replacement for all repeats and all candidate values in the tuning grid with the number of PLSR factors (ncomp) . Within each of the resampling data set splits, each of the 10 possible held-out and model fitting set combinations (folds) was subjected to candidate model building at the respective ncomp, using out of 10 subsets, and remaining held-out samples were predicted based on the fitted models. The root mean square error (RMSE; Eq. 1) of the held-out samples was calculated by aggregating all repeated K-fold cross-validation predictions () and corresponding observed values (yi) grouped by ncomp, which resulted in a cross-validated performance profile RMSE vs. ncomp.
Based on this performance profile, the minimal ncomp among the models, whose performance was within a single standard error (“one standard error rule”; Breiman et al., 1984) of the lowest numerical value of RMSE, was selected.
Model assessment was done with the best factors for each property using cross-validation hold outs. We reported the cross-validated measures' RMSE, R2 (coefficient of determination) obtained via linear least squares regression, and ratio of performance to deviation (RPD), after averaging predictions across repeats. The RPD index is the ratio of the chemical reference data standard deviation (sy) to the RMSE of prediction.
Besides calculating the above listed performance measures, the uncertainty of spectral estimates was graphically reported for each soil sample, using prediction means and 95 % confidence intervals derived from cross-validation repeats (; Eqs. 3 and 4).
To cover the full training data space in the models for future sample predictions, the final PLSR models were rebuilt using the entire training set and the respective values of the optimal final number of PLSR components determined by the procedure described above.
2.3.3 Model interpretation
The mid-IR spectra contain complex information about soil composition and properties. To establish a predictive relationship, statistical models need to find relevant spectral features for each soil property. Model interpretation requires a variable importance assessment to decide on the contribution of spectral variables to prediction and to explain spectral mechanisms. Therefore, we conducted model interpretation based on the variable importance in projection (VIP) method (Wold et al., 1993; Chong and Jun, 2005), using the model at the respective best number of factors (ncomp). The VIP measure vj was calculated for each wavenumber variable j as
where waj are the PLSR weights for the ath component for each of the wavenumber variables, and SSa is the sum of squares explained by the ath component:
where qa are the scores of the predicted variable y, and ta are the scores of the predictors X. These VIP scores account for multicollinearity found in spectra and are considered to be a robust measure to identify relevant predictors. Important wavenumbers were classified with a VIP score above 1. A variable with VIP above 1 contributes more than the average to the model prediction. For model interpretation, we only computed VIP at the respective finally chosen number of PLS (partial least squares) components afinal for each considered model. We focused on a selection of three well-performing models with R2 ≥ 0.8 (RPD ≥ 2.3) to illustrate model interpretation. These were total C, total N, and clay content.
2.4 Statistical software
The entire analysis was performed using the R statistical computing language and environment (version 3.6.0) (R Core Team, 2017). We used the pls (Mevik et al., 2019) package for PLSR, as described by Martens and Naes (1989). Cross-validation resampling, model tuning, and assessment was done using the caret package (Kuhn et al., 2019). Custom functions from the simplerspec package were used for spectroscopic modeling (Baumann, 2019). All data and code to reproduce the results of this study are available online via Zenodo (Baumann, 2020).
Measured properties and mid-IR estimates of yam soils
The distribution of soil properties of the yam fields showed a wide variation across the landscapes (Fig. 1). Total C concentrations across all fields ranged from 2.4 to 24.7 g C kg−1. Total C values at the landscape scale were the lowest (median) in Léo and the highest in Tiéningboué. Soils from yam fields in the two landscapes from Côte d’Ivoire (13.0 ± 5.4 g C kg−1; mean ± standard deviation) had relatively higher total C compared with the fields in the landscapes in Burkina Faso (6.1 ± 3.6 g C kg−1). The median value and variation of CECeff exhibited similar patterns across the landscapes to total C. Total N concentrations across all fields ranged from 0.18 to 2.48 g N kg−1. Total N within and across the four landscapes exhibited a similar pattern to total C. Generally, the landscapes in Burkina Faso were low in total N compared to those from Côte d’Ivoire (0.44 ± 0.24 g N kg−1 vs. 1.09 ± 0.46 g N kg−1). Median total N concentrations were almost identical for Liliyo and Tiéningboué, with 1.1 g N kg−1. Total S concentrations varied between 41 and 242 mg S kg−1 across all fields and showed a similar pattern to total C and N. The yam fields in the landscapes of Burkina Faso had on average more than 2 times higher total S than the other landscapes. Total P concentrations were in a similar range for the landscapes Léo, Midebdo, and Liliyo. In Tiéningboué, total P values were almost 2 times higher than the other fields (817 mg S kg−1 vs. 453 mg P kg−1), with more within-landscape variation.
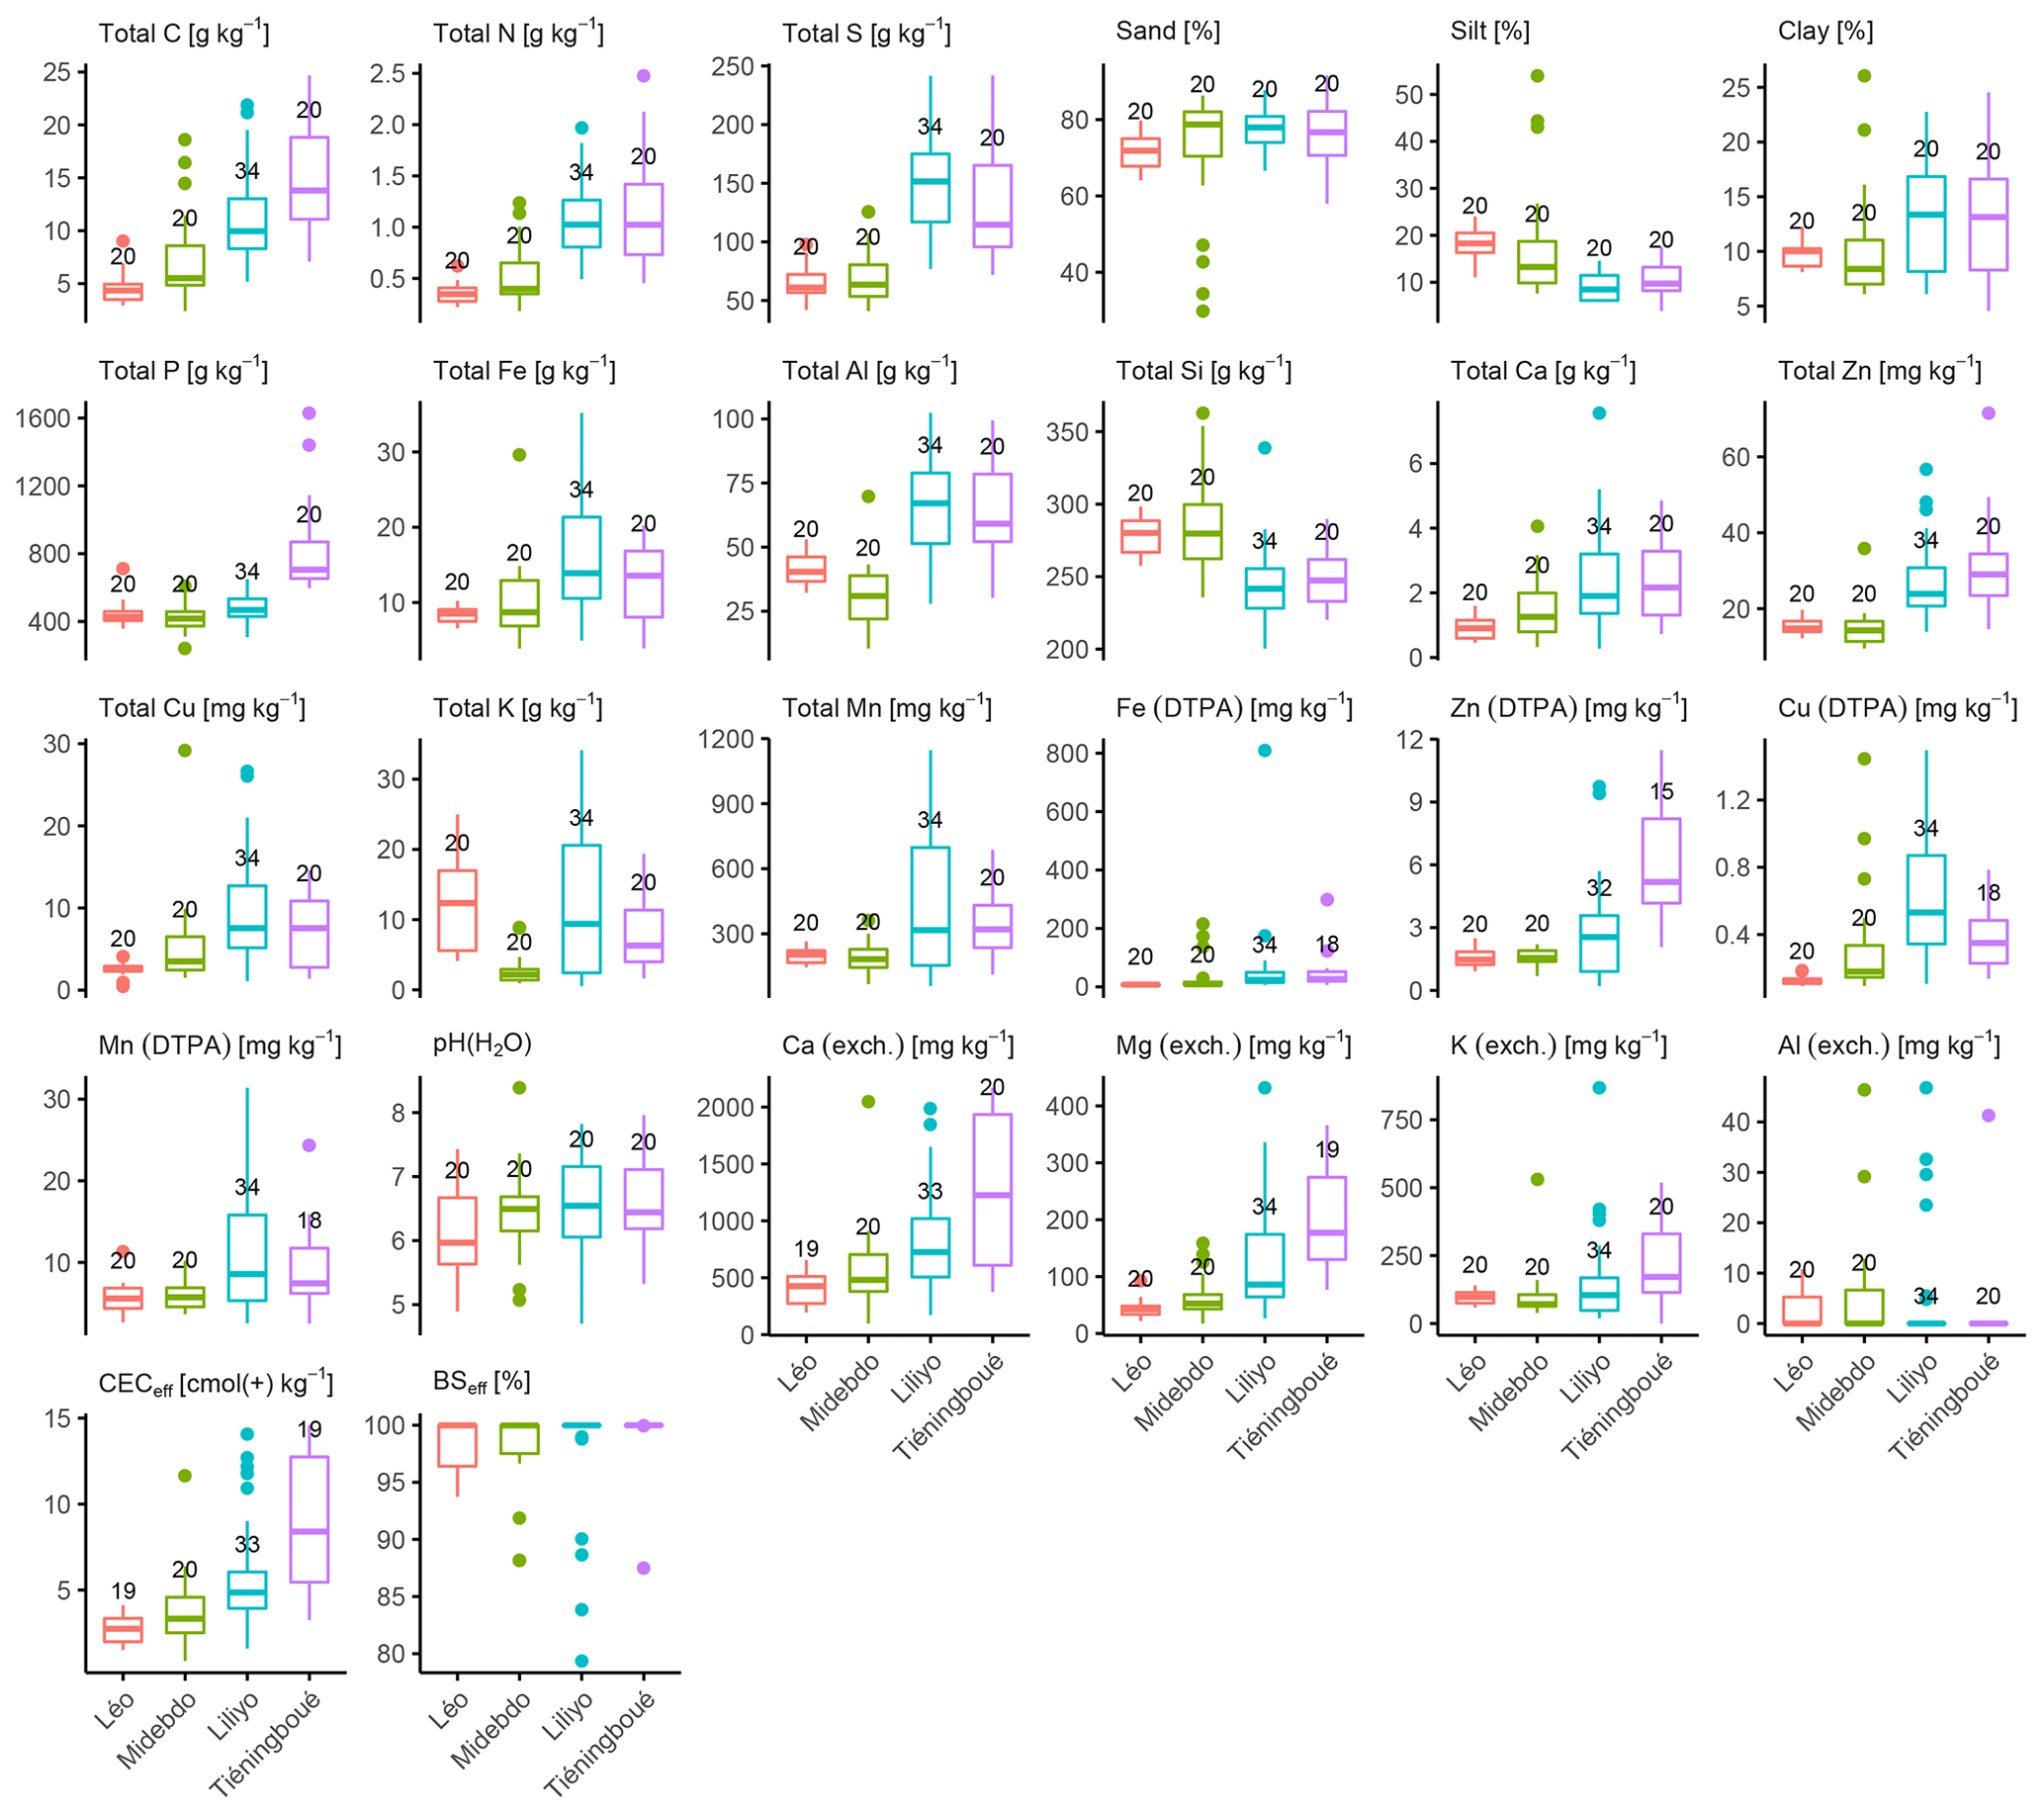
Figure 1Reference measurements of soil chemical properties. Léo and Midebdo are two yam-growing landscapes in Burkina Faso, and Liliyo and Tiéningboué are in Côte d'Ivoire. The chemically analyzed soils (n=94) originated from 20 yam fields per landscape and 14 additional soils from the Liliyo region were provided by the World Agroforestry Center (ICRAF). C is carbon, N is nitrogen, P is phosphorus, Fe is iron, Al is aluminum, Si is silicon, Ca is calcium, Zn is zinc, Cu is copper, K is potassium, and Mn is manganese. Bioavailable micronutrients were measured by the diethylenetriaminepentaacetic acid (DTPA) extraction method. Ca(exch.), Mg(exch.), K(exch.), and Al(exch.) signify exchangeable elements determined with BaCl2 extraction. CECeff is the effective cation exchange capacity, and BSeff is the effective base saturation. The number of soils analyzed for each individual property is indicated above the 75 % percentile.
The concentrations of total Fe, total Al, total Ca, total Zn, and total Cu in the soil tended to be higher for the landscapes in Côte d’Ivoire than in Burkina Faso (Fig. 1). To give an example, median concentrations of total Ca were 2.16 g Ca kg−1 in fields sampled from the Tiéningboué region and similar in Liliyo (i.e., 1.90 g Ca kg−1), while they were markedly lower in Léo and Midebdo (i.e., 0.90 vs. 1.26 g Ca kg−1). In general, the ranges for total micronutrient contents were more variable in the landscapes of Côte d’Ivoire (e.g., range = 14.0–57.0 mg Zn kg−1 in Liliyo; lowest range in Léo = 12.2–19.7 mg Zn kg−1). Total K concentration was highly variable within and across the landscapes (overall range = 0.5–34.1 g K kg−1) and lowest in Midebdo (range = 0.9–8.9 g K kg−1), while the highest total K median was measured in yam fields of Léo (range = 4.1–25.0 g K kg−1).
Median extractable Fe and its interquartile ranges were comparable across the landscapes (see Fig. 1). However, there were some fields where extractable Fe reached values higher than 100 mg Fe kg−1. Median extractable Zn values showed a similar pattern to total C, with the highest median values and interquartile range in Tiéningboué, and had the lowest in Léo. In comparison, the highest median values and interquartile range of extractable Cu and Mn were found in Liliyo. For extractable Zn, Cu, and Mn, median values and interquartile range were higher in the two landscapes in Côte d’Ivoire than the two landscapes in Burkina Faso.
Across all samples and landscapes, soil pH varied between 4.7 and 8.4. Median pH was comparable in Tiéningboué (i.e., 6.4), Liliyo (i.e., 6.5), and Midebdo (i.e., 6.5). Median pH of yam fields in Léo (i.e., 6.0) was lower than in the other landscapes. Exchangeable K, Ca, and Mg concentrations showed similar patterns across the four landscapes. In Burkina Faso, each of the exchangeable cations showed relatively low median concentrations across the fields and less landscape-level variation than in Côte d’Ivoire. In general, the highest median and variation of exchangeable cations among the landscapes were measured in the yam field soils of Tiéningboué. Median exchangeable Al values were comparable among the landscapes, although there were some outliers with exchangeable Al > 20 mg kg−1 for Midebdo, Liliyo, and Tiéningboué. The CECeff ranged from 0.9 to 14.6 cmol(+) kg−1 across all fields and landscapes. Median CECeff tended to decrease in the following order across landscapes: Léo > Midebdo > Liliyo > Tiéningboué. The interquartile range of CECeff was also the greatest in Tiéningboué and the smallest in Léo.
Reference measurements for total N, S, exchangeable Ca, exchangeable Mg, and CECeff. were closely correlated with total C (Fig. 2; (CECeff.)). Also, total Ca, Al, and clay content correlated closely with total C (r>0.70). Clay contents were weakly related to silt (r=0.21), while sand had a markedly negative relationship with silt (). Bioavailable Zn (DTPA) was covarying with both CECeff. (r=0.58) and total Zn (r=0.59). Bioavailable Cu (DTPA) had a strongly positive association to total Cu (r=0.90). Exchangeable K (BaCl2) had the strongest relationship with total C and CECeff. (r=0.63, and r=0.64).
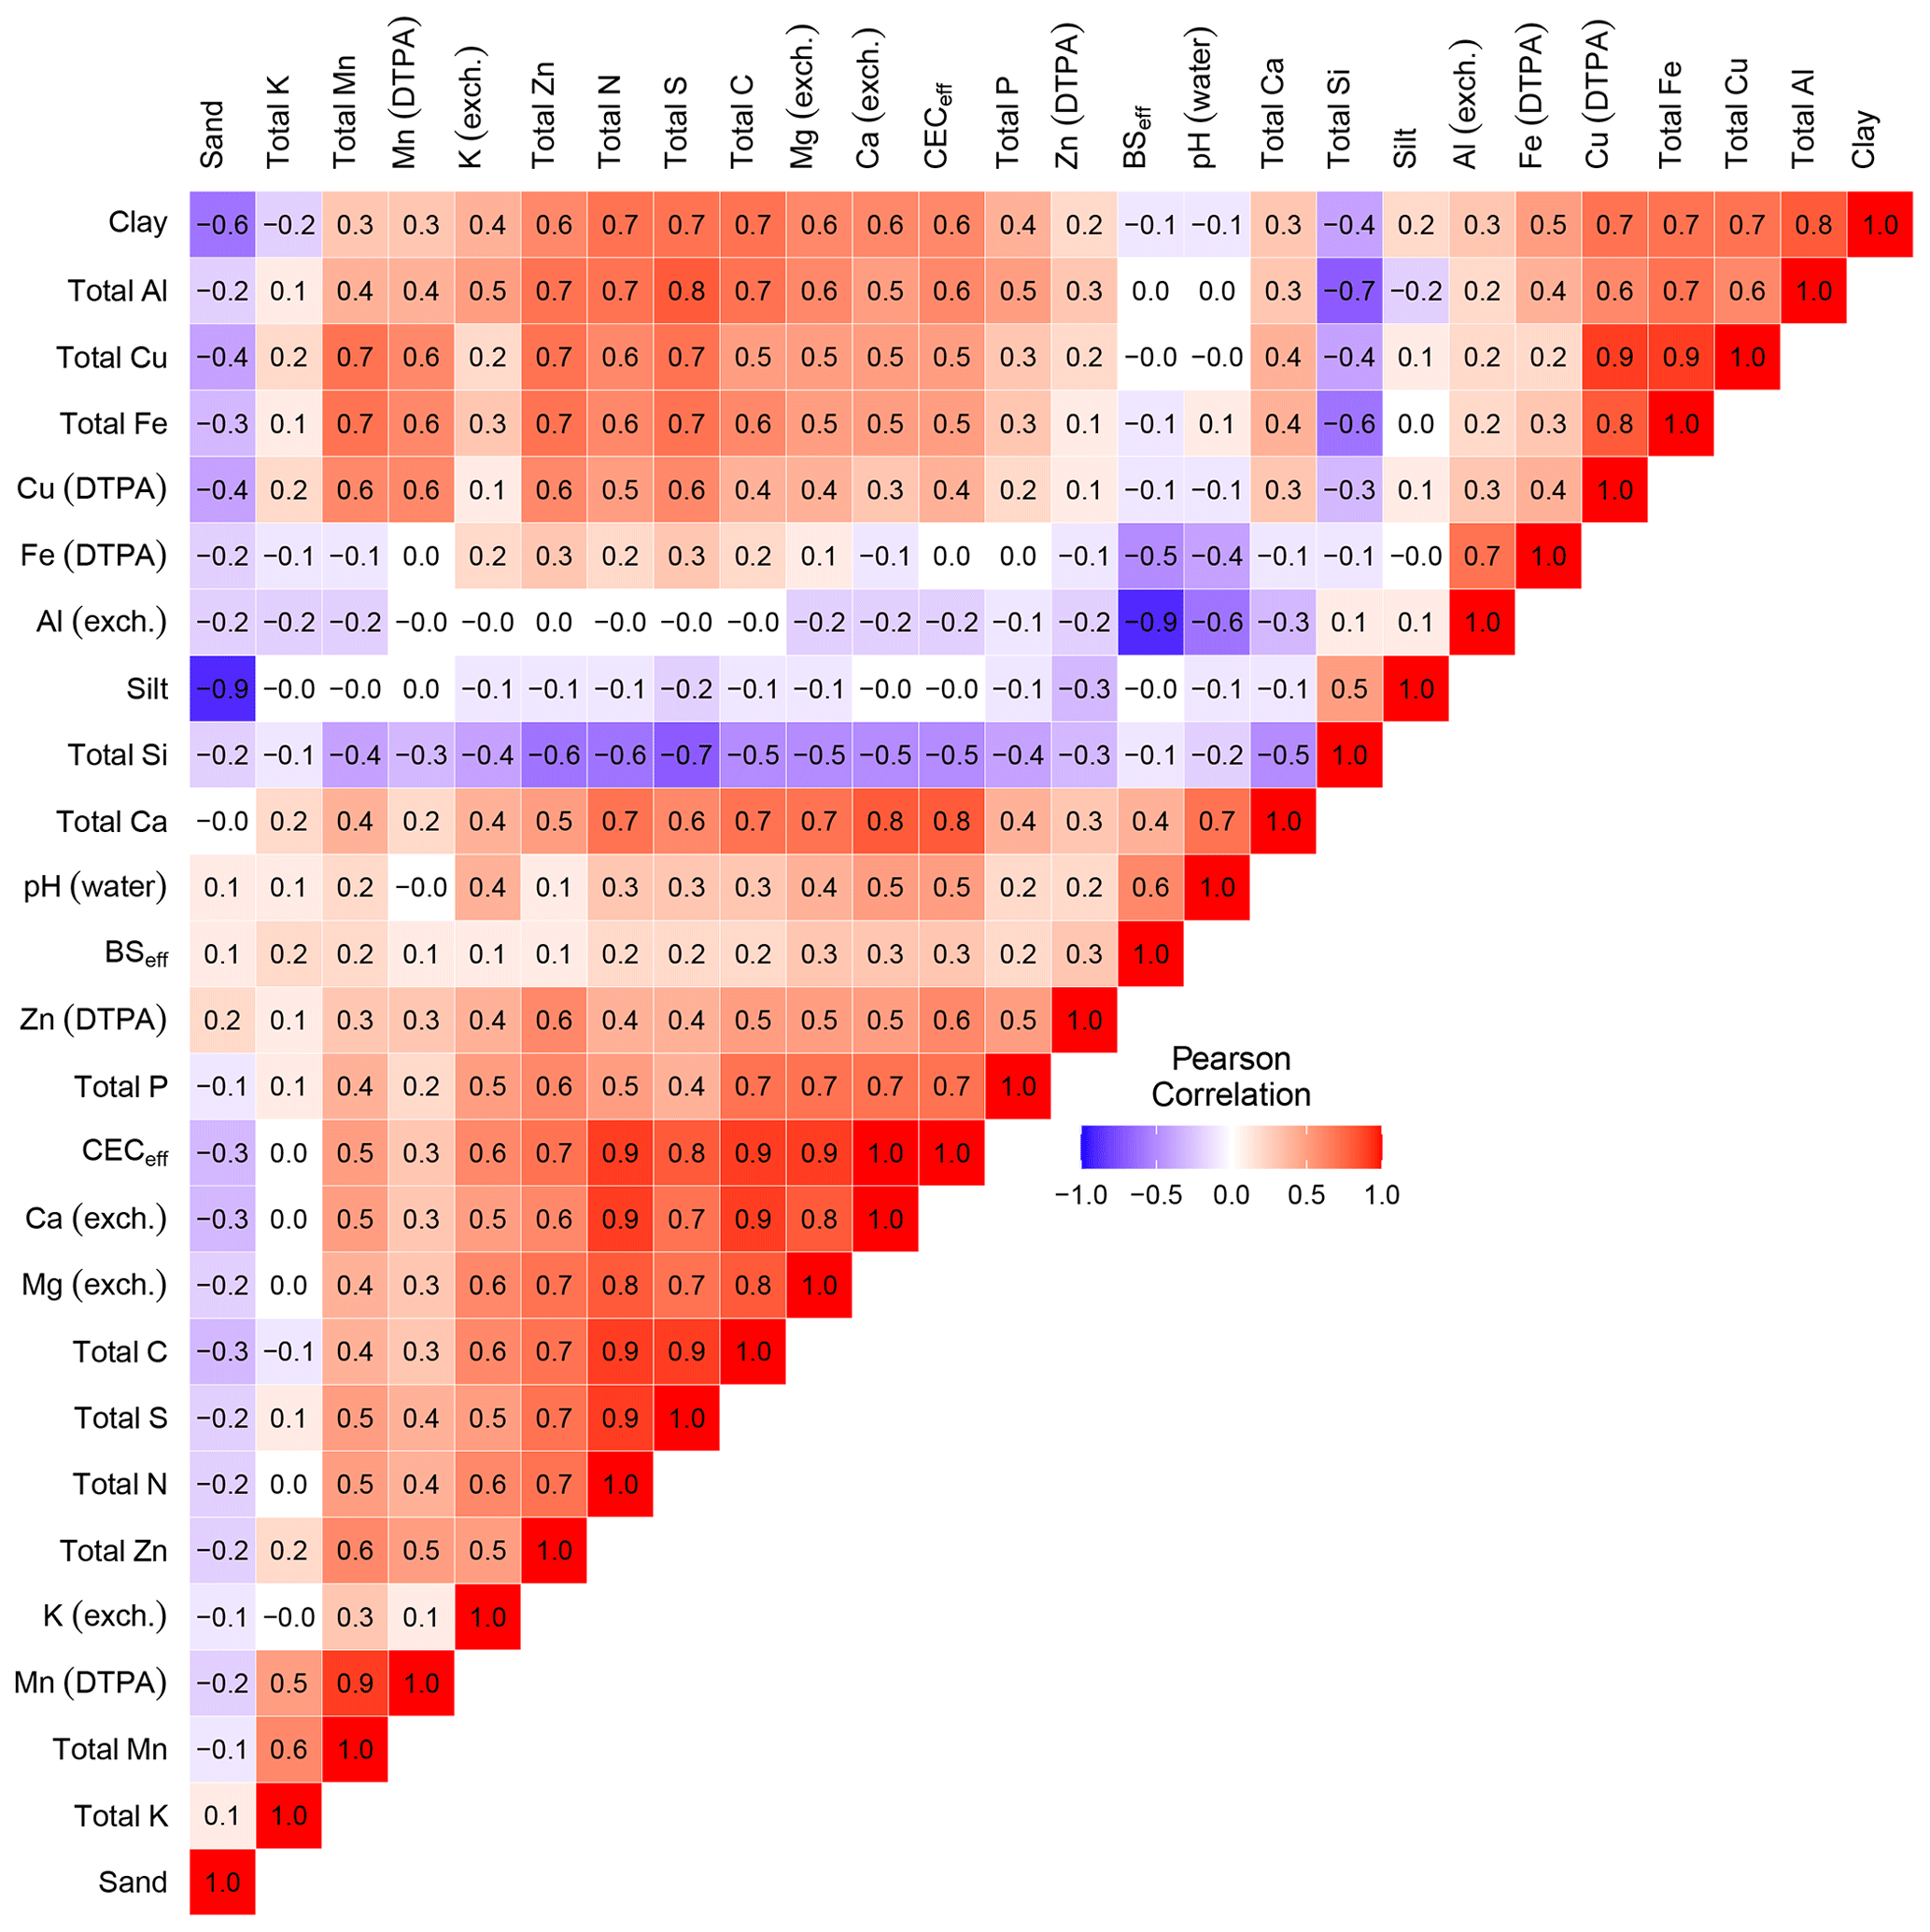
Figure 2Correlation matrix of soil properties measured on each of the 20 soils sampled from individual yam fields per landscape and 14 additional agricultural soils received from the World Agroforestry Center (n=94; see Fig. 1 for further details and abbreviated chemical properties). Pearson correlation coefficients (r) were rounded to one decimal point.
3.1 Soil mid-IR spectroscopic models
Among the measured soil properties, mid-IR PLSR models for total K (R2=0.96) and total Al (R2=0.97) performed the best (Table 1). Out of a total of 27 soil attributes, 11 were well quantified by the models (; Fig. 3). The confidence intervals derived from cross-validation prediction were very narrow, showing that all PLSR models were stable. Within this group of stable models, four soil attributes are directly related to the mineralogy (total Fe, Al, K, and Ca), three are related to soil organic matter (total C, N, and S), one is related to texture (clay fraction), one is related to plant nutrition (exchangeable Fe), and two are related to mineralogy and plant nutrition (exchangeable Ca and CECeff). More specifically, total C was accurately predicted, with an R2 of 0.92 and a RMSE of 1.6 g C kg−1. The models were also able to predict total N well (R2=0.89; RMSE = 0.16 g N kg−1). Prediction accuracy of total S was slightly lower than for total C, but its goodness-of-fit and RMSE suggest that the model was reliable for prediction. However, exchangeable K (R2=0.28) and BSeff (R2=0.24) were poorly predicted (Table 1). Predictions for percent clay were reliable (R2=0.81; RMSE=2.1 %), whereas predictions for percent sand (R2=0.45; RMSE=8.1 %) and percent silt (R2=0.41; RMSE=6.5 %) were not accurate. Finally, chosen models of all soil attributes had between one and nine PLSR components.
Table 1Descriptive summary of measured (meas.) soil reference data (see Fig. 1) and evaluation results of cross-validated PLSR models. All samples across the four landscapes were aggregated into a single model per respective soil property. Model evaluation was done on held-out predictions of 10-fold cross-validation (cv) repeated five times at the finally selected number of PLSR components (ncomp). CV is the coefficient of variation, RMSE is the root mean square error, and RPD is the ratio of performance to deviation. C is carbon, N is nitrogen, P is phosphorus, Fe is iron, Al is aluminum, Si is silicon, Ca is calcium, Zn is zinc, Cu is copper, K is potassium, and Mn is manganese. Bioavailable micronutrients were measured by diethylenetriaminepentaacetic acid (DTPA) extraction. Ca(exch.), Mg(exch.), K(exch.), and Al(exch.) signify exchangeable elements determined with BaCl2 extraction. CECeff is the effective cation exchange capacity, and BSeff is the effective base saturation.
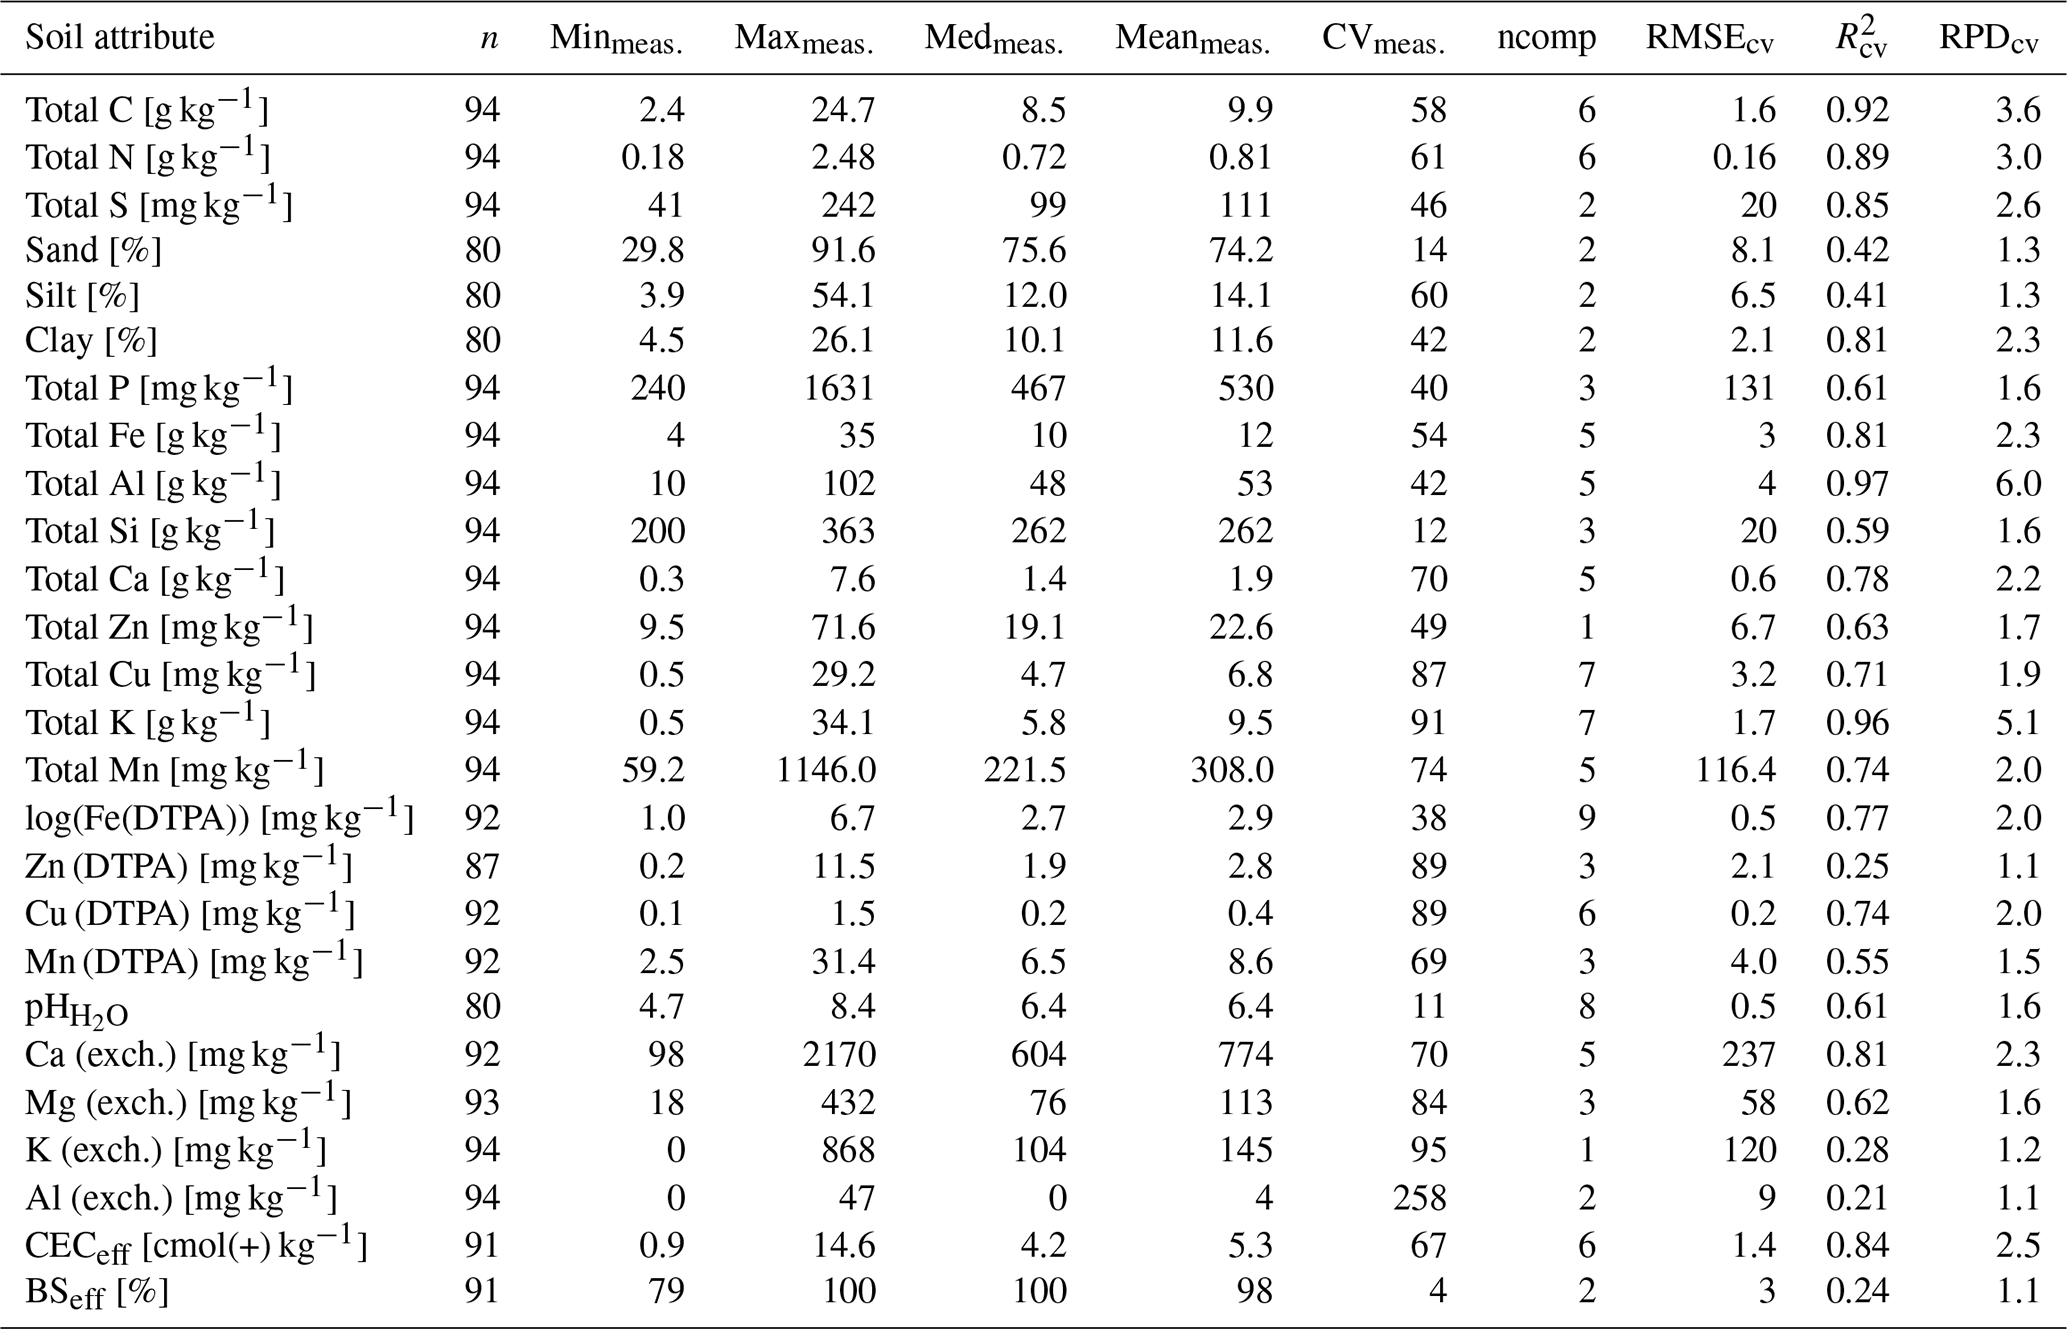
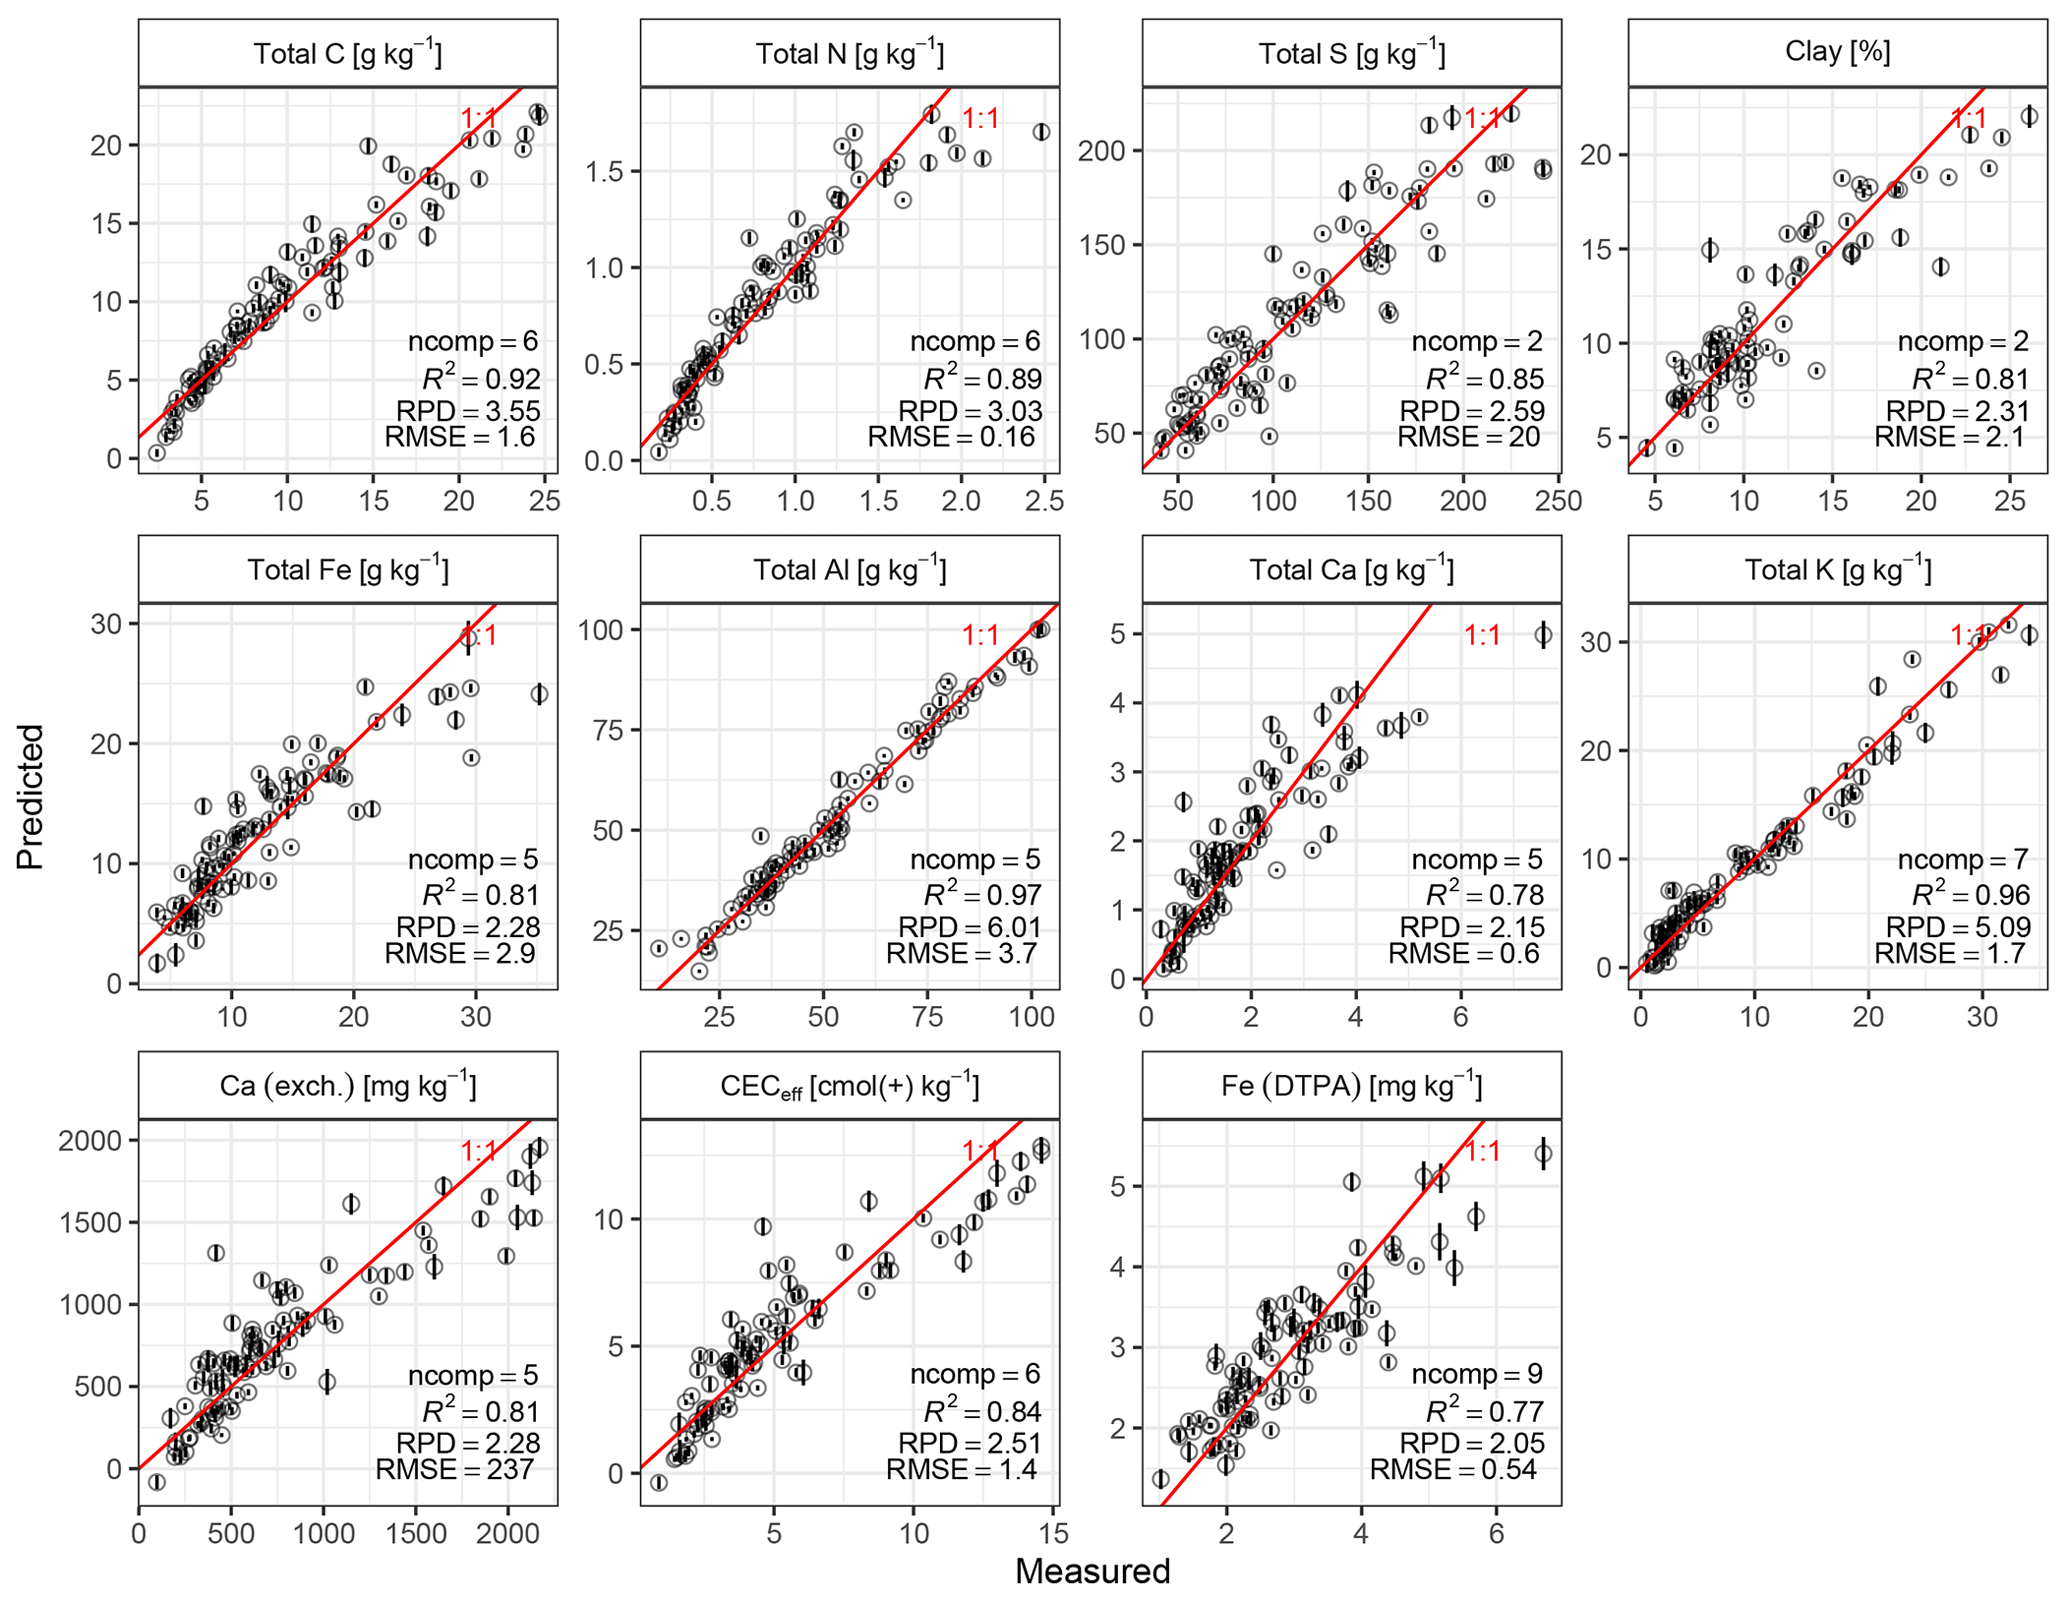
Figure 3Cross-validated predictions of soil properties derived from best mid-infrared (mid-IR) partial least squares regression (PLSR) models vs. laboratory reference measurements (see Fig. 1). Average estimates, their confidence intervals (error bars), and evaluation metrics were derived with 10-fold cross-validation repeated five times. “ncomp” is the number of PLSR components of most accurate final models, RSME is the root mean square error, and RPD is the ratio of performance to deviation. Only soil properties modeled with R2>0.75 are shown. CECeff is the effective cation exchange capacity. Exchangeable (exch.) elements were determined with BaCl2. Bioavailable Fe was determined via diethylenetriaminepentaacetic acid (DTPA) extraction.
3.1.1 Model interpretation
A large proportion of absorptions had VIP>1 for each of the total C, total N, and clay models (Fig. 4). Important wavenumbers (VIP>1) for total C were mostly between 3140 and 1230 cm−1. Besides clear absorption peaks, there were relatively continuous spectral features that were important to the models. For example, the relatively continuous and smooth spectral region between the alkyl C−H vibrations at 2855 and 2362 cm−1 had a comparable contribution to the model as peak regions associated with total C prediction. The VIP patterns across wavenumbers were almost identical for total C and N models, and its reference measurements were strongly correlated (r=0.94; Fig. 2). In contrast, the clay content model deviated from the total C model in particular regions, for example around the kaolinite OH− feature at 3620 cm−1 or at kaolinite vibrations at 934 and 914 cm−1.
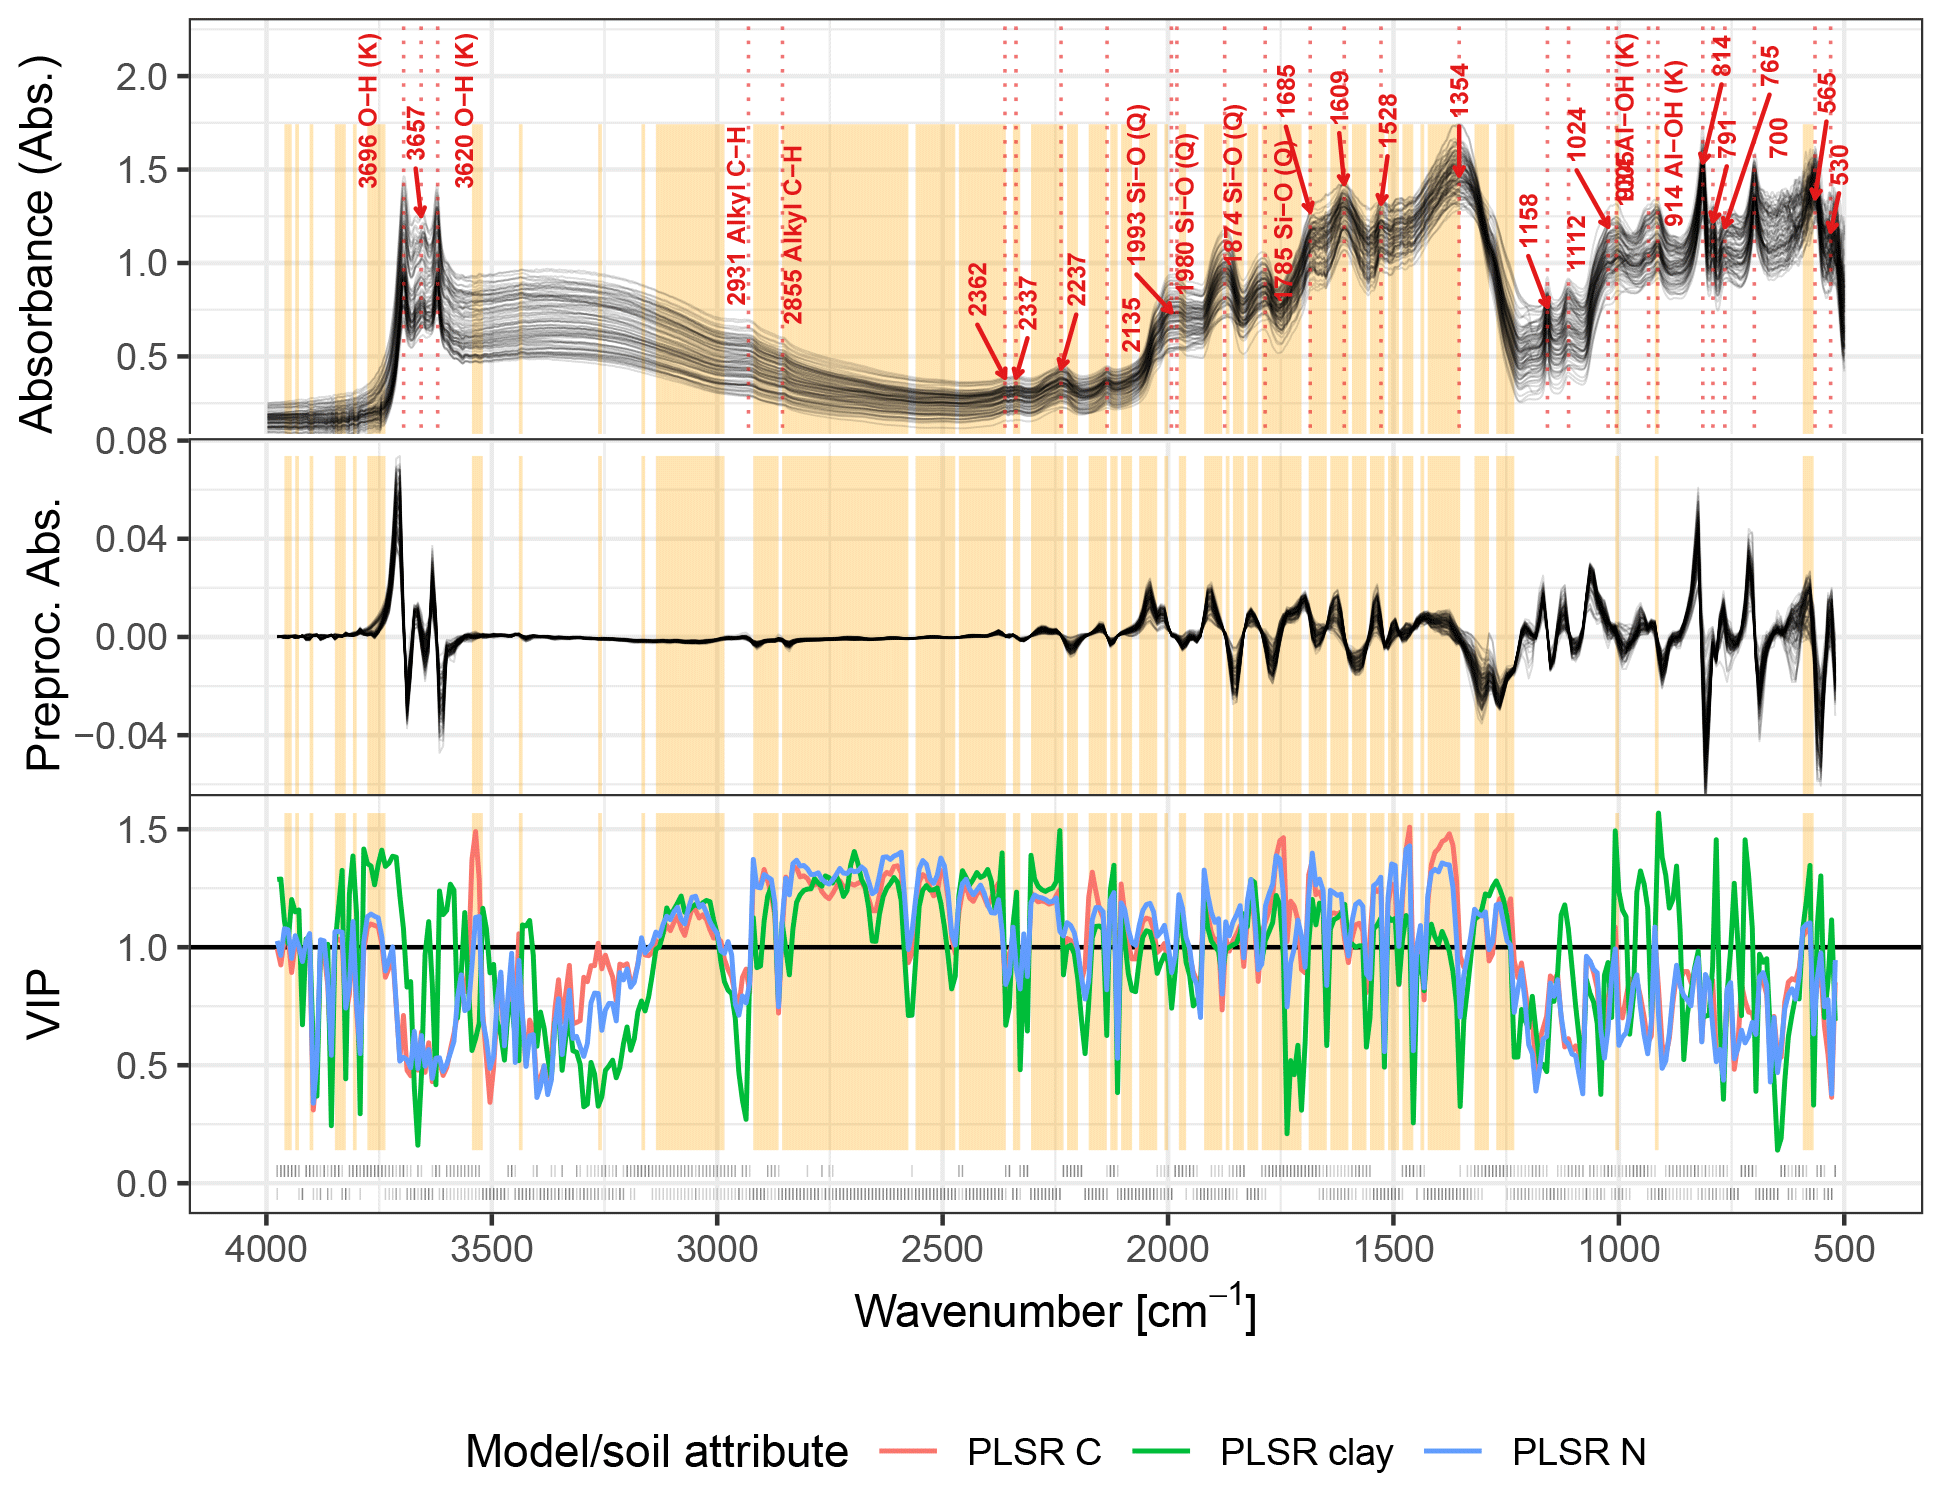
Figure 4Variable importance analysis of partial least squares regression (PLSR) models for the concentrations of total soil C and total N and clay content, including overlaid raw and preprocessed spectra. The top panel shows resampled mean sample absorbance spectra (n=94). Prominent peaks were identified as local maxima with a span of 10 points 20 cm−1 for the selected wavenumbers. Fundamental mid-IR vibrations that are well described in the literature (e.g., Madejová et al., 2002; Rossel and Behrens, 2010; Stevens et al., 2013) were added as labels when identified peaks matched literature assignments. (Q) stands for quartz and (K) for kaolinite. The middle panel depicts preprocessed spectra (Savitzky–Golay first derivative with a window size of 21 points (42 cm−1); third-order polynomial fit). The bottom panel shows variable importance in the projection (VIP) for three selected well-performing PLSR models (total C, total N and clay; R2>0.81). The horizontal black line at VIP=1 indicates the threshold above which absorbance at a given wavenumber contributes more than the average (wavenumber) to the spectral variance explained of a certain soil property. Dashed points closely below the y=0 line of the VIP graph visualize positive (above y=0) and negative (below y=0) PLSR β coefficients.
3.2 Accuracy and relevance of mid-IR spectroscopy for agronomic diagnostics
Timely and accurate estimates of multiple soil properties are required to better understand and predict soil constraints across the yam belt in West Africa. The soil spectral library from our study, which includes four landscapes of the yam belt, can be practical to diagnose and monitor (and eventually manage) soil fertility that is considered to be low and therefore is a major constraint to yam production in West Africa. Specifically, our results show that properties closely related to organic matter – total amount of C, (micro)nutrients, and exchangeable cations – can be accurately estimated using mid-IR spectra and in the selected yam-growing landscapes (Fig. 3). Soil organic matter plays a crucial role during vegetative growth and tuber formation phases of yam, as it guarantees among many other functions the storage and availability of essential nutrients and water needed for yam and tuber growth throughout the season and prevents soil erosion as well due to its structural stabilization capacity. It promotes soil aggregation, which stabilizes soil organic matter and protects it from microbial decomposition (Six et al., 2006).
Fertilizers are becoming more essential to replenish mineral nutrients for prolonged cropping. Nevertheless, soil organic matter is at high risk of depletion in these regions because of the increasing land use frequencies and shorter fallows to restore the soil organic C pools. While it is pivotal to develop innovative crop and soil management solutions to this problem (O'Sullivan and Jenner, 2006; Frossard et al., 2017; Kiba et al., 2020), it is also crucial to perform a separate but complementary activity to give feedback on potential soil changes: developing and applying soil conventional and proximal sensing methods. When testing sustainable soil and crop management options, for example to derive region-specific and farm-adapted nutrient management strategies, putting both validated quantitative statements on the status of soil organic carbon and local farmers' soil knowledge into the equation is crucial (Wawire et al., 2021). Inevitably, both determining the inherent soil status (i.e., soil texture and organic carbon) and measuring the chemical and physical environment that regulates nutrient availability at trial sites (e.g., pH) is of agronomic and environmental importance (Foster, 1981). Maintaining and improving soil quality attributes will be paramount to sustaining soils' ecosystem functions and crop yields over time. Activities to maintain and improve soil properties can for example be oriented towards fostering nutrient recycling.
Quick and reasonably accurate soil estimates derived from mid-IR spectra and empiric models as for example outlined in this study can inform the site-adapted timing, placing, and form of nutrient supply based on local soil conditions. To give a specific example, yam requires relatively large quantities of N and K (e.g., O'Sullivan, 2010); on light-textured soils, yam can attain high tuber yields but at a high risk of losing large proportions of applied N and K to the environment (e.g., Diby et al., 2011). Therefore, spectral estimates of texture can give an indication that applying larger amounts of N and K at once would not improve yield potential under such situations. Hence, more frequent and local mineral applications of these nutrients after crop emergence, eventually combined with organic mulch, could improve the fertilizer efficiency and mitigate negative environmental impacts under these soil conditions. To estimate the availability of specific (micro)nutrients, however, more efforts need to be made to measure them at fine temporal and spatial resolution.
The mid-IR model accurately estimated C (RMSE = 1.6 g kg−1; Table 1; Fig. 3). Mostly, only field-scale spectroscopic models achieve such accuracy (Nocita et al., 2015; Guerrero et al., 2016), whereas the predictive accuracy reported for larger scale application of spectroscopic models is lower than for our model (Rossel and Webster, 2012; Stevens et al., 2013; Sila et al., 2016). Models covering a wide geographical range of soils often result in high prediction errors (Stenberg and Rossel, 2010). Despite different soil types and climate regimes across a wide geographic spacing between the calibration fields, we achieved an accurate spectroscopic estimation of total C. The model was also able to reliably estimate a range of other important soil properties than total C. Specifically, other soil variables eligible for a mid-IR quantification include total N, total S, total Ca, total K, total Al, exchangeable Ca, Fe DTPA, CECeff., and clay content (R2>0.75). The close correlations of total C with N, S, exchangeable Ca, exchangeable Mg, CECeff., total Ca, Al, and clay content (Fig. 2) are consistent with Johnson et al. (2019), who reported very similar associations of clay content and exchangeable cations (Ca, Mg, K) as well as CECeff. in soils from rice fields () – nevertheless they spectrally modeled a considerable soil variability (20 countries in sub-Saharan Africa; 42 study sites) and a larger sample size (n=285) using PLS regression. At the same time, the measured range and the error in spectral estimates of CEC were larger compared to ours (RMSE = 6.7 cmol(+) kg−1 vs. 1.4 cmol(+) kg−1; range = 1.9–66.5 cmol(+) kg−1 vs. 0.9–14.6 cmol(+) kg). Even though total K and Fe(DTPA) were poorly correlated with total C, their spectroscopic estimates were relatively accurate. This suggests that the mid-IR prediction of other soil properties is largely based on their correlation with total C as well as other absorption features of many organic and mineral soil components having a specific IR adsorption.
We also found reasonable prediction accuracy for Cu(DTPA) (R2=0.74) and Mn(DTPA) (R2=0.55), although soil nutrients that are extraction-based or dependent on surface chemistry usually have variable predictive performance (Janik et al., 1998). Since relationships between soil composition and soil matrix exchange processes are typically complex, some properties may not be represented in the models in a straightforward manner (Janik et al., 1998; Nocita et al., 2015).
Although total elements are not necessarily a direct proxy for plant-available nutrients – with the exception of total C from organic matter – they can be related to mineralogical status, which is influenced by weathering and nutrient supply. For example, total Fe from iron oxides can be important in controlling the availability of P (Parfitt et al., 1975), and total P can be correlated to available P in other cases. For yam – which is an understudied crop with a relatively large yield gap – fertilizer response to N, P, and K is often absent on soils that have been under long fallow periods (O'Sullivan, 2010). Even more importantly, the number of thoroughly conduced yam fertilizer trials in a region and for distinct soil types is often not sufficient for the site-specific calibration of soil tests with regard to fertilizer response and recommendations (O'Sullivan and Jenner, 2006).
3.3 Interpretation of spectral features
All mid-IR spectra that we measured for soils in the four landscapes exhibited a similar pattern of absorbance (Fig. 4). The absorptions in quartz at 1080, 800–780, and 700 cm−1 were a prominent feature in the spectra due to relatively high sand contents across the landscapes (range 30 % to 92 %, median 76 %). Our spectra further had hydroxyl (OH) absorptions, which are typical for kaolin minerals, at 3695 cm−1 (surface OH), 3620 cm−1 (inner OH), 914 cm−1 (inner OH), and 936 cm−1 (surface OH) (Madejová et al., 2002). The spectral pattern between the hydroxyl bands at 3695 and 3620 cm−1 was relatively consistent, and the intensity ratio of these flanking peaks was close to 1. This is typical for halloysite (0.8–0.9), while the ratio for kaolinite is often higher (1.2–1.5) and dickite lower (0.6–0.8) (Lyon and Tuddenham, 1960). The two weak intermediary stretching absorptions at around 3657 and 3670 cm−1 indicate surface hydroxyls. Together with the absorption at 936 cm−1, the spectra would suggest the presence of rather well-ordered prismatic halloysite (Hillier et al., 2016). This aligns well with the spectral patterns of soils that were assigned to the Halloysite archetype through similarity mapping (by comparison to the pure mineral spectra) by Sila et al. (2016). Our spectra confirm the presence of kaolin minerals, which reflects the advanced state of mineral weathering in these tropical soil types.
Our accurate predictions, which are comparable to field-scale calibrations, are most likely because of the relatively uniform mid-IR spectra we obtained from our samples and their linear relationships to some of the key properties. This suggests a relatively homogeneous soil chemical composition, particularly with regard to the mineralogy of the sampled soils. Still, the data set presented here is relatively small, and no randomized spatial sampling strategy was used for selecting field locations. Therefore, we propose the implementation of a spectroscopy-driven approach to diagnose soils in more yam-growing areas, as an effort to broaden the library to achieve better spatial coverage of soil variability.
We developed models with mid-IR spectra to estimate soil chemical and physical properties relevant to the production of yam and other staple crops in four landscapes in the yam belt of West Africa. We tested the models for the important soil properties that are applied widely for agronomic performance evaluation. We showed that mid-IR spectroscopy models have the potential for the cost-effective and rapid determination of the distribution and variability of important soil properties across highly variable yam production landscapes in West Africa. Specifically, total C, total N, total S, total Fe, total Al, total K, total Ca, exchangeable Ca, CECeff, bioavailable Fe, and clay content can be quantified with RPD>2 and R2>0.75 when aiming to predict in the range of soil property values found in the environmental conditions covered by this study. We achieved spectral estimates with quite small uncertainties that are typically reported for libraries at the geographical extent of a field or farm. The correlation analysis of measured values together with spectral inference helps improve our understanding of how soil properties are interrelated with soil functional composition. This study delivered parsimonious, unbiased, and accurate mid-IR spectroscopy-based models to monitor and predict soil quality and to manage crop nutrition. Hence, we envision this pilot study as being a starting point to continuously update and adapt the mid-IR model library for more efficient site-specific and agronomically relevant soil estimates in the West African yam belt. This can create a better capacity to diagnose and monitor soils in the long term compared with traditional wet chemistry and will hopefully ameliorate the soil conditions for sustainably meeting the demand of yam and other important staple crops in the regions.
All data and code to reproduce the results of this publication are publicly available under GNU General Public License v3.0 and can be accessed via the Zenodo archive and the corresponding GitHub public repository (https://doi.org/10.5281/zenodo.4358606, Baumann, 2020).
PB carried out the research and analysis (soil sampling, sample preparation, soil chemical analysis, infrared spectroscopy, statistical modeling) under continuous support of the YAMSYS project team and took the lead in writing the manuscript. All co-authors helped to improve the manuscript. JS, JL, and EF framed the idea of delivering validated models for soil properties relevant for yam growth in the four pilot regions in Burkina Faso and Côte d’Ivoire. VKH and DIK contributed to the selection of representative yam fields that were sampled for our work.
The authors declare that they have no conflict of interest.
Publisher’s note: Copernicus Publications remains neutral with regard to jurisdictional claims in published maps and institutional affiliations.
This article is part of the special issue “Tropical biogeochemistry of soils in the Congo Basin and the African Great Lakes region”. It is not associated with a conference.
This study has been done within the YAMSYS project (https://www.yamsys.org, last access: 1 October 2021) funded by the food security module of the Swiss Programme for Research on Global Issues for Development (r4d programme; http://www.r4d.ch, last access: 1 October 2021) (SNF project no. 400540_152017/1). We would like to express gratitude to the site managers – Marie Leance Kouassi, Marcel Soma, and Augustin Kangah N'da – and the 80 farmers that strongly supported our sampling endeavor and the idea of developing diagnostic and management innovations for improved yam growth. We would like to thank Nestor Pouya and Carole Werdenberg, who assisted with soil sampling. Our thanks also go to Bahar Aciksöz, Michele Wyler, and Patricia Schwitter, who helped with sample milling, weighting, and acid digestion. We would also like to thank Federica Tamburini for support with the CNS analysis and Björn Studer for the opportunity to perform XRF analyses on soils. We thank Raphael Viscarra Rossel and Marijn Van de Broek for their valuable feedback, which helped us to improve the manuscript.
This research has been supported by the food security module of the Swiss Programme for Research on Global Issues for Development (http://www.r4d.ch/) (SNF project no. 400540_152017/1).
This paper was edited by Stefan Hauser and reviewed by Stefan Hauser and one anonymous referee.
Abbott, L. K. and Murphy, D. V. (Eds.): Soil Biological Fertility: A Key to Sustainable Land Use in Agriculture, Springer Netherlands, available at: https://www.springer.com/de/book/9781402017568 (last access: 1 October 2021), 2007. a
Abdi, D., Tremblay, G. F., Ziadi, N., Bélanger, G., and Parent, L.-É.: Predicting Soil Phosphorus-Related Properties Using Near-Infrared Reflectance Spectroscopy, Soil Sci. Soc. Am. J., 76, 2318–2326, https://doi.org/10.2136/sssaj2012.0155, 2012. a
Baumann, P.: philipp-baumann/simplerspec: Beta release simplerspec 0.1.0 for zenodo, Zenodo [software], https://doi.org/10.5281/zenodo.3303637, 2019. a
Baumann, P.: Philipp-baumann/yamsys-soilspec-publication: Open data and code (manuscript submission): Estimation of soil properties with mid-infrared soil spectroscopy across yam production landscapes in West Africa, Zenodo [data set, code], https://doi.org/10.5281/zenodo.4358606, 2020. a, b
Bouyoucos, G. J.: A recalibration of the hydrometer method for making mechanical analysis of soils, Agron. J., 43, 434–438, 1951. a
Breiman, L., Friedman, J., Stone, C., and Olshen, R.: Classification and Regression Trees, The Wadsworth and Brooks-Cole statistics-probability series, Taylor & Francis, available at: https://books.google.ch/books?id=JwQx-WOmSyQC (last access: 1 October 2021), 1984. a
Cambou, A., Cardinael, R., Kouakoua, E., Villeneuve, M., Durand, C., and Barthès, B. G.: Prediction of soil organic carbon stock using visible and near infrared reflectance spectroscopy (VNIRS) in the field, Geoderma, 261, 151–159, https://doi.org/10.1016/j.geoderma.2015.07.007, 2016. a
Carsky, R. J., Asiedu, R., and Cornet, D.: Review of soil fertility management for yam-based systems in west africa, African Journal of Root and Tuber Crops, 8, 1–17, 2010. a, b
Chong, I.-G. and Jun, C.-H.: Performance of some variable selection methods when multicollinearity is present, Chemometr. Intell. Lab., 78, 103–112, https://doi.org/10.1016/j.chemolab.2004.12.011, 2005. a
Clairotte, M., Grinand, C., Kouakoua, E., Thébault, A., Saby, N. P., Bernoux, M., and Barthès, B. G.: National calibration of soil organic carbon concentration using diffuse infrared reflectance spectroscopy, Geoderma, 276, 41–52, https://doi.org/10.1016/j.geoderma.2016.04.021, 2016. a
Cornet, D., Sierra, J., Tournebize, R., Gabrielle, B., and Lewis, F. I.: Bayesian Network Modeling of Early Growth Stages Explains Yam Interplant Yield Variability and Allows for Agronomic Improvements in West Africa, Eur. J. Agron., 75, 80–88, https://doi.org/10.1016/j.eja.2016.01.009, 2016. a
Cécillon, L., Barthès, B. G., Gomez, C., Ertlen, D., Genot, V., Hedde, M., Stevens, A., and Brun, J. J.: Assessment and monitoring of soil quality using near-infrared reflectance spectroscopy (NIRS), Eur. J. Soil Sci., 60, 770–784, https://doi.org/10.1111/j.1365-2389.2009.01178.x, 2009. a
Diby, L. N., Hgaza, V. K., Tie, T. B., ASSA, A., Carsky, R., Girardin, O., and Frossard, E.: Productivity of Yams (Dioscorea Spp.) as Affected by Soil Fertility, J. Anim. Plant Sci., 5, 494–506, 2009. a
Diby, L. N., Tie, B. T., Girardin, O., Sangakkara, R., and Frossard, E.: Growth and Nutrient Use Efficiencies of Yams (Dioscorea Spp.) Grown in Two Contrasting Soils of West Africa, Int. J. Agron., 2011, 1–8, https://doi.org/10.1155/2011/175958, 2011. a
Enesi, R. O., Hauser, S., Lopez-Montez, A., and Osonubi, O.: Yam Tuber and Maize Grain Yield Response to Cropping System Intensification in South-West Nigeria, Arch. Agron. Soil Sci., 64, 953–966, https://doi.org/10.1080/03650340.2017.1404580, 2018. a
Enyi, B. A. C.: Effect of Staking, Nitrogen and Potassium on Growth and Development in Lesser Yams: Dioscorea Esculenta, Ann. Appl. Biol., 72, 211–219, https://doi.org/10.1111/j.1744-7348.1972.tb01287.x, 1972. a
Food and Agriculture Organization of the United Nations: FAOSTAT statistics database, available at: http://www.fao.org/3/i3794en/I3794en.pdf (last access: 1 October 2021), 2019. a
Foster, H. L.: The Basic Factors Which Determine Inherent Soil Fertility in Uganda, J. Soil Sci., 32, 149–160, https://doi.org/10.1111/j.1365-2389.1981.tb01693.x, 1981. a
Frossard, E., Aighewi, B. A., Aké, S., Barjolle, D., Baumann, P., Bernet, T., Dao, D., Diby, L. N., Floquet, A., Hgaza, V. K., Ilboudo, L. J., Kiba, D. I., Mongbo, R. L., Nacro, H. B., Nicolay, G. L., Oka, E., Ouattara, Y. F., Pouya, N., Senanayake, R. L., Six, J., and Traoré, O. I.: The Challenge of Improving Soil Fertility in Yam Cropping Systems of West Africa, Front. Plant Sci., 1953, 1–8, https://doi.org/10.3389/fpls.2017.01953, 2017. a, b, c, d
Guerrero, C., Wetterlind, J., Stenberg, B., Mouazen, A. M., Gabarrón-Galeote, M. A., Ruiz-Sinoga, J. D., Zornoza, R., and Viscarra Rossel, R. A.: Do We Really Need Large Spectral Libraries for Local Scale SOC Assessment with NIR Spectroscopy?, Soil Till. Res., 155, 501–509, https://doi.org/10.1016/j.still.2015.07.008, 2016. a
Hendershot, W. H. and Duquette, M.: A simple barium chloride method for determining cation exchange capacity and exchangeable cations, Soil Sci. Soc. Am. J., 50, 605–608, 1986. a
Hgaza, V. K., Diby, L. N., Tié, T. B., Tschannen, A., Aké, S., Assa, A., and Frossard, E.: Growth and Distribution of Roots of Dioscorea Alata L. Do Not Respond to Mineral Fertilizer Application, Open Plant Sci. J., 5, 14–22, 2011. a
Hillier, S., Brydson, R., Delbos, E., Fraser, T., Gray, N., Pendlowski, H., Phillips, I., Robertson, J., and Wilson, I.: Correlations among the mineralogical and physical properties of halloysite nanotubes (HNTs), Clay Miner., 51, 325–350, https://doi.org/10.1180/claymin.2016.051.3.11, 2016. a
IUSS Working Group WRB: World Reference Base for Soil Resources 2014, update 2015 International soil classification system for naming soils and creating legends for soil maps, World Soil Resources Reports No. 106, FAO, Rome, 2015. a, b, c, d
Janik, L. J., Skjemstad, J. O., and Merry, R. H.: Can mid infrared diffuse reflectance analysis replace soil extractions?, Aust. J. Exp. Agr., 38, 681, https://doi.org/10.1071/EA97144, 1998. a, b
Johnson, J.-M., Vandamme, E., Senthilkumar, K., Sila, A., Shepherd, K. D., and Saito, K.: Near-infrared, mid-infrared or combined diffuse reflectance spectroscopy for assessing soil fertility in rice fields in sub-Saharan Africa, Geoderma, 354, 113840, https://doi.org/10.1016/j.geoderma.2019.06.043, 2019. a
Kang, B. T. and Wilson, J. E.: Effect of mound size and fertilizer on white Guinea yam (Dioscorea rotundata) in Southern Nigeria, Plant Soil, 61, 319–327, https://doi.org/10.1007/BF02182013, 1981. a
Kassi, S.-P. A., Koné, A. W., Tondoh, J. E., and Koffi, B. Y.: Chromoleana Odorata Fallow-Cropping Cycles Maintain Soil Carbon Stocks and Yam Yields 40 Years after Conversion of Native- to Farmland, Implications for Forest Conservation, Agr. Ecosyst. Environ., 247, 298–307, https://doi.org/10.1016/j.agee.2017.06.044, 2017. a
Kiba, D. I., Hgaza, V. K., Aighewi, B., Aké, S., Barjolle, D., Bernet, T., Diby, L. N., Ilboudo, L. J., Nicolay, G., Oka, E., Ouattara, F. Y., Pouya, N., Six, J., and Frossard, E.: A Transdisciplinary Approach for the Development of Sustainable Yam (Dioscorea Sp.) Production in West Africa, Sustainability, 12, 4016, https://doi.org/10.3390/su12104016, 2020. a
Kim, J.-H.: Estimating classification error rate: Repeated cross-validation, repeated hold-out and bootstrap, Comput. Stat. Data Anal., 53, 3735–3745, https://doi.org/10.1016/j.csda.2009.04.009, 2009. a
Kuhn, M., Wing, J., Weston, S., A., W., Keefer, C., Engelhardt, A., Cooper, T., Mayer, Z., Kenkel, B., Benesty, M., Lescarbeau, R., Ziem, A., Scrucca, L., Tang, Y., Candan, C., and Hunt, T.: caret: Classification and Regression Training, available at: https://CRAN.R-project.org/package=caret (last access: 1 October 2021), R package version 6.0-82, 2019. a
Lindsay, W. L. and Norvell, W. A.: Development of a DTPA soil test for zinc, iron, manganese, and copper, Soil science society of America journal, 42, 421–428, 1978. a
Lyon, R. J. P. and Tuddenham, W. M.: Infra-Red Determination of the Kaolin Group Minerals, Nature, 185, 835–836, https://doi.org/10.1038/185835a0, 1960. a
Madejová, J., Kečkés, J., Pálková, H., and Komadel, P.: Identification of components in smectite/kaolinite mixtures, Clay Miner., 37, 377–388, https://doi.org/10.1180/0009855023720042, 2002. a, b
Martens, H. and Naes, T.: Multivariate Calibration, Wiley Chichester, 1989. a
Mevik, B.-H., Wehrens, R., and Liland, K. H.: pls: Partial Least Squares and Principal Component Regression, available at: https://CRAN.R-project.org/package=pls (last access: 1 October 2021), R package version 2.7-1, 2019. a
Molinaro, A. M., Simon, R., and Pfeiffer, R. M.: Prediction error estimation: a comparison of resampling methods, Bioinformatics, 21, 3301–3307, https://doi.org/10.1093/bioinformatics/bti499, 2005. a
Nocita, M., Stevens, A., van Wesemael, B., Aitkenhead, M., Bachmann, M., Barthès, B., Ben Dor, E., Brown, D. J., Clairotte, M., Csorba, A., Dardenne, P., Demattê, J. A., Genot, V., Guerrero, C., Knadel, M., Montanarella, L., Noon, C., Ramirez-Lopez, L., Robertson, J., Sakai, H., Soriano-Disla, J. M., Shepherd, K. D., Stenberg, B., Towett, E. K., Vargas, R., and Wetterlind, J.: Soil Spectroscopy: An Alternative to Wet Chemistry for Soil Monitoring, in: Advances in Agronomy, Vol. 132, Elsevier, 139–159, https://doi.org/10.1016/bs.agron.2015.02.002, 2015. a, b, c, d
O'Sullivan, J. N.: Yam nutrition nutrient disorders and soil fertility management, ACIAR, Canberra, oCLC: 1074816829, 2010. a, b
O'Sullivan, J. N. and Jenner, R.: Nutrient Deficiencies in Greater Yam and Their Effects on Leaf Nutrient Concentrations, J. Plant Nutr., 29, 1663–1674, https://doi.org/10.1080/01904160600851569, 2006. a, b, c, d
Padwick, G. W.: Fifty Years of Experimental Agriculture II. The Maintenance of Soil Fertility in Tropical Africa: A Review, Exp. Agr., 19, 293–310, https://doi.org/10.1017/S001447970001276X, 1983. a
Parfitt, R. L., Atkinson, R. J., and Smart, R. S. C.: The Mechanism of Phosphate Fixation by Iron Oxides, Soil Sci. Soc. Am. J., 39, 837–841, https://doi.org/10.2136/sssaj1975.03615995003900050017x, 1975. a
R Core Team: R: A Language and Environment for Statistical Computing, R Foundation for Statistical Computing, Vienna, Austria, available at: https://www.R-project.org/ (last access: 1 October 2021), 2017. a
Rossel, R. A. V. and Webster, R.: Predicting soil properties from the Australian soil visible–near infrared spectroscopic database, Europ. J. Soil Sci., 63, 848–860, https://doi.org/10.1111/j.1365-2389.2012.01495.x, 2012. a
Rossel, R. V. and Behrens, T.: Using data mining to model and interpret soil diffuse reflectance spectra, Geoderma, 158, 46–54, https://doi.org/10.1016/j.geoderma.2009.12.025, 2010. a
Sanderman, J., Savage, K., and Dangal, S. R. S.: Mid-Infrared Spectroscopy for Prediction of Soil Health Indicators in the United States, Soil Sci. Soc. Am. J., 84, 251–261, https://doi.org/10.1002/saj2.20009, 2020. a
Savitzky, A. and Golay, M. J. E.: Smoothing and Differentiation of Data by Simplified Least Squares Procedures., Anal. Chem., 36, 1627–1639, https://doi.org/10.1021/ac60214a047, 1964. a
Sila, A. M., Shepherd, K. D., and Pokhariyal, G. P.: Evaluating the utility of mid-infrared spectral subspaces for predicting soil properties, Chemometr. Intell. Lab., 153, 92–105, https://doi.org/10.1016/j.chemolab.2016.02.013, 2016. a, b, c, d
Six, J., Frey, S. D., Thiet, R. K., and Batten, K. M.: Bacterial and Fungal Contributions to Carbon Sequestration in Agroecosystems, Soil Sci. Soc. Am. J., 70, 555–569, https://doi.org/10.2136/sssaj2004.0347, 2006. a
Soares, M. R. and Alleoni, L. R. F.: Contribution of Soil Organic Carbon to the Ion Exchange Capacity of Tropical Soils, J. Sustain. Agr., 32, 439–462, https://doi.org/10.1080/10440040802257348, 2008. a
Stenberg, B. and Rossel, R. A. V.: Diffuse Reflectance Spectroscopy for High-Resolution Soil Sensing, in: Proximal Soil Sensing, edited by: Rossel, R. A. V., McBratney, A. B., and Minasny, B., Progress in Soil Science, Springer Netherlands, 29–47, https://doi.org/10.1007/978-90-481-8859-8_3, 2010. a
Stevens, A., Nocita, M., Tóth, G., Montanarella, L., and van Wesemael, B.: Prediction of Soil Organic Carbon at the European Scale by Visible and Near InfraRed Reflectance Spectroscopy, PLoS ONE, 8, e66409, https://doi.org/10.1371/journal.pone.0066409, 2013. a, b
Syers, J. K., Campbell, A. S., and Walker, T. W.: Contribution of organic carbon and clay to cation exchange capacity in a chronosequence of sandy soils, Plant Soil, 33, 104–112, https://doi.org/10.1007/BF01378202, 1970. a
UNEP: Land Health Surveillance: An Evidence-Based Approach to Land Ecosystem Management, Illustrated with a Case Study in the West Africa Sahel, United Nations Environment Programme, Nairobi, 2012. a, b
Vagen, T.-G., Shepherd, K. D., Walsh, M. G., Winowiecki, L., Desta, L. T., and Tondoh, J. E.: AfSIS technical specifications: Soil Health Surveillance, available at: http://www.worldagroforestry.org/sites/default/files/afsisSoilHealthTechSpecs_v1_smaller.pdf (last access: 1 October 2021), 2010. a
Viscarra Rossel, R., Behrens, T., Ben-Dor, E., Brown, D., Demattê, J., Shepherd, K., Shi, Z., Stenberg, B., Stevens, A., Adamchuk, V., Aïchi, H., Barthès, B., Bartholomeus, H., Bayer, A., Bernoux, M., Böttcher, K., Brodský, L., Du, C., Chappell, A., Fouad, Y., Genot, V., Gomez, C., Grunwald, S., Gubler, A., Guerrero, C., Hedley, C., Knadel, M., Morrás, H., Nocita, M., Ramirez-Lopez, L., Roudier, P., Campos, E. R., Sanborn, P., Sellitto, V., Sudduth, K., Rawlins, B., Walter, C., Winowiecki, L., Hong, S., and Ji, W.: A global spectral library to characterize the world's soil, Earth-Sci. Rev., 155, 198–230, https://doi.org/10.1016/j.earscirev.2016.01.012, 2016. a
Viscarra Rossel, R. A., Walvoort, D. J. J., McBratney, A. B., Janik, L. J., and Skjemstad, J. O.: Visible, near infrared, mid infrared or combined diffuse reflectance spectroscopy for simultaneous assessment of various soil properties, Geoderma, 131, 59–75, https://doi.org/10.1016/j.geoderma.2005.03.007, 2006. a, b
Wawire, A. W., Csorba, Á., Kovács, E., Mairura, F. S., Tóth, J. A., and Michéli, E.: Comparing Farmers' Soil Fertility Knowledge Systems and Scientific Assessment in Upper Eastern Kenya, Geoderma, 396, 115090, https://doi.org/10.1016/j.geoderma.2021.115090, 2021. a
Wold, S., Martens, H., and Wold, H.: The Multivariate Calibration Problem in Chemistry Solved by the PLS Method, in: Matrix Pencils, edited by: Kågström, B. and Ruhe, A., Vol. 973, Springer Berlin Heidelberg, 286–293, https://doi.org/10.1007/BFb0062108, 1983. a
Wold, S., Johansson, E., and Cocchi, M.: PLS-partial least squares projections to latent structures, 3D QSAR in drug design, Springer Netherlands, 1, 523–550, https://doi.org/10.1007/0-306-46858-1, 1993. a