the Creative Commons Attribution 4.0 License.
the Creative Commons Attribution 4.0 License.
 | 15 Mar 2021
Particulate macronutrient exports from tropical African montane catchments point to the impoverishment of agricultural soils
Jaqueline Stenfert Kroese
John N. Quinton
Suzanne R. Jacobs
Lutz Breuer
Mariana C. Rufino
Agricultural catchments in the tropics often generate high concentrations of suspended sediments following the conversion of natural ecosystems. The eroded fine particles are generally enriched with carbon (TC) and nutrients (TN and TP) originating from the topsoil of agricultural land. Sediment-associated TC, TN and TP are an important loss to the terrestrial ecosystem and tightly connected to an increase in riverine particulate TC and nutrient export. Soil nutrient depletion can limit crop growth and yields, whereas an excess of nutrients in streams can cause eutrophication in freshwater systems. Streams in East Africa, with widespread land conversion from forests to agriculture, are expected to receive high loads of sediment-associated TC, TN and TP. In this study, we assess the effect of land use on particulate TC, TN and TP concentrations. Suspended sediments (time-integrated, manual-event-based and automatic-event-based sediment samples) were analysed for TC, TN and TP concentrations collected at the outlet of a natural montane forest (35.9), a tea-tree plantation (33.3) and a smallholder agriculture (27.2 km2) catchment in western Kenya during a wet sampling period in 2018 and a drier sampling period in 2019. Particulate TC, TN and TP concentrations were up to 3-fold higher (p<0.05) in the natural forest catchment compared to fertilized agricultural catchments. However, because of higher sediment loads from the smallholder agriculture catchment, the total sediment-associated loads of TC, TN and TP were higher compared to the natural forest and tea-tree plantation catchment. The higher C:N ratios in the natural forest suggest that the particulate nutrients are of organic origin due to tighter nutrient cycles, whereas lower ratios in both agricultural catchments suggest a mixture of mineral and organic sediment sources. The findings of this study imply that with the loss of natural forest, the inherent soil fertility is progressively lost under the current low fertilization rates and soil management strategies.
- Article
(8573 KB) - Full-text XML
- BibTeX
- EndNote


In sub-Saharan Africa, streams often have high concentrations of suspended sediments, mainly due to the anthropogenic disturbance of natural ecosystems (Mogaka et al., 2006; Penny, 2009). These sediment concentrations can be particularly high (up to 8387 t km2 yr−1) in the steep highlands of East Africa, where surface soil erosion in catchments dominated by agriculture generates significantly more suspended sediments than in forested catchments (Stenfert Kroese et al., 2020b; Vanmaercke et al., 2014). The loss of organic-carbon- (C) and nutrient-rich topsoil through surface runoff induced by soil erosion from agricultural surfaces (Powlson et al., 2011; Quinton et al., 2001) leads to further deterioration of tropical soils (Okalebo et al., 2005; Tully et al., 2015). Phosphorus (P) and nitrogen (N) are soil nutrients which can limit crop growth when they are in low supply, and therefore their loss from topsoils should be avoided (Pasley et al., 2019). The clays found in many of the tropical soils of East Africa contain amorphous iron (Fe), which can limit plant P availability, and consequently the application of fertilizers (inorganic N and P and/or manure) is often required to improve agricultural productivity (Mutuo et al., 1999). Soil-forming processes tend to be much slower than the rates of soil loss through erosion (Amundson et al., 2015; Evans et al., 2020), which can lead to soil and plant nutrient deficits, resulting in low and stagnant crop yields (Lederer et al., 2015; Saiz et al., 2016). Soil organic matter is a critical determinant of soil fertility, providing nutrients to plants and playing fundamental roles in soil carbon sequestration and soil water functions (Owuor et al., 2018; Weil and Brady, 2016). Processes affecting nutrient stocks and pools of soils are tightly connected to the processes controlling riverine C and nutrient fluxes.
Sediments and their associated organic C and nutrients, such as N and P (Horowitz, 2008; Johnson et al., 2018; Quinton et al., 2001), may impact streams by reducing benthic communities, primary productivity and water storage capacity of water reservoirs (Hunink and Droogers, 2011; Tamene et al., 2006) and by increasing turbidity, which prevents light reaching aquatic plants (Stenfert Kroese et al., 2020b; Tamooh et al., 2014). In nutrient-limited freshwater systems, an excess of nutrients can cause eutrophication (Jarvie et al., 2019; Smith et al., 2017; Smith and Schindler, 2009), inducing algal blooms and promoting invasive weeds (e.g. water hyacinth; Lung'ayia et al., 2001). When C enters the watercourse, it can be mineralized and emitted as a greenhouse gas (Marx et al., 2017a, b). Nutrient-enriched sediments can turn stream waters from the sink to the source of nutrients through sorption and desorption processes and increased chemical and biological activity (Kreiling et al., 2019; Mainstone and Parr, 2002; Palmer-Felgate et al., 2009).
Several studies investigating the effects of land use change and agricultural intensification on the water quality of river systems have focused on dissolved C and nutrients such as N and P (Bowes et al., 2018; Drewry et al., 2009; Smith et al., 2017). Other studies in temperate and tropical regions have shown that up to 95 % of the nutrient loads and up to 40 % of the C loads in streams are transported in particulate form, associated with suspended sediments (Moran et al., 2005; Rodríguez-Blanco et al., 2015; Scanlon et al., 2004). Sediment-associated nutrients (N and P) are spatially variable (Harrington and Harrington, 2014; Withers et al., 2001), and their concentrations increase during storm events with the rising limb of the hydrograph (Drewry et al., 2009; López-Tarazón et al., 2016). Walling et al. (1997) and Bender et al. (2018) observed that P loads mainly occur in particulate form in temperate and subtropical catchments, while N is mainly transported in dissolved form in a temperate catchment in China (Wang et al., 2015). Others have found that the major inputs to rivers occur as dissolved P and N loads (Harrington and Harrington, 2014). Currently, there are no studies for East Africa investigating sediment-associated total carbon (TC), total nitrogen (TN) and total phosphorus (TP) exports from different land uses. This is an important knowledge gap because the East Africa region has a very dynamic land use system, with intensive conversion of natural ecosystems (forests, wetlands and grasslands) to subsistence and commercial agriculture (Carter et al., 2018).
This study aims to fill this knowledge gap by developing an improved understanding of the response of suspended sediments and TC, TN and TP fluxes associated with sediments under contrasting land use at catchment scale in the headwaters of the Sondu River basin originating in the Mau forest complex, Kenya. Earlier work in this area found much higher suspended sediment yields and dissolved nitrate exports in agricultural compared to forested land use (Jacobs et al., 2018; Stenfert Kroese et al., 2020b) and identified agricultural land as the main source of sediments within a smallholder agriculture catchment (Stenfert Kroese et al., 2020a). Therefore, we set out to test the hypothesis that the sediment-associated TC, TN and TP fluxes would be higher from the more intensively managed agricultural catchments than from a natural forest catchment.
2.1 Catchment characteristics
This study was conducted in nested catchments in the montane headwaters of the Sondu River basin (3470 km2), located in the south-west Mau, western Kenya, home to one of the largest closed-canopy montane forests of East Africa (the Mau forest complex) and where the inherent fertility of the soils allowed for the development of a tea industry in parallel to subsistence agriculture (Binge, 1962). Over the last 4 decades, the western highlands of Kenya have undergone significant land use changes, whereby 25 % of the Mau forest complex was converted into commercial and smallholder agriculture (Brandt et al., 2018). As an important headwater area to tributaries of Lake Victoria, the Mau forest complex is a critical catchment area that supplies people (approximately 5 million), livestock, wildlife and the economy with fresh water (UNEP, 2008). Lake Victoria, an important freshwater lake for five countries, has shown increased signs of eutrophication over recent years (Zhou et al., 2014), stressing the need for mitigation and control of nutrient inputs.
The study catchments were chosen based on the criteria of different land use: (1) natural forest (NF; 35.9 km2), (2) tea-tree plantations (TTP; 33.3 km2) and (3) smallholder agriculture (SHA; 27.2 km2) and comparability between the catchment characteristics, such as surface area, morphology, geology, pedology, slope and climate (Fig. 1 and Table 1). The mean slope gradient of the catchments ranges between 11.6 % and 15.7 %, up to a maximum of 72 % in the natural forest catchment. The streams are first- and second-order perennial streams merging to Sondu River (a sixth-order stream). The region has a bimodal rainfall pattern, with a long rainy season (March–June) and a short rainy season (October–December) and a continued intermediate rainy season between the two wet seasons (July–September). The driest months are in January and February. The mean annual rainfall is 1979±325 mm yr−1 (period 1905–2019). Geology is composed of folded volcanics from the early Miocene. Kericho phonolites cover the lower catchment (tea-tree plantations), followed by phonolitic nephelinites with intercalated tuffs and Mau ashes with basal tuff encompassing the natural forest, while phonolitic nephelinites comprise the upper catchment in the smallholder agriculture (Binge, 1949; Jennings, 1962). The catchments are covered by deep (>1.8 m) and well-drained, dark-red loamy soils (Sombroek et al., 1982), characterized as mollic Andosols and humic Nitisols (ISRIC, 2004), with moderate (15 %–30 %) to high (>30 %) amounts of organic matter (Dunne, 1979).
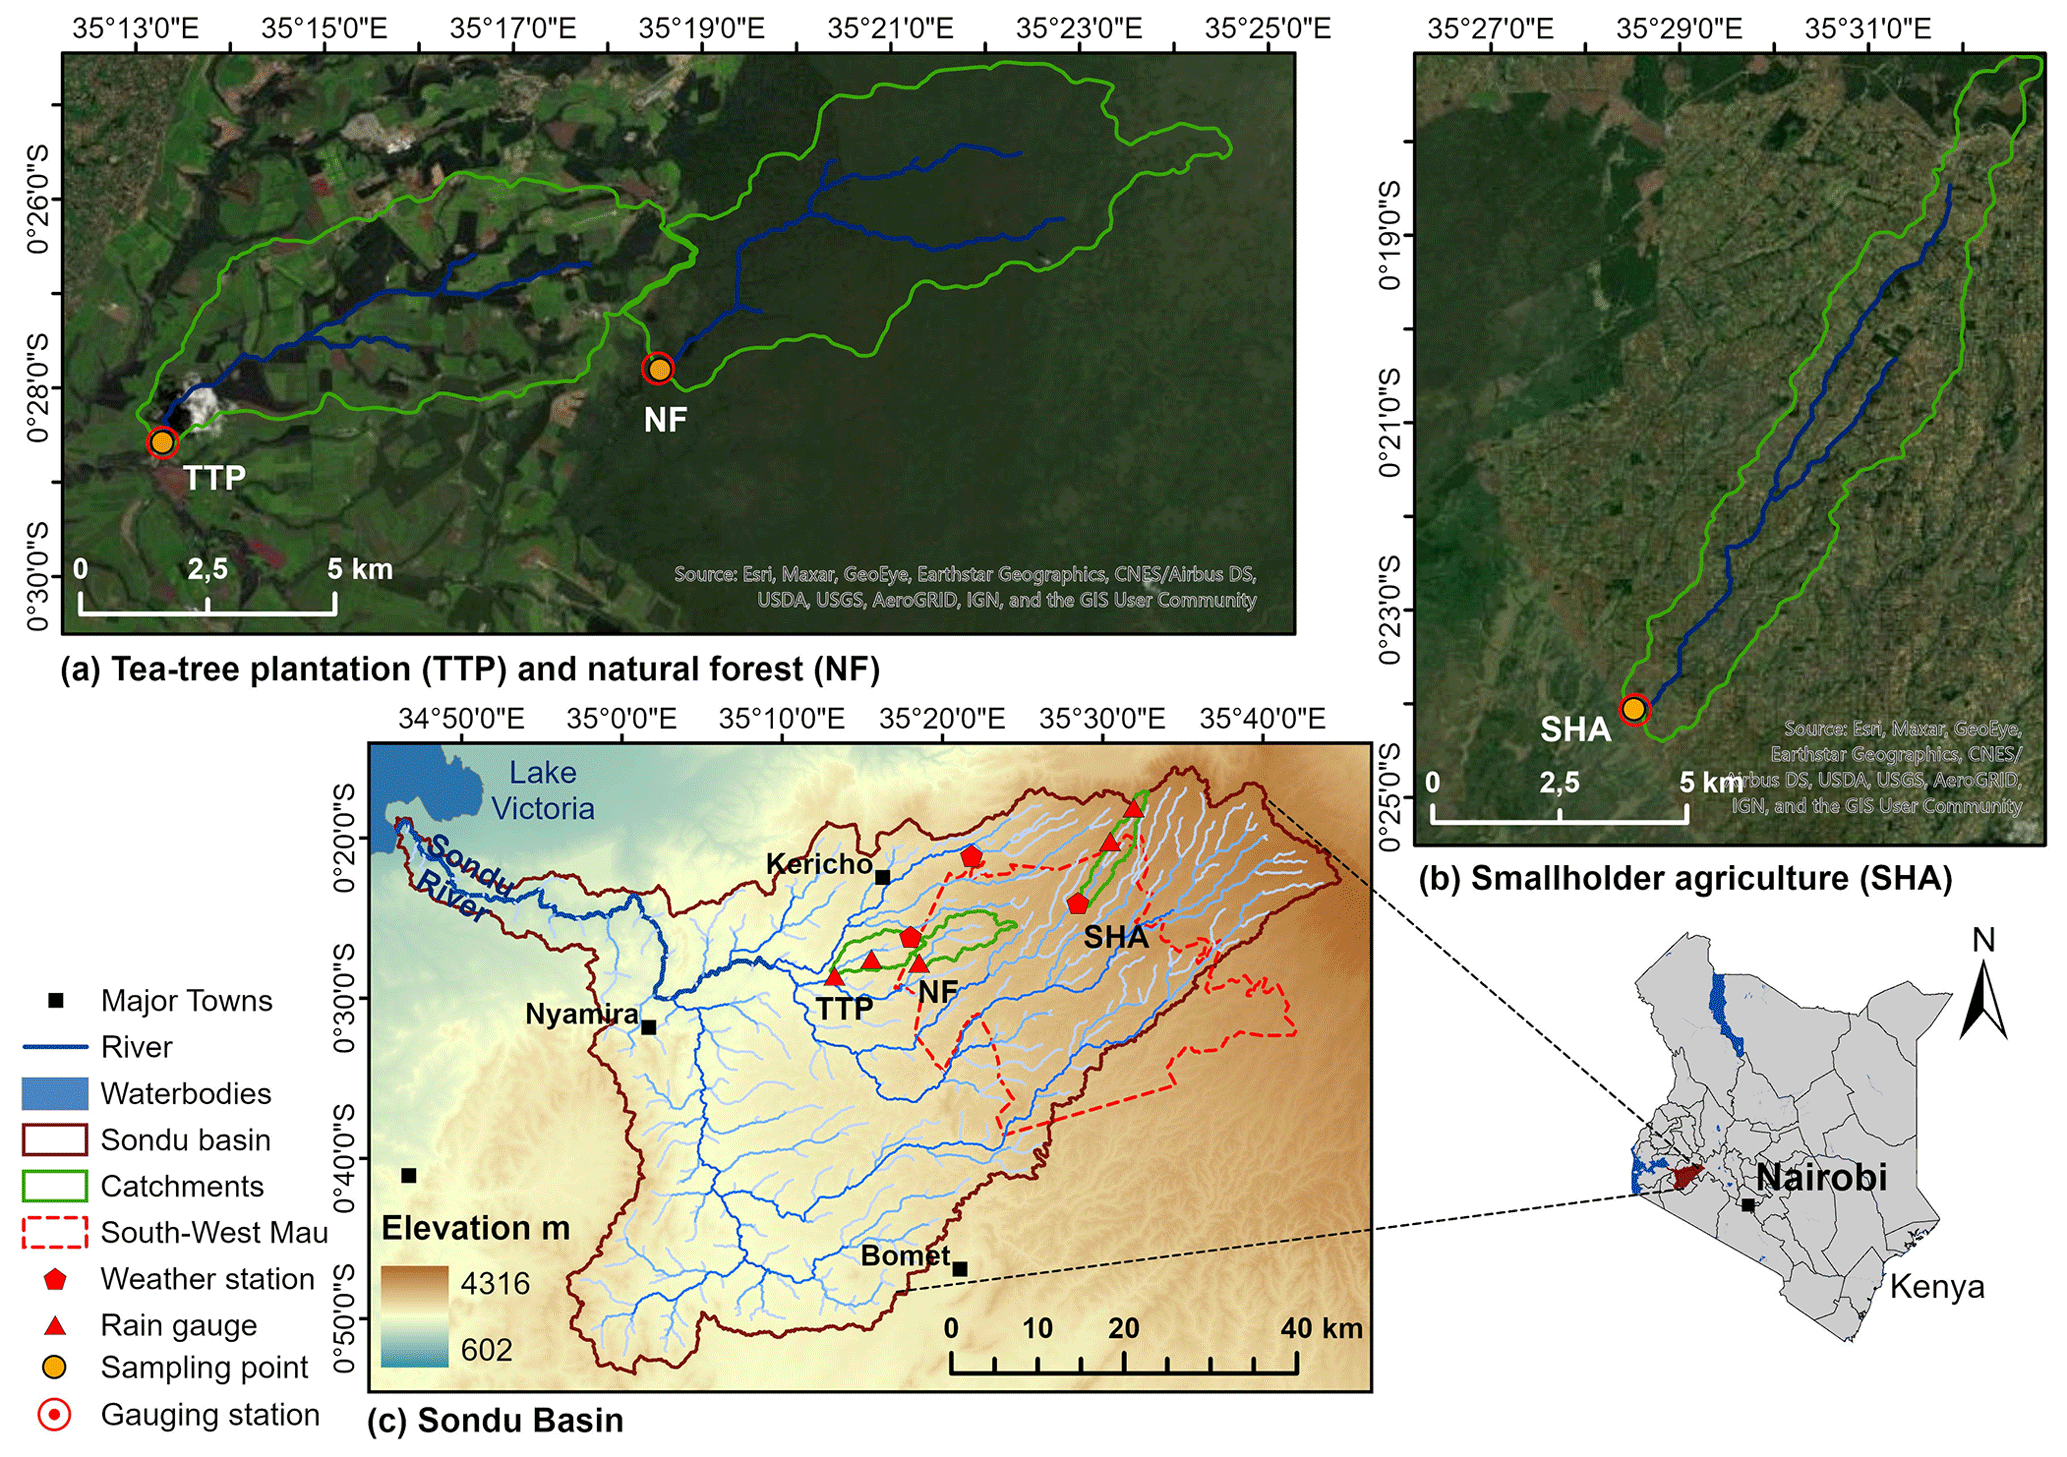
Figure 1(a) Tea-tree plantation (TTP) and natural forest (NF) and (b) smallholder agriculture (SHA) catchments with imagery basemap (Esri, 2020) as nested catchments of the (c) Sondu River basin with elevation (SRTM digital elevation model, 30 m resolution) (USGS, 2000) in the south-west Mau, Kenya.
The natural forest catchment falls within the south-west Mau forest part of the Mau forest complex. As an afromontane mixed forest, species such as Polyscias kikuyuensis, Macaranga kilimandscharica, Olea hochstetteri, Casearia battiscombei and Fagara spp. dominate the vegetation, transitioning to irregular patches of bamboo forest above 2300 m above sea level (a.s.l.; Binge, 1962). The riparian zone transits from the forest vegetation containing an understorey with a dense cover of shrubs and tree ferns combined with tall indigenous tree species (Table 1).
The tea-tree plantation catchment borders the south-west Mau to the west. The catchment is characterized by tea (Camellia spp.) plantations alternated with Eucalyptus saligna and Cupressus lusitanica woodlots used for fuelwood for tea processing at the tea factories and timber production. The common practices to control soil erosion are mulching and interplanting rows of oat grass between rows of tea during the establishment of new tea fields, cover crop establishment with mature tea trees, and terracing and sited cut-off drains. A well maintained road system along with open culverts as road drainages connects surface runoff with the riparian buffer zone. Herbicides are commonly used to control weeds. Aerial application of inorganic fertilizer is conducted two to three times per year on the tea plantations (150–250 and 8–13 ; Jacobs et al., 2018). Riparian zones of up to 30 m from the river are commonly vegetated by native tree species densely covering the ground (Table 1).
In the upper smallholder agriculture catchment, subsistence farmers grow maize interspersed with beans, potatoes, millet, cabbage and tea (Camellia spp.) on farms usually smaller than 1 ha. Grasslands for livestock and woodlots of Eucalyptus saligna, Cupressus lusitanica and Pinus patula are alternated with agricultural land. A combination of hoeing and herbicide application is used for weed control. Inorganic fertilizer is applied manually on potatoes and maize (23–45 and 12–23 twice a year on potatoes and once a year on maize), while manure is commonly used for cabbage and other greens. Unpaved roads, frequently used by people, livestock and motorbikes, often develop into deeply incised gullies running downslope, coupling hillslopes with the stream network. Degraded riverbanks with a sparse or absent riparian vegetation are prone to erosion, and in some places degraded riparian wetlands are found (Table 1).
Table 1Catchment characteristics under different land use: natural forest, tea-tree plantations and smallholder agriculture in the south-west Mau, Kenya.
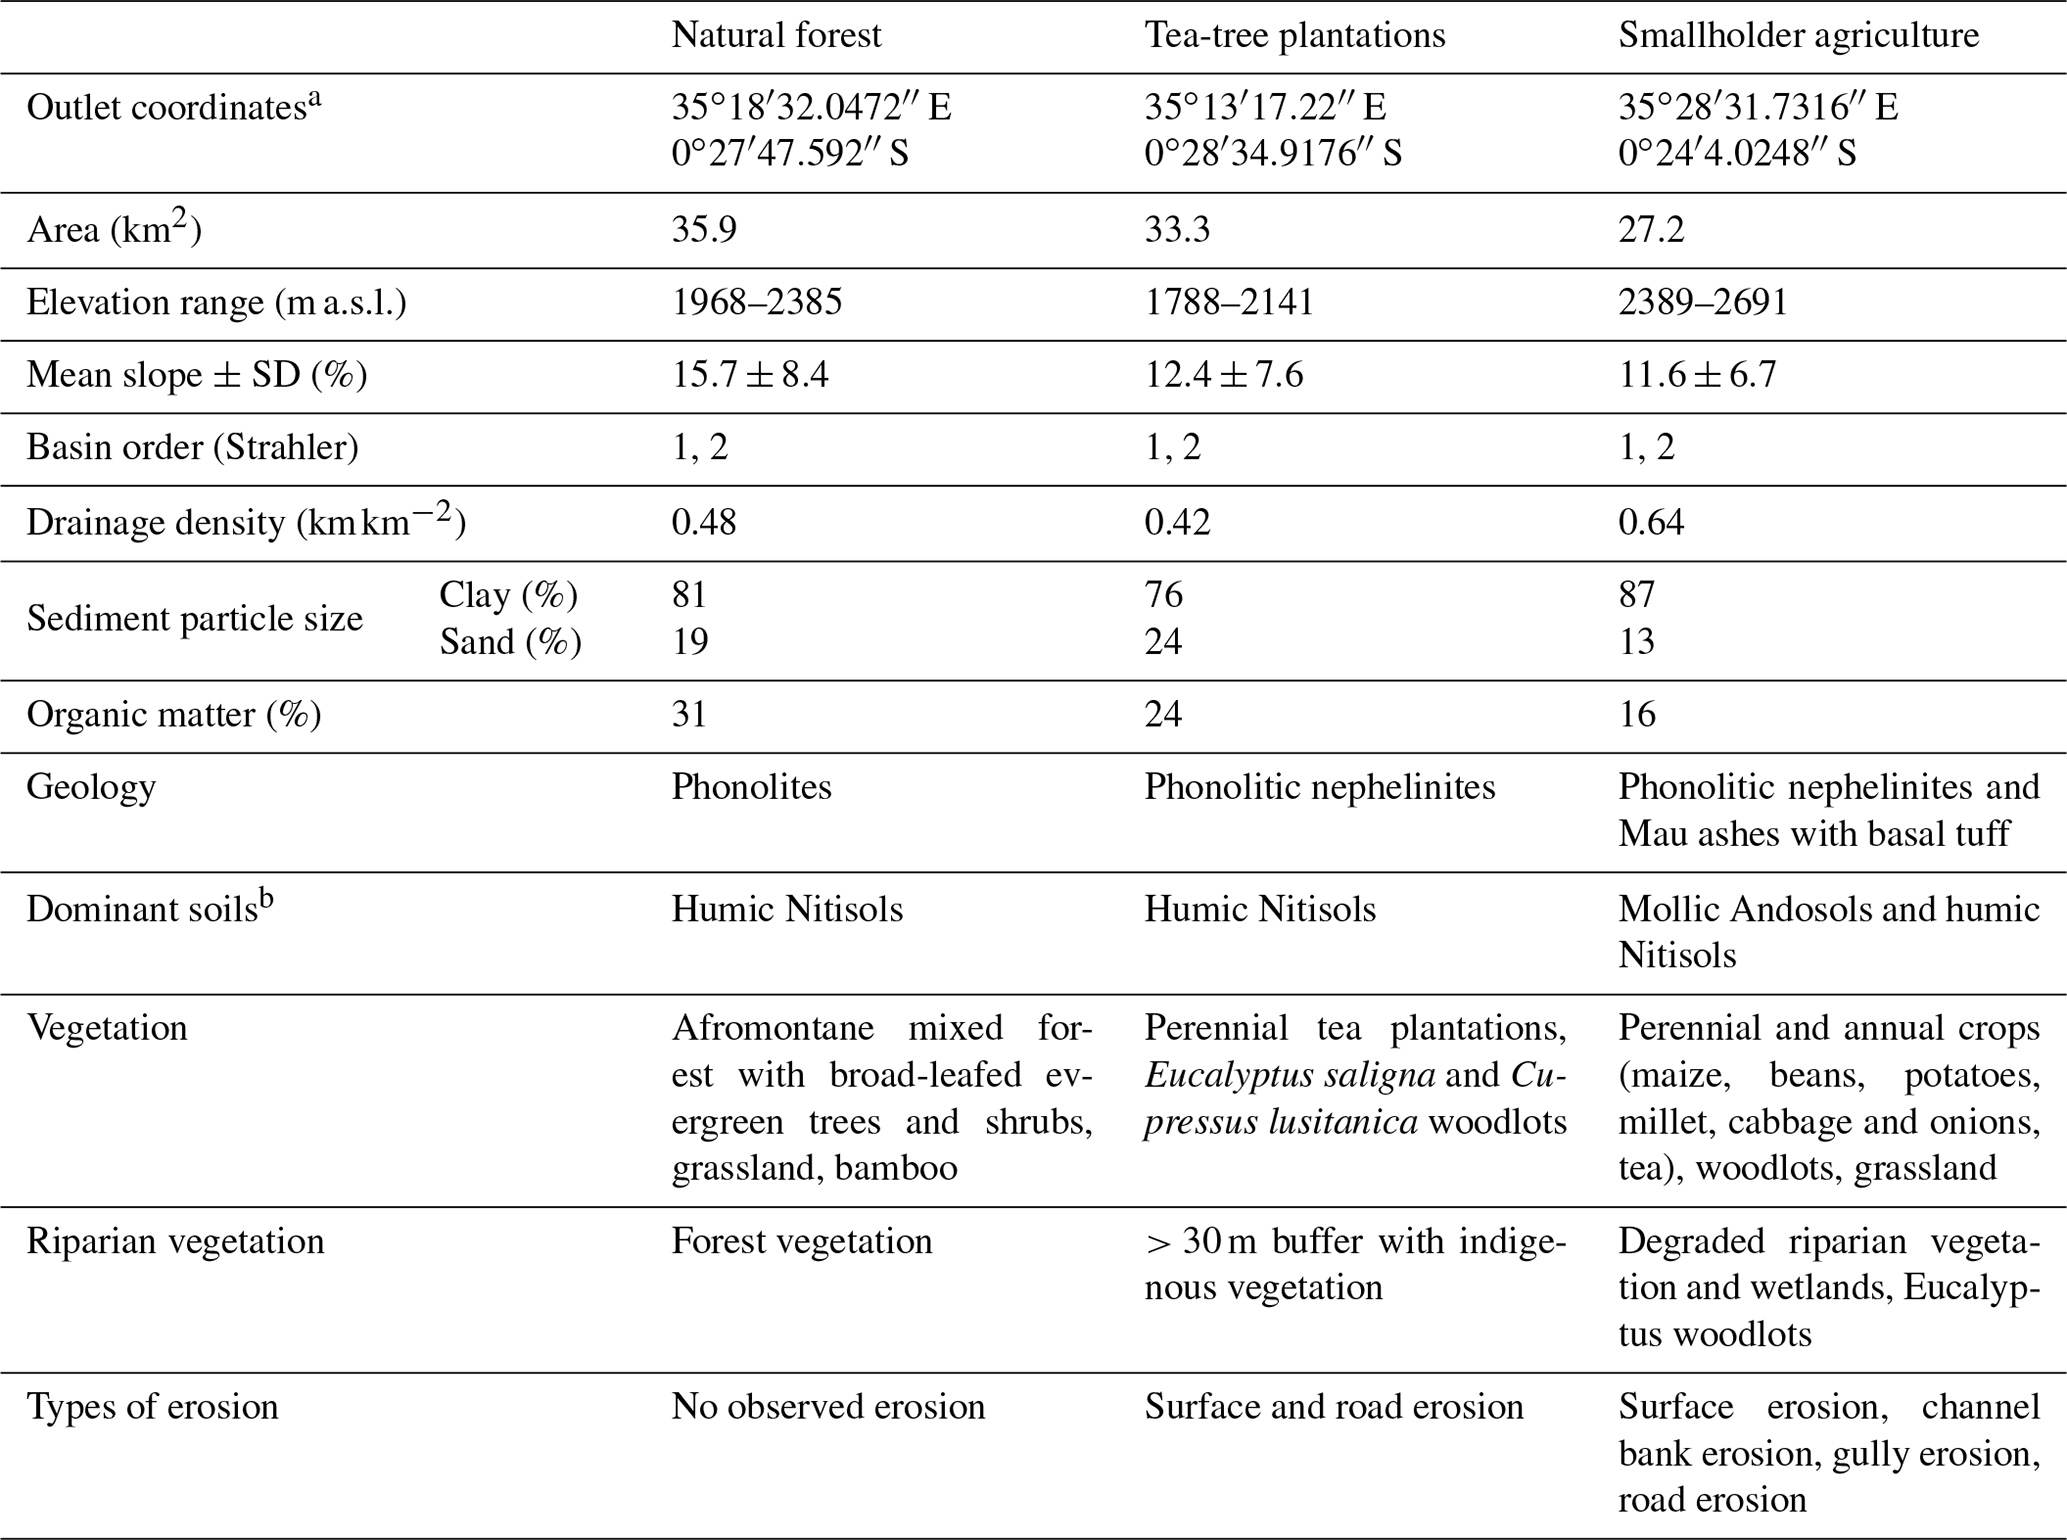
a WGS 84 UTM zone 36S. b KENSOTER geology data from the Soil and Terrain database for Kenya (KENSOTER) version 2.0.
2.2 Continuous field monitoring
The outlet of each catchment is equipped with an automatic gauging station to continuously measure (10 min interval) water level (m) with a radar sensor (VEGAPULS WL61, VEGA Grieshaber KG, Schiltach, Germany) and turbidity (formazin turbidity unit=FTU) using a UV–Vis spectroscopy sensor (spectro::lyser, s::can Messtechnik GmbH, Vienna, Austria; Fig. 1). The data are stored automatically on a data logger (con::cube, s::can Messtechnik GmbH, Vienna, Austria) and downloaded on a weekly to biweekly basis. The data are additionally automatically uploaded to an online database, except for the site at the natural forest due to network restrictions. The equipment is powered by solar panels and two batteries. Stream discharge (m3 s−1) was obtained by using a site-specific second-order polynomial water level to the discharge rating curve (Jacobs et al., 2018). Specific discharge (mm d−1) was determined by integrating instantaneous discharge taken at 10 min intervals over a day and relating it to the catchment area. In situ turbidity measurements were used to estimate suspended sediment concentrations (mg L−1), based on a rating curve between turbidity and suspended sediment concentrations established by Stenfert Kroese et al. (2020b). After obtaining continuous discharge and suspended sediment concentrations, suspended sediment load was determined by multiplying suspended sediment concentration and discharge for each 10 min interval. Suspended sediment yield was calculated by integrating sediment load over time and relating it to the catchment area.
Precipitation was measured using eight automatic tipping bucket rain gauges calibrated to measure cumulative rainfall every 10 min with a 0.2 mm resolution (five tipping bucket rain gauges: Theodor Friedrichs, Schenefeld, Germany, and three weather stations: ECRN-100 high-resolution rain gauge; Fig. 1). Thiessen polygons weighted the contribution of rainfall of every tipping bucket to each catchment. To relate the amount of runoff to the amount of precipitation received, the catchment runoff coefficient was calculated as the ratio of specific discharge to annual rainfall. A more detailed description of sampling sites and instrumentation can be found in Jacobs et al. (2018). This study uses hydrological and sedimentological data between January 2018 and December 2019.
2.3 Data quality assurance
For quality assurance, the turbidity, discharge and rainfall datasets were checked for anomalies. Recorded values were flagged with Not a Number (NaN) during malfunctioning, such as (i) sensor above water level, (ii) siltation of turbidity sensors, (iii) biofilm or debris on the measurement window due to malfunctioning of automatic cleaning with compressed air, (iv) measurement gaps due to incidents of power supply failure or (v) restricted counting of number of tips by the rain gauges by blocked funnel or spider webs.
Once anomalous values were replaced by NaN, local outliers were detected by the median absolute deviation (MAD) for discharge and suspended sediment:
where xi is the whole dataset, Mi1 is the median of the dataset and Mi2 is the median of the absolute deviation from the dataset from its median. The standard deviation is estimated by the constant b set to 1.4826 for normal distribution (Leys et al., 2013). A moving window of k=16 measurements around observation xi at time ti was used to detect local outliers with :
where a=6 is the threshold for outlier selection, Mj,i is the median and the MADj,i is the MAD for xj. There are gaps for discharge and suspended sediment data for the smallholder agriculture catchment in September until October 2019 due to theft of the power supply. Missing sediment data were integrated using a linear interpolation.
2.4 Suspended sediment sampling
Suspended sediment was sampled during both long rainy seasons in 2018 and 2019 (May–September 2018 and April–May 2019). However, the sampling period in 2019 coincided with the onset of the long rainy season in 2019 and was drier compared to 2018. Therefore, the first sampling campaign in 2018 is described as the “2018 wet period” and the second sampling campaign in 2019 as the “2019 drier period”. The sediment sampling covered 20 and 12 sampling days in the natural forest, 22 and 13 d in the tea-tree plantation and 13 and 16 sampling days in the smallholder agriculture catchment in 2018 and in 2019, respectively. We deployed three different methods for suspended sediment sampling: time-integrated sampling with sediment traps (n=88), following the method by Phillips et al. (2000) (Fig. 2d), and manual (n=6) and automatic (n=7; 3700 Full-size portable sampler, Teledyne ISCO, Lincoln, USA) storm-event-based bulk sampling (Table 2). The manual-event-based sampling was conducted next to the installed time-integrated samplers at each catchments outlet (Fig. 1). Time-integrated samplers were emptied of accumulated suspended sediment after 3–5 d. The storm-event-based samples were retrieved during a storm manually with bulk river water samples (∼10 L). The auto-sampling was only conducted at the outlet of the smallholder agriculture catchment, whereby samples were collected during the rising and falling stages of a storm event at 30 min interval and composed a bulk sample. Sediment in suspension from all three sampling methods was allowed to stand for up to 5 d, then the supernatant was carefully removed; the remaining sediment–water mixture was then placed in aluminium trays for air-drying.
Table 2Total number of samples of time-integrated and manual and automatic storm-event-based sediment sampling of the natural forest, tea-tree plantations and smallholder agriculture catchments in 2018 and 2019.

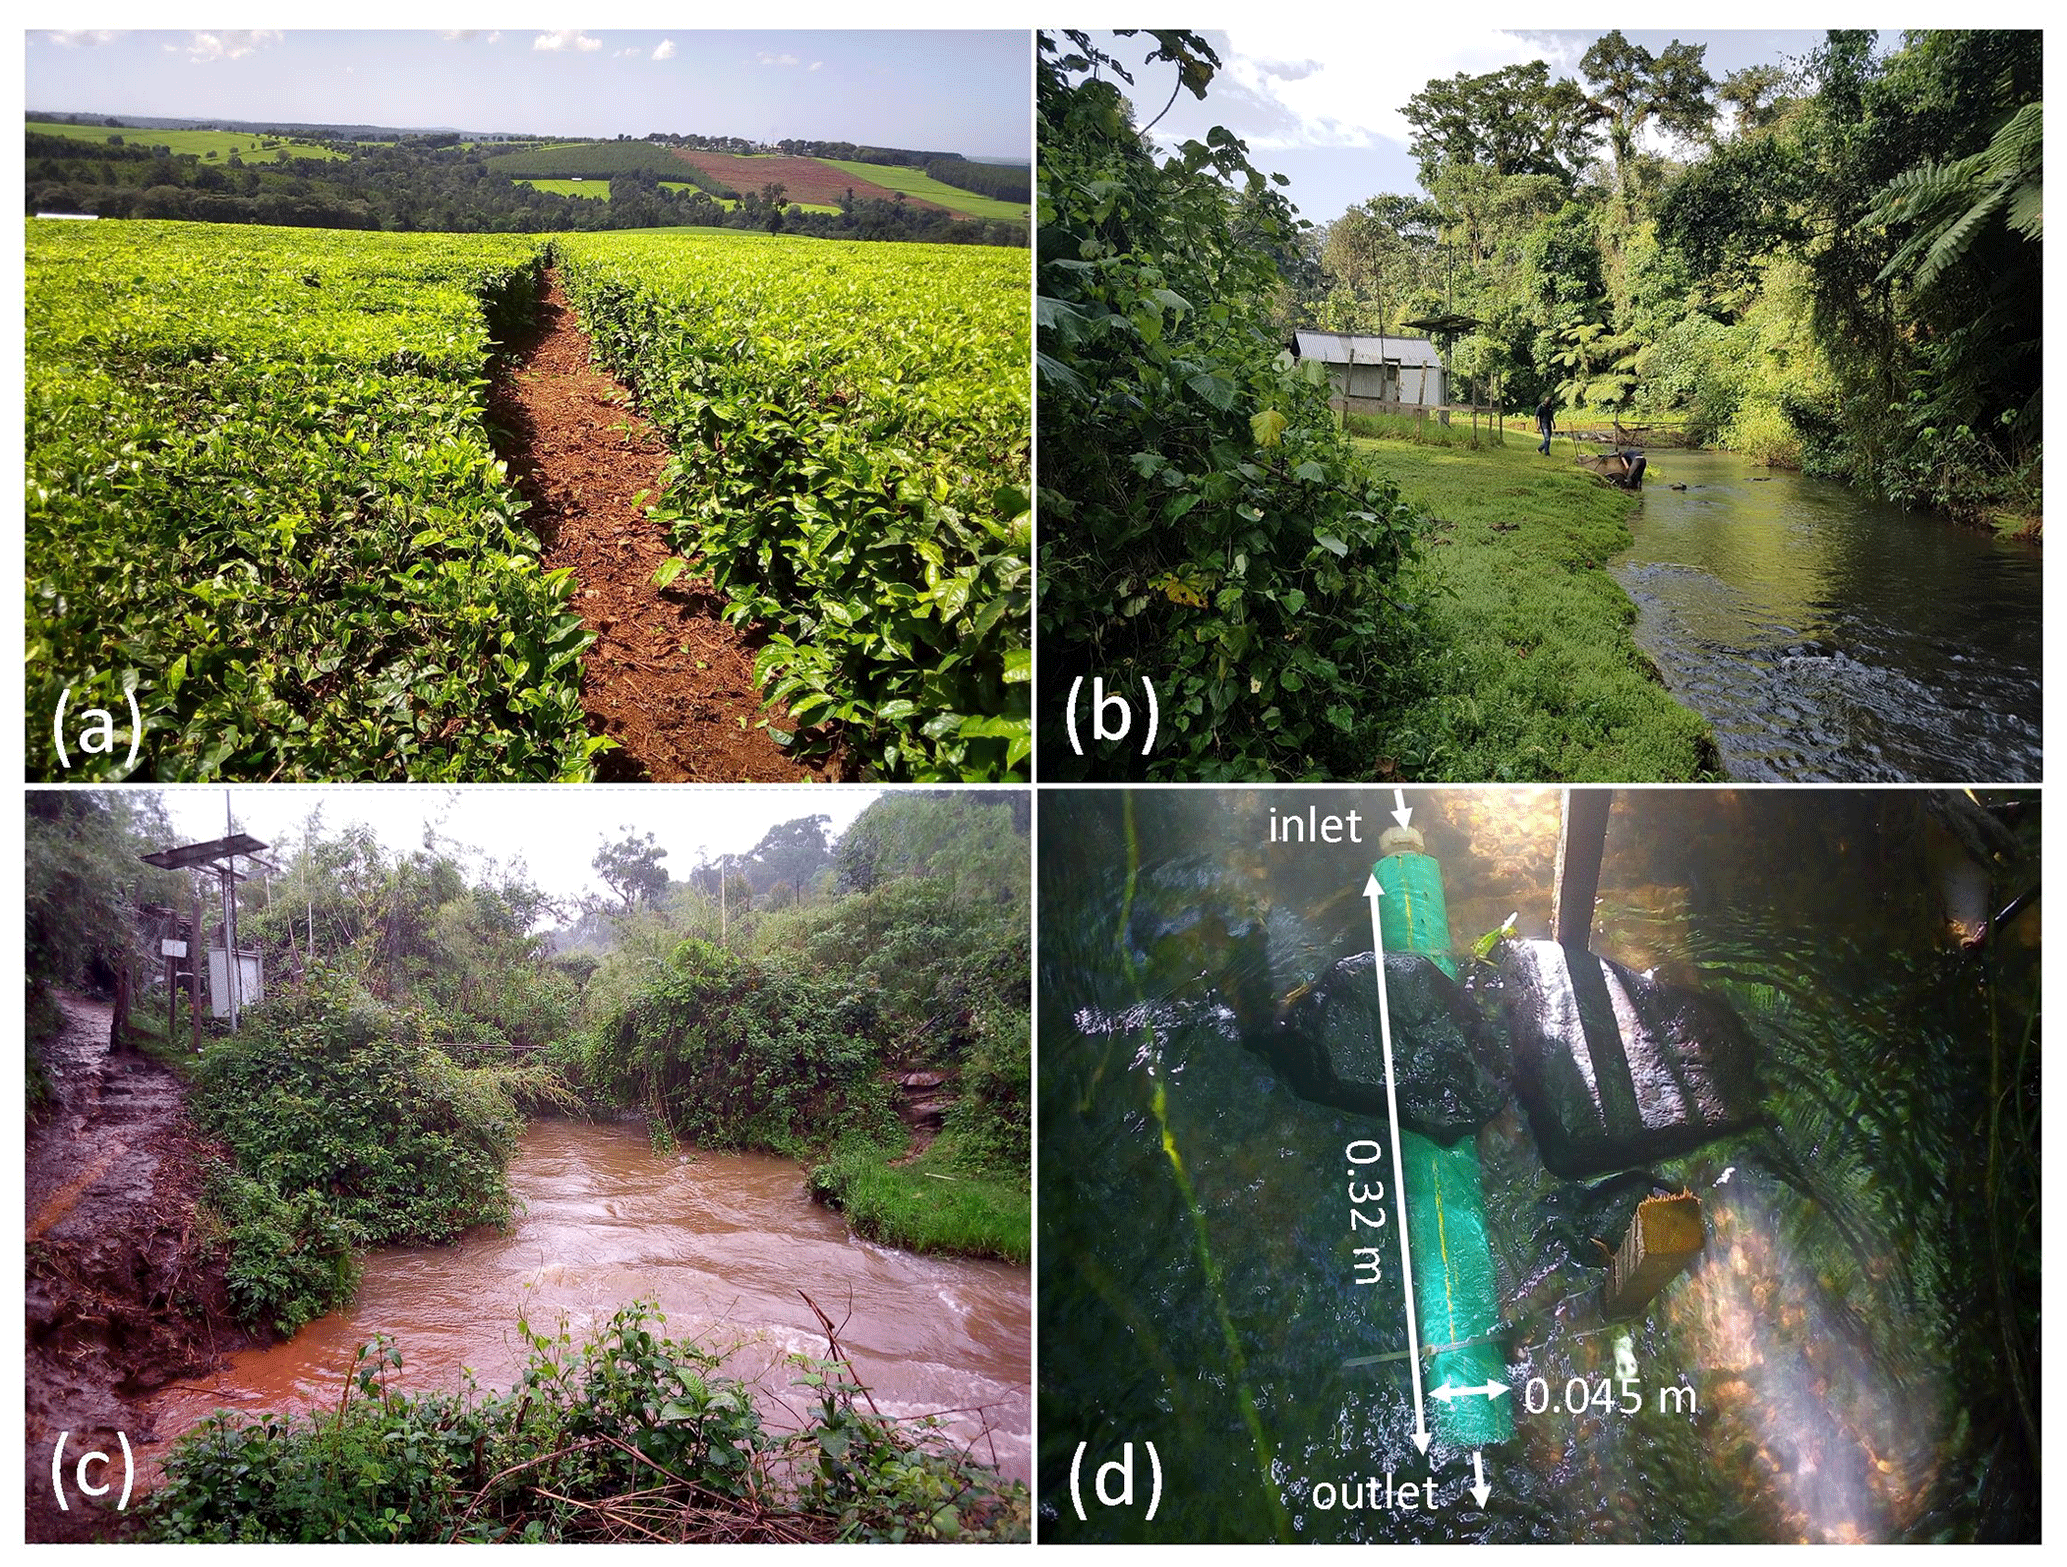
Figure 2(a) Tea-tree plantation catchment, (b) outlet of the natural forest and (c) outlet of the smallholder agriculture catchment and (d) time-integrated sediment trap.
2.5 Processing and qualitative analysis of suspended sediment
An aliquot of each sediment sample (>230 mg) was ground using a ball mill grinder for further laboratory analysis. The ground samples were analysed for TC, TN and TP concentrations. In this context, TC, TN and TP refer to the total C, N and P concentration in suspended sediments, which corresponds to particulate C, N and P (expressed in grams per kilogram, g kg−1). For TC and TN concentration measurements, a subsample of 30 mg of ground sediment was wrapped in tin capsules and combusted in an elemental micro-analyser (Elementar vario EL III, Elementar Analysensysteme GmbH, Langenselbold, Germany) at 950 ∘C. For TP concentration measurements, a subsample of 200 mg of ground sediment was digested in 4.4 mL of sulfuric acid–hydrogen peroxide digest reagent and heated to 400 ∘C for 2 h (Allen et al., 1974). After diluting the digestate twice, TP was determined using colorimetry based on a reaction with acidic molybdate in the presence of antimony which forms an antimony–phosphomolybdate complex. Ascorbic acid turns the complex an intense blue (phosphomolybdenum blue), which is measured spectrophotometrically at 880 nm in a segmented flow analyser (Auto-analyser 3HQ, SEAL Analytical Ltd., Hampshire, United Kingdom). The remaining sediment samples were analysed for organic matter content using gravimetric weight change by loss on ignition at 500 ∘C for 4 h in a muffle furnace.
To estimate TC, TN and TP concentrations in stream water (mg L−1), the mean suspended sediment concentrations (mg L−1) for each sampling period were multiplied with the particulate TC, TN and TP concentrations (g kg−1) per dry weight sediments. For TC, TN and TP load calculations, the mean discharge and suspended sediment concentration were obtained for each sediment sampling period. The concentrations of TC, TN and TP (g kg−1) were multiplied by the mean discharge (m3 s−1) and mean suspended sediment concentrations (mg L−1) to obtain the sediment-associated loads (t d−1). Annual suspended sediment-associated TC, TN and TP yields were calculated by integrating the mean of the daily loads to annual loads and relating it to the catchment area.
2.6 Data analysis
Data analysis was conducted in R (R Development Core Team, 2017). All data were analysed for normality using the Shapiro–Wilk test. We tested significant differences on particulate TC, TN and TP values among the different land uses between the 2 years using the Kruskal–Wallis test for analyses of variances. The effect of land use on particulate TC, TN and TP within each year was tested for significance using the pairwise Wilcoxon rank sum test. To test the linear relationship between two macroelements, the correlation coefficient r was identified between each of the two macroelements. All significant differences reported are at p<0.05.
3.1 Hydrological and suspended sediment responses
Mean annual rainfall for the study period (2018–2019) was 1989, 2006, and 1671 mm yr−1 for the natural forest, tea-tree plantation and smallholder agriculture catchments, respectively. In the natural forest and the tea-tree plantations, 2019 was wetter than 2018, while the smallholder agriculture catchment was drier in 2019. Mean annual specific discharge was highest in the natural forest catchment, followed by the tea-tree plantation and the smallholder agriculture catchments with 806 (95 % confidence interval 778–834), 678 (642–714) and 658 (634–682) mm yr−1. The catchment runoff coefficient was highest for the natural forest catchment (0.41) and smaller for the tea-tree plantations and the smallholder agriculture with a mean of 0.34 and 0.39, respectively. The mean annual suspended sediment yield for the 2 years was highest in the smallholder agriculture with 231 (215–248), followed by the natural forest with 57 (54–62) and the tea-tree plantation catchments with 48 (44–52) (Table 3).
Table 3Hydrological characteristics and total suspended sediment (TSS) (and 95 % confidence interval) of the three catchments under different land use: natural forest (NF), tea-tree plantations (TTP) and smallholder agriculture (SHA) in the south-west Mau, Kenya, in 2018 and 2019.
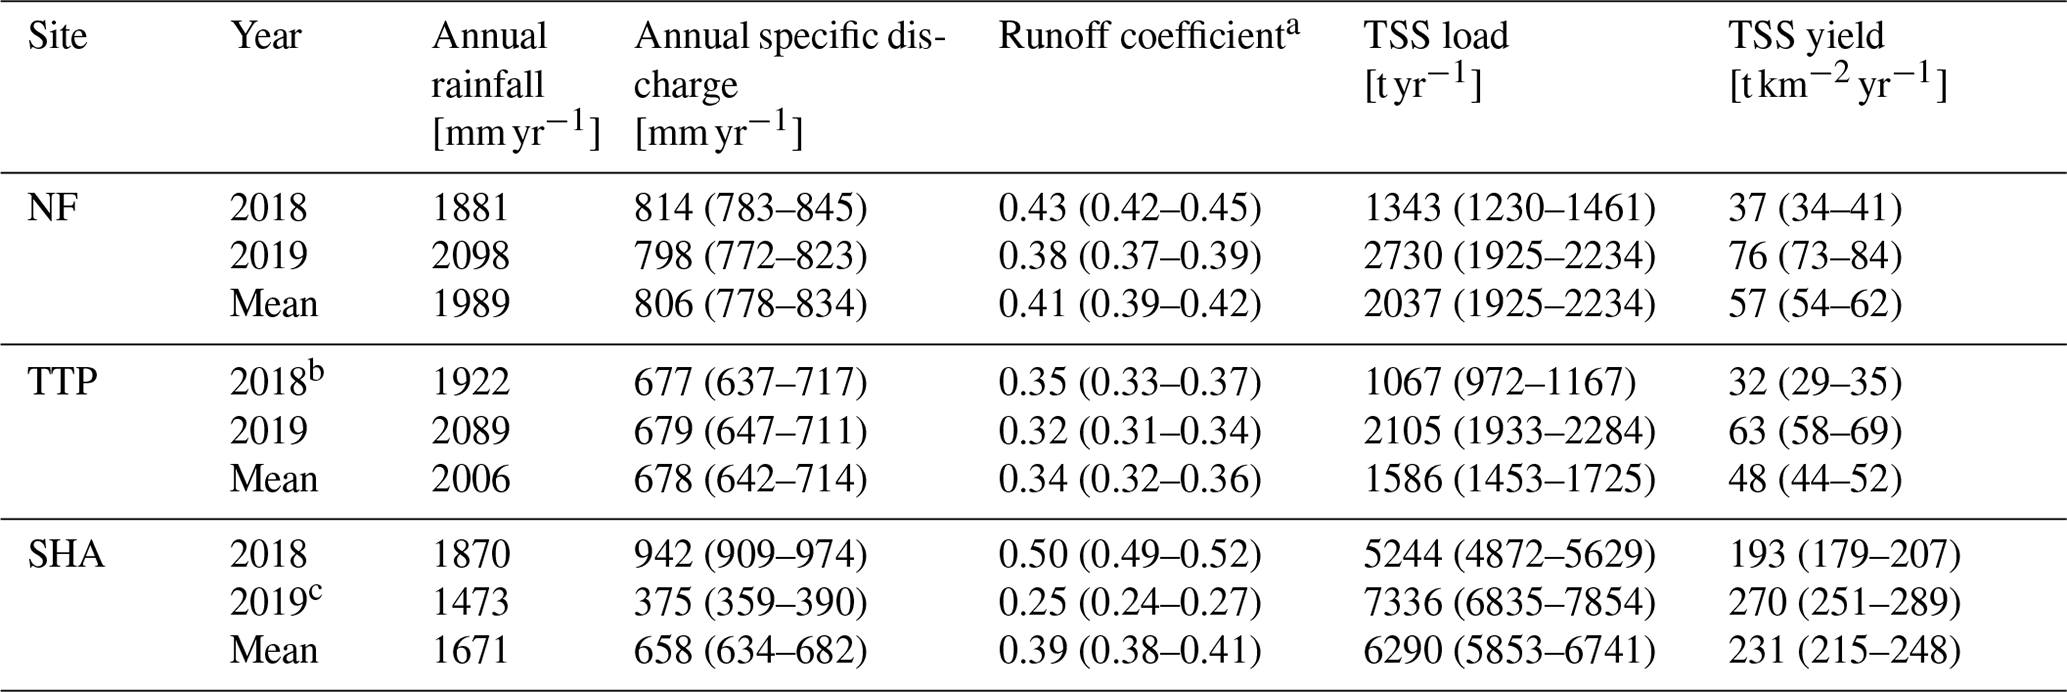
a Specific discharge as proportion of annual rainfall. b Gaps in discharge and suspended sediment data due to sensor malfunctioning. c Gaps in discharge and suspended sediment data due to theft of power supply.
In all three catchments, discharge followed the rainfall pattern. The rising limb of the hydrograph was generally steep, followed by either steep or gentle falling limbs, depending on the magnitude of the storm event. Discharge peaked during the long rainy season between April and July 2018. In contrast, 2019 experienced a delayed onset of the rains, and the highest discharge peaks occurred between October and December. Suspended sediment peaks followed the same pattern as discharge (Fig. 3).
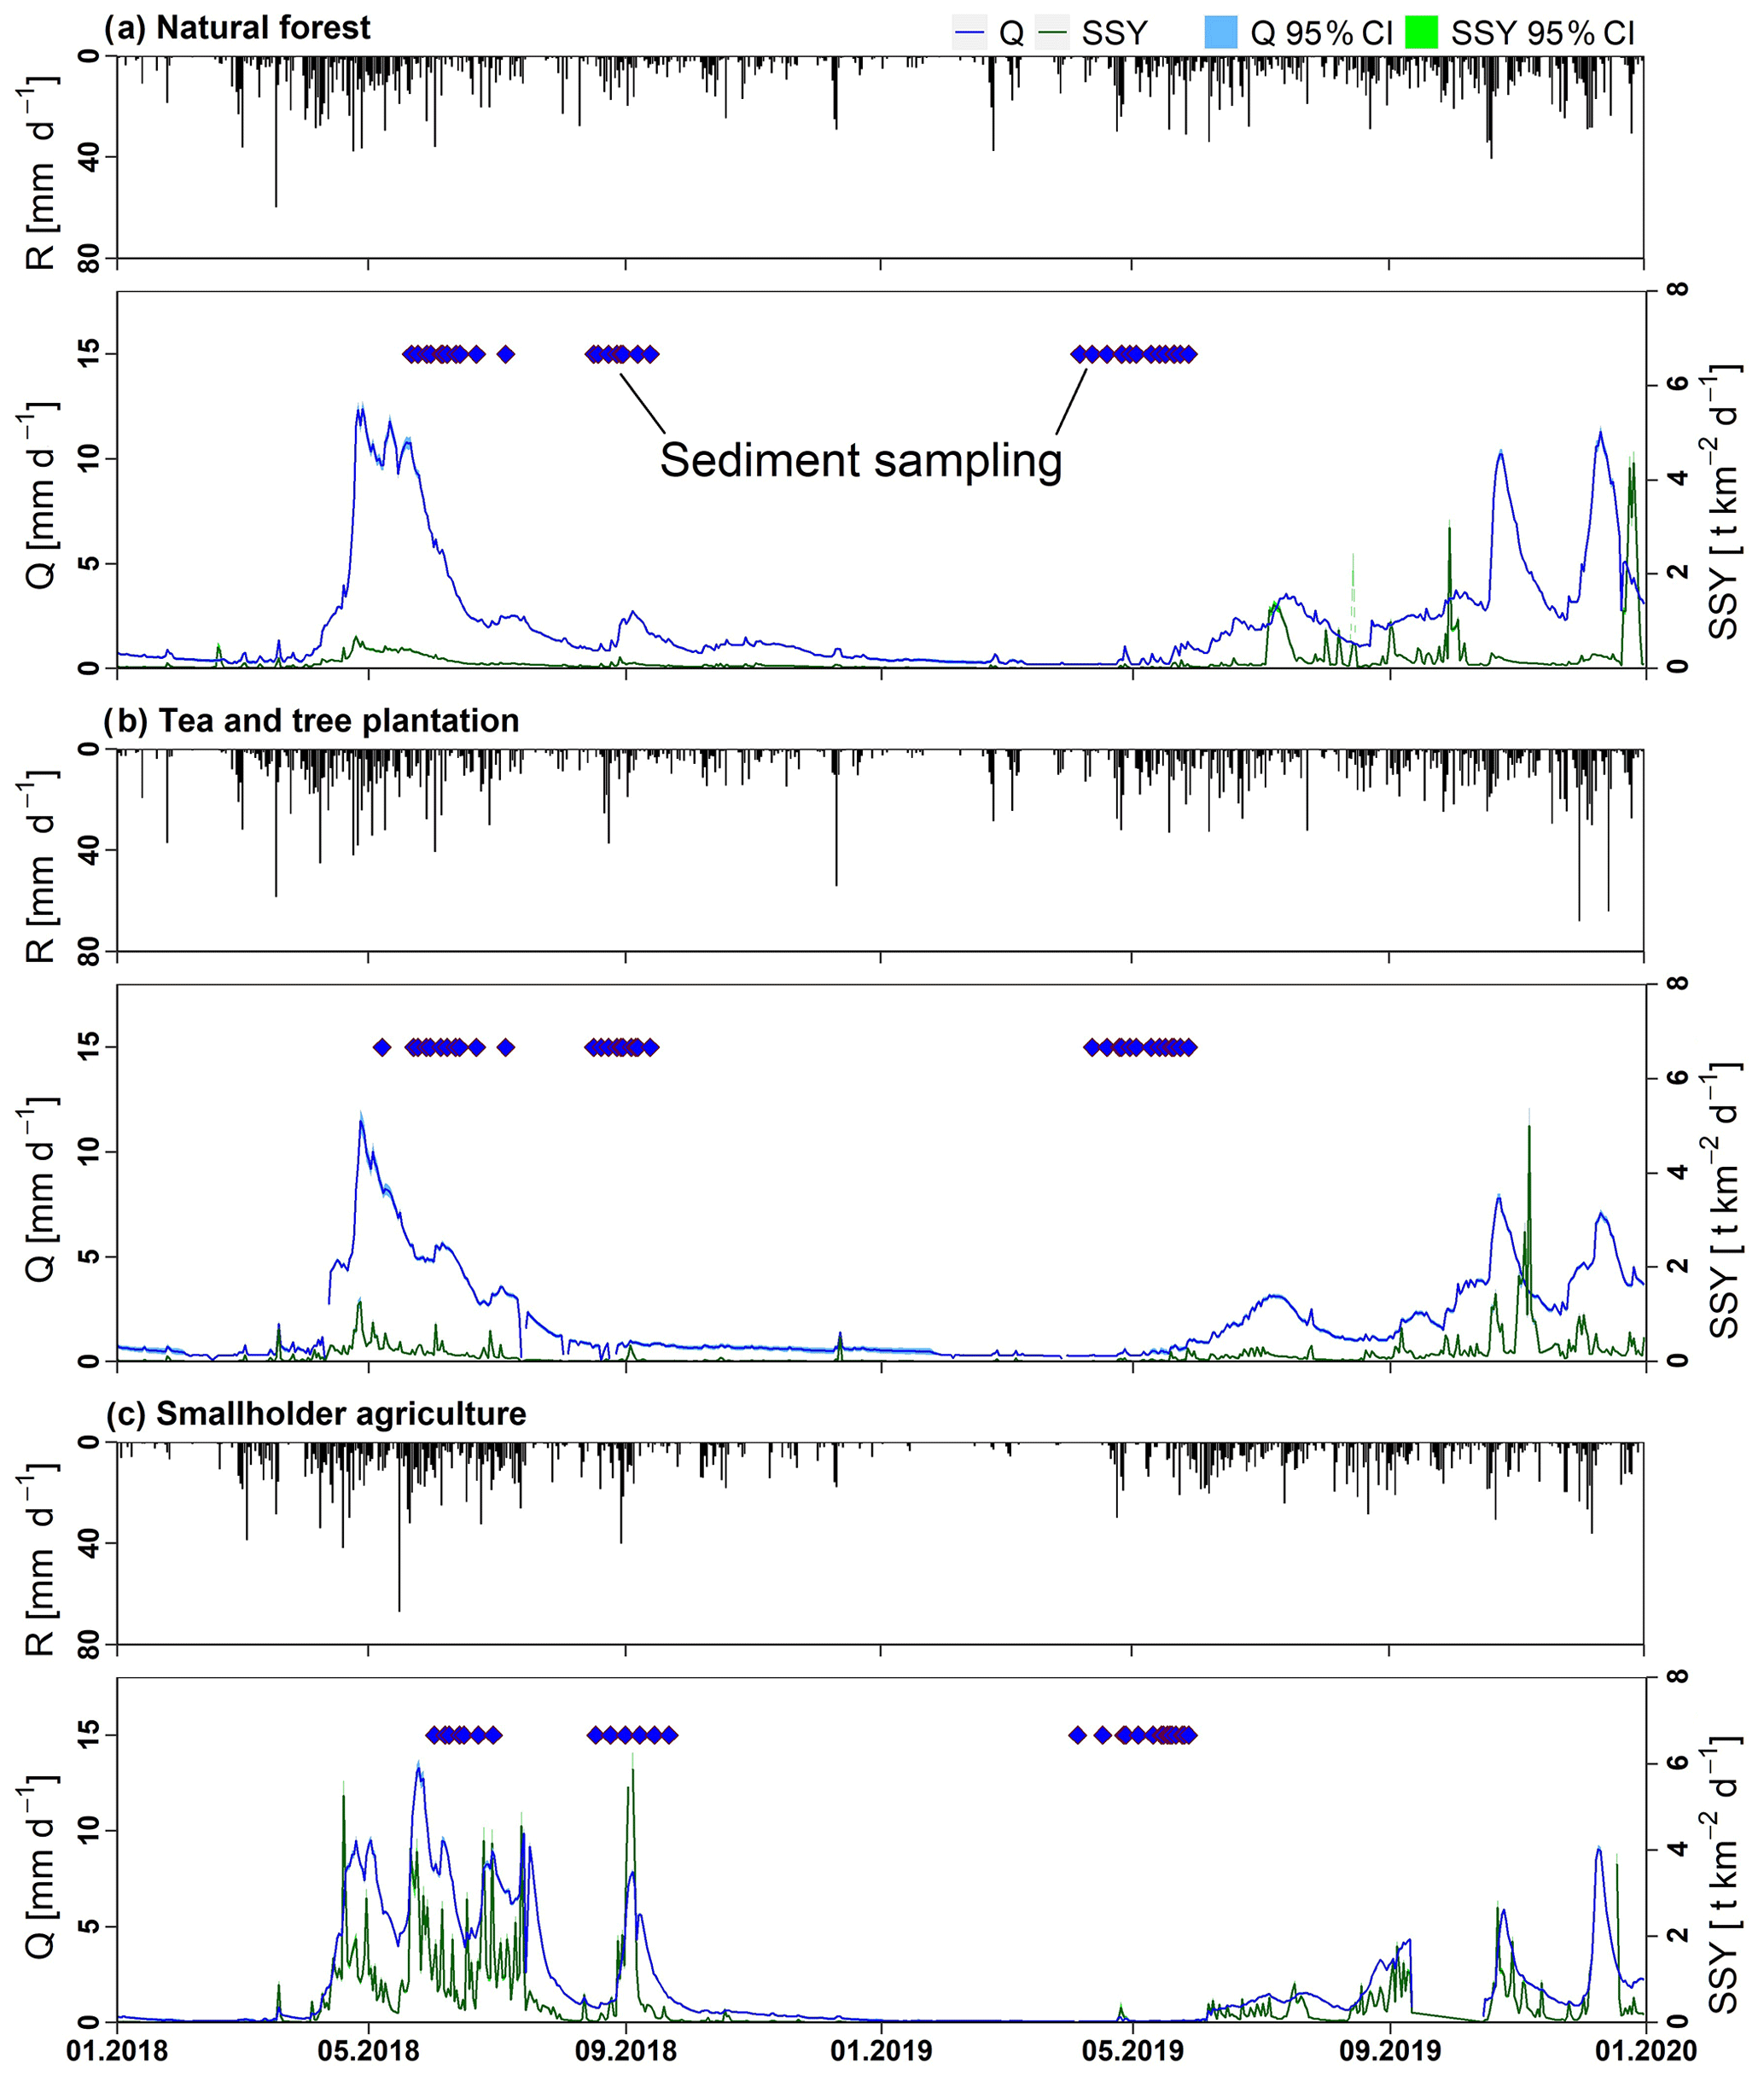
Figure 3Daily accumulated rainfall (R) [mm d−1], specific discharge (Q) [mm d−1] and suspended sediment yield (SSY) [] aggregated from 10 min resolution with 95 % confidence interval (CI) of the (a) natural forest, (b) tea-tree plantation catchment and (c) smallholder agriculture catchment in the south-west Mau, Kenya, between January 2018 and December 2019.
3.2 Macronutrient concentrations in sediment and in the stream
Suspended sediment sampling for the particulate TC, TN and TP analysis was conducted during the high flows in 2018 (May–September), while in 2019 the sampling coincided with the onset of the long rainy season during April and May (Fig. 3). The TC concentrations were 7 % lower in the natural forest catchment and 15 % higher in the smallholder agriculture in 2019 than in the previous year. The TN concentrations were 8 %–20 % higher in 2019 than in 2018 for all three catchments. In the natural forest and the tea-tree plantation catchments, the TP concentrations were 25 % and 17 % higher, respectively, and 38 % lower in the smallholder agriculture catchment in 2019 than in 2018 (Fig. 4).

Figure 4Particulate total carbon, nitrogen and phosphorus concentrations [] of time-integrated and manual and automatic collected samples of the natural forest (NF), tea-tree plantation (TTP) and smallholder agriculture (SHA) catchments in the south-west Mau, Kenya, based on 13–22 sampling days for the sampling campaign from May–October 2018 and 14–18 sampling days for the period April–June 2019. Different letters indicate significant differences between land uses (p<0.05).
Particulate TC, TN and TP concentrations were significantly higher in the natural forest catchment than in the tea-tree plantation and smallholder agriculture catchments in both years. The TC concentrations were significantly higher in the tea-tree plantations than in the smallholder agriculture in 2018, while there was no difference in 2019. TN and TP concentrations were significantly higher in the tea-tree plantation than in the smallholder agriculture catchment in 2019, but concentrations were not significantly different between the tea-tree plantations and the smallholder agriculture in 2018 (Table 4).
Table 4Mean ± standard deviation of particulate TC, TN and TP concentrations [] of time-integrated and manual and automatic collected samples, suspended sediment concentrations (TSS) [mg L−1] and TC, TN [mg L−1] and TP [µg L−1] concentrations in water at the outlet of the natural forest (NF), tea-tree plantation (TTP) and the smallholder agriculture (SHA) in the south-west Mau, Kenya, based on 13–22 sampling days for the sampling campaign from May–October 2018 and 14–18 sampling days for the period April–June 2019.
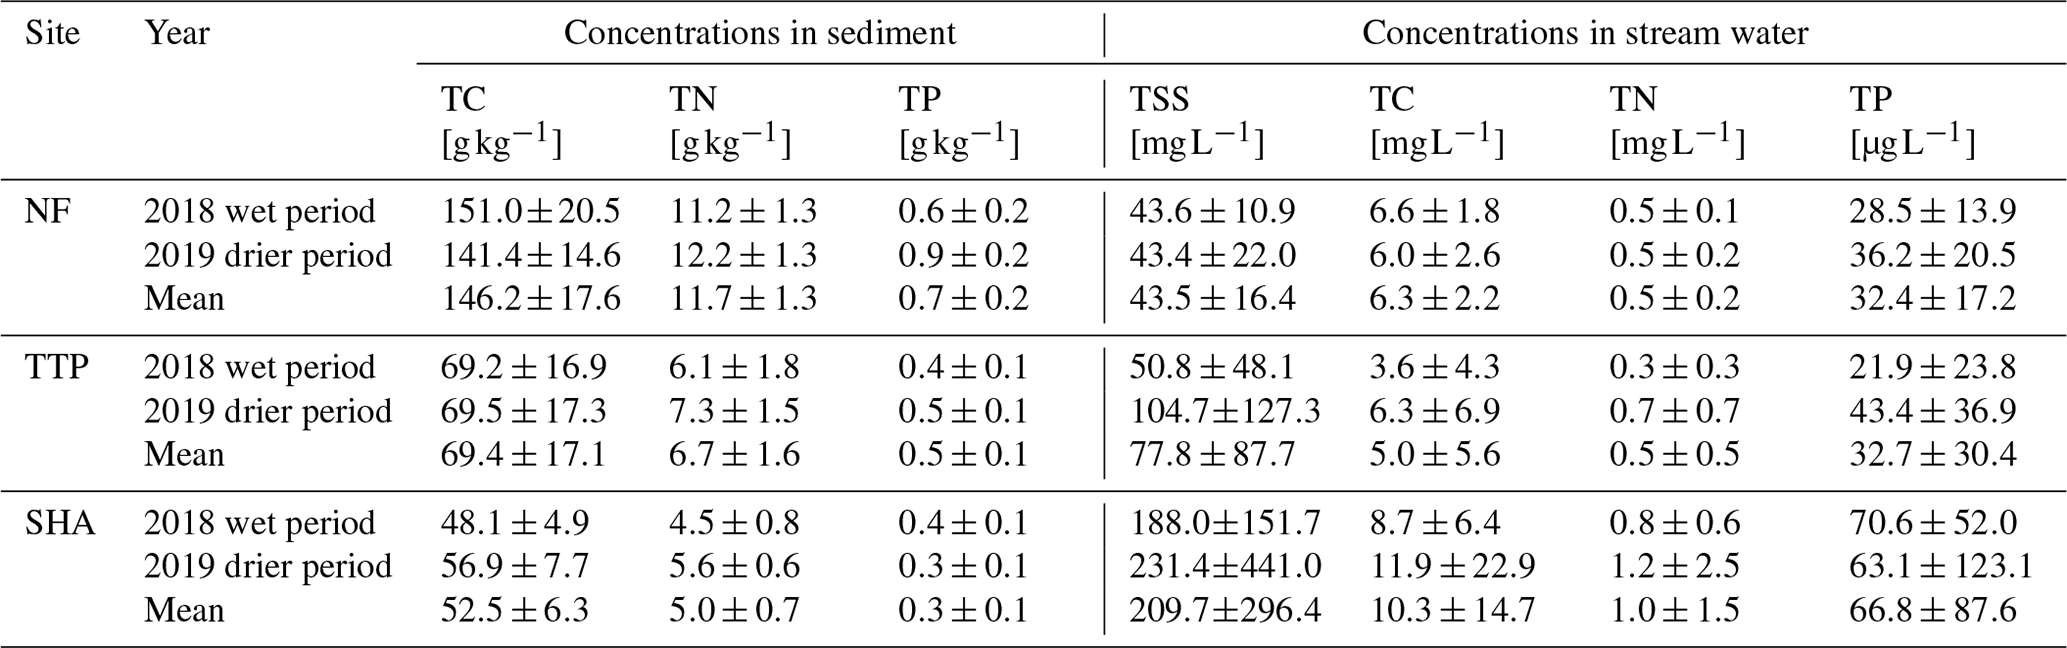
Wet period May–October 2018; drier period April–June 2019.
The mean TC, TN and TP concentrations in the stream water for both years, estimated based on the particulate macronutrient concentrations and suspended sediment concentrations, were highest for the smallholder agriculture and lowest for the natural forest catchment and tea-tree plantations (Table 4).
The natural forest catchment had the highest percentage of organic matter in suspended sediments with 31 %, followed by the tea-tree plantations with 24 %, and the lowest percentage was measured in the smallholder agriculture catchment with 16 %.
3.3 Stoichiometric macronutrient ratios and their relationships
The C:N ratio in the sediment from natural forest (12.6±1.0) was significantly higher (p<0.05) than the ratios of the tea-tree plantations (10.5±1.2) and the smallholder agriculture (10.6±1.3) for both years, while the C:N ratio was not significantly different between the tea-tree plantations and the smallholder agriculture (p>0.05). The C:P ratio in the natural forest (269.8±106.4) was significantly higher than the tea-tree plantations (160.5±39.2) and the smallholder agriculture (126.7±22.6) in 2018, but the C:P ratio was not significantly different between the three catchments in 2019. The N:P ratio was significantly higher in the natural forest (19.9±6.9) than the smallholder agriculture (11.8±3.0) in 2018, while 2019 showed no significant difference between the three catchments (p>0.05). The C:N ratio was significantly higher in 2018 than in 2019 in the natural forest and the tea-tree plantations, while the C:P and N:P ratios were significantly higher in 2019 than 2018 in the smallholder agriculture (Fig. 5). The sediment-associated ratio was highest in the natural forest catchment with , followed by the smallholder agriculture with and the tea-tree plantations with , whereas the N:P ratio was similar for all three catchments.

Figure 5Macronutrient ratios for carbon : nitrogen (C:N), carbon : phosphorus (C:P) and nitrogen : phosphorus (N:P) of the natural forest (NF), tea-tree plantation (TTP) and smallholder agriculture (SHA) catchments in the south-west Mau, Kenya, based on 13–22 sampling days for the sampling campaign from May–October 2018 and 14–18 sampling days for the period April–June 2019. Different letters indicate significant differences between catchments, and the asterisk indicates significant differences within one catchment between years (p<0.05).
TC, TN and TP concentrations were correlated with each other for all three catchments (Fig. 6). The strongest relationship was observed between TC and TN within the tea-tree plantations (r=0.87), followed by the smallholder agriculture (r=0.71) and the natural forest catchment (r=0.64). The correlation between TN and TP was strongest in the tea-tree plantations (r=0.58). No significant relationships were found between TC and TP in the natural forest and in the smallholder agriculture catchment, with low correlation coefficient values ranging between −0.15 and 0.04, and between the correlation of TN and TP in the smallholder agriculture (; p>0.05). The correlations of the natural forest catchment were in general higher than those of the tea-tree plantations and the smallholder agriculture (Fig. 6).
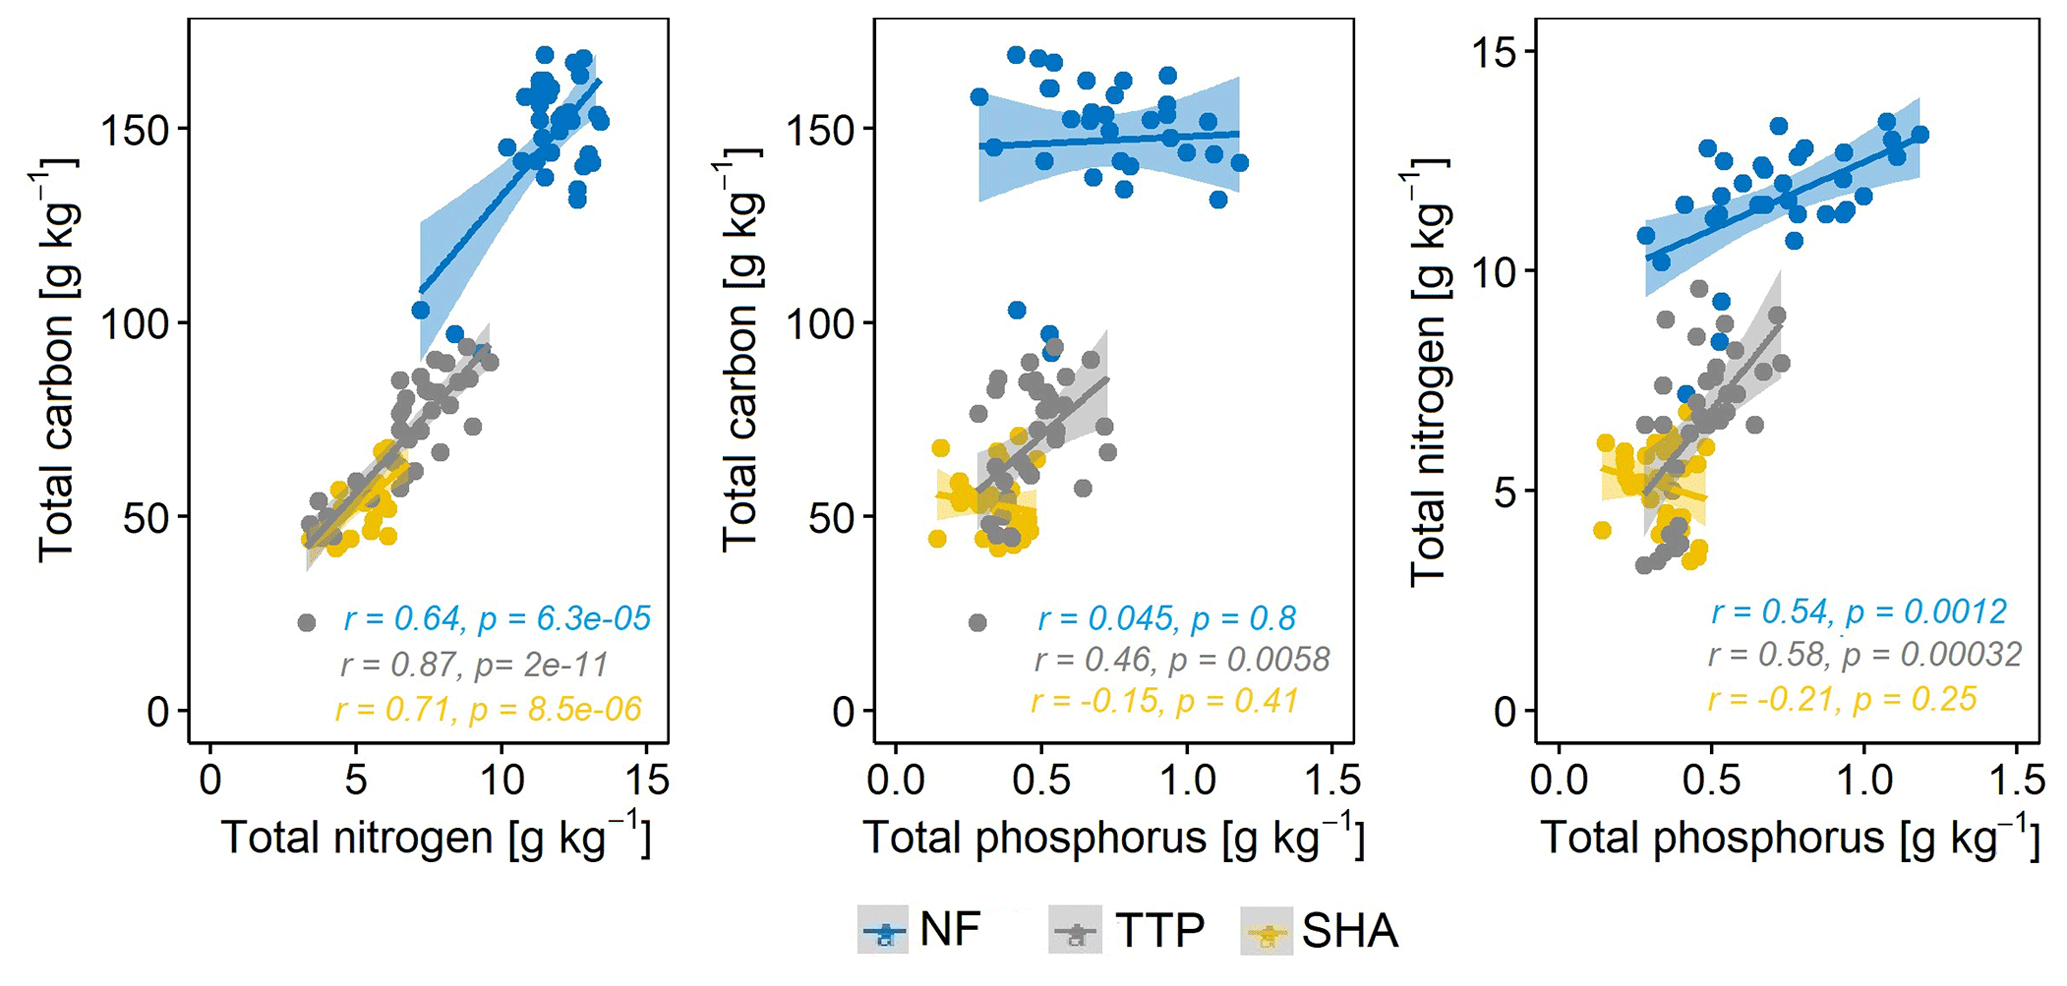
Figure 6Correlations with correlation coefficient r obtained between total carbon, total nitrogen and total phosphorus [] concentrations of the natural forest (NF), the tea-tree plantation catchments (TTP) and the smallholder agriculture (SHA) in the south-west Mau, Kenya, based on 13–22 sampling days for the sampling campaign from May–October 2018 and 14–18 sampling days for the period April–June 2019. Significant difference at p<0.05.
3.4 Sediment-associated macronutrient loads
The mean daily suspended sediment loads for the sampling period were between 3- and 4-fold higher in the smallholder agriculture compared to the natural forest and the tea-tree plantations (14.6±15.0, 4.9±2.5 and 3.4±3.9t d−1, respectively). The mean daily TC and TN load in suspended sediment during the sampling periods in 2018 and 2019 was highest for the smallholder agriculture (668.9±661.9 kg C d−1 and 60.5±59.5 kg N d−1), followed by the natural forest (496.9±335.3 kg C d−1 and 37.2±20.9 kg N d−1) and the tea-tree plantation catchment (193.4±178.6 kg C d−1 and 18.1±18.5 kg N d−1). For the sediment-associated TP, the highest daily loads were observed in the smallholder agriculture followed by the natural forest and the tea-tree plantations (5.5±5.1, 1.9±1.3, and 1.4±1.3 kg P d−1, respectively). The mean annual sediment-associated TC, TN and TP yields of the sampling period are estimated to be up to 4-fold higher for the smallholder agriculture (9.0±8.9 , 0.8±0.8 and 73.9±68.9 ) compared to the natural forest and up to 5-fold higher than the tea-tree plantations (2.1±2.0 , 0.2±0.2 and 14.9±13.6 ) (Table 5).
Table 5Overview of total suspended sediment-associated (TSS) total carbon (TC), total nitrogen (TN) [] and total phosphorus (TP) yields [] and total suspended sediment yields [] based on 13–22 sampling days for the sampling campaign from May–October 2018 and 14–18 sampling days for the period April–June 2019.

Wet period May–October 2018; drier period April–June 2019.
4.1 Land use affects sediment-associated carbon and nutrient concentrations
This study shows that land use and management is a key controlling factor of suspended sediment-associated TC, TN and TP concentrations in the headwaters of the Sondu River basin. Most significantly, and despite the application of fertilizer to the tea-tree plantation and smallholder agriculture catchments, the natural forest catchment has much higher particulate TC, TN and TP concentrations than the agricultural catchments. These results suggest that the sediment from the forest catchment is comprised of organic material with a high ratio, either originating from the forest floor or falling directly into the river. In contrast, sediments from the agricultural catchments are a mix of mineral and organic matter, and fertilizer additions do not balance with the loss of TC, TN and TP from the system. This refutes our hypothesis that particulate-bound TC, TN and TP concentrations in sediment are highest in agricultural catchments where the majority of suspended sediment (77 %) originates from agricultural land (Stenfert Kroese et al., 2020a). Although concentrations of TC, TN and TP associated with sediments were lower in the smallholder agriculture catchment, because of higher sediment loads from the smallholder agriculture catchment, the total sediment-associated loads of TC, TN and TP were higher. In addition, higher sediment concentrations in the smallholder catchment meant that TC, TN and TP concentrations in the stream water were also higher in that catchment (Tables 4 and 5). Our sediment-associated TC, TN and TP yield estimations are uncertain. This is due to the sampling of the drier start of the long rainy season in 2019 and the short sampling period in both years. This might have resulted in missed sampling of storm events. Increasing the sampling frequency would improve our understanding of the particulate TC, TN and TP fluxes.
The overall wetter 2019 with higher annual rainfall might have resulted in higher annual suspended sediment yields for the natural forest and tea-tree plantation catchments. In contrast, the smallholder agriculture catchment experienced higher suspended sediment yields during a drier 2019 compared to the previous year. The late onset of the rainy season in 2019 resulted in a late start of the cropping season. As discussed in Stenfert Kroese et al. (2020b), this might have left bare agricultural land prone to erosion during stronger but shorter rainfall events.
The low C and nutrient concentrations in sediments from agricultural soils are associated with soils much lower in nutrients and organic matter compared to nutrient-rich forest soils. The native forest vegetation was converted to smallholder farms during the last few decades (Brandt et al., 2018), conversion that leads to reduced organic inputs and increased decomposition rates of soil organic matter following land management practices (Freibauer et al., 2004). Globally, an average decrease in soil TC of around 30 % was found for soils after conversion of forests to croplands (Don et al., 2011; Murty et al., 2002), while a study of a converted native forest in the highlands of western Kenya showed a decrease by 30 %–40 % within the first 39 years after conversion (Nyberg et al., 2012). Similarly, a decline in soil organic carbon and nutrients was observed following conversion to agricultural cultivation in the same catchments of the Mau forest complex, which was converted during the last 4 to 5 decades (Arias-Navarro et al., 2017; Owuor et al., 2018; Wanyama et al., 2018). The highest TC and TN concentrations were measured in the surface soil (0–0.05 m) of the natural forest catchment (81.1±24.2 g C kg−1 and 4.9±2.3 g N kg−1, respectively), compared to lowest concentrations in smallholder croplands (56.9±11.1 g C kg−1 and 2.1±1.2 g N kg−1, respectively) (Owuor et al., 2018). Chiti et al. (2018) found a significant decline in soil organic carbon as a consequence of forest degradation in the same tropical montane forest. In their study, the organic horizon, the litter layer, had the highest TC concentration under primary forest (412.3±23.2 g C kg−1) compared to a degraded forest (408.2±21.3) and to cypress (398.6±19.6) and tea plantations (381.7±17.6g C kg−1) that replaced the forest. With the reduction in the organic horizon, a decline in soil TC was found in the uppermost mineral soil layer (<0.05 m) (Chiti et al., 2018).
In the smallholder agriculture catchment, the lowered concentrations of sediment TC, TN and TP can be explained by sediment originating from the subsurface where nutrient concentrations are lower (Gellis et al., 2009; Russell et al., 2001; Wanyama et al., 2018). This was demonstrated by Stenfert Kroese et al. (2020a) in a sediment fingerprinting study showing that the subsoil sources are of increased importance in the smallholder agriculture compared to the natural forest and the tea-tree plantation catchment due to exposure of subsoil to erosion processes.
Table 6Overview of particulate total carbon (TC), total nitrogen (TN) and total phosphorus (TP) mean concentrations [g kg−1] of catchment studies around the world. Analysed sample material: SS, suspended sediment, BS, riverbed sediment and WS, water sample. DR Congo is the Democratic Republic of Congo, and TRPR is the Tana River Primate Reserve.
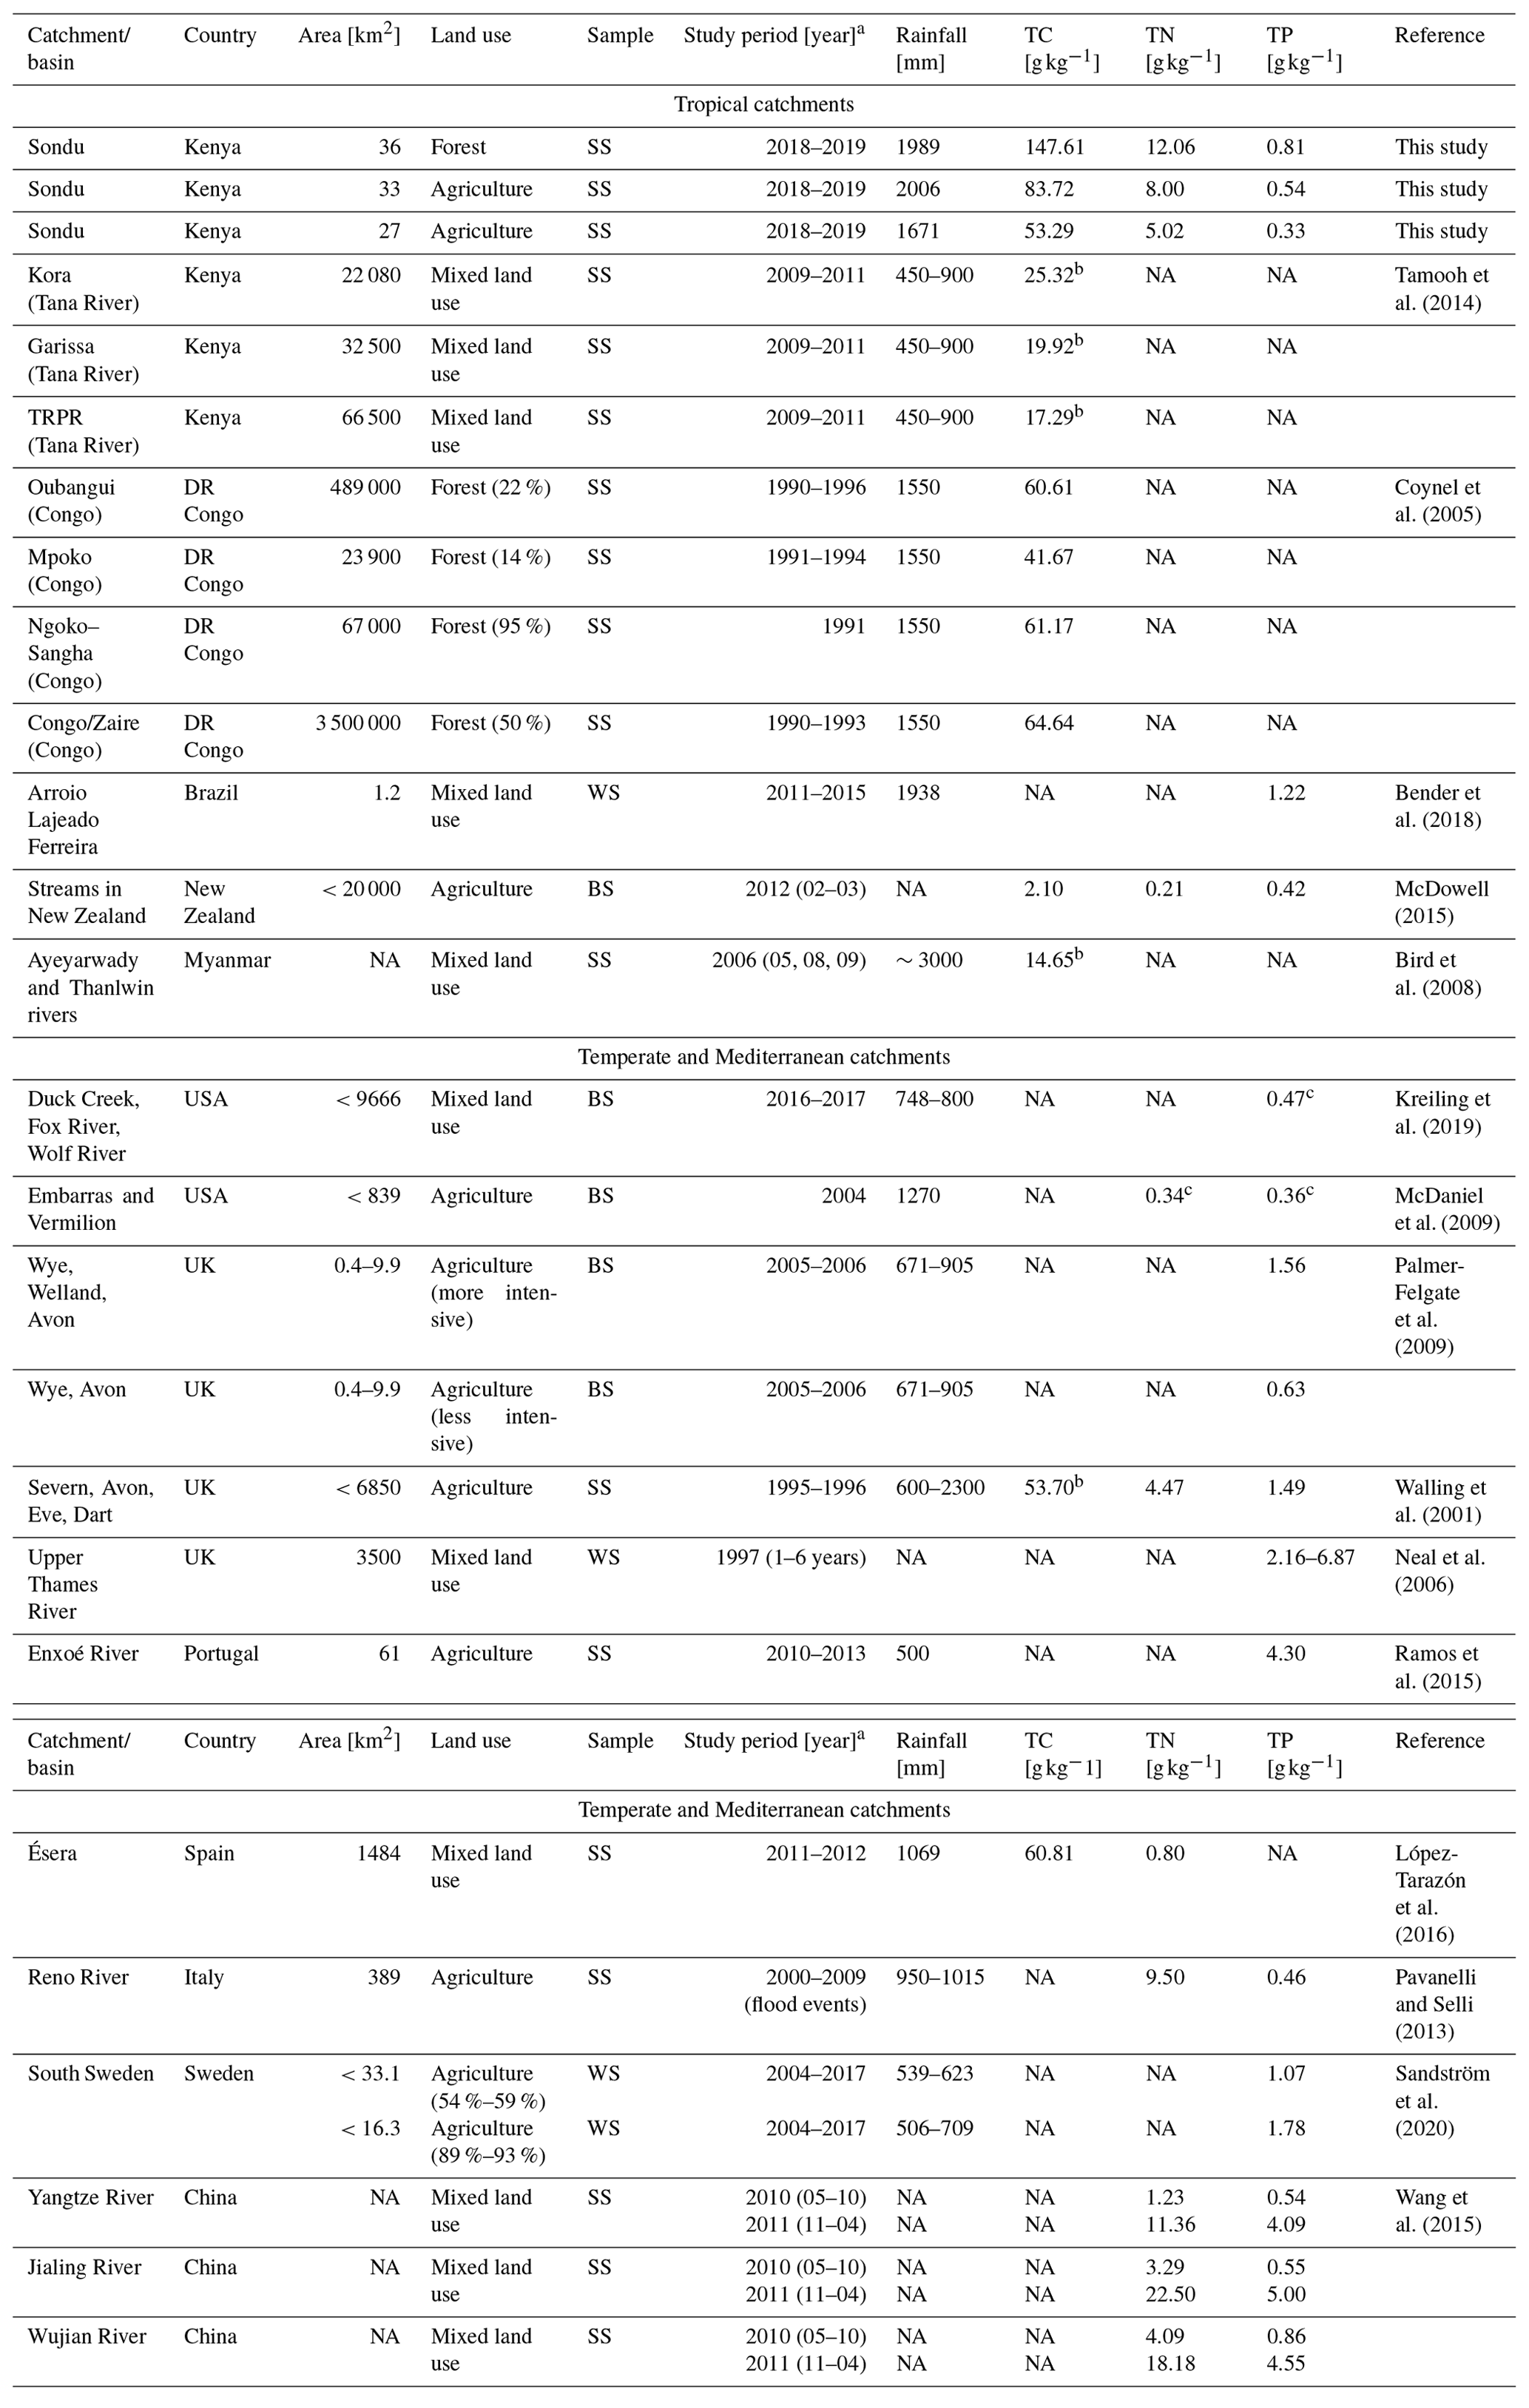
NA denotes not available. a Month of the year. b Particle organic carbon. c Concentrations presented in median.
The significant lower C:N ratio in the natural forest and tea-tree plantations in 2019 compared to 2018 might indicate a reduction in organic matter content of the sediment sources during the drier period in 2019 compared to the wet sampling period in 2018. The significantly higher C:P and N:P ratios in 2019 in the smallholder agriculture catchment suggest that the source of phosphorus originates from higher mineralization rates of organic matter and unused fertilizer from bare agricultural surfaces in the drier period of 2019 compared to the drier sampling period in 2018. The higher ratios and the relationship between TC and TN in the natural forest catchment (Fig. 6) further imply that TN is of organic origin, where a lower and similar relationship in both agricultural catchments suggests a mix of mineral and organic sediment sources. A significant relationship was observed between TC and TP for the tea-tree plantation catchment, which may indicate that the mineralization of soil organic matter contributes to the available phosphorus, as observed in the study of Maranguit et al. (2017). Similarly, the study of Johnson et al. (2018) in a forested catchment in the Piedmont region, Maryland (USA), showed that sediment sources from forest floor litter had the highest TC and TN concentrations compared to near-stream sources such as the stream bed and stream banks. The fresher material from the forest floor was likely the least degraded, resulting in higher C and nutrient concentrations (Johnson et al., 2018). Old growth forests maintain a tight nutrient cycle through high and diverse aboveground biomass. They accumulate much more organic matter and nutrients by decomposition of fresh litter material and production of humus than managed land use types where carbon inputs are smaller and losses larger (Dawson and Smith, 2007).
When compared with other monitored catchments, both within and outside the tropics, the sediments in the forested catchment were more enriched with TC, similar for TN yet depleted in TP, while the tea-tree plantation and smallholder agriculture catchments' TC and TN fell within the range reported in other studies, but TP concentrations were lower (Table 6). The TC concentrations of the natural forest catchment of our study were more than twice the concentrations recorded in the Congo Basin under disturbed and undisturbed forest cover (14 %–95 %) (Coynel et al., 2005) and of disturbed agricultural catchments in temperate regions (López-Tarazón et al., 2016; Walling et al., 2001). Other catchments of disturbed tropical basins under mixed land use (Tana River basin, Kenya, and Ayeyarwady and Thanlwin rivers, Myanmar) had lower TC concentrations (Bird et al., 2008; Tamooh et al., 2012) than the concentrations of all three catchments of this study.
The TN concentrations of the natural forest catchment were in the same range as those of subcatchments under mixed land use of the Yangtze River, Jialing River and Wujian River, China, during the wet season but exceeded the concentrations of intensified agricultural catchments in the USA, New Zealand and Spain by up to 12-fold (López-Tarazón et al., 2016; McDaniel et al., 2009; McDowell, 2015). The TN concentrations of the agricultural catchments of this study were within the ranges of concentrations in intensified temperate agricultural catchments (Pavanelli and Selli, 2013; Walling et al., 2001) (Table 6).
The particulate TP concentrations of the natural forest, tea-tree plantations and smallholder agriculture catchments were lower than those reported for a tobacco cultivated catchment in subtropical Brazil, with a TP range of 0.09–3.58 g P kg−1, with a similar mean annual rainfall of 1938 mm yr−1 (Bender et al., 2018). TP concentrations for agricultural catchments of temperate regions (Neal et al., 2006; Ramos et al., 2015; Sandström et al., 2020) and catchments in China during the wet season (Wang et al., 2015) exceeded the concentrations of our study (Table 6).
4.2 Implications of nutrient losses from agricultural soils
The low sediment-bound concentrations (TC, TN and TP) in the smallholder agriculture catchment reflect soils with much lower organic matter and nutrients than the forest due to intensive cropping without appropriate practices for restoration of soil fertility. In addition to the decline in organic matter after conversion, soils cultivated on steep hillslopes with poor soil conservation practices and excessive surface runoff are prone to erosion and further nutrient depletion (Stenfert Kroese et al., 2020b). This may have been intensified by the cultivation of a major nutrient miner, Pyrethrum daisy (Chrysanthemum cinerariifolium), following the clearance of the south-west Mau, which is known to promote surface soil erosion due to poor soil cover (Smaling et al., 1993). Similar soil nutrient losses have been observed in other densely populated tropical agricultural regions cultivated on steep hillslopes in Uganda, Tigray (Ethiopia) or Kisii County (western Kenya), caused in particular by surface erosion and insufficient use of fertilizer application (Girmay et al., 2009; Lederer et al., 2015; Smaling et al., 1993). Scarcity of land leads to an overexploitation of soil nutrients on agricultural land due to the absence of fallow periods.
There is a need for soil management practices to be focused on the retention of soil organic matter through boosting agricultural productivity, mulching or cover crops in the agricultural catchments to maintain soil fertility. Increased retention of crop residues creates a positive feedback loop for the accumulation of organic matter (Nyberg et al., 2012). Incorporating crop residues into the soil is challenging for smallholder farmers, who prefer to feed them to their livestock (Castellanos-Navarrete et al., 2015). Other management practices such as vegetative buffer strips, erosion ditches or fanya juu terracing can prevent soil erosion (Conelly and Chaiken, 2000; Tiffen et al., 1994). Improved soil stability through soil organic matter will reduce soil erosion and suspended sediments and the further loss of soil organic carbon and nutrients, and therefore integrative practices that boost the production biomass and reduce bare soil are required.
This study conducted in catchments in the headwaters of the Sondu River basin of the south-west Mau, Kenya, shows that cultivated land uses have led to a pronounced decline in sediment-associated TC, TN and TP concentrations compared to native forest. The high C:N ratio in the natural forest catchment reveals that most particulate nitrogen is of organic origin. The native forest is rich in biomass, with a tighter nutrient cycle and likely high organic matter inputs. This is in contrast to the smaller nutrient stocks in the agricultural land, reflecting nutrient losses and the impoverishment of agricultural soils. The temporal differences in observations are suggested to stem from the timing of a different sampling period in 2018 compared to 2019. The disturbance of soil through agricultural practices increases soil mineralization of soil organic matter, echoed in the lower organic matter content in suspended sediments. Despite the lower TC, TN and TP concentrations, the smallholder agriculture had the greatest particulate TC, TN and TP yields due to the higher export of suspended sediment yields passing the outlet. Elevated TC, TN and TP concentrations in sediments and in stream water contribute to nutrient pollution and eutrophication, impacting the downstream reaches such as Lake Victoria. Management practices should focus on retaining and storing soil organic matter of agricultural topsoils to increase soil organic carbon and soil nutrients. Practices to manage soil organic matter should also control soil erosion and consequently reduce suspended sediment concentrations and the loss of nutrient-rich topsoil.
The raw data are available online at https://doi.org/10.17635/lancaster/researchdata/387 (Stenfert Kroese, 2020) hosted by Lancaster University, United Kingdom.
JSK, MCR and JNQ designed the research. JSK conducted sampling and laboratory work and analysed results. JSK prepared the manuscript with input from MCR, JNQ, LB and SRJ.
The authors declare that they have no conflict of interest.
This article is part of the special issue “Tropical biogeochemistry of soils in the Congo Basin and the African Great Lakes region”. It is not associated with a conference.
We thank the German Federal Ministry for Economic Cooperation and Development (grant 81206682 “The Water Towers of East Africa: policies and practices for enhancing co-benefits from joint forest and water conservation”) and the German Science Foundation (Deutsche Forschungsgemeinschaft DFG, grant BR2238/23-1) for providing financial support for this research. This work was also partially funded by the CGIAR Program on Forest, Trees and Agroforestry led by the Centre for International Forestry Research (CIFOR). We would like to thank the tea companies, the Kenya Forest Service (KFS) and the chief of the smallholder agriculture catchment (Kuresoi sub-location), for supporting our research activities and Megan Tomlinson for assisting with fieldwork in 2018.
This research has been supported by the Bundesministerium für Wirtschaftliche Zusammenarbeit und Entwicklung (grant no. 81206682) and the Deutsche Forschungsgemeinschaft (grant no. BR2238/23-1).
This paper was edited by Sebastian Doetterl and reviewed by two anonymous referees.
Allen, S. E., Grimshaw, H. M., Parkinson, J. A., and Quarmby, C.: Chemical analysis of ecological materials, Blackwell Scientific Publications, Oxford, UK, 1974.
Amundson, R., Berhe, A. A., Hopmans, J. W., Olson, C., Sztein, A. E., and Sparks, D. L.: Soil and human security in the 21st century, Soil Sci., 348, 647–654, https://doi.org/10.1126/science.1261071, 2015.
Arias-Navarro, C., Díaz-Pinés, E., Zuazo, P., Rufino, M. C., Verchot, L. V., and Butterbach-Bahl, K.: Quantifying the contribution of land use to N2O, NO and CO2 fluxes in a montane forest ecosystem of Kenya, Biogeochemistry, 134, 95–114, https://doi.org/10.1007/s10533-017-0348-3, 2017.
Bender, M. A., dos Santos, D. R., Tiecher, T., Minella, J. P. G., de Barros, C. A. P., and Ramon, R.: Phosphorus dynamics during storm events in a subtropical rural catchment in southern Brazil, Agric. Ecosyst. Environ., 261, 93–102, https://doi.org/10.1016/j.agee.2018.04.004, 2018.
Binge, F. W.: Geology map of the Kericho area, Ministy of Natural Resources, Geol. Surv. Kenya, 86, online, available at: https://www.samsamwater.com/maps/kenya/geology.php (last access: 21 August 2020), 1949.
Binge, F. W.: Geology of the Kericho area, Geological Survey of Kenya, Nairobi, Kenya, 1962.
Bird, M. I., Robinson, R. A. J., Win Oo, N., Maung Aye, M., Lu, X. X., Higgitt, D. L., Swe, A., Tun, T., Lhaing Win, S., Sandar Aye, K., Mi Mi Win, K., and Hoey, T. B.: A preliminary estimate of organic carbon transport by the Ayeyarwady (Irrawaddy) and Thanlwin (Salween) Rivers of Myanmar, Quat. Int., 186, 113–122, https://doi.org/10.1016/j.quaint.2007.08.003, 2008.
Bowes, M. J., Armstrong, L. K., Harman, S. A., Wickham, H. D., Nicholls, D. J. E., Scarlett, P. M., Roberts, C., Jarvie, H. P., Old, G. H., Gozzard, E., Bachiller-Jareno, N., and Read, D. S.: Weekly water quality monitoring data for the River Thames (UK) and its major tributaries (2009–2013): the Thames Initiative research platform, Earth Syst. Sci. Data, 10, 1637–1653, https://doi.org/10.5194/essd-10-1637-2018, 2018.
Brandt, P., Hamunyela, E., Herold, M., de Bruin, S., Verbesselt, J., and Rufino, M. C.: Sustainable intensification of dairy production can reduce forest disturbance in Kenyan montane forests, Agr. Ecosyst. Environ., 265, 307–319, https://doi.org/10.1016/j.agee.2018.06.011, 2018.
Carter, S., Herold, M., Avitabile, V., De Bruin, S., De Sy, V., Kooistra, L., and Rufino, M. C.: Agriculture-driven deforestation in the tropics from 1990–2015: Emissions, trends and uncertainties, Environ. Res. Lett., 13, 014002, https://doi.org/10.1088/1748-9326/aa9ea4, 2018.
Castellanos-Navarrete, A., Tittonell, P., Rufino, M. C., and Giller, K. E.: Feeding, crop residue and manure management for integrated soil fertility management – A case study from Kenya, Agric. Syst., 134, 24–35, https://doi.org/10.1016/j.agsy.2014.03.001, 2015.
Chiti, T., Díaz-Pinés, E., Butterbach-Bahl, K., Marzaioli, F., and Valentini, R.: Soil organic carbon changes following degradation and conversion to cypress and tea plantations in a tropical mountain forest in Kenya, Plant Soil, 422, 527–539, https://doi.org/10.1007/s11104-017-3489-1, 2018.
Conelly, W. T. and Chaiken, M. S.: Intensive farming, agro-diversity, and food security under conditions of extreme population pressure in western Kenya, Hum. Ecol., 28, 19–51, https://doi.org/10.1023/A:1007075621007, 2000.
Coynel, A., Seyler, P., Etcheber, H., Meybeck, M., and Orange, D.: Spatial and seasonal dynamics of total suspended sediment and organic carbon species in the Congo River, Global Biogeochem. Cy., 19, 1–17, https://doi.org/10.1029/2004GB002335, 2005.
Dawson, J. J. C. and Smith, P.: Carbon losses from soil and its consequences for land-use management, Sci. Total Environ., 382, 165–190, https://doi.org/10.1016/j.scitotenv.2007.03.023, 2007.
Don, A., Schumacher, J., and Freibauer, A.: Impact of tropical land-use change on soil organic carbon stocks – a meta-analysis, Glob. Change Biol., 17, 1658–1670, https://doi.org/10.1111/j.1365-2486.2010.02336.x, 2011.
Drewry, J. J., Newham, L. T. H., and Croke, B. F. W.: Suspended sediment, nitrogen and phosphorus concentrations and exports during storm-events to the Tuross estuary, Australia, J. Environ. Manage., 90, 879–887, https://doi.org/10.1016/j.jenvman.2008.02.004, 2009.
Dunne, T.: Sediment yield and land use in tropical catchments, J. Hydrol., 42, 281–300, https://doi.org/10.1016/0022-1694(79)90052-0, 1979.
Esri: DigitalGlobe, GeoEye, EarthstarGeographics, cNESAirbus DS, USDA, USGS, AeroGRID, IGN and the GIS User Community, World Imagery, online, available at: https://www.arcgis.com/home/item.html?id=10df2279f9684e4a9f6a7f08febac2a9, last access: 22 September 2020.
Evans, D., Quinton, J., Davies, J., Zhao, J., and Govers, G.: Soil lifespans and how they can be extended by land use and management change, Environ. Res. Lett., 15, 0940b2, https://doi.org/10.1088/1748-9326/aba2fd, 2020.
Freibauer, A., Rounsevell, M. D. A., Smith, P., and Verhagen, J.: Carbon sequestration in the agricultural soils of Europe, Geoderma, 122, 1–23, https://doi.org/10.1016/j.geoderma.2004.01.021, 2004.
Gellis, A. C., Hupp, C. R., Pavich, M. J., Landwehr, J. M., Banks, W. S. L., Hubbard, B. E., Langland, M. J., Ritchie, J. C., and Reuter, J. M.: Sources, transport, and storage of sediment at selected sites in the Chesapeake Bay Watershed, U. S. Geol. Surv. Sci. Investig. Rep., 2008–5186, 95, online, available at: https://www.researchgate.net/publication/283712181_Sources_Transport_and_Storage_of_Sediment_at_Selected_Sites_in_the_Chesapeake_Bay_Watershed (last access: 18 February 2020), 2009.
Girmay, G., Singh, B. R., Nyssen, J., and Borrosen, T.: Runoff and sediment-associated nutrient losses under different land uses in Tigray, Northern Ethiopia, J. Hydrol., 376, 70–80, https://doi.org/10.1016/j.jhydrol.2009.07.066, 2009.
Harrington, S. T. and Harrington, J. R.: Dissolved and particulate nutrient transport dynamics of a small Irish catchment: the River Owenabue, Hydrol. Earth Syst. Sci., 18, 2191–2200, https://doi.org/10.5194/hess-18-2191-2014, 2014.
Horowitz, A. J.: Determining annual suspended sediment and sediment-associated trace element and nutrient fluxes, Sci. Total Environ., 400, 315–343, https://doi.org/10.1016/J.SCITOTENV.2008.04.022, 2008.
Hunink, J. and Droogers, P.: Physiographical baseline survey for the Upper Tana catchment: erosion and sediment yield assessment: Report, Wageningen, the Netherlands, available at: https://www.futurewater.nl/publication/physiographical-baseline-survey-for-the-upper-tana-catchment-erosion-and-sediment-yield-assessment/ (last access: 8 September 2020), 2011.
ISRIC: Soil and terrain database for Kenya (KENSOTER), version 2.0, at scale 1 : 1 million, Wageningen, the Netherlands, Kenya Agric. Res. Inst., available at: https://data.isric.org/geonetwork/srv/api/records/73e27136-9efe-49e4-af35-fd98b841d467 (last access: 22 September 2020), 2004.
Jacobs, S. R., Weeser, B., Guzha, A. C., Rufino, M. C., Butterbach-Bahl, K., Windhorst, D., and Breuer, L.: Using high-resolution data to assess land use impact on nitrate dynamics in East African tropical montane catchments, Water Resour. Res., 54, 1812–1830, https://doi.org/10.1002/2017WR021592, 2018.
Jarvie, H. P., Sharpley, A. N., Flaten, D., and Kleinman, P. J. A.: Phosphorus mirabilis: illuminating the past and future of phosphorus stewardship, J. Environ. Qual., 48, 1127–1132, https://doi.org/10.2134/jeq2019.07.0266, 2019.
Jennings, D. J.: Geology map of the Molo area, Ministry of Natural Resources, Geol. Surv. Kenya, online, available at: https://www.samsamwater.com/maps/kenya/geology.php (last access: 22 September 2020), 1962.
Johnson, E. R., Inamdar, S., Kan, J., and Vargas, R.: Particulate organic matter composition in stream runoff following large storms: role of POM sources, particle size, and event characteristics, J. Geophys. Res.-Biogeo., 123, 660–675, https://doi.org/10.1002/2017JG004249, 2018.
Kreiling, R. M., Thoms, M. C., Bartsch, L. A., Richardson, W. B., and Christensen, V. G.: Complex response of sediment phosphorus to land use and management within a river network, J. Geophys. Res.-Biogeo., 124, 1764–1780, https://doi.org/10.1029/2019JG005171, 2019.
Lederer, J., Karungi, J., and Ogwang, F.: The potential of wastes to improve nutrient levels in agricultural soils: a material flow analysis case study from Busia District, Uganda, Agric. Ecosyst. Environ., 207, 26–39, https://doi.org/10.1016/j.agee.2015.03.024, 2015.
Leys, C., Ley, C., Klein, O., Bernard, P., and Licata, L.: Detecting outliers: Do not use standard deviation around the mean, use absolute deviation around the median, J. Exp. Soc. Psychol., 49, 764–766, https://doi.org/10.1016/J.JESP.2013.03.013, 2013.
López-Tarazón, J. A., López, P., Lobera, G., and Batalla, R. J.: Suspended sediment, carbon and nitrogen transport in a regulated Pyrenean river, Sci. Total Environ., 540, 133–143, https://doi.org/10.1016/j.scitotenv.2015.06.132, 2016.
Lung'ayia, H., Sitoki, L., and Kenyanya, M.: The nutrient enrichment of Lake Victoria (Kenyan waters), Hydrobiolgia, 458, 75–82, https://doi.org/10.1023/A:1013128027773, 2001.
Mainstone, C. P. and Parr, W.: Phosphorus in rivers – ecology and management, Sci. Total Environ., 282–283, 25–47, https://doi.org/10.1016/S0048-9697(01)00937-8, 2002.
Maranguit, D., Guillaume, T., and Kuzyakov, Y.: Land-use change affects phosphorus fractions in highly weathered tropical soils, Catena, 149, 385–393, https://doi.org/10.1016/j.catena.2016.10.010, 2017.
Marx, A., Dusek, J., Jankovec, J., Sanda, M., Vogel, T., van Geldern, R., Hartmann, J., and Barth, J. A. C.: A review of CO2 and associated carbon dynamics in headwater streams: a global perspective, Rev. Geophys., 55, 560–585, https://doi.org/10.1002/2016RG000547, 2017a.
Marx, A., van Geldern, R., and Barth, J.: Small streams make big contribution to carbon cycle, Eos (Washington, DC), 98, https://doi.org/10.1029/2018EO078009, 2017b.
McDaniel, M. D., David, M. B., and Royer, T. V.: Relationships between benthic sediments and water column phosphorus in Illinois streams, J. Environ. Qual., 38, 607–617, https://doi.org/10.2134/jeq2008.0094, 2009.
McDowell, R. W.: Relationship between sediment chemistry, equilibrium phosphorus concentrations, and phosphorus concentrations at baseflow in rivers of the New Zealand national river water quality network, J. Environ. Qual., 44, 921–929, https://doi.org/10.2134/jeq2014.08.0362, 2015.
Mogaka, H., Gichere, S., Davis, R., and Hirji, R.: Climate variability and water resources degradation in Kenya: improving water resources development and management, World Bank, Washington, DC, 2006.
Moran, C., Prosser, I., DeRose, R., Lu, H., Croke, B., Hughes, A., Olley, J., and Cannon, G.: Sediments and nutrients in the rivers of the Murray-Darling Basin: targeting the future. Murray-Darling Commission Knowledge Series 14/05, Murray-Darling Basin Commission, Canberra, ISBN: 1 921038 46 2, edited by: Kim Wells, Forestry and Ecology, 2005.
Murty, D., Kirschbaum, M. U. F., Mcmurtrie, R. E., and Mcgilvray, H.: Does conversion of forest to agricultural land change soil carbon and nitrogen? A review of the literature, Glob. Change Biol., 8, 105–123, https://doi.org/10.1046/j.1354-1013.2001.00459.x, 2002.
Mutuo, P. K., Smithson, P. C., Buresh, R. J., and Okalebo, R. J.: Comparison of phosphate rock and triple superphosphate on a phosphorus-deficient Kenyan soil, Commun. Soil Sci. Plant Anal., 30, 1091–1103, https://doi.org/10.1080/00103629909370270, 1999.
Neal, C., Neal, M., Leeks, G. J. L., Old, G., Hill, L., and Wickham, H.: Suspended sediment and particulate phosphorus in surface waters of the upper Thames Basin, UK, J. Hydrol., 330, 142–154, https://doi.org/10.1016/j.jhydrol.2006.04.016, 2006.
Nyberg, G., Bargués Tobella, A., Kinyangi, J., and Ilstedt, U.: Soil property changes over a 120-yr chronosequence from forest to agriculture in western Kenya, Hydrol. Earth Syst. Sci., 16, 2085–2094, https://doi.org/10.5194/hess-16-2085-2012, 2012.
Okalebo, J. R., Othieno, C. O., Maritim, H. K., Iruria, D. M., Kipsat, M. J., Kisinyo, P. O., Kimenye, L., Woomer, P. L., Mukhwana, E. J., Batiano, A., Adipala, E., Njoroge, R. K., Thuita, M., Nekesa, A. O., and Ruto, E. C.: Management of soil fertility in western Kenya: experience working with smallholder farmers, African Crop Sci. Conf. Proc., Kampala, Uganda, December 2005, 7, 1465–1473, available at: https://www.researchgate.net/publication/281081038_Management_of_soil_fertility_in_western_Kenya_Experience_working_with_smallholder_farmers (last access: 10 September 2020), 2005.
Owuor, S. O., Butterbach-Bahl, K., Guzha, A. C., Jacobs, S., Merbold, L., Rufino, M. C., Pelster, D. E., Díaz-Pinés, E., and Breuer, L.: Conversion of natural forest results in a significant degradation of soil hydraulic properties in the highlands of Kenya, Soil Till. Res., 176, 36–44, https://doi.org/10.1016/J.STILL.2017.10.003, 2018.
Palmer-Felgate, E. J., Jarvie, H. P., Withers, P. J. A., Mortimer, R. J. G., and Krom, M. D.: Stream-bed phosphorus in paired catchments with different agricultural land use intensity, Agric. Ecosyst. Environ., 134, 53–66, https://doi.org/10.1016/j.agee.2009.05.014, 2009.
Pasley, H. R., Cairns, J. E., Camberato, J. J., and Vyn, T. J.: Nitrogen fertilizer rate increases plant uptake and soil availability of essential nutrients in continuous maize production in Kenya and Zimbabwe, Nutr. Cycl. Agroecosystems, 115, 373–389, https://doi.org/10.1007/s10705-019-10016-1, 2019.
Pavanelli, D. and Selli, L.: Effective size characteristics of suspended sediment and nutrient concentrations during flood events in the Reno River Tributaries (Northern Italy), Procedia Environ. Sci., 19, 723–732, https://doi.org/10.1016/j.proenv.2013.06.081, 2013.
Penny, R.: Desertification and deforestation in Africa, in Land use, land cover and soil sciences, pp. 201–219, UNESCO-Encyclopedia of Life Support Systems (EOLSS), online, available at: http://www.eolss.net/ebooklib/cart.aspx (last access: 23 January 2020), 2009.
Phillips, J. M., Russell, M. A., and Walling, D. E.: Time-integrated sampling of fluvial suspended sediment: a simple methodology for small catchments, Hydrol. Process., 14, 2589–2602, https://doi.org/10.1002/1099-1085(20001015)14:14<2589::AID-HYP94>3.0.CO;2-D, 2000.
Powlson, D. S., Gregory, P. J., Whalley, W. R., Quinton, J. N., Hopkins, D. W., Whitmore, A. P., Hirsch, P. R., and Goulding, K. W. T.: Soil management in relation to sustainable agriculture and ecosystem services, Food Policy, 36, S72–S87, https://doi.org/10.1016/j.foodpol.2010.11.025, 2011.
Quinton, J. N., Catt, J. A., and Hess, T. M.: The selective removal of phosphorus from soil, J. Environ. Qual., 30, 538, https://doi.org/10.2134/jeq2001.302538x, 2001.
R Development Core Team: R: A language and environment for statistical computing. R Foundation for Statistical Computing, Vienna, Austria, available at: https://www.R-project.org/ (last access: 10 September 2020), 2017.
Ramos, T. B., Gonçalves, M. C., Branco, M. A., Brito, D., Rodrigues, S., Sánchez-Pérez, J. M., Sauvage, S., Prazeres, Â., Martins, J. C., Fernandes, M. L., and Pires, F. P.: Sediment and nutrient dynamics during storm events in the Enxoé temporary river, southern Portugal, Catena, 127, 177–190, https://doi.org/10.1016/j.catena.2015.01.001, 2015.
Rodríguez-Blanco, M. L., Taboada-Castro, M. M., Taboada-Castro, M. T., and Oropeza-Mota, J. L.: Relationships between phosphorus and suspended sediment concentrations in a stream draining a rural area in NW Spain, Commun. Soil Sci. Plant Anal., 46, 339–345, https://doi.org/10.1080/00103624.2014.989105, 2015.
Russell, M. A., Walling, D. E., and Hodgkinson, R. A.: Suspended sediment sources in two small lowland agricultural catchments in the UK, J. Hydrol., 252, 1–24, https://doi.org/10.1016/S0022-1694(01)00388-2, 2001.
Saiz, G., Wandera, F. M., Pelster, D. E., Ngetich, W., Okalebo, J. R., Rufino, M. C., and Butterbach-Bahl, K.: Long-term assessment of soil and water conservation measures (Fanya-juu terraces) on soil organic matter in South Eastern Kenya, Geoderma, 274, 1–9, https://doi.org/10.1016/j.geoderma.2016.03.022, 2016.
Sandström, S., Futter, M. N., Kyllmar, K., Bishop, K., O'Connell, D. W., and Djodjic, F.: Particulate phosphorus and suspended solids losses from small agricultural catchments: Links to stream and catchment characteristics, Sci. Total Environ., 711, 134616, https://doi.org/10.1016/j.scitotenv.2019.134616, 2020.
Scanlon, T. M., Kiely, G., and Xie, Q.: A nested catchment approach for defining the hydrological controls on non-point phosphorus transport, J. Hydrol., 291, 218–231, https://doi.org/10.1016/j.jhydrol.2003.12.036, 2004.
Smaling, E. M. A., Stoorvogel, J. J., and Windmeijer, P. N.: Calculating soil nutrient balances in Africa at different scales – II. District scale, Fertil. Res., 35, 237–250, https://doi.org/10.1007/BF00750642, 1993.
Smith, D. R., Jarvie, H. P., and Bowes, M. J.: Carbon, nitrogen, and posphorus stoichiometry and eutrophication in River Thames tributaries, UK, Agric. Environ. Lett., 2, 1–4, https://doi.org/10.2134/ael2017.06.0020, 2017.
Smith, V. H. and Schindler, D. W.: Eutrophication science: where do we go from here?, Trends Ecol. Evol., 24, 201–207, https://doi.org/10.1016/j.tree.2008.11.009, 2009.
Sombroek, W. G., Braun, H. M. H., and van der Pouw, B. J.: Exploratory soil map and agro-climatic zone map of Kenya, 1980, scale 1:1 000 000, E1 ed., Ministry of Agriculture – National Agricultural Laboratories, Kenya., 1982.
Stenfert Kroese, J.: Macronutrient (TC, TN and TP) concentrations and time series of rainfall, discharge and suspended sediment concentrations of 2018 and 2019, Lancaster University, https://doi.org/10.17635/lancaster/researchdata/387, 2020.
Stenfert Kroese, J., Batista, P. V. G., Jacobs, S. R., Breuer, L., Quinton, J. N., and Rufino, M. C.: Agricultural land is the main source of stream sediments after conversion of an African montane forest, Sci. Rep., 10, 1–15, https://doi.org/10.1038/s41598-020-71924-9, 2020a.
Stenfert Kroese, J., Jacobs, S., Tych, W., Breuer, L., Quinton, J. N., and Rufino, M. C.: Tropical montane forest conversion is a critical driver for sediment supply in East African catchments, Water Resour. Res., 56, 1–20, https://doi.org/10.1029/2020WR027495, 2020b.
Tamene, L., Park, S. J., Dikau, R., and Vlek, P. L. G.: Reservoir siltation in the semi-arid highlands of northern Ethiopia sediment yield-catchment area relationship and a semi-quantitative approach for predecting sediment yield, Earth Surf. Process. Landforms, 31, 1364–1383, https://doi.org/10.1002/esp.1338, 2006.
Tamooh, F., Van den Meersche, K., Meysman, F., Marwick, T. R., Borges, A. V., Merckx, R., Dehairs, F., Schmidt, S., Nyunja, J., and Bouillon, S.: Distribution and origin of suspended matter and organic carbon pools in the Tana River Basin, Kenya, Biogeosciences, 9, 2905–2920, https://doi.org/10.5194/bg-9-2905-2012, 2012.
Tamooh, F., Meysman, F. J. R., Borges, A. V., Marwick, T. R., Van Den Meersche, K., Dehairs, F., Merckx, R., and Bouillon, S.: Sediment and carbon fluxes along a longitudinal gradient in the lower Tana River (Kenya), J. Geophys. Res.-Biogeo., 119, 1340–1353, https://doi.org/10.1002/2013JG002358, 2014.
Tiffen, M., Mortimore, M., and Gichuki, F.: More people, less erosion: environmental recovery in Kenya, African Centre for Technology Studies (ACTS) Press, Nairobi, Kenya, 1994.
Tully, K., Sullivan, C., Weil, R., and Sanchez, P.: The state of soil degradation in sub-Saharan Africa: baselines, trajectories, and solutions, Sustainability, 7, 6523–6552, https://doi.org/10.3390/su7066523, 2015.
UNEP: Mau Complex and Marmanet forests, Environmental and economic contributions, current state and trends. Briefing notes compiled by the team that participated in the reconnaissance flight on 7 May 2008, in consultation with relevant government departments, Nairobi, Kenya, available at: http://hdl.handle.net/20.500.11822/28379 (last access: 15 October 2020), 2008.
USGS: Shuttle Radar Topography Mission (SRTM) 1 Arc-Second Global, US Geological Survey, Reston, Virginia, USA, 2000.
Vanmaercke, M., Poesen, J., Broeckx, J., and Nyssen, J.: Sediment yield in Africa, Earth-Science Rev., 136, 350–368, https://doi.org/10.1016/j.earscirev.2014.06.004, 2014.
Walling, D. E., Webb, B. W., and Russell, M. A.: Sediment-associated nutrient transport in UK rivers, in: Freshwater Contamination, vol. 243, 69–81, IAHS Publ, Rabat, Morocco, 1997.
Walling, D. E., Russell, M. A., and Webb, B. W.: Controls on the nutrient content of suspended sediment transported by British rivers, Sci. Total Environ., 266, 113–123, https://doi.org/10.1016/S0048-9697(00)00746-4, 2001.
Wang, X. Q., Liu, Z. C., Miao, J. L., and Zuo, N.: Relationship between nutrient pollutants and suspended sediments in upper reaches of Yangtze River, Water Sci. Eng., 8, 121–126, https://doi.org/10.1016/j.wse.2015.04.003, 2015.
Wanyama, I., Pelster, D. E., Arias-Navarro, C., Butterbach-Bahl, K., Verchot, L. V., and Rufino, M. C.: Management intensity controls soil N2O fluxes in an Afromontane ecosystem, Sci. Total Environ., 624, 769–780, https://doi.org/10.1016/j.scitotenv.2017.12.081, 2018.
Weil, R. R. and Brady, N. C.: The nature and properties of soils, 15th edn., edited by: Fox, D., Pearson, Columbus, 2016.
Withers, P. J. A., Edwards, A. C., and Foy, R. H.: Phosphorus cycling in UK agriculture and implications for phosphorus loss from soil, Soil Use Manag., 17, 139–149, https://doi.org/10.1111/j.1475-2743.2001.tb00020.x, 2001.
Zhou, M., Brandt, P., Pelster, D., Rufino, M. C., Robinson, T., and Butterbach-Bahl, K.: Regional nitrogen budget of the Lake Victoria Basin, East Africa: Syntheses, uncertainties and perspectives, Environ. Res. Lett., 9, 105009, https://doi.org/10.1088/1748-9326/9/10/105009, 2014.