the Creative Commons Attribution 4.0 License.
the Creative Commons Attribution 4.0 License.
 | 21 Jul 2021
Nutrient limitations regulate soil greenhouse gas fluxes from tropical forests: evidence from an ecosystem-scale nutrient manipulation experiment in Uganda
Joseph Tamale
Roman Hüppi
Marco Griepentrog
Laban Frank Turyagyenda
Matti Barthel
Sebastian Doetterl
Peter Fiener
Oliver van Straaten
Soil macronutrient availability is one of the abiotic controls that alters the exchange of greenhouse gases (GHGs) between the soil and the atmosphere in tropical forests. However, evidence on the macronutrient regulation of soil GHG fluxes from central African tropical forests is still lacking, limiting our understanding of how these biomes could respond to potential future increases in nitrogen (N) and phosphorus (P) deposition. The aim of this study was to disentangle the regulation effect of soil nutrients on soil GHG fluxes from a Ugandan tropical forest reserve in the context of increasing N and P deposition. Therefore, a large-scale nutrient manipulation experiment (NME), based on 40 m×40 m plots with different nutrient addition treatments (N, P, N + P, and control), was established in the Budongo Central Forest Reserve. Soil carbon dioxide (CO2), methane (CH4), and nitrous oxide (N2O) fluxes were measured monthly, using permanently installed static chambers, for 14 months. Total soil CO2 fluxes were partitioned into autotrophic and heterotrophic components through a root trenching treatment. In addition, soil temperature, soil water content, and nitrates were measured in parallel to GHG fluxes. N addition (N and N + P) resulted in significantly higher N2O fluxes in the transitory phase (0–28 d after fertilization; p<0.01) because N fertilization likely increased soil N beyond the microbial immobilization and plant nutritional demands, leaving the excess to be nitrified or denitrified. Prolonged N fertilization, however, did not elicit a significant response in background (measured more than 28 d after fertilization) N2O fluxes. P fertilization marginally and significantly increased transitory (p=0.05) and background (p=0.01) CH4 consumption, probably because it enhanced methanotrophic activity. The addition of N and P (N + P) resulted in larger CO2 fluxes in the transitory phase (p=0.01), suggesting a possible co-limitation of both N and P on soil respiration. Heterotrophic (microbial) CO2 effluxes were significantly higher than the autotrophic (root) CO2 effluxes (p<0.01) across all treatment plots, with microbes contributing about two-thirds of the total soil CO2 effluxes. However, neither heterotrophic nor autotrophic respiration significantly differed between treatments. The results from this study suggest that the feedback of tropical forests to the global soil GHG budget could be disproportionately altered by increases in N and P availability over these biomes.
- Article
(671 KB) - Full-text XML
- BibTeX
- EndNote


Tropical forest soils play an important role in the Earth's radiative balance by sequestering and releasing significant amounts of carbon dioxide (CO2), methane (CH4), and nitrous oxide (N2O; Mosier et al., 2004). It is estimated that tropical forest soils emit about 1.3±0.3 Tg N2O yr−1 (Butterbach-Bahl et al., 2004), capture 6.4 Tg CH4 yr−1 (Dutaur and Verchot, 2007), sequester about 10 % of the total atmospheric CO2 via photosynthesis, and account for about 30 % of the world's soil C stocks (Jobbágy and Jackson, 2000; Malhi and Phillips, 2004).
The rate and magnitude of the specific plant and soil microbial processes that produce (CO2 – autotrophic and heterotrophic respiration; N2O – denitrification and nitrification; CH4 – enteric fermentation and methanogenesis) and consume (CO2 – photosynthesis; CH4 – oxidation) greenhouse gases (GHGs) in and at the soil–atmospheric interface are constrained by a multiplicity of biotic and abiotic controls (Mosier et al., 2004). These controls include vegetation communities (Veber et al., 2018), soil moisture (Sjögersten et al., 2018), soil temperature (Holland et al., 2000), geochemistry, given its control on microbial abundance (Gray et al., 2014) and soil organic carbon stabilization (Doetterl et al., 2015), and macronutrient availability (especially N and P; Oertel et al., 2016).
Macronutrient replenishment in undisturbed tropical forests is inherently via litter input (for both N and P; Tanner et al., 1998) and rock weathering (for P; Hedin et al., 2003) processes. However, the past 3 decades have seen an increase in the levels of N and P deposition over most tropical regions (including central Africa) due to widespread deforestation and biomass burning (Bauters et al., 2019; Galloway et al., 2004). Currently, the central African region receives about 18.5 kg N ha−1 (Bauters et al., 2019) and 1.8–2.5 kg P ha−1 (Tamatamah et al., 2005) each year due to high fire-derived N deposition (Bauters et al., 2019) and P-rich biomass aerosols (Barkley et al., 2019), respectively. Increased anthropogenic N and P deposition over tropical forest biomes disrupts ecosystem stoichiometric equilibrium, thereby affecting the biogeochemical cycling of N and P (Bauters et al., 2019) and the exchange of GHGs between the soil and atmosphere (Corre et al., 2014). One way of understanding how increases in N and P availability (for instance, through deposition) affect soil GHG fluxes from tropical forests is through large-scale nutrient manipulation experiments (NMEs). NMEs purposely use large doses of N and P (e.g., Cleveland and Townsend, 2006 – 150 and 150 ; Hall and Matson, 2003 – 100 and 40 ) to simulate how future nutrient enrichment of tropical forests (through deposition) could affect soil GHG fluxes (among other ecosystem processes; Corre et al., 2010).
To date, several NMEs have been carried out across the tropics (e.g., Corre et al., 2010; Wei et al., 2008), and the outcome has been a consensus that the addition of N to an already N-rich tropical forest ecosystem results in increased N2O emissions (Corre et al., 2014; Martinson et al., 2013; Zhang et al., 2008). For N-rich forest ecosystems, an increase in available soil N beyond the microbial immobilization and plant nutritional demands results in the excess being nitrified or (and) denitrified by soil microbes (Corre et al., 2014). However, several studies suggest that the increased availability of N not only reduces fine root biomass but also curtails microbial activity, leading to reduced autotrophic (Cusack et al., 2011) and heterotrophic respiration (Chen et al., 2010; DeForest et al., 2006; Koehler et al., 2009a), respectively. Notably, there are varying results on how N addition affects CH4 uptake from tropical forest soils. For instance, Veldkamp et al. (2013) found no effect of N on CH4 uptake, while Du et al. (2019) measured reduced CH4 consumption following the addition of N to a tropical forest, with the latter study suggesting an inhibitory effect of N on CH4 uptake (Bodelier and Steenbergh, 2014; Seghers et al., 2003; Zhang et al., 2011). Aronson and Helliker (2010) argue that the observed differences in the measured CH4 fluxes in the two separate studies were likely due to the different amounts of N added in the respective experimental setups. They argued that low amounts of N stimulate CH4 uptake, while high amounts inhibit it.
With respect to P, it has been shown that P availability opens up the N cycle by stimulating soil organic matter mineralization, releasing excess N for soil nitrification or (both) denitrification processes (Mori et al., 2010). It is also urged that P availability has a positive effect on both autotrophic and heterotrophic components of soil respiration (Mori et al., 2013). P not only stimulates fine root growth (Chen et al., 2010) but also regulates organic matter decomposition (Mori et al., 2018). However, studies elucidating the P limitation of organic matter decomposition in the P-deficient tropics remain rare, and even the few available studies on the regulation effect of P on leaf litter mass loss rates are inconclusive (Cleveland and Townsend, 2006). This might explain why contrasting results were reported from two similar experiments carried out on P-depleted soils in Hawaii (Hobbie and Vitousek, 2000) and the Brazilian Amazon (McGroddy et al., 2008). Hobbie and Vitousek (2000) reported an increase in the litter mass loss rate, while McGroddy et al. (2008) did not detect any change, suggesting that the relationship between P availability and organic matter decomposition is complex (Cleveland and Townsend, 2006). Similarly, the literature on the interaction between N and P in regulating CH4 fluxes from tropical forests remains limited.
Despite the recognition that N and P affect soil GHG fluxes, and the fact that tropical forest ecosystems could subtly respond to potential future increases in N and P deposition (Bobbink et al., 2010; Li et al., 2006), the magnitude and direction of this response remains unclear for African tropical forests. To date, only a handful of NMEs focusing on tropical forests response to shifts in ecosystem N and P dynamics have been carried out. Of these studies, just a few included both N and P treatments in their experimental setups (e.g., Corre et al., 2014). Yet, P deficiency typical of tropical soils can have direct impacts on ecosystem biomass production if the limitation is lifted (John et al., 2007). Furthermore, nearly all the studies conducted in (sub-)tropical forest ecosystems were, so far, concentrated in China (Jiang et al. 2016; Yan et al., 2008; Zheng et al., 2016), Central America (Corre et al., 2014; Koehler et al., 2009a; Matson et al., 2014), and South America (Martinson et al., 2013; Müller et al., 2015; Wolf et al., 2011).
Unfortunately, no single controlled experiment has simulated the effects of elevated soil nutrient inputs on soil greenhouse gas fluxes from African tropical forests, despite the projected increase in N and P deposition over these biomes (Galloway et al., 2004) and the fact that they represent a significant proportion of global tropical forests (27 %; Saatchi et al., 2011). It was for this reason that a replicated, completely randomized NME was established in a Ugandan tropical forest reserve to investigate the role N and P have in regulating soil GHG fluxes in the context of changing N and P deposition rates over the tropics. In the following, it was hypothesized that:
-
the addition of N or N + P to a tropical forest ecosystem would result in increased N2O emissions coming from the excess availability of bio-available N beyond microbial immobilization and plant N demands, decreased CH4 uptake due to negative effects of N addition on soil methanotrophs, and reduced CO2 effluxes largely attributed to reduction in both root and microbial respiration upon the addition of N;
-
the addition of P to a tropical forest ecosystem would stimulate the release of N from soil organic matter and, consequently, lead to increased N2O emissions, higher CO2 effluxes linked to increased root activity and decomposition of soil organic matter, and increased CH4 uptake due to stimulation of methanotrophic activity.
2.1 Study site description
The study was conducted in the Budongo Central Forest Reserve, a semi-deciduous tropical forest, located in the northwestern part of Uganda ( N, E). The forest reserve spans over 825 km2 and is extensively diverse with respect to forest communities, with Cynometra alexandri, Chrysophyllum albidum, Maesopsis eminii, and Diospyros abyssinica as the dominant tree species (Eggeling, 1947). The long-term mean annual temperature and precipitation over the study area is 25 ∘C and 1700 mm, respectively (Lukwago et al., 2020). Rainfall is distributed into two rainy seasons (i.e., March to May and August to November) punctuated by a strong dry season (December to February) and a weak dry season (June to July; Lukwago et al., 2020). It is worth noting that the amount of rainfall received during the field campaign (2385 mm; Fig. 2d) was higher than the long-term mean annual precipitation for this region. The weather data for the experiment period were obtained from a climatic station installed at the Budongo Conservation Field station (2 km northwest of the study site) and was beneficial for understanding how precipitation constrained soil greenhouse gas fluxes given its direct control on water filled pore space. The soils at the experimental site are highly weathered, are classified as Lixisols (IUSS Working Group WRB, 2014), and are developed on a Precambrian gneissic–granulitic basement complex (van Straaten, 1976).
2.2 Experimental design
The study was conducted within the framework of a running nutrient manipulation experiment (NME). The NME study used a completely randomized design to investigate how the three macronutrients (applied individually as nitrogen, phosphorus, and potassium and in all possible combinations, i.e., N + P, N + K, P + K, and N + P + K, as treatments) constrained key ecosystem processes (particularly nutrient cycling and net primary productivity) in comparison to the unamended control. Each of the eight treatments was replicated four times (hence, n=32 plots; eight treatments × four replications). While the NME included a K treatment, the soil GHG flux study (the basis for this paper) was conducted on the N, P and N + P (combination of N and P) plots and compared to the untreated control plots (n=16). Only N and P (among nutrient addition plots) were exclusively considered for soil GHG flux measurements because their availability has been shown to limit soil greenhouse gas fluxes from tropical forest biomes. Each treatment plot measured 40 m×40 m in size but measurements were conducted in the inner measurement core (30 m×30 m) to avoid boundary effects. A spacing of at least 40 m between experimental plots was ensured to prevent spillover of applied nutrients from the neighboring plots. In order to elicit an ecosystem response, N was applied at a rate of 125 , in the form of urea ((NH2)2CO), and P at 50 , as triple superphosphate (Ca(H2PO4)2). The types of fertilizers and application rates used in this study were identical to those used in the Wright et al. (2011) NME. The fertilizer was applied by hand and in four split dozes every year. Specifically, 31.3 kg N ha−1 and 12.5 kg P ha−1 were applied to the plots of the NME every 3 months between May 2018 and June 2020.
2.3 Baseline soil physico-biochemical characterization
Prior to the first fertilizer application, soil samples were taken from all the treatment plots of the NME (for the top soils) and from the close proximity of the NME (for deeper soil layers) for baseline soil physico-biochemical analyses. The analyses included texture, bulk density, soil pH, total soil organic carbon (TOC) stocks, total nitrogen stocks, C N ratio, exchangeable bases, effective cation exchange capacity (ECEC), and Bray-extractable P. For the top soils (0–10 cm depth), soil monoliths () were carefully taken from 10 different locations within each plot of the NME (n=32 plots) using a spade. For deeper soil layers (0–30 and 30–50 cm), samples were obtained outside the established NME plots in order to minimize modifications to the microenvironment inside the NME plots. Deeper soil sampling was done during a reconnaissance survey conducted at approximately 500 m from the current location of the NME site. During the reconnaissance survey, 16 plots (n=16) were established and samples were taken from five different locations in each plot for every depth interval (i.e., 0–30 and 30–50 cm) using an auger (diameter=30 mm). The samples from the same depth within each plot were mixed thoroughly in a basin, and about 500 g of the homogenized samples were sent to the soils laboratory of the University of Göttingen, Germany, for analysis. Soil texture was determined using a Bouyoucos hydrometer. Soil pH was determined in a 1:2.5 (soil water) suspension. Soil bulk density for every depth in each plot was calculated from the mass of oven-dried soil (at 105 ∘C for 48 h) and the volume of the Kopecky ring (volume=251 cm3) used in collecting the soil sample. Note that soil bulk density was corrected for stone content. The soils were tested for the presence of inorganic carbon (IC) using dilute hydrochloric acid and were found to be devoid of any IC. Hence, TOC and N were determined using a CN elemental analyzer (vario EL cube; Elementar Analysis Systems GmbH, Hanau, Germany) and stocks were later calculated from bulk density measurements. Exchangeable base cations (Ca, Mg, K, Na, and Al) and ECEC were determined on the 1–2 mm Earth fraction of the collected soil samples.
2.4 Soil greenhouse gas fluxes and soil environmental control measurements
Soil CO2, CH4 and N2O fluxes were measured monthly over a period of 14 months (May 2019 to June 2020). In every replicate plot's inner measurement core, four chamber bases (fabricated from a 250 mm PN10 PVC pipe and each with an area equal to 0.044 m2 and volume equal to about 12 L) were randomly installed at the soil surface to a depth of about 0.03 m. Installation of chamber bases was done at the beginning of April 2019, a month prior to the GHG flux measurements, and chamber bases remained permanently in place for the entire measurement period. Litter was not removed from the chambers. However, all the chamber bases were always maintained to be vegetation free throughout the gas sampling period in order to avoid measuring plant night respiration during chamber closure. On the sampling day, chamber bases were covered with vented polyvinyl hoods fitted with sampling ports. A pooled gas sample was then obtained every 3, 13, 23, and 33 min using an airtight Luer lock syringe, following the pooling approach described in detail by Arias-Navarro et al. (2013). The 33 min maximum chamber closure period used in this study was well under the threshold recommended by Pavelka et al. (2018) but comparable to other tropical GHG flux studies (e.g., Corre et al., 2010; Koehler et al., 2009a; Matson et al., 2017). To check if the pooling worked correctly, both the pooled and unpooled (an average of four individual chamber measurements) samples were taken for the month of February 2020 for analysis. Both methods produced very comparable results (Fig. A1). Soil GHG fluxes were always measured between 09:00 and 16:00 EAT throughout the entire study period, while, for each measurement day, the sequence of plots to be measured was randomly chosen. Together with the very low diurnal variability in air (0.6±0.04 ∘C; mean ± SE) and soil (0.2±0.03 ∘C; mean ± SE) temperatures at this tropical forest site, the time of the measurement of individual gas chambers should, if at all, only have a minimal effect on the measured gas fluxes. All collected gas samples were stored in Labco exetainers (Labco Limited, Lempeter, UK) with screw-on plastic caps fitted with Labco gray chlorobutyl septum because these exetainers have been demonstrated to remain airtight for periods spanning up to 6 months (Hassler et al., 2015). Additionally, all the plastic caps were screwed on to the exetainers by hand and quarter turned prior to sampling to ensure that they were airtight (Pavelka et al., 2018). All the gas-filled exetainers were shipped to the Department of Environmental Systems Science, ETH Zürich, Switzerland, for analysis using a gas chromatograph (GC; SCION 456-GC; Bruker, Germany) within a period of 4 months from sampling. The GC was equipped with an electron capture detector (N2O), flame ionization detector (CH4), thermal conductivity detector (CO2), and auto-sampler. GC concentrations of the individual gas species of interest (CO2, CH4 and N2O) were then calculated by comparing the peak areas of the measured samples to the respective peak areas of a suite of standard gas samples. Next, flux rates of individual gases at the soil–atmosphere interface were calculated based on either linear increase or decrease in gas concentrations during chamber closure, following Eq. (1) in Butterbach-Bahl et al. (2011).
where GHGflux is given as a positive flux to the atmosphere or a negative flux into the soil (micrograms per square meters per hour; hereafter ), Vch is the chamber volume (cubic meters), GHGm is the molar mass of the different gases (grams per mole; hereafter g mol−1), S is the slope of a linear regression calculated based on the increase or decrease in gas concentrations during chamber closure (parts per million per minute), Ach is the chamber ground area (square meters), and GHGv is the molar volume of the different gases (cubic meters per mole; hereafter m3 mol−1). Note that the constants 106, 109, and 60 were used to convert grams into micrograms, parts per million into cubic meters, and minutes into hours. GHGv was adjusted to air temperature and pressure in the field using ideal gas law, following Eq. (2):
where Tf is the air temperature (degrees Celsius) and Pf is the pressure (Pascal) at the field site, while Ps is the pressure at sea level (Pascal). As a quality check, the linearity of the CO2 increase during chamber closure was inspected by comparing the CO2 concentrations (of each chamber measurement) with time since chamber closure and, thereafter, determining the goodness of fit for the linear regression model (R2). The R2 for all the measurements was 0.992±0.001 (mean ± SE). Additionally, the measured gas concentrations from the GC were checked against the standards and the GC's minimum detection limit to ensure that the changes in gas concentrations during chamber closure were well above its minimum detection limit.
In parallel to gas flux measurements, soil environmental controls, particularly soil temperature, volumetric water content, and soil mineral nitrogen (ammonium – ; nitrate – ), were measured. Soil temperature and volumetric water content were determined at 0.05 m soil depth adjacent to each of the four installed chamber bases per replicate plot. A digital thermometer (Greisinger GMH 3230; GHM Messtechnik GmbH Standort Greisinger, Germany) fitted with an insertion probe and a calibrated ML3 ThetaProbe soil moisture sensor (Delta-T Devices Ltd, United Kingdom) were used to determine soil temperature and soil volumetric water content, respectively. Soil mineral nitrogen was determined by obtaining a soil sample in a Kopecky ring at 0.05 m depth (from the soil surface) and 1 m distance from each of the installed chamber per replicate plot. The obtained soil samples (from each replicate plot) were pooled together and thoroughly mixed. Next, 100 and 150 g of the pooled soil samples were extracted with 100 and 600 mL CaCl2 solution to determine and concentrations, respectively, using the RQflex® 10 reflectometer. The RQflex® 10 reflectometer is part of the Reflectoquant®system comprising a reflectometer, a batch-specific barcode, and test strips. The test strips used in this study had a 3–90 and 0.2–7 mg L−1 detection range for nitrates (NO3-N) and ammonium (NH4-N), respectively.
To understand the contribution of autotrophic (root) and heterotrophic (microbial) sources to total soil respiration, a trenching treatment was done in all the plots, following the protocol of Wang and Yang (2007). Prior to trenching, root biomass distribution with depth was determined in order to establish where most roots were located. Root biomass estimation involved digging three profile pits measuring at the forest site. In every pit, 10 soil monoliths (each measuring 20 cm (L)×20 cm (W)) were carefully cut out (using a spade and hoe), following a 10 cm depth interval from the surface down to 1 m. The soil monoliths were thoroughly washed to isolate the roots from the bulk soil. The root samples were oven-dried at 60 ∘C for 48 h and weighed to determine the root biomass per depth increment. The root biomass for each depth interval was calculated as the mean of the root biomass from the three pits for that interval. It was established that over 90 % of the roots were within the top 0.60 m of the soil profile. Therefore, a circular trench (about 0.60 m in diameter) was dug to a depth of about 0.60 m at the center of all the plots, thereby creating a soil mass free of roots. All the trenches were lined with a heavy-duty plastic sheet to prevent roots from growing back into the trenched soil mass. The trenched soil mass and the proximally neighboring untrenched (reference) zone (about 1 m apart) were, respectively, installed with a chamber base. Both the trenched and reference chamber bases had a design (area equal to 0.044 m2 and volume equal to about 12 L) identical to the one used in the NME soil GHG flux study. The installed chamber bases were left standing for 6 months before the first measurements began in November 2019. This ensured that a large proportion of the cut roots in the trenched soil mass decomposed before the start of the CO2 measurements. CO2 measurements were conducted monthly for a period of 4 months (starting in November 2019 and ending in February 2020). The selected measurement time window represented the transition between the wet season and the long dry season, allowing us to capture how soil moisture constrained the different soil CO2 efflux sources. After the completion of the flux measurements, root coring was done to a depth of 0.30 m at two locations directly adjacent to both the trenched and untrenched chambers in order to determine if the trenching approach was effective in reducing the amount of living root biomass in the trenched zone. It was established that there was a 73 % and 63 % reduction in fine root biomass and coarse root biomass, respectively, in the trenched zone in comparison to the reference zone. Heterotrophic (microbial) respiration was equal to the CO2 effluxes from the trenched chamber, while autotrophic (root) respiration was the difference between CO2 effluxes from the reference and trenched chambers.
2.5 Statistical analysis
Prior to statistical analysis, transitory N2O fluxes from N addition plots (N and N + P) were detrended to compensate for the absence of frequent measurements immediately after fertilization coming from sampling GHGs monthly. Detrending involved using a lognormal fit between the measured N2O fluxes and time since fertilization (until day 42), and this explained 43 % of the observed variability in the N2O data during the transitory phase (p<0.05). Additionally, GHG flux and soil environmental control data were aggregated based on seasons (wet and dry) and phases (transitory – 0–28 d from the date of fertilization; background – more than 28 d after fertilization). Furthermore, despite monitoring soil and contents on a monthly basis throughout the measurement period, only the soil data set was used in the analysis because soil was mostly low and often below the detection limit of the reflectometer at majority of the sampling time points.
Data were checked for normality and homogeneity of variance (homoscedasticity) across treatment groups, seasons, and phases before implementing parametric tests (i.e., linear mixed effects models – LMEMs; one-way analysis of variance – ANOVA). Normality of the respective data was inspected by using diagnostic plots (histograms and quantile–quantile plots) and the Shapiro–Wilk normality test, while heteroscedasticity was determined with the Levene test and by inspecting residual plots of fitted values. In the case of heteroscedasticity and non-normal distribution of the data, either a logarithmic or a Tukey transformation was applied on the data set. However, if the normality of the data and homogeneity of variance were not restored by the transformations, an equivalent nonparametric statistical test was selected. The Spearman's correlation coefficient test was used to check the relationship between the measured background soil GHG fluxes and soil environmental controls.
To determine the differences in mean soil GHG fluxes between treatments, a one-way ANOVA test was used with GHG species and treatments included in the model as response and predictor variables, respectively. In order to determine the effect of the added nutrients on soil GHG fluxes (CO2, CH4, and N2O), soil CO2 sources (heterotrophic and autotrophic), and soil environmental controls (water-filled pore space, soil temperature, and nitrates), LMEMs were employed. LMEMs effectively deal with temporal pseudo-replication (coming from repeated measurements) and, hence, safeguard against inflation of the degrees of freedom, which would significantly compromise the power of the statistical test. Added nutrients (treatments), seasons (wet and dry), CO2 sources (autotrophic and heterotrophic), and phases (transitory and background) were included in the LMEMs as fixed effects, while sampling days and replicate plots were included as random effects. Some of the LMEMs were extended to either include a variance function (to account for variation in the response variable per level of the fixed effect), a first-order temporal autoregressive process (to control for correlation between closely spaced measurements in time), or both. The extensions were included in the LMEMs on the premise that they improved the relative goodness of model fit based on Akaike information criterion (AIC).
All the statistical data analyses were performed using R 3.6.3 (R Development Core Team, 2019). Specifically, nlme and car packages were employed to run LMEMs and one-way ANOVA tests, respectively. Throughout the paper, statistical significance in all the tests was inferred if p≤0.05, and annual soil GHG fluxes were estimated through a trapezoidal interpolation on the measured monthly soil GHG fluxes.
3.1 Soil physico-chemical characteristics, water filled pore space, soil temperature, and nitrates
Soil characteristics did not significantly differ across plots; hence, the parameters presented in Table 1 represent the soil physico-chemical characteristic for the NME site.
Table 1Soil physico-chemical properties in three depths and vegetation characteristics of the study site located in the Budongo Central Forest Reserve, northwestern Uganda.
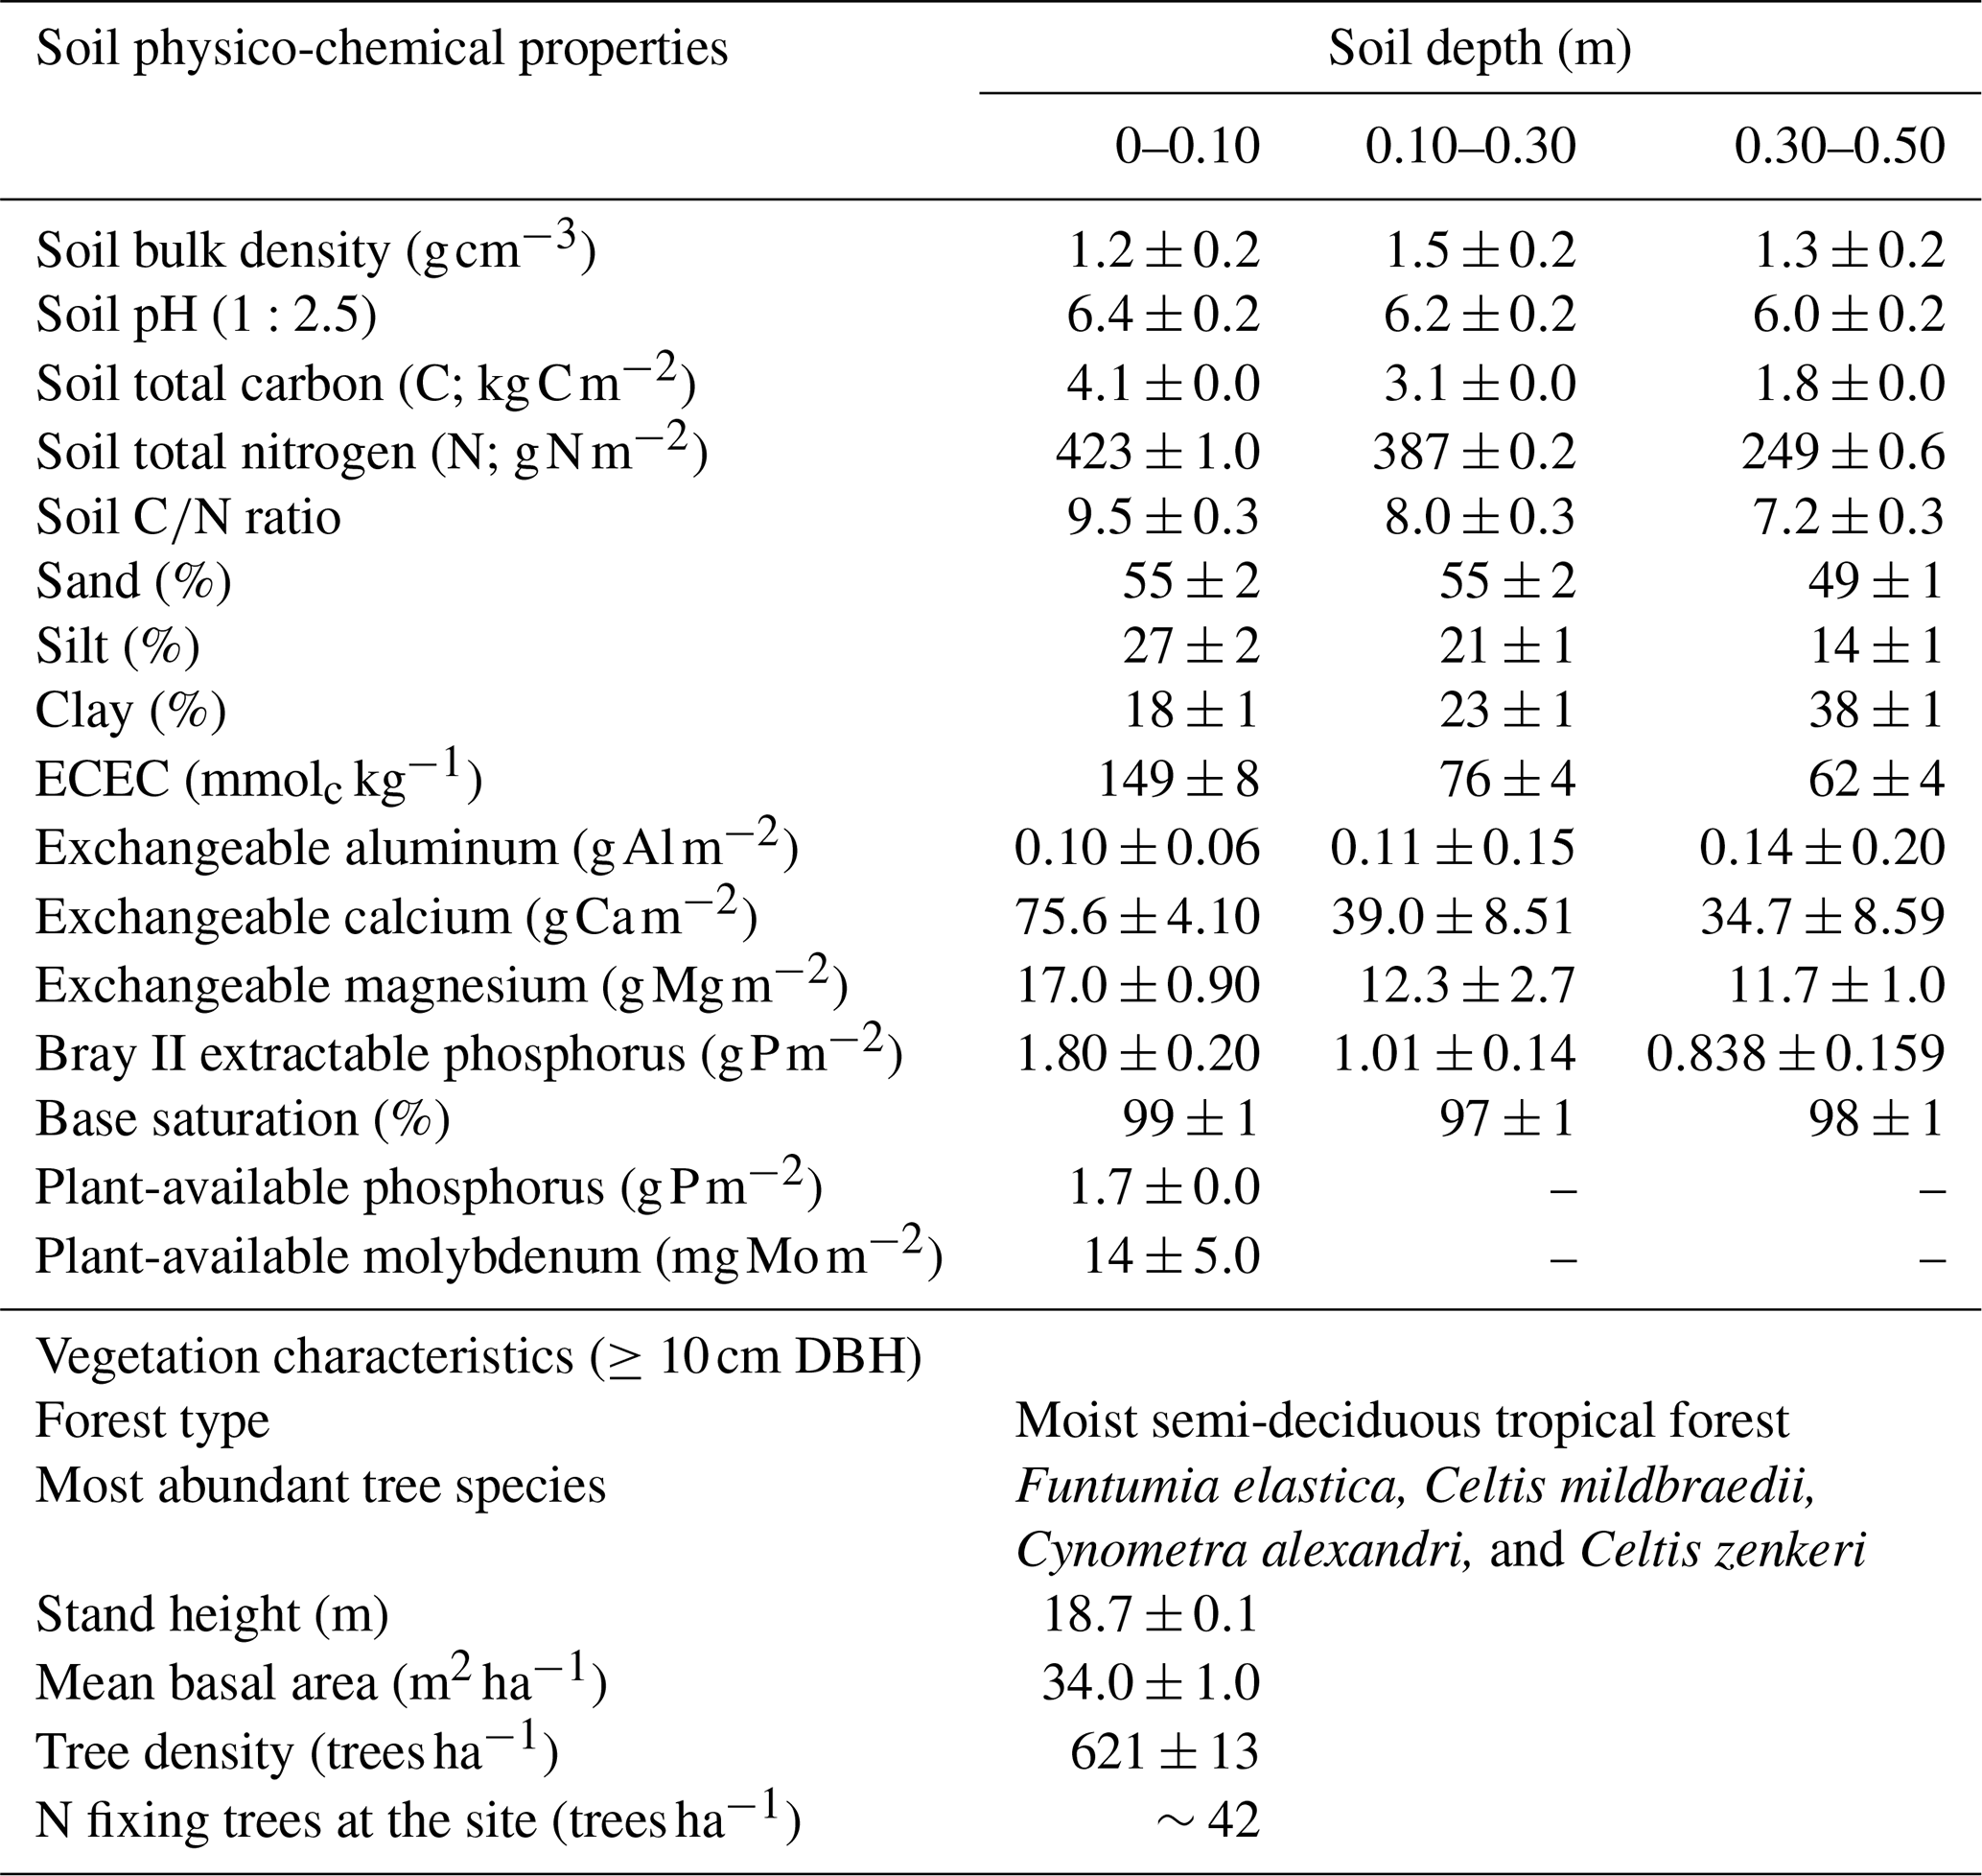
Notes: DBH – diameter at breast height; ECEC – effective cation exchange capacity.
The soils have a high bulk density (specifically, 10–30 cm), slightly acidic pH, sandy texture, relatively high effective cation exchange capacity (ECEC), high base saturation (dominated by Ca and Mg), low level of plant-available phosphorus, and low CN (Table 1). The water-filled pore space (WFPS) was significantly higher in the wet season (March to December; 55±1.0 %) compared to the dry season (January to February; 43±1.7 %; Figs. 1a and 2a; p<0.01). WFPS was higher in N and N + P addition plots compared the control plots both in the dry (N – ; N + P – p=0.04) and wet (N – ; N + P – p=0.05) seasons (Fig. 1a). Soil temperature varied minimally (0.6 ∘C) across treatments and seasons, ranging between 20.1 and 21.4 ∘C in the dry season and between 19.7 and 22.9 ∘C in the wet season. Soil nitrate contents measured across all treatment plots were significantly larger in the dry season compared to the wet season (Fig. 1c; p<0.01). Soil nitrate content from the N (p=0.01) and N + P (p=0.02) addition plots was significantly higher than the control plots in the wet season (Fig. 1c), but no significant difference was detected between the nutrient addition treatments and the control in the dry season (Fig. 1c). Strong nitrate peaks were observed in N and N + P addition plots in September 2019 and June 2020, shortly after fertilization (Fig. 2c).
Table 2Mean (±SE; n=4) soil GHG fluxes (CO2, CH4, and N2O) and annual soil GHG fluxes measured between May 2019 and June 2020 from control (Ctrl), nitrogen (N), phosphorus (P), and N + P plots of the nutrient manipulation experiment.

Notes: Means followed by different lowercase letters indicate significant differences among treatments (one-way ANOVA; p≤0.05); * Annual soil CO2 fluxes, CH4 fluxes, and N2O fluxes were approximated by applying the trapezoid rule on time intervals between measured flux rates. The mean and annual soil GHG fluxes included both transitory and background flux measurements. Note: transitory N2O fluxes (measured within 28 d from fertilization) from N addition plots (N and N + P) were detrended to compensate for absence of frequent measurements immediately after fertilization coming from sampling GHGs monthly.
3.2 Soil CO2 fluxes
Soil CO2 fluxes varied between 60 and 330 during the measurement period across all treatments. However, the highest CO2 fluxes were measured in December at the interface between wet and dry season (Fig. 3a). Fertilization resulted in an immediate increase in CO2 fluxes across all nutrient addition plots (N – 15 %; P – 14 %; N + P – 24 %) in the transitory phase. However, this increase was only significant in the N + P plots (Fig. 4a; p=0.01). There was no significant effect of fertilization on background CO2 fluxes between nutrient addition treatments and the control plots (Fig. 4d).

Figure 1Mean (±SE, n=4) WFPS (a), soil temperature (b), and nitrates (c) in the top 0.05 m of the control (Ctrl), nitrogen (N), phosphorus (P), and N + P plots of the nutrient manipulation experiment measured during the dry (January and February; monthly precipitation <100 mm) and wet (March to December; monthly precipitation >100 mm) seasons. Different lowercase letters indicate the significant differences between treatments and the control, while different uppercase letters indicate significant differences between seasons (LMEMs; p≤0.05).
Similarly, no significant differences in the background CO2 fluxes were detected between seasons, despite measuring marginally lower background CO2 fluxes in the wet season compared to the dry season (Fig. 4d). Additionally, no significant differences were detected between transitory and background CO2 fluxes (Fig. 4a and d). Heterotrophic (microbial) CO2 effluxes were significantly higher than the autotrophic (root) CO2 effluxes (Fig. 5; p<0.01) across all treatment plots, with microbes contributing about 3 times more to the total soil CO2 effluxes compared to roots (Fig. 5; p<0.01). Neither heterotrophic nor autotrophic respiration significantly differed between treatments (Fig. 5). Overall, there was a relatively low variability in annual CO2 fluxes across treatments ( %). The Spearman correlation coefficient indicated that background soil CO2 fluxes did not correlate to any of the measured soil environmental controls (WFPS, soil temperature, and nitrates) across all treatment plots (Fig. 6a–c).
3.3 Soil CH4 fluxes
Across all treatments, phases (transitory and background), and seasons, soil CH4 fluxes varied between an uptake of −278 and a release of 77 . In the transitory phase, CH4 consumption increased slightly but not significantly in the N (2 %) and N + P (6 %) plots. A larger but still not significant (marginal) increase was found in the case of P plots (54 %; p=0.05; Fig. 4b). Beyond 28 d from the time of fertilization, no significant difference in background soil CH4 fluxes between treatments was detected in the dry season (Fig. 4e). However, a significantly higher background soil CH4 consumption was measured in P plots in the wet season (Fig. 4e; p=0.01). Soil CH4 consumption in the dry season was, on average, 1.5 times larger than the wet season across all treatments (Fig. 4e; p=0.01). Soil CH4 uptake across all treatment plots measured during the transitory phase () did not significantly differ from the CH4 uptake in the background phase (; Fig. 4b and e). Annual CH4 uptake ranged between −2.7 and , with soils in all the treatment plots acting as net sinks for CH4 (Table 2). The Spearman correlation coefficient test indicated that background CH4 fluxes were strongly and positively correlated to WFPS (Fig. 6d), while soil temperature (Fig. 6e) and nitrates (Fig. 6f) were also significant but negatively correlated.
3.4 Soil N2O fluxes
Soil N2O fluxes across treatments, phases (transitory and background), and seasons varied between an uptake of −18 and a release of 499 . A strong increase in N2O effluxes was measured immediately after fertilization (September and December 2019; April and June 2020) in all N addition plots, with increases of 445 % in N plots (p<0.01) and 455 % in the N + P plots (p<0.01) compared to the control plots in the transitory phase (Fig. 4c). The soil N2O peaks in September 2019 and June 2020 (Fig. 3c) coincided with the peaking in soil nitrate concentrations (Fig. 2c). Background soil N2O fluxes did not differ significantly between nutrient addition plots and the control plots both in the dry and wet seasons (Fig. 4f). Annual N2O fluxes ranged between 1.8 and 4.8 , with soils in all the treatment plots acting as net sources of N2O (Table 2). The Spearman correlation coefficient indicated that background soil N2O fluxes were strongly and positively correlated to WFPS (Fig. 6g) in all treatment plots. The majority of the background soil N2O fluxes higher than 15 (constituting 74 % of the average background soil N2O fluxes) corresponded to WFPS greater than 49 % (wetter conditions; Fig. 6g). Background soil N2O fluxes negatively correlated to soil temperature (Fig. 6h) and nitrates (Fig. 6i) in all treatment plots.
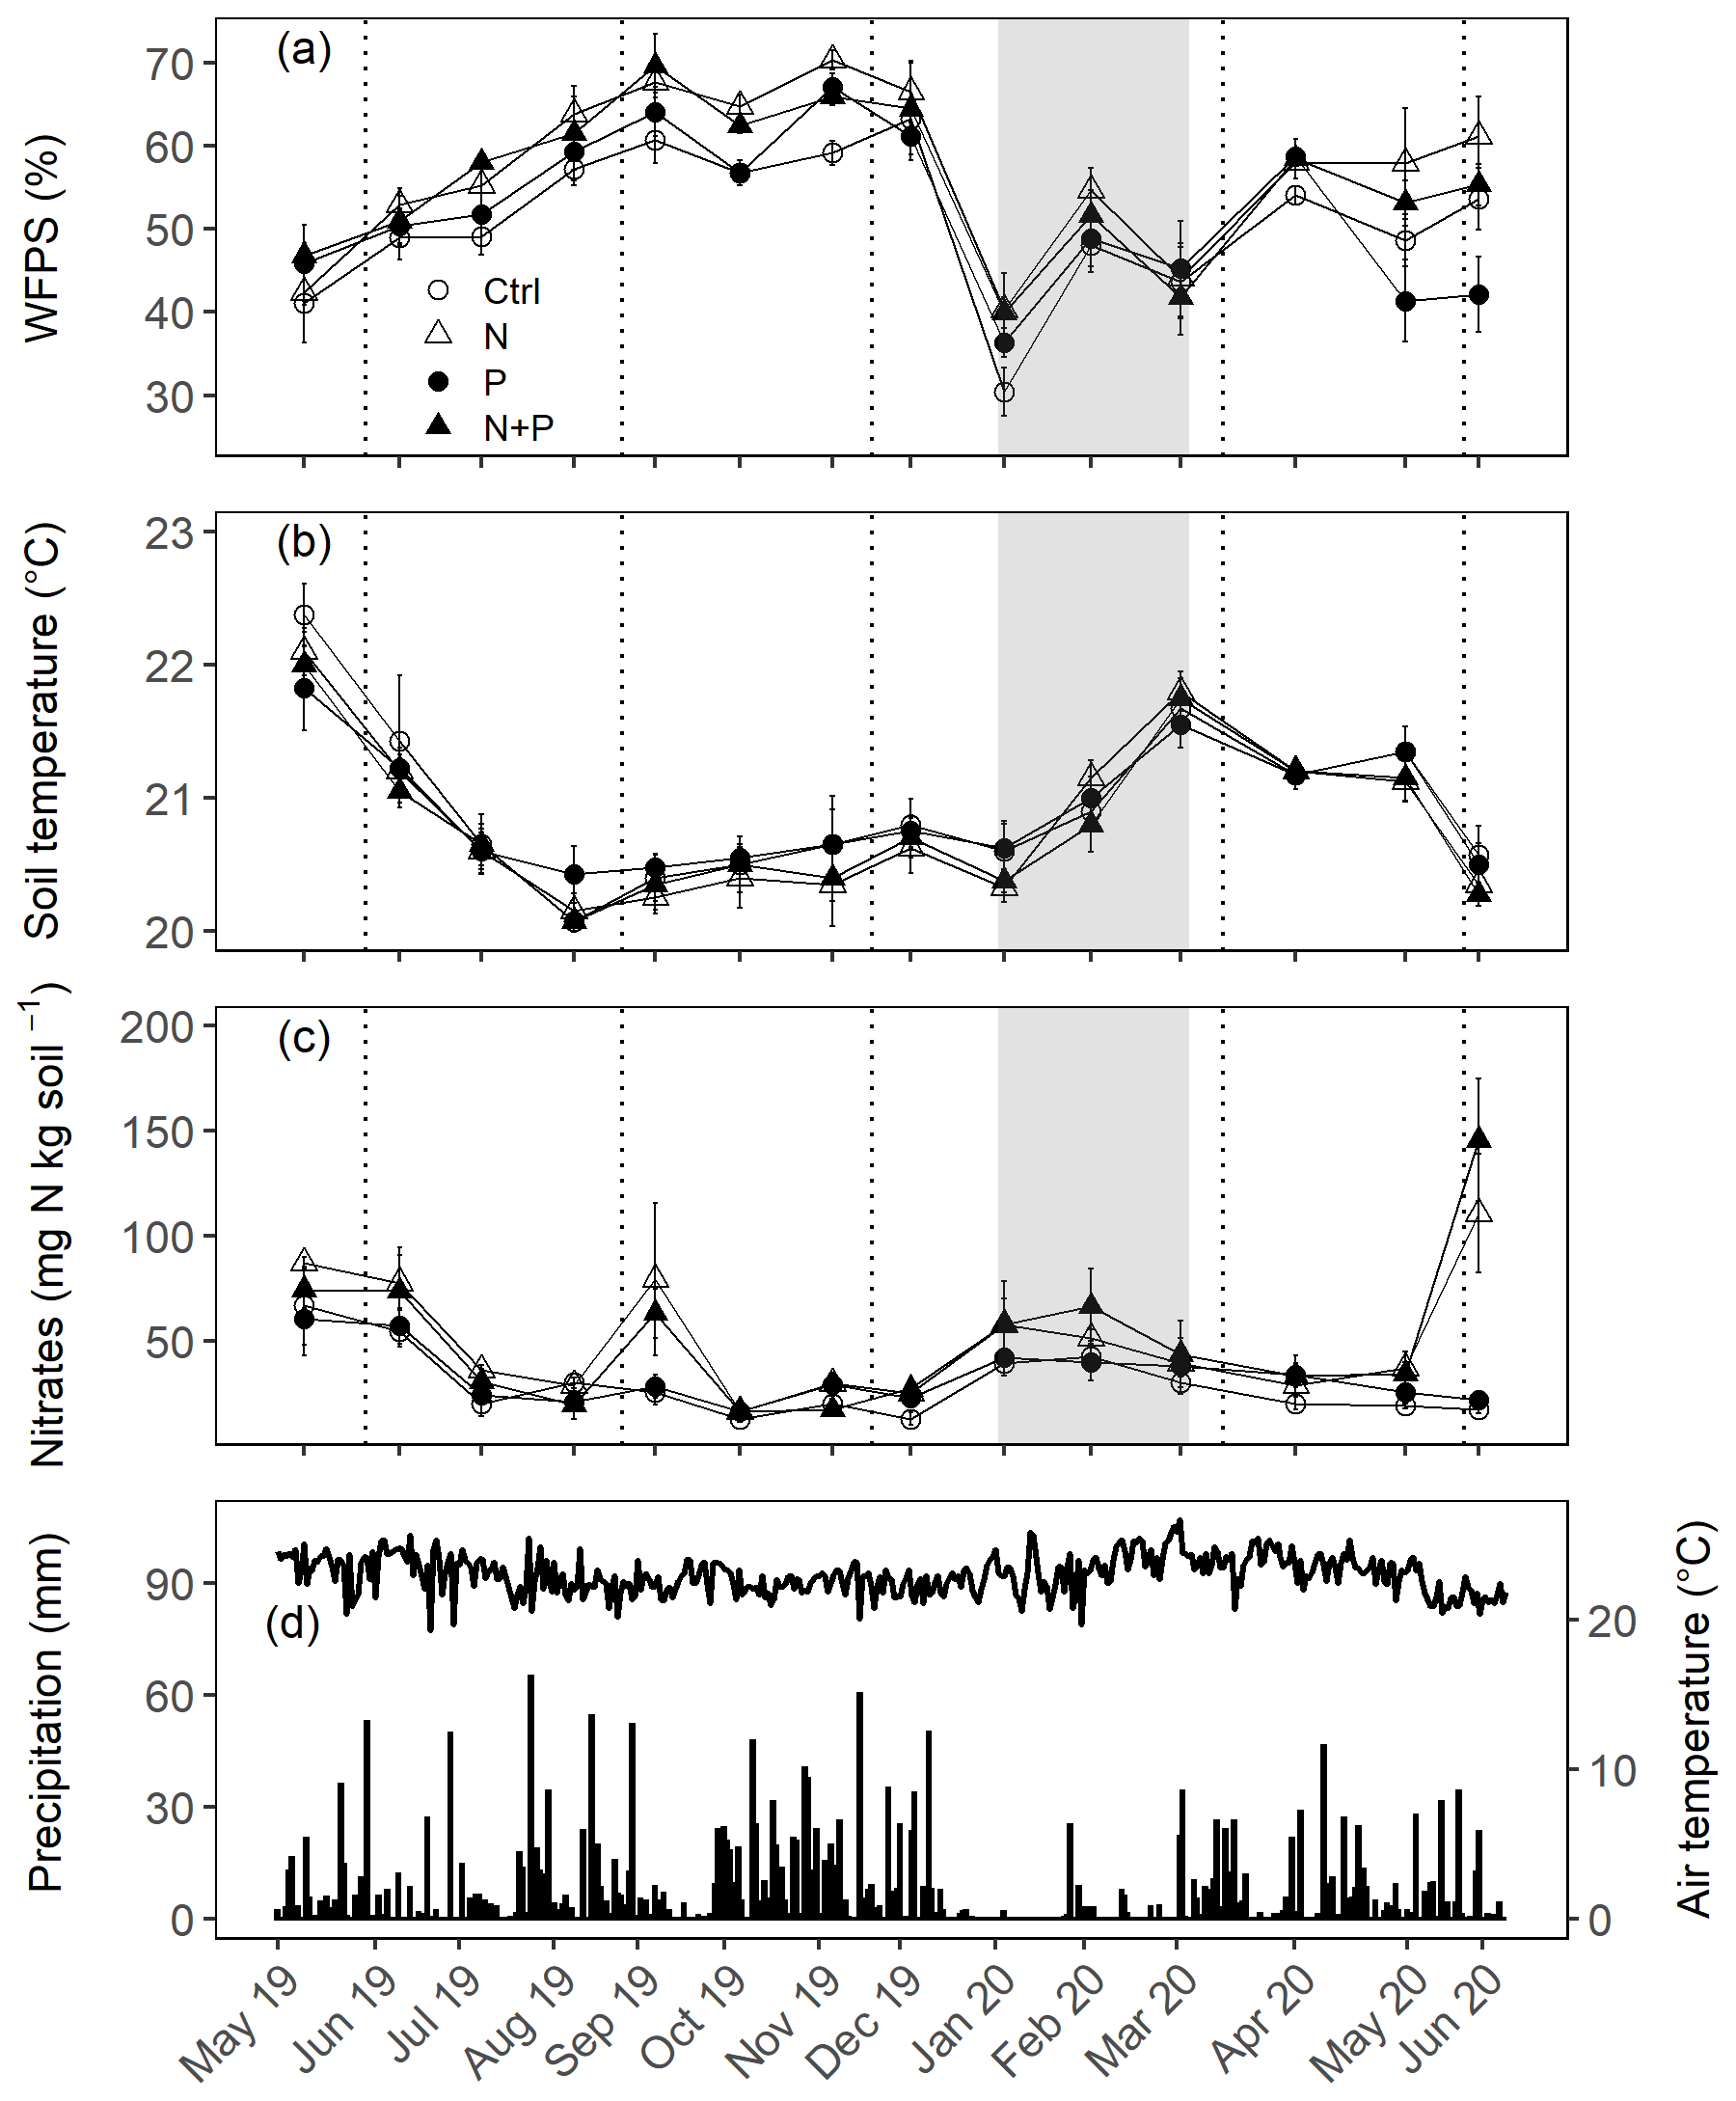
Figure 2Mean (±SE; n=4) WFPS (a), soil temperature (b), and nitrates (c) in the top 0.05 m measured monthly (May 2019 to June 2020) from control (Ctrl), nitrogen (N), phosphorus (P), and N + P plots of the nutrient manipulation experiment. Vertical lines indicate the timing of each split dose of N (31.3 kg N ha−1), P (12.5 kg P ha−1), and N (31.3 kg N ha−1) + P (12.5 kg P ha−1) fertilization every 3 months. The gray shaded rectangle (in a, b, and c) marks the beginning and end of the dry season (January and February; monthly precipitation <100 mm), while panel (d) gives the daily precipitation (bars) and air temperature (line) between May 2019 and June 2020. Climatic data were obtained from a weather station installed at the Budongo Conservation Field Station, 2 km from the location of the nutrient manipulation experiment in the Budongo Central Forest Reserve, northwestern Uganda.
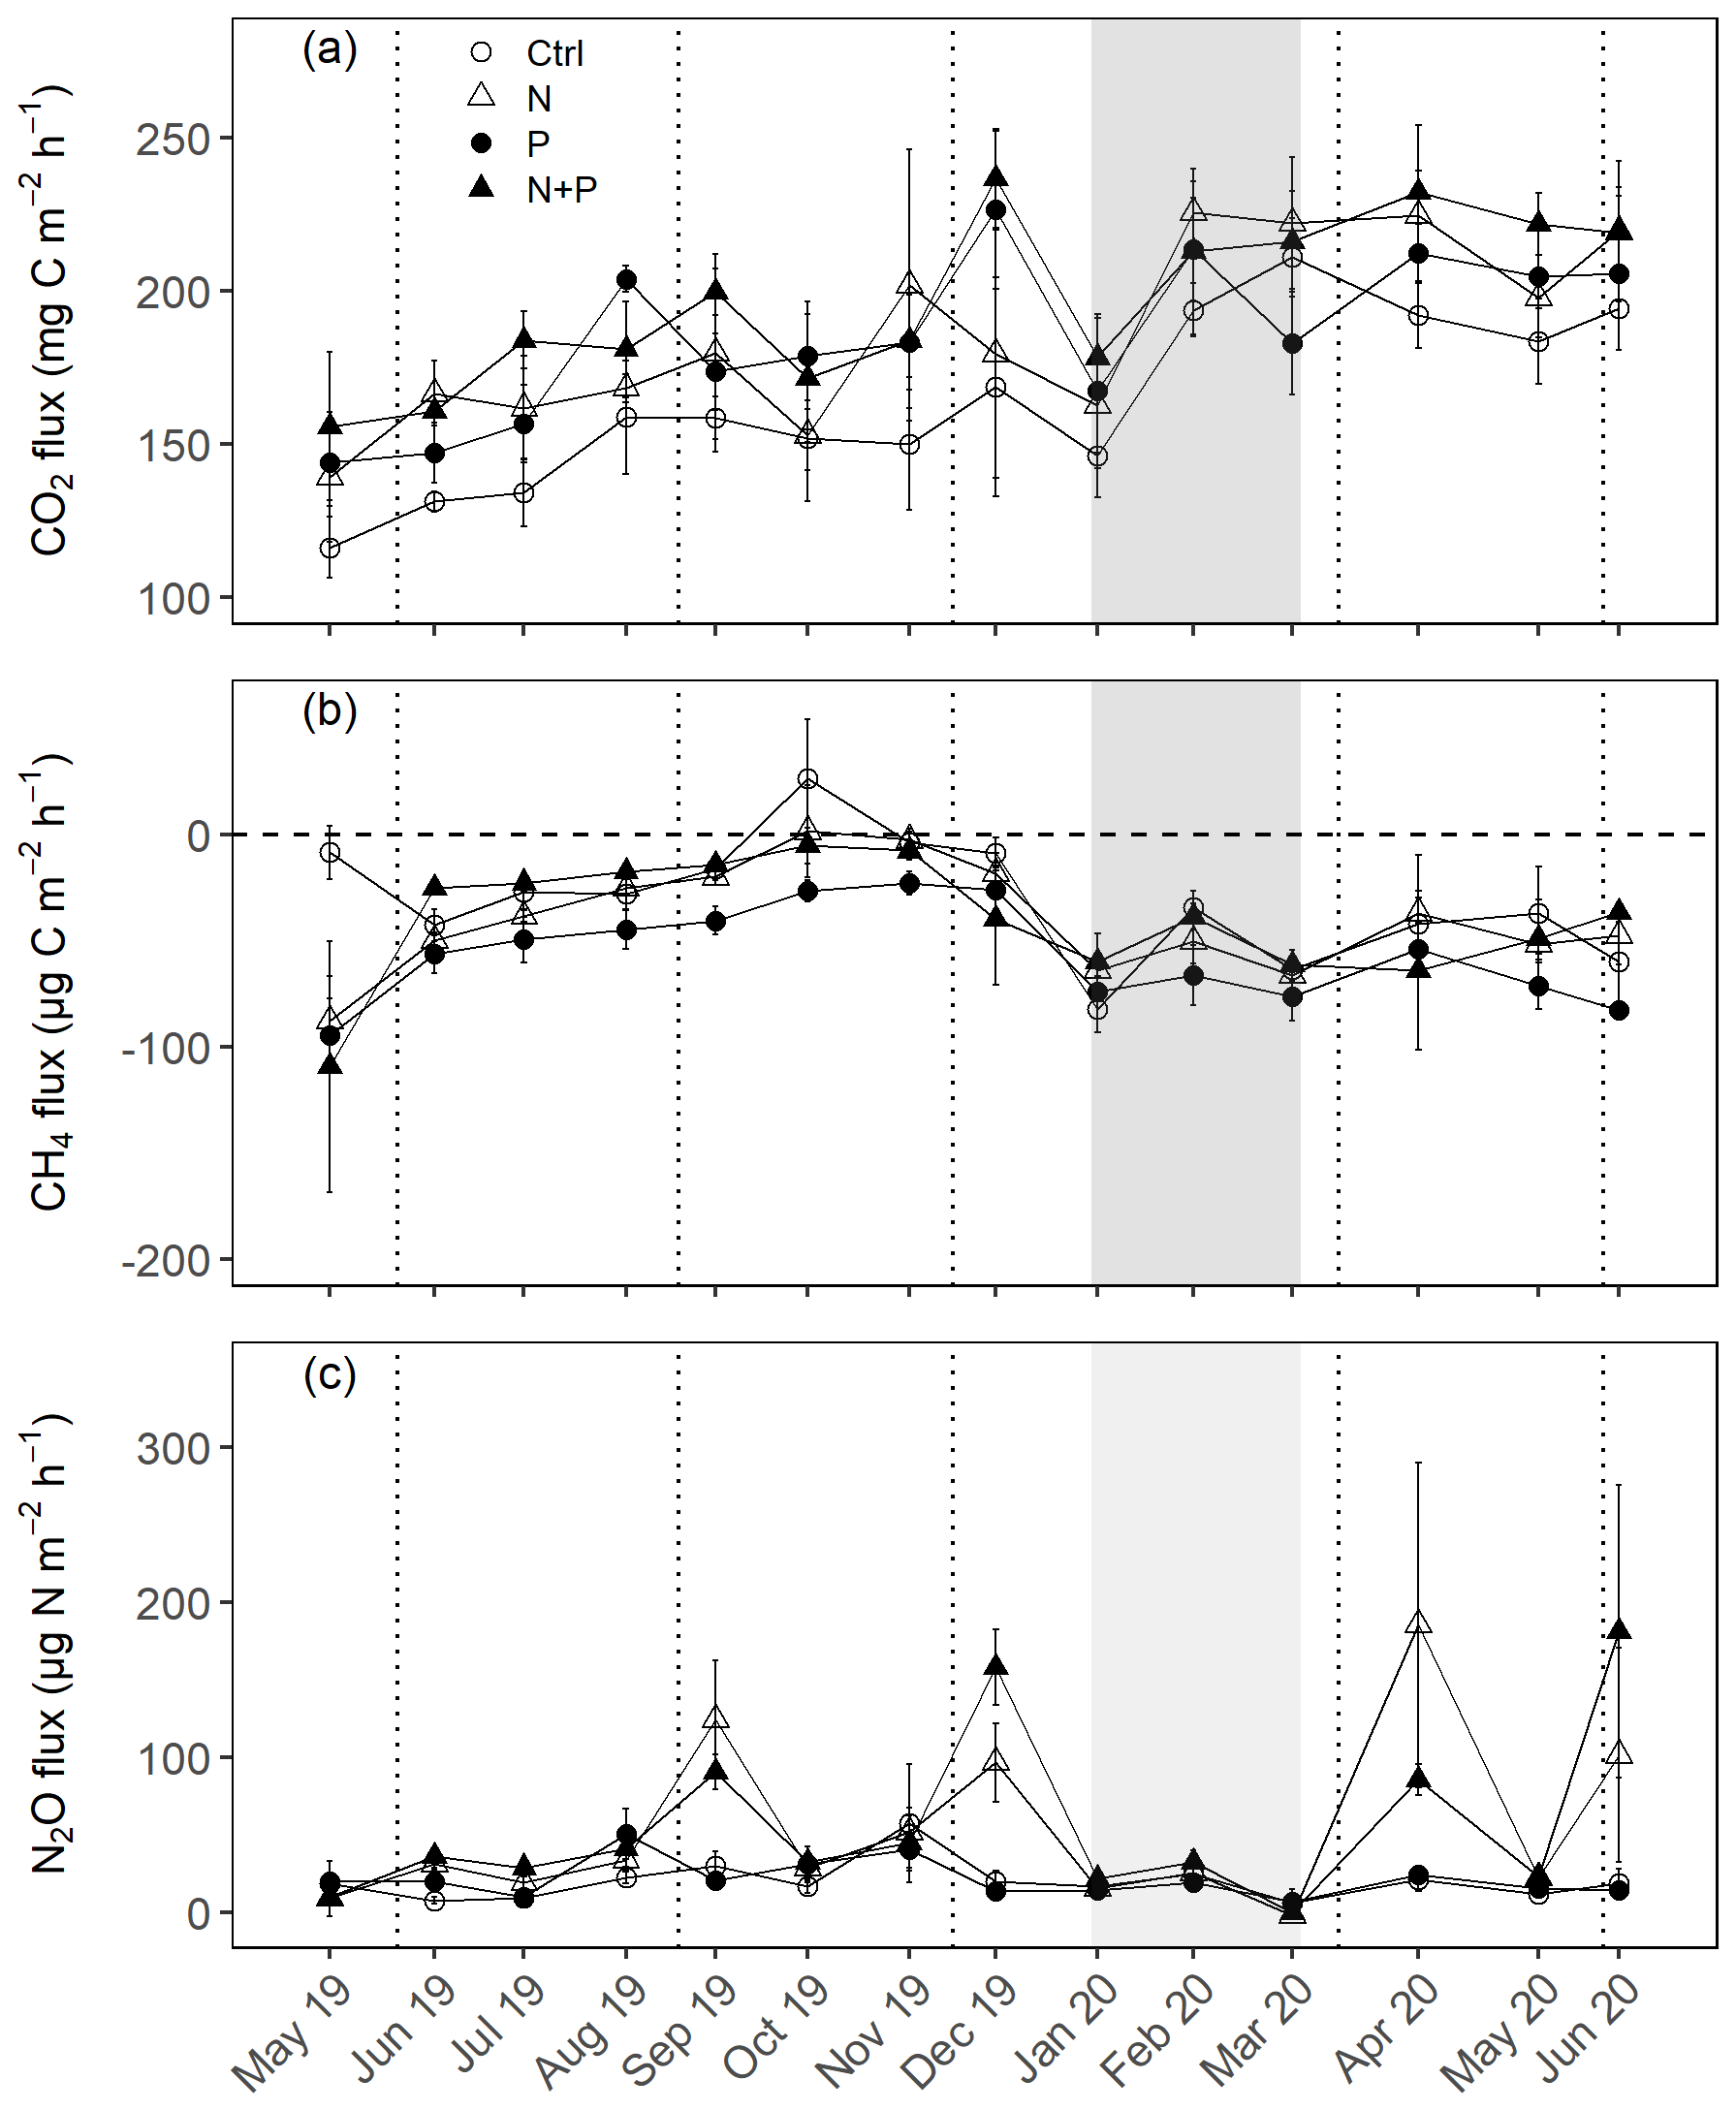
Figure 3Mean (±SE; n=4) soil CO2 fluxes (a), CH4 fluxes (b), and N2O fluxes (c) measured monthly (between May 2019 and June 2020) from control (Ctrl), nitrogen (N), phosphorus (P), and N + P plots of the nutrient manipulation experiment. Vertical lines indicate the timing of each split dose of N (31.3 kg N ha−1), P (12.5 kg P ha−1) and N (31.3 kg N ha−1) + P (12.5 kg P ha−1) fertilization every 3 months. The gray shaded rectangle marks the beginning and end of the dry season (January and February; monthly precipitation <100 mm). Note: transitory N2O fluxes (measured within 28 d from fertilization) from N addition plots (N and N + P) were detrended to compensate for absence of frequent measurements immediately after fertilization coming from sampling GHGs monthly.
4.1 Effect of N and P addition and soil environmental controls on soil CO2 fluxes
The annual soil CO2 effluxes from control plots (Table 2) were lower than those measured from tropical forests in Thailand (Hashimoto et al., 2004) and Hawaii (Townsend et al., 1995), within range to those from the Democratic Republic of Congo (Baumgartner et al., 2020), Panama (Koehler et al., 2009a; Pendall et al., 2010), Brazil (Sousa Neto et al., 2011), and Cameroon (Verchot et al., 2020), and higher than those reported from Kenya (Wanyama et al., 2019) and Indonesia (van Straaten et al., 2011). The differences in soil CO2 fluxes between the control plots in this study and studies done in other tropical forest sites may be due to differences in soil environmental characteristics, e.g., soil C quality and quantity, soil temperature, and moisture availability at the respective sites (Nottingham et al., 2015).
The alleviation of nutrient limitations on soil biological activity (in microbial communities and in root respiration) through fertilizer addition was particularly reflected by the significant increase in transitory CO2 effluxes following the addition of N and P together (Fig. 4a). The transitory phase (<28 d from fertilization) is the period where addition of nutrients (N, P, and N + P) is expected to result in a large pulse of microbial activities. However, the fact that the increase in soil CO2 effluxes was significant only in plots where N and P were added simultaneously (N + P) suggests a possible co-limitation between N and P on soil biological activity (Bréchet et al., 2019). These results seemingly align with the proposed multiple element limitation concept, which suggests a strong response in microbial mediated processes upon the supply of limiting nutrients (Fanin et al., 2015). Furthermore, the results likely indicate that some soil respiration sources may respond positively to N addition (Yan et al., 2017), while others may respond positively to P addition (Ma et al., 2020), yielding an overall additive response when added together. An increase in soil CO2 effluxes following the simultaneous addition of N and P has also been reported in studies like Bréchet et al. (2019), and Soong et al. (2018) from Panamanian tropical forests.
In contrast, the lack of significant treatment effects on background soil CO2 efflux (Fig. 4a and d) and its different components (heterotrophic and autotrophic; Fig. 5) may suggest that numerous counteracting processes could be happening at the same time, hence masking treatment effects. Some studies have, for instance, demonstrated that the addition of N subdues exoenzymes (Li et al., 2018), decreases microbial biomass (Burton et al., 2004; Hicks et al., 2019), increases net primary productivity (Adamek et al., 2009), and reduces fine root biomass (Cusack et al., 2011), while other studies have reported that P addition increases soil organic matter decomposition in tropical forest ecosystems (Cleveland and Townsend, 2006). The possibility of counteracting processes at the experimental site is further exemplified by the lack of a relationship between all the measured soil environmental controls (soil temperature, nitrates, and soil moisture) and background CO2 effluxes (Fig. 6a–c). Although these results are consistent with the findings by Baumgartner et al. (2020) in the Congo Basin, they contrast several GHG studies located in tropical forests that have reported a strong correlation between CO2 effluxes and soil moisture (Matson et al., 2017; van Straaten et al., 2011). For this experiment site, it could be that the minimal temporal fluctuation in soil temperature (Fig. 1b), together with the fact that water-filled pore space was mostly >40 % (Fig. 1a) during the sampling campaign dampened the effect of soil temperature and moisture on soil CO2 fluxes.
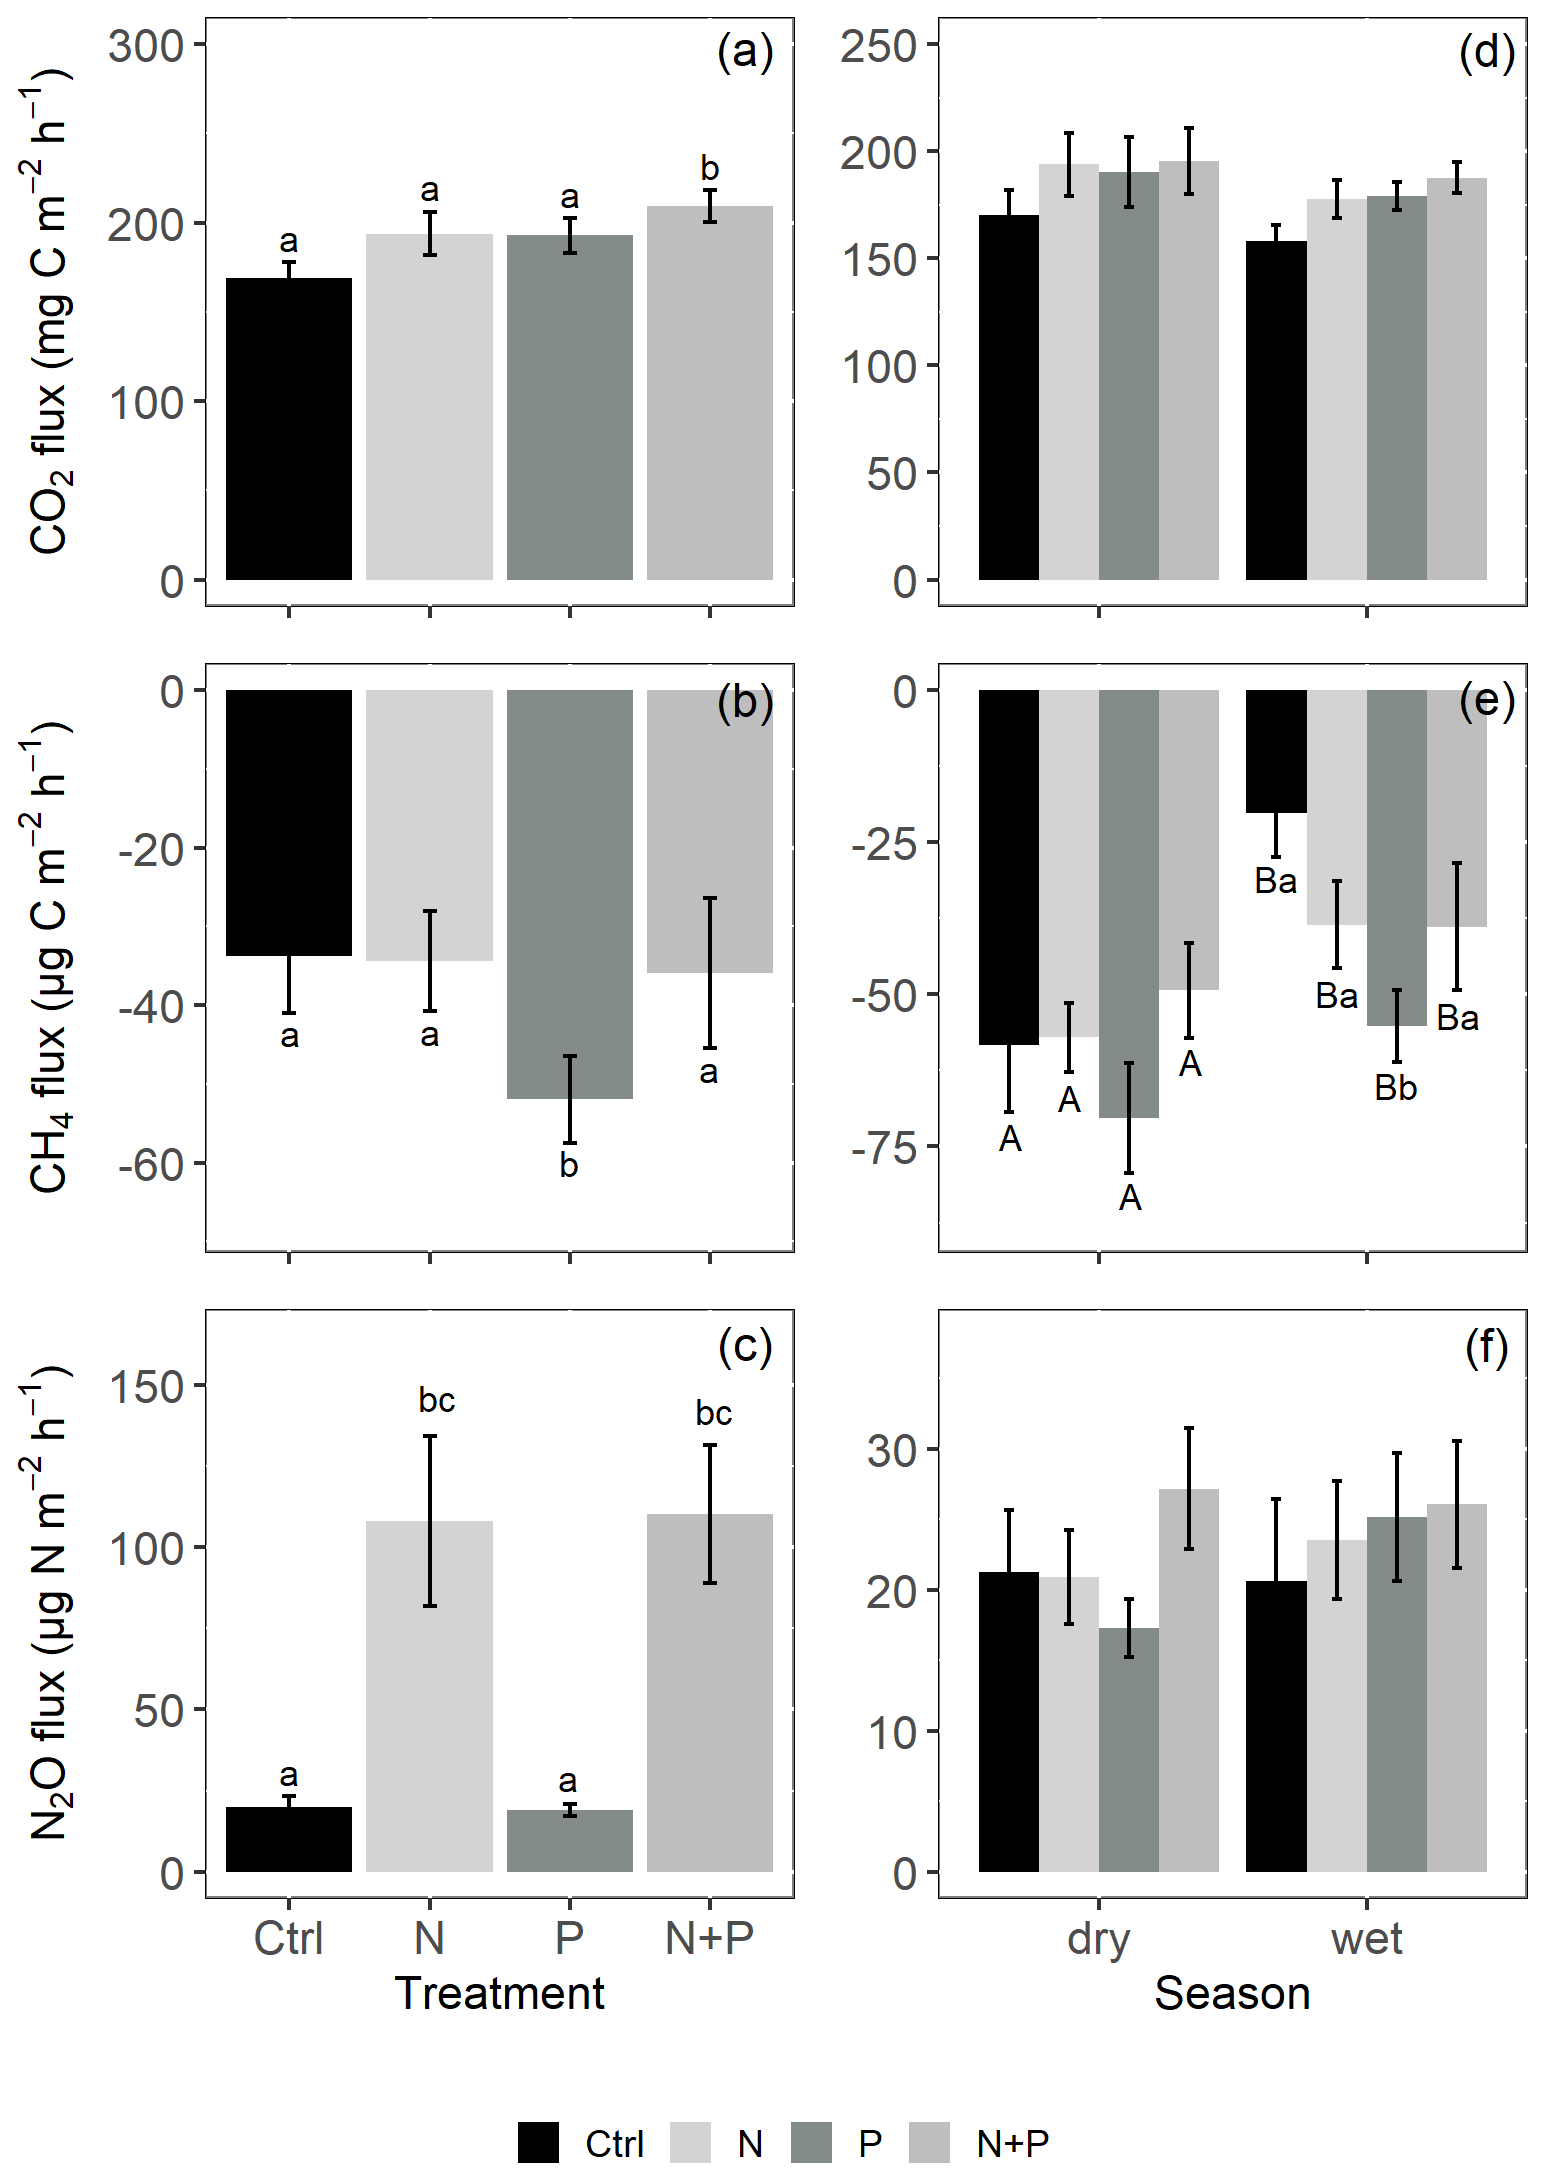
Figure 4Mean (±SE; n=4) soil CO2 fluxes (a, d), CH4 fluxes (b, e), and N2O fluxes (c, f) from the control (Ctrl), nitrogen (N), phosphorus (P), and N + P plots of the nutrient manipulation experiment. Column 1 (a–c) includes only fluxes measured during the transitory phase (0 to 28 d after fertilization), and all the transitory fluxes were in the wet season (monthly precipitation >100 mm). Column 2 (d–f) includes only background-level fluxes (fluxes measured more than 28 d after fertilization). Different lowercase letters indicate significant differences between nutrient addition treatments and the control, while different uppercase letters indicate significant differences between seasons (linear mixed effects models; p≤0.05). Note: transitory N2O fluxes (measured within 28 d from fertilization) from N addition plots (N and N + P) were detrended to compensate for absence of frequent measurements immediately after fertilization coming from sampling GHGs monthly.
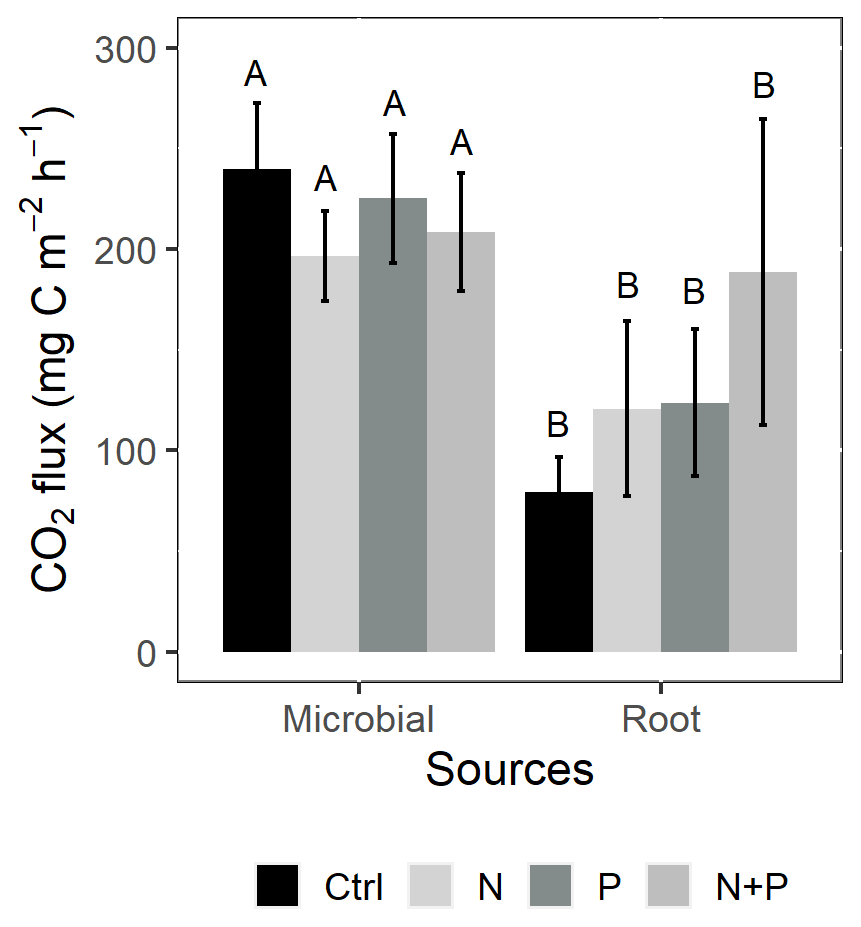
Figure 5Mean (±SE; n=4) soil CO2 flux from the control (Ctrl), nitrogen (N), phosphorus (P), and N + P plots of a trenching treatment separated into microbial and root sources. Different uppercase letters indicate significant differences between microbial and root contribution to total CO2 flux (linear mixed effects models; p≤0.05).
4.2 Effect of N and P addition and soil environmental controls on soil CH4 fluxes
The annual soil CH4 fluxes from the control plots (Table 2) were at the upper end of the CH4 fluxes measured in lowland tropical forests (Aronson et al., 2019; Veldkamp et al., 2013; Zheng et al., 2016), and at the lower end of those measured in (sub-)montane tropical forest ecosystems (Sousa Neto et al., 2011; Yan et al., 2008). The difference in soil texture and soil moisture regimes between this experimental site and the other study sites might explain why the CH4 uptake at the respective sites was different. It is recognized that soil physical properties, particularly texture (Sousa Neto et al., 2011), along with soil moisture content directly control the entry and diffusivity of CH4 from the atmosphere to the oxidative sites in the soil (Veldkamp et al., 2013).
In this experiment, the significantly higher CH4 consumption from the P addition plots compared to the control during both the transitory and background periods (Fig. 4b and e) is attributed to the alleviation of P limitations affecting methanotrophic activity. Similar findings were reported by Zhang et al. (2011) and Yu et al. (2017) but contrasted those of Bréchet et al. (2019) and Zheng et al. (2016). It is worth noting that, although all these studies were located in tropical forests, they differed fundamentally in their experimental designs, type and amount of fertilizers applied, and the frequency of fertilizer application, which could have influenced the reported CH4 uptake rates at the respective sites.
The lack of a response in background CH4 consumption following N fertilization (Fig. 4e) is likely because there were contrasting ecosystem responses to the N addition. On the one hand, the addition of nitrogen significantly increased soil-water-filled pore space in comparison to the control (Fig. 1a; possibly as a result of reduced fine root biomass; Cusack et al., 2011), which could have resulted in a decrease in methane uptake. On the other hand, the negative correlation between nitrates and background CH4 fluxes (Fig. 6f) indicates that increases in soil nitrate content should increase CH4 uptake. Additionally, the lack of a clearer signal in background CH4 uptake may have something to do with the high variability in the measured CH4 fluxes ( %) potentially caused by localized termite activity (Brune, 2014; Nauer et al., 2018).
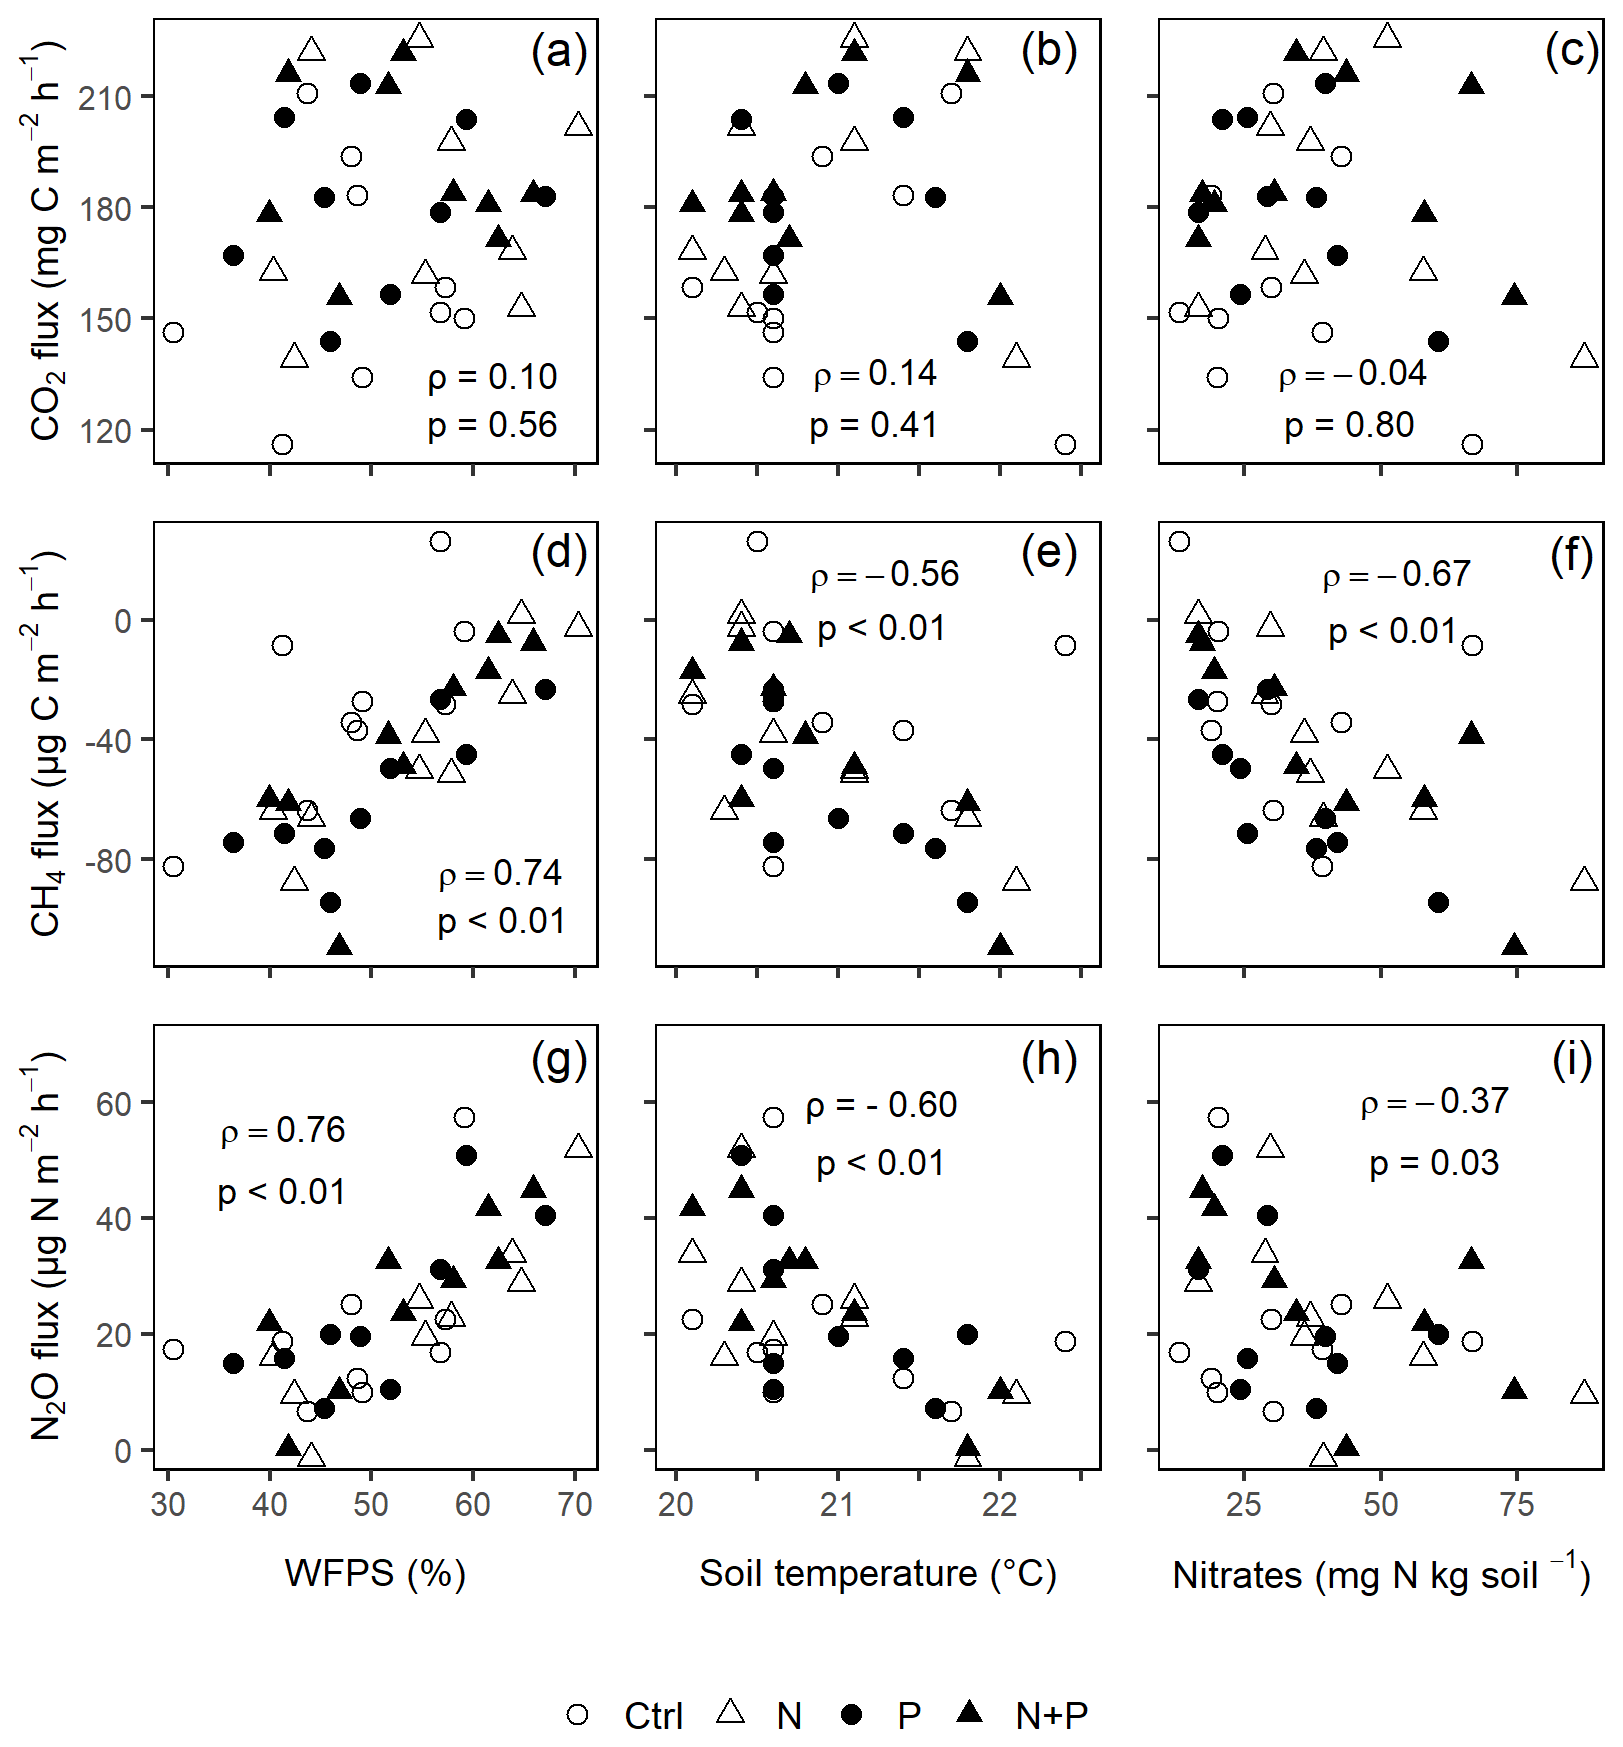
Figure 6The Spearman correlation coefficient between mean background CO2 (a–c), CH4 (d–f), and N2O (g–i) fluxes and WFPS (column 1), soil temperature (column 2), and nitrates (column 3) using monthly measurement means of four replicate treatment plots (i.e., control (Ctrl), nitrogen (N), phosphorus (P), and N + P) taken between May 2019 and June 2020 (p≤0.05; n=16; i.e., four replicate plots in each of the four treatments). ρ is Spearman's correlation coefficient.
4.3 Effect of N and P addition and soil environmental controls on soil N2O fluxes
The annual soil N2O fluxes from the control plots (Table 2) were at the higher end of those measured in (sub-)montane tropical forests (Iddris et al., 2020; Arias-Navarro et al., 2017; Gütlein et al., 2018) and at the lower end of those measured in lowland tropical forest sites (e.g., Koehler et al., 2009b). This may either be due to the differences in soil N cycling rates (Koehler et al., 2009b) or the differences in the spatial abundance of leguminous trees (Xu et al., 2020) at the respective sites.
The immediate flush of N2O following fertilization (in the transitory phase), both in the N and N + P addition plots (Figs. 3c and 4c), is due to the increase in soil N concentrations beyond microbial immobilization and plant N needs (Davidson et al., 2000), which is typical of an open or leaky N cycle (Koehler et al., 2009b). Contrary to Kaspari et al. (2008) and Koehler et al. (2009b), sustained N fertilization did not trigger a significant response in background soil N2O fluxes from N addition plots (Fig. 4f). This was unexpected, but given the rapid drainage at the site (sandy texture; Table 1), there could have been substantial loss of added N via leaching, which possibly rid the ecosystem of excess nitrates (Lohse and Matson, 2005; Martinson et al., 2013). Notably, sustained P addition did not result in increased background N2O fluxes (Fig. 4f), which contrasts the findings by Mori et al. (2017), who reported that P availability opens up the N cycle by stimulating mineralization of soil organic matter, releasing excess N that is lost as N2O emissions. At this study site, it could be that either the amount of P added in the experiment was not sufficient to trigger a response in background soil N2O fluxes or P is not a limiting nutrient for N2O fluxes given the relatively high pH of the site (Table 1).
Unexpectedly, nitrates correlated negatively to background N2O fluxes (Fig. 6i), yet many studies (e.g., Corre et al., 2014; Zhang et al., 2020) have found that nitrates and N2O fluxes were positively correlated. The likely explanation for such a relationship is the transformation of N2O to N2 under wet conditions, which further reduced the amount of nitrates in soil (Matson et al., 2017). Despite the minimal influence of seasonality on background N2O fluxes (Fig. 4f), a strong positive correlation between background N2O fluxes and WFPS was observed (Fig. 6g), which conforms to the explanation given by the conceptual hole in the pipe (HIP) model. The HIP model places soil aeration status (approximated by WFPS) second to N availability in controlling soil N2O fluxes. Soil aeration not only directly controls oxygen entry into the soil but also determines how N2O is produced (denitrification or nitrification) and transported out of the soil (Davidson et al., 2000). Whereas there seems to be a balance between the denitrification and nitrification process at this forest site (given that majority of the measurements corresponded to WFPS of ≤60 %; Fig. 6g), the considerable N2O fluxes at higher WFPS values (≥60 %; Fig. 6g) seem to suggest that denitrification is more dominant than nitrification in producing N2O in these biomes.
4.4 Implications of increasing N and P deposition rates on soil greenhouse gases from tropical forests
While this experiment was established to investigate how nutrient limitations constrain soil GHG fluxes, it also sheds valuable insights on how anthropogenic nutrient inputs (through deposition) may affect future soil GHG fluxes from African tropical forests and other tropical sites with a similarly strong seasonality, soil, and vegetation characteristics (Table 1). Nutrient depositions are often highest immediately after the onset of the rainy season (Wang et al., 2020), especially due to aerosol deposition following burning activities associated with deforestation during the dry season (Giglio et al., 2006; Roberts et al., 2009). Accordingly, we suspect that the increased N inputs during this short time may yield similar responses to those observed in the transitory period measured at this study site, namely N2O flushes when reactive nitrogen enters the soil. Although N additions did not elicit a positive N2O response during the background period, it is quite likely that our fertilization activities (from year 1 to year 2 of the study) had not gone on for long enough to simulate chronic long-term N additions. A study conducted by Koehler et al. (2009b) in Panama showed that 11 years of chronic N addition significantly increased both transitory and background soil N2O emissions.
In addition, this study shows that future increases in P deposition over tropical forests may significantly increase the CH4 sink capacity of tropical forest soils. Also, it was interesting to observe that the addition of N and P simultaneously resulted in increased CO2 effluxes immediately after fertilization, likely suggesting a co-limitation of N and P on soil respiration. This means that future increases in the deposition of N- and P-rich ashes (from biomass burning) might result in significant soil CO2 emissions from these biomes, while it is unclear if this is compensated via an increase in photosynthetic CO2 uptake, as indicated by Cernusak et al. (2013). In this context, it is important to note that it has been demonstrated by Barkley et al. (2019) that P derived from biomass burning aerosols is more soluble than the P from dust aerosols; hence, the former would have an immediate impact on ecosystem processes.
Nutrient manipulation studies premised in tropical forests are crucial to understand how these under-studied yet very important sinks and sources of soil GHGs subtly respond to changes in soil macronutrient availability. N fertilization (N and N + P) significantly increased N2O fluxes immediately after fertilization (transitory phase) but had no significant effect on background N2O fluxes, which might occur if the system would gain N over longer time spans. Against our expectations, neither background CO2 effluxes nor CH4 uptake decreased following addition of N, indicating that neither a negative effect of a potential surplus of soil N on root and microbial respiration nor a negative effect on methanotrophs. CO2 effluxes even showed a significant increase during the transitory phase following N and N + P fertilization. However, this effect was only significant for N + P addition, indicating some N and P co-limitation. An increase in CH4 uptake was found both shortly and after sustained P fertilization, supporting our second hypothesis which suggested that lifting the P limitation on soil methanotrophs would significantly increase CH4 consumption. Surprisingly, both transitory and background N2O and CO2 fluxes (including its different components) were not significantly affected by P fertilization. Overall, the results from this first nutrient manipulation GHG study from a wet African tropical forest site, in general, indicate our limited knowledge about the counteracting interactions between N and P inputs and GHG fluxes from different tropical forest ecosystems. This confines any general conclusions and equally limits our ability to parametrize tropical forest ecosystems in Earth system models. Nevertheless, the contribution of tropical forest biomes to the global soil GHG budgets maybe disproportionately altered via potential future increases in N and P availability.
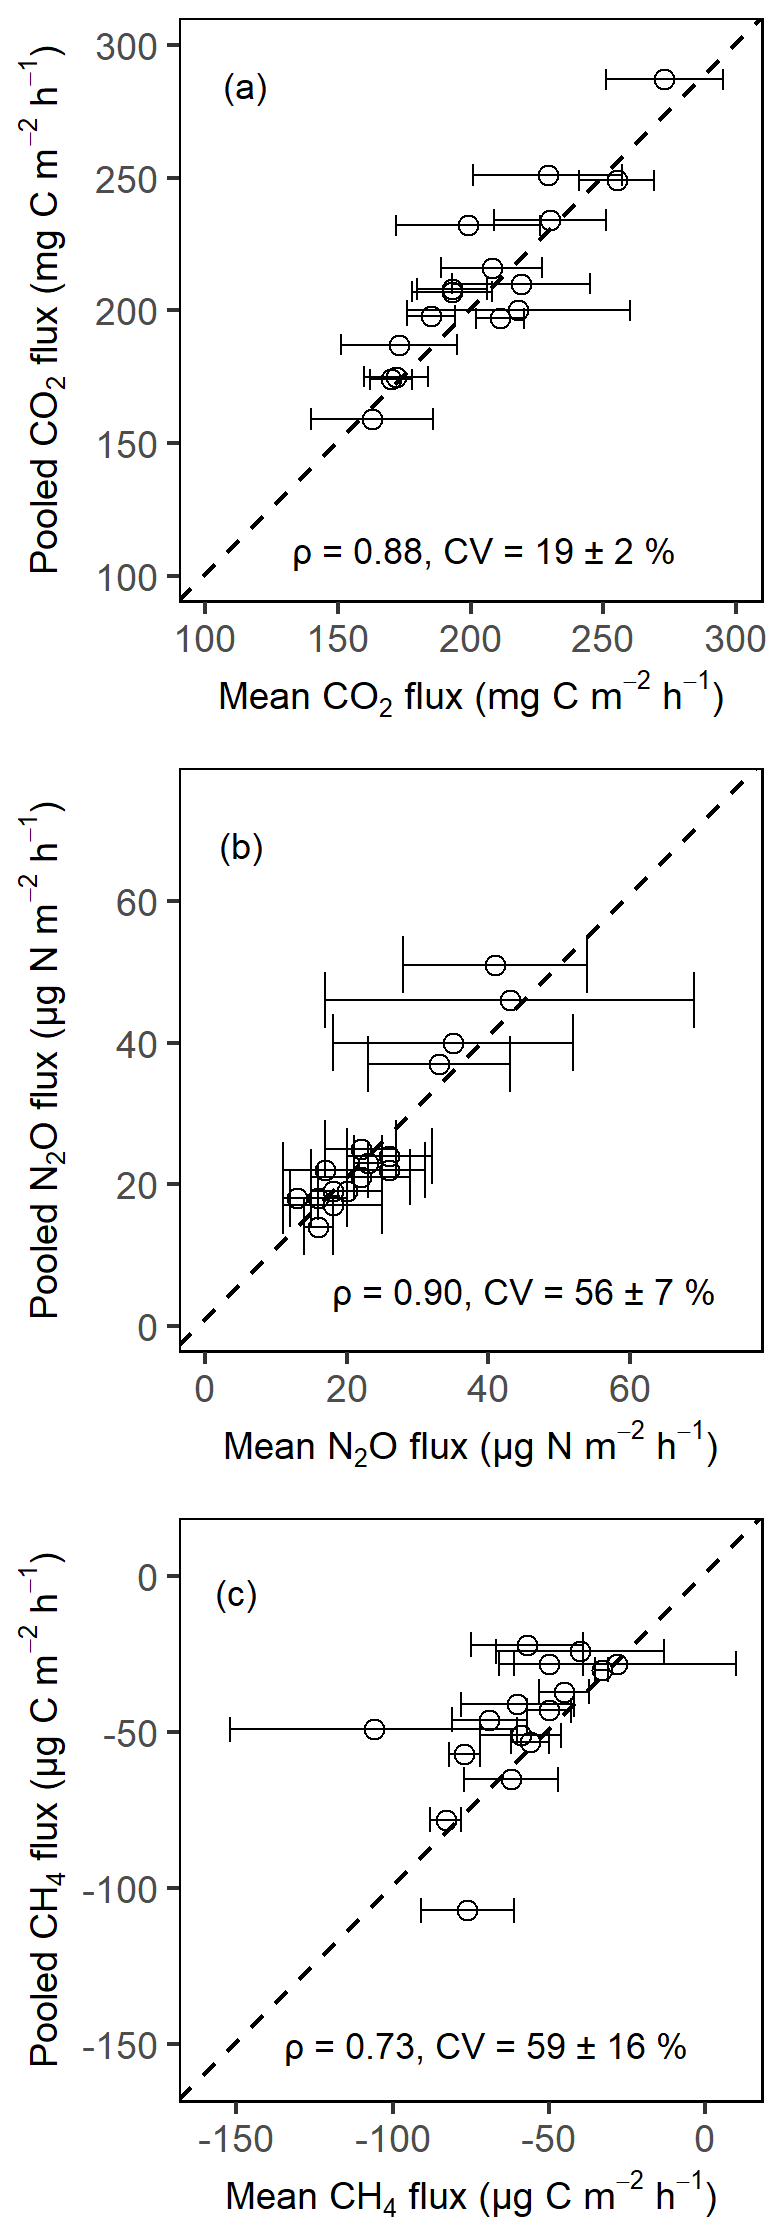
Figure A1Comparison of the soil CO2 fluxes (a), soil N2O fluxes (b), and soil CH4 fluxes (c) from pooled sampling and the mean of four chamber measurements for the month of February 2020 in the Budongo Central Forest Reserve. ρ is the Spearman correlation coefficient, and CV is the coefficient of variation. Error bars are derived from standard error of the mean.
Data are available on request.
JT and OvS conceptualized the study. OvS established the nutrient manipulation experiment. JT conducted the fieldwork, did the data analysis, and prepared the paper. OvS, PF, and SD provided significant input on the experimental setup and data analysis. RH and BM did the laboratory measurements and gave critical feedback on the paper. OvS, PF, SD, MG, and LFT critically reviewed and gave feedback on the paper.
The authors declare that they have no conflict of interest.
Publisher's note: Copernicus Publications remains neutral with regard to jurisdictional claims in published maps and institutional affiliations.
This article is part of the special issue “Tropical biogeochemistry of soils in the Congo Basin and the African Great Lakes region”. It is not associated with a conference.
We thank Fred Babweteera and the Budongo Conservation Field Station management for hosting the nutrient manipulation experiment and providing us with working space and the climatic data. Special thanks goes to Johan Six's laboratory at ETH Zürich for analyzing the gas samples. We are grateful to the German Academic Exchange for Joseph Tamale's stipend and for covering his travel costs between Uganda and Germany. We also thank the International Foundation of Science (IFS), Stockholm, Sweden, for the financial support towards Joseph Tamale's fieldwork in Uganda, and the National Agricultural Research Organization (NARO) for the institutional support and administration of the IFS grant. We thank the DFG-funded Emmy Noether Junior Research Group “TropSOC”, for the additional support towards this study, and the DFG-funded Individual Research project, for setting up the nutrient manipulation experiment. Lastly, we thank Gerald Brown Ayo and Moses Adriko for supporting our field measurements.
This research has been supported by the German Academic Exchange (grant no. 57381412), the International Foundation of Science, Stockholm, Sweden (grant no. D/6293-1), and the Deutsche Forschungsgemeinschaft (project no. 38747233; grant no. STR 1375/1-1).
This paper was edited by Pauline Chivenge and reviewed by two anonymous referees.
Adamek, M., Corre, M. D., and Hölscher, D.: Early effect of elevated nitrogen input on above-ground net primary production of a lower montane rain forest, Panama, J. Trop. Ecol., 256, 637–647, https://doi.org/10.1017/S0266467409990253, 2009.
Arias-Navarro, C., Díaz-Pinés, E., Kiese, R., Rosenstock, T. S., Rufino, M. C., Stern, D., Neufeldt, H., Verchot, L. V., and Butterbach-Bahl, K.: Gas pooling: A sampling technique to overcome spatial heterogeneity of soil carbon dioxide and nitrous oxide fluxes, Soil Biol. Biochem., 67, 20–23, https://doi.org/10.1016/j.soilbio.2013.08.011, 2013.
Arias-Navarro, C., Díaz-Pinés, E., Zuazo, P., Rufino, M. C., Verchot, L. V., and Butterbach-Bahl, K.: Quantifying the contribution of land use to N2O, NO and CO2 fluxes in a montane forest ecosystem of Kenya, Biogeochemistry, 134, 95–114, https://doi.org/10.1007/s10533-017-0348-3, 2017.
Aronson, E. L. and Helliker, B. R.: Methane flux in non-wetland soils in response to nitrogen addition: A meta-analysis, Ecology, 91, 3242–3251, https://doi.org/10.1890/09-2185.1, 2010.
Aronson, E. L., Dierick, D., Botthoff, J. K., Oberbauer, S., Zelikova, T. J., Harmon, T. C., Rundel, P., Johnson, R. F., Swanson, A. C., Pinto-Tomás, A. A., Artavia-León, A., Matarrita-Carranza, B., and Allen, M. F.: ENSO-influenced drought drives methane flux dynamics in a tropical wet forest soil, J. Geophys. Res., 124, 2267–2276, https://doi.org/10.1029/2018JG004832, 2019.
Barkley, A. E., Prospero, J. M., Mahowald, N., Hamilton, D. S., Popendorf, K. J., Oehlert, A. M., Pourmand, A., Gatineau, A., Panechou-Pulcherie, K., Blackwelder, P., and Gaston, C. J.: African biomass burning is a substantial source of phosphorus deposition to the Amazon, Tropical Atlantic Ocean, and Southern Ocean, P. Natl. Acad. Sci. USA, 116, 16216–16221, https://doi.org/10.1073/pnas.1906091116, 2019.
Baumgartner, S., Barthel, M., Drake, T. W., Bauters, M., Makelele, I. A., Mugula, J. K., Summerauer, L., Gallarotti, N., Cizungu Ntaboba, L., Van Oost, K., Boeckx, P., Doetterl, S., Werner, R. A., and Six, J.: Seasonality, drivers, and isotopic composition of soil CO2 fluxes from tropical forests of the Congo Basin, Biogeosciences, 17, 6207–6218, https://doi.org/10.5194/bg-17-6207-2020, 2020.
Bauters, M., Verbeeck, H., Rütting, T., Barthel, M., Bazirake Mujinya, B., Bamba, F., Bodé, S., Boyemba, F., Bulonza, E., Carlsson, E., Eriksson, L., Makelele, I., Six, J., Cizungu Ntaboba, L., and Boeckx, P.: Contrasting nitrogen fluxes in African tropical forests of the Congo Basin, Ecol. Monogr., 89, 1–17, https://doi.org/10.1002/ecm.1342, 2019.
Bobbink, R., Hicks, K., Galloway, J., Spranger, T., Alkemade, R., Ashmore, M., Bustamante, M., Cinderby, S., Davidson, E., Dentener, F., Emmett, B., Erisman, J. W., Fenn, M., Gilliam, F., Nordin, A., Pardo, L., and De Vries, W.: Global assessment of nitrogen deposition effects on terrestrial plant diversity: A synthesis, Ecol. Appl., 20, 30–59, https://doi.org/10.1890/08-1140.1, 2010.
Bodelier, P. L. E. and Steenbergh, A. K.: Interactions between methane and the nitrogen cycle in light of climate change, Curr. Opin. Env. Sust., 9–10, 26–36, https://doi.org/10.1016/j.cosust.2014.07.004, 2014.
Bréchet, L., Courtois, E. A., Saint-Germain, T., Janssens, I. A., Asensio, D., Ramirez-Rojas, I., Soong, J. L., Van Langenhove, L., Verbruggen, E., and Stahl, C.: Disentangling drought and nutrient effects on soil carbon dioxide and methane fluxes in a tropical forest, Frontiers in Environmental Sciences, 7, 180, https://doi.org/10.3389/fenvs.2019.00180, 2019.
Brune, A.: Symbiotic digestion of lignocellulose in termite guts, Nat. Rev. Microbiol., 12, 168–180, https://doi.org/10.1038/nrmicro3182, 2014.
Burton, A. J., Pregitzer, K. S., Crawford, J. N., Zogg, G. P., and Zak, D. R.: Simulated chronic deposition reduces soil respiration in northern hardwood forests, Glob. Change Biol., 10, 1080–1091, https://doi.org/10.1111/j.1365-2486.2004.00737.x, 2004.
Butterbach-Bahl, K., Kock, M., Willibald, G., Hewett, B., Buhagiar, S., Papen, H., and Kiese, R.: Temporal variations of fluxes of NO, NO2, N2O, CO2, and CH4 in a tropical rain forest ecosystem, Global Biogeochem. Cy., 18, 1–11, https://doi.org/10.1029/2004GB002243, 2004.
Butterbach-Bahl, K., Kiese, R., and Liu, C.: Measurements of biosphere–atmosphere exchange of CH4 in terrestrial ecosystems, Method. Enzymol., 495, 271–287, https://doi.org/10.1016/B978-0-12-386905-0.00018-8, 2011.
Cernusak, L. A., Winter, K., Dalling, J. W., Holtum, J. A., Jaramillo, C., Körner, C., Leakey, A. D., Norby, R. J., Poulter, B., Turner, B. L., and Wright, S. J.: Tropical forest responses to increasing atmospheric CO2: current knowledge and opportunities for future research. Funct. Plant Biol., 40, 531–551, https://doi.org/10.1071/FP12309, 2013.
Chen, D., Zhou, L., Rao, X., Lin, Y., and Fu, S.: Effects of root diameter and root nitrogen concentration on in situ root respiration among different seasons and tree species, Ecol. Res., 25, 983–993, https://doi.org/10.1007/s11284-010-0722-2, 2010.
Cleveland, C. C. and Townsend, A. R.: Nutrient additions to a tropical rain forest drive substantial soil carbon dioxide losses to the atmosphere, P. Natl. Acad. Sci. USA, 103, 10316–10321, https://doi.org/10.1073/pnas.0600989103, 2006.
Corre, M. D., Veldkamp, E., Arnold, J., and Wright, S. J.: Impact of elevated N input on soil N cycling and losses in old-growth lowland and montane forests in Panama. Ecology, 91, 1715–1729, https://doi.org/10.1890/09-0274.1, 2010.
Corre, M. D., Sueta, J. P., and Veldkamp, E.: Nitrogen-oxide emissions from tropical forest soils exposed to elevated nitrogen input strongly interact with rainfall quantity and seasonality, Biogeochemistry, 118, 103–120, https://doi.org/10.1007/s10533-013-9908-3, 2014.
Cusack, D. F., Silver, W. L., Torn, M. S., Burton, S. D., and Firestone, M. K.: Changes in microbial community characteristics and soil organic matter with nitrogen additions in two tropical forests, Ecology, 92, 621–632, https://doi.org/10.1890/10-0459.1, 2011.
Davidson, E. A., Keller, M., Erickson, H. E., Verchot, L. V., and Veldkamp, E.: Testing a conceptual model of soil emissions of nitrous and nitric oxides, Bioscience, 50, 667–680, https://doi.org/10.1641/0006-3568(2000)050[0667:TACMOS]2.0.CO;2, 2000.
DeForest, J. L., Noormets, A., McNulty, S. G., Sun, G., Tenney, G., and Chen, J.: Phenophases alter the soil respiration-temperature relationship in an oak-dominated forest, Int. J. Biometeorol., 51, 135–144, https://doi.org/10.1007/s00484-006-0046-7, 2006.
Doetterl, S., Stevens, A., Six, J., Merckx, R., Oost, K. Van, Pinto, M. C., Casanova-Katny, A., Muñoz, C., Boudin, M., Venegas, E. Z., and Boeckx, P.: Soil carbon storage controlled by interactions between geochemistry and climate, Nat. Geosci., 8, 780–783, https://doi.org/10.1038/NGEO2516, 2015.
Du, E., Xia, N., and de Vries, W.: Effects of nitrogen deposition on growing-season soil methane sink across global forest biomes, Biogeosciences Discuss. [preprint], https://doi.org/10.5194/bg-2019-29, 2019.
Dutaur, L. and Verchot, L. V.: A global inventory of the soil CH4 sink, Global Biogeochem. Cy., 21, 1–9, https://doi.org/10.1029/2006GB002734, 2007.
Eggeling, W. J.: Observations on the ecology of the Budongo rainforest, Uganda, J. Ecol., 34, 20–87, https://doi.org/10.2307/2256760, 1947.
Fanin, N., Hättenschwiler, S., Schimann, H., and Fromin, N.: Interactive effects of C, N and P fertilization on soil microbial community structure and function in an Amazonian rain forest, Funct. Ecol., 29, 140–150, https://doi.org/10.1111/1365-2435.12329, 2015.
Galloway, J., Dentener, F., Capone, D., Boyer, E., and Howarth, R.: Nitrogen cycles: past, present, and future, Biogeochemistry, 70, 153–226, https://doi.org/10.1007/s10533-004-0370-0, 2004.
Giglio, L., Csiszar, I., and Justice, C. O.: Global distribution and seasonality of active fires as observed with Terra and Aqua Moderate Resolution Imaging Spectroradiometers (MODIS) sensors, J. Geophys. Res., 111, G02016, https://doi.org/10.1029/2005JG000142, 2006.
Gray, N. D., McCann, C. M., Christgen, B., Ahammad, S. Z., Roberts, J. A., and Graham, D. W.: Soil geochemistry confines microbial abundances across an arctic landscape; implications for net carbon exchange with the atmosphere, Biogeochemistry, 120, 307–317, https://doi.org/10.1007/s10533-014-9997-7, 2014.
Gütlein, A., Gerschlauer, F., Kikoti, I., and Kiese, R.: Impacts of climate and land use on N2O and CH4 fluxes from tropical ecosystems in the Mt. Kilimanjaro region, Tanzania, Glob. Change Biol., 24, 1239–1255, https://doi.org/10.1111/gcb.13944, 2018.
Hall, S. J. and Matson P. A.: Nutrient status of tropical rain forests influences soil N dynamics after N additions. Ecol. Monogr., 73, 107–129, jstor.org/stable/3100077, 2003.
Hashimoto, S., Tanaka, N., Suzuki, M., Inoue, A., Takizawa, H., Kosaka, I., Tanaka, K., Tantasirin, C., and Tangtham, N.: Soil respiration and soil CO2 concentration in a tropical forest, Thailand, J. For. Res.-Jpn., 9, 75–79, https://doi.org/10.1007/s10310-003-0046-y, 2004.
Hassler, E., Corre, M. D., Tjoa, A., Damris, M., Utami, S. R., and Veldkamp, E.: Soil fertility controls soil–atmosphere carbon dioxide and methane fluxes in a tropical landscape converted from lowland forest to rubber and oil palm plantations, Biogeosciences, 12, 5831–5852, https://doi.org/10.5194/bg-12-5831-2015, 2015.
Hedin, L. O., Vitousek, P. M., and Matson, P. A.: Nutrient losses over four million years of tropical forest development, Ecology., 84, 2231–2255, https://doi.org/10.1890/02-4066, 2003.
Hicks, L. C., Meir, P., Nottingham, A. T., Reay, D. S., Stott, A. W., Salinas, N., and Whitaker, J.: Carbon and nitrogen inputs differentially affect priming of soil organic matter in tropical lowland and montane soils, Soil Biol. Biochem., 129, 212–222, https://doi.org/10.1016/j.soilbio.2018.10.015, 2019.
Hobbie, S. E. and Vitousek, P. M.: Nutrient limitation of decomposition in Hawaiian forests, Ecology, 81, 1867–1877, https://doi.org/10.1890/0012-9658(2000)081[1867:NLODIH]2.0.CO;2, 2000.
Holland, E. A., Neff, J. C., Townsend, A. R., and McKeown, B.: Uncertainties in the temperature sensitivity of decomposition in tropical and subtropical ecosystems: Implications for models, Global Biogeochem. Cy., 14, 1137–1151, https://doi.org/10.1029/2000GB001264, 2000.
Iddris, N. A.-A., Corre, M. D., Yemefack, M., van Straaten, O., and Veldkamp, E.: Stem and soil nitrous oxide fluxes from rainforest and cacao agroforest on highly weathered soils in the Congo Basin, Biogeosciences, 17, 5377–5397, https://doi.org/10.5194/bg-17-5377-2020, 2020.
IUSS Working Group WRB: World reference base for soil resources 2014. International soil classification system for naming soils and creating legends for soil maps, FAO, Rome, Italy, 106, 2014.
Jiang, X., Chen, H., Peng, C., Li, Y., He, Y., Chen, D., Lin, M., Hu, J., Ma, T., Liu, L., Liu, X., Xia, M., and Liu, Y.: Soil carbon dioxide fluxes from three forest types of the tropical montane rainforest on Hainan Island, China, Water Air Soil Poll., 227, 1–14, https://doi.org/10.1007/s11270-016-2904-1, 2016.
Jobbágy, E. G. and Jackson, R. B.: The vertical distribution of soil organic carbon and its relation to climate and vegetation, Ecol. Appl., 10, 423–436, https://doi.org/10.1890/1051-0761(2000)010[0423:TVDOSO]2.0.CO;2, 2000.
John, R., Dalling, J. W., Harms, K. E., Yavitt, J. B., Stallard, R. F., Mirabello, M., Hubbell, S. P., Valencia, R., Navarrete, H., Vallejo, M., and Foster, R. B.: Soil nutrients influence spatial distributions of tropical trees species, P. Natl. Acad. Sci. USA, 104, 864–869, https://doi.org/10.1073/pnas.0604666104, 2007.
Kaspari, M., Garcia, M. N., Harms, K. E., Santana, M., Wright, S. J., and Yavitt, J. B.: Multiple nutrients limit litterfall and decomposition in a tropical forest, Ecol. Lett., 11, 35–43, https://doi.org/10.1111/j.1461-0248.2007.01124.x, 2008.
Koehler, B., Corre, M. D., Veldkamp, E., and Sueta, J. P.: Chronic nitrogen addition causes a reduction in soil carbon dioxide efflux during the high stem-growth period in a tropical montane forest but no response from a tropical lowland forest on a decadal time scale, Biogeosciences, 6, 2973–2983, https://doi.org/10.5194/bg-6-2973-2009, 2009a.
Koehler, B., Corre, M. D., Veldkamp, E., Wullaert, H., and Wright, S. J.: Immediate and long-term nitrogen oxide emissions from tropical forest soils exposed to elevated nitrogen input, Glob. Change Biol., 15, 2049–2066, https://doi.org/10.1111/j.1365-2486.2008.01826.x, 2009b.
Li, Y., Xu, M., and Zou, X.: Effects of nutrient additions on ecosystem carbon cycle in a Puerto Rican tropical wet forest, Glob. Change Biol., 12, 284–293, https://doi.org/10.1111/j.1365-2486.2005.01096.x, 2006.
Li, Y., Sun, J., Tian, D., Wang, J., Ha, D., Qu, Y., Jing, G., and Niu, S.: Soil acid cations induced reduction in soil respiration under nitrogen enrichment and soil acidification, Sci. Total Environ., 615, 1535–1546, https://doi.org/10.1016/j.scitotenv.2017.09.131, 2018.
Lohse, K. A. and Matson, P.: Consequences of nitrogen additions for soil losses from wet tropical forests, Ecol. Appl., 15, 1629–1648, https://doi.org/10.1890/03-5421, 2005.
Lukwago, W., Behangana, M., Mwavu, E. N., and Hughes, D. F.: Effects of selective timber harvest on amphibian species diversity in Budongo forest Reserve, Uganda, Forest Ecol. Manag., 458, 1–7, https://doi.org/10.1016/j.foreco.2019.117809, 2020.
Ma, S., Chen, G., Tian, D., Du, E., Xiao, W., Jiang, L., Zhou, Z., Zhu, J., He, H., Zhu, B., and Fang, J.: Effects of seven-year nitrogen and phosphorus additions on soil microbial community structures and residues in a tropical forest in Hainan Island, China, Geoderma, 361, 114034, https://doi.org/10.1016/j.geoderma.2019.114034, 2020.
Malhi, Y. and Phillips, O. L.: Tropical forests and global atmospheric change: A synthesis, Philos. Tr. Roy. Soc. B, 359, 549–555, https://doi.org/10.1098/rstb.2003.1449, 2004.
Martinson, G. O., Corre, M. D., and Veldkamp, E.: Responses of nitrous oxide fluxes and soil nitrogen cycling to nutrient additions in montane forests along an elevation gradient in southern Ecuador, Biogeochemistry, 112, 625–636, https://doi.org/10.1007/s10533-012-9753-9, 2013.
Matson, A. L., Corre, M. D., and Veldkamp, E.: Nitrogen cycling in canopy soils of tropical montane forests responds rapidly to indirect N and P fertilization, Glob. Change Biol., 20, 3802–3813, https://doi.org/10.1111/gcb.12668, 2014.
Matson, A. L., Corre, M. D., Langs, K., and Veldkamp, E.: Soil trace gas fluxes along orthogonal precipitation and soil fertility gradients in tropical lowland forests of Panama, Biogeosciences, 14, 3509–3524, https://doi.org/10.5194/bg-14-3509-2017, 2017.
McGroddy, M. E., Baisden, W. T., and Hedin, L. O.: Stoichiometry of hydrological C, N, and P losses across climate and geology: An envionmental matrix approach across New Zealand primary forests, Global Biogeochem. Cy., 22, 1–14, https://doi.org/10.1029/2007GB003005, 2008.
Mori, T., Ohta, S., Ishizuka, S., Konda, R., Wicaksono, A., Heriyanto, J., and Hardjono, A.: Effects of phosphorus addition on N2O and NO emissions from soils of an Acacia mangium plantation, Soil Sci. Plant Nutr., 56, 782–788, https://doi.org/10.1111/j.1747-0765.2010.00501.x, 2010.
Mori, T., Ohta, S., Ishizuka, S., Konda, R., Wicaksono, A., Heriyanto, J., and Hardjono, A.: Effects of phosphorus application on root respiration and heterotrophic microbial respiration in Acacia mangium plantation soil, Tropics, 22, 113–118, https://doi.org/10.3759/tropics.22.113, 2013.
Mori, T., Wachrinrat, C., Staporn, D., Meunpong, P., Suebsai, W., Matsubara, K., Boonsri, K., Lumban, W., Kuawong, M., Phukdee, T., Srifai, J., and Boonman, K.: Effects of phosphorus addition on nitrogen cycle and fluxes of N2O and CH4 in tropical tree plantation soils in Thailand, Agr. Nat. Res., 51, 91–95, https://doi.org/10.1016/j.anres.2016.03.002, 2017.
Mori, T., Lu, X., Aoyagi, R., and Mo, J.: Reconsidering the phosphorus limitation of soil microbial activity in tropical forests, Funct. Ecol., 32, 1145–1154, https://doi.org/10.1111/1365-2435.13043, 2018.
Mosier, A., Wassmann, R., Verchot, L., King, J., and Palm, C.: Methane and nitrogen oxide fluxes in tropical agricultural soils: Sources, sinks and mechanisms, Environ. Dev. Sustain., 6, 11–49, https://doi.org/10.1023/B:ENVI.0000003627.43162.ae, 2004.
Müller, A. K., Matson, A. L., Corre, M. D., and Veldkamp, E.: Soil N2O fluxes along an elevation gradient of tropical montane forests under experimental nitrogen and phosphorus addition, Front. Earth Sci., 3, 66, https://doi.org/10.3389/feart.2015.00066, 2015.
Nauer, P. A., Hutley, L. B., and Arndt, S. K.: Termite mounds mitigate half of termite methane emissions, P. Natl. Acad. Sci. USA, 115, 13306–13311, https://doi.org/10.1073/pnas.1809790115, 2018.
Nottingham, A. T., Whitaker, J., Turner, B. L., Salinas, N., Zimmermann, M., Malhi, Y., and Meir, P.: Climate Warming and Soil Carbon in Tropical Forests: Insights from an Elevation Gradient in the Peruvian Andes, Bioscience, 65, 906–921, https://doi.org/10.1093/biosci/biv109, 2015.
Oertel, C., Matschullat, J., Zurba, K., Zimmermann, F., and Erasmi, S.: Greenhouse gas emissions from soils – A review, Chemie der Erde, 76, 327–352, https://doi.org/10.1016/j.chemer.2016.04.002, 2016.
Pavelka, M., Acosta, M., Kiese, R., Altimir, N., Brümmer, C., Crill, P., Darenova, E., Fuß, R., Gielen, B., Graf, A., and Klemedtsson, L.: Standardization of chamber technique for CO2, N2O and CH4 fluxes measurements from terrestrial ecosystems, Int. Agrophys., 32, 569–587, https://doi.org/10.1515/intag-2017-0045, 2018.
Pendall, E., Schwendenmann, L., Rahn, T., Miller, J. B., Tans, P. P., and White, J. W. C.: Land use and season affect fluxes of CO2, CH4, CO, N2O and H2 and isotopic source signatures in Panama: Evidence from nocturnal boundary layer profiles, Glob. Change Biol., 16, 2721–2736, https://doi.org/10.1111/j.1365-2486.2010.02199.x, 2010.
R Development Core Team: a language and environment for statistical computing, R Foundation for Statistical Computing, Vienna, Austria, 2019.
Roberts, G., Wooster, M. J., and Lagoudakis, E.: Annual and diurnal african biomass burning temporal dynamics, Biogeosciences, 6, 849–866, https://doi.org/10.5194/bg-6-849-2009, 2009.
Saatchi, S. S., Harris, N. L., Brown, S., Lefsky, M., Mitchard, E. T. A., Salas, W., Zutta, B. R., Buermann, W., Lewis, S. L., Hagen, S., Petrova, S., White, L., Silman, M., and Morel, A.: Benchmark map of forest carbon stocks in tropical regions across three continents, P. Natl. Acad. Sci. USA, 108, 9899–9904, https://doi.org/10.1073/pnas.1019576108, 2011.
Seghers, D., Top, E. M., Reheul, D., Bulcke, R., Boeckx, P., Verstraete, W., and Siciliano, S. D.: Long-term effects of mineral versus organic fertilizers on activity and structure of the methanotrophic community in agricultural soils, Environ. Microbiol., 5, 867–877, https://doi.org/10.1046/j.1462-2920.2003.00477.x, 2003.
Sjögersten, S., Aplin, P., Gauci, V., Peacock, M., Siegenthaler, A., and Turner, B. L.: Temperature response of ex-situ greenhouse gas emissions from tropical peatlands: Interactions between forest type and peat moisture conditions, Geoderma, 324, 47–55, https://doi.org/10.1016/j.geoderma.2018.02.029, 2018.
Soong, J. L., Marañon-Jimenez, S., Cotrufo, M. F., Boeckx, P., Bodé, S., Guenet, B., Peñuelas, J., Richter, A., Stahl, C., Verbruggen, E., and Janssens, I. A.: Soil microbial CNP and respiration responses to organic matter and nutrient additions: Evidence from a tropical soil incubation, Soil Biol. Biochem., 122, 141–149, https://doi.org/10.1016/j.soilbio.2018.04.011, 2018.
Sousa Neto, E., Carmo, J. B., Keller, M., Martins, S. C., Alves, L. F., Vieira, S. A., Piccolo, M. C., Camargo, P., Couto, H. T. Z., Joly, C. A., and Martinelli, L. A.: Soil-atmosphere exchange of nitrous oxide, methane and carbon dioxide in a gradient of elevation in the coastal Brazilian Atlantic forest, Biogeosciences, 8, 733–742, https://doi.org/10.5194/bg-8-733-2011, 2011.
Tamatamah, R. A., Hecky, R. E., and Duthie, H. C.: The atmospheric deposition of phosphorus in Lake Victoria (East Africa), Biogeochemistry, 73, 325–344, https://doi.org/10.1007/s10533-004-0196-9, 2005.
Tanner, E. V. J., Vltousek, P. M., and Cuevas, E.: Experimental investigation of nutrient limitation of forest growth on wet tropical mountains, Ecology, 79, 10–22, https://doi.org/10.1890/0012-9658(1998)079[0010:EIONLO]2.0.CO;2, 1998.
Townsend, A. R., Vitousek, P. M., and Trumbore, S. E.: Soil organic matter dynamics along gradients in temperature and land use on the island of Hawaii, Ecology, 76, 721–733, https://doi.org/10.2307/1939339, 1995.
van Straaten, H. P.: Präkambrium und junges Western Rift im Bunyoro Distrikt, NW- Uganda (Ostafrika), in: Geologisches Jahrbuch, Reihe B, Heft 18. Hannover, Schweizerbart Science Publishers, 1976.
van Straaten, O., Veldkamp, E., and Corre, M. D.: Simulated drought reduces soil CO2 efflux and production in a tropical forest in Sulawesi, Indonesia, Ecosphere, 2, 1–22, https://doi.org/10.1890/es11-00079.1, 2011.
Veber, G., Kull, A., Villa, J. A., Maddison, M., Paal, J., Oja, T., Iturraspe, R., Pärn, J., Teemusk, A., and Mander, Ü.: Greenhouse gas emissions in natural and managed peatlands of America: Case studies along a latitudinal gradient, Ecol. Eng.,114, 34–45, https://doi.org/10.1016/j.ecoleng.2017.06.068, 2018.
Veldkamp, E., Koehler, B., and Corre, M. D.: Indications of nitrogen-limited methane uptake in tropical forest soils, Biogeosciences, 10, 5367–5379, https://doi.org/10.5194/bg-10-5367-2013, 2013.
Verchot, L. V., Dannenmann, M., Kengdo, S. K., Njine-Bememba, C. B., Rufino, M. C., Sonwa, D. J., and Tejedor, J.: Land-use change and Biogeochemical controls of soil CO2, N2O and CH4 fluxes in Cameroonian forest landscapes, J. Integr. Environ. Sci., 17, 1–23, https://doi.org/10.1080/1943815X.2020.1779092, 2020.
Wang, C. K. and Yang J. Y.: Rhizospheric and heterotrophic components of soil respiration in six Chinese temperate forests. Glob. Change Biol., 13, 123–131, https://doi.org/10.1111/j.1365-2486.2006.01291.x, 2007.
Wang, Z., Zhang, X., Liu, L., Cheng, M., and Xu, J.: Spatial and seasonal patterns of atmospheric nitrogen deposition in North China, Atmos. Sci. Lett., 13, 188–194, https://doi.org/10.1080/16742834.2019.1701385, 2020.
Wanyama, I., Pelster, D. E., Butterbach-Bahl, K., Verchot, L. V., Martius, C., and Rufino, M. C.: Soil carbon dioxide and methane fluxes from forests and other land use types in an African tropical montane region, Biogeochemistry, 143, 171–190, https://doi.org/10.1007/s10533-019-00555-8, 2019.
Wei, Z., Jiangming, M., Yunting, F., Xiankai, L., and Hui, W.: Effects of nitrogen deposition on the greenhouse gas fluxes from forest soils, Acta Ecologica Sinica, 28, 2309–2319, https://doi.org/10.1016/S1872-2032(08)60047-5, 2008.
Wolf, K., Veldkamp, E., Homeier, J., and Martinson, G. O.: Nitrogen availability links forest productivity, soil nitrous oxide and nitric oxide fluxes of a tropical montane forest in southern Ecuador, Global Biogeochem. Cy., 25, 1–12, https://doi.org/10.1029/2010GB003876, 2011.
Wright, S. J., Yavitt, J. B., Wurzburger, N., Turner, B. L., Tanner, E. V., Sayer, E. J., Santiago, L. S., Kaspari, M., Hedin, O, L., Harms, E, K., Garcia, N. M., and Corre, M. D.: Potassium, phosphorus, or nitrogen limit root allocation, tree growth, or litter production in a lowland tropical forest. Ecology, 92, 1616–1625, https://doi.org/10.1890/10-1558.1, 2011.
Xu, H., Detto, M., Fang, S., Chazdon, R. L., Li, Y., Hau, B. C. H., Fischer, G. A., Weiblen, G. D., Hogan, J. A., Zimmerman, J. K., Uriarte, M., Thompson, J., Lian, J., Cao, K., Kenfack, D., Alonso, A., Bissiengou, P., Memiaghe, H. R., Valencia, R., Yap, S. L., Davies, S. J., Mi, X., and Yao, T. L.: Soil nitrogen concentration mediates the relationship between leguminous trees and neighbor diversity in tropical forests, Communications Biology, 3, 1–8, https://doi.org/10.1038/s42003-020-1041-y, 2020.
Yan, Y., Sha, L., Cao, M., Zheng, Z., Tang, J., Wang, Y., Zhang, Y., Wang, R., Liu, G., Wang, Y., and Sun, Y.: Fluxes of CH4 and N2O from soil under a tropical seasonal rain forest in Xishuangbanna, Southwest China, J. Environ. Sci., 20, 207–215, https://doi.org/10.1016/S1001-0742(08)60033-9, 2008.
Yan, G., Xing, Y., Xu, L., Wang, J., Dong, X., Shan, W., Guo, L., and Wang, Q.: Effects of different nitrogen additions on soil microbial communities in different seasons in a boreal forest, Ecosphere, 8, 1–19, https://doi.org/10.1002/ecs2.1879, 2017.
Yu, L., Wang, Y., Zhang, X., Dörsch, P., and Mulder, J.: Phosphorus addition mitigates N2O and CH4 emissions in N-saturated subtropical forest, SW China, Biogeosciences, 14, 3097–3109, https://doi.org/10.5194/bg-14-3097-2017, 2017.
Zhang, T., Zhu, W., Mo, J., Liu, L., and Dong, S.: Increased phosphorus availability mitigates the inhibition of nitrogen deposition on CH4 uptake in an old-growth tropical forest, southern China, Biogeosciences, 8, 2805–2813, https://doi.org/10.5194/bg-8-2805-2011, 2011.
Zhang, W., Mo, J., Yu, G., Fang, Y., Li, D., Lu, X., and Wang, H.: Emissions of nitrous oxide from three tropical forests in Southern China in response to simulated nitrogen deposition, Plant Soil, 306, 221–236, https://doi.org/10.1007/s11104-008-9575-7, 2008.
Zhang, Y., Ma, M., Fang, H., Qin, D., Cheng, S., and Yuan, W.: Impacts of nitrogen addition on nitrous oxide emission: Comparison of five nitrous oxide modules or algorithms, Ecol. Model., 421, 108963, https://doi.org/10.1016/j.ecolmodel.2020.108963, 2020.
Zheng, M., Zhang, T., Liu, L., Zhang, W., Lu, X., and Mo, J.: Effects of nitrogen and phosphorus additions on soil methane uptake in disturbed forests, J. Geophys. Res., 121, 3089–3100, https://doi.org/10.1002/2016JG003476, 2016.