the Creative Commons Attribution 4.0 License.
the Creative Commons Attribution 4.0 License.
 | 16 Dec 2020
Comparison of regolith physical and chemical characteristics with geophysical data along a climate and ecological gradient, Chilean Coastal Cordillera (26 to 38° S)
Mirjam Schaller
Igor Dal Bo
Todd A. Ehlers
Anja Klotzsche
Reinhard Drews
Juan Pablo Fuentes Espoz
Jan van der Kruk
We combine geophysical observations from ground-penetrating radar (GPR) with regolith physical and chemical properties from pedons excavated in four study areas spanning 1300 km of the climate and ecological gradient in the Chilean Coastal Cordillera. Our aims are the following: (1) to relate GPR observations to depth-varying regolith physical and weathering-related chemical properties in adjacent pedons and (2) to evaluate the lateral extent to which these properties can be extrapolated along a hillslope using GPR observations. Physical observations considered include regolith bulk density and grain size distribution, whereas chemical observations are based on major and trace element analysis. Results indicate that visually determined pedolith thickness and the transition from the B to C horizons generally correlate with maximums in the 500 and 1000 MHz GPR envelope profiles. To a lesser degree, these maximums in the GPR envelope profiles agree with maximums in weathering-related indices such as the chemical index of alteration (CIA) and the chemical index of mass transfer (τ) for Na. Finally, we find that upscaling from the pedon to hillslope scale is possible with geophysical methods for certain pedon properties. Taken together, these findings suggest that the GPR profiles down hillslopes can be used to infer lateral thickness variations in pedolith horizons in different ecologic and climate settings, and to some degree the physical and chemical variations with depth.
- Article
(30513 KB) - Full-text XML
-
Supplement
(6641 KB) - BibTeX
- EndNote


Weathering of bedrock by biotic and abiotic processes produces regolith which provides resources for life. Most biota is found in the mobile pedolith, which overlies the immobile saprolith. The pedolith is replenished with nutrients from the saprolith through chemical weathering and erosion that drives nutrient uplift towards the surface (e.g., Porder et al., 2007). The thickness and production of pedolith is influenced by aspect, topography, composition (mineral content), biota, climate, tectonically driven rock uplift, and time (e.g., Hilgard, 1914; Jenny, 1994). However, subsurface variations in pedolith thickness at the scale of hillslopes are difficult to quantify because of lack of exposure. Thus, subsurface imaging by geophysical techniques, when calibrated to regolith excavations (pedons), offers a potential means to characterize spatial variability in pedolith thickness and regolith properties (e.g., Mellett, 1995; Doolittle and Collins, 1995; Miller et al., 2002). Here, we evaluate the utility of applying ground-penetrating radar (GPR) to map variations in physical and chemical regolith properties caused by diverse climate and ecological settings.
Previous work has attributed spatial variations in pedolith thickness to hillslope curvature (Heimsath et al., 1997, 1999), which determines the downslope rate of mass transport assuming a diffusion-based geomorphic transport law (e.g., Roering et al., 2001). However, this single-point information is spatially restricted and pedon excavations are time-intensive. To further understand spatial variations in pedolith and saprolith thickness, other approaches such as modeling (e.g., Scarpone et al., 2016) and geophysical imaging (e.g., see summary in Parsekian et al., 2015) have been applied. For example, pedolith thickness variations were extrapolated from digital elevation models (DEMs) in combination with several different observations at single locations (e.g., Scarpone et al., 2016). Different geophysical techniques have provided a non-invasive or minimally invasive approach to view pedolith variations down to the saprolith and bedrock interface (e.g., Parsekian et al., 2015). Whereas high-frequency GPR has proven suitable for investigating pedolith layering and thickness (e.g., Doolittle et al., 2007; Gerber et al., 2010; Roering et al., 2010; Dal Bo et al., 2019), other methods such as seismics (e.g., Holbrook et al., 2014), electrical resistivity tomography (ERT, e.g., Braun et al., 2009), and low-frequency GPR (e.g., Aranha et al., 2002) are better suited to image saprolith and bedrock interfaces (e.g., Parsekian et al., 2015). GPR methods were also previously used to indirectly measure water flow (e.g., Zhang et al., 2014; Guo et al., 2020) as well as root density (e.g., Hruska et al., 1999; Guo et al., 2013). Interpreting the interplay of GPR signals with physical and chemical regolith properties is challenging (e.g., Saarenketo, 1998; Sucre et al., 2011; Tosti et al., 2013; Sarkar et al., 2019).
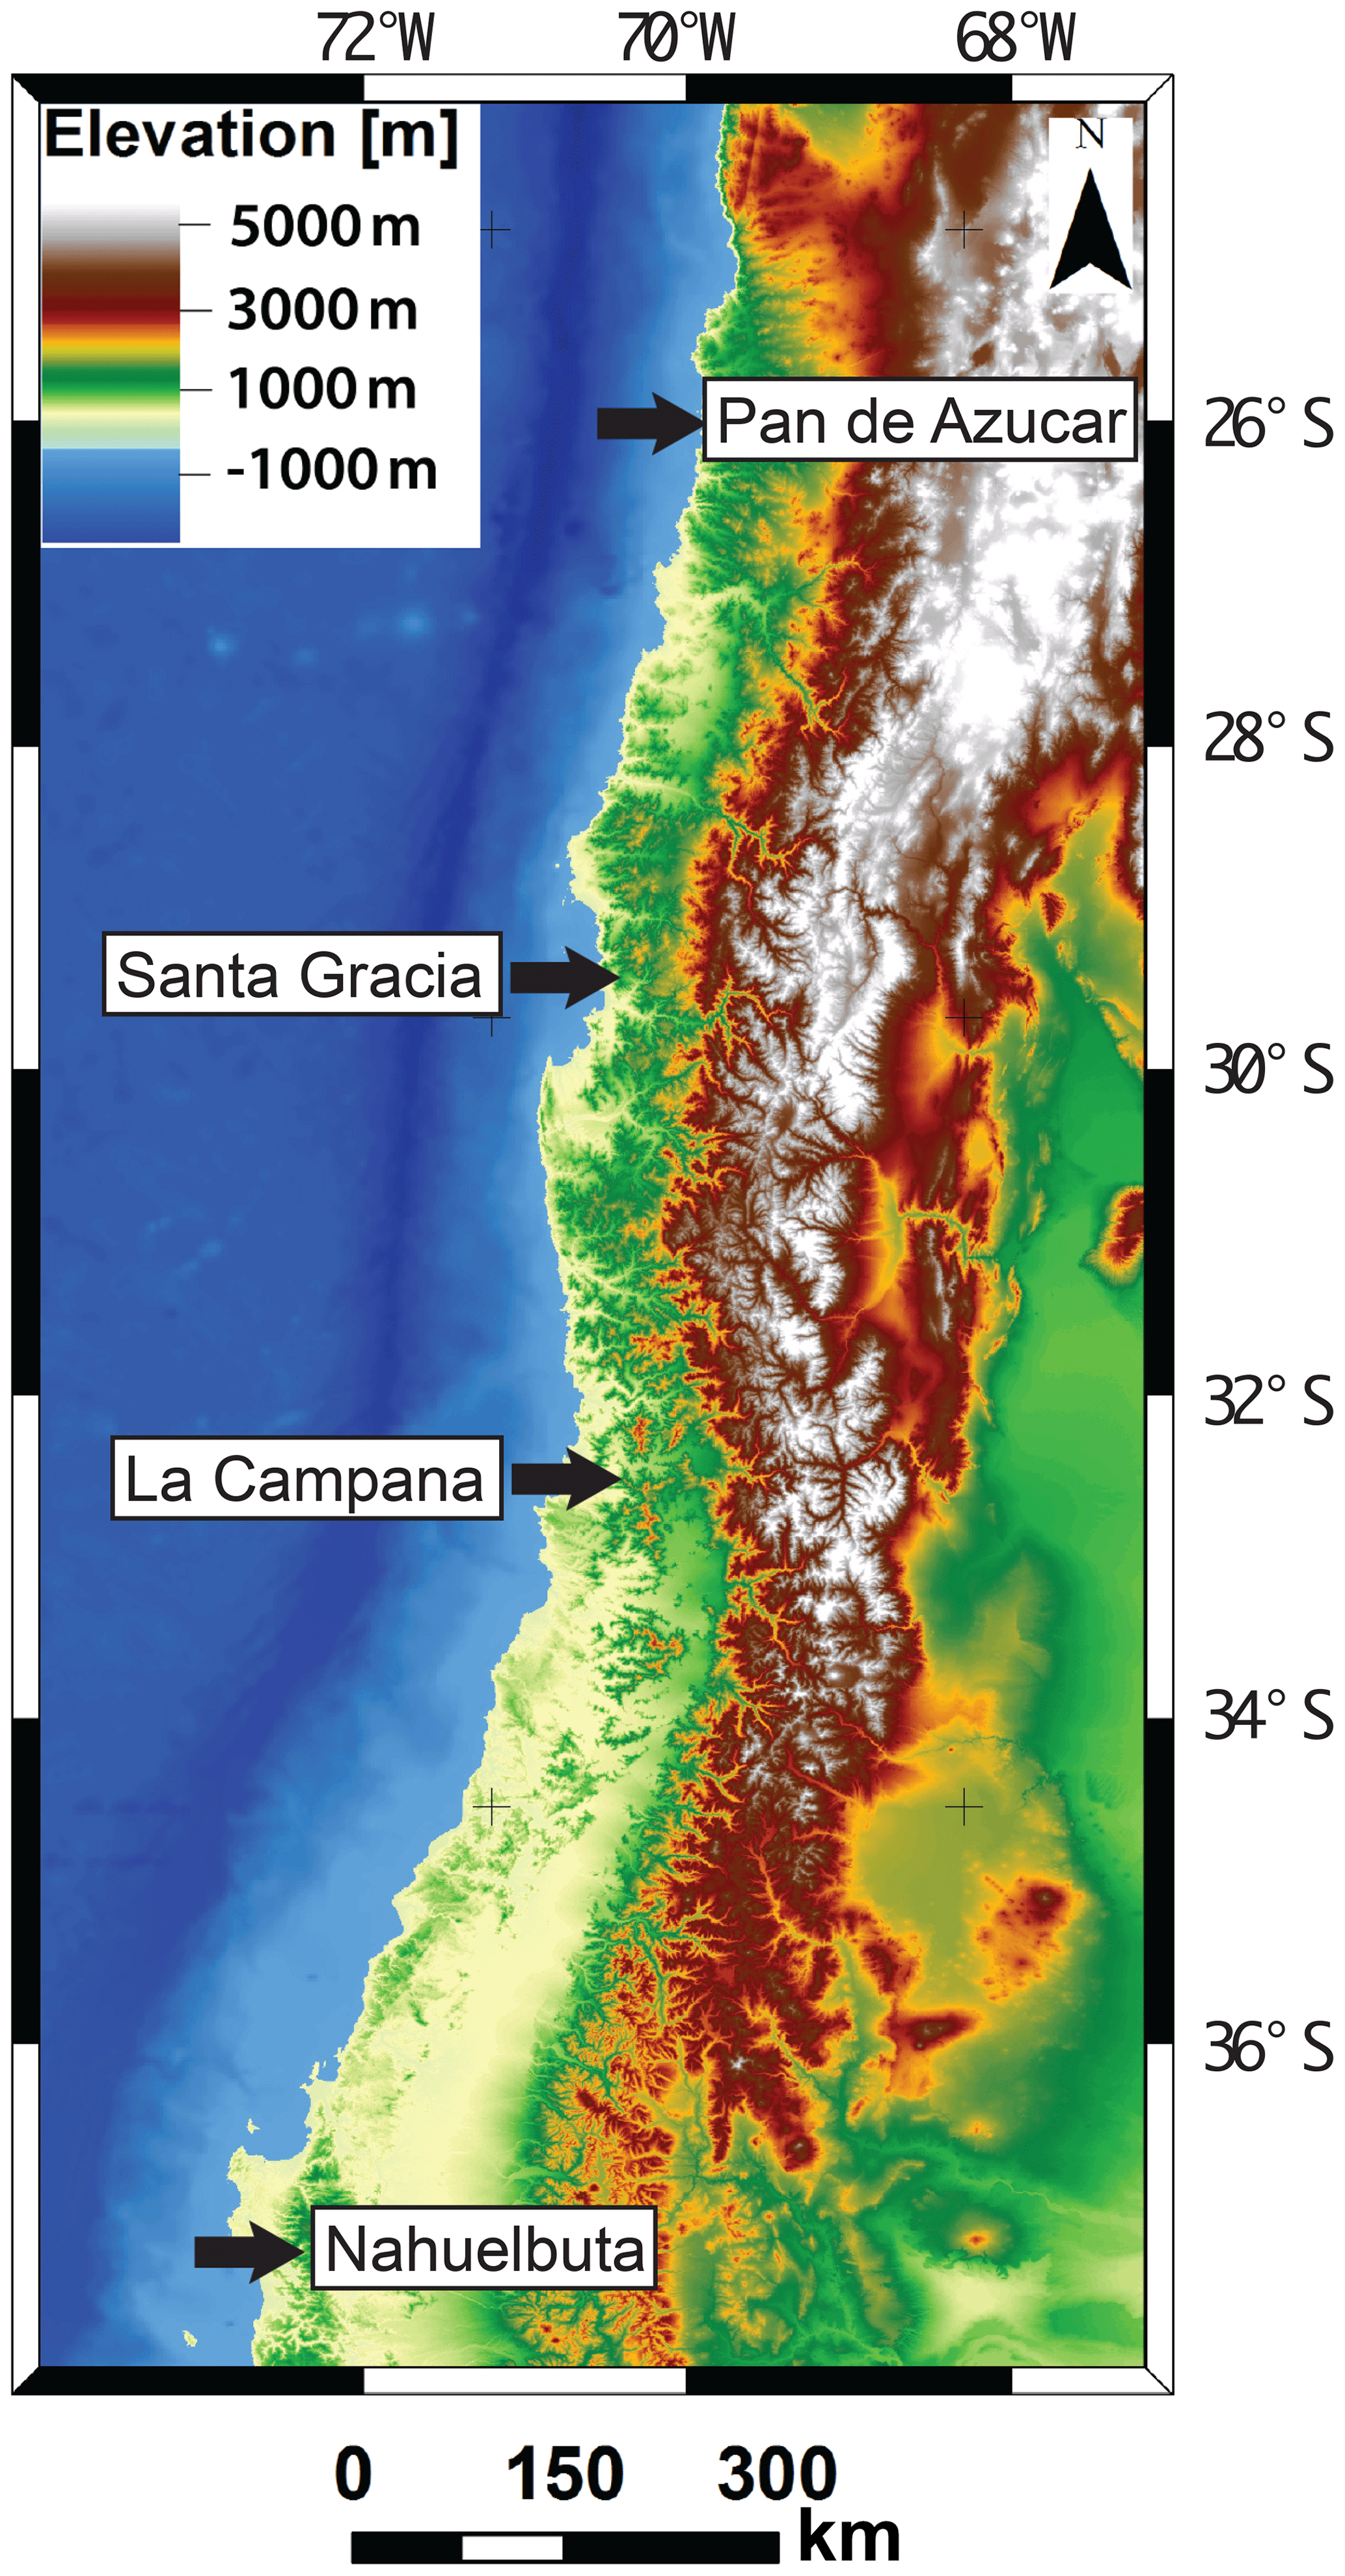
Figure 1Digital elevation model (data source: GTOPO30) for the Chilean Coastal Cordillera and the Central Andes showing the four investigated study areas (from north to south): Pan de Azúcar (∼ 26∘ S), Santa Gracia (∼ 30∘ S), La Campana (∼ 33∘ S), and Nahuelbuta (∼ 38∘ S).
The Chilean Coastal Cordillera (Fig. 1) contains an extreme climate and vegetation gradient and is a natural laboratory to study the influence of climate and vegetation on the surface of the Earth in a setting with similar tectonic history and lithology. The region is home to four study areas of the German–Chilean EarthShape priority program (https://www.earthshape.net, last access: 11 December 2020), where investigations of biotic interactions with regolith were conducted (e.g., Bernhard et al., 2018; Oeser et al., 2018). The study areas were selected to show a range from arid climate in the northernmost location (∼ 26.1∘ S) to temperate rain forest conditions in the southernmost location (∼ 37.8∘ S). These four study areas were investigated to qualitatively and quantitatively describe the differences between the four settings. Our previous work in these areas has identified from field observations and GPR-based methods an increase in pedolith thickness from north to south and major and trace element compositional variations within pedons (e.g., Bernhard et al., 2018; Oeser et al., 2018; Dal Bo et al., 2019). However, in our previous GPR work (Dal Bo et al., 2019) we were not able to present a detailed comparison of physical, chemical, and regolith observations, which has yet to be reported for these areas.
In this paper we build upon the previous work of Dal Bo et al. (2019) and compare the pedon measured physical and chemical observations (from Bernhard et al., 2018; Oeser et al., 2018) to a large newly acquired GPR data set from the same area to gain insight into regolith variations along a climate and ecological gradient. Our approach is to relate GPR observations adjacent to pedons to depth-varying regolith properties caused by weathering as well as to evaluate whether these properties can be extrapolated along a hillslope using GPR transects. In doing this, we test the hypothesis that if weathering processes produce depth-varying physical and chemical changes in regolith observed in pedons, then (a) GPR-based observations of these locations should produce observable changes in the GPR envelope and reflectors correlative to weathering horizons, and (b) GPR can be used to upscale geochemical observations from pedons to the hillslope scale. In general, we find that our new GPR measurements can be correlated to changes in pedolith physical properties if these changes are of sufficient magnitude and laterally coherent. If such a correlation is observed, we discuss the links between the physical and chemical properties. The comparison of physical and chemical properties with field observations and GPR data helps to better understand the regolith at point locations (e.g., pedolith thickness) and in some cases allows for upscaling point observations to the hillslope scale along a GPR measurement profile.
From north to south (Figs. 1 and 2), the four selected study areas in the climatic and vegetation gradient observed in the Chilean Coastal Cordillera are (a) Pan de Azúcar (∼ 26.1∘ S), (b) Santa Gracia (∼ 29.8∘ S), (c) La Campana (∼ 33.0∘ S), and (d) Nahuelbuta (∼ 37.8∘ S). The study areas were investigated for regolith physical and chemical properties by Bernhard et al. (2018) and Oeser et al. (2018) as well as studied with GPR by Dal Bo et al. (2019) (see Tables 1 and 2).
2.1 General climate, vegetation, and geologic setting
The Chilean Coastal Cordillera with its climate and vegetation gradient is a natural laboratory to study the influence of climate and vegetation on denudation (Fig. 1). From north to south (∼ 26 to 38∘ S), present climate ranges from arid to humid temperate. The mean annual precipitation increases from nearly zero to ∼ 1500 mm yr−1, and mean annual temperature decreases from ∼ 20 to ∼ 5 ∘C. Vegetation cover increases from nearly zero to ∼ 100 %. The flora consists of small shrubs, geophytes, and annual plants (Armesto et al., 1993) in the north and changes to lower-stature deciduous trees and shrubs intermixed with tall evergreen mixed forest in the south.
Climate and vegetation in the primary study areas changed over time from the Last Glacial Maximum (LGM) to present. Mean annual precipitation during the LGM was higher than at present in all four study areas (Mutz et al., 2018). Mean annual temperature during the LGM was lower than at present except in the southernmost study area where mean annual temperature stayed the same (Mutz et al., 2018). Hence, the climate gradient observed today is comparable to the gradient during the LGM. Even though the climate was wetter and cooler during the LGM, no glaciers covered any of the study areas (Rabassa and Clapperton, 1990). Because of these climatic changes over time, vegetation zones during the LGM were shifted northward by ∼ 5∘ and vegetation cover was slightly (∼ 5 %–10 %) lower compared to present (Werner et al., 2018). This shift of vegetation zones to the north and the decrease in vegetation cover also likely influenced the fauna present, but to an unknown degree.
To compare the effect of climate and vegetation on pedolith thickness and GPR observations, differences in lithologies need to be minimal. However, these conditions are not always fulfilled and need to be taken into account. Whereas bedrock in Pan de Azúcar, La Campana, and Nahuelbuta is granite to granodiorite, the bedrock in Santa Gracia ranges from granodiorites to gabbros (Oeser et al., 2018). Hence, the parent material in Santa Gracia is lower in SiO2 content (50 %–65 %) in comparison to the other three study areas (SiO2 content >65 %). Chemical weathering and physical erosion, which in turn influence pedolith formation and thickness, may be affected by this difference.
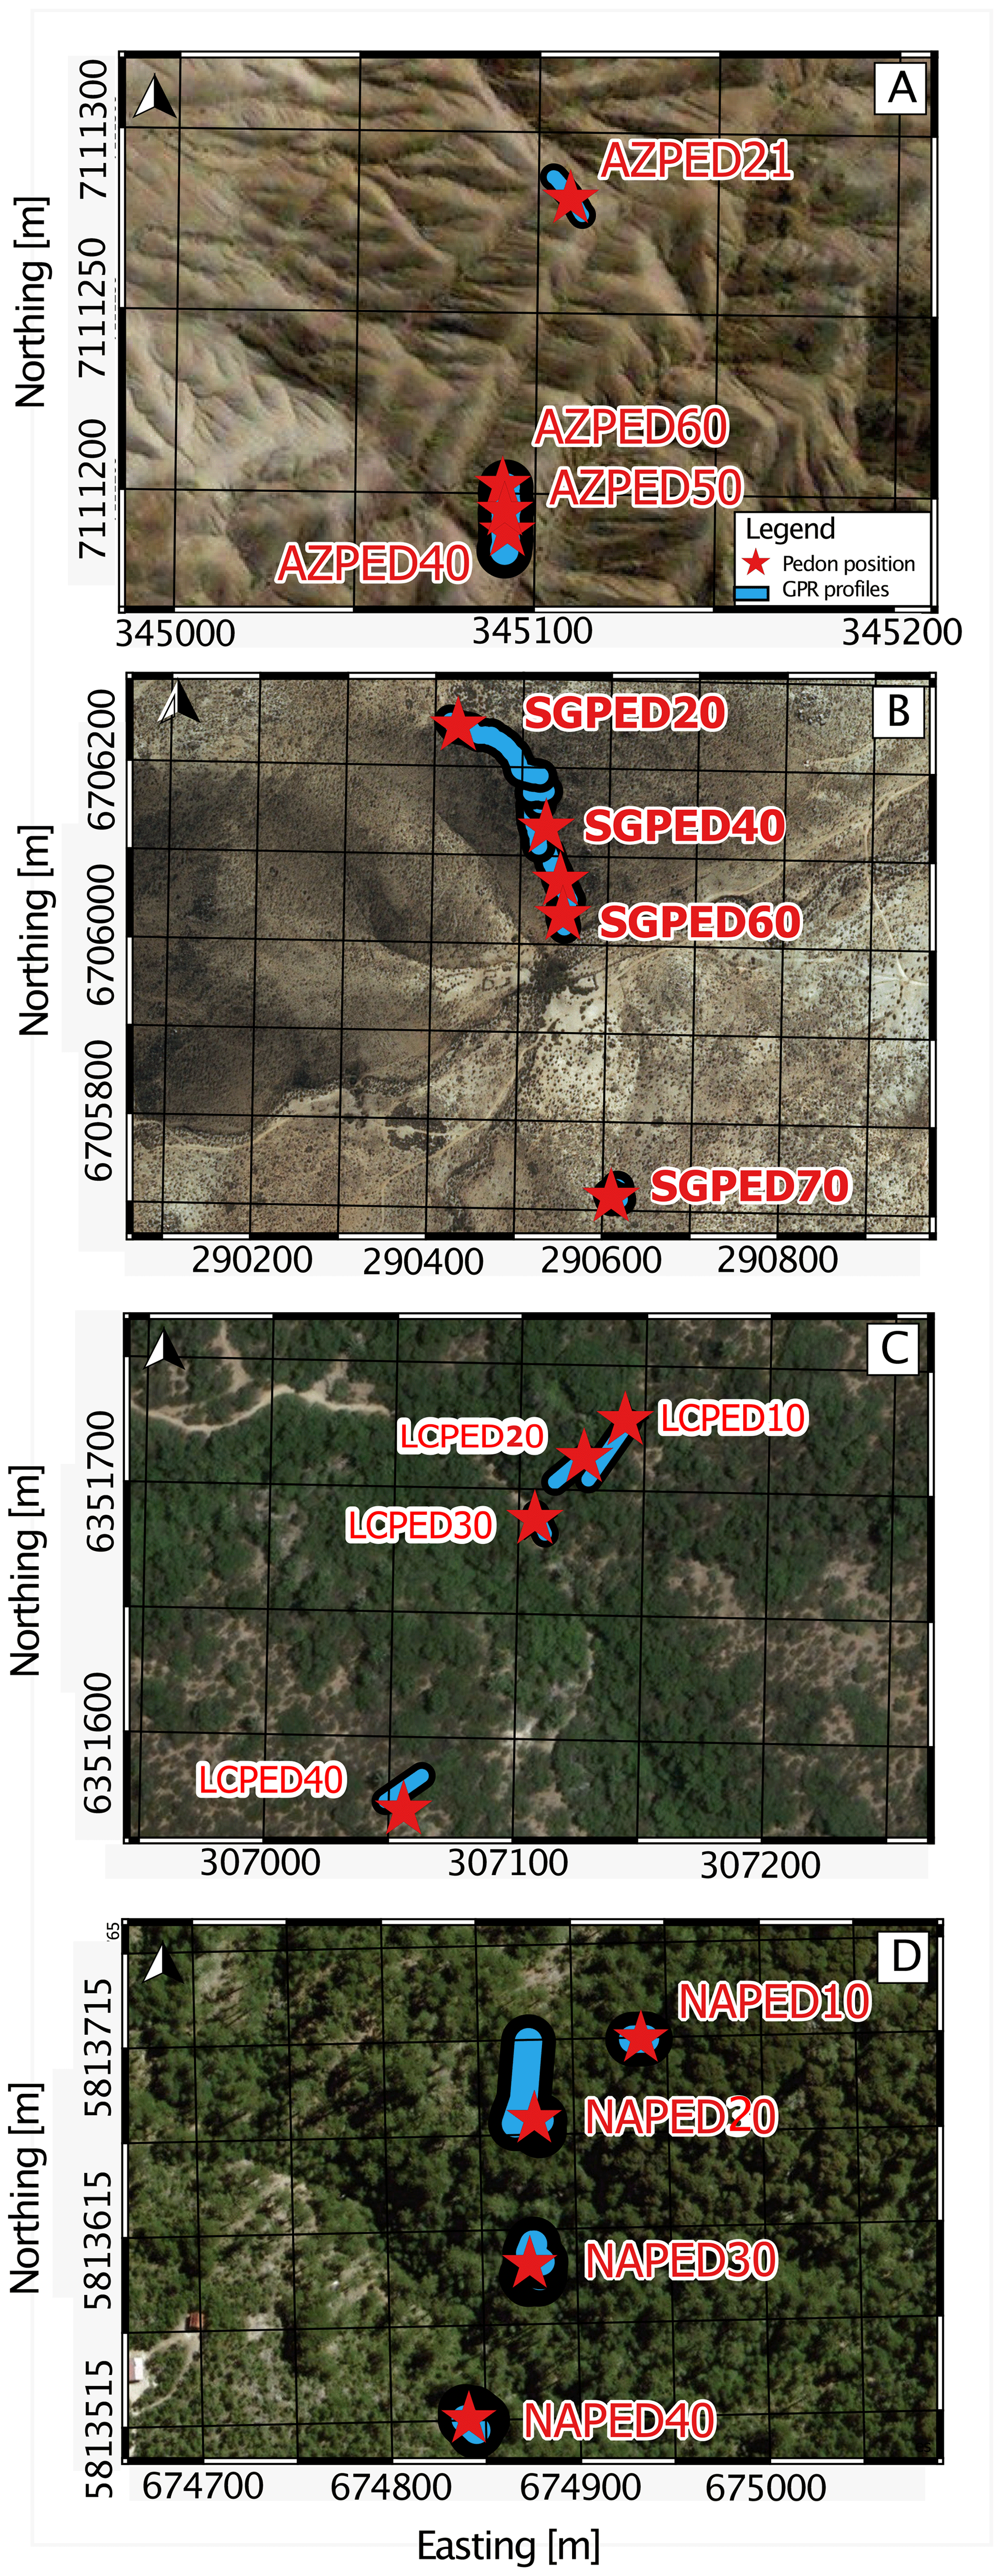
Figure 2Satellite images (data source: Google Earth©) of the four study areas from north to south in latitude: (a) Pan de Azúcar, (b) Santa Gracia, (c) La Campana, and (d) Nahuelbuta. Red stars indicate the pedon positions, whereas the blue lines represent the locations of the geophysical investigations.

Figure 3N- and S-facing hillslopes of the four study areas with locations of pedons and transects of ground-penetrating radar indicated by the red double arrows. For complete characterization and interpretation of the pedons, see Fig. 2 in Bernhard et al. (2018) and Figs. 3 to 6 in Oeser et al. (2018).
2.2 Regolith characteristics
In each study area, regolith transects (Figs. 2 and 3; Table 1) from a catena consisting of three pedons on the S-facing slope (top slope, mid-slope, and toe slope) and one pedon on the N-facing slope (mid-slope) were described, sampled, and analyzed (see Bernhard et al., 2018; Oeser et al., 2018; Schaller et al., 2018; Dal Bo et al., 2019). Only one pedon was investigated in the N-facing slopes due to time and financial restrictions. In addition, transect lengths in some settings are limited due to the availability of weathered hillslopes in the same lithologies (e.g., Pan de Azúcar; Fig. 3a) as well as restriction of access due to intense vegetation (e.g., Nahuelbuta; Fig. 3d).
Table 1Data compilation for pedons in the investigated four study areas in the Chilean Coastal Cordillera.
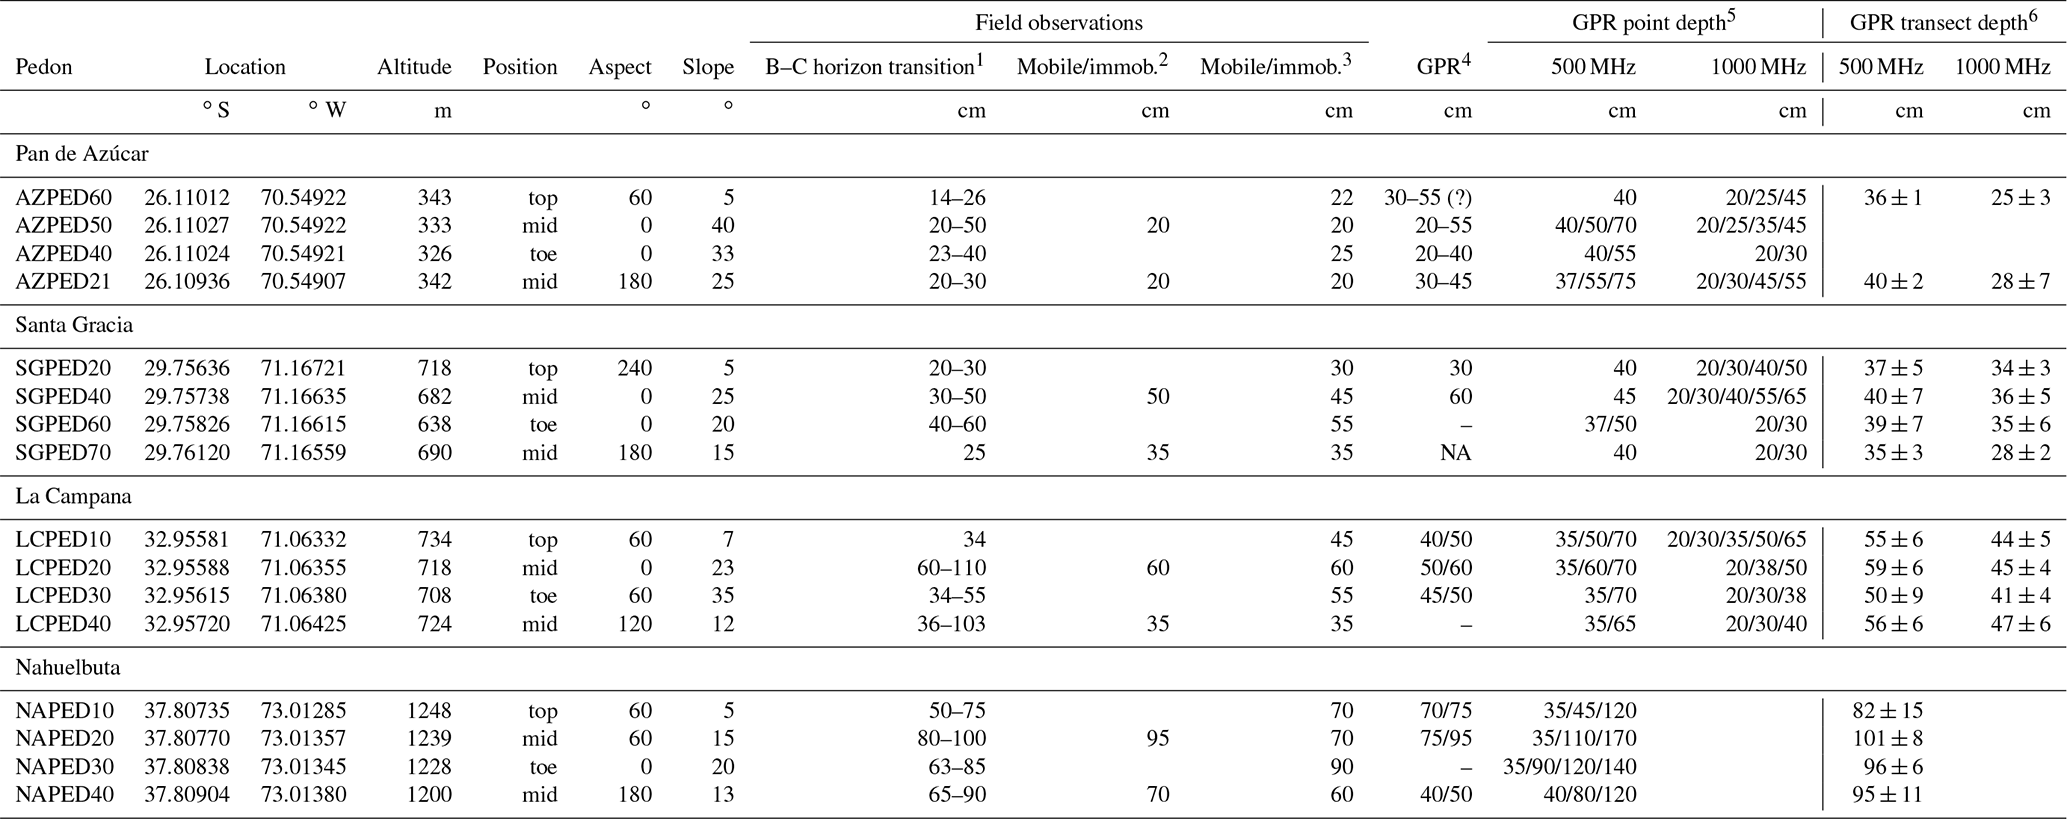
1 Depth of B–C horizon transition from Bernhard et al. (2018). 2 Depth of mobile pedolith from Schaller et al. (2018). 3 Depth of mobile pedolith from Oeser et al. (2018). 4 Depth based on data from Dal Bo et al. (2019). 5 Depth based on single-point GPR envelopes (this study). 6 Average depth based on envelopes from GPR transect data (this study).
These previous studies from pedons in each area identify O, A, B, and C horizons that overlie weathered bedrock (for complete characterization and interpretation of the pedons, see Fig. 2 in Bernhard et al., 2018 and Figs. 3 to 6 in Oeser et al., 2018). In this study, we refer to depth profiles as regolith profiles that are composed of a mobile pedolith that includes the A and B horizons and an immobile saprolith including the C horizon.

Figure 4Compilation of physical and chemical investigations with depth at the pedon location in the mid-slope position of the S-facing hillslope in Pan de Azúcar. Properties shown are (1) GPR transect and the envelope profile of the 500 MHz measurement; (2) GPR transect and the envelope profile of the 1000 MHz measurement; (3) bulk density; (4) grain size distribution of sand, silt, and clay; (5) loss on ignition, LOI; (6) chemical index of alteration, CIA; (7) chemical index of the mass transfer coefficient τ; and (8) volumetric strain εstrain. The black line indicates the boundary between the mobile pedolith and the immobile saprolith (after Oeser et al., 2018), and the gray area with green lines reflects the transition zone from B to C horizon (after Bernhard et al., 2018).
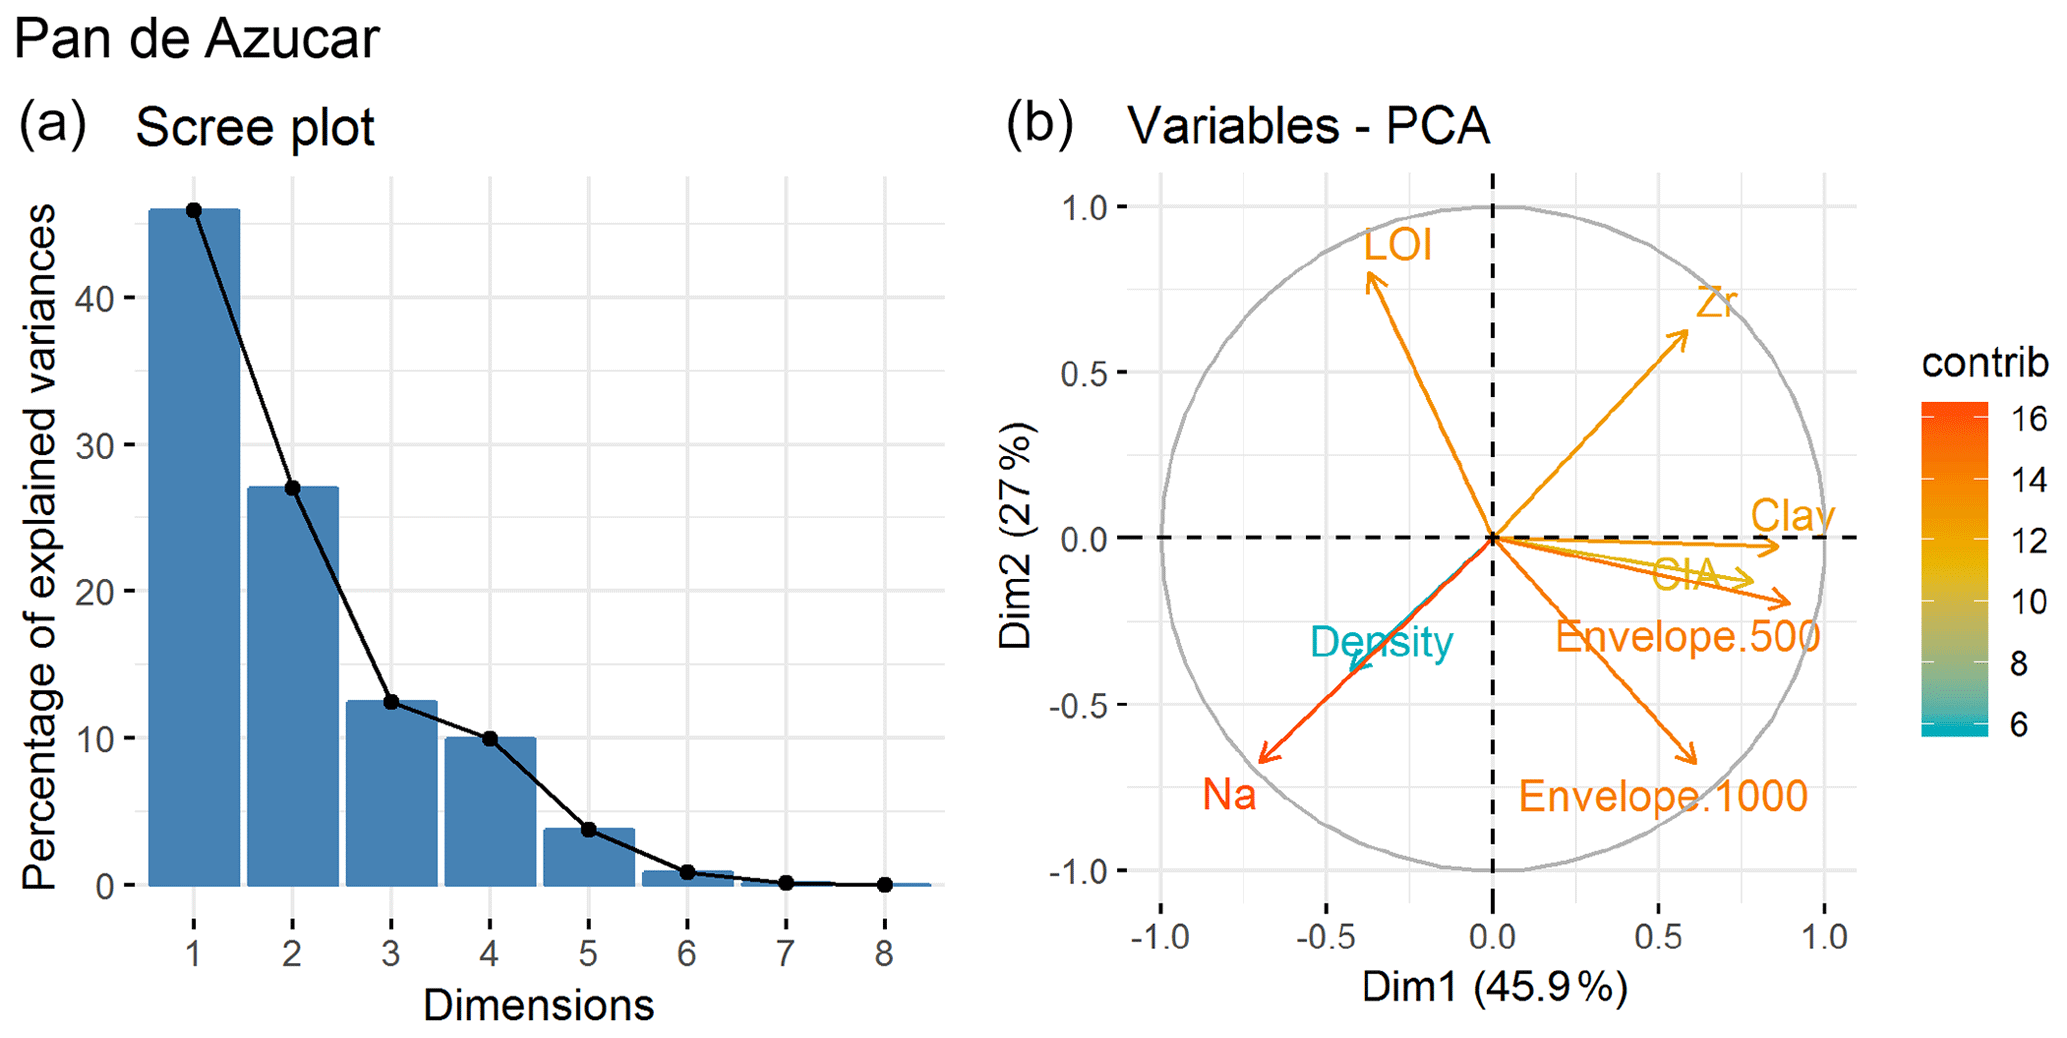
Figure 5Principal component analysis (PCA) of properties for all four pedons in Pan de Azúcar. (a) Scree plot showing the percentage of explained variances and (b) variables – PCA.
In Pan de Azúcar, the regolith, a Regosol (IUSS Working Group WRB, 2015), consists of A and B horizons with a combined thickness of 20 to 25 cm and an underlying saprolith (the C horizon), which is coarse-grained and jointed (Oeser et al., 2018). The total organic carbon content of the A and B horizons is <0.1 % (Bernhard et al., 2018). Angular fragments in the pedolith increase in size (>1 mm) with depth. The average bulk density of the A and B horizons is 1.3 g cm−3. In Santa Gracia, the 30 to 55 cm thick pedolith overlying the saprolith is a Cambisol (IUSS Working Group WRB, 2015). Total organic carbon content of the A and B horizons is 0.4 %. Whereas the A horizon consists of a silt-sized to fine sand-sized matrix supporting up to 2 mm sized fragments, the underlying B horizon shows a transitional increase of fragments to a coarse fragment-supported fine-grained matrix. The weathered granodiorite of the saprolith consists of up to 1 cm sized fragments which are surrounded by fine-grained material and fine roots (Oeser et al., 2018). The average bulk density of the pedolith is 1.5 g cm−3. The regolith in La Campana is a Cambisol (IUSS Working Group WRB, 2015). The A and B horizons are 35 to 60 cm thick and have a total organic carbon content of 1.9 % (Bernhard et al., 2018). The fine sand- to silt-sized A horizon contains fragments of up to 3 mm. The matrix in the underlying B horizon is coarsening downwards, and the number of fragments increases such that the horizon shifts from matrix- to clast-supported. In the saprolith, which shows a granodioritic fabric, fine roots are common and fractures are abundant (Oeser et al., 2018). The average bulk density is 1.3 g cm−3. The regolith in Nahuelbuta, an Umbrisol (IUSS Working Group WRB, 2015), consists of a 60 to 90 cm thick pedolith and a readily disaggregating saprolith. Total organic carbon content in these pedoliths is 6.1 % (Bernhard et al., 2018). The A horizon is composed of silt-sized particles forming nodular aggregates. In the upper part there are up to 1 mm large quartz grains embedded, whereas the lower part contains large fragments. The fine sand-sized matrix of the transitional B horizon hosts subangular fragments. The amount and size of these fragments increases with depth. The average bulk density of the pedolith is 0.8 g cm−3.
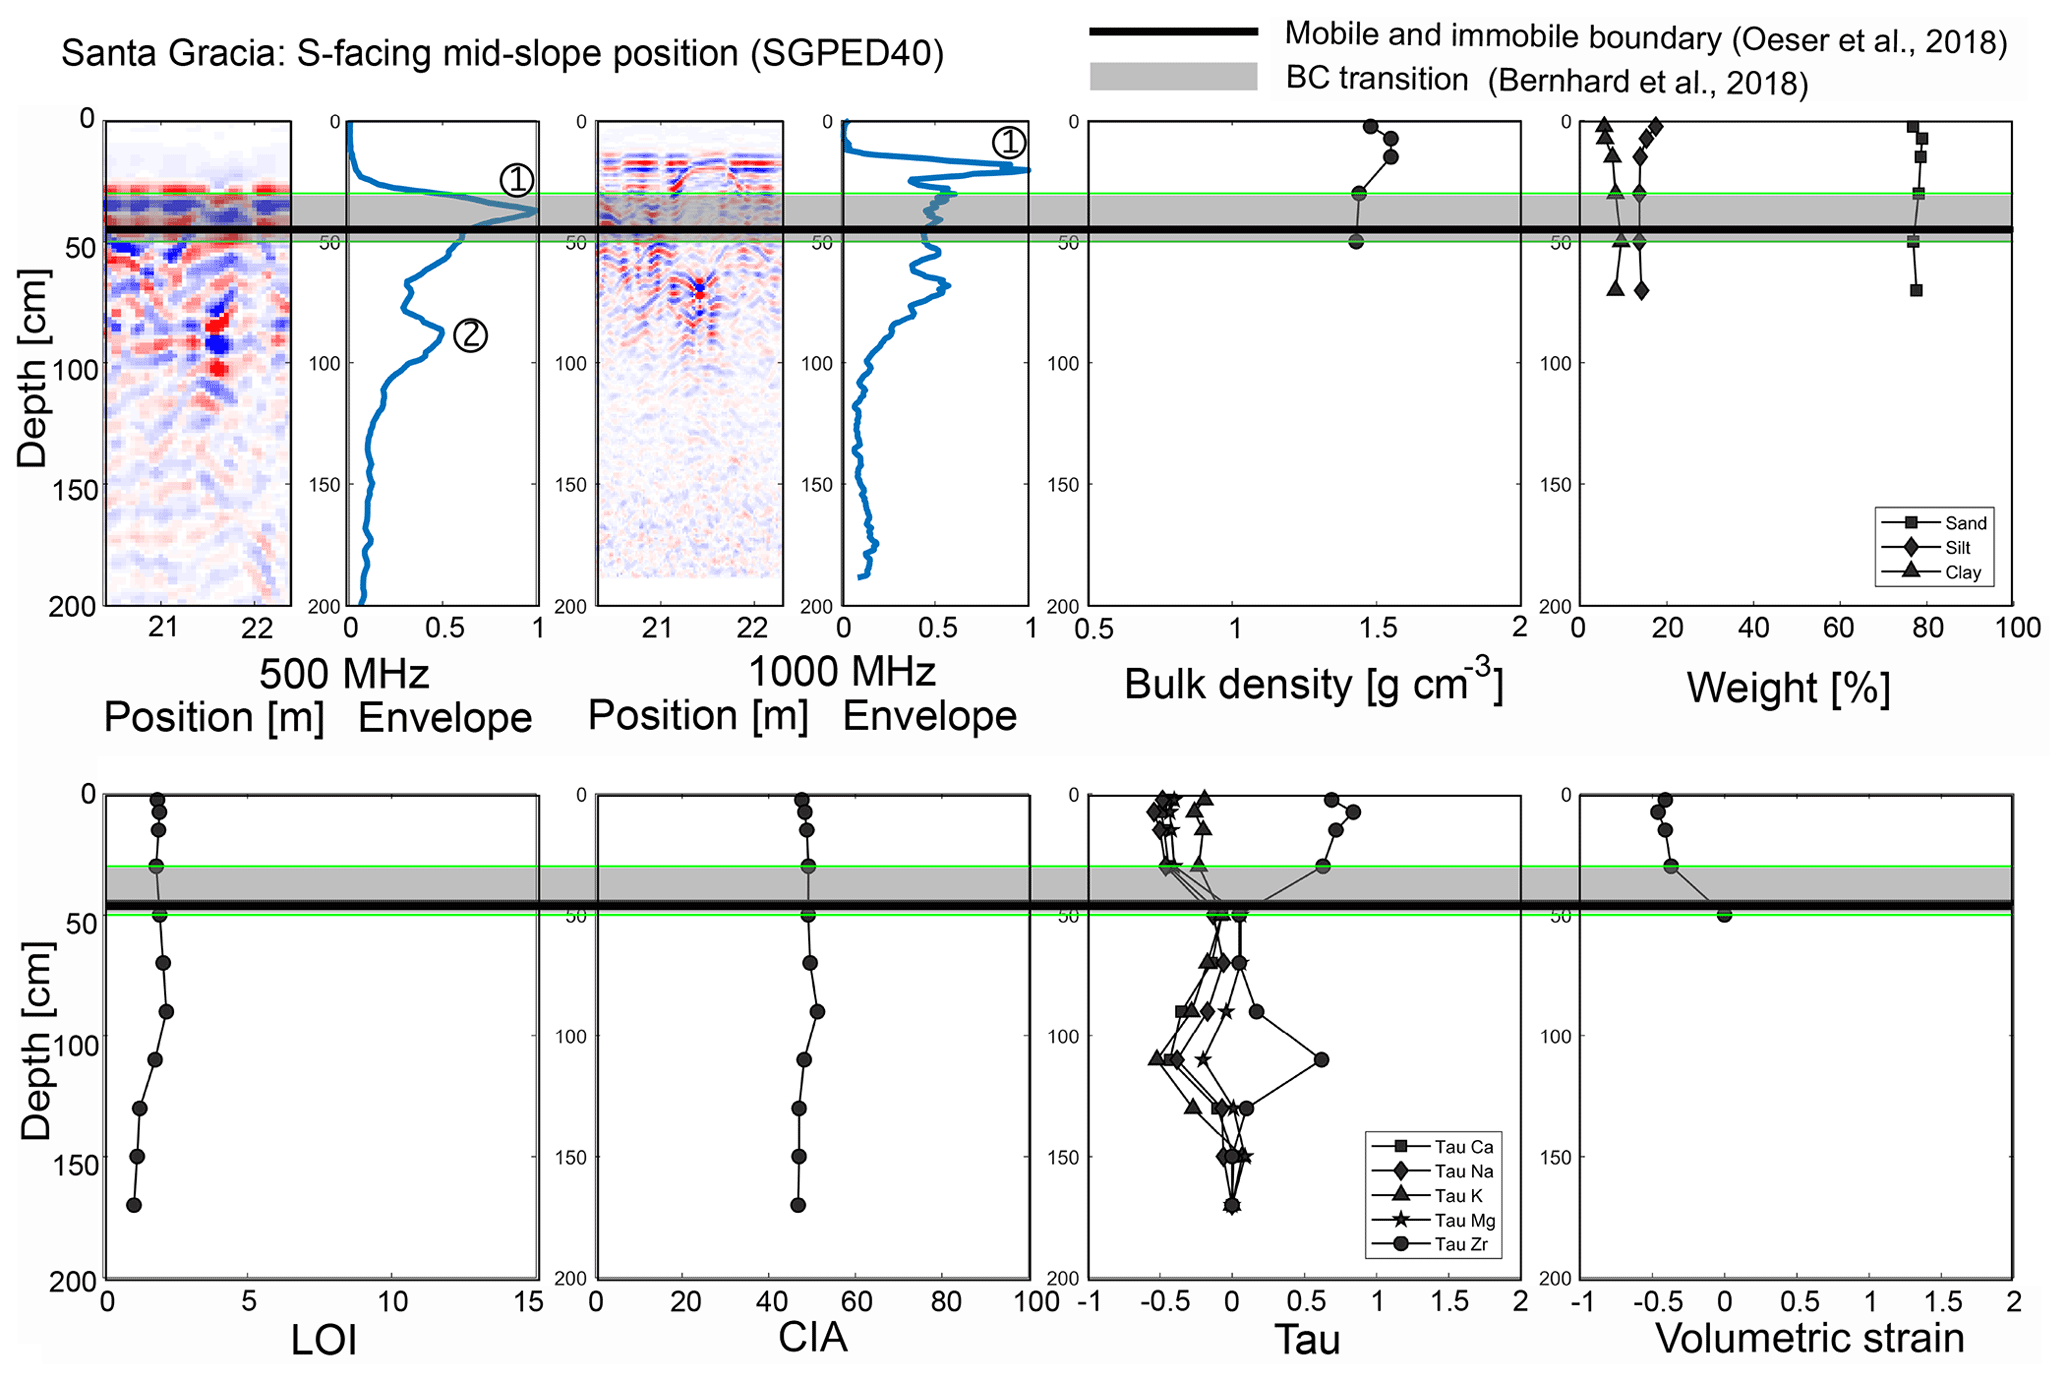
Figure 6Compilation of physical and chemical investigations at the pedon location in the mid-slope position of the S-facing hillslope in Santa Gracia. Properties shown are listed in caption of Fig. 4.
New data from 25 GPR profiles in the four study areas were collected at frequencies of 500 and 1000 MHz. These data are compared to physical and chemical properties from point locations (pedons) from previous studies (Bernhard et al., 2018; Oeser et al., 2018). Unfortunately, no regolith water content was measured in samples from the pedons excavated in 2016. The new GPR profiles (collected in 2017) complement previous GPR data collected 2016 at the same frequencies, in the same catchments (Dal Bo et al., 2019). The difference between this study and that of Dal Bo et al. (2019) lies in the new, more extensive GPR data coverage, the analysis of regolith water content in augers in the study areas, and its comparison to physical and chemical subsurface variations.
Using physical and chemical properties collected in pedons to understand the corresponding radar signatures is a difficult task requiring multiple steps. First, it would require identifying relationships between the measured pedon properties and corresponding permittivity changes in the radar signal. Second, it would require a radar forward model that successfully predicts the convolution of the emitted radar pulse with the subsurface reflectivity. This includes handling constructive and destructive interference caused by closely spaced vertical permittivity changes. For applications to regolith this is currently not possible because the permittivity relationships are unclear. We therefore take a step back from the more sophisticated methods and use simpler statistical metrics to isolate regolith properties (i.e., Pearson correlation) or combinations thereof (i.e., principal component analysis) that may explain parts of the radar signatures.
3.1 Data compilation
In this study, GPR data are compared to previously published pedolith and saprolith physical and chemical properties (Table 2) such as (1) bulk density, grain size distribution, acid and base properties – pH, and cation exchange capacity – CEC (Bernhard et al., 2018); and (2) loss on ignition – LOI, chemical index of alteration – CIA, mass transfer coefficient – τ, and volumetric strain εstrain (Oeser et al., 2018). The grain size distributions provide a measure of the weight percent of different grain sizes smaller than 2 mm in the regolith, and the bulk density provides a measure of how dense the pedolith and saprolith material is packed. The geochemical data used provide major and trace element analysis, pH, and CEC. Major and trace element analyses allow the investigation of the LOI, τ, and volumetric strain εstrain. The degree of weathering can be quantified by CIA, which is sensitive to the removal of alkalis such as calcium, sodium, and potassium from feldspars (Nesbiitt and Young, 1982). τ reflects chemical gains and losses during weathering based on the elemental concentrations of mobile and immobile elements in weathered and unweathered material (e.g., Brimhall et al., 1985; Chadwick et al., 1990); εstrain in a regolith is based on the density ρ (g cm−3) and immobile element concentrations of the weathered regolith in comparison to the unweathered bedrock indicating volumetric gain or loss (Brimhall and Dietrich, 1987).
Table 2Overview of physical, chemical, and geophysical properties determined in the four different study areas.
GPR signals are sensitive to regolith water content variations with depth (e.g., Steelman et al., 2012; Ardekani et al., 2014). In addition to our compilation of previously published chemical and physical properties, we present here newly collected regolith water content data from regolith augers in Santa Gracia, La Campana, and Nahuelbuta (Supplement Table S3a to c). Although these data provide insight into regolith water content variations with depth, regularly spaced sampling with depth was not possible in the field. As a result, the regolith water content data are sparse and not directly overlying the GPR profile locations. Given the sparseness of these data, we were not able to include them in our correlations or correlation and principal component analysis (PCA; described below), but we do discuss trends present in the regolith water content (gravimetric basis) with depth and potential implications for the rest of our analysis. Furthermore, we note that the GPR data were not collected with an approach that allowed for the inversion for regolith water content (e.g., Steelman et al., 2012).
3.2 Ground-penetrating radar (GPR)
Ground-penetrating radar (GPR), a geophysical technique based on the emission of pulsed electromagnetic waves into the subsurface, is applied in this study for frequencies of 500 and 1000 MHz (for more details see Dal Bo et al., 2019). Fourteen new transects going from hillslope toe (near valley) to top (ridge crest) are collected crossing the pedons where physical and chemical properties were collected (Figs. 2 and 3). Of these 14 transects, two were collected in the Pan de Azúcar study area (for 500 and 1000 MHz), six in Santa Gracia (for 500 and 1000 MHz), three in La Campana (for 500 and 1000 MHz), and three in Nahuelbuta (only for 500 MHz). Wide-angle-reflection–refraction (WARR) is used to retrieve velocity and physical properties at the point scale. For each pedon, a WARR is measured in a relatively flat location (red stars, Fig. 2).
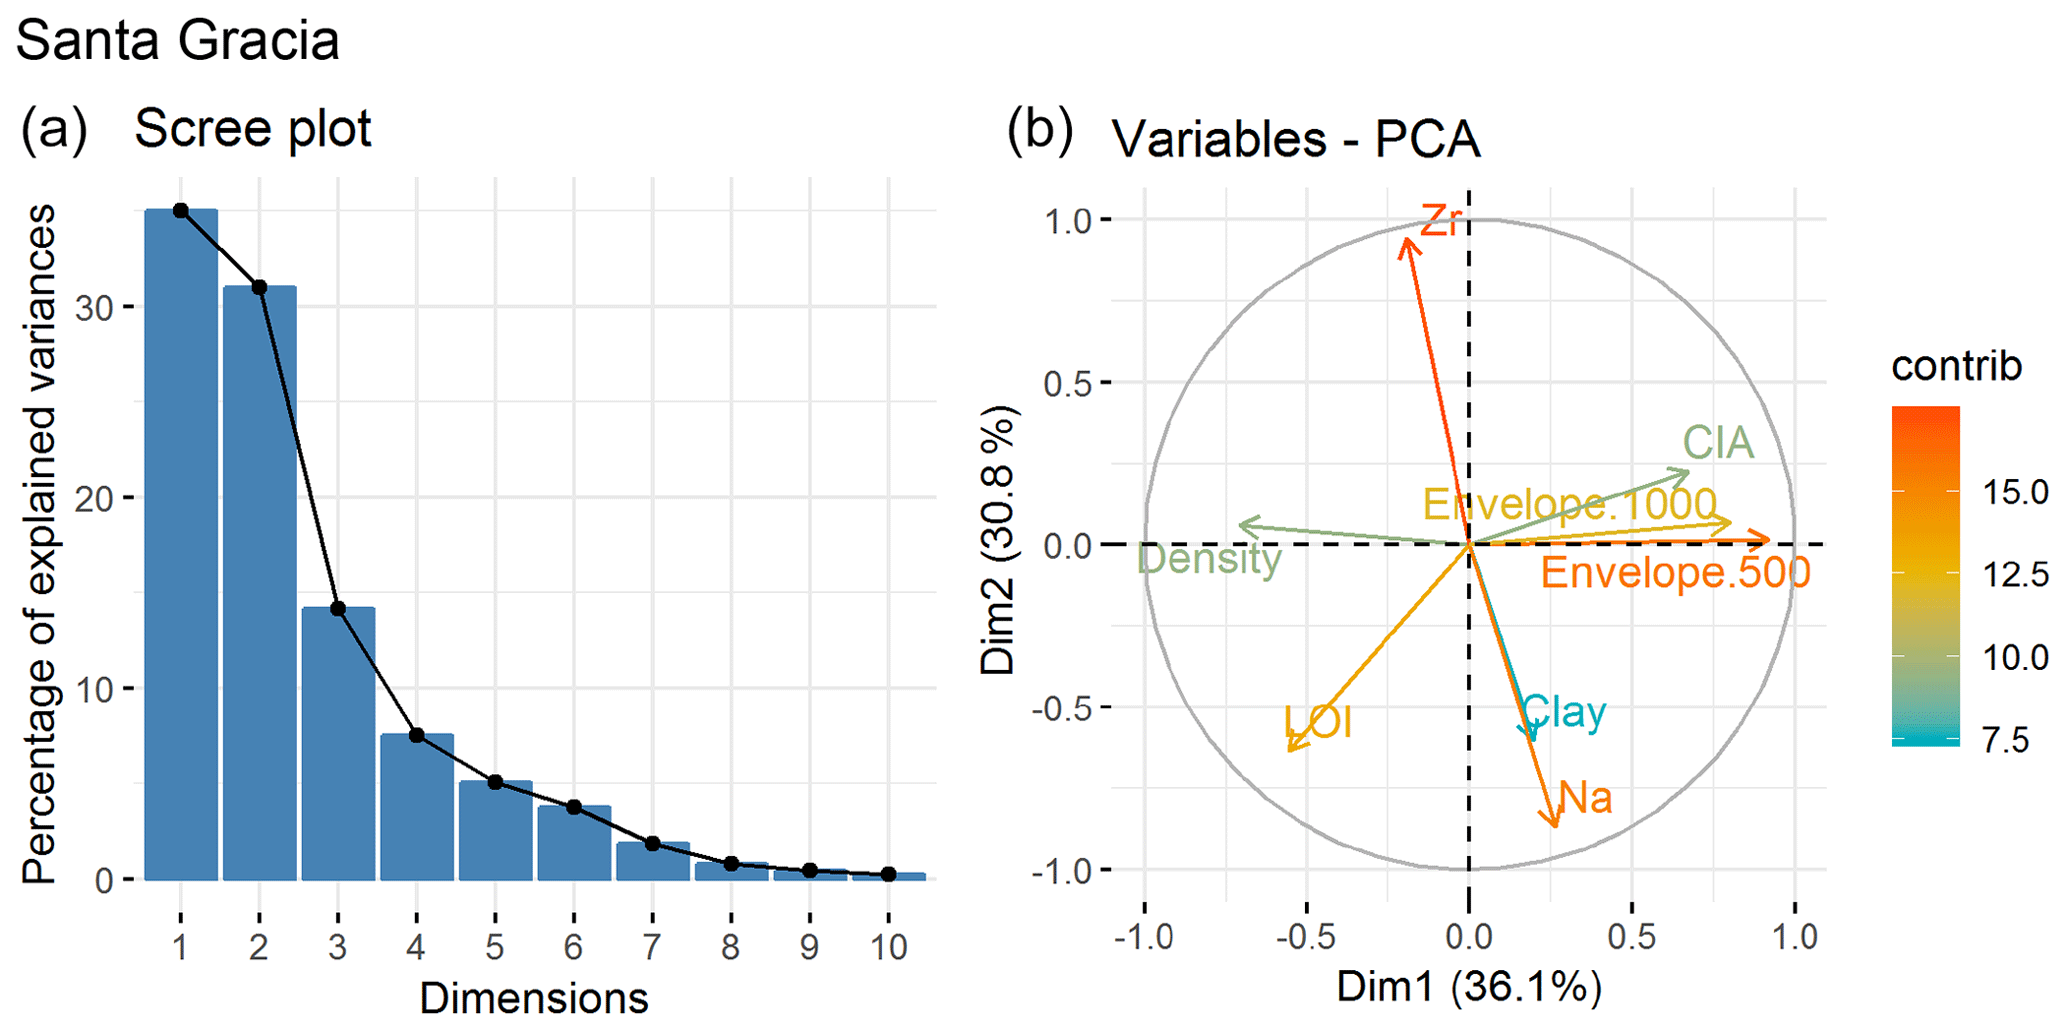
Figure 7Principal component analysis (PCA) of properties for all four pedons in Santa Gracia.
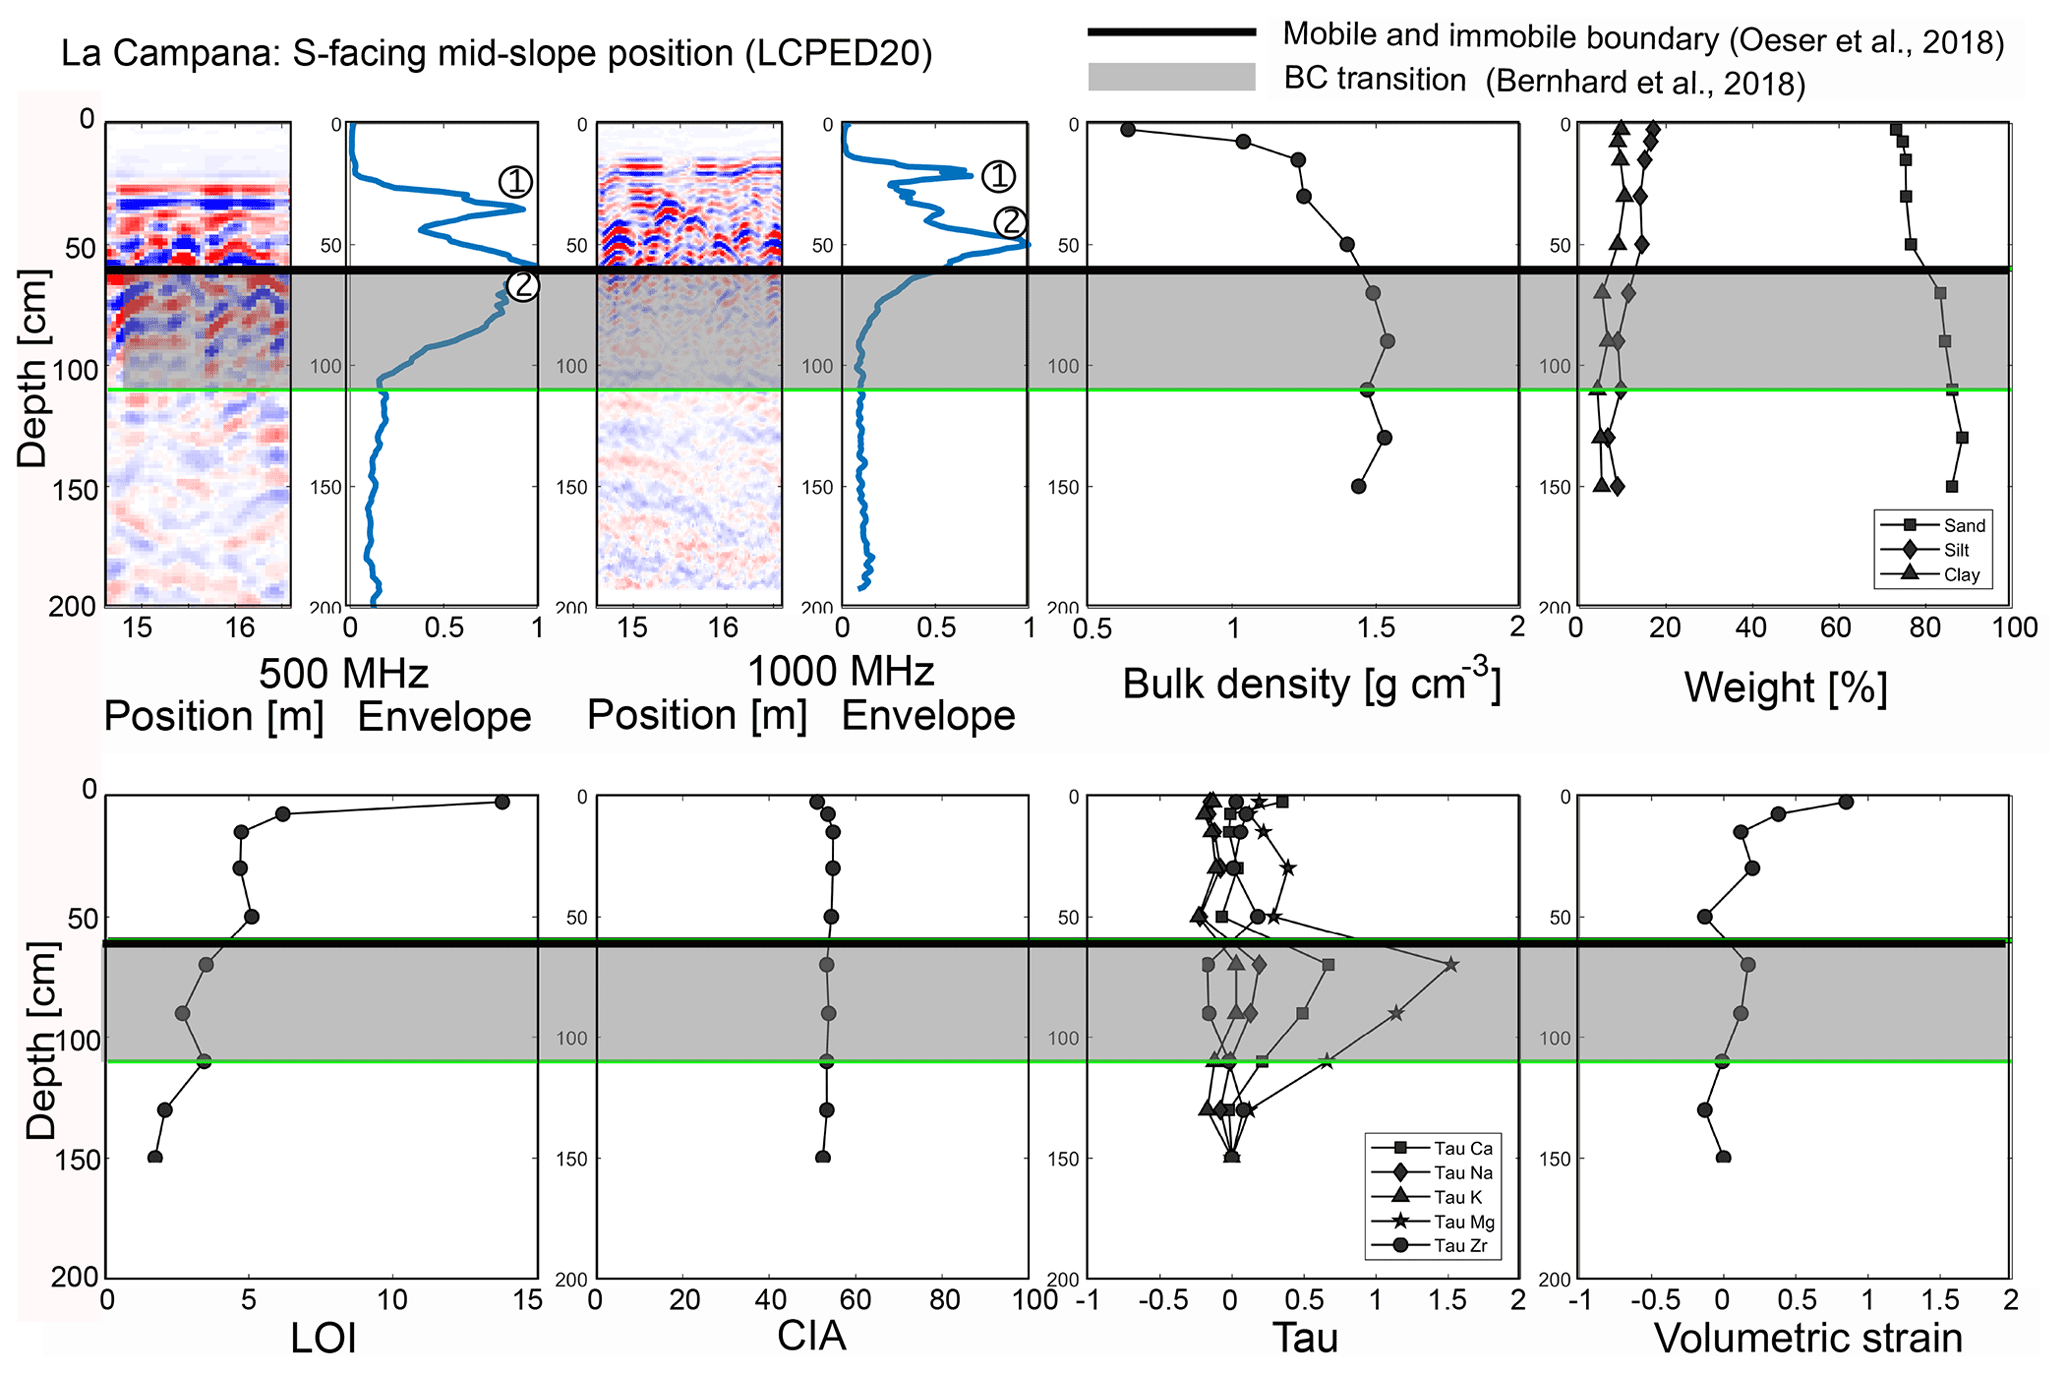
Figure 8Compilation of physical and chemical investigations at the pedon location in the mid-slope position of the S-facing hillslope in La Campana. Properties shown are listed in caption of Fig. 4.
GPR data were processed and analyzed using MATLAB as described in Dal Bo et al. (2019). In addition, signal envelopes were calculated using a Hilbert transform (Green, 2004; Liu and Marfurt, 2007). At each pedon location, a certain number of traces depending on the measurement step size (i.e., between 10 and 50) were sampled for 0.5 m uphill and 0.5 m downhill the pedon and laterally averaged for comparison to the pedon physical and chemical properties. The averaging assumes that both chemical and GPR signatures do not change with depth across that interval, an assumption that may not hold everywhere. As the GPR envelope is directly related to the electric impedance (Telford et al., 1990; Jol, 2009), the envelope onset and energy intervals could be compared to variations in physical, and potentially chemical, regolith properties.
3.3 Statistical correlation and principal component analysis
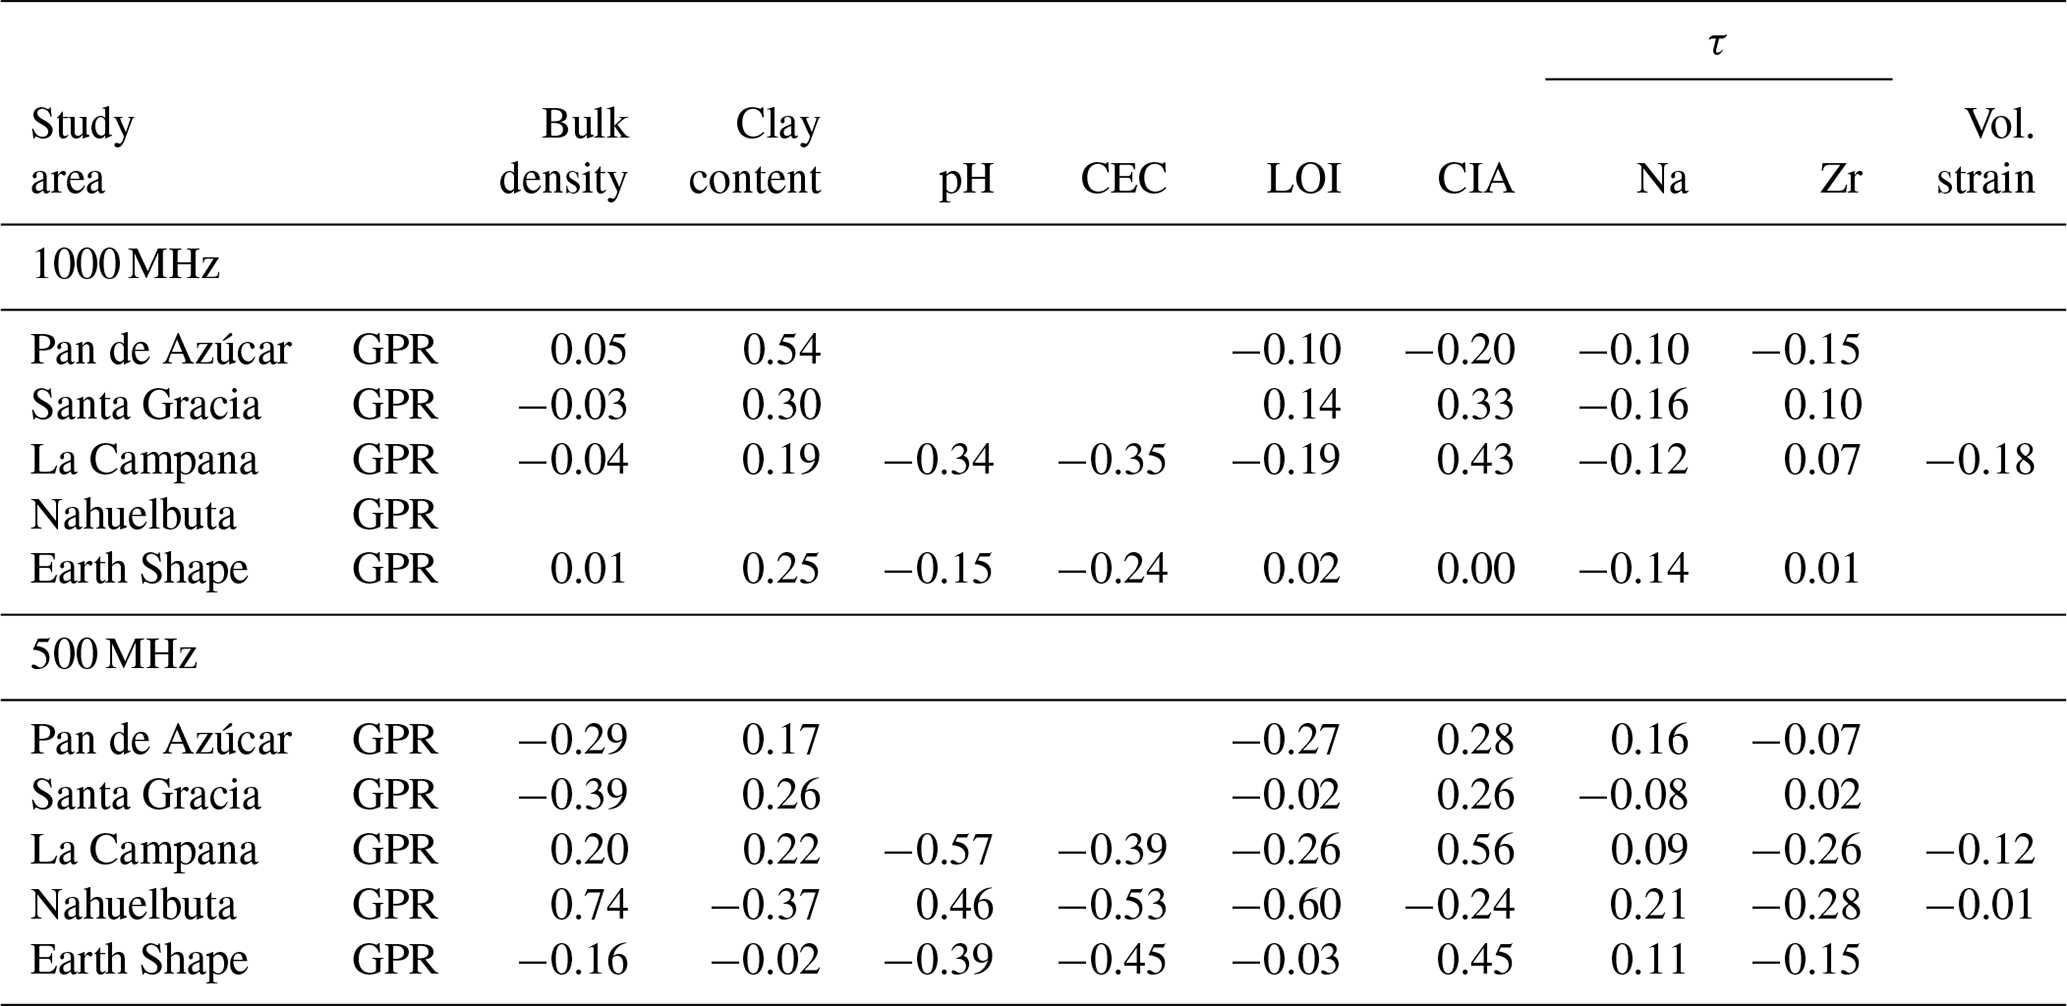
Comparison between the physical and chemical pedon information (Bernhard et al., 2018; Oeser et al., 2018) and GPR data was conducted. Where available, we used the bulk density, clay content, LOI, CIA, τ, volumetric strain (εstrain), pH, and CEC for comparison to the GPR 500 and 1000 MHz antennae envelope data. The GPR envelopes were resampled and averaged such that the depth intervals were the same as for the derivatives of the regolith data (see Table S2). Furthermore, because the envelope of GPR data is sensitive to changes along the vertical direction, we also calculated the vertical gradient of the ground truth information at each sampled depth using a centered difference approximation. Following this, the R package function corrplot (Wei, 2012) was used to calculate the Pearson's correlation coefficient to identify correlations between the variables (Sedgwick, 2012). We further conducted a multivariate analysis of the data based on principal component analysis (PCA; Wold et al., 1987). This was done using the factoextra R package (Kassambara, 2017). Correlation coefficients and PCA are done for each study area along the entire climate gradient.
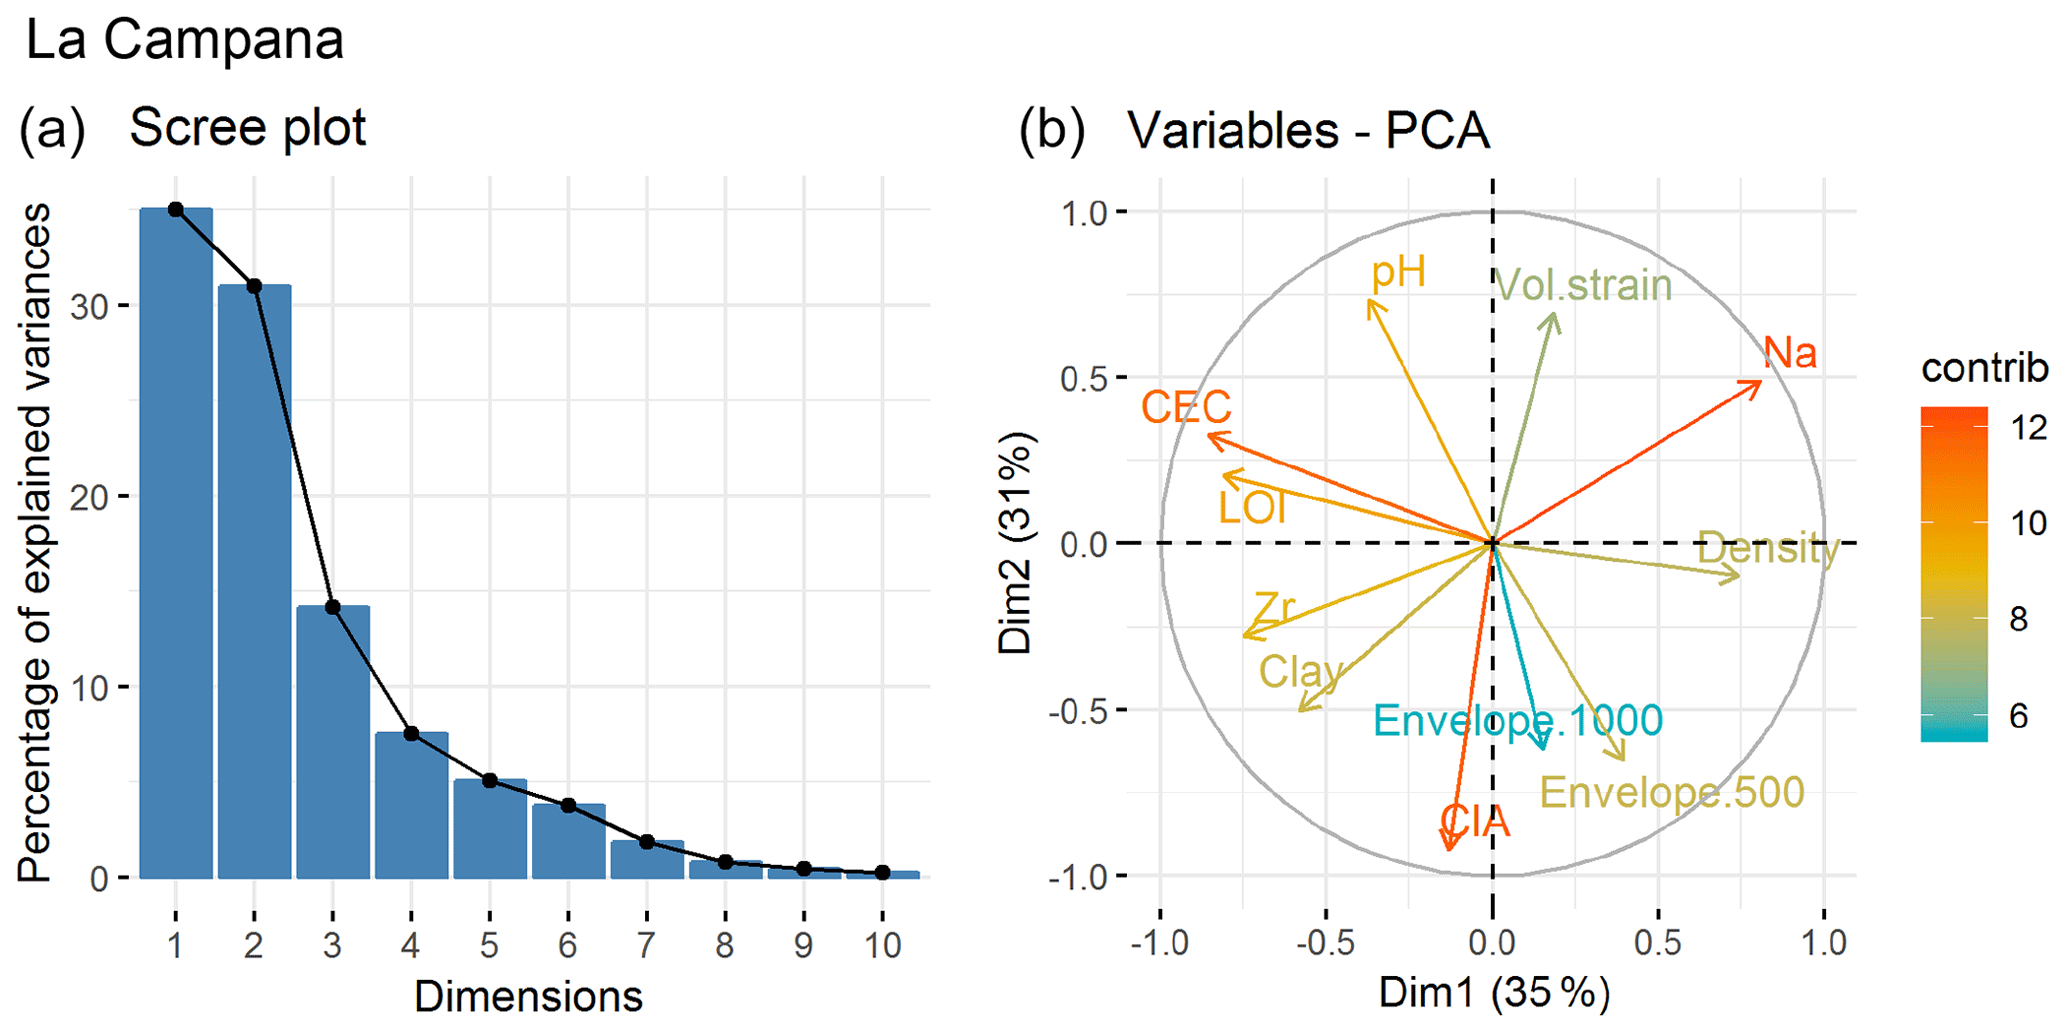
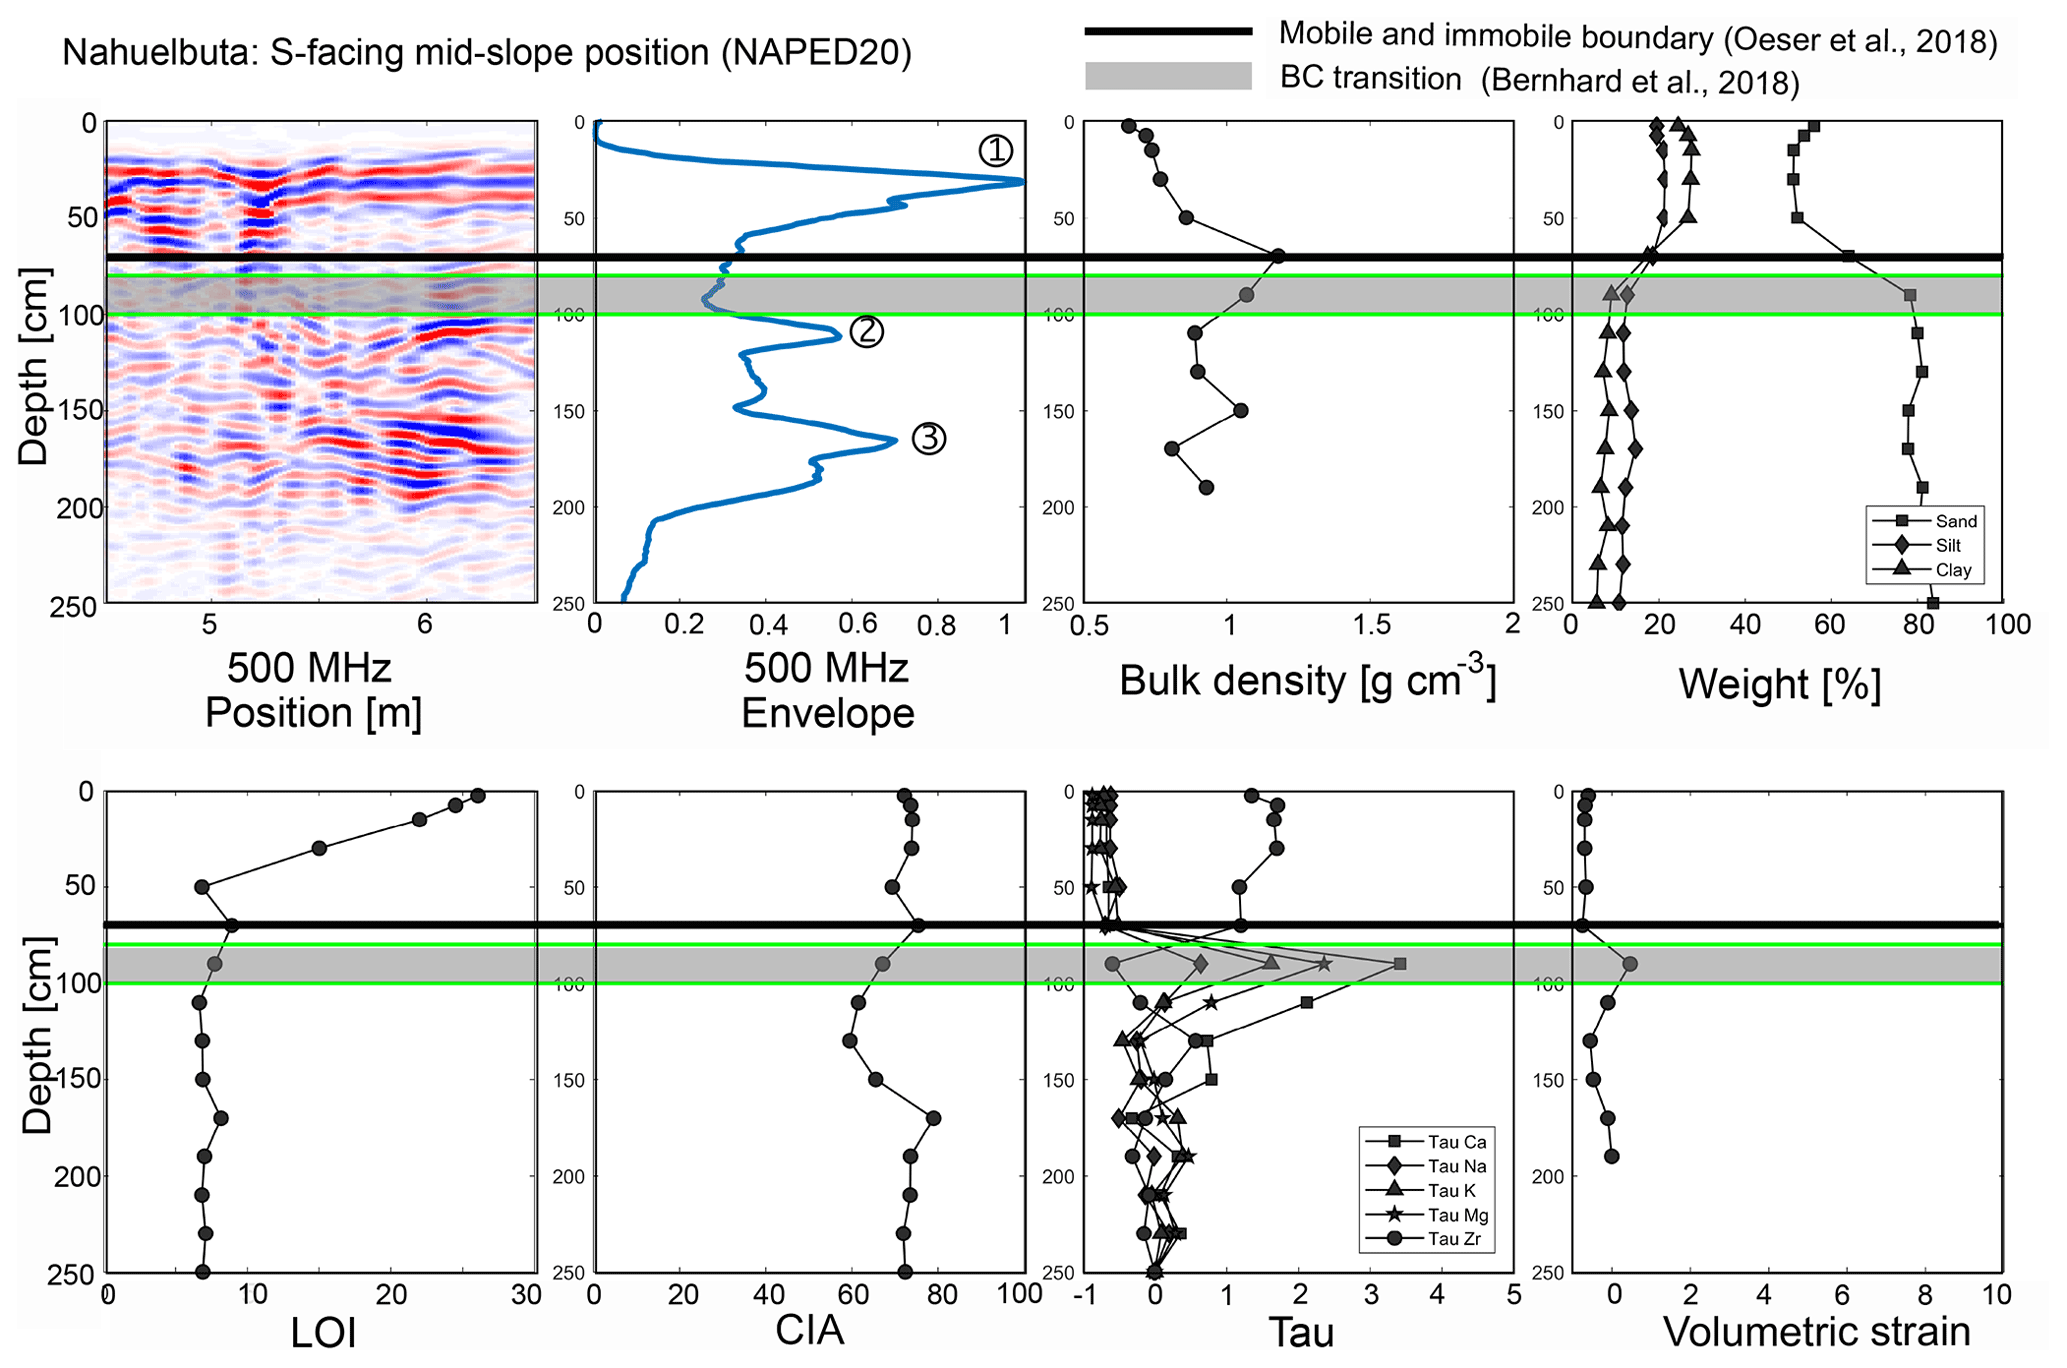
Figure 10Compilation of physical and chemical investigations at the pedon location in the mid-slope position of the S-facing hillslope in Nahuelbuta. Properties shown are listed as in caption of Fig. 4. Note that only the 500 MHz signal and envelope profile exist.
Physical and chemical properties of pedons are shown with the 500 and 1000 MHz GPR profiles and their envelopes with depth as well as investigated correlations and PCA results for the four study areas (Figs. 4 to 11; S1 to S12; Tables 3, S1a to d, S2a to d, S3a to c, and S4a to e). For brevity, comparisons between pedon observations and GPR data are presented only for the S-facing mid-slope positions in the main text (Figs. 4, 6, 8, and 10), and the remaining locations are provided in the Supplement. Note that the envelopes are averaged over the common offset profile data, collected over a lateral distance of 1 m in total, and are therefore not point information. Given that the pedolith thickness increases towards the southern study areas, the 1000 MHz GPR antenna is interpreted for the northern two study areas Pan de Azúcar and Santa Gracia, whereas in La Campana and Nahuelbuta the 500 MHz GPR signal was used because it has a deeper penetration depth. However, we show results below for both frequency antennae to demonstrate the difference in penetration depth and resolution between the two antennae. Details for each study area (from north to south) follow.
4.1 Pan de Azúcar (northernmost and driest study area)
In Pan de Azúcar (Figs. 1 and 2a), a gradual transition from the B to the C horizon was visually observed in the pedons at 20 to 40 cm (shaded gray areas after Bernhard et al., 2018; Figs. 4, S1 to S3), whereas the mobile and immobile boundary is considered to be at 20 to 25 cm (black lines after Oeser et al., 2018; Figs. 4, S1 to S3). No water content measurements for this area were available due to poor recovery of auger samples from the impenetrable substrate. The available physical properties for this location do not indicate a strong change in material properties with depth. LOI and CIA indicate a minor change in properties at ∼ 20 cm depth. A maximum in the energy envelope in the 1000 MHz frequency is present at about 20 to 30 cm and could be related to the transition of material properties between the B and C horizons and the location of mobile and immobile boundary observed in the field.
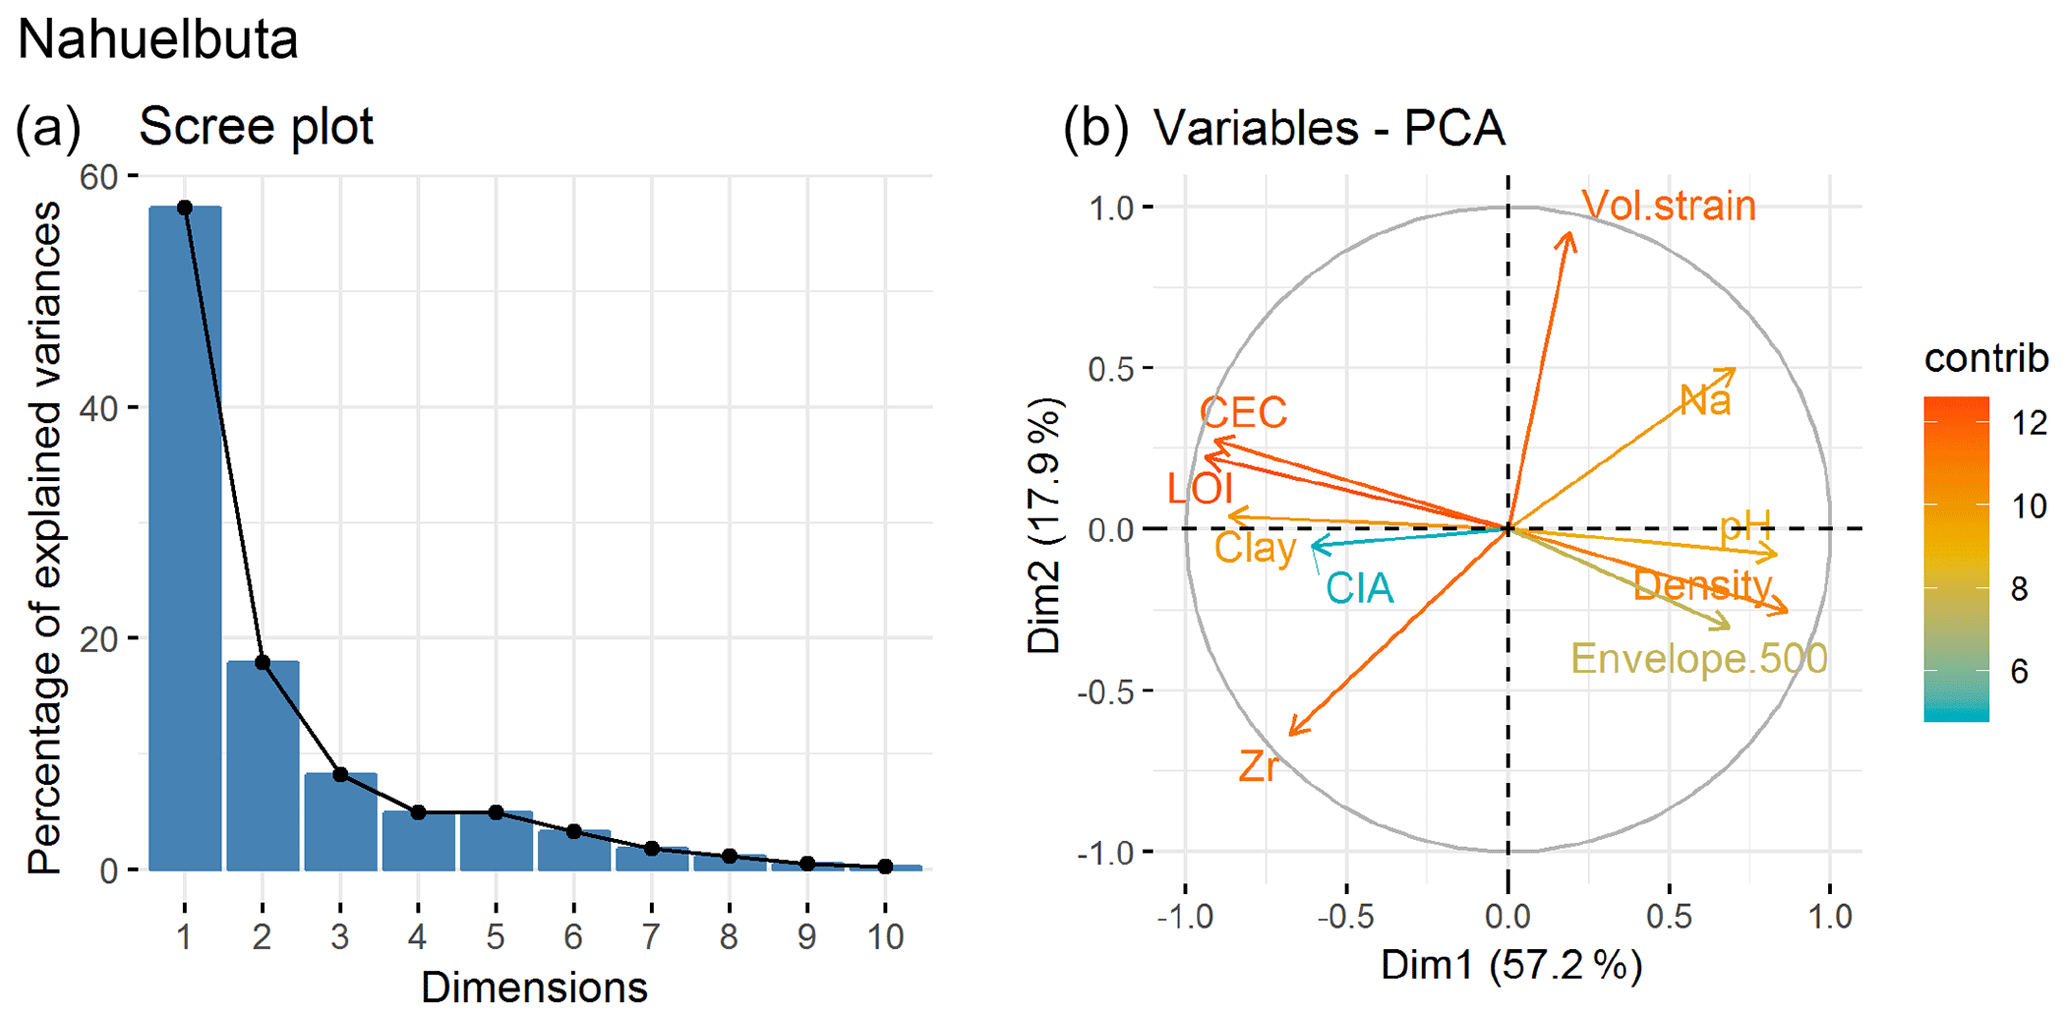
Figure 11Principal component analysis (PCA) of properties for all four pedons in Nahuelbuta.
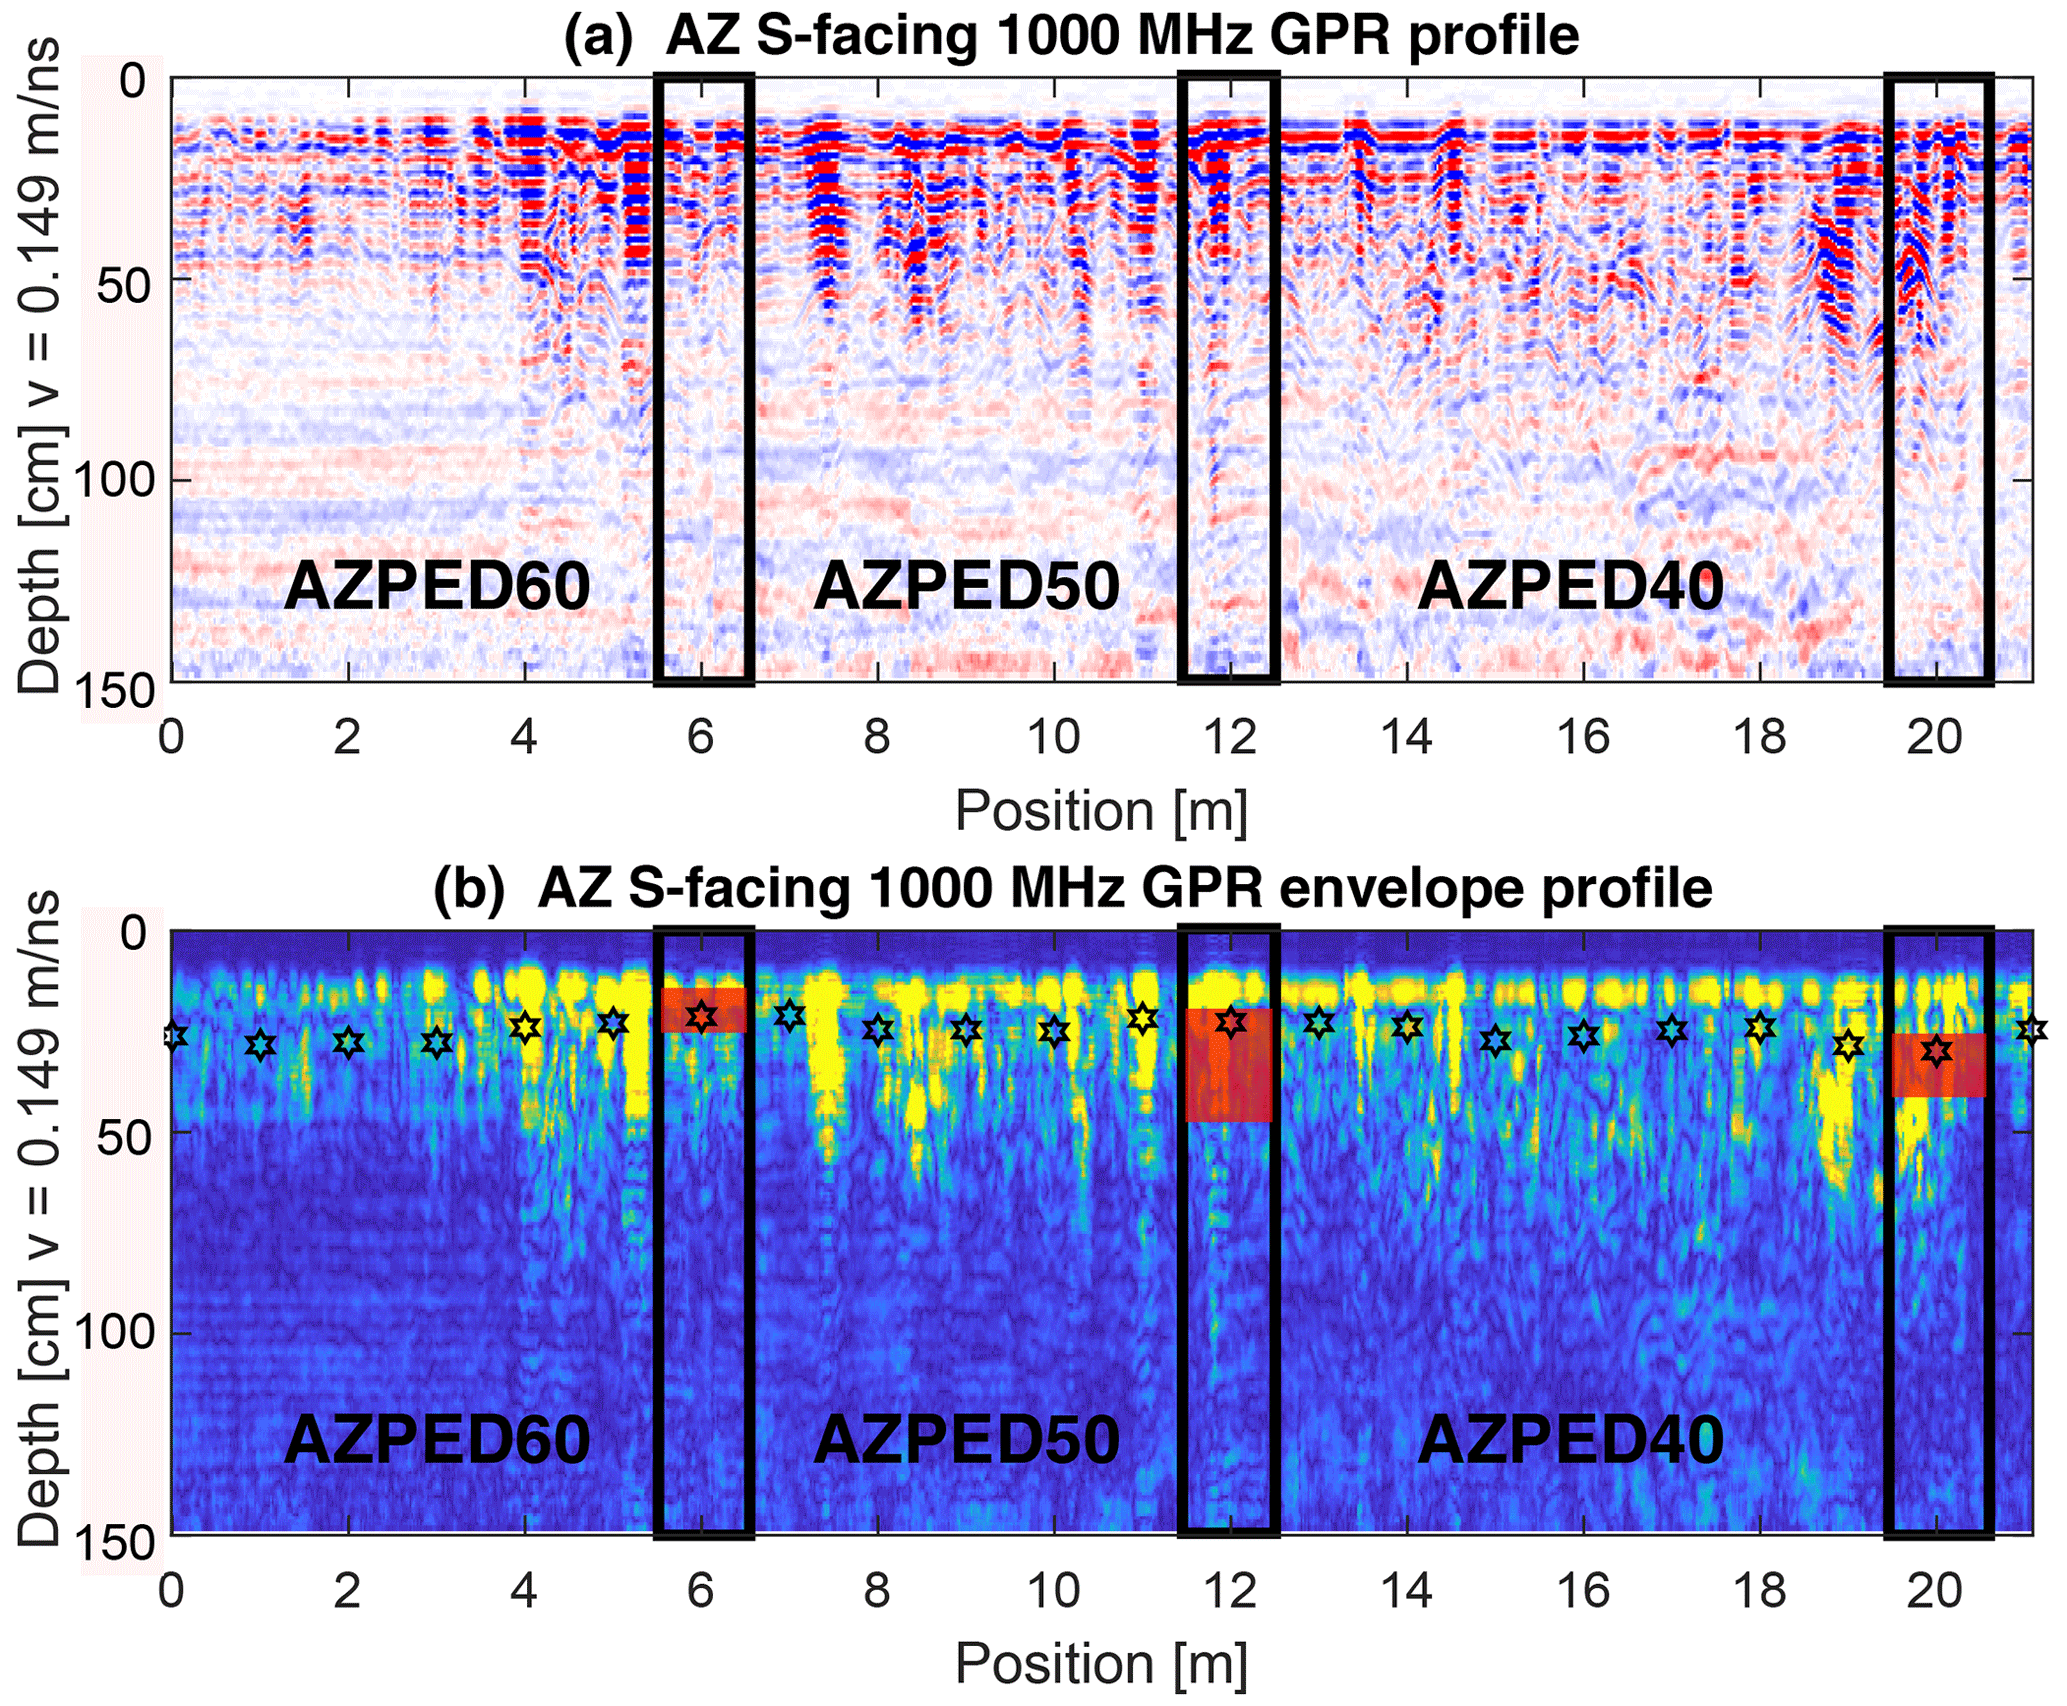
Figure 12(a) 1000 MHz GPR transect and (b) envelope for the S-facing hillslope in Pan de Azúcar. The hillslope transect spans over ∼ 20 m and includes pedon AZPED60, AZPED50, and AZPED40 (black boxes). The potential pedolith thickness based on the envelopes is indicated by stars (in b). The red bar indicates the B to C horizon transition as given in Bernhard et al. (2018). Uphill is from left to right. Note that in the radar data the air wave and background removal is applied.
Due to the sparse depth information for bulk density and clay content, the statistical analyses for this location were not very insightful. Whereas clay content shows a medium correlation (0.54) with the 1000 MHz GPR envelope, no strong correlation between LOI, CIA, τ, and the 1000 MHz GPR envelope could be found (Table 3). In the PCA, three principal components (PCs) explain over 80 % of the variance (Table S4a). PC1 has the biggest contribution from CIA, clay content, and the 500 MHz envelope, whereas PC2 has the biggest contribution from LOI, the 1000 MHz envelope, and τ of Na and Zr (Fig. 5).
Table 3Correlation coefficients R of 1000 and 500 MHz GPR envelope with derivatives of physical and chemical properties for each study area.
4.2 Santa Gracia
In Santa Gracia (Figs. 1 and 2b), a gradual transition from the B to the C horizon was observed in the field between 20 and 60 cm depth (shaded gray region Figs. 6, S4 to S6). The boundaries between the pedolith and saprolith were observed between 30 and 55 cm depth. Water content near pedon locations ranges between 7.6 % and 1.8 % and is highly variable with sample locations and with no clear spatial or depth-dependent trend (Table S3a). Bulk density and volumetric strain show slight changes around 15 and 30 cm depth. Whereas LOI and CIA do not show any changes with depth, τ shows changes between 30 and 50 cm depth. The 500 and 1000 MHz GPR profiles and envelopes show increased irregular and strong reflections at ∼ 25 cm (1000 MHz) and 45 cm (500 MHz) depth, as well as maximums in the envelope at ∼ 25 cm (1000 MHz) and 45 cm (500 MHz) depths. These variations in the reflections and maximums in the envelopes coincide with either the top or central position of the transition from the B to the C horizon.
A weak to moderate correlation (∼ 0.30) between clay content as well as CIA and the 1000 MHz GPR envelope is present (Table 3). Results from a PCA analysis of the Santa Gracia data indicate that three components explain over 80 % of the observed variance (Table S4b). PC1 explains over 35 % of the variance and includes bulk density, CIA, and the 500 and 1000 MHz envelopes (Fig. 7). PC2, explaining 31 % of the variance, includes clay content, LOI, and τ of Na and Zr.
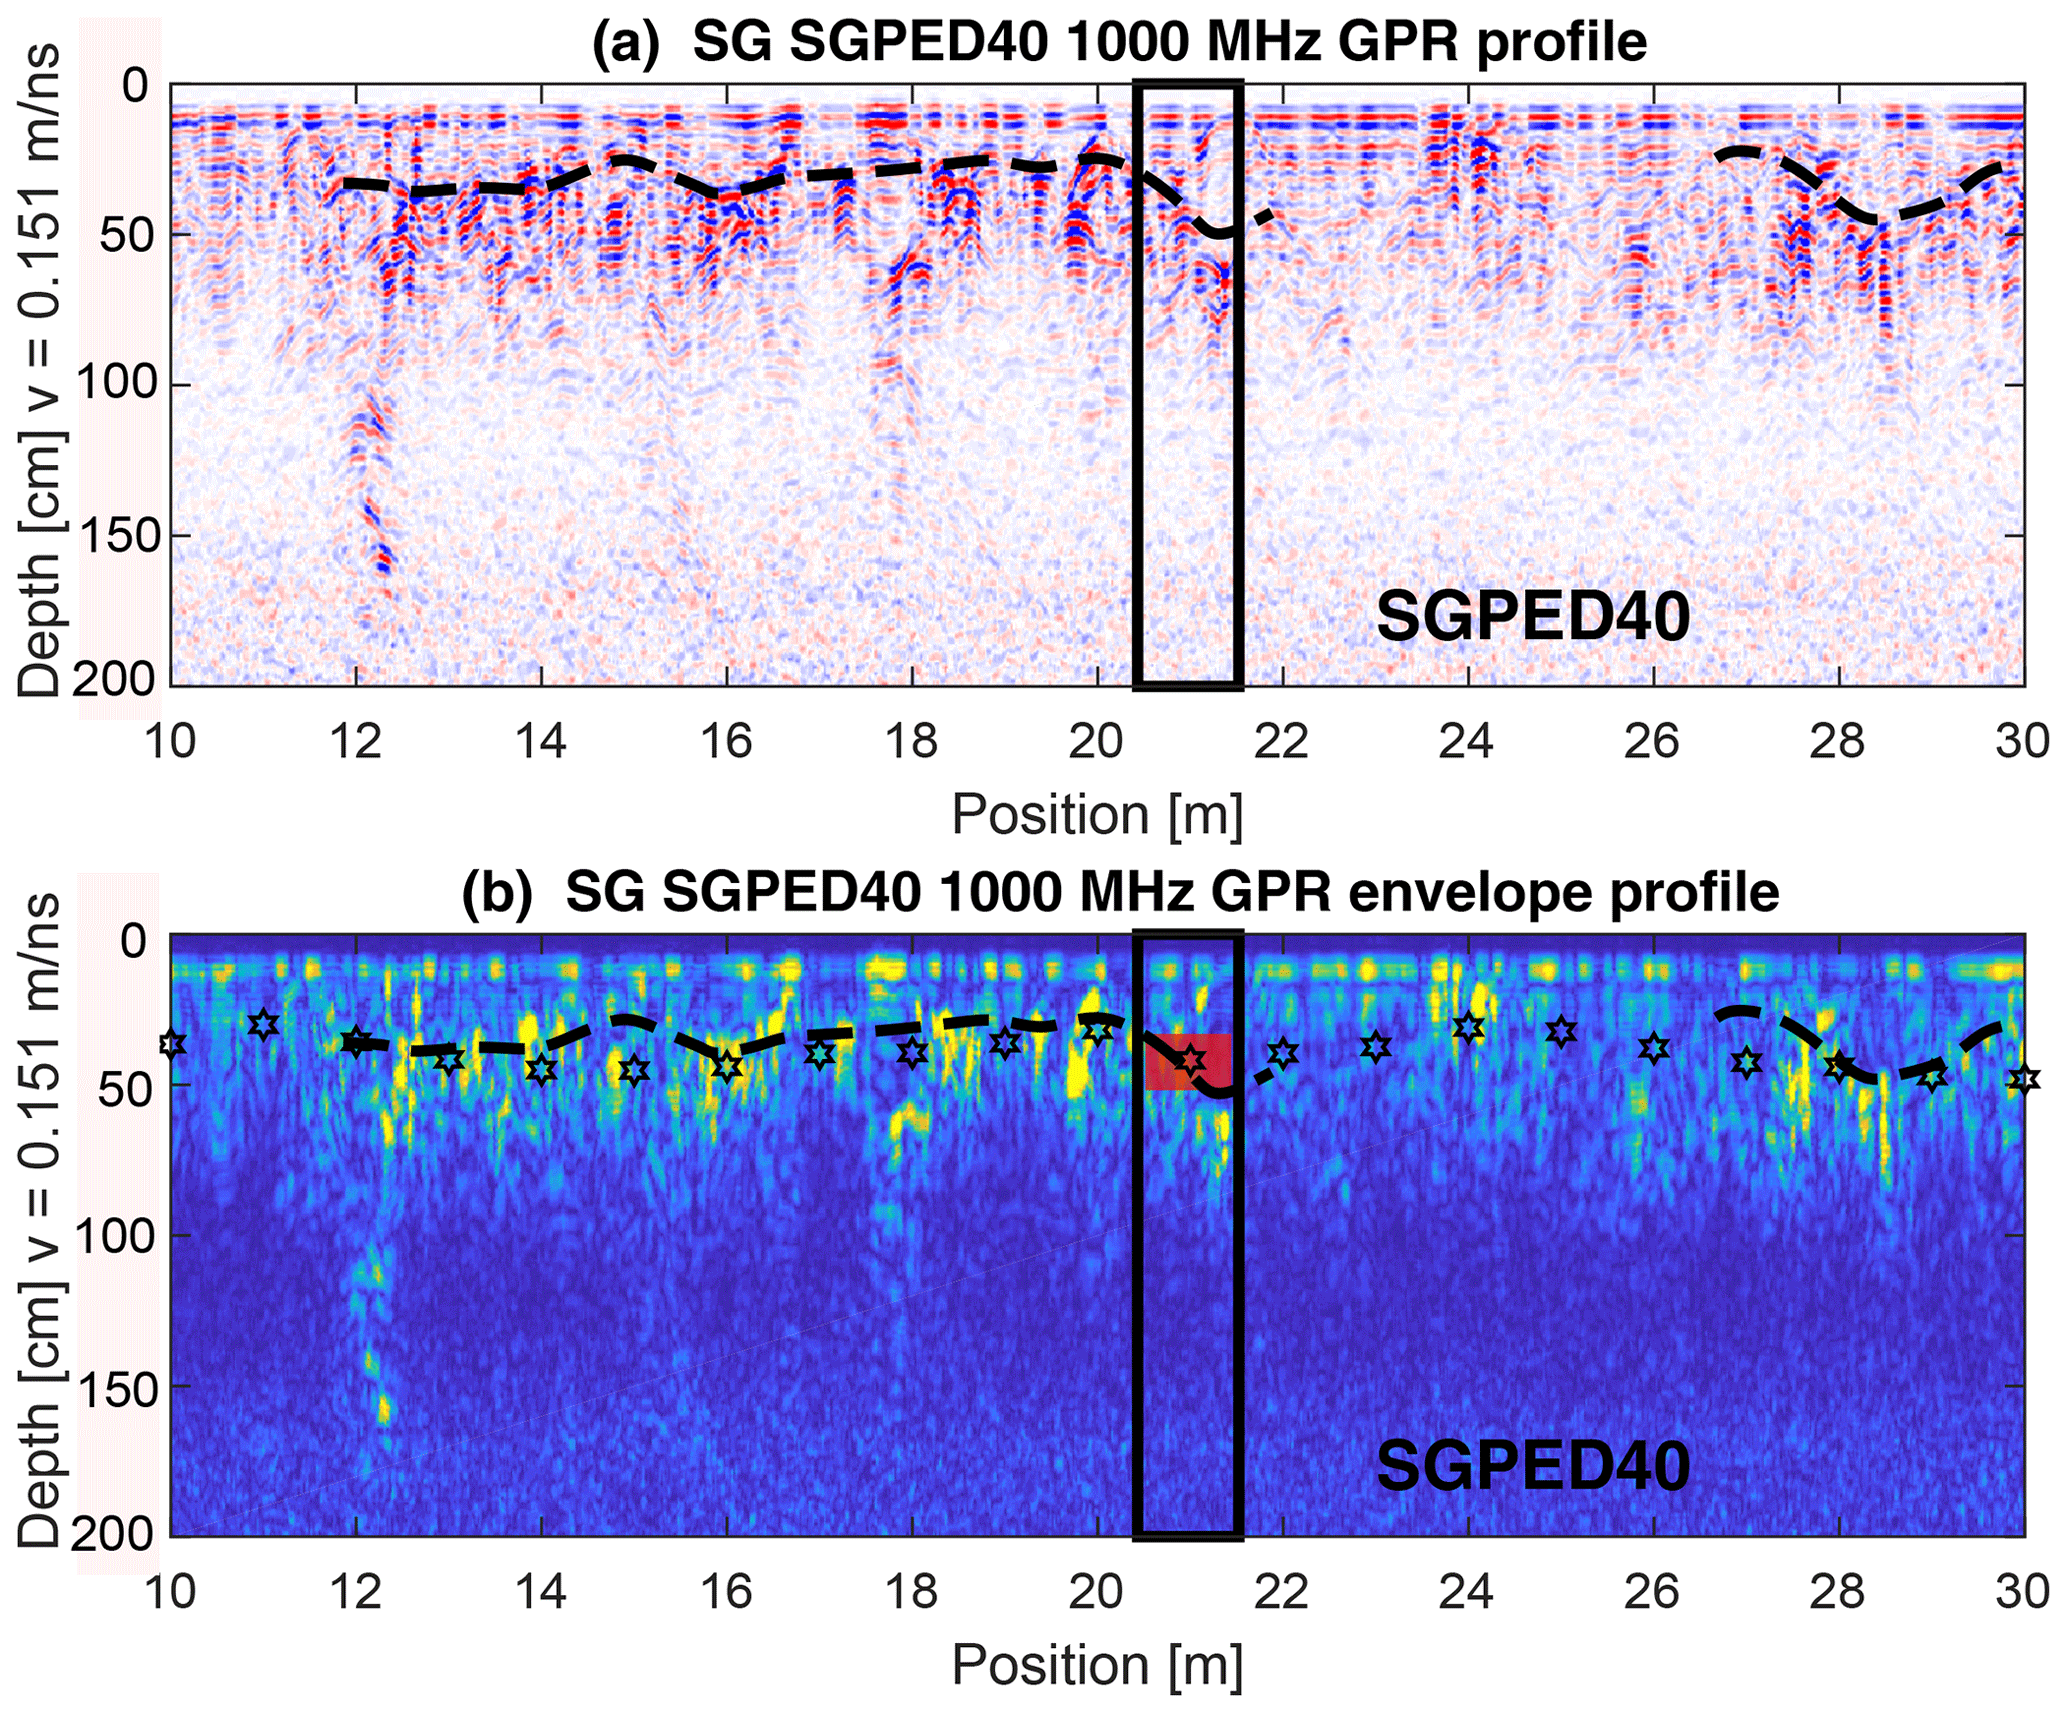
Figure 131000 MHz GPR signal and envelope for the mid-slope position of the S-facing hillslope position in Santa Gracia (SGPED40). The hillslope transect spans over ∼ 20 m. Interpretation of the radar signal is indicated where possible (stippled lines in a and b). The potential pedolith thickness is indicated based on the envelope profile. Uphill is from left to right. Lines and symbols in figures as described in Fig. 12.
4.3 La Campana
Field observations from the La Campana area (Figs. 1 and 2c) document a layer of cobbles (5 to 10 cm diameter) between the A and B horizon at a depth of ∼ 30 cm (Bernhard et al., 2018). The transition between the B and C horizons does not contain rock fragments. The transition from the B to C horizon (shaded gray area, Fig. 8) and the mobile and immobile boundary (black line, Fig. 8) are observed at 34 to 110 cm and 35 to 60 cm, respectively (see also Figs. S7 to S9). The pedolith extends deeper in La Campana than in Pan de Azúcar or Santa Gracia, and physical properties were available for greater depths. Bulk density and grain size change gradually with depth, and no pedolith thickness could be determined. Also, LOI, CIA, and τ do not show an abrupt change in regolith properties. Water content near pedons ranges between 3.1 % and 1.5 % and shows only a slight (∼ 0.5 %) decrease between depths of ∼ 30 and 90 cm (Table S3a). Reflection hyperbolas and irregular reflection horizons appear in the 500 and 1000 MHz GPR data at about 40 to 60 cm depth above the B to C horizon transition. The second peaks of the 500 and 1000 MHz GPR envelopes coincide with the B to C horizon transition.
In contrast to the previous study areas, the 500 MHz GPR envelope correlates moderately with CIA (0.56), pH (−0.57), and CEC (−0.39, Table 3). Three components from the PCA analysis explain about 80 % of the total variance (Table S4c). PC1 (∼ 35 % of the total variance) includes LOI, τ, and CEC, whereas PC2 (31 %) contains CIA, volumetric strain εstrain, and the envelopes (Fig. 9). PC3 is dominated by pH as well as τ of Zr. In general, whereas the first energy interval (1000 MHz) could be attributed to the stone layer between the A and B horizon, the second energy interval occurs close to (<10 cm) with the mobile and immobile boundary (Fig. 8).
4.4 Nahuelbuta (southernmost and wettest study area)
In Nahuelbuta, the B horizon contains pebbles and cobbles at around 60 to 80 cm depth (Bernhard et al., 2018). The B to C horizon transition appears at 50 to 100 cm depth (shaded gray region, Fig. 10; see also Figs. S10 to S12). The mobile and immobile boundary was identified at 60 to 90 cm depth (Oeser et al., 2018). Density measurements in the pedon indicate a transition in bulk density between about 30 and 60 cm depth where the grain size distribution also changes. The LOI and τ generally show large changes with depth, in contrast to the CIA and volumetric strain, which are more homogenous with depth. In general water content near pedons and in near-surface (10 to 30 cm depth) samples is between 23 % and 39 % and decreases ∼ 4 % to ∼ 10 % over regolith depths of 30 to 90 cm (Table S3a). In addition, water content increases from top to toe position in the S-facing slope and is lower in the N-facing mid-slope position than in the S-facing position. The 500 MHz GPR profile indicates the existence of point targets/objects appearing as reflection hyperbola or undulating features at depths greater than 60 cm. This depth is approximately the same depth at which the mobile and immobile boundary was identified, as well as changes in the physical properties (e.g. bulk density, percent sand) and chemical properties (LOI, τ). The hyperbolas do not add up coherently during the lateral averaging and therefore do not produce a significant energy interval in the average envelope. The envelope is dominated by the energy intervals given by two reflections at about 30 to 50 cm depth. The lower set of these energy intervals could be linked with the upper physical pedolith boundary.
Results from the correlation analysis indicate that the 500 MHz GPR envelope is strongly positively correlated with bulk density (0.74), strongly inversely correlated with LOI (−0.60), and moderately inversely or positively correlated with clay content (−0.37), pH (0.46), and CEC (−0.53) (Table 3). Results from the PCA analysis show that two PCs explain ∼ 75 % of the variance. PC1 (∼ 57 %) includes bulk density, clay content, LOI, and CEC, and PC2 (∼ 18 %) contains τ of Zr and pH (Fig. 11; Table S4d). In general, as the 500 MHz GPR envelope signal correlates well with bulk density and clay content, the envelope signal reflects changes in regolith properties.
Here we evaluate the physical, chemical, and geophysical observations from the pedons. Using this information, we attempt to upscale information from the pedons to the hillslope scale along the GPR transects.
5.1 Synthesis of GPR data with physical and chemical properties from point locations
GPR data image subsurface changes that could be caused by variations in physical (e.g., bulk density, grain size variation, water content) and chemical properties (e.g., pH, CEC, CIA). The interplay between these different properties can have a complicated influence on the GPR signal and therefore can be difficult to disentangle. Disentangling any relationship between GPR data and physical and chemical properties is further complicated because not all properties influencing GPR data are measured in the pedons (e.g., water content; Jol, 2009). In addition, the determination of the boundary between the pedolith and saprolith in the field causes its own problems because observed changes are not discrete but transitional over a depth interval of 5 to 10 cm. In the following, we start by discussing whether GPR data can be used to image pedolith thickness as well as physical and chemical properties at the pedon locations where in situ observations were made in each study area.
In Pan de Azúcar (Figs. 4 and 5, S1 to S3), the locations where GPR data can be compared to pedons show low variability in the observed pedolith thickness (∼ 20 to 30 cm) at each pedon location. Whereas the 500 MHz signal shows the interface with the saprolith, the maximum in the 1000 MHz energy interval signal agrees with the pedolith thicknesses observed in the field (Figs. 4 and S1 to S3). However, the boundary between the pedolith and saprolith is probably too shallow to be detected with the 1000 MHz antenna. An even higher frequency would be required to detect the pedolith and saprolith boundary. Hence the Pearson correlations and PCA results from Pan de Azúcar are restricted not only because of GPR analysis but also due to restricted physical properties. The physical and chemical properties correlate only weakly to moderately with the 1000 MHz envelopes (Table 3). The PCA results indicate that bulk density is not likely correlated with either the 1000 MHz signal or LOI. In Pan de Azúcar, LOI does not represent organic matter because regoliths of arid zones generally have low or no organic matter content. The volatile loss measured in the LOI is more likely associated with the combustion of carbonates. In general, shallow pedoliths in the arid zone do not show much variability in pedolith thickness nor do they provide insight into the influence of physical or chemical properties on GPR signals.
In Santa Gracia (Figs. 6 and 7, S4 to S6), the field-observed pedolith thicknesses of the different pedons are more variable than in Pan de Azúcar. Although the 500 and 1000 MHz GPR envelopes indicate changes at depth, the physical and chemical properties observed with depth show only a few distinct changes implying that the pedolith thickness cannot easily be determined using only physical or chemical properties. The PCA indicates that most of the variance in PC1 is explained by the envelope signals, bulk density, and CIA, whereas PC2 is dominated by clay content and τ of Na and Zr. The clay content does not seem to be a dominant factor for the envelope signal but rather represents a complex interaction between physical and chemical property changes that cannot be disentangled with available data. It appears that the second energy interval in the 1000 MHz envelope may agree with the observed pedolith thickness in Santa Gracia, and (in contrast to the Pan de Azúcar location) the first maximum in the 500 MHz envelope does agree with the observed pedolith thickness. These observations again underscore that, for different locations with variable regolith type, vegetation, and physical and chemical properties, local calibration between pedons and GPR data is required.
The determination of pedolith thickness from GPR data in La Campana is as difficult as in the previous settings (Figs. 8 and 9, S7 to S9). Field observations indicate relatively thick transition zones from the B to C horizons, and some physical properties vary only weakly with depth. As a result, the determination of pedolith thickness with physical and chemical properties is difficult, despite the moderate to strong correlation of 500 MHz GPR envelopes with derivatives of physical and chemical properties. Whereas PC1 explains much of the variance in terms of bulk density, LOI, τ of Na and Zr, and volumetric strain εstrain, the PC2 consists of the envelopes, CIA, pH, and CEC. Chemical properties seem to have a considerable influence on GPR signals in this setting. In La Campana, the first energy interval in the 500 MHz envelope is interpreted to reflect the presence of the stone layer, whereas the second energy interval seems to match the observed pedolith thickness. Given these uncertainties in local conditions, a clear identification of pedolith thickness from GPR data is difficult, even with local calibration to a pedon.
Finally, in Nahuelbuta (Figs. 10 and 11, S10 to S12), the observed pedolith thickness in the field is the deepest of all the four study areas and reaches from 50 to 100 cm. The pedolith thickness is easily identifiable based on physical properties (e.g., bulk density, grain size variation). The derivatives of the physical properties correlate moderately with the available 500 MHz envelope (Table 3). Furthermore, the chemical properties correlate weakly with the GPR envelope. The variance is strongly explained by PC1 containing physical properties (e.g., bulk density, clay content, LOI) and less by PC2 including chemical properties (e.g., pH, τ of Na and Zr). Even though changes in properties are more pronounced in Nahuelbuta than in the drier locations, a clear correlation between maximums in the 500 MHz energy envelope and pedolith thickness is not present. The second energy interval of the 500 MHz envelope best agrees with the observed pedolith thickness. However, due to local inhomogeneities caused by intense vegetation, every pedon and its attributed GPR envelope looks different.
In summary, the 500 and 1000 MHz envelopes at point locations have the potential to be used to determine pedolith thickness. But the clarity with which this can be done is variable and requires calibration to local pedons. Even with local calibration, the relationships are not always clear (e.g., Fig. 8). Physical and chemical properties with depth exert a complex influence on measured GPR signals. If a certain combination of physical and chemical properties is dominant in one setting, another combination may influence the measured GPR signal in another. For example, whereas clay content correlations are moderately positive with GPR envelopes in the dry area of Pan de Azúcar, the relationship is weaker at more southerly latitudes and is moderately negatively correlated in Nahuelbuta. Other physical properties (e.g., bulk density, LOI) only correlate well with the envelopes in the southernmost study area of Nahuelbuta. The more pronounced correlation of bulk density and LOI with the envelope signal can be attributed to the abundance of organic matter in the regolith. The presence of organic matter influences not only bulk density and LOI but also CEC and pH (all organic matter-related variables). Analysis of the PCA results in light of organic matter variations identifies the following variables as being best explained from north to south: (1) in Pan de Azúcar, the GPR envelope, clay content, and CIA are most closely related; (2) in Santa Gracia, the GPR envelope, bulk density, and CIA are most closely related; (3) in La Campana, the GPR envelope, bulk density, organic matter-related variables are related; and (4) in Nahuelbuta, the organic matter-related variables, bulk density, and GPR envelope are most closely related.
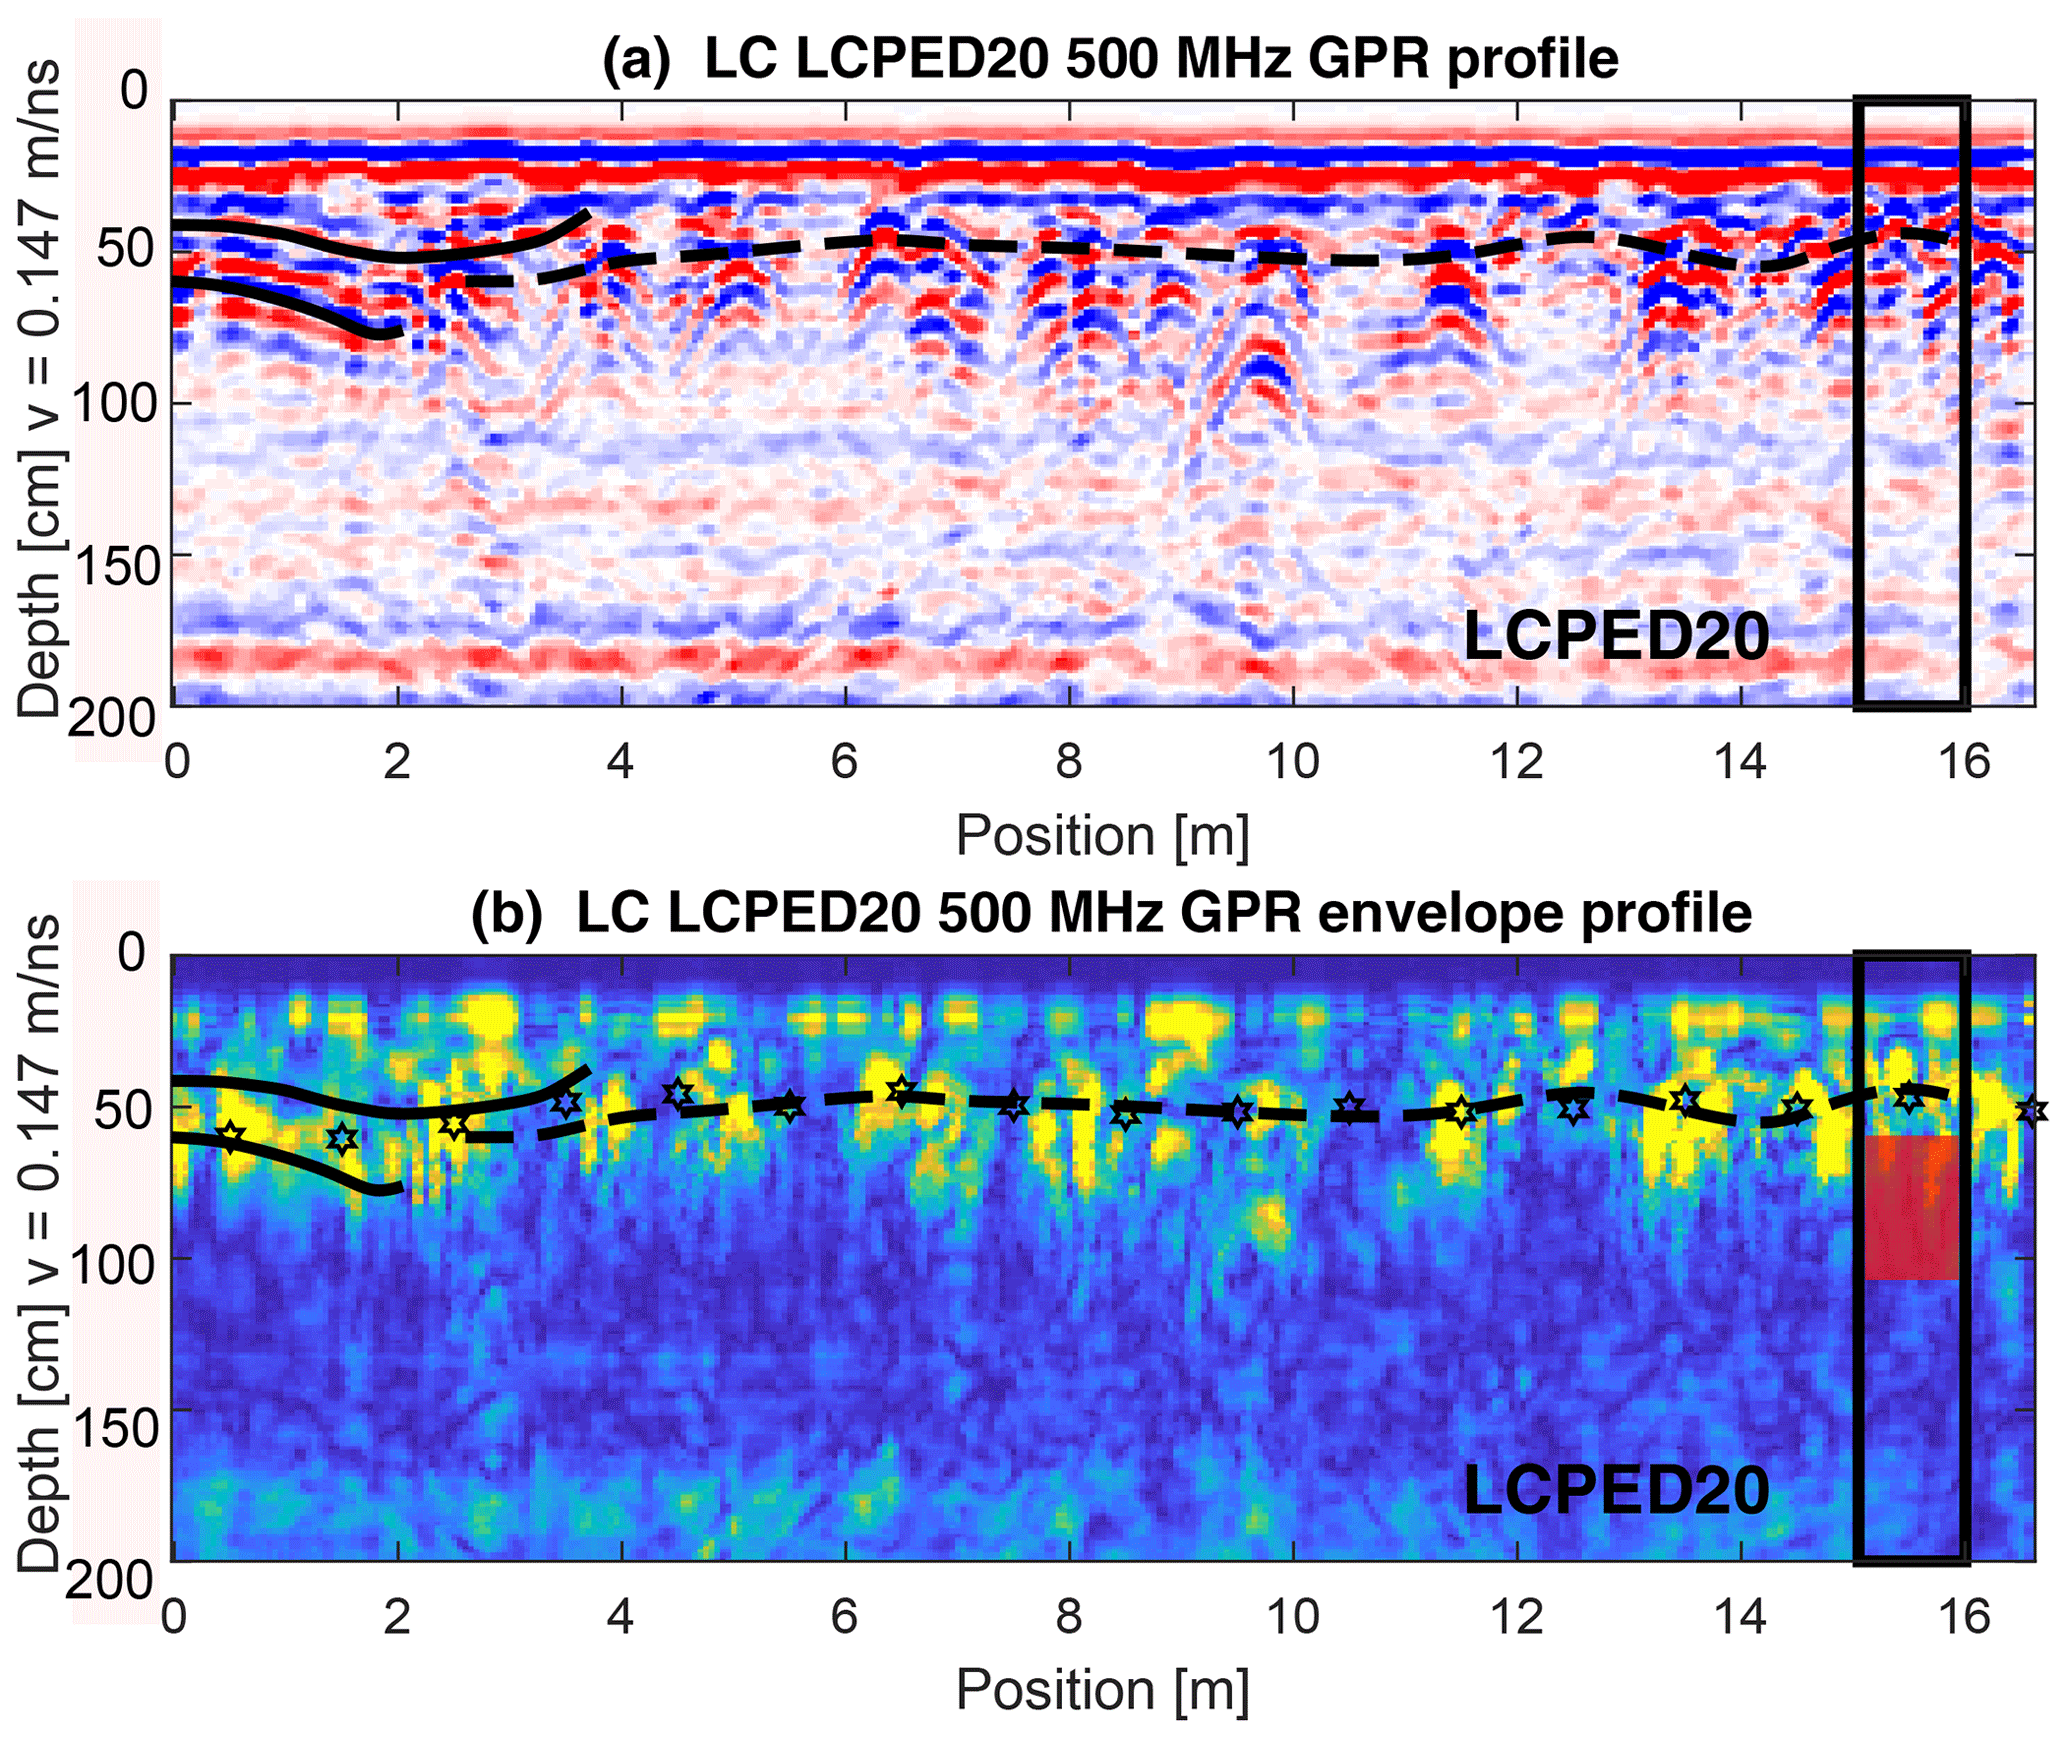
Figure 14500 MHz GPR signal and envelope for the mid-slope position of the S-facing hillslope in La Campana (LCPED20). The hillslope transect spans over ∼ 8 m. Interpretation of the radar signal is indicated where possible (stippled and black lines in a and b). The potential pedolith thickness is indicated based on the envelope profile. Uphill is from left to right. Lines and symbols in figures as described in Fig. 12.
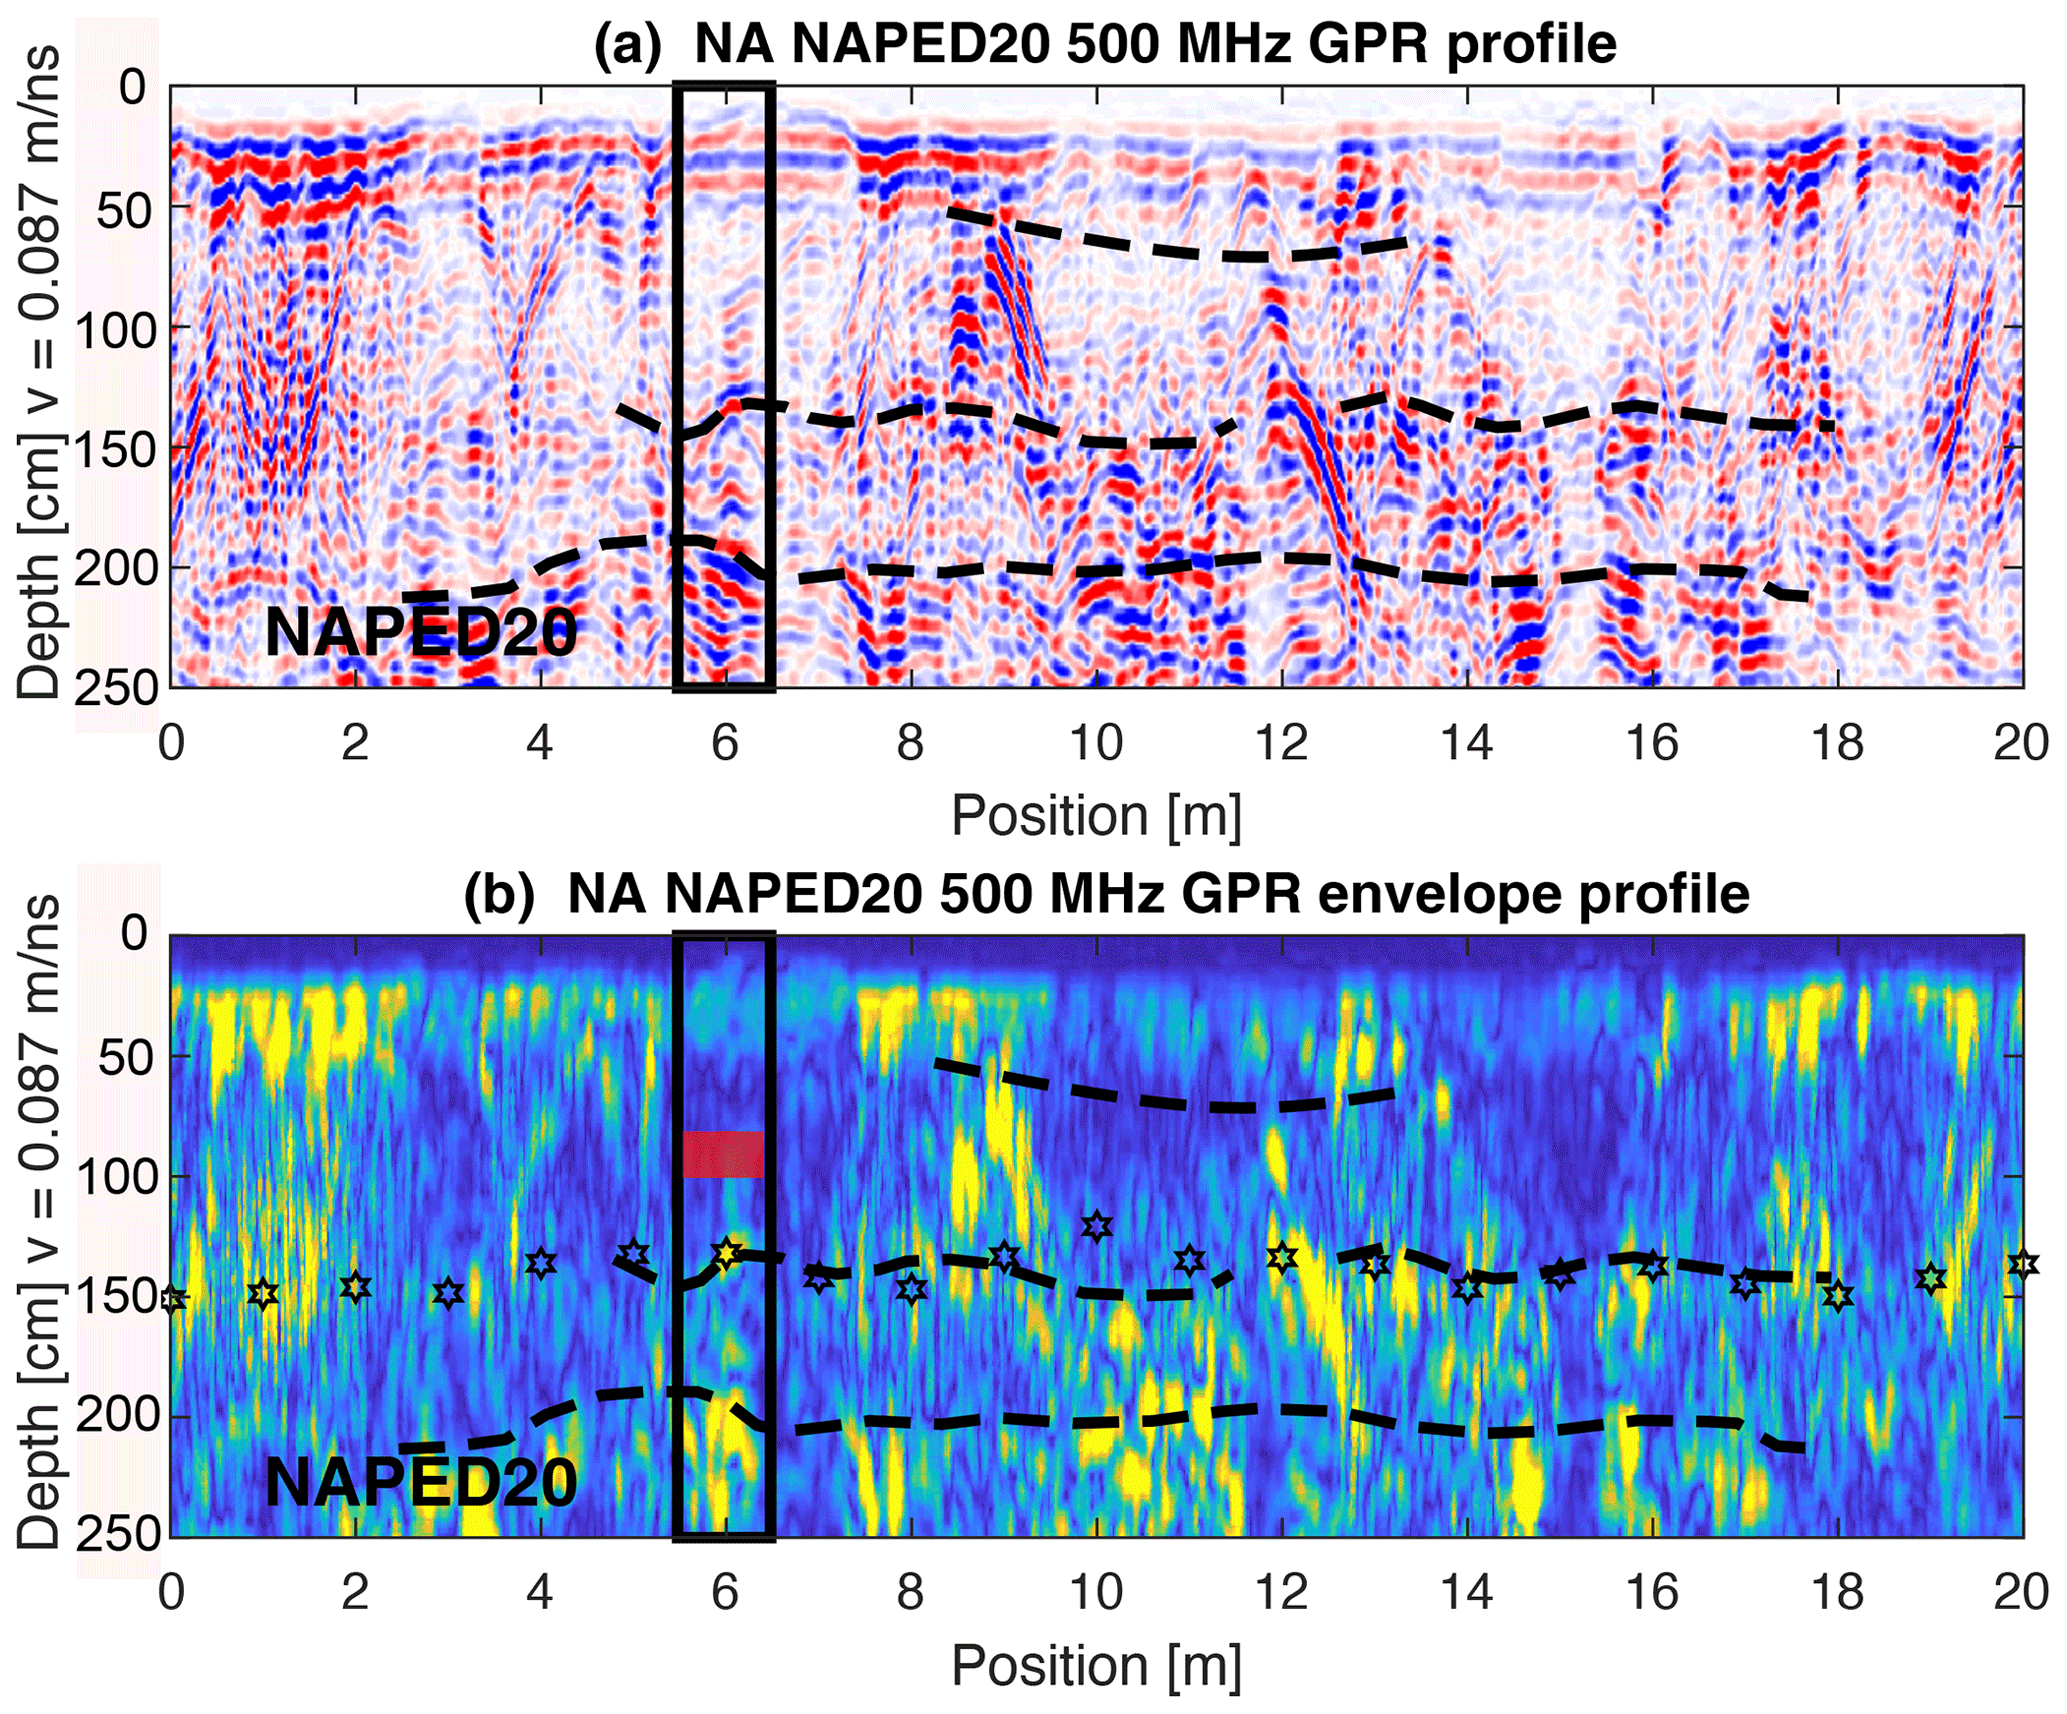
Figure 15500 MHz GPR signal and envelope for the mid-slope position of the S-facing hillslope in Nahuelbuta (NAPED20). The hillslope transect spans over ∼ 20 m. Interpretation of the radar signal is indicated where possible (stippled lines in a and b). The potential pedolith thickness is indicated based on the envelope profile. Uphill is from left to right. Lines and symbols in figures as described in Fig. 12.
Thus, the influence of vegetation and the continuous addition of organic matter to regolith properties influencing GPR signals are strengthened from north to south. Therefore, which GPR frequency works best for the individual study area (due to different physical and chemical properties) needs to be investigated with information from point locations/pedons. For the arid Pan de Azúcar and semi-arid Santa Gracia, we suggest using the 1000 MHz frequency (or higher), whereas for the Mediterranean climate setting of La Campana and temperate Nahuelbuta the 500 MHz frequency proved better. Improvements in our approach to determine pedolith thickness from GPR data might be possible by applying multifrequency GPR techniques, which are freed from antenna effects by fusion of different frequency measurements (e.g., De Coster and Lambot, 2018). Nevertheless, the point information of pedolith thickness has the potential to be upscaled to hillslopes in some settings using GPR transects after local calibration is conducted.
5.2 Upscaling to hillslopes
Here we use insights gained from comparisons between GPR and point locations to extrapolate the pedolith thickness along the hillslope GPR profiles (Figs. 2 and 3). Our efforts here complement previous work by Dal Bo et al. (2019) by adding 25 new GPR profiles that cover a larger geographic region. The upscaling is carried out using a combination of amplitude and envelope depth-converted profiles. To do this upscaling, we calculated the envelope along each profile. Then, using the known pedolith depth data from all pedons in one study area, this interface was estimated along the profiles by searching for the corresponding signal in the envelope at every meter. Even though the information of three-point locations is at the lower limit, the combination of field observations with GPR transects allows estimation of the lateral variability of pedolith thickness over hillslopes. However, the complications of which frequency of GPR antenna to use for analysis (Dal Bo et al., 2019) in addition to what envelope interval to select (Sect. 5.1) requires careful upscaling of the pedolith thickness to hillslopes.
In Pan de Azúcar (Figs. 12, S14) the observed B to C horizon transition at point locations is typically between ∼ 14 and 50 cm. No clear pedolith thickness could be determined based on GPR profiles. Nevertheless, pedolith thicknesses identified from 1000 MHz GPR envelopes seem to be relatively homogeneous over the entire S-facing transect with an average value of 25 ± 3 cm (Table 1). In contrast, the N-facing transect indicates a thinner pedolith uphill than downhill where it reaches a maximum depth of ∼ 50 cm (Fig. S14). In Santa Gracia (Figs. 13, S15 to 17), the pedolith thicknesses from point locations/pedons in the S-facing transect increase downslope and range between 20 and 60 cm (Table 1). The pedolith thickness based on the 1000 MHz GPR envelope at the top-slope position (SGPED20) decreases first downhill and then increases again, thereby demonstrating laterally variability down the hillslope. The pedolith thickness in the mid-slope position (SGPED40) is variable and reaches from 25 to 50 cm. At the toe-slope position (SGPED60) a mostly constant thickness of 30 cm is identified. In the N-facing transect almost no variability in pedolith thickness (∼ 25 cm) is observed. Although the pedolith thickness based on GPR envelopes cannot be used to decipher the exact pedolith thickness, the method still offers a close approximation of pedolith thicknesses determined by field observations and GPR profiles. In La Campana (Figs. 14, S18 to 20) the pedolith thickness from the 500 MHz GPR envelope is 35 to 70 cm (Table 1). Whereas the top-slope and mid-slope positions in the S-facing hillslope (LCPED10 and LCPED20, respectively) show variable pedolith thickness between 50 and 70 cm, the toe-slope position (LCPED30) contains pedolith thicknesses between 35 and 70 cm. Relatively constant pedolith thicknesses of 50 to 60 cm are identified for the N-facing mid-slope position (LCPED40). Field observations do not always agree with pedolith thicknesses based on GPR envelopes. In the La Campana location, pedolith thicknesses based on GPR envelopes need to be considered with caution but contain valuable information such as the existence of pebble layers. However, GPR profiles show hyperbolas and continuous reflections, which can be interpreted along almost all the covered length. These interfaces can be reliably used to infer pedolith thicknesses, when a previous calibration with pedons has been done. In Nahuelbuta (Figs. 15, S21 to 23), pedolith thickness in the S-facing top-slope position (NAPED10) increases downhill from 60 to 110 cm (Table 2). At the mid-slope position (NAPED20), the pedolith thickness is highly variable and ranges from 50 to 110 cm. Pedolith thickness at the toe-slope position (NAPED30) is 80 to 110 cm. In the N-facing mid-slope position the pedolith thickness ranges from 60 to 110 cm. Pedolith thicknesses based on GPR envelopes are generally thicker than pedolith thicknesses observed in the field and do also not agree well with thicknesses based on GPR profiles. The discrepancy between GPR measurements and field observations could result from the high water content in Nahuelbuta at the time of GPR acquisition. Alternatively, the discrepancy could also result from the heterogeneity of regolith observed in pedons at each location (Berhard et al., 2018). The application of GPR envelopes to determine pedolith thicknesses needs to be treated with care in this setting. On the contrary, GPR profiles display rather continuous reflections that might represent interfaces within the pedolith and could therefore be used to extrapolate point-scale ground-truth information over the profile scale.
In summary, the application of GPR envelopes to determine pedolith thicknesses provides more information than pedolith thicknesses determined from GPR transects alone where in some cases no clear reflections may be visible. Generally, the findings of this study agree with the findings of Bernhard et al. (2018) as well as Dal Bo et al. (2019). Pedolith thicknesses increase from north to south in latitude. Due to the increase in vegetation amount, pedolith thicknesses are also less homogenous from increasing latitude (north to south). Due to the increasing heterogeneity in pedolith thickness, no clear trend in increasing pedolith thickness from top to toe slope is easily detectable. Only in Santa Gracia, the constantly thin pedoliths at the S-facing top slope are in contrast to the thicker and more variable pedolith thickness in the mid-slope position. Bernhard et al. (2018) describe an increase of the A to B–C horizon from top to toe slope in the S-facing hillslope. In addition, a clear difference between pedolith thickness from S- and N-facing slopes could not be detected for the more heavily vegetated study areas in the south. Again, only in Santa Gracia with little vegetation an expected difference in pedolith thickness between S- and N-facing slopes was detectable. The increase in vegetation under increasing precipitation rates causes not only more heterogenous pedolith depths, but also stabilization of hillslopes (e.g., Langbein and Schumm, 1958; Schmid et al., 2018; Starke et al., 2020).
5.3 Comparison to previous work and study caveats
Geophysical studies focusing on the critical zone are a relatively new topic and have gained attention in the past decades (e.g., Parsekian et al., 2005). The results presented in this study complement a range of previous studies. Previous studies have used near-surface geophysical methods to non-invasively measure subsurface properties and structures of the regolith and help to characterize critical zone-related processes in the shallow subsurface (e.g., Scott and Pain, 2009). In this study, we focused in particular on deploying surface ground-penetrating radar (GPR). The electromagnetic properties of the subsurface affect the propagation (i.e., velocity), attenuation (i.e., the energy loss), and reflectivity of the electromagnetic waves (e.g., Jol, 2009). The electromagnetic wave velocity and attenuation can be linked to the dielectric permittivity and electrical conductivity of the subsurface, respectively. Previous work provides examples of environments, where GPR is suitable for mapping subsurface properties. These include karst areas, where structures in the regolith have been identified up to the bedrock interface (e.g., Estrada-Medina et al., 2010; Fernandes et al., 2015; Carriere et al., 2013), volcanic environments (e.g., Gomez et al., 2012; Ettinger et al., 2014), and dry environments (e.g., Bristow et al., 2007; Harari, 1996) as generally these regimes are characterized by low clay and water content. The primary new contribution of this study with respect to existing regolith studies is the comparison of GPR data to a wide range of physical and chemical properties that are commonly interpreted in projects studying surface processes.
Previous work has highlighted the primary factors that GPR data can be sensitive to, and we briefly discuss these in the context of caveats associated with our work. Important factors that influence GPR data are the presence of water, solute content, and conductive materials such as clay (e.g., Scott and Pain, 2009; Huisman et al., 2003). In particular, clay as a highly conductive material has a significant impact on GPR signal as it affects the permittivity and the electrical conductivity at the same time (e.g., Daniels, 2004). With increasing amounts of clay in the subsurface, the signal penetrating is decreased due the increased attenuation of the waves. However, this behavior can be used to identify fine material in the subsurface, since in GPR profiles clay layers could be identified starting from spatial differences in signal penetration (e.g., Gómez-Ortiz et al., 2010; De Benedetto et al., 2010; Tosti et al., 2013). Furthermore, particle size beyond just clay content also plays a major role in GPR measurements, as the closer the particle size is to the wavelength of the emitted electromagnetic waves, the stronger are the reflections generated by these particles that can be seen in the detected signals (e.g., Jol, 2009). In this study, we incorporated clay content into our PCA and correlation analysis to identify whether, and by how much, it may influence GPR observations.
Previous studies have also documented how mineralogical variations with depth influence GPR signals. For example, the presence of minerals such as iron and aluminum oxides/hydroxides can play an important role in limiting the depth of penetration for GPR waves (e.g., Čeru et al., 2018) as iron oxides have been linked with variations of relative permittivity, which might have in turn a considerable effect in the propagation of the GPR signals and affect the interpretation (e.g., Van Dam et al., 2003; Van Dam and Schlager, 2000; Havholm et al., 2003). Other studies showed that with increasing mafic mineral content in the subsurface, GPR signal attenuation is higher (e.g., Breiner et al., 2011). The presence of clay lenses in the regolith, alongside the layering, can influence the preferential flow path for regolith water, which can enhance reflectivity of the surfaces and therefore produce detectable reflections (e.g., Zhang et al., 2014). In this study, mineralogical variations with depth in the pedons were not available for comparison to our GPR data. However, we note that many of the processes described above may be responsible for the subsurface reflectors observed in Figs. 12 to 15, and the fairly uniform granitoid composition of the different study areas means that mineralogical variations along any given hillslope profile are likely minimal and not a dominant source of signal in our GPR data.
The presence of volumetric water limits GPR signal penetration, with an increasing effect at higher frequencies (e.g., Utsi, 2017; Miller et al., 2002). GPR techniques have been used in the past two decades as a tool to detect water content variations in the subsurface as it has a strong effect on the dielectric permittivity (e.g., Klotzsche et al., 2018). In compact regoliths, where the volumetric water content is small, it has been shown that the bulk density has an important effect on the wave velocity, which is positively correlated (Wang et al., 2016). When solutes are present in the groundwater, the electrical conductivity of the medium increases, generating more signal loss, and therefore increasing wave attenuation (e.g., Benedetto and Palewski, 2015). One shortcoming of our study is that no information about subsurface water content within the pedon depth profiles was available for comparison to GPR observations as we did with the regolith physical and chemical properties. The depth-varying chemical weathering indices we present (e.g., CIA, τ, Figs. 4 to 10) would not be expected to correlate with present-day water content as these weathering indices developed over the timescale of regolith development (millennia and longer). Nevertheless, we find that out of the four study areas investigated, the present-day water content appears to influence the GPR signals and interpretations presented here only in the southernmost and wettest study area of Nahuelbuta. As a result, the subsurface correlations between the GPR envelopes and physical or chemical properties at this location are likely influenced, to an unknown degree, by regolith water content. The exclusion of regolith water content in our analysis may very well be a reason why we are not able to explain the full radar signature. However, without the inclusion of these data, peaks in the radar envelopes were still interpretable when compared to available physical and chemical property variations with depth. Thus, although the inclusion of regolith water content would be preferred, the omission of it does not negate the observed signals we were able to interpret.
In locations, where the aforementioned regolith properties are not dominant, GPR can be used as a tool to identify structures and layering in both sediments (e.g., Bristow and Jol, 2003) and regoliths, where interfaces ranging from the regolith–bedrock limit to the B horizon have been identified due to changes in the dielectric permittivity (e.g., Yoder et al., 2001; Lambot et al., 2006). In particular Zhang et al. (2018) showed the potential of mapping regolith layering in grasslands obtaining differences between GPR reflections and real regolith layer depth within 3 cm. In many situations, the interplay between different regolith properties makes it difficult to understand the subsurface architecture without validation through regolith samples, as shown by Orlando et al. (2016) in the Icacos River watershed (Puerto Rico), where the stress regime, climate, and lithology are controlling the structures visible in GPR profiles. In comparing the previous studies to this one, we note that “in general” the results of this study were able to identify subsurface regolith structure and explain them, in many cases, with available physical and chemical properties. However, the complexity in GPR signals observed necessitates having pedons for local calibration when comparing to regolith weathering indices.
Pedolith thickness and physical and chemical properties are investigated in four study areas along a climate and vegetation gradient. This gradient spans from arid and Mediterranean to temperate humid conditions. The visually observed transition from the mobile pedolith to immobile saprolith coincides with one or more changes in measured physical and chemical properties in each study area. These physical and chemical properties, in turn, influence return signals generated by ground-penetrating radar (GPR) in the regolith, but no systematic trend is visible for which physical or chemical properties correlate with GPR-based observations of pedolith thickness. Given this, the measurements and interpretation of GPR signals for systematically identifying subsurface changes in physical and chemical properties are not straightforward and differ for each study area. In general, the better developed the pedolith the better the correlation of GPR signals from point locations with physical and chemical regolith properties. We note that choosing the GPR antenna frequency that is best suited for identifying pedolith thickness is difficult, and calibration to local point locations (e.g., pedons) is always required. Furthermore, we found that the higher-frequency (1000 MHz) antenna worked best for imaging pedolith layers for comparison to chemical indicators in the arid and semi-arid study areas (Pan de Azúcar and Santa Gracia). In contrast, the lower-frequency antenna (500 MHz) worked better in the Mediterranean and temperature study areas (La Campana and Nahuelbuta) for imaging pedolith structure and for comparison to chemical observations.
Data available in the Supplement of this manuscript which is partially based on underlying data available as supplementary datasets in Bernhard et al. (2018), (https://doi.org/10.5880/GFZ.5.3.2018.001) and Oeser et al. (2018) (https://doi.org/10.5880/GFZ.3.3.2018.001).
The supplement related to this article is available online at: https://doi.org/10.5194/soil-6-629-2020-supplement.
The study design was planned by MS, JvdK, and TAE. IDB, AK, and JvdK planned and conducted the GPR surveys with support from JPFE. IDB processed the GPR data, collected regolith samples, and preformed the statistical and PCA analysis. MS compiled the geochemical data and compared to geophysical observations with input from all authors. MS, IDB, and TAE prepared the manuscript, and all authors contributed to manuscript revisions.
The authors declare that they have no conflict of interest.
We would like to thank CONAF and all the park rangers for the possibility of working in the natural parks, for providing access to the sample locations, and help inside the national parks. We also thank Collin Pain, Lisa Worrall, and the topical editor, David Dunkerley, for their reviews of an earlier version of the manuscript.
We acknowledge funding from the German Science Foundation (DFG) priority
research program SPP-1803 “EarthShape: Earth Surface Shaping by Biota”
(grants KR 3725/1-1, SCHA 1690/3-1, and EH329/17-2). RD was supported by a
DFG Emmy Noether grant (DR 822/3-1).
This open-access publication was supported
by the University of Tübingen.
This paper was edited by David Dunkerley and reviewed by Colin Pain and Lisa Worrall.
Aranha, P. R. A., Augustin, C. H. R. R., and Sobreira, F. G.: The use of GPR for characterizing underground weathered profiles in the sub-humid tropics, J. Appl. Geophys., 49, 195–210, 2002.
Ardekani, M. R., Neyt, X., Benedetto, D., Slob, E., Wesemael, B., Bogaert, P., Craeye, C., and Lambot, S.: Soil moisture variability effect on GPR data, Proceedings of the 15th International Conference on Ground Penetrating Radar, Brussels, 214–217, https://doi.org/10.1109/ICGPR.2014.6970416, 2014.
Armesto, J. J., Vidiella, P. E., and Gutierrez, J. R.: Plant communities of the fog-free coastal desert of Chile: plant strategies in a fluctuating environment, Rev. Chil. Hist. Nat., 66, 271–282, 1993.
Benedetto, A. and Pajewski, L.: Civil engineering applications of ground penetrating radar, Springer, Cham, Switzerland, 371 pp., 2015.
Bernhard, N., Moskwa, L.-M., Oeser, R., von Blanckenburg, F., Boy, H., Brucker, E., Dippold, M., Ehlers, T. A., Fuentes-Espoz J. P., Godoy, R., Köster, M., Osses, P., Paulino, L., Schaller, M., Scholten, T., Seguel, O., Spielvogel, S., Spohn, M., Stock, S., Stroncik, N., Uebernickel, K., Wagner, D., and Kühn, P.: Pedogenic and microbial interrelations to regional climate and local topography: New insights from a climate gradient (arid to humid) along the Coastal Cordillera of Chile, Catena, 170, 335–355, https://doi.org/10.5880/GFZ.5.3.2018.001, 2018.
Braun, J.-J., Descloitres, M., Riotte, J., Fleury, S., Barbiero, L., Boeglin, J.-L., Violette, A., Lacarce, E., Ruiz, L., Sekhar, M., Mohan Kumar, M. S., Subramanian, S., and Dupre, B.: Regolith mass balance inferred from combined mineralogical, geochemical and geophysical studies: Mule Hole gneissic watershed, South India, Geochim. Cosmochim. Ac., 73, 935–961, 2009.
Breiner, J. M., Doolittle J. A., Horton R., and Graham R. C.: Performance of ground-penetrating radar on granitic regoliths with different mineral composition, Soil Sci., 176, 435–440, 2011.
Brimhall, G. H. and Dietrich, W. E.: Constitutive mass balance relations between chemical composition, volume, density, porosity, and strain in metasomatic hydrochemical systems: Results on weathering and pedogenesis, Geochim. Cosmochim. Ac., 51, 567–587, 1987.
Brimhall, G. H., Alpers, C., and Cunningham, A. B.: Analysis of supergene ore-forming processes using mass balance principles, Econ. Geol., 80, 1227–1254, 1985.
Bristow, C. S. and Jol, H. M.: An introduction to ground penetrating radar (GPR) in sediments, Geol. Soc. Lond. Spec. Publ., 211, 1–7, 2003.
Bristow, C. S., Jones, B. G., Nanson, G. C., Hollands, C., Coleman, M., and Price, D. M.: GPR surveys of vegetated linear dune stratigraphy in central Australia: Evidence for liear dune extension with vertical and lateral accretion, Special Papers, Geol. Soc. Am., 432, 19–34, 2007.
Carriere, S. D., Chalikakis, K., Senechal, G., Danquigny C., and Emblanch C.: Combining electrical resistivity tomography and ground penetrating radar to study geological structuring of karst unsaturated zone, J. Appl. Geophys., 94, 31–41, 2013.
Čeru, T., Dolonec, M., and Gosar, A.: Application of Ground Penetrating Radar Supported by Mineralogical-Geochemical Methods for Mapping Unroofed Cave Sediments, Remote Sens., 10, 639, https://doi.org/10.3390/rs10040639, 2018.
Chadwick, O. A., Brimhall, G. H., and Hendricks, D. M.: From a black to a gray box – a mass balance interpretation of pedogenesis, Geomorphology, 3, 369–390, 1990.
Dal Bo, I., Klotzsche, A., Schaller, M., Ehlers, A. T., Kaufmann, M. S., Fuentes-Espoz, J. P., Vereecken, H., and van der Kruk, J.: Geophysical imaging of regolith in landscapes along a climate and vegetation gradient in the Chilean Coastal Cordillera, Catena, 180, 146–159, 2019.
Daniels, D. J.: Ground penetrating radar, IEE Radar, Sonar, Navigation and Avionics Series, The Institution of Electrical Engineers, London, UK, 734 pp., 2004.
De Benedetto, D., Castrignano, A., Sollitto, D., and Modugno, F.: Spatial relationship between clay content and geophysical data, Clay Minerals, 45, 197–207, 2010.
De Coster, A. and Lambot, S.: Fusion of Multifrequency GPR Data Freed From Antenna Effects, J. Select. Top. Appl. Earth Ob. Remote S., 11, 664–674, 2018.
Doolittle, J. A. and Collins, M. E.: Use of soil information to determine application of ground penetrating radar, J. Appl. Geuphys., 33, 101–105, 1995.
Doolittle, J. A., Minzenmayer, F. E., Waltman, F. W., Benham, E. C., Tuttle, J. W., and Peaslee, S. D.: Ground-penetrating radar soil suitability map of the conterminous United States, Geoderma, 141, 416–421, 2007.
Estrada-Medina, H., Tuttle, W., Graham, R. C., Allen, M. F., and Jimenez-Osornio, J.: Identification of Underground Karst Features using Ground-Penetrating Radar in Northern Yucatan, Mexico, Vadose Zone J., 9, 653–661, 2010.
Ettinger, S., Manville, V., Kruse, S., and Paris, R.: GPR-derived architecture of a labor-generated fan at Cotopaxi volcano, Ecuador, Geomorphology, 213, 225–239, 2014.
Fernandes Jr., A. L., Medeiros, W. E., Bezerra, F. H. R., Oliveira Jr., J. G., and Cazarin, C. L.: GPR investigation of karst guided by comparison with outcrop and unmanned aerial vehicle imagery, J. Appl. Geophys., 112, 268–278, 2015.
Gerber, R., Felix-Henningsen, P., Behrens, T., and Scholten, T.: Applicability of ground-penetrating rader as a tool for nondestructive soil-depth mapping on Pleistocene slope deposits, J. Plant Nutr. Soil Sci., 173, 173–184, 2010.
Gomez, C., Kataoka, K. S., and Tanaka, K.: Large-scale internal structure of the Sambongi Fan-Towada Volcano, Japan: Putting the theory to the test using PGR on volcanoclastic deposits, J. Volcanol. Geotherm. Res., 229, 44–49, 2012.
Gómez-Ortiz, D., Martin-Crespo, T., Martin-Velazquez, S., Martinez-Pegan, P., Higueras, H., and Manzana, M.: Application of ground penetrating radar (GPR) to delineate clay layers in wetlands. A case study in the Soto Grande and Soto Chico watercourses, Donana (SW Soain), J. Appl. Geophys., 72, 107–113, 2010.
Green, A. G.: Applications of 3-D georadar methods to diverse environmental and engineering problems, Progress in Environmental and Engineering Geophysics, edited by: Chao, C. and Jianghai, X., Science Press USA, 220–226, 2004.
Guo, L., Chen, J., Cui, X., Fan, B., and Lin, H.: Application of graound penetrating radar for coarse root detection and quantification: a review, Plant Soil, 362, 1–23, 2013.
Guo, L., Mount, G. J, Hudson, S., Lin, H., and Levia, D.: Pairing geohpysical techniques helps understanding of the near-surfce Critical Zone: Visualization of preferential rouging of stemflow along coarse roots, Geoderma, 357, 113953, https://doi.org/10.1016/j.geoderma.2019.113953, 2020.
Harari, Z.: Ground-penetrating radar (GPR) for imaging stratigraphic features and groundwater in sand dunes, J. Appl. Geophys., 36, 43–52, 1996.
Havholm, K. G., Bergstrom, N. D., Jol, H. M., and Running, G. L.: GPR survey of a Holocene aeolian/fluvial/lacustrine succession, Lauder Sandhills, Manitoba, Canada, Geol. Soc. Lond. Spec. Publ., 211, 47–54, 2003.
Heimsath, A. M., Dietrich, W. E., Nishiizumi, K., and Finkel, R. C.: The soil productionfunction and landscape equilibtium, Nature, 388, 358–361, 1997.
Heimsath, A. M., Dietrich, W. E., Nishiizumi, K., and Finkel, R. C.: Cosmogenic nuclides, topography, and the spatial variation of soil depth, Geomorphology, 27, 151–172, 1999.
Hilgard, E. W.: Soils: Their Formation, Properties, Compositions and Relations to Climate and Plant Growth in the Humid and Arid Regions, The Macmillan Company, New York, 593 pp., 1914.
Holbrook, W. S., Riebe, C. S., Elwaseif, M., Hayes, J. L., Vasler-Reeder, K., Harry, D. L., Malazian, A., Dosseto, A., Hartsough, P. C., and Hopmans, W.: Geophysical constraints on deep weathering and water storage potential in the Southern Sierra Critical Zone Observatory, Earth Surf. Process. Land., 39, 366–380, 2014.
Hruska, J., Cermak, J., and Sustek, S.: Mapping tree root system with ground-penetrating radar, Tree Physiol., 19, 125–130, 1999.
Huisman, J. A., Hubbard, S. S., and Annan, P. A.: Measuring soil water content with ground penetrating radar: A review, Vadose Zone J., 2, 476–491, https://doi.org/10.2136/vzj2003.4760, 2003.
IUSS Working Group WRB: World reference base for soil resources 2014, edited by: Schad, P., van Huyssteen, C., and Micheli, E., World Soil Resources Reports No. 106, FAO, Rome, 192 pp., 2015.
Jenny, H.: Factors of Soil Formation: A System of Quantitative Pedology, Dover Publications, New York, 281 pp., 1994.
Jol, H. M. (Ed.): Ground penetrating radar: theory and applications, Elsevier Science, Amsterdam, the Netherlands, Oxford, United Kingdom, 544 pp., 2009.
Kassambara, A.: Practical guide to cluster analysis in R: unsupervised machine learning, STHDA, 38 pp., 2017.
Klotzsche, A., Jonard, F., Looms, M. C., van der Kruk, J., and Huisman, J. A.: Measuring soil water content with ground penetrating radar: A decade of progress, Vadose Zone J., 17, 1–9, 2018.
Lambot, S., Antoine, M., Vanclooster, M., and Slob E. C.: Effect of soil roughness on the inversion of off-graound monostatic GPR signal for noninvasive quantification of soil properties, Water Resour. Res., 42, W03403, https://doi.org/10.1029/2005WR00441, 2006.
Langbein, W. B. and Schumm, S. A.: Yield of sediment in relation to mean annual precipitation, Trans. Am. Geophys. Union, 39, 1076–1084, 1958.
Liu, J. L. and Marfurt, K. J.: Instantaneous Spectral Attributes to Detect Channels, Geophysics, 72, 23–31, https://doi.org/10.1190/1.2428268, 2007.
Mellett, J. S.: Ground penetrating radar applications in engeneering, environmental management, and geology, J. Appl. Geophys., 33, 157–166, 1995.
Miller, T. W., Hendrickx, J. M. H., and Borchers, B.: Radar detection of burried landmines field soils, Vadose Zone J., 3, 1116–1127, 2002.
Mutz, S. G., Ehlers, T. A., Werner, M., Lohmann, G., Stepanek, C., and Li, J.: Estimates of late Cenozoic climate change relevant to Earth surface processes in tectonically active orogens, Earth Surf. Dynam., 6, 271–301, https://doi.org/10.5194/esurf-6-271-2018, 2018.
Nesbitt, H. W. and Young, G. M.: Early Proterozoic climates and plate motions inferrred form major element chemistry of lutites, Nature, 299, 215–217, 1982.
Oeser, R. A., Stroncik, N., Moskwa, L.-M., Bernhard, N., Schaller, M., Canessa, R., van der Brink, L., Köster, M., Brucker, E., Stock, S. S., Fuentes, J. P., Godoy, R., Matus, F. J., Oses Pedraza, R., Osses McIntyre, P., Paulino, L., Seguel, O., Bader, M. Y., Boy, J., Dippold, M. A., Ehlers, T. A., Kühn, P., Kuzyakiv, Y., Peinweber, P., Scholten, T., Spielvogel, S., Spohn, M., Üubernickel, K., Tielbörger, K., Wagner, D., and von Blanckenburg, F.: Chemistry and microbiology of the Critical Zone along a steep climate and vegetation gradient in the Chilean Coastal Cordillera, Catena, 170, 183–203, https://doi.org/10.5880/GFZ.3.3.2018.001, 2018.
Orlando, J., Comas, Z., Hynek, S., Buss, H. L., and Brantley, S. L.: Architecture of the deep critical zone in the Rio Icacos watershed (Luquillo Critical Zone Observatory, Puerto Rico) inferred from drilling and ground penetrating radar (GPR), Earth Surf. Process. Land., 41, 1823–1840, 2016.
Parsekian, A. D., Singha, K., Minsley, B. J., Holbrook, W. S., and Slater, L.: Multiscale geophysical imaging of the critical zone, Rev. Geophys., 53, 1–26, 2015.
Porder, S., Vitousek, M. P., Chadwick, O. A., Chamberlain, C. P., and Hilley, G. E.: Uplift, Erosion, and Phosphorous Limitation in Terrestrial Ecosystems, Ecosystems, 10, 158–170, 2007.
Rabassa, J. and Clapperton, C. M.: Quaternary glaciations of the southern Andes, Quaternary Sci. Rev., 9, 153–174, 1990.
Roering, J. J., Kirchner, J. W., and Dietrich, W. E.: Hillslope evolution by nonlinear, slope-dependent transport: Steady state morphology and equilibrium adjustment timescales, J. Geophys. Res., 106, 16499–16513, 2001.
Roering, J. J., Marshall, J., Booth, A. M., Mort, M., and Jin, Q.: Evidence for biotic controls on topography and soil production, Earth Plant. Sc. Lett., 289, 183–190, 2010.
Saarenketo, T.: Electrical properties of water in clay and silty soils, J. Appl. Geophys., 40, 73–88, 1998.
Sarkar, R., Paul, K. B., and Higgins, T. R.: Impacts of soil physiochemical properties and temporal-seasonal soil-environmental status on ground-penetrating radar response, Soil Sci. Soc. Am. J., 83, 542–554, 2019.
Scarpone, C., Schmidt, M. G., Bulmer, C. E., and Knudby, A.: Modelling soil thickness in the critical zone for Southern British Columbia, Geoderma, 282, 59–69, 2016.
Schaller, M., Ehlers, T., Lang, K., Schmid, M., and Fuentes-Espoz, J.: Addressing the contribution of climate and vegetation cover on hillslope denudation, Chilean Coastal Cordillera (26∘–38∘ S), Earth Planet. Sc. Lett., 489, 111–122, 2018.
Schmid, M., Ehlers, T. A., Werner, C., Hickler, T., and Fuentes-Espoz, J.-P.: Effect of changing vegetation and precipitation on denudation – Part 2: Predicted landscape response to transient climate and vegetation cover over millennial to million-year timescales, Earth Surf. Dynam., 6, 859–881, https://doi.org/10.5194/esurf-6-859-2018, 2018.
Scott, K. and Pain, C.: Regolith science, Csiro Publishing, Springer Netherlands, 461 pp., 2009.
Sedgwick, P.: Pearson's correlation coefficient, BMJ, 345, e4483, https://doi.org/10.1136/bmj.e4483, 2012.
Starke, J., Ehlers, T. A., and Schaller, M.: Latitudinal effect of vegetation on erosion rates identified along western South America, Science, 367, 1358–1361, 2020.
Steelman, C. M., Endres, A. L., and Jones, J. P.: High-resolution ground-penetrating radar monitoring of soil moisture dynamics: Field results, interpretation, and comparison with unsaturated flow model, Water Resour. Res., 48, W09538, https://doi.org/10.1029/2011WR011414, 2012.
Sucre, E. B., Tuttle, J. W., and Fox, T. R.: The use of ground-penetrating radar to accurately estimate soil depth in rocky forest soils, Forest Sci., 57, 59–66, 2011.
Telford, W. M., Geldart, L. P., Sheriff, R. E., and Keys, D. A. (Eds.): Applied Geophysics, 2th Edn., Cambridge University Press, Cambridge, 770 pp., https://doi.org/10.1017/CBO9781139167932, 1990.
Tosti, F., Patriarca, C., Slob, E., Benedetto, A., and Lambot, S.: Clay content evaluation in soils through GPR signal processing, J. Appl. Geohpys., 97, 69–80, 2013.
Utsi, E. C.: Ground penetrating radar: theory and practice, Butterworth-Heinemann, Amsterdam, 224 pp., 2017.
van Dam, R. L. and Schlager, W.: Identifying causes of ground-penetrating radar reflections using time-domain reflectometry and sedimentological analyses, Sedimentology, 47, 435–449, https://doi.org/10.1046/j.1365-3091.2000.00304.x 2000.
van Dam, R. L., Nichol, S. L., Augustinus, P. C., Parnell, K. E., Hosking, P. L., and McLean, R. F.: GPR stratigraphy of a large active dune on Paren-garenga Sandspit, New Zealand, The Leading Edge, 22, 865–881, 2003.
Wang, P., Hu, Z., Zhao, Y., and Li, X.: Experimental study of soil compaction effects on GPR signals, J. Appl. Geohpys., 126, 128–137, 2016.
Wei, T.: Package “corrplot” – Visualization of a correlation matrix, v0.60, available at: https://cran.rproject.org (last access: 11 December 2020), 2012.
Werner, C., Schmid, M., Ehelrs, T. A., Fuentes-Espoz, J. P., Steinkamp, J., Forrest, M., Liakka, J., Maldonado, A., and Hickler, T.: Effect of changing vegetation and precipitation on denudation – Part 1; Predicted vegetation composition and cover over the last 21 thousand years along the Coastal Cordillera of Chile, Earth Surf. Dynam., 6, 829–858, https://doi.org/10.5194/esurf-6-829-2018, 2018.
Wold, S., Esbensen, K., and Geladi, P.: Principal component analysis, Chemometrics and Intelligent Laboratory Systems, 2, 37–52, https://doi.org/10.1016/0169-7439(87)80084-9, 1987.
Yoder, R. E., Freeland, R. S., Ammons, J. T., and Leonard, L. L.: Mapping agricultural fields with GPR and EMI to identify offsite movement of agrochemicals, J. Appl. Geophys., 47, 251–259, 2001.
Zhang, J., Lin, H., and Doolittle, J.: Soil layering and preferential flow impacts on seasonal changes of GPR signals in two contrasting soils, Geoderman, 213, 560–569, 2014.
Zhang, X., Dao, L., Zhang, C., Morrison, L., Hong, B., Zhang H., and Gan, Y.: Mapping the spatial distribution of soil depth in a grassland ecosystem with the aid of ground penetrating radar and GIS (Northwestern Sichuan, China), Grassl. Sci., 64, 217–225, 2018.