the Creative Commons Attribution 4.0 License.
the Creative Commons Attribution 4.0 License.
 | 09 Oct 2020
Development of a soil biological quality index for soils of semi-arid tropics
Selvaraj Aravindh
Chinnappan Chinnadurai
Agricultural intensification, an inevitable process to feed the ever-increasing population, affects soil quality due to management-induced changes. To measure the soil quality in terms of soil functioning, several attempts were made to develop a soil quality index (SQI) based on a set of soil attributes. However, there is no universal consensus protocol available for SQI, and the role of soil biological indicators in SQI is meagre. Therefore, the present work aims to develop a unitless soil biological quality index (SBQI) scaled between 0 and 10, which would be a major component of SQI in the future. The long-term organic manure amended (OM), integrated nutrient management enforced (INM), synthetic fertilizer applied (IC), and unfertilized control (control) soils from three different predominant soil types of the location (Tamil Nadu state, India) were chosen for this. The soil organic carbon, microbial biomass carbon, labile carbon, protein index, dehydrogenase activity, and substrate-induced respiration were used to estimate the SBQI. Five different SBQI methods, viz. simple additive (SBQI1 and SBQI2), scoring function (SBQI3), principal component analysis-based statistical modelling (SBQI4), and quadrant-plot-based method (SBQI5), were developed to estimate the biological quality as a unitless scale. All five methods have the same resolution to discriminate the soils and INM ≈ OM > IC > control is the relative trend being followed in all the soil types based on the SBQIs. All five methods were further validated for their efficiency in 25 farmers' soils of the location and proved that these methods can scale the biological health of the soil. Among the five SBQIs, we recommend SBQI5, which relates the variables to each other to scale the biological health of the soil.
- Article
(1720 KB) - Full-text XML
-
Supplement
(160 KB) - BibTeX
- EndNote


Soil quality, according to Doran and Parkin (1994), is the capacity of a soil to function, within the ecosystem and land-use boundaries, to sustain productivity, maintain environmental quality, and promote plant and animal health. Soil quality uses several physical, chemical, and biological attributes of soil either individually or in combinations to determine whether the soil function under different management and agricultural practices is improving, stable, or degrading (Andrews et al., 2002; Bünemann et al., 2018). As the soil functions of interest and the environmental factors differ among the soil systems, no universal method is available to measure the quality using a common set of indicators (Bouma, 2002; Rinot et al., 2019). Selected soil attributes that are used to assess the soil quality are referred to as “soil quality indicators”. Their measures in the soil as influenced by nutrient management, tillage, cropping system, and all ecosystem disturbance activities were used to assess the soil quality and its sustainability (Andrews et al., 2004; Karlen et al., 2006; Masto et al., 2008; Bai et al., 2018). Alternatively, soil properties such as soil organic carbon and its fractions, soil aggregates and their stability, and several microbial attributes that are sensitive to management practices were also used to monitor the quality (Bastida et al., 2016; Duval et al., 2020; Giannitsopoulos et al., 2019; Khan et al., 2020; Li et al., 2020; Liu et al., 2019; Yang et al., 2019). Apart from these, several biochemical properties, including respiration, nitrification, and enzyme activity, were also reported as good sensitivity indicators for the soil quality (Bastida et al., 2015, 2019; Bhowmik et al., 2019; Jian et al., 2020; Mundepi et al., 2019; VeVerka et al., 2019). However, the choice of soil indicators and their contribution to soil quality vary according to several factors, including climate and intended land-use patterns (Karlen et al., 2006; Stewart et al., 2018). Soil quality was used as a tool to test the effects of soil management practices and tillage systems (Armenise et al., 2013; Jernigan et al., 2020; Williams et al., 2020), land-use type (Masto et al., 2008; Rahmanipour et al., 2014), cover crop (Bastida et al., 2006; Fu et al., 2004; Navas et al., 2011; Jian et al., 2020), and native ecosystems and grassland degradation (Alves de Castro Lopes et al., 2013; Li et al., 2013; Pérez-Jaramillo et al., 2019) on soil function.
The term “soil quality index” (SQI) is defined as “the minimum set of parameters that, when interrelated, provides numerical data on the capacity of soil to carry out one or more functions” (Acton and Padbury, 1993). SQI is the function of more than a few soil quality indicators, which is defined as a “measurable property that influences the capacity of a soil to carry out a given function” (Acton and Padbury, 1993). The soil quality index assessment studies showed that SQI is complex because of diversity of soil quality indicators (representing physical, chemical, and biological attributes of the soil) and unease in integrating them all to establish a single measurable scale (Garcia et al., 1994; Halvorson et al., 1996; Papendick and Parr, 1992). Several attempts were made to aggregate the information got for each soil quality indicator into an SQI. The simple addition of soil quality indicators (Velásquez et al., 2007; Mukherjee and Lal, 2014) or scoring function of soil quality indicators (Moebius-Clune et al., 2016) are the two common approaches used to scale the soil quality index between 0 and 1 or between 0 and 10. The selection of soil quality indicators should be deliberate to the soil functions of interest (Nortcliff, 2002); threshold values of such identified indicators should be based on the local conditions and indicator selection should be based on expert opinion or statistical procedures or a combination of both to get a minimum dataset. However, the soil quality index should link the scientific knowledge and agricultural and land management practices to assess sustainability (Romig et al., 1995). Most of the SQIs place more importance on the physical (soil aggregation, water retention) and chemical indicators (carbon dynamics and nutrient-carrying capacity), with less importance given to biological attributes (microbial biomass carbon, arthropods) (Biswas et al., 2017; Calero et al., 2018; Menta et al., 2018; Pulido et al., 2017; Schmidt et al., 2018). To emphasize the biological and biochemical attributes in soil quality, the biological quality of soil (BSQ) was first proposed by Parisi (2001), which was used to measure the bioindicators of soil, especially the arthropods of soil. This approach was successfully validated with other physical and chemical indicators by several researchers (Blasi et al., 2013; Menta et al., 2014, 2018; Rüdisser et al., 2015; Visioli et al., 2013). Pascazio et al. (2018) used microbial biomass, β glucosidase, mineralizable nitrogen, and urease to represent the biological indicators to measure the SQI. Similarly, Vincent et al. (2018) used bacterial and fungal density and richness with mycorrhizal colonization as bioindicators for SQI. From these works, it is evident that there is no consensus on representing the biological component of the SQI. In the present work, we developed a unitless soil biological quality index (SBQI) using six important biological attributes of soil. This index may be a part of an SQI in the future to assess the soil quality for sustaining agricultural productivity.
2.1 Experimental sites and soil sampling
Table 1Study area and soil characteristics.

* The nutrient management adopted in each site is described in Materials and methods.
Long-term permanent manure trials being maintained by Tamil Nadu Agricultural University, India, at three different locations of Tamil Nadu state, India, viz. the (i) Department of Soil Science and Agricultural Chemistry, Coimbatore, (ii) Agricultural College and Research Institute, Madurai, and (iii) Agricultural Research Station, Kovilpatti (designated as Coimbatore, Madurai, and Kovilpatti, respectively), were selected for this investigation. The details of the study area, trial details, and their basic soil characteristics were given in Table 1. In all these experimental plots, organic (farmyard manure, green manure) and inorganic (nitrogenous, phosphate, and potash fertilizers) nutrient management was assessed for crop response over a period of time. All the experimental plots were single non-replicated plots with 5 m × 4 m size. Though difference exists in the set of treatments being adopted among the three long-term trials, we chose four long-term nutrient management-adopted soils existing in all three trials for our investigation, i.e. control soil (control); inorganic fertilizer applied soil (IC); organic amendment applied soil (OM); and integrated nutrient management (both organic and inorganic) adopted soil (INM). The details of each treatment are as follows: control represents the plot in which the crop (Coimbatore – maize followed by sunflower; Madurai – rice; Kovilpatti – cotton followed by bajra) was raised without any nutrient amendments. The soils with naturally added crop residues were incorporated during tillage. In IC, nitrogen (N), phosphorus (P), and potassium (K) were applied in the form of urea, superphosphate, and murate of potash at the recommended dosage varying among the crops (maize – 135 : 62.5 : 50 kg NPK ha−1; sunflower – 40 : 20 : 20 kg NPK ha−1; rice – 120 : 60 : 60 kg NPK ha−1; cotton and bajra – 40 : 20 : 0 kg NPK ha−1). A half dose of N and a full dose of P and K fertilizers were applied as basal, while the remaining half of N was top-dressed during crop growth. An OM plot was applied with farmyard manure alone as a nutrient amendment (12.5 t ha−1 of farmyard manure, FYM, irrespective of the crop). The well-decomposed manure was incorporated into the soil during the last ploughing before sowing of every crop. INM refers to the plot with 100 % NPK as chemical fertilizers along with FYM (12.5 t ha−1) (similar to IC and OM, respectively). All the plots were ploughed using a country plough, added with different nutrient amendments, and levelled manually. The respective crops were raised as per the standard practice (Coimbatore – irrigated, maize/sunflower; Madurai – wetland, rice; Kovilpatti – rainfed, cotton/bajra).
Samples were collected from the upper 15 cm of the surface soil of each plot during the fallow period, when the crop was not raised (January 2018). In each plot, 10 sub-sample soil cores were collected randomly and pooled together in a composite sample, giving three biological replicates. Likewise, sampling was repeated three times, giving a total of nine replicates from four plots in each location. The debris, plant residues, and stones were removed during sampling to avoid any influence on the soil parameters analysed. The soil samples were packed in plastic bags, transported to the laboratory using an ice cooler box, and stored at 4 ∘C. The gravimetric moisture content of the soil was measured immediately.
2.2 Soil biological properties
Soil organic carbon (SOC) was analysed by the wet chromic acid digestion method (Walkley and Black, 1934) and expressed as mg g−1 of soil. The microbial biomass carbon (MBC) was measured by the fumigation–incubation technique (Jenkinson and Powlson, 1976) and expressed as µg g−1 of soil. Soil labile carbon (SLC) was measured by the permanganate method (Blair and Crocker, 2000) and expressed as µg g−1 of soil. Soil protein was extracted from soil using a protocol as described by Hurisso et al. (2018) and expressed as µg g−1 of soil. The dehydrogenase (DHA) was measured by the procedure described by Casida Jr et al. (1964) and expressed as µg of triphenyl formazan released per g soil d−1. The substrate-induced respiration (SIR) measured the rate of respiration in the soil after glucose was amended in it and expressed as µg of CO2- (Enwall et al., 2007).
2.3 Data analysis
The relation between soil variables influenced by long-term nutrient management adoptions was evaluated by Pearson correlation analysis (Pearson, 1895) and simple linear regression (Freedman, 2009) using SPSS (SPSS Statistics for Windows, Version 20.0. Armonk, NY: IBM Corp). The scoring function for each assessed variable of soil was developed by SPSS 20.0. For this, the data were transformed into rank scores (rank case function of SPSS) and scoring percentile was calculated using the following formula:
To assess the relativeness of assessed soil variables and their cumulative contribution to the variability among the treatments, principal component analysis (PCA) (Wold et al., 1987) was performed on the data using XLSTAT (Version 2010.5.05, Addinsoft, USA).
Table 2Soil biological quality indicators, their threshold values, and corresponding score values used for SBQI1.
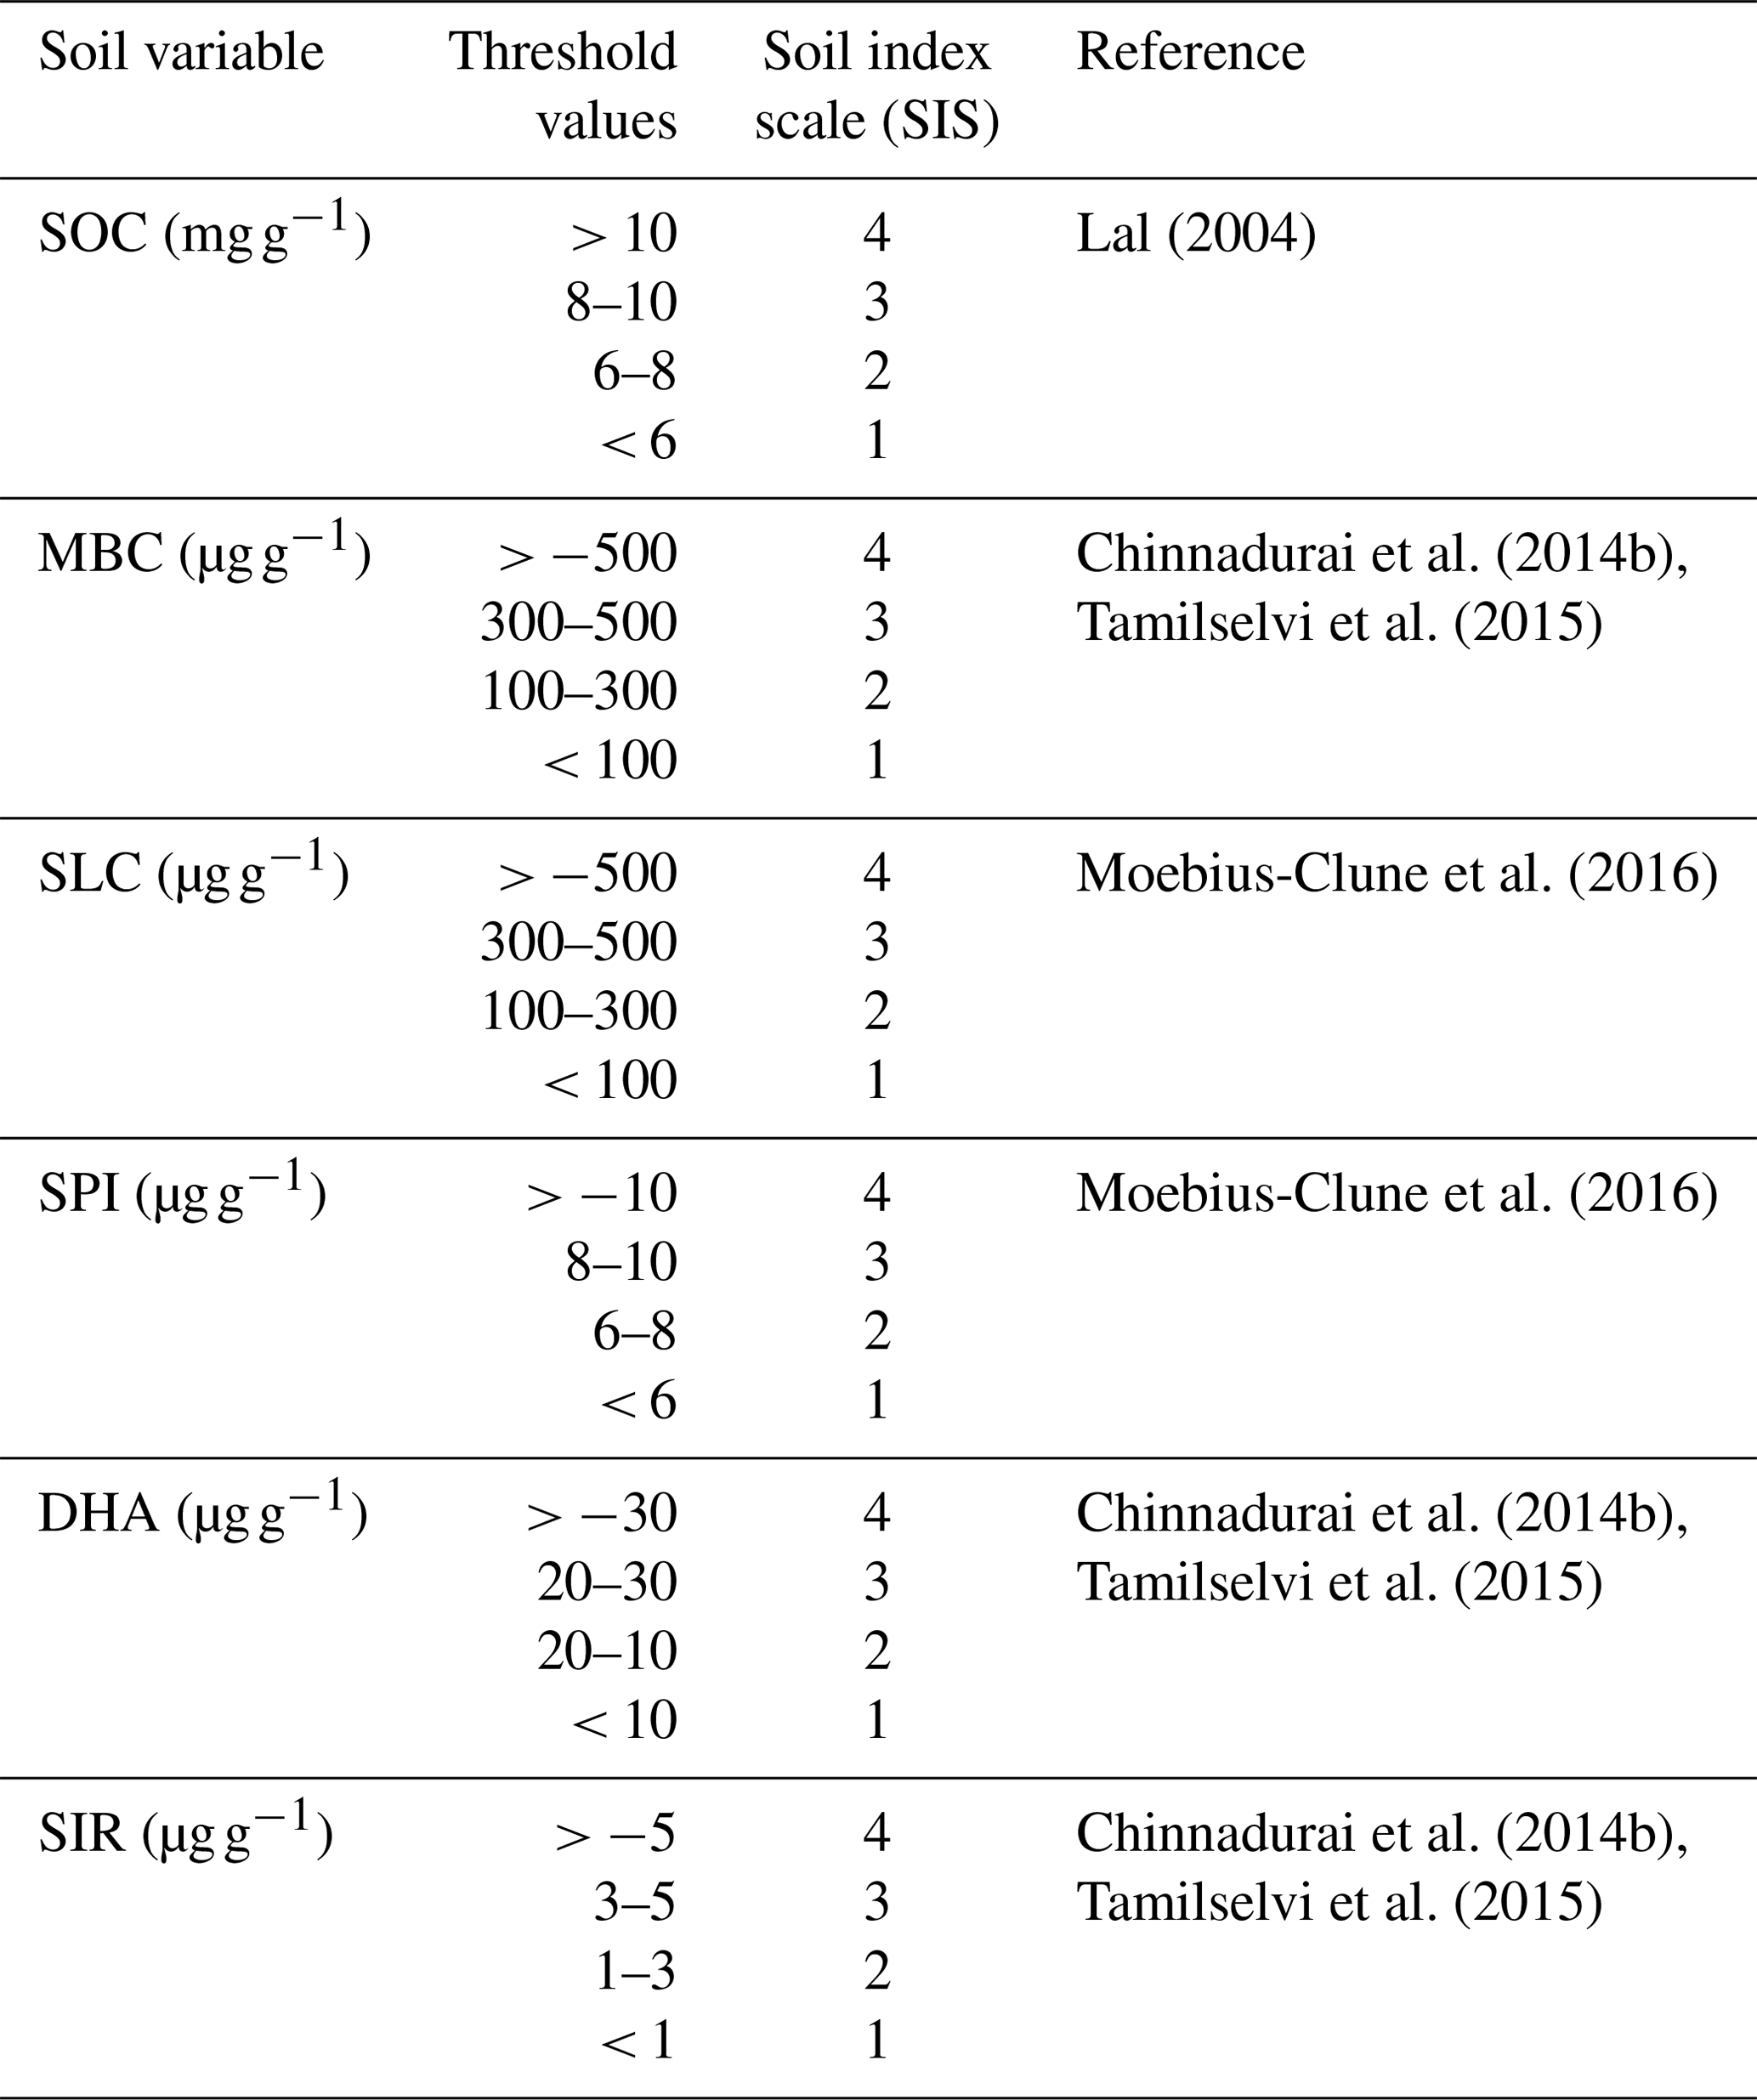
SOC – soil organic carbon; MBC – microbial biomass carbon; SLC – soil labile
carbon; SPI – soil protein index; DHA – dehydrogenase; SIR – substrate-induced
respiration. Threshold values are scaled as a soil index scale ranging from 1 to 4 based
on the literature.
2.4 Estimating soil biological quality index (SBQI)
2.4.1 Simple additive methods (SBQI1 and SBQI2)
In the simple additive method, the assessed soil parameters were given threshold values based on the available literature and previous experiences. The threshold values of each parameter were further scored as soil index scores (SIS) (Table 2). From these score values, the SBQI, a unitless scoring value scaled to 1–10, was calculated using the formula as follows (Amacher et al., 2007):
where SIS represents the score value of individual attributes; S represents the sum of maximum SIS (=24).
In SBQI2, the index computed was normalized using the maximum and minimum values of the dataset (Amacher et al., 2007). The formula for this method is as follows:
where ΣSIS refers to the sum of all soil index scores and SISmin and SISmax are minimum and maximum values of SIS of the dataset. S represents the sum of maximum SIS (=24).
2.4.2 Weighed additive method (SBQI3)
Table 3Pair of variables used for the quadrant plot and their mean and regression coefficient (R2).

SOC – soil organic carbon; MBC – microbial biomass carbon; SLC – soil labile carbon; SPI – soil protein index; DHA – dehydrogenase; SIR – substrate-induced respiration.
For this, the data were transformed into rank scores (rank case function of SPSS) and the scoring percentile was calculated in SPSS. The scoring percentiles were summed and scaled to 10 (Moebius-Clune et al., 2016). Further, the index values were normalized using the minimum and maximum SBQI values of the dataset. The formula for the SBQI3 calculation is as follows:
ΣSBQI represents the sum of SBQI derived from percentile scores, whereas MP represents the sum of the maximum percentile score (=600).
where ΣSBQI refers to the sum values from the above formula and SBQImin and SBQImax are minimum and maximum values of SBQI of the dataset.
2.4.3 PCA-based SBQI (SBQI4)
The principal component analysis of all six biological parameters of four soil samples of three locations was performed as described elsewhere. From the outcome of PCA, the SBQI was calculated (Andrews et al., 2002; Mandal et al., 2011; Masto et al., 2008). This SBQI used the percent contribution of individual variability to calculate the overall soil biological quality of the soil. The formulae adopted to calculate SBQI-4 are as follows.
2.4.4 Quadrant-plot-based SBQI (SBQI5)
As any soil variable is not independently acting and depends on several other variables or is under the influence of other variables, the relativeness of two closely associated variables (examples SOC and MBC) is used to measure the soil biological quality. This method is adopted for the variables that are well correlated with each other. Six significantly correlated (P<0.001) variable pairs and their R2 values and means were used for the scoring (Table 3). The paired variables were plotted in a scatter plot using variable-1 (major contributor) on the x axis and variable-2 (secondary contributor) on the y axis. The scatter plot was converted into four quadrants by scaling the mean values of the corresponding variables on their axes. The right-handed upper quadrants representing “high” for both variables are scaled to 4 as both the variables above the means. The right-handed lower quadrant representing “high for variable-a and low for variable-b” is scaled to 3. Likewise, the left-handed upper quadrant is scored for 2, and the left-handed lower quadrant, which represents “low” for both the variables, had a value of 1. Since the major contributor is always on the x axis, high for variable-a and low for variable-b had a score value of 3 and its opposite had 2. All six pairs (SOC–MBC, SOC–SLC, SOC–SIR, MBC–SPI, MBC–DHA, MBC–SIR) were scored using this method and SBQI was calculated as follows:
2.4.5 Validation of SBQIs in farmers' fields
To validate the SBQI methods developed from long-term manure experiment plots and also to check the consistency in SBQI calculations and to assess the relatedness among the SBQIs, the soil samples collected randomly from the farmers' field were assessed using the soil biological indicators as described in the previous chapter and the biological quality indices were calculated using the five methods as described earlier. The details of those soil samples were presented as Table 1 in the Supplement. All five SBQIs measured for long-term nutrient management adopted soils and farmers' soils were compared through Pearson correlation as described earlier to understand the effectiveness and relation of each other.

Figure 1Histogram and distribution curve (bell curve) of the observed soil biological variables from four different nutrient management plots of three different agroclimatic zones of Tamil Nadu, India. A – soil organic carbon; B – microbial biomass carbon; C – soil labile carbon; D – soil protein index; E – dehydrogenase activity; F – substrate-induced respiration.
Table 4Correlation coefficient (Pearson, n−1) of the observed variables from long-term nutrient management soils.
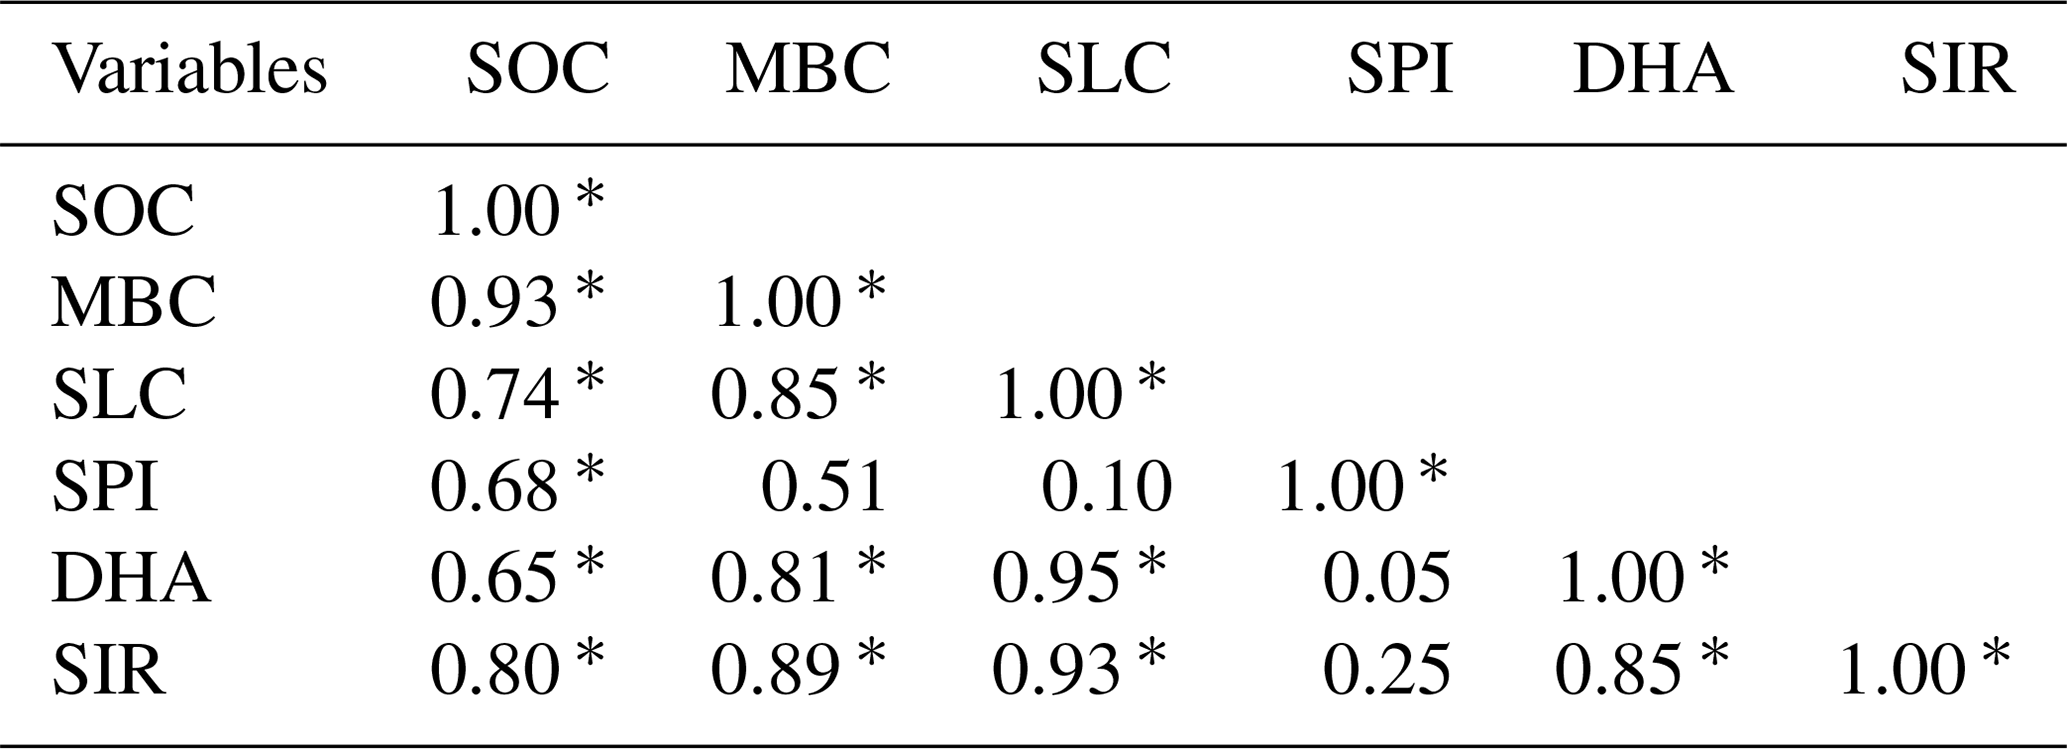
SOC – soil organic carbon; MBC – microbial biomass carbon; SLC – soil labile carbon; SPI – soil protein index; DHA – dehydrogenase; SIR – substrate-induced respiration.
* Correlation is significant at the 0.05 level.
Table 5Regression analysis of soil variables assessed for long-term nutrient management adopted soils.
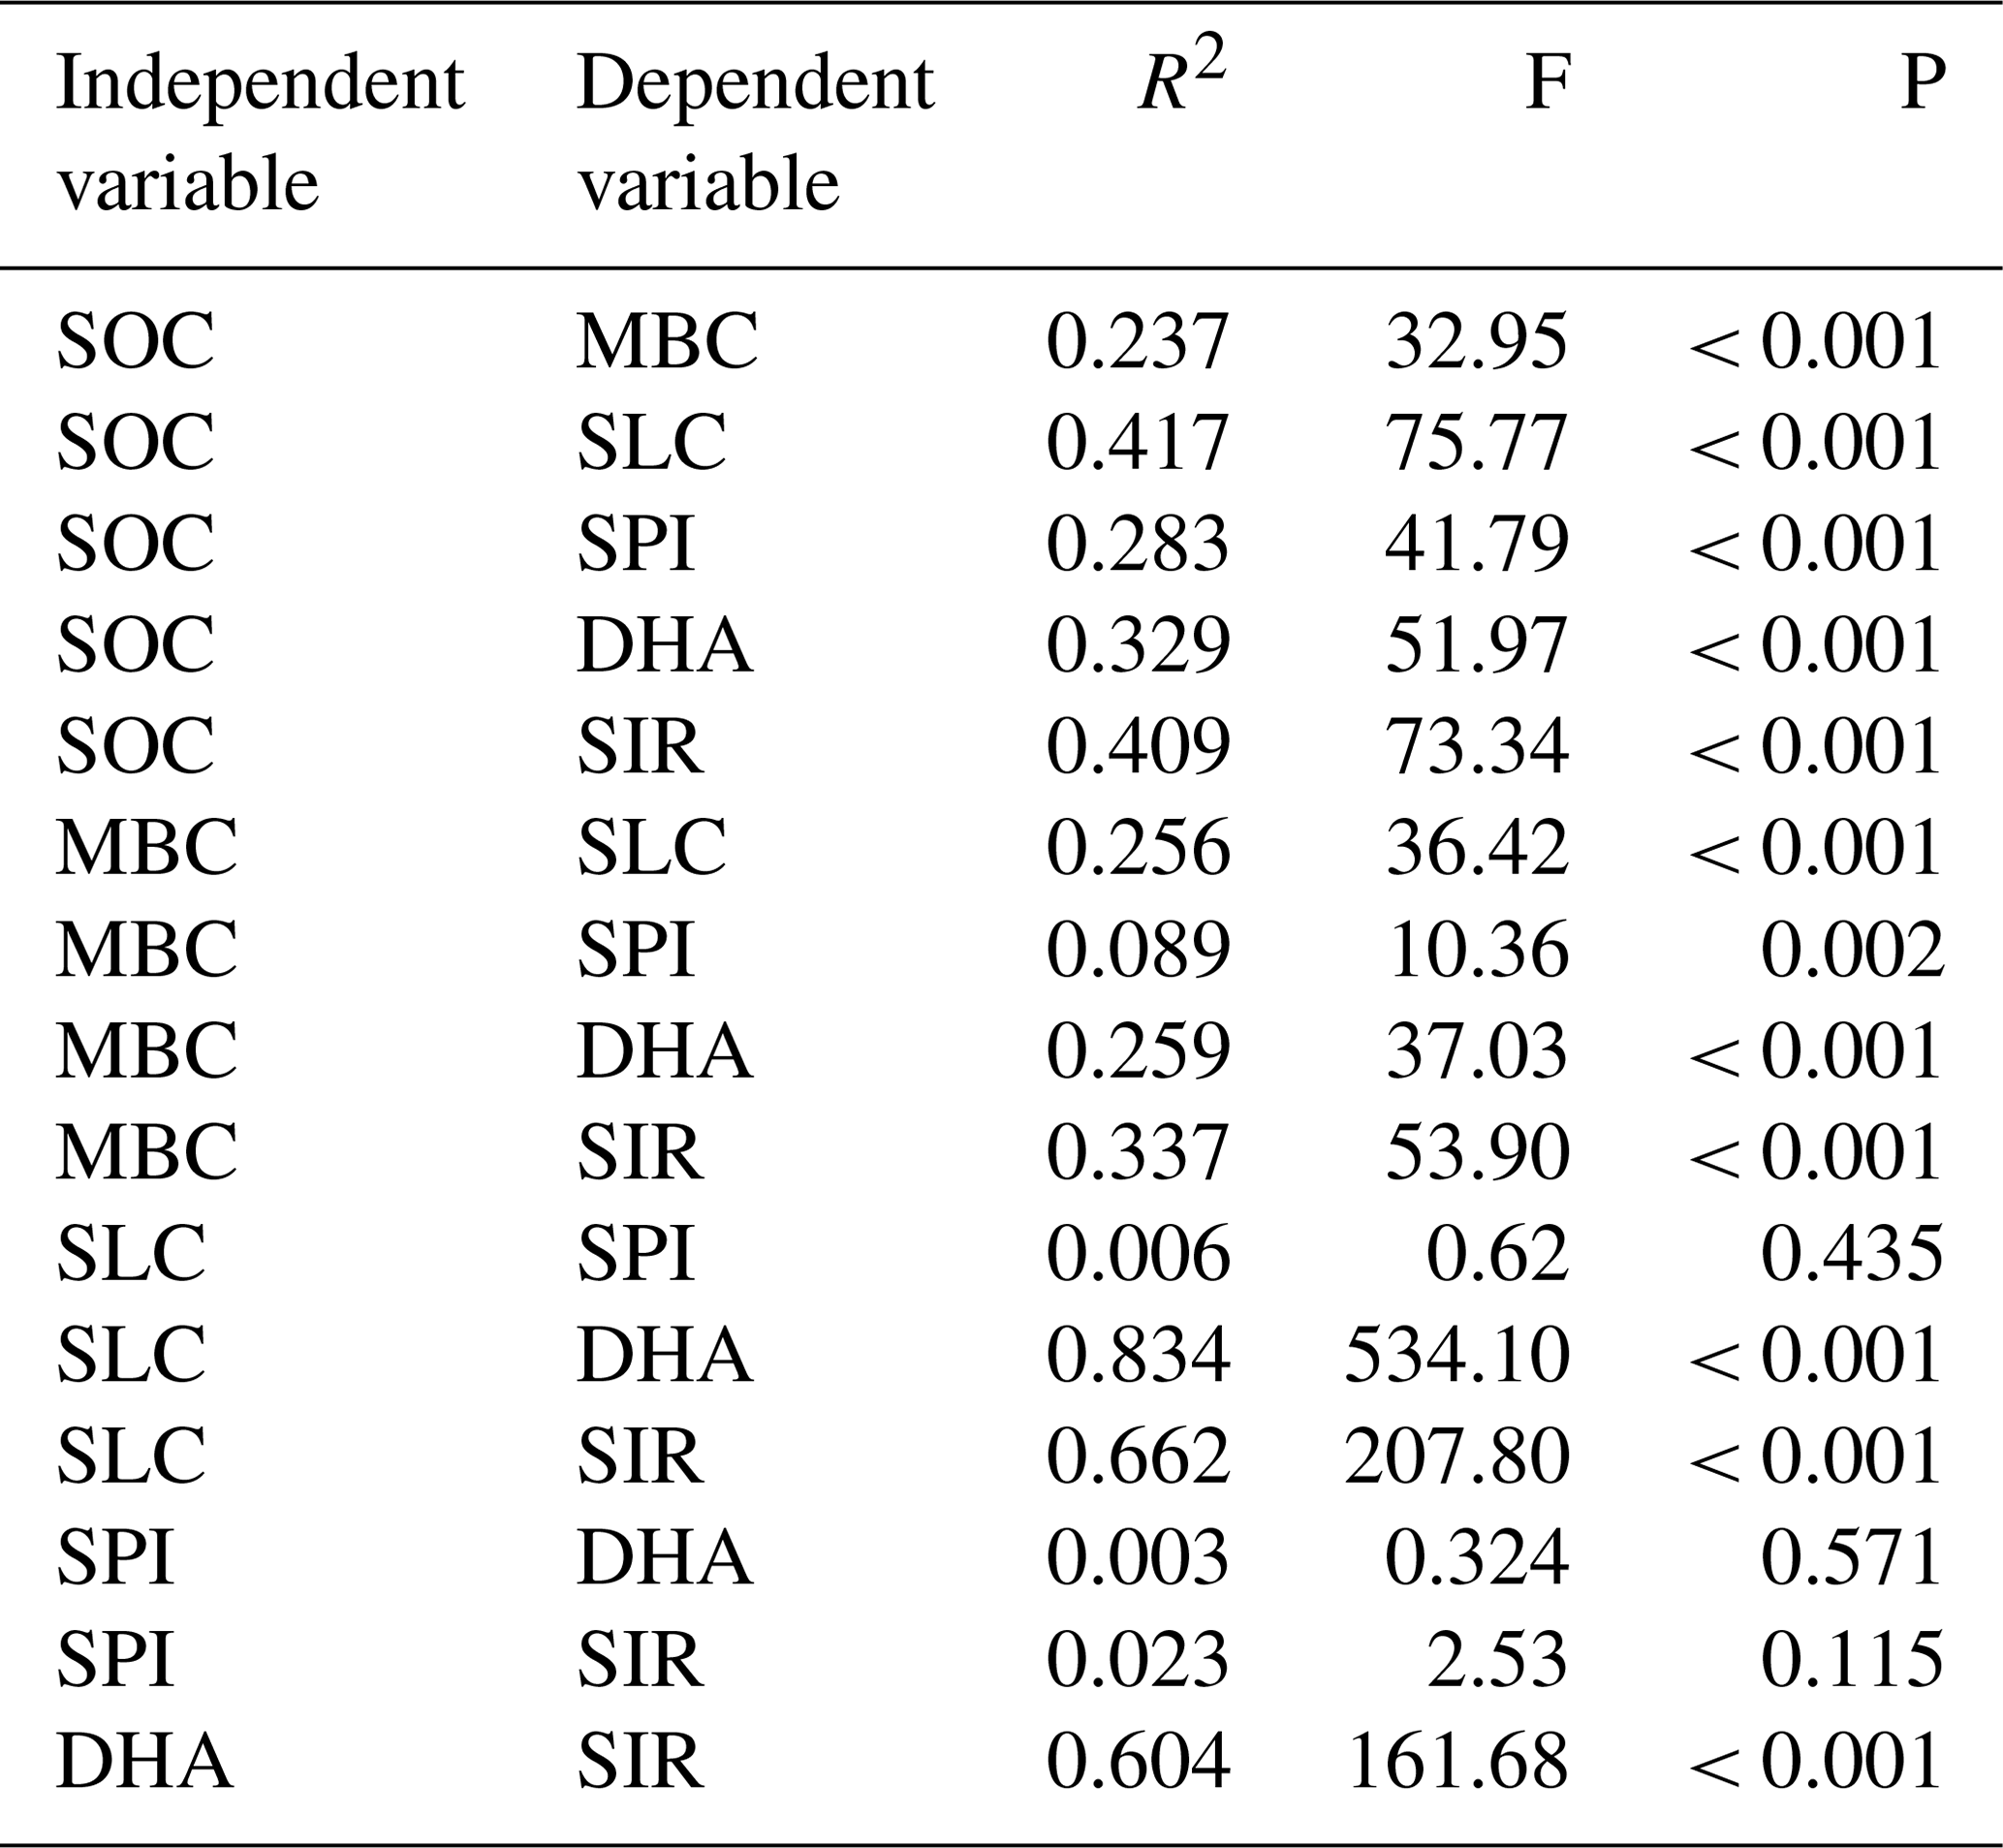
SOC – soil organic carbon; MBC – microbial biomass carbon; SLC – soil labile carbon; SPI – soil protein index; DHA – dehydrogenase; SIR – substrate-induced respiration. R2 – regression coefficient (linear); F – F test; P – p value.
3.1 Statistical scrutiny of soil biological attributes for developing SBQI
The histogram of measured values (x axis) of each variable and its frequency (y axis) with a distribution curve or bell curve showed that the data observed were normally distributed. The mean ± SD for the observed parameters, viz. 7.29 ± 2.46 (SOC), 382.51 ± 199.61 (MBC), 480.30 ± 234.17 (SLC), 5.46 ± 0.84 (SPI), 11.51 ± 9.54 (DHA), and 3.20 ± 0.56 (SIR), were well fitted in the curve (Fig. 1). Among the six variables, the histograms of SOC and SLC were left-skewed; DHA (Fig. 1e) was bimodal, while those others were normal.
In correlation analysis, SOC had a significant correlation with the other five biological variables, while MBC, SLC, DHA, and SIR had a significant correlation with other variables except for SPI (Table 4). Similarly, with SOC as an independent variable with others as the dependent variables, the linear regression coefficient (R2) showed significance (Table 5). All the dependent variables (MBC, SLC, SPI, DHA, SIR) showed significant R2 (P<0.001). However, SPI had the lowest R2 (0.237), while the SLC had the highest R2 (0.417). Likewise, SPI had the lowest but significant linear regression coefficient (0.089) with MBC, while others had high R2 values. SPI with other variables such as SLC, DHA, and SIR had insignificant R2.

Figure 2Cumulative normal distribution for scoring the observed soil biological variables in four different nutrient management plots of three different agroclimatic zones of Tamil Nadu, India. A – soil organic carbon; B – microbial biomass carbon; C – soil labile carbon; D – soil protein index; E – dehydrogenase activity; F – substrate-induced respiration. In the distribution curve, the mean + SD of measured values was intercepted and the scoring percentile for each variable was calculated and presented in the corresponding plot.
The scatter plot with the interpolation curve between the actual values (x axis) and the percentile scores (y axis) had a similar trend and relation for all the assessed biological attributes (Fig. 2). The mean + SD of the actual value had 79th to 81st percentiles (Fig. 2a–f). Hence, all six variables used in the present study fall under the “more is better” category, which implies that improving these variables will reflect the soil health.

Figure 3Principal component analysis biplot showing the relation between the soil biological variables in four different nutrient management plots of three different agroclimatic zones of Tamil Nadu, India. SOC – soil organic carbon; MBC – microbial biomass carbon; SLC – soil labile carbon; SPI – soil protein index; DHA – dehydrogenase activity; SIR – substrate-induced respiration. Control – unfertilized control soil; IC – inorganic chemical fertilized soil; OM – organically managed soil; INM – integrated nutrient management enforced soil; C – Coimbatore; M – Madurai; K – Kovilpatti. The % variance explained by each component (PC1 and PC2) is given in parentheses in axes.
The PCA biplot representing PC1 and PC2 of assessed variables and soil samples was presented in Fig. 3. PC1 had a variability of 75.21 % and PC2 added 20.48 % with a cumulative variability of 95.68 %, which were due to six biological variables. All the soil parameters significantly contributed to the cumulative variability of PCs. Among the soil samples, OM and INM samples of Coimbatore and Madurai recorded highest and were positively influenced due to the nutrient managements positioned in the right-hand top quadrant, while the control samples were negatively impacted by the observed variables positioned in the left-hand bottom quadrant. The control soil of Madurai, which is on par with IC, OM, and INM of Madurai and higher than Killikulam, is also positioned in the positive quadrant. All the variables except SPI significantly contributed to the PC1 (> 0.80 loading value), while SPI had a significant loading value to PC2. Regarding the contribution of individual soil variables to the total variability of the PC1 (75.21 %), MBC had 21.01 %, SIR 19.88 %, SLC 19.22 %, SIR 19.88 %, and SOC 18.64 % contributions. SPI had a 64.75 % contribution to the PC2 variability (20.48 %) (Table 2 in the Supplement).
3.2 SBQIs of long-term nutrient management-adopted soils
Table 6Soil biological quality index of long-term nutrient management adopted soils of three different centres assessed by five different methods (SBQI1 to SBQI5).
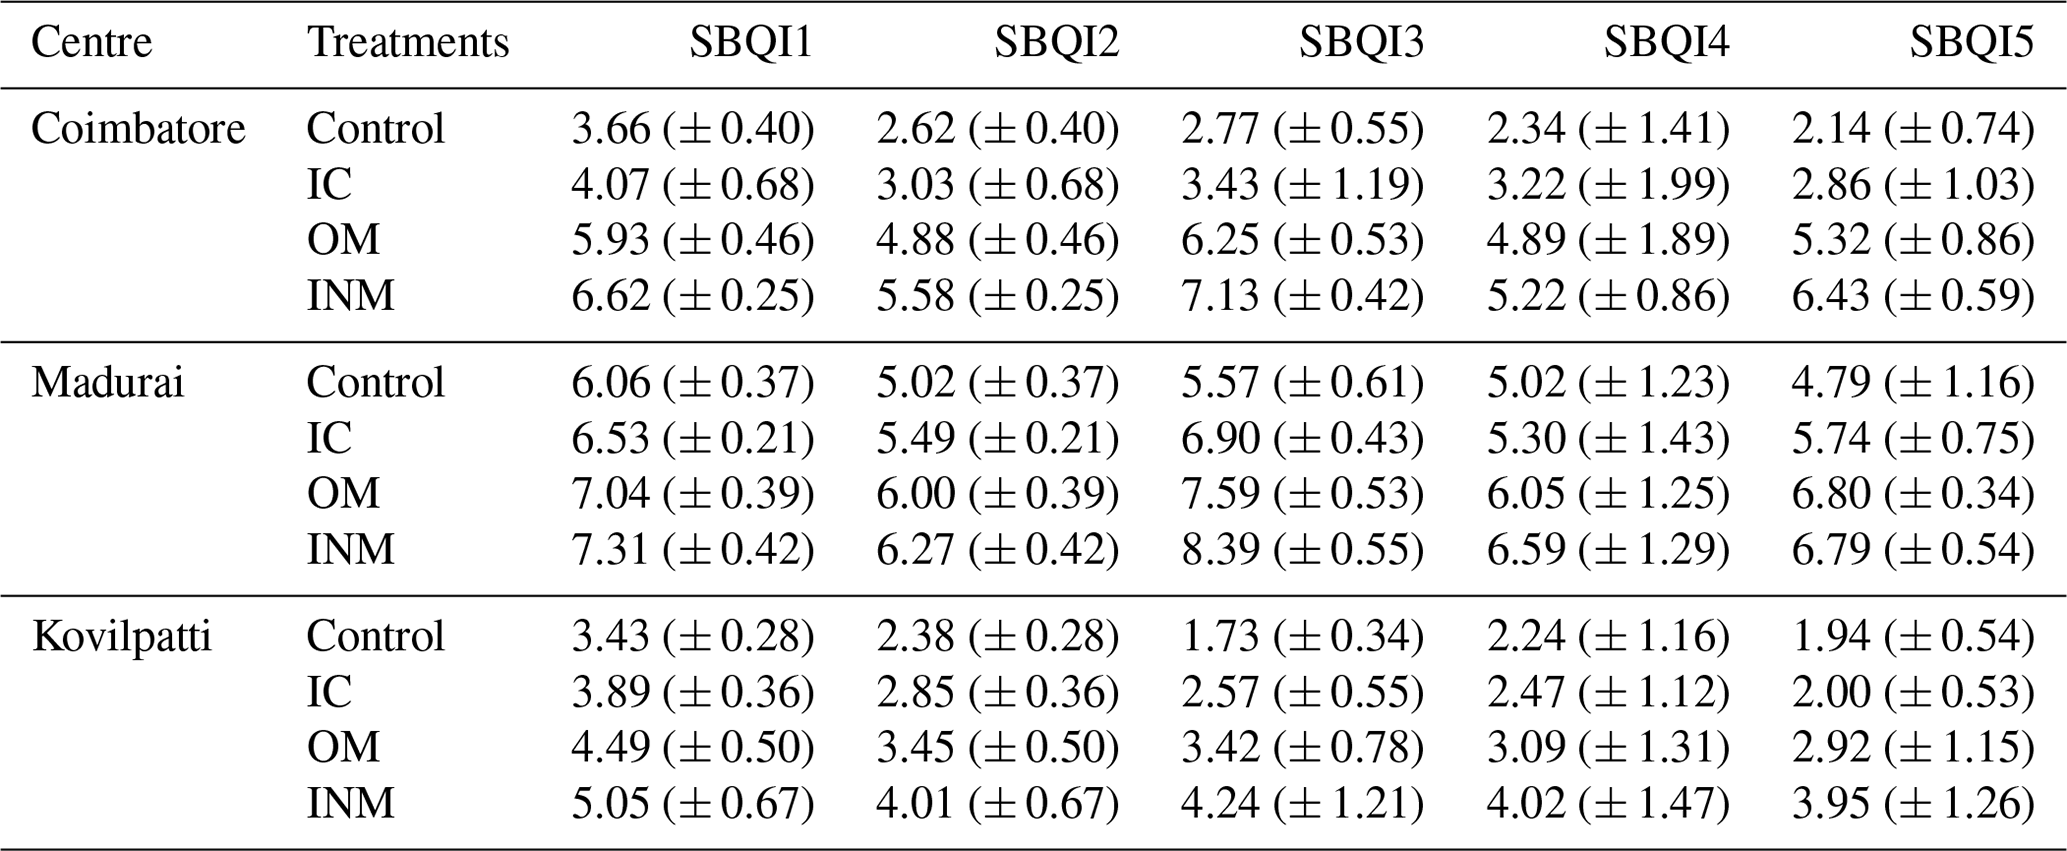
Values are the mean (± SD) of three replicates. Control – unfertilized control soil; IC – inorganic chemical fertilized soil; OM – organically managed soil; INM – integrated nutrient management enforced soil; SBQI1–SBQI5 refer to the unitless 10-scaled soil biological quality index computed using six soil biological variables.
The SBQIs of four long-term nutritionally managed soils were computed as a 10-scale unitless index using six biological attributes (Table 6). The sample-wise SBQIs calculated were presented as a spreadsheet (file XLS in the Supplement). The SBQI1 calculated using the threshold values of each biological attribute ranged between 3.43 and 7.31 for the tested soil samples. Among the four nutrient managements, OM and INM had the highest SBQI values (5.93 and 6.62 for Coimbatore; 7.04 and 7.31 for Madurai; 4.49 and 5.05 for Kovilpatti, respectively). The wetland soil (Madurai) recorded the highest index followed by irrigated gardenland soil (Coimbatore) and a minimum in dryland soil (Kovilpatti). The least index values (between 3.0 and 4.0) were recorded in unfertilized control and IC soils. Overall, the SBQI1 significantly discriminated the soils based on the soil index scales used by the threshold index of respective soil biological variables. SBQI2 was derived from SBQI1 after scaling it with minimum and maximum values. Hence, the SBQI2 values were lower than the SBQI1, with no change in the trends due to either treatments or centres (Table 6).
The SBQI3 was calculated based on the scoring functions (percentile) of each assessed biological variable. The calculated soil biological quality index for the four different nutrient management enforced soils collected from three different soil types (locations) showed a significant difference due to nutrient management as well as due to locations. In this method also, the highest biological index was recorded in the soils of Madurai (wetland soil), followed by Coimbatore (irrigated gardenland soil) and least in Killikulam (dryland soil). Among them, INM from Madurai recorded the highest SBQI of 8.39, followed by OM (Madurai) (7.59), while IC and control of Madurai recorded quality indexes of 6.90 and 5.57, respectively. The Coimbatore (Alfisol) soils had SBQ indexes of 7.13 (INM), 6.25 (OM), 3.43 (IC), and 2.77 (control), whereas the Kovilpatti soils recorded the lowest SBQI values. INM recorded 4.24, which is lower than the control soil of Madurai, OM with 3.42, IC with 2.57, and control with 1.73. However, like the other two methods (SBQI1 and SBQI2), the resolution to differentiate among the soils based on the biological properties due to long-term nutrient management is high for this method as well.

Figure 4Quadrant scatter plots showing the relatedness of the soil biological variables in four different nutrient management enforced soils of three different agroclimatic zones of Tamil Nadu. Each scatter plot is divided into quadrants based on the mean of the respective axis, which is indicated in the plot. Quadrants with “High” show that both the variables are above the average; “Medium” means that any one of the variables is below the average; “Low” means that both the variables are below the average. The main variable is on the x axis and the second variable for it is on the y axis; 1–108 represent the soil samples.
From the PCA, the percent contribution of each variable to the PCs (PC1 with SOC, MBC, SLC, DHA, and SIR; PC2 with SPI) was used to compute the SBQI4. The actual values were weighed based on their percent contribution in PCA to the total cumulative variability. As depicted from other SBQI methods, in this method also, the soils were attributed to the same trends of SBQI values. The highest SBQI was recorded by INM (Madurai) with 6.59 followed by OM (Madurai) 6.05. Within the Coimbatore centre, INM recorded the highest index of 5.22 followed by OM (5.89), IC (3.22), and control (3.24). The same trend was noticed for other centres as well. In SBQI5, the relation of two variables and their measured values were used for computing the quality index. The paired variables were plotted in a scatter plot and the mean of both the variables was used to form quadrants of the plot (Fig. 4). The samples positioned in the quadrants were scored (scaled from 1 to 4) and the score values were weighed with the regression coefficient (R2) and scaled to 10. Such calculated SBQI5 values for the long-term nutrient management enforced soils were the lowest among the five different methods. The Madurai soil (wetland) recorded a score value of 4.79 to 6.79, which is relatively higher than Coimbatore (irrigated garden land soil) (2.14 to 6.43) and Kovilpatti (dryland) (1.94 to 3.95). Regarding the nutrient management effects, OM ≈ INM > IC > control was the trend followed in three different soil types.
3.3 SBQIs of farmers' soils
Table 7SBQI values of farmers' soils measured by five different methods.
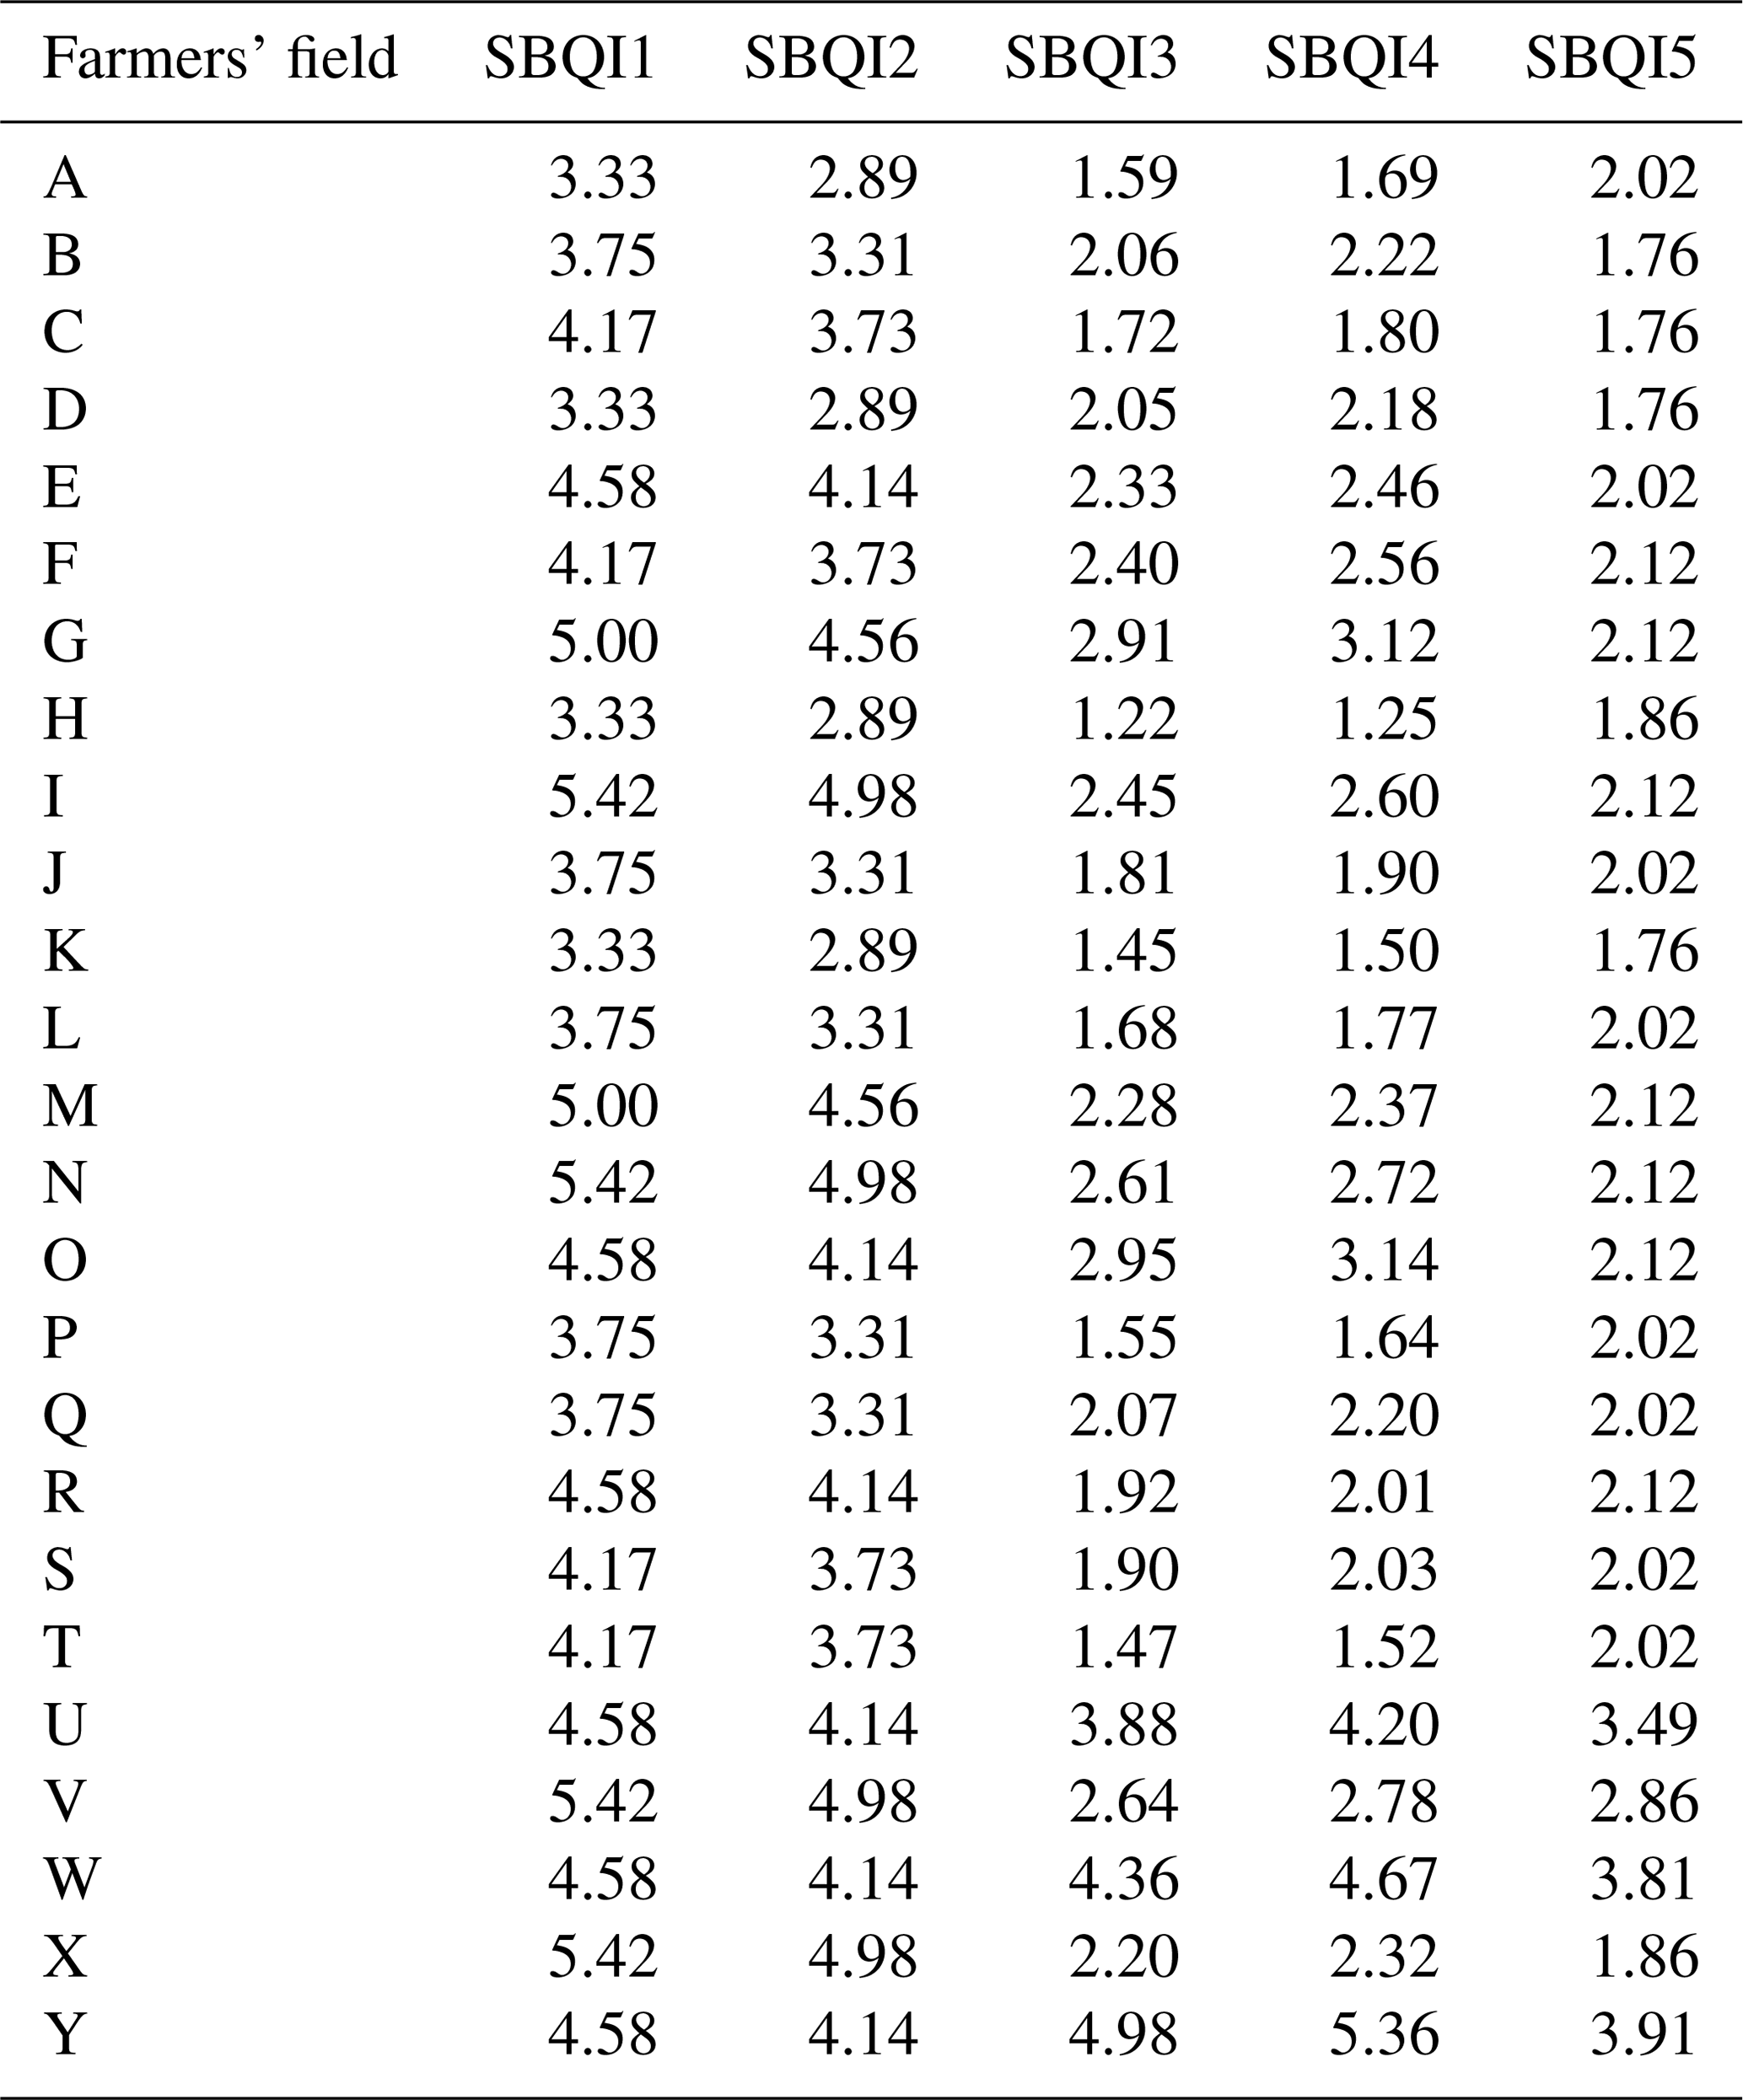
SBQI1 to SBQI5 represent the unitless 10-scaled values of the soil biological quality index calculated for the farmers' field soil using different methods as described earlier. Details of farmers' field soils are provided in Table S1 in the Supplement.
All five SBQI procedures scored the biological quality of the farmers' soils, with a uniform trend among them (Table 7). Irrespective of the soils, SBQI1 had a high level of scaling (example 3.33 for sample A), followed by SBQI2 (2.89) and SBQI5 (2.02), while SBQI3 and SBQI4 recorded 1.59 and 1.69, respectively. All the farmers' soils got lower SBQI scores (no soil with > 6.0) compared to the SBQIs of long-term OM and INM soils of permanent manure experimental soils. When the SBQI values of permanent manurial trial soils and farmers' field soils were pooled and their relativeness assessed, all the SBQI methods showed a significant positive correlation with each other (Table 8).
In the present work, we developed a unitless soil biological quality index to scale the biological properties of soil, to monitor the soil health. We chose six biological indicators, viz. soil organic carbon, soil microbial biomass, soil labile carbon, soil protein index, dehydrogenase activity, and substrate-induced respiration, whose role in soil functioning is well documented. Apart, these variables are known for consistent performance as indicators, relatively quick and simple assessment, and sensitivity to soil disturbances. We measured these six variables from four long-term nutrient management adopted soils (control, inorganic fertilizer applied, organic manure amended, and integrated nutrient management adopted). Such long-term nutrient managements are being adopted in three different soils (semi-arid Alfisol irrigated; semi-arid sub-tropical Alfisol wetland; arid Vertisol dryland). Hence, we assume that the data obtained from these soils can be normalized and the impact of nutrient management on these soil biological attributes could scale the SBQI so that the index can be applied to any range of soils of this region. With this background, the SBQI was computed using these six biological indicators. Based on the literature and our previous works (Balachandar et al., 2014, 2016; Chinnadurai et al., 2013, 2014a; Preethi et al., 2012; Tamilselvi et al., 2015), it is obvious that these biological variables were significantly altered by the nutrient management adoptions (Babin et al., 2019; van der Bom et al., 2018). All these bio-indicators were reported as highest in OM and INM, whereas the IC and control recorded on-par values or sometimes IC was higher than control. Hence, the scale developed using these six variables should differentiate among the OM, INM, IC, and control to each other. We also assume that by comparing those SBQI values of long-term experimental plots to the farmer's soils, it may be possible to predict the biological quality of the soil. This approach was already successfully used to compute the soil quality index (including physical, chemical, and biological attributes) by Cornell University, USA, as the Cornell Soil Health Assessment (Moebius-Clune et al., 2016), and the Soil Assessment and Management Framework by the Soil Quality Institute (Andrews and Carroll, 2001; Wienhold et al., 2004, 2009).
Table 8Correlation coefficient (Pearson, n−1) relating five different methods used to measure the soil biological quality index of long-term nutrient management adopted soils of three different agroecological zones and farmers' soils of Tamil Nadu.
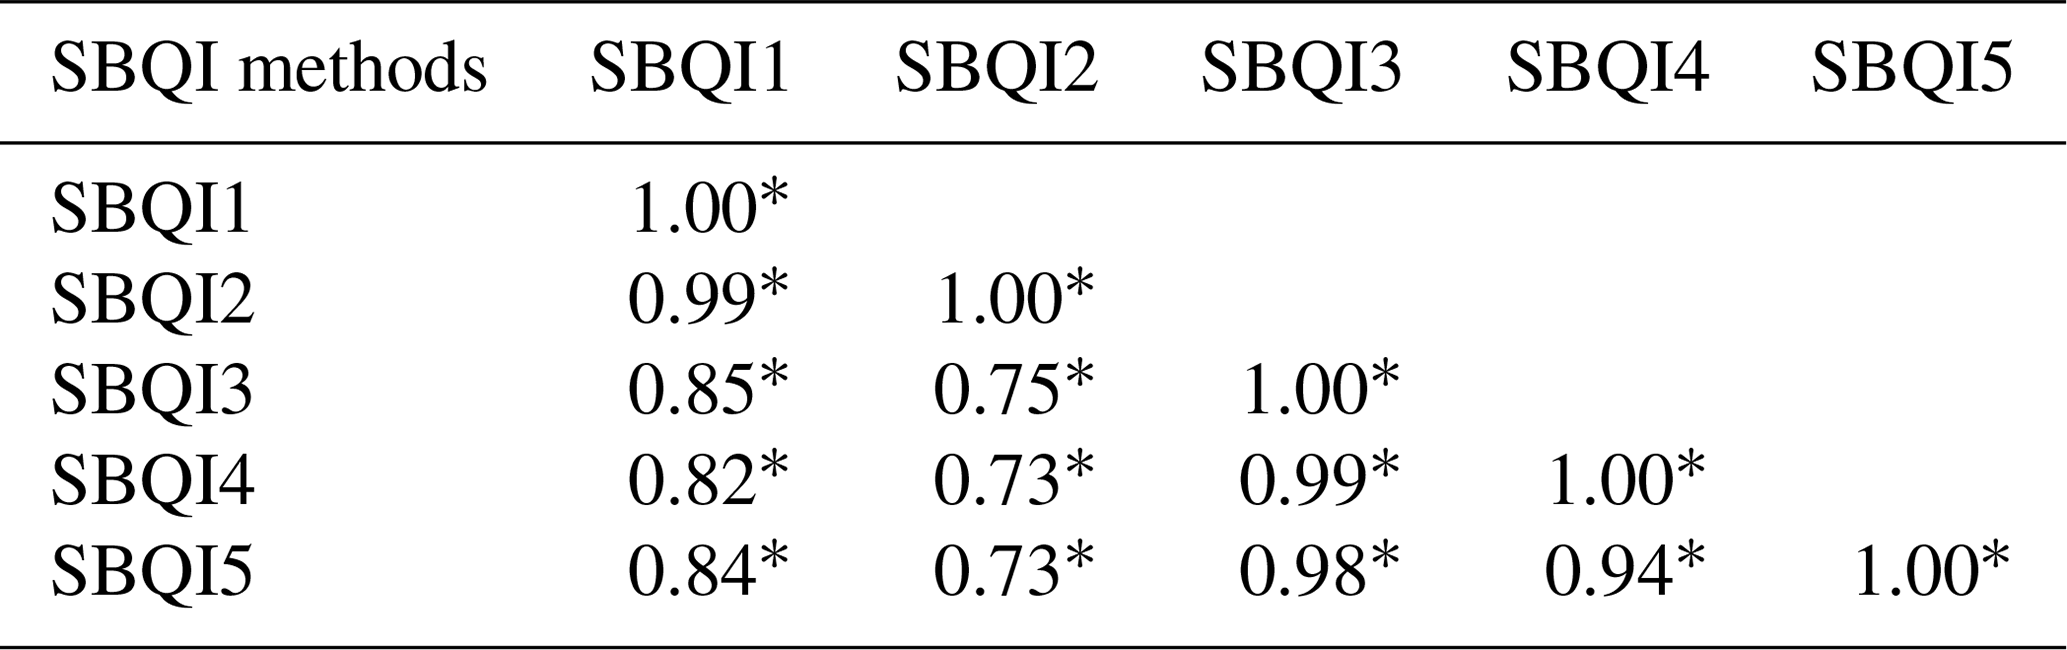
SBQI1 to SBQI5 represent the unitless 10-scaled values of the soil biological quality index calculated for the soil samples.
* Correlation is significant at the 0.05 level.
In the present SBQI development, compared to SBQI1, SBQI2 showed a relatively low-quality index. These simple additive methods performed well for the present soil ecosystems and differentiate among the soils based on their biological attributes as impact by the nutrient management adopted. In all three locations, INM had high scores followed by OM, while IC and control had low index values. The consistent results obtained from all three centres showed the efficiency of these two methods. Among the two, SBQI2 would be more powerful than SBQI1, as it normalizes the data which increased the resolution of the scoring giving weight to the localization of data. As pointed out by Mukherjee and Lal (2014), this method is relatively simple, quick, and user-friendly.
The SBQI3 is based on the scoring functioning of assessed variables. It is an advanced way of calculating SQI, establishing standard non-linear scoring functions, which typically have shapes for “more is better”, “optimum range”, “less is better”, and “undesirable range”. The scores are relative to the measured values of the respective region and transformed the values between 0 and 1, with 0 being the poorest and the score of 1 the best (Andrews et al., 2004; Moebius-Clune et al., 2016). In the present work, all the measured values of six biological variables were scored for their percentile and non-linear scores obtained and grouped as “more is better” shaped curved (Andrews et al., 2004; Moebius-Clune et al., 2016). Hence, it is obvious that the measured values of these indicators would have a positive correlation with SBQI. As suggested by Moebius-Clune et al. (Moebius-Clune et al., 2016), mean + 1 SD was used to score the variables, and all six variables had 78 %–81 % scoring functions, suggesting that over 70 % of the samples fall within this range. Hence, these biological attributes could be significant contributors to the SBQI. If the values are less than 40 %, the reliability of using the variable is questionable. Besides, to get the cumulative single index value, the scoring function percentiles of each variable were added, summed, and normalized to scale between 1 and 10. The major assumption made in this method is that summing the scoring values (percentiles) of each variable rather than actual values or their soil index scales (as with SBQI1 and SBQI2) can provide more accurate score values among the samples tested. The scoring functions and the plots follow the Cornell Soil Health Assessment (Moebius-Clune et al., 2016). The SBQI scored based on this method also had high discriminative power on the samples obtained from permanent manure experiments of three different soils. Among the three locations, dryland soil had the lowest SBQI in this method, while the wetland soil had the highest values. In all three soil types, INM > OM > IC > control is the trend followed for SBQI3 values.
The PCA-based calculation is the most popular method among researchers worldwide and across soil types and land-use management to score the SQI (Bünemann et al., 2018). This method integrated the measured variables into PCs and used to scale them to SQI. In the present investigation, we adopted the same method with slight modification. From the PCA factor loading, each variable's contribution to the corresponding PC was used to weigh the actual measured values, and these weighed values were further summed and scaled to 1–10. Unlike previous investigators (Biswas et al., 2017; Mukherjee and Lal, 2014; Schmidt et al., 2018), we did not pick the single variable for each PC; rather, all the factor loadings of six biological attributes were used to scale the SBQI. This method also significantly discriminated the soils that are under the influence of long-term nutrient management adoptions under three different soil types. Compared to all the above methods, this method is a more statistical approach and places more stress on discriminating the samples than other methods. This method was also successfully used to measure the SQI and was able to predict the yield of a particular system (Mukherjee and Lal, 2014) and relate it to the soil functioning (Vasu et al., 2016).
The fifth method adopted to measure the SBQI from the data is unique and uses the relatedness of two potential variables. The combinations of the variable pairs used are SOC/MBC, SOC/SLC, SOC/SIR, MBC/SPI, MBC/DHA, and MBC/SIR assuming that SOC and MBC are the major driving forces of the soil biology, while the other four variables are relating to them to the functioning. The scatter plots of each pair of variables were divided into four quadrants using the mean of each corresponding variable. The assumption made here is that any sample having more than local average is considered “high”, and less than that is “low”. Thus, the relatedness of the two variables can divide the scatter plot into four quadrants as “high/high”, “high/low”, “low/high”, and “low/low”. Based on the position of the samples in the four quadrants, score values were given (“high/high” – 4, “high/low” – 3, “low/high” – 2 and “low/low”' – 1) and these score values were used to compute the SBQI. This method measured the soils with least SBQIs, suggest that more pressure was made to show the variability. This method adopts the less statistical and more biological approach to score the SBQI, unlike SBQI3 and SBQI4, which are more statistical and less biological. Though the method is relatively complicated to compute the SBQI, more inference and a better understanding of soil biological variables can be obtained. For example, high SOC/high MBC means the samples are sufficient with SOC and MBC, need to maintain them using organic amendments; high SOC/low MBC means the SOC may be recalcitrant or microbial inhibitors/heavy metals/pollutants may be present; need proper reclamation; low SOC/high MBC means the soil needs continuous organic amendments to proliferate the microbial growth; low SOC/low MBC means the soil biological quality is very poor; needs remedy to improve them. Like this, quadrant-based analyses can identify the “soil biological constraints” more sensitively than those methods. Hence, among the five models, SBQI5 can be regarded as the best model to scale the biological health of the soil.
Twenty-five farmers' fields in and around the Coimbatore and Nilgiris districts of Tamil Nadu state, India, were assessed, and SBQIs were computed by all five models as detailed earlier. This part of the investigation was performed for validation, relatedness, and consistency of SBQIs developed in this study. All five SBQIs were in the same trend in the farmer's field. Compared to experimental soils, the farmers' soils are low in SOC and MBC, and all the measured attributes hence recorded lower SBQIs. In these soils also, SBQI1 and SBQI2 had relatively higher values, followed by SBQI3 and SBQI4, while the least was observed in SBQI5. Soil from Ooty (Nilgiris) had relatively high SBQI scores compared to other samples. This was mainly because of the temperate climate and high SOC of those soils. Our SBQI results are comparable to the three methods validated by Mukherjee and Lal (2014). The SBQI values measured in the farmers' fields were identified following constraints in the soil biological functioning: most of the farm soils have low SBQI values (< 4.0) and are in the “low SOC/low MBC”, “low MBC/low DHA”, and “low MBC/low SPI” categories. The soil biological activities responsible for nutrient transformation, organic decomposition, and carbon assimilation are low in these soils. As the poor soil management continues, the quality of the soils may decrease and may be reflected in declining crop productivity.
In the present work, we investigated four different nutrient managements on soil biological attributes, and the difference between them was used to scale a single unitless quantitative measure as an SBQI. Five different models were proposed to compute the SBQIs and each method discriminated the four soil samples accurately, and we could not find any difference among them. However, each method has its advantages and limitations. All five methods gave the same results in the farmers' field and all the SBQIs had a significant positive correlation with each other. Among the five SBQI models tested, SBQI5 would be an appropriate method, as it implies fewer statistics calculations and is more based on a biological approach.
The data that support the findings of this study are available by request from the corresponding author (D. Balachandar).
The supplement related to this article is available online at: https://doi.org/10.5194/soil-6-483-2020-supplement.
DB designed the experimental setup. SA and CC did the soil sampling and led the lab analysis procedure. DB also did the statistics, prepared the manuscript with valuable contributions of the two co-authors SA and CC, and undertook the revisions during the review process.
The authors declare that they have no conflict of interest.
The financial support from the Indian Council of Agricultural Research, New Delhi, India, through the All India Network Project (AINP) on Soil Biodiversity and Biofertilizers to conduct these experiments is acknowledged. P. Malathi, Department of Soil Science and Agricultural Chemistry, Tamil Nadu Agricultural University, Coimbatore, S. Thiyageshwari, Agricultural College and Research Institute, Madurai, and V. Sanjivkumar, Agricultural Research Station, Kovilpatti, are acknowledged for their help and support in collecting the soil samples from the permanent manure experimental fields.
This research has been supported by the ICAR-All India Network Project on Soil Biodiversity and Biofertilizer (grant no. AINP-SBB-2017).
This paper was edited by Carolina Boix-Fayos and reviewed by two anonymous referees.
Acton, D. and Padbury, G.: A conceptual framework for soil quality assessment and monitoring, A program to assess and monitor soil quality in Canada: Soil quality evaluation program summary, Centre for Land and Biological Resources Research Research Branch, Ottowa, Canada, 205 pp., 1993.
Alves de Castro Lopes, A., Gomes de Sousa, D. M., Chaer, G. M., Bueno dos Reis Junior, F., Goedert, W. J., and de Carvalho Mendes, I.: Interpretation of microbial soil indicators as a function of crop yield and organic carbon, Soil Sci. Soc. Am. J., 77, 461–472, https://doi.org/10.2136/sssaj2012.0191, 2013.
Amacher, M. C., O'Neill, K. P., and Perry, C. H.: Soil vital signs: a new soil quality index (SQI) for assessing forest soil health, U.S. Department of Agriculture Forest Service, Fort Collins, USA, 2007.
Andrews, S., Karlen, D., and Mitchell, J.: A comparison of soil quality indexing methods for vegetable production systems in Northern California, Agr. Ecosyst. Environ., 90, 25–45, https://doi.org/10.1016/S0167-8809(01)00174-8, 2002.
Andrews, S. S. and Carroll, C. R.: Designing a soil quality assessment tool for sustainable agroecosystem management, Ecol. Appl., 11, 1573–1585, https://doi.org/10.1890/1051-0761(2001)011[1573:DASQAT]2.0.CO;2, 2001.
Andrews, S. S., Karlen, D. L., and Cambardella, C. A.: The soil management assessment framework, Soil Sci. Soc. Am. J., 68, 1945–1962, https://doi.org/10.2136/sssaj2004.1945, 2004.
Armenise, E., Redmile-Gordon, M., Stellacci, A., Ciccarese, A., and Rubino, P.: Developing a soil quality index to compare soil fitness for agricultural use under different managements in the Mediterranean environment, Soil Till. Res., 130, 91–98, https://doi.org/10.1016/j.still.2013.02.013, 2013.
Babin, D., Deubel, A., Jacquiod, S., Sørensen, S. J., Geistlinger, J., Grosch, R., and Smalla, K.: Impact of long-term agricultural management practices on soil prokaryotic communities, Soil Biol. Biochem., 129, 17–28, https://doi.org/10.1016/j.soilbio.2018.11.002, 2019.
Bai, Z., Caspari, T., Gonzalez, M. R., Batjes, N. H., Mäder, P., Bünemann, E. K., de Goede, R., Brussaard, L., Xu, M., Ferreira, C. S. S., Reintam, E., Fan, H., Mihelič, R., Glavan, M., and Tóth, Z.: Effects of agricultural management practices on soil quality: A review of long-term experiments for Europe and China, Agr. Ecosyst. Environ., 265, 1–7, https://doi.org/10.1016/j.agee.2018.05.028, 2018.
Balachandar, D., Doud, M. S., Schneper, L., Mills, D., and Mathee, K.: Long-term organic nutrient management fosters the eubacterial community diversity in the Indian semi-arid alfisol as revealed by length heterogeneity–PCR, Commun. Soil Sci. Plan., 45, 189–203, https://doi.org/10.1080/00103624.2013.841919, 2014.
Balachandar, D., Chinnadurai, C., Tamilselvi, S., Ilamurugu, K., and Arulmozhiselvan, K.: Lessons from long-term nutrient management adoptions in semi-arid tropical alfisol, Int. J. Plant Soil. Sci., 10, 1–14, https://doi.org/10.9734/IJPSS/2016/24014, 2016.
Bastida, F., Moreno, J. L., Hernandez, T., and García, C.: Microbiological degradation index of soils in a semiarid climate, Soil Biol. Biochem., 38, 3463–3473, https://doi.org/10.1016/j.soilbio.2006.06.001, 2006.
Bastida, F., Selevsek, N., Torres, I. F., Hernández, T., and García, C.: Soil restoration with organic amendments: linking cellular functionality and ecosystem processes, Sci. Rep.-UK, 5, 15550, https://doi.org/10.1038/srep15550, 2015.
Bastida, F., Torres, I. F., Moreno, J. L., Baldrian, P., Ondoño, S., Ruiz-Navarro, A., Hernández, T., Richnow, H. H., Starke, R., García, C., and Jehmlich, N.: The active microbial diversity drives ecosystem multifunctionality and is physiologically related to carbon availability in Mediterranean semi-arid soils, Mol. Ecol., 25, 4660–4673, https://doi.org/10.1111/mec.13783, 2016.
Bastida, F., García, C., Fierer, N., Eldridge, D. J., Bowker, M. A., Abades, S., Alfaro, F. D., Asefaw Berhe, A., Cutler, N. A., Gallardo, A., García-Velázquez, L., Hart, S. C., Hayes, P. E., Hernández, T., Hseu, Z.-Y., Jehmlich, N., Kirchmair, M., Lambers, H., Neuhauser, S., Peña-Ramírez, V. M., Pérez, C. A., Reed, S. C., Santos, F., Siebe, C., Sullivan, B. W., Trivedi, P., Vera, A., Williams, M. A., Luis Moreno, J., and Delgado-Baquerizo, M.: Global ecological predictors of the soil priming effect, Nat. Commun., 10, 3481, https://doi.org/10.1038/s41467-019-11472-7, 2019.
Bhowmik, A., Kukal, S. S., Saha, D., Sharma, H., Kalia, A., and Sharma, S.: Potential indicators of soil health degradation in different land use-based ecosystems in the Shiwaliks of Northwestern India, Sustainability, 11, 3908, https://doi.org/10.3390/su11143908, 2019.
Biswas, S., Hazra, G., Purakayastha, T., Saha, N., Mitran, T., Roy, S. S., Basak, N., and Mandal, B.: Establishment of critical limits of indicators and indices of soil quality in rice-rice cropping systems under different soil orders, Geoderma, 292, 34–48, https://doi.org/10.1016/j.geoderma.2017.01.003, 2017.
Blair, N. and Crocker, G.: Crop rotation effects on soil carbon and physical fertility of two Australian soils, Soil Res., 38, 71–84, 2000.
Blasi, S., Menta, C., Balducci, L., Conti, F. D., Petrini, E., and Piovesan, G.: Soil microarthropod communities from Mediterranean forest ecosystems in Central Italy under different disturbances, Environ. Monit. Assess., 185, 1637–1655, https://doi.org/10.1007/s10661-012-2657-2, 2013.
Bouma, J.: Land quality indicators of sustainable land management across scales, Agr. Ecosyst. Environ., 88, 129–136, https://doi.org/10.1016/S0167-8809(01)00248-1, 2002.
Bünemann, E. K., Bongiorno, G., Bai, Z., Creamer, R. E., De Deyn, G., de Goede, R., Fleskens, L., Geissen, V., Kuyper, T. W., Mäder, P., Pulleman, M., Sukkel, W., van Groenigen, J. W., and Brussaard, L.: Soil quality – A critical review, Soil Biol. Biochem., 120, 105–125, https://doi.org/10.1016/j.soilbio.2018.01.030, 2018.
Calero, J., Aranda, V., Montejo-Ráez, A., and Martín-García, J. M.: A new soil quality index based on morpho-pedological indicators as a site-specific web service applied to olive groves in the Province of Jaen (South Spain), Comput. Electron. Agr., 146, 66–76, https://doi.org/10.1016/j.compag.2018.01.016, 2018.
Casida Jr, L., Klein, D., and Santoro, T.: Soil dehydrogenase activity, Soil Sci., 98, 371–376, 1964.
Chinnadurai, C., Gopalaswamy, G., and Balachandar, D.: Diversity of cultivable Azotobacter in the semi-arid Alfisol receiving long-term organic and inorganic nutrient amendments, Ann. Microbiol., 63, 1397–1404, https://doi.org/10.1007/s13213-013-0600-6, 2013.
Chinnadurai, C., Gopalaswamy, G., and Balachandar, D.: Impact of long-term organic and inorganic nutrient managements on the biological properties and eubacterial community diversity of the Indian semi-arid Alfisol, Arch. Agron. Soil Sci., 60, 531–548, 2014a.
Chinnadurai, C., Gopalaswamy, G., and Balachandar, D.: Long term effects of nutrient management regimes on abundance of bacterial genes and soil biochemical processes for fertility sustainability in a semi-arid tropical alfisol, Geoderma, 232, 563–572, https://doi.org/10.1016/j.geoderma.2014.06.015, 2014b.
Doran, J. W. and Parkin, T. B.: Defining and assessing soil quality, in: Defining soil quality for a sustainable environment, edited by: Doran, J. W., Coleman, D. C., Bezdicek, D. F., and Stewart, B. A., SSSA Special Publication, 35, Soil Science Society of America and American Society of Agronomy, Madison, WI, 1–21, 1994.
Duval, M. E., Martinez, J. M., and Galantini, J. A.: Assessing soil quality indices based on soil organic carbon fractions in different long-term wheat systems under semiarid conditions, Soil Use Manage., 36, 71–82, https://doi.org/10.1111/sum.12532, 2020.
Enwall, K., Nyberg, K., Bertilsson, S., Cederlund, H., Stenström, J., and Hallin, S.: Long-term impact of fertilization on activity and composition of bacterial communities and metabolic guilds in agricultural soil, Soil Biol. Biochem., 39, 106–115, 2007.
Freedman, D. A.: Statistical models: theory and practice, Cambridge University Press, New York, USA.2009.
Fu, B. J., Liu, S. L., Chen, L. D., Lu, Y. H., and Qiu, J.: Soil quality regime in relation to land cover and slope position across a highly modified slope landscape, Ecol. Res., 19, 111–118, https://doi.org/10.1111/j.1440-1703.2003.00614.x, 2004.
Garcia, C., Hernandez, T., and Costa, F.: Microbial activity in soils under Mediterranean environmental conditions, Soil Biol. Biochem., 26, 1185–1191, https://doi.org/10.1016/0038-0717(94)90142-2, 1994.
Giannitsopoulos, M. L., Burgess, P. J., and Rickson, R. J.: Effects of conservation tillage systems on soil physical changes and crop yields in a wheat–oilseed rape rotation, J. Soil Water Conserv., 74, 247–258, https://doi.org/10.2489/jswc.74.3.247, 2019.
Halvorson, J. J., Smith, J. L., and Papendick, R. I.: Integration of multiple soil parameters to evaluate soil quality: a field example, Biol. Fert. Soils, 21, 207–214, https://doi.org/10.1007/BF00335937, 1996.
Hurisso, T. T., Moebius-Clune, D. J., Culman, S. W., Moebius-Clune, B. N., Thies, J. E., and van Es, H. M.: Soil protein as a rapid soil health indicator of potentially available organic nitrogen, Agric. Environ. Lett., 3, 180006, https://doi.org/10.2134/ael2018.02.0006, 2018.
Jenkinson, D. S. and Powlson, D. S.: The effects of biocidal treatments on metabolism in soil—V: A method for measuring soil biomass, Soil Biol. Biochem., 8, 209–213, https://doi.org/10.1016/0038-0717(76)90005-5, 1976.
Jernigan, A. B., Wickings, K., Mohler, C. L., Caldwell, B. A., Pelzer, C. J., Wayman, S., and Ryan, M. R.: Legacy effects of contrasting organic grain cropping systems on soil health indicators, soil invertebrates, weeds, and crop yield, Agr. Syst., 177, 102719, https://doi.org/10.1016/j.agsy.2019.102719, 2020.
Jian, J., Lester, B. J., Du, X., Reiter, M. S., and Stewart, R. D.: A calculator to quantify cover crop effects on soil health and productivity, Soil Till. Res., 199, 104575, https://doi.org/10.1016/j.still.2020.104575, 2020.
Karlen, D. L., Hurley, E. G., Andrews, S. S., Cambardella, C. A., Meek, D. W., Duffy, M. D., and Mallarino, A. P.: Crop rotation effects on soil quality at three northern corn/soybean belt locations, Agron. J., 98, 484–495, https://doi.org/10.1016/S0016-7061(03)00039-9, 2006.
Khan, M. I., Gwon, H. S., Alam, M. A., Song, H. J., Das, S., and Kim, P. J.: Short term effects of different green manure amendments on the composition of main microbial groups and microbial activity of a submerged rice cropping system, Appl. Soil Ecol., 147, 103400, https://doi.org/10.1016/j.apsoil.2019.103400, 2020.
Lal, R.: Soil carbon sequestration impacts on global climate change and food security, Science, 304, 1623–1627, https://doi.org/10.1126/science.1097396, 2004.
Li, P., Zhang, T., Wang, X., and Yu, D.: Development of biological soil quality indicator system for subtropical China, Soil Till. Res., 126, 112–118, https://doi.org/10.1016/j.still.2012.07.011, 2013.
Li, T., Sun, Z., He, C., Ge, X., Ouyang, Z., and Wu, L.: Changes in soil bacterial community structure and microbial function caused by straw retention in the North China Plain, Arch. Agron. Soil Sci., 66, 46–57, https://doi.org/10.1080/03650340.2019.1593382, 2020.
Liu, M., Wang, C., Wang, F., and Xie, Y.: Vermicompost and humic fertilizer improve coastal saline soil by regulating soil aggregates and the bacterial community, Arch. Agron. Soil Sci., 65, 281–293, https://doi.org/10.1080/03650340.2018.1498083, 2019.
Mandal, U. K., Ramachandran, K., Sharma, K., Satyam, B., Venkanna, K., Udaya Bhanu, M., Mandal, M., Masane, R. N., Narsimlu, B., and Rao, K.: Assessing soil quality in a semiarid tropical watershed using a geographic information system, Soil Sci. Soc. Am. J., 75, 1144–1160, https://doi.org/10.2136/sssaj2009.0361, 2011.
Masto, R. E., Chhonkar, P. K., Singh, D., and Patra, A. K.: Alternative soil quality indices for evaluating the effect of intensive cropping, fertilisation and manuring for 31 years in the semi-arid soils of India, Environ. Monit. Assess., 136, 419–435, https://doi.org/10.1007/s10661-007-9697-z, 2008.
Menta, C., Conti, F. D., Pinto, S., Leoni, A., and Lozano-Fondón, C.: Monitoring soil restoration in an open-pit mine in northern Italy, Appl. Soil Ecol., 83, 22–29, https://doi.org/10.1016/j.apsoil.2013.07.013, 2014.
Menta, C., Conti, F. D., Pinto, S., and Bodini, A.: Soil biological quality index (QBS-ar): 15 years of application at global scale, Ecol. Indic., 85, 773–780, https://doi.org/10.1016/j.ecolind.2017.11.030, 2018.
Moebius-Clune, B., Moebius-Clune, D., Gugino, B., Idowu, O., Schindelbeck, R., and Ristow, A.: Comprehensive assessment of soil health, 3.2 ed., The Cornell Framework Manual, 3.1 edn., Cornell University, Ithaca, NY, 2016.
Mukherjee, A. and Lal, R.: Comparison of soil quality index using three methods, Plos One, 9, e105981, https://doi.org/10.1371/journal.pone.0105981, 2014.
Mundepi, A., Cabrera, M., Norton, J., and Habteselassie, M.: Ammonia oxidizers as biological health indicators of elevated Zn and Cu in poultry litter amended soil, Water Air Soil Poll., 230, 239, https://doi.org/10.1007/s11270-019-4283-x, 2019.
Navas, M., Benito, M., Rodríguez, I., and Masaguer, A.: Effect of five forage legume covers on soil quality at the Eastern plains of Venezuela, Appl. Soil Ecol., 49, 242–249, https://doi.org/10.1016/j.apsoil.2011.04.017, 2011.
Nortcliff, S.: Standardisation of soil quality attributes, Agr. Ecosyst. Environ., 88, 161–168, https://doi.org/10.1016/S0167-8809(01)00253-5, 2002.
Papendick, R. I. and Parr, J. F.: Soil quality-the key to a sustainable agriculture, Am. J. Alternative Agr., 7, 2–3, https://doi.org/10.1017/S0889189300004343, 1992.
Parisi, V.: La qualità biologica del suolo. Un metodo basato sui microartropodi, Acta Naturalia de l'Ateneo Parmense, 37, 97–106, 2001.
Pascazio, S., Crecchio, C., Scagliola, M., Mininni, A. N., Dichio, B., Xiloyannis, C., and Sofo, A.: Microbial-based soil quality indicators in irrigated and rainfed soil portions of Mediterranean olive and peach orchards under sustainable management, Agr. Water Manage., 195, 172–179, https://doi.org/10.1016/j.agwat.2017.10.014, 2018.
Pearson, K.: Note on regression and inheritance in the case of two parents, P. R. Soc. London, 58, 240–242, https://doi.org/10.1098/rspl.1895.0041, 1895.
Pérez-Jaramillo, J. E., de Hollander, M., Ramírez, C. A., Mendes, R., Raaijmakers, J. M., and Carrión, V. J.: Deciphering rhizosphere microbiome assembly of wild and modern common bean (Phaseolus vulgaris) in native and agricultural soils from Colombia, Microbiome, 7, 114, https://doi.org/10.1186/s40168-019-0727-1, 2019.
Preethi, B., Poorniammal, R., Balachandar, D., Karthikeyan, S., Chendrayan, K., Bhattacharyya, P., and Adhya, T. K.: Long-term organic nutrient managements foster the biological properties and carbon sequestering capability of a wetland rice soil, Arch. Agron. Soil Sci., 59, 1607–1624, https://doi.org/10.1080/03650340.2012.755260, 2012.
Pulido, M., Schnabel, S., Contador, J. F. L., Lozano-Parra, J., and Gómez-Gutiérrez, Á.: Selecting indicators for assessing soil quality and degradation in rangelands of Extremadura (SW Spain), Ecol. Indic., 74, 49–61, https://doi.org/10.1016/j.ecolind.2016.11.016, 2017.
Rahmanipour, F., Marzaioli, R., Bahrami, H. A., Fereidouni, Z., and Bandarabadi, S. R.: Assessment of soil quality indices in agricultural lands of Qazvin province, Iran, Ecol. Indic., 40, 19–26, https://doi.org/10.1016/j.ecolind.2013.12.003, 2014.
Rinot, O., Levy, G. J., Steinberger, Y., Svoray, T., and Eshel, G.: Soil health assessment: A critical review of current methodologies and a proposed new approach, Sci. Total Environ., 648, 1484–1491, https://doi.org/10.1016/j.scitotenv.2018.08.259, 2019.
Romig, D. E., Garlynd, M. J., Harris, R. F., and McSweeney, K.: How farmers assess soil health and quality, J. Soil Water Conserv., 50, 229–236, 1995.
Rüdisser, J., Tasser, E., Peham, T., Meyer, E., and Tappeiner, U.: The dark side of biodiversity: Spatial application of the biological soil quality indicator (BSQ), Ecol. Indic., 53, 240–246, https://doi.org/10.1016/j.ecolind.2015.02.006, 2015.
Schmidt, E. S., Villamil, M. B., and Amiotti, N. M.: Soil quality under conservation practices on farm operations of the southern semiarid pampas region of Argentina, Soil Till. Res., 176, 85–94, https://doi.org/10.1016/j.still.2017.11.001, 2018.
Stewart, R. D., Jian, J., Gyawali, A. J., Thomason, W. E., Badgley, B. D., Reiter, M. S., and Strickland, M. S.: What we talk about when we talk about soil health, Agric. Environ. Lett., 3, 180033, https://doi.org/10.2134/ael2018.06.0033, 2018.
Tamilselvi, S., Chinnadurai, C., Ilamurugu, K., Arulmozhiselvan, K., and Balachandar, D.: Effect of long-term nutrient managements on biological and biochemical properties of semi-arid tropical Alfisol during maize crop development stages, Ecol. Indic., 48, 76–87, 2015.
van der Bom, F., Nunes, I., Raymond, N. S., Hansen, V., Bonnichsen, L., Magid, J., Nybroe, O., and Jensen, L. S.: Long-term fertilisation form, level and duration affect the diversity, structure and functioning of soil microbial communities in the field, Soil Biol. Biochem., 122, 91–103, https://doi.org/10.1016/j.soilbio.2018.04.003, 2018.
Vasu, D., Singh, S. K., Ray, S. K., Duraisami, V. P., Tiwary, P., Chandran, P., Nimkar, A. M., and Anantwar, S. G.: Soil quality index (SQI) as a tool to evaluate crop productivity in semi-arid Deccan plateau, India, Geoderma, 282, 70–79, https://doi.org/10.1016/j.geoderma.2016.07.010, 2016.
Velásquez, E., Lavelle, P., and Andrade, M.: GISQ, a multifunctional indicator of soil quality, Soil Biol. Biochem., 39, 3066–3080, https://doi.org/10.1016/j.soilbio.2007.06.013, 2007.
VeVerka, J. S., Udawatta, R. P., and Kremer, R. J.: Soil health indicator responses on Missouri claypan soils affected by landscape position, depth, and management practices, J. Soil Water Conserv., 74, 126–137, https://doi.org/10.2489/jswc.74.2.126, 2019.
Vincent, Q., Auclerc, A., Beguiristain, T., and Leyval, C.: Assessment of derelict soil quality: Abiotic, biotic and functional approaches, Sci. Total Environ., 613–614, 990–1002, https://doi.org/10.1016/j.scitotenv.2017.09.118, 2018.
Visioli, G., Menta, C., Gardi, C., and Conti, F. D.: Metal toxicity and biodiversity in serpentine soils: Application of bioassay tests and microarthropod index, Chemosphere, 90, 1267–1273, https://doi.org/10.1016/j.chemosphere.2012.09.081, 2013.
Walkley, A. and Black, I. A.: An examination of the Degtjareff method for determining soil organic matter, and a proposed modification of the chromic acid titration method, Soil Sci., 37, 29–38, 1934.
Wienhold, B. J., Andrews, S., and Karlen, D.: Soil quality: a review of the science and experiences in the USA, Environ. Geochem. Hlth., 26, 89–95, https://doi.org/10.1023/B:EGAH.0000039571.59640.3c, 2004.
Wienhold, B. J., Karlen, D., Andrews, S., and Stott, D.: Protocol for indicator scoring in the soil management assessment framework (SMAF), Renew. Agr. Food Syst., 24, 260–266, https://doi.org/10.1017/S1742170509990093, 2009.
Williams, H., Colombi, T., and Keller, T.: The influence of soil management on soil health: An on-farm study in southern Sweden, Geoderma, 360, 114010, https://doi.org/10.1016/j.geoderma.2019.114010, 2020.
Wold, S., Esbensen, K., and Geladi, P.: Principal component analysis, Chemometr. Intell. Lab., 2, 37–52, https://doi.org/10.1016/0169-7439(87)80084-9, 1987.
Yang, C., Liu, N., and Zhang, Y.: Soil aggregates regulate the impact of soil bacterial and fungal communities on soil respiration, Geoderma, 337, 444–452, https://doi.org/10.1016/j.geoderma.2018.10.002, 2019.