the Creative Commons Attribution 4.0 License.
the Creative Commons Attribution 4.0 License.
 | 03 Jun 2020
Catchment export of base cations: improved mineral dissolution kinetics influence the role of water transit time
Martin Erlandsson Lampa
Harald U. Sverdrup
Kevin H. Bishop
Salim Belyazid
Ali Ameli
Stephan J. Köhler
Soil mineral weathering is one of the major sources of base cations (BC), which play a dual role in forest ecosystems: they function as plant nutrients and buffer against the acidification of catchment runoff. On a long-term basis, soil weathering rates determine the highest sustainable forest productivity that does not cause acidification. It is believed that the hydrologic residence time plays a key role in determining the weathering rates at the landscape scale.
The PROFILE weathering model has been used for almost 30 years to calculate weathering rates in the rooting zone of forest soils. However, the mineral dissolution equations in PROFILE are not adapted for the saturated zone, and employing these equations at the catchment scale results in a significant overprediction of base cation release rates to surface waters. In this study, we use a revised set of PROFILE equations which, among other features, include retardation due to silica concentrations. Relationships between the water transit time (WTT) and soil water concentrations were derived for each base cation, by simulating the soil water chemistry along a one-dimensional flow path, using the mineralogy from a glacial till soil. We show how the revised PROFILE equations are able to reproduce patterns in BC and silica concentrations as well as BC ratios (, and ) that are observed in the soil water profiles and catchment runoff. In contrast to the original set of PROFILE equations, the revised set of equations could reproduce the fact that increasing WTT led to a decreasing ratio and increasing and ratios. Furthermore, the total release of base cations from a hillslope was calculated using a mixing model, where water with different WTTs was mixed according to an externally modeled WTT distribution. The revised set of equations gave a 50 % lower base cation release (0.23 eq m−2 yr−1) than the original PROFILE equations and are in better agreement with mass balance calculations of weathering rates. Thus, the results from this study demonstrate that the revised mineral dissolution equations for PROFILE are a major step forward in modeling weathering rates at the catchment scale.
- Article
(2514 KB) - Full-text XML
- BibTeX
- EndNote


The dissolution of minerals in soils is one of the key processes behind the diversity of surface water chemistry around the world. In forest ecosystems, mineral dissolution is a major source of base cations. These cations act as tree nutrients in soil water and provide buffering capacity to both soil and the runoff sustaining aquatic ecosystems. Both forest harvest and acid deposition are anthropogenic factors that remove base cations and can potentially create imbalances that threaten soil and aquatic ecosystems (Akselsson et al., 2007). Thus, quantifying the base cation release rates from mineral dissolution is fundamental when determining sustainable rates of forest harvest as well as critical loads of acidifying deposition (Klaminder et al., 2011). Extensive modeling efforts have been made to define sustainability with respect to tree health (Blum et al., 2002; Gérard et al., 2008; Akselsson et al., 2016); however, there are only a few examples of studies that explicitly model mineral dissolution at the catchment scale (e.g., Goddéris et al., 2006) in an effort to determine the long-term sustainability of ecosystems. Instead key management decisions for controlling acid deposition and forest management practices have been based on approaches that do not explicitly predict weathering rates.
One key influence on any process-based understanding of base cation flows in soils is a clear relationship between water transit time (WTT) and the amount of weathering products exported from the catchment: the longer the soil water is in contact with mineral surfaces, the more solutes will be released to pore water that can eventually exit the catchment as runoff (Maher, 2010). If chemical weathering dominates over other base cation flux terms (biological uptake, deposition and so on), the relationship between WTT and solute concentrations in runoff will be linear as long as minerals dissolve at a steady rate. This means that increasing the water flux dilutes the concentration seen in soil waters and stream runoff, creating a negative relationship between stream concentration and discharge. However, as the concentrations of weathering products build up in the soil water solution, the mineral dissolution rates will slow down. This is a part of the complexity of predicting concentration–discharge relationships that can often include chemostatic behavior (Godsey et al., 2009; Maher, 2011). As minerals react individually to changes in the surrounding solution, this shift may be timed differently for different solutes at different flux rates that are all operating in a catchment system where the mineralogy and physical properties will change over time in response to dissolution processes, secondary mineral formation and other processes.
Process-based models of soil weathering are powerful tools with the potential to couple hydrological processes and mineral dissolution rates. The PROFILE steady-state weathering model (Warfvinge and Sverdrup, 1992), and its dynamic successors SAFE (Sverdrup and Warfvinge, 1993) and ForSAFE (Wallman et al., 2006), have consistently proven capable of reproducing observations of field conditions in the rooting zone over a wide range of soil types and climate zones (Sverdrup et al., 1995, 1998; Kolka et al., 1996; Langan et al., 1995; Zabowski et al., 2007; Phelan et al., 2014). However, PROFILE was developed for and is restricted to the unsaturated soil domain, and it can also only handle vertical flow. Application of the PROFILE equations for mineral dissolution rates to the saturated zone (Erlandsson et al., 2016), as well as initial efforts to use ForSAFE for two-dimensional simulations of hillslope weathering (Zanchi, 2016), revealed a significant overprediction of weathering rates below the water table and overestimates of Na+ and K+ release to the stream, suggesting shortcomings in some aspects of the model.
Aside from differences in the mineral dissolution process, prediction of catchment weathering rates also demands a better understanding of hydrological processes. Catchment hydrology adds process complexity beyond that encountered in the unsaturated zone, requiring descriptions of both vertical and lateral flow. There are also still unresolved issues regarding transit time distributions, flow paths and “immobile water” (McDonell and Beven, 2014; Pinay et al., 2015). For the weakly buffered glacial till soils (i.e., unsorted glacial deposits) covering large parts of the boreal/nemoral vegetation zones, the soil and surface water systems have base cation dissolution rates where acid deposition and/or forest harvest can significantly affect the buffering capacity and nutrient supply (Akselsson et al., 2019). Due to the strong gradient in soil physical properties, these systems have been problematic to model hydrologically (Amvrosiadi et al., 2017a). Recently, advances have been made in the development of models able to simulate both the runoff and transport of conservative elements from catchments (Ameli et al., 2017). While the theoretical importance of correctly defining both the water flow system and the chemical dissolution rates has been identified (Maher, 2010), it remains to be seen how the dissolution rates of specific minerals found in shallow till systems of weakly buffered glacial till soils interact with the possible distributions of water fluxes in these environments.
It has been established that the current PROFILE mineral dissolution equations do not form a complete description of the dissolution process (Rapp and Bishop, 2003). Specifically, the retardant effect of aqueous silica, a major constituent of silicate minerals, has previously not been included. While this is less important in the unsaturated zone where aqueous silica concentrations are low (typically <0.3 mM), it has been suggested that the overprediction of weathering in the saturated zone is caused by neglecting the silica effect. In Sverdrup et al. (2020), a revised set of PROFILE equations is presented which contain a number of expanded functions, including retardation due to silica concentrations. In the present study, we use both the original and the revised PROFILE equations to evaluate how the mineral dissolution rates interact with the WTT. We utilize a simple one-dimensional reactive transport model, simulating the dissolution of minerals and the evolution of soil water chemistry along a one-dimensional flow path created to simulate the movement of a water particle through the saturated zone of a catchment. Given the mineralogy and mineral surface area of the soil, the model will produce a unique relationship between the WTT and solute concentration for each individual base cation. We then evaluate the results against soil water and stream water data, specifically against how the ratios between different base cations (Ca2+, Mg2+, Na+ and K+) vary with different proxies for WTT. Furthermore, we demonstrate how the base cation release rates from mineral dissolution in a hillslope comprised of a range of flow paths with different WTTs can be calculated by mixing the water from the mineral dissolution model according to a given WTT distribution.
2.1 Dissolution rate equations
2.1.1 Dissolution rate equations in the PROFILE model
The mineral-specific dissolution rates can generally be written as follows:
where stands for the forward dissolution rate of the ith reaction and is a function of the surrounding fluid chemistry, Fi(T) represents a temperature function for the ith reaction and g(ΔGR) denotes a chemical affinity function.
Forward dissolution rates in the PROFILE model are calculated as the sum of a number of parallel reactions (Sverdrup, 1990; Warfvinge and Sverdrup, 1992, 1995; Sverdrup and Warfvinge, 1993):
where j is the dissolution agent; k is a temperature-dependent reaction coefficient; and f is a so-called “brake” function, which describes a retardant effect on mineral dissolution. In the original version of PROFILE, the terms for the four dissolution agents are defined as follows: H+, H2O, CO2 and one organic anion analogue (R−). A fifth dissolution agent, OH−, is known to be potentially important but has been omitted thus far, as it is not believed to contribute significantly to mineral dissolution in the unsaturated zone.
The retardant functions are products of factors defined by concentrations of aquatic species with a retardant effect on mineral dissolution:
where k is an aqueous species that retards the dissolution reaction. Retardant effects from base cations (BC) and aluminum (Al) as well as a self-inhibiting factor for the reaction with R− are defined in the original version of PROFILE. However, there are no brake functions that apply to the CO2 term, and BC and Al brakes are missing from the R− term.
2.1.2 Features of the new PROFILE model
The new version of the PROFILE equations contains several new features (Sverdrup et al., 2020):
-
A new term representing the reaction with OH− was added to Eq. (2).
-
A “Si brake”, used to define the retardant effects of aqueous siliceous acid (referred to as “Si” hereafter), was applied to all terms. This brake takes the following form:
where KSi is the silica brake constant, CSi is the lower limiting silica concentration and zSi is the silica brake order. This term will cause weathering rates to decrease with increasing silica concentrations.
-
A CO2 brake was applied to the CO2 term to define the saturation limit of the reaction:
where is the CO2 brake constant and is the CO2 brake order (which is equal to n, i.e., the reaction order of the CO2 reaction). This term will avoid an unrealistic rise in weathering at high CO2 soil water concentrations.
-
BC and Al brakes were applied to the terms for which they were not defined in the original PROFILE equations, i.e., the CO2 term, the R− term and the OH− term. The parameters of the new terms can be found in Sverdrup et al. (2020). The new PROFILE equations require aqueous Si to be modeled in order to make the Si brakes work properly. Si is known to be retained in the soil (although it is unclear in exactly what form), and the precipitated phases are often poorly identified (Yang and Steefel, 2008). In this study Si and Al were controlled by letting the soil water solution equilibrate against a “kaolinite-like” phase:
The stoichiometric coefficients x, y and z and the equilibrium constant were then calibrated so that the modeled Si–WTT relationship resembled the observed Si–depth relationship in the S22 soil profile at the study site (see Sect. 2.3.3). Besides this reaction, which removes Al and Si from the soil water solution by precipitation, no secondary phases were considered. In comparison with Al and Si, the soil retention of base cations is small.
2.2 Model description
The model is a simplified representation of a one-dimensional flow path through the saturated zone of a hillslope, where the release of base cations is calculated by simulating how the soil solution chemistry evolves as mineral grains dissolve and precipitate. All calculations were performed with the PHREEQC geochemical code. Some of the terms and their respective relations are illustrated in Fig. 1.
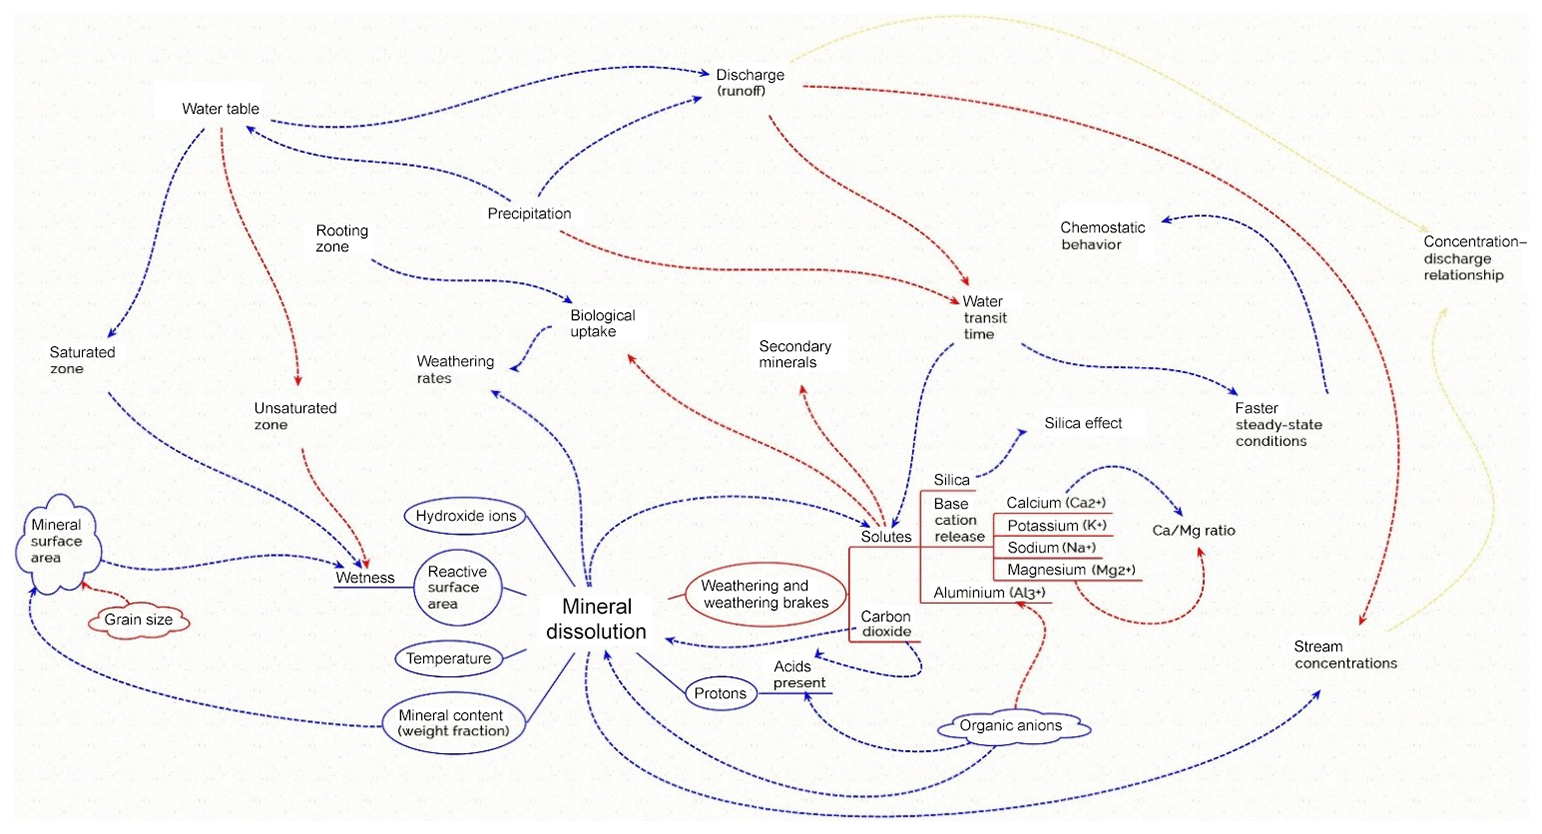
Figure 1Sketch of possible interactions and feedbacks in soil during mineral dissolution. The mineral dissolution rate is affected by several physical (e.g., grain size and temperature), biological (e.g., cation uptake) and chemical (e.g., the presence of protons, organic acids and ions) parameters, some of which are connected to feedback loops from other related processes. Weathering brakes that slow down mineral dissolution are affected by the presence of different dissolved ions and compounds (organic acids and dissolved carbon dioxide) which, in turn, are affected by water fluxes and biological uptake. Water fluxes are driven by rainfall and runoff, leading to water table variations and, thus, changes in the soil water content and soil water solute concentration in general. Some of the feedbacks (marked in red) are negative feedbacks implying a reduction, whereas others are positive feedbacks (marked in blue). Derived terms such as concentration–discharge relationships that result from the interactions are marked in yellow. As a result, the weathering rate will be augmented through high biological uptake, reactive surface area, wet soil, temperature, secondary mineral formation in presence of organic acids at an acidic pH and large water fluxes causing low cation concentrations.
The transport through the column was simulated as an advective process. The column was composed of 40 cells that were each 1 m in length, which equates to a total length of 40 m. Each cell contains (by default in PHREEQC) 1 dm3 of water, and the total cell volume is therefore equal to 1 divided by the porosity of the cell (dm3). In each time step, the water in the cell interacts with a specified area of mineral surfaces, which dissolve according to a set of dissolution rate-laws. The model was run for transit times ranging from 1 month to 48 years until steady state was reached. All column cells are uniform with respect to mineralogy, soil texture, flow velocity, organic carbon content and carbon dioxide pressure. Ion exchange processes and plant uptake are not included in the model. As the study site is a mature forest with low historic acid deposition, it is likely that the system is close to steady state with respect to base cation uptake and net exchange.
In the model setup, precipitation was used as the infilling solution, with a chemical composition calculated as the measured annual bulk deposition (average values for the years 1999–2011, Zetterberg et al., 2014) divided by the annual runoff. The calculated base cation concentrations in precipitation were 0.016 meq [Ca2+], 0.01 meq [Mg2+], 0.019 meq [Na+] and 0.006 meq [K+].
For each cell and time step, the net release of base cations from the mineral dissolution (w) of each mineral m was calculated using:
where r is the specific dissolution rate, and SA is the surface area for mineral “m”.
Assuming that the surface areas of different minerals are proportional to their weight fractions, SAm was calculated according to the following formula:
where φm is the weight fraction of mineral m, Amin is the total field surface area per kilogram of minerals, δmin is the mineral density, δorg is the density of organic material, Vu is the unit volume of one model cell, ∅ is the porosity and LOI is the loss on ignition, i.e., the proportion of organic material. The detailed derivation of this equation can be found in Erlandsson et al. (2016).
2.3 Site description and field data
2.3.1 Site description
All field data used in the study were taken from the Krycklan Catchment Study (Laudon et al., 2013). The catchment is located in northern Sweden (64∘14′ N, 19∘46′ E), 60 km inland from the Baltic Sea. The catchment covers an area of 67 km2, and the elevation ranges from 405 to 114 m a.s.l. The soil has developed predominantly on glacial till, with larger areas of fluvioglacial deposits at lower altitudes. The vegetation is dominated by coniferous forests (87 %) and mires (9 %). The forest is managed, and is predominantly second-generation vegetation. Approximately 7 % of the catchment was clear-cut between 1999 and 2010.
2.3.2 Data for input to the model
Input data required to run the model include mineralogy, estimated surface area per kilogram minerals, porosity and loss on ignition. These were taken from the mean values of observations from four different depths below the maximal groundwater level (35, 50, 75 and 90 cm) of the soil profile (S22) located 22 m from the headwater stream C2 on the “S-transect” hillslope study that was established in 1996 (Nyberg et al., 2001). Figure 2 displays a schematic of the hillslope. Porosity equaled 40.5 %, and loss on ignition was 0.6 %. The average observed mineralogy has the following composition: 47 % quartz, 26 % plagioclase, 20 % K-feldspar, 5.3 % hornblende, 1.0 % pyroxene, 0.62 % biotite and 0.18 % apatite. The mineral surface area was calculated from the soil texture as follows:
The resulting mineral surface area equalled 500 m2 kg−1.
2.3.3 Data for model evaluation
Three different data sets from the Krycklan Catchment Study were used to compare the modeled relations between the WTT and base cation concentrations, as well as the base cation ratios (), with field observations:
-
Soil water samples from the S22 soil profile. Samples from the upper meter of soil (12, 20, 35, 50, 75 and 90 cm) are part of a soil water monitoring program that regularly sampled soil water from 2004 to 2012. In addition, we also included samples from deeper groundwater (2.25, 5.2 and 10.7 m) collected from piezometers. Deeper groundwater samples were only collected once (in August 2012). Soil water chemistry was plotted against depth as a proxy for WTT.
-
Stream water samples from regularly monitored sites in the Krycklan Catchment. A total of 13 streams with catchment areas between 0.12 and 67 km2 were included in the analysis (Köhler et al., 2014). The average stream chemistry from samples taken in 2016 was plotted against catchment area as a proxy for WTT. The mineralogy is largely homogeneous across the whole 67 km2 catchment (Ledesma et al., 2013). Large parts (80 %) of the catchment are covered by glacial till similar to the S22 profile; however, the valleys of the lower parts are covered with finer fluvioglacial sediments.
-
Stream water samples from the C2 stream. Samples were collected fortnightly to monthly from March 2003 to December 2012, but sampling occurred more frequently before and after spring flood (> 50 % of the samples were collected during April and May). Samples were taken approximately 400 m downstream of the intersection between the stream and the S-transect. At the sampling point, the catchment area is approximately 0.12 km2 and completely forested on mineral soils, with the exception of a riparian band of Histosols extending 2–10 m from the stream. Stream chemistry was plotted against decreasing flow as a proxy for increasing WTT.
2.3.4 Implementation of dissolution rate-laws
The model was run with three different combinations of dissolution rate-laws and mineralogies:
-
Model 1: the original PROFILE dissolution rate equations.
-
Model 2: the new PROFILE dissolution rate equations.
-
Model 3: the same as model 2 but assuming that plagioclase consists of two phases that dissolve independently: one phase of albite (a plagioclase feldspar containing only Na+) and one phase of bytownite (a plagioclase feldspar containing 80 % Ca2+ and 20 % Na+).
2.4 Hydrological modeling of the hillslope
Here, we assume that the hillslope hydrological flow can be represented as a series of steady-state noninteracting flow paths with different WTTs and fluxes. We used the WTT distribution for the study site, which was modeled in Ameli et al. (2016b) using the integrated flow and transport model developed in Ameli et al. (2016a). The model explicitly calculates the pathway (and the corresponding transit time and hydrological flux) of each water particle from the land surface to the stream for an exponentially depth-decaying pattern of saturated hydraulic conductivity. These WTTs and fluxes were used to estimate the delivery of base cations by calculating the base cation transport carried by each “water parcel” of the WTT distribution.
The annual base cation release rate from the hillslope (Whill) was then calculated from the mean BC concentrations in hillslope runoff (cBC) divided by the annual runoff (R) as follows:
where cBC is the mean concentration of a base cation in hillslope runoff (eq m−3), and R is the mean annual runoff (m yr−1). This will help to demonstrate the relative importance of old groundwater for base cations transport to the stream.
3.1 Field data
3.1.1 Base cation concentrations
Three different data sets of field observations were analyzed, with each one reflecting the relationship between the base cation concentrations and WTT as approximated by soil depth, catchment size or stream discharge (Fig. 3). Base cation concentrations increased with increasing estimated WTT in all three sets of samples. In the soil profile S22 (Fig. 2), soil water base cation concentrations were approximately constant with depth within the unsaturated zone (at around 0.2 meq L−1). Below 75 cm in the permanently saturated zone, base cation concentrations increased with depth and eventually reached a concentration of 1.2 meq L−1 at a depth of 10.7 m. Hydrological modeling has estimated the age of this water below the minimum groundwater level as years to 1 or 2 decades (Ameli et al., 2016b; Amvrosiadi et al., 2017a).
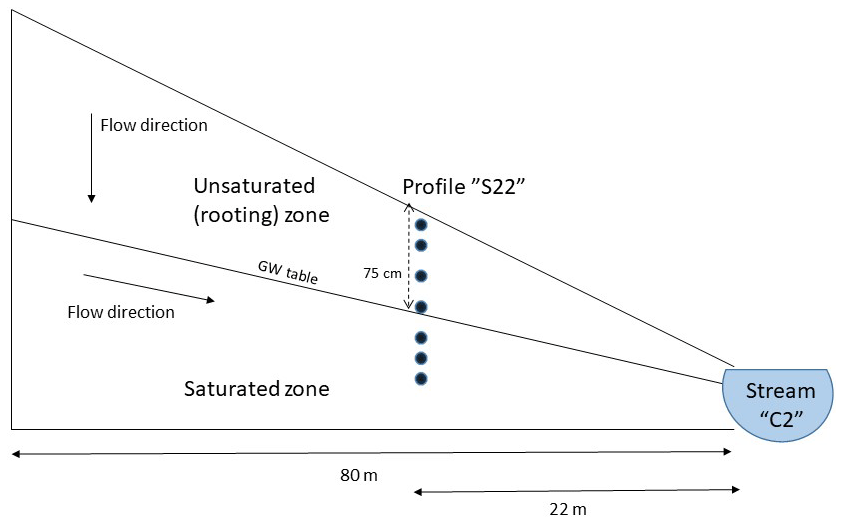
Figure 2Schematic of the hillslope showing the sampled soil profile “S22” (not to scale). The boundary between the unsaturated and saturated zones is defined by the average groundwater table.
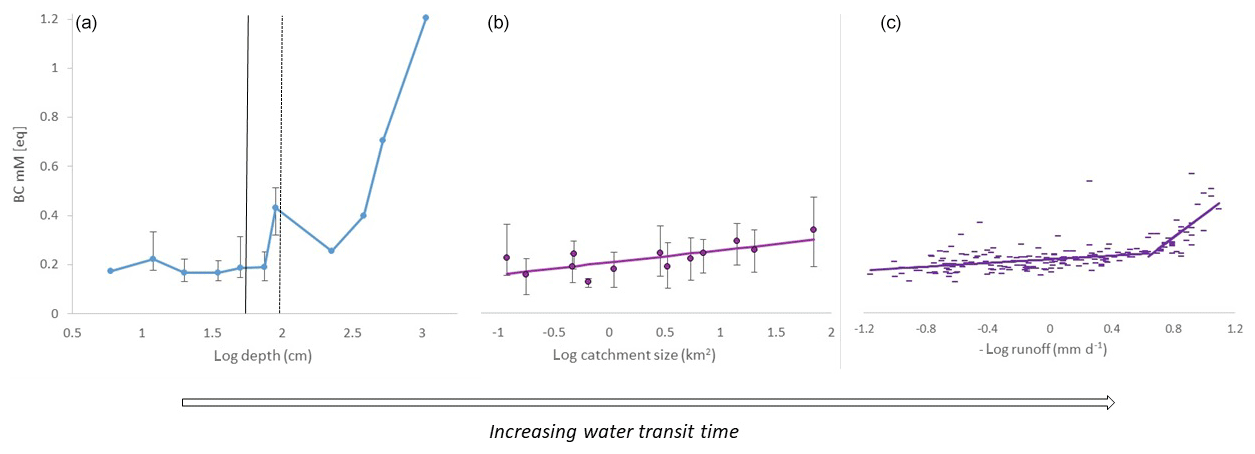
Figure 3Base cation concentrations (mM eq) plotted against different proxies for water transit time. (a) Soil water concentrations in the S22 soil profile (22 m from stream C2), sampled from a depth of 6 to 10.7 m below the surface. Uncertainty bars represent the minimum and maximum concentration observed over 8 years of sampling (N=45–69). Vertical lines represent the approximate highest and lowest groundwater surface depth. (b) Stream water concentrations in samples from 2016 (N=19–25) from the Krycklan Basin plotted against the subcatchment size (range of 0.12–67 km2). Uncertainty bars represent the minimum and maximum concentration observed during sampling. (c) Stream water concentrations in samples from 2003 to 2012 from stream C2 (0.12 km2) plotted against the negative logarithm of runoff. Note that stream C2 displayed in panel (c) is the same as the smallest stream in panel (b) but for two different sampling periods.
In the catchment stream water samples, base cation concentrations generally increased with increasing catchment size. Defining a trend by linear regression, the BC concentrations increased from around 0.16 meq L−1 in the headwater stream with the smallest catchment (0.12 km2) to around 0.30 meq L−1 at the outlet of the Krycklan Basin which has the largest total catchment area (67 km2).
As for the headwater stream C2, the base cation concentrations were lowest at the highest flows. The concentrations increased gently as flow decreased, by about 0.021 meq L−1 per log unit of runoff (mm d−1), down to a runoff of approximately 0.22 mm d−1. With a further decrease in runoff, the base cation concentrations increased more sharply (by 0.26 meq L−1 per log unit of runoff).
3.1.2 Base cation ratios
In the soil profile, all base cation ratios varied substantially with soil depth (Fig. 4). The fraction increased almost monotonically, from a value of 10 % in the shallowest soil layer to around 25 % in the deepest soil layer. varied somewhat irregularly, but it increased substantially with depth below the groundwater surface, from 33 % to 54 % in the deepest soil layer. increased from around 40 % to 48 % with depth in the unsaturated zone and then decreased substantially with depth in the saturated zone to a value of 16 % in the deepest soil layer. was highest in the shallowest soil layer at 20 %, dropped sharply to a value of just 3.6 % in the next soil layer and then displayed an irregular variation with depth.
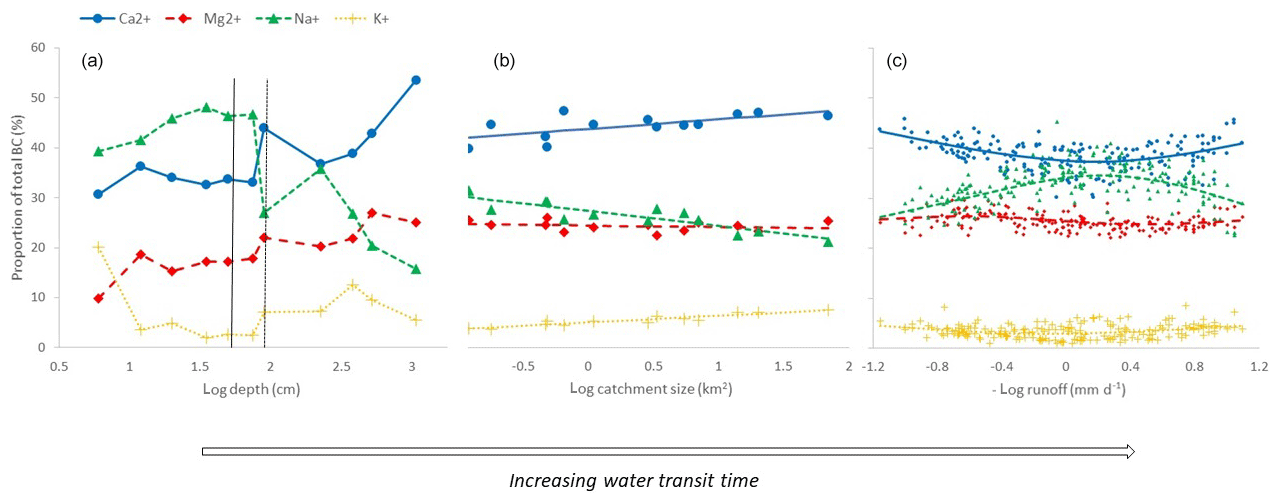
Figure 4Base cation ratios (%) plotted against different proxies for water transit time. (a) Ratios in soil water samples from a soil profile 22 m from stream C2, sampled from a depth of 6 to 10.7 m below the surface. (b) The ratios in stream water samples from 2016 (N=19–25) from the Krycklan Basin plotted against subcatchment size (range of 0.12–67 km2). (c) The ratios in stream water samples from 2003 to 2012 from stream C2 (0.12 km2) plotted against the negative logarithm of runoff.
In the stream water samples, in-stream decreased significantly with catchment size, from 32 % in the smallest stream to 22 % in the largest, whereas increased significantly, from 3.4 % in the smallest stream to 8.2 % in the largest. and tended to increase with catchment size but not significantly.
In the headwater samples, and mirrored each other when plotted against the logarithmic discharge, with displaying a maximum value and displaying a minimum value at a runoff of approximately 0.6–0.7 mm d−1. displayed a minimum, similar to that of , although less pronounced, whereas displayed little systematic variability with runoff.
3.2 Model evaluation
3.2.1 Water transit time–solute concentration relationships
Using the original PROFILE dissolution rate equations (model 1), the relationships between WTT and base cation concentrations were nearly linear for all base cations (Fig. 5). After 4 years of WTT, the total base cation concentration at the column outlet equaled 0.76 meq L−1.

Figure 5Calculated WTT–concentration relationships for the original (solid line) and new (dashed line) PROFILE equations. (a) Total BC concentrations (black); (b) Na+ (green) and K+ (yellow) concentrations; and (c) Ca2+ (blue) and Mg2+ (red) concentrations.
Using the new PROFILE dissolution equations (model 2), the relationship between WTT and the total base cation concentration started on the same trajectory as that calculated from the original equations, but it soon begun to deviate from the linear pattern. After 1 year of WTT, the total BC concentrations calculated from the new set of equations were 80 % of those calculated using the original equations, and after 4 years, they were 55 % of those from the original equations.
As for the individual base cations, the difference between the two sets of equations was largest for K+ due to the strong Si brake for K-feldspar. Using the new set of equations, K+ showed an almost chemostatic behavior after only a few months of WTT. Mg2+, in comparison, displayed an almost linear relationship between the WTT and solute concentrations for both sets of mineral dissolution equations due to the weak Si brakes for all Mg-bearing minerals. Na+, and to a lesser degree Ca2+, were affected by the relatively strong Si brake for plagioclase. For these two base cations, the WTT–solute-concentration relationship derived from the new set of equations begun to deviate from a linear relationship after approximately 1 year of WTT.
3.2.2 Model evaluation of silica and base cation concentrations
For the new PROFILE equations (model 2), the stoichiometry and the equilibrium constant for the secondary “kaolinite-like” phase was calibrated so the modeled Si concentrations approximately matched those of the deep soil profile. The equilibrium between the soil solution and the secondary phase could be written as follows:
The calibrated equilibrium constant for this reaction was 104.3.
Using these assumptions, the modeled Si concentrations were within the same range and showed similar trends with increasing WTT as those observed in the deep soil profile. A similar comparison between modeled base cation concentrations plotted against WTT and base cation concentrations from the soil profile plotted against depth also show good agreement (Fig. 6).
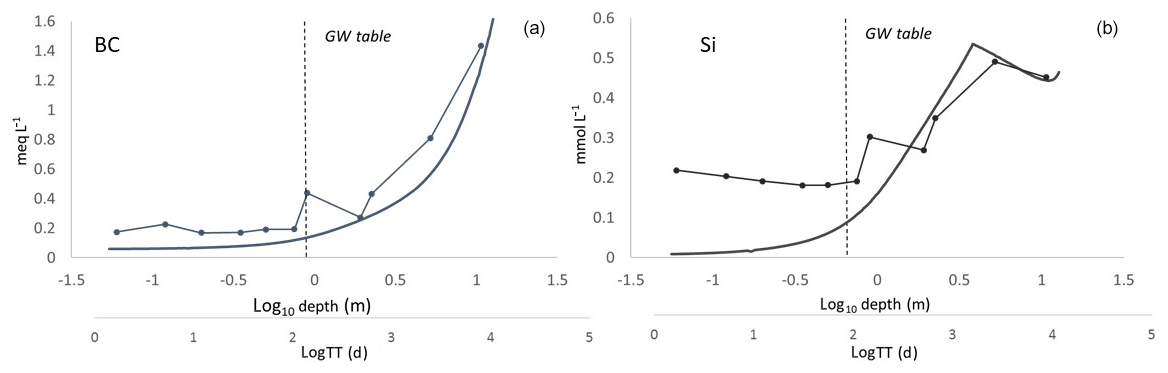
Figure 6Modeled BC (a) and Si (b) concentrations from model 2, plotted against the log10 of WTT (smooth lines). The observed BC and Si concentrations from the soil profile are overlain and plotted against the log10 of soil depth (straight lines with markers). Note that the scales are not directly comparable, instead the figures are intended to illustrate trends and ranges of solute concentrations.
3.2.3 Model evaluation of base cation ratios and water transit time
Using the original set of PROFILE equations (model 1), the trends of the base cation ratios with increasing WTT were generally the opposite of those observed in field data (Fig. 7). and both decreased with WTT, from respective values in the infilling solution of 31 % and 20 % to respective end-point values of 25 % and 11 % after 42 years. and increased with WTT from 37 % and 11 % in the infilling solution to end-point values of 47 % and 17 %, respectively.

Figure 7The calculated base cation ratios (, , and ) from the three different models plotted against the log WTT (thick lines). Model 1 uses the original PROFILE equations, model 2 uses the revised PROFILE equations and model 3 uses the revised PROFILE equations with plagioclase split in two phases that dissolve separately. For comparison, the base cation ratios from the S22 soil profile are displayed on the same graphs (markers are connected with dashed lines) and plotted against the logarithmic depth. Note that the WTT scale is not directly comparable, instead the figures are intended to illustrate trends and ranges of base cation ratios.
With the new set of PROFILE equations (model 2), modeled base cation ratios were more generally in agreement with those observed in field data. and both increased, but the latter increased more sharply, and after 42 years of WTT, the Mg2+ concentrations were higher than the Ca2+ concentrations, which was never seen in field data (Fig. 7). End-point ratios were 38 % for and 42 % for . decreased gently to an end-point value of 3 %, and decreased sharply to an end-point value of 17 %.
With the modification of separating plagioclase into a Na+-rich phase (i.e., albite) and a Ca2+-rich phase (i.e., bytownite) and assuming that these dissolved independently, the agreement between modeled and observed base cation ratios were further improved (model 3). The stronger Si brake for albite than for bytownite allowed for more Ca2+ to be released, and the ratio increased steadily throughout the whole simulation period.
The rapid decrease of saturated hydrological conductivity with depth means that the residence time of water also increases rapidly with depth in the soil. Therefore, as the water reaching the stream moves to the stream in the saturated soil below the water table (except at the highest flow rates in these catchments), the age of the water in the stream also increases as flow rates decline (Bishop, 1991; Ameli et al., 2016b). This explains why deeper depths in the soils profile and lower streamflow rates are proxies for water age. The correlation of age with catchment size relates to deeper and longer flow paths in larger catchments (Peralta-Tapia et al., 2015).
3.3 Hillslope mass balance calculations
The total flux of the base cation release from mineral dissolution of the study hillslope was calculated to be 0.23 eq m−2 yr−1 using the original PROFILE equations. With the new equations, the calculated base cation release was about 50 % lower (0.12 eq m−2 yr−1). The latter estimate of base cation release from mineral dissolution is in much better agreement with the hillslope mass balance (see Erlandsson et al., 2016), especially for Na+ and K+ (Fig. 8). The sinks and sources do not equal each other due to unknown terms in the mass balance, such as the net ion exchange, uptake by plants other than trees and precipitation of secondary phases. However, when the original PROFILE equations were applied, the source terms were 4 times larger than the sink terms for Na+ and 9 times higher for K+.
While the median WTT was 2.1 years, the median “age” of monovalent cations (Na+ and K+) was around 3.7 years, i.e., half of the transport of these ions is carried by water older than 3.7 years. For the divalent cations (Ca2+ and Mg2+), the corresponding age was approximately 5.5 years (Fig. 9). Thus, “old” water is relatively more important for the transport of divalent cations than for monovalent cations.
4.1 Functions of the revised PROFILE equations
The PROFILE model was developed in the late 1980s and is still being used in its original form. However, while PROFILE is a well-recognized tool for estimating root zone weathering rates, the model has also been criticized regarding different aspects. Most notably, Hodson et al. (1997) argued that while PROFILE did give similar estimates of weathering rates to other methods, some of the steps in the model calculations are problematic, especially those related to mineral surface area. In the referred paper, they pointed out that the Eq. (9) puts an unrealistic constraint on mineral surface area and that using actual measured surface areas as input to the model results in overprediction of weathering rates. While the role of mineral surface area, and the way it is calculated in PROFILE, is worth discussing further, we focus here on how formulations of the dissolution kinetics can be improved and how this allows for the inclusion of the saturated zone in the model domain. Furthermore, the mineral surface area has a marginal impact on the BC ratios presented in Fig. 7, and even the calculations of hillslope BC release rates are relatively insensitive to mineral surface area: doubling the specific mineral area to 1000 m2 kg−1 only resulted in a 55 % increase in estimated weathering rates. In comparison, the original PROFILE equations without the brake functions introduced in this study (i.e., model 1) gave 92 % higher estimates of hillslope weathering rates.
While the PROFILE equations demand the determination of many parameters, which are unique for every mineral, a large majority of the parameters found in the original model formulations were based on empirical studies in the form of single mineral laboratory studies of dissolution rates. For these reasons, none of the parameters in the original set of equations were changed in the revision. Instead, a number of features were added, which are more important in the saturated zone which has longer water residence times. Of these, the Si brake had the largest effect by far, accounting for 45 % of the 48 % decrease in the calculated weathering rates between model 1 and model 2. Adding BC and Al brakes to the CO2 and organic terms accounted for another 4 %, whereas the addition of the OH term and CO2 brakes were negligible.
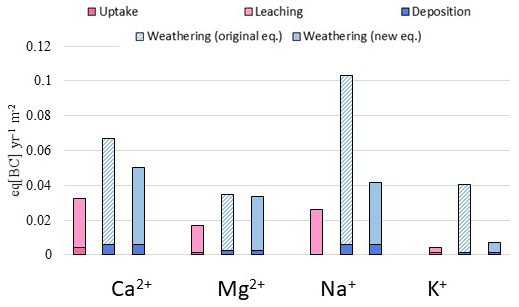
Figure 8Sinks and source terms of the base cation mass balance for a hillslope. The first bar (pink) represents sink terms (net tree uptake and runoff), the second bar represents the source terms with weathering calculated from the original PROFILE equations (model 1) and the third bar represents the source terms with weathering calculated from the new PROFILE equations (model 3).

Figure 9Cumulative water transit time distribution (black) of the study hillslope, and the distribution of the “age” of the water carrying each of the base cations according to model 3.
From the catchment perspective, the quantity of weathering products delivered to runoff is a function of the dissolution rate, integrated over the time the soil water is in contact with the mineral surfaces, and the total mineral surface area. With everything else constant, this produced a nearly linear relationship between base cation concentrations and WTT using the original PROFILE equations. Adding the Si brake disrupts the linear proportionality between the rate of base cation export and the increase in residence time or mineral surface area. However, these revisions do not contradict the applicability of the original PROFILE model to the unsaturated zone. The WTT in the unsaturated zone in shallow till soils may of course vary, but it would typically be around 1 year or less in Fennoscandia and other areas with similar glacial till soils and climate regimes (Rodhe et al., 1996; Amvrosiadi et al., 2017b). The calculated difference in base cation release between the original and the new set of PROFILE equations was relatively small at these timescales; the calculated release from the new equations was 81 % of that from the original equations after 1 year of WTT. It has, however, been noted in previous PROFILE studies that the release of Na+ is overestimated (Stendahl et al., 2013; Kronnäs et al., 2019), and one cause for this may well be neglecting retardant effects from silica on dissolution rates.
4.2 Base cation rations – similarities and differences between modeled results and observations
In this study, we have demonstrated how a model for mineral dissolution kinetics, with a sound theoretical basis in thermodynamics and transition-state theory, is able to explain observed patterns of base cation concentration and distribution in a soil profile and stream water from a poorly buffered glacial till catchment. Ideally, the modeled results would have been evaluated against age-determined groundwater samples along the deeper flow paths; however, such analyses are not available at this site. Here, we made use of some consistent patterns in how base cation ratios in field observations (, , and ) vary with proxies of WTT. The comparison between the model and the sampled soil water profile with respect to base cation concentrations and ratios suggests that the length (i.e., depth) scale of the soil profile (0–10 m) and the timescale of the model (0–48 years) are comparable.
The model correctly reproduced most of the observed patterns in base cation ratios: the initial increase in , followed by a sharp decrease below the groundwater level, and the generally increasing trends of and with increasing WTT (Fig. 7). The clear exception is , which increased with WTT in field data, especially in the catchment samples, whereas the modeled decreased with WTT due to the strong Si brake for K-feldspar, which is the main source of K+. There are several possible explanations for the observed increase in with catchment size. Two of the more likely explanations are as follows:
-
K+ is the base cation that is most involved in biological cycling (Likens et al., 1994). It is rapidly taken up and circulated by trees in the uppermost part of the profile, where is high in the uppermost layer due to high K+ concentrations in throughfall, but is very low in the remainder of the unsaturated zone. As the proportion of K+-poor unsaturated flow to runoff decreases with increasing catchment size, the ratio should be expected to increase.
-
Although the main K-bearing mineral, K-feldspar, should dissolve at a very slow rate in the saturated zone, there is a possibility that K+ is released from the mineral by nonstoichiometric dissolution. This would then be an alteration process rather than a dissolution process. As K+ is replaced with other cations (either Ca2+ or Mg2+), the mineral is gradually altered from K-feldspar to illite or smectite (Sverdrup, 1990). Therefore, this process would form a source of K+ and a sink of Ca2+ or Mg2+.
As there are indications from field data that even increases in the deep groundwater where there is no biological uptake (the soil profile in Fig. 4a and the right part of the in-stream C–Q relationship in Fig. 4c), we conclude that at least the second hypothesis is likely to be true. Furthermore, as the observed ratio does not increase as much as would be expected from the model (the catchment plot in Fig. 4b and the in-stream C–Q relationship in Fig. 4c), an exchange between K+ and Mg2+ appears to be the dominant mechanism.
4.3 Irreversibility of primary mineral dissolution
Most weathering models describe the mineral dissolution rate as a function of chemical affinity, where the dissolution rate approaches zero as the mineral approaches equilibrium with the surrounding soil water solution (Aagaard and Helgeson, 1982). Thus, the dissolution rate described by these models is the net dissolution rate, i.e., the sum of the forward and backward reaction, which implies that the mineral dissolution reaction is reversible. However, for reactions at low temperature and pressure, the dissolution of primary minerals is irreversible, as the conditions for forming these minerals are simply not present (Sverdrup, 1990; Sverdrup and Warfvinge, 1995).
The PROFILE model adopts a different philosophy, where the dissolution reaction is not assumed to depend on the chemical affinity. As no backward reaction is assumed, the PROFILE equations aim to describe only the forward reaction rate, i.e., the pure dissolution reaction. Consequently, these equations allow for minerals to dissolve even if the mineral is apparently saturated with respect to the surrounding soil water solution. As an example, the modeled initial dissolution rate for K-feldspar was 4.5 10−15 mol m−2 s−1. After approximately 2.5 months, K-feldspar is apparently in equilibrium with the surrounding solution, i.e., the calculated saturation index is 0. Using the new PROFILE equations, the K-feldspar is still dissolving at a rate of 1.5 10−15 mol m−2 s−1, i.e., 33 % of the initial rate. If conditions (i.e., heat and pressure) had allowed for K-feldspar to form, the dissolution reaction would have been counterbalanced by an equally fast precipitation reaction; however, in a shallow soil with low temperature, this reaction is not possible. After 1 year of WTT, K-feldspar is oversaturated if geochemical equilibrium is assumed, with a calculated saturation index of 3. According to the new PROFILE equations, K-feldspar is still dissolving, but at a very low rate of 2.3 10−16 mol m−2 s−1, i.e., 5 % of the initial rate.
Revising the mineral dissolution equations of PROFILE is a major step forward in modeling weathering rates at the catchment scale. Our revised equations may now be incorporated into the more complex dynamic ForSAFE model. The PROFILE steady-state approach proposed here is applicable to mineralogically homogenous hillslopes (i.e., either unsorted throughout the domain or not stratified if sorted) as a tool for estimating element fluxes. Given measured texture, mineralogy and a reasonable WTT based on, for example, isotope data, it is a valuable tool for studying hillslope and catchment chemistry in the boreal zone of mature forest systems.
For a more complete description of base cation release from catchments, especially on a longer timescale, a kinetic description of the gradual transformation from primary to secondary minerals would be useful. While the chemical sequence for such mineral alterations, for example feldspars to illite or biotite to vermiculite, are known (Sverdrup et al., 2020), the kinetics are not, and this would probably require a calibration approach as well as data from catchments with substantially older water fractions than those studied here.
As the revised PROFILE equations otherwise generally reproduced base cation concentrations and ratios in the saturated zone correctly, the next step is to test these equations in a model that produces stream runoff, thereby making the link from the unsaturated zone to groundwater and runoff from an entire catchment. The two-dimensional version of ForSAFE (Zanchi, 2016) would allow for this, as it is a dynamic model of biogeochemical cycling that has been developed from PROFILE and its one-dimensional, steady-state conceptualization. This would be a major improvement on the mass balance approaches currently used to define critical loads for surface waters. These mass balances are highly uncertain when using directly observed inputs and outputs, even with 1 or 2 decades of measurements (Simonsson et al., 2015; Akselsson et al., 2019). The mass balance methods also fail to address feedback mechanisms on chemical weathering. For example, tree uptake and deposition affect soil water pH, aluminum and base cation concentrations, all of which effect mineral dissolution rates (Erlandsson et al., 2016). Climate change affects both soil temperature and moisture, which will also impact mineral dissolution (Akselsson et al., 2016). The recent development of a two-dimensional version of ForSAFE in combination with these revised weathering equations would allow for modeling of the interactions and feedbacks between trees, soils and runoff, thereby making it possible to predict the effects of such processes, including the impact of forestry practices on surface water quality.
Data on soil parameters from the Krycklan Catchment Study are available from the “Svartberget data-portal” at https://franklin.vfp.slu.se (Lindgren, 2015). The PHREEQC code can be made available upon request to martin.erlandsson.lampa@lansstyrelsen.se.
MEL, SK and KB conceived the ideas for the paper. The methodology was developed by MEL, HS and SK. Data acquisition was carried out by MEL and SK. Weathering kinetics were developed by HUS and parameterized by HUS and MEL. Data analysis was carried out by MEL, SB and SK. The hydrological modeling was done by AA. The paper was primarily written by MEL with contributions from all coauthors.
The authors declare that they have no conflict of interest.
This article is part of the special issue “Quantifying weathering rates for sustainable forestry (BG/SOIL inter-journal SI)”. It is not associated with a conference.
This study was funded by the Swedish Research Council for Environment, Agricultural Sciences and Spatial Planning (FORMAS, reg. no. 212-2011-1691) within the ”Quantifying weathering rates for sustainable forestry (QWARTS)” strong research environment.
This research has been supported by the Swedish Research Council for Environment, Agricultural Sciences and Spatial Planning (grant no. 212-2011-01691).
This paper was edited by Boris Jansen and reviewed by two anonymous referees.
Aagaard P. and Helgeson, H.: Thermodynamic and kinetic constraints on reaction rates among minerals and aqueous solutions: I. Theoretical considerations, Am. J. Sci., 282, 237–285, 1982.
Akselsson, C., Westling, O., Sverdrup, H., Holmqvist, J., Thelin, G., Uggla, E., and Malm, G.: Impact of harvest intensity on long-term base cation budgets in Swedish forest soils, Water Air Soil Poll., 7, 201–210, https://doi.org/10.1007/s11267-006-9106-6, 2007.
Akselsson, C., Olsson, J., Belyazid, S., and Capell, R.: Can increased weathering rates due to future warming compensate for base cation losses following whole-tree harvesting in spruce forests?, Biogeochemistry, 128, 89–105, https://doi.org/10.1007/s10533-016-0196-6, 2016.
Akselsson, C., Belyazid, S., Stendahl, J., Finlay, R., Olsson, B., Erlandsson Lampa, M., Wallander, H., Gustafsson, J. P., and Bishop, K.: Weathering rates in Swedish forest soils, Biogeochemistry, 16, 4429–4450, 2019.
Ameli, A. A., McDonnell, J. J., and Bishop, K.: The exponential decline in saturated hydraulic conductivity with depth: a novel method for exploring its effect on water flow paths and transit time distribution, Hydrol. Process., 30, 2438–2450, https://doi.org/10.1002/hyp.10777, 2016a.
Ameli, A. A., Amvrosiadi, N., Grabs, T., Laudon, H., Creed, I. F., McDonnell, J. J., and Bishop, K.: Hillslope permeability architecture controls on subsurface transit time distribution and flow paths, J. Hydrol., 543, 17–30, https://doi.org/10.1016/j.jhydrol.2016.04.071, 2016b.
Ameli, A. A., Beven, K., Erlandsson, M., Creed, I. F., McDonnell, J. J., and Bishop, K.: Primary weathering rates, water transit times, and concentration-discharge relations: A theoretical analysis for the critical zone, Water Resour. Res., 53, 942–960, https://doi.org/10.1002/2016WR019448, 2017.
Amvrosiadi, N., Seibert, J., Grabs, T., and Bishop, K.: Water storage dynamics in a till hillslope: the foundation for modeling flows and turnover times, Hydrol. Process., 31, 4–14, https://doi.org/10.1002/hyp.11046, 2017a.
Amvrosiadi, N., Bishop, K., and Seibert, J.: Soil moisture storage estimation based on steady vertical fluxes under equilibrium, J. Hydrol., 553, 798–804, https://doi.org/10.1016/j.jhydrol.2017.08.042, 2017b.
Bishop, K. H.: Episodic increases in stream acidity, catchment flow pathways and hydrograph separation, Ph. D. thesis, University of Cambridge, 257 pp., 1991.
Blum, J. D., Klaue, A., Nezat, C. A., Driscoll, C. T., Johnson, C. E., Siccama, T. G., Eagar, C., Fahey, T. J., and Likens, G. E.: Mycorrhizal weathering of apatite as an important calcium source in base-poor forest ecosystems, Nature, 417, 729–731, https://doi.org/10.1038/nature00793, 2002.
Erlandsson, M., Oelkers, E. H., Bishop, K., Sverdrup, H., Belyazid, S., Ledesma, J. L. J., and Köhler, S. J.: Spatial and temporal variations of base cation release from chemical weathering on a hillslope scale, Chem. Geol., 441, 1–13, https://doi.org/10.1016/j.chemgeo.2016.08.008, 2016.
Gérard, F., Mayer, K. U., Hodson, M. J., and Ranger, J.: Modelling the biogeochemical cycle of silicon in soils: application to a temperate forest ecosystem, Geochim. Cosmochim. Ac., 72, 741–758, https://doi.org/10.1016/j.gca.2007.11.010, 2008.
Goddéris, Y., François, L. M., Probst, A., Schott, J., Moncoulon, D., Labat, D., and Viville, D.: Modelling weathering processes at the catchment scale: The WITCH numerical model, Geochim. Cosmochim. Ac., 70, 1128–1147, https://doi.org/10.1016/j.gca.2005.11.018, 2006.
Godsey, S. E., Kirchner, J. W., and Clow, D. W.: Concentration–discharge relationships reflect chemostatic characteristics of US catchments, Hydrol. Process., 23, 1844–1864, https://doi.org/10.1002/hyp.7315, 2009.
Hodson, M. E., Langan, S. J., and Wilson, M. J.: A critical evaluation of the use of the PROFILE model in calculating mineral weathering rates, Water Air Soil Poll., 98, 79–104, https://doi.org/10.1007/BF02128651, 1997.
Klaminder, J., Lucas, R. W., Futter, M. N., Bishop, K. H., Köhler, S. J., Egnell, G., and Laudon, H.: Silicate mineral weathering rate estimates: Are they precise enough to be useful when predicting the recovery of nutrient pools after harvesting?, Forest Ecol. Manag., 261, 1–9, https://doi.org/10.1016/j.foreco.2010.09.040, 2011.
Köhler, S. J., Lidman, F., and Laudon, H.: Landscape types and pH control organic matter mediated mobilization of Al, Fe, U and La in boreal catchments, Geochim. Cosmochim. Ac., 135, 190–202, https://doi.org/10.1016/j.gca.2014.03.033, 2014.
Kolka, R. K., Grigal, D. F., and Nater, E. A.: Forest soil mineral weathering rates: use of multiple approaches, Geoderma, 73, 1–21, https://doi.org/10.1016/0016-7061(96)00037-7, 1996.
Kronnäs, V., Akselsson, C., and Belyazid, S.: Dynamic modelling of weathering rates – the benefit over steady-state modelling, SOIL, 5, 33–47, https://doi.org/10.5194/soil-5-33-2019, 2019.
Langan, S. J., Sverdrup, H. U., and Coull, M.: The calculation of base cation release from the chemical weathering of Scottish soils using the PROFILE model, Water Air Soil Poll., 85, 2497–2502, https://doi.org/10.1016/0016-7061(95)00071-2, 1996.
Laudon, H., Taberman, I., Ågren, A., Futter, M., Ottosson‐Löfvenius, M., and Bishop, K.: The Krycklan Catchment Study – A flagship infrastructure for hydrology, biogeochemistry, and climate research in the boreal landscape. Water Resour. Res., 49, 7154–7158, https://doi.org/10.1002/wrcr.20520, 2013.
Ledesma, J. L. J., Grabs, T., Futter, M. N., Bishop, K. H., Laudon, H., and Köhler, S. J.: Riparian zone control on base cation concentration in boreal streams, Biogeosciences, 10, 3849–3868, https://doi.org/10.5194/bg-10-3849-2013, 2013.
Likens, G. E., Driscoll, C. T., Buso, D. C., Siccama, T. G., Johnson, C. E., Lovett, G. M., Ryan, D. F., Fahey, T., and Reiners, W. A.: The biogeochemistry of potassium at Hubbard Brook, Biogeochemistry, 25, 61–125, https://doi.org/10.1007/BF00000881, 1994.
Lindgren, K.: 2015. Svartberget data portal, available at: https://franklin.vfp.slu.se, last access: 22 December 2019.
Maher, K.: The dependence of chemical weathering rates on fluid residence time, Earth Planet Sc. Lett., 294, 101–110, https://doi.org/10.1016/j.epsl.2010.03.010, 2010.
Maher, K.: The role of fluid residence time and topographic scales in determining chemical fluxes from landscapes, Earth Planet Sc. Lett., 312, 48–58, https://doi.org/10.1016/j.epsl.2011.09.040, 2011.
McDonnell, J. J. and Beven, K.: Debates – The future of hydrological sciences: A (common) path forward? A call to action aimed at understanding velocities, celerities and residence time distributions of the headwater hydrograph, Water Resour. Res., 50, 5342–5350, https://doi.org/10.1002/2013WR015141, 2014.
Nyberg, L., Stähli, M., Mellander, P. E., and Bishop, K. H.: Soil frost effects on soil water and runoff dynamics along a boreal forest transect: 1. Field investigations, Hydrol. Process., 15, 909–926, https://doi.org/10.1002/hyp.256, 2001.
Peralta-Tapia, A., Sponseller, R. A., Tetzlaff, D., Soulsby, C., and Laudon, H.: Connecting precipitation inputs and soil flow pathways to stream water in contrasting boreal catchments, Hydrol. Process., 29, 3546–3555, https://doi.org/10.1002/hyp.10300, 2015.
Phelan, J., Belyazid, S., Kurz, D., Guthrie, S., Cajka, J., Sverdrup, H., and Waite, R.: Estimation of soil base cation weathering rates with the PROFILE model to determine critical loads of acidity for forested ecosystems in Pennsylvania, USA: pilot application of a potential national methodology, Water Air Soil Poll., 225, 2109–2128, https://doi.org/10.1007/s11270-014-2109-4, 2014.
Pinay, G., Peiffer, S., De Dreuzy, J. R., Krause, S., Hannah, D. M., Fleckenstein, J. H., Sebilo, M., Bishop, K., and Hubert-Moy, L.: Upscaling nitrogen removal capacity from local hotspots to low stream orders' drainage basins, Ecosystems, 18, 1101–1120, https://doi.org/10.1007/s10021-015-9878-5, 2015.
Rapp, L. and Bishop, K.: Modeling Surface Water Critical Loads with PROFILE, J. Environ. Qual., 32, 2290–2300, https://doi.org/10.2134/jeq2003.2290, 2003.
Rodhe, A., Nyberg, L., and Bishop, K.: Transit times for water in a small till catchment from a step shift in the oxygen 18 content of the water input, Water Resour. Res., 32, 3497–3511, https://doi.org/10.1029/96WR01806, 1996.
Simonsson, M., Bergholm, J., Olsson, B., von Brömssen, C., and Öborn I.: Estimating weathering rates using base cation budgets in a Norway spruce stand on podzolised soil: Analysis of fluxes and uncertainties, Forest Ecol. Manag., 340, 135–152, https://doi.org/10.1016/j.foreco.2014.12.024, 2015.
Stendahl, J., Akselsson, C., Melkerud, P. A., and Belyazid, S.: Pedon-scale silicate weathering: comparison of the PROFILE model and the depletion method at 16 forest sites in Sweden, Geoderma, 211, 65–74, https://doi.org/10.1016/j.geoderma.2013.07.005, 2013.
Sverdrup, H.: The Kinetics of Chemical Weathering, Lund University Press, Lund, Sweden, 245 pp., 1990.
Sverdrup, H. and Warfvinge, P.: Calculating field weathering rates using a mechanistic geochemical model PROFILE, Appl. Geochem., 8, 273–283, https://doi.org/10.1016/0883-2927(93)90042-F, 1993.
Sverdrup, H. and Warfvinge, P.: Estimating field weathering rates using laboratory kinetics, Rev. Mineral. Geochem., 31, 485–541, 1995.
Sverdrup, H., Warfvinge, P., Blake, L., and Goulding, K.: Modelling recent and historic soil data from the Rothamsted Experimental Station, UK using SAFE, Agr. Ecosys. Environ., 53, 161–177, https://doi.org/10.1016/0167-8809(94)00558-V, 1995.
Sverdrup, H., Warfvinge, P., and Wickman, T.: Estimating the Weathering Rate at Gårdsjön Using Different Methods, I: Experimental Reversal of Acid Rain Effects, in The Gårdsjön Roof Project, edited by: Hultberg, H. and Skeffington, R., John Wiley Science, 231–250, 1998.
Sverdrup, H. U., Oelkers, E. H., Erlandsson Lampa, M., Belyazid, S., Kurz, D., and Akselsson, C.: Improved parameterization of the weathering kinetics module in the PROFILE and ForSAFE models, Biogeosciences Discuss., https://doi.org/10.5194/bg-2019-464, in review, 2020.
Wallman, P., Svensson, M. G., Sverdrup, H., and Belyazid, S.: ForSAFE – an integrated process-oriented forest model for long-term sustainability assessments, Forest Ecol. Manag., 207, 19–36, https://doi.org/10.1016/j.foreco.2004.10.016, 2005.
Warfvinge, P. and Sverdrup, H.: Calculating critical loads of acid deposition with PROFILE – a steady-state soil chemistry model, Water Air Soil Poll., 63, 119–143, https://doi.org/10.1007/BF00475626, 1992.
Yang, L. and Steefel, C. I.: Kaolinite dissolution and precipitation kinetics at 22C and pH 4, Geochim. Cosmochim. Ac., 72, 99–116, https://doi.org/10.1016/j.gca.2007.10.011, 2008.
Zabowski, D., Skinner, M. F., and Payn, T. W.: Nutrient release by weathering: Implications for sustainable harvesting of Pinus radiata in New Zealand soils, New Zeal. J. For. Sci., 37, 336–354, 2007.
Zanchi, G.: Modelling nutrient transport from forest ecosystems to surface waters: The model ForSAFE-2D. Ph. D. thesis, Lund University, Department of Physical Geography and Ecosystem Science, 53 pp., 2016.
Zetterberg, T., Köhler, S. J., and Löfgren, S.: Sensitivity analyses of MAGIC modelled predictions of future impacts of whole-tree harvest on soil calcium supply and stream acid neutralizing capacity, Sci. Total Environ., 494, 187–201, https://doi.org/10.1016/j.scitotenv.2014.06.114, 2014.