the Creative Commons Attribution 4.0 License.
the Creative Commons Attribution 4.0 License.
 | 25 Mar 2019
Microbial community responses determine how soil–atmosphere exchange of carbonyl sulfide, carbon monoxide, and nitric oxide responds to soil moisture
Thomas Behrendt
Elisa C. P. Catão
Rüdiger Bunk
Zhigang Yi
Elena Schweer
Steffen Kolb
Jürgen Kesselmeier
Susan Trumbore
Carbonyl sulfide (OCS) plays an important role in the global sulfur cycle and is relevant for climate change due to its role as a greenhouse gas, in aerosol formation and atmospheric chemistry. The similarities of the carbon dioxide (CO2) and OCS molecules within chemical and plant metabolic pathways have led to the use of OCS as a proxy for global gross CO2 fixation by plants (gross primary production, GPP). However, unknowns such as the OCS exchange from soils, where simultaneous OCS production (POCS) and consumption (UOCS) occur, currently limits the use of OCS as a GPP proxy. We estimated POCS and UOCS by measuring net fluxes of OCS, carbon monoxide (CO), and nitric oxide (NO) in a dynamic chamber system fumigated with air containing different mixing ratios [OCS]. Nine soils with different land use were rewetted and soil–air exchange was monitored as soils dried out to assess responses to changing moisture. A major control of OCS exchange was the total amount of available sulfur in the soil. POCS production rates were highest for soils at WFPS (water-filled pore space) >60 % and rates were negatively related to thiosulfate concentrations. These moist soils switched from a net source to a net sink activity at moderate moisture levels (WFPS 15 % to 37 %). For three soils we measured NO and CO mixing ratios at different mixing ratios of OCS and revealed that NO and potentially CO exchange rates are linked to UOCS at moderate soil moisture. High nitrate concentrations correlated with maximum OCS release rates at high soil moisture. For one of the investigated soils, the moisture and OCS mixing ratio was correlated with different microbial activity (bacterial 16S rRNA, fungal ITS RNA relative abundance) and gene transcripts of red-like cbbL and amoA.
- Article
(4205 KB) - Full-text XML
-
Supplement
(627 KB) - BibTeX
- EndNote


Carbonyl sulfide (OCS) is the most abundant sulfur-containing trace gas in the troposphere with a lifetime in the order of years. OCS contributes to warming of the troposphere and cooling of the stratosphere, and both processes are considered balanced (Brühl et al., 2012). Plants simultaneously take up carbon dioxide (CO2) and OCS by the enzymes ribulose-1,5-bisphosphate carboxylase (rubisco) and phosphoenolpyruvate carboxylase (PEPCO). Carbonic anhydrase (CA) enhances this uptake process, since it accumulates CO2 intracellularly (Protoschill-Krebs and Kesselmeier, 1992; Protoschill-Krebs et al., 1996). Photosynthesis represents the largest global OCS, i.e., 0.73 to 1.5 Tg S a−1 (Sandoval-Soto et al., 2005). Thus, fluxes of OCS are closely related to gross CO2 uptake during photosynthesis.
Soils can act as both sources and sinks of OCS. While anoxic soils and wetlands are considered a global source for OCS of about 0.05 Tg a−1 (Watts, 2000), oxic soils are considered to be a sink for OCS of about 0.36 Tg a−1 (Berry et al., 2013). OCS uptake in soils has been considered to be predominantly performed by CA (Wingate et al., 2009). However, there is some evidence that rubisco of soil microorganisms might also play a role (Whelan et al., 2018; Kesselmeier et al., 1999; Meredith et al., 2019). The microbial mechanisms underlying OCS production (POCS) and consumption (UOCS) in soil, however, are not resolved and are a topic to recent research (Kaisermann et al., 2018; Meredith et al., 2019; Ogée et al., 2016). In fact, current studies report that soils can switch between net OCS uptake and emission related either to soil moisture and/or soil temperature (Bunk et al., 2017; Whelan et al., 2016; Maseyk et al., 2014). Thus, an understanding of environmental factors controlling the soil microbial community is required for the prediction of net soil OCS fluxes from the ecosystem to global scale.
OCS can be produced by microbial decomposition of organic S compounds via thiosulfate (with minor amounts of CS2; Smith and Kelly, 1988) and thiocyanate hydrolysis (Katayama et al., 1992). Nonetheless, alternative metabolic pathways for OCS production might occur in soil (Conrad, 1996). A recent study suggests that S-containing amino acids act as important OCS precursors (Meredith et al., 2018). There is indication that also archaea are capable of OCS production via CS2 hydrolase (Smeulders et al., 2011). Previous studies suggest thiocyanate as important precursor in microbial OCS production. However, there is no clear evidence if it is the only or main precursor in soil since it can also inhibit microbial OCS production (Katayama et al., 1992). S-oxidizing bacteria that utilize this pathway are Thiobacillus thioparus, Thiohalophilus thiocyanatoxydans, Acinetobacter junii, Geodermatophilus obscurus, and Amycolatopsis orientalis (Katayama et al., 1992; Sorokin et al., 2006; Mason et al., 1994; Ogawa et al., 2016). Sulfate (Banwart and Bremner, 1976), S-containing amino acids (Meredith et al., 2018; Banwart and Bremner, 1975), and other S compounds (Flöck et al., 1997; Lehmann and Conrad, 1996) can therefore act as precursors for microbial OCS formation. Additionally, an abiotic process in which organic matter is degraded depending on temperature and/or light might be of importance for POCS (Whelan and Rhew, 2015).
Consumption of OCS can be linked to microbial pathways in soils that utilize either CO2 or bicarbonate () by various microbial carboxylases (Erb, 2011). CA reversibly catalyzes the hydration of gaseous CO2 to bicarbonate () under neutral pH (Smith and Ferry, 2000). As a ubiquitous enzyme for exchanging and equilibrating CO2, CA does not only occur in higher plants but also in microscopic algae and lichens which may assimilate S from the atmosphere (Kuhn and Kesselmeier, 2000). CA also irreversibly catalyzes OCS to H2S and CO2 (Ogawa et al., 2016; Protoschill-Krebs et al., 1995; Blezinger et al., 2000; Notni et al., 2007). A recent study found a correlation of OCS exchange rates and CO18O with different forms of CA (Meredith et al., 2019).
Rubisco occurs in plants and other photoautotrophs, as well as in soil microbial chemolithoautotrophs (Badger and Bek, 2008). Thus, rubisco is also a candidate for OCS consumption. In plant leaves, stomatal control is the main regulator of OCS uptake (Sandoval-Soto et al., 2012). In soils, accumulating CO2 mixing ratios may have the potential for inhibition of rubisco but not for the alternative enzymes by which soil organisms may uptake CO2, such as CA or PEPCO (Bunk et al., 2017; Cousins et al., 2007).
In addition to its co-metabolism due to its similarity with CO2, OCS can be a direct source of sulfur and/or energy for some autotrophs and heterotrophs. Based on pure culture studies, Thiobacillus thioparus (Smith and Kelly, 1988; Kamezaki et al., 2016), fungal and bacterial strains belonging to Trichoderma (Masaki et al., 2016), and Actinomycetales (Ogawa et al., 2016) may degrade OCS. It has been shown by Laing and Christeller (1980) that OCS acts as a competitive inhibitor for CO2 uptake by rubisco, where CO2 and OCS compete for the active center of the enzyme as alternative substrates (Lorimer and Pierce, 1989).
The OCS production process which has been found to correlate with the amount of nitrogen fertilizer (Kaisermann et al., 2018; Melillo and Steudler, 1989) is still not understood and thus it is still unknown if OCS consumption might be linked to the nitrogen cycle as well. In aerobic soils NO is predominantly produced by nitrifiers (e.g., Placella and Firestone, 2013). In addition, some methanotroph species fix carbon via rubisco (Rasigraf et al., 2014, and references therein). Instead of rubisco, ammonia-oxidizing archaea utilize the hydroxypropionate–hydroxybutyrate cycle for aerobic CO2 fixation (Könneke et al., 2014; Pratscher et al., 2011). Thus, there is evidence that the microbial NO (and potentially CO) exchange might be linked to each other. Ammonia-oxidizing bacteria and methanotrophs may co-oxidize CO via ammonia monooxygenase (AMO) and methane monooxygenase (MMO), which likely is stoichiometrically correlated to ammonia oxidation (Jones et al., 1984).
There is some evidence that the CO and OCS consumption is coupled since various carboxydotrophic soil microorganisms exist. Soil ammonia oxidizers and methanotrophs are capable of CO co-oxidation via ammonia and methane monooxygenase (Bédard and Knowles, 1989; Jones and Morita, 1983; Jones et al., 1984; Bender and Conrad, 1994). Aerobic carboxydotrophic bacteria and fungi can consume CO (King and Weber, 2007; Inman and Ingersoll, 1971). Inhibition experiments indicate that fungi might utilize CA for OCS consumption (Bunk et al., 2017). Archaeal carboxydotrophs are typically hyperthermophilic aerobes that are not common in temperate soils (King and Weber, 2007; Sokolova et al., 2017). The energy conserved from the oxidation of CO can be utilized for CO2 fixation within the Calvin–Benson–Bassham (CBB) cycle via rubisco (Ragsdale, 2004). Anaerobes, such as acetogens, methanogens, and sulfate reducers that harbor the Wood–Ljungdahl pathway might also be capable of oxidizing CO via carbon monoxide dehydrogenase, CODH (Davidova et al., 1993; Ragsdale, 2004; Alber, 2009). CO dehydrogenase can reduce OCS to CO and H2S, and the substrate affinity Km is about 2.2 mM for OCS (Conrad, 1996). While some enzymes consume only OCS (e.g., CA), others consume OCS and produce CO (e.g., CODH). Consistently, OCS:CO2 ratios are correlated with CO:CO2 ratios in a boreal forest (Sun et al., 2018). CO production from abiotic photodecomposition of organic matter (Conrad and Seiler, 1985) might be negligible in soil.
A key goal of our study work was to explore whether simultaneous measurements of, for example, NO and CO and microbial activity by RNA-based approaches have the potential to indicate active metabolic pathways (e.g., CO2 fixation via different enzymes). In turn, this information may provide insights into pathways of POCS and UOCS in a way that allows prediction of net OCS fluxes across a range of soils and moisture contents. Ultimately the ability to understand the role of soils in net ecosystem exchange of OCS is relevant to enabling the estimation of canopy fluxes of OCS and their interpretation as a proxy for gross primary production, GPP (Campbell et al., 2017, 2008; Blonquist et al., 2011; Berry et al., 2013).
Based on this approach, we investigated whether NO and CO exchange rates measured over a range of different moisture conditions and in different soils reveal the influence of soil moisture on the underlying microbial metabolisms of the net soil OCS exchange. For one of the investigated soils (an agricultural soil from Germany), gas exchange rates were linked to microbial activity of archaeal and bacterial ammonia oxidizers (AOA, AOB) and fungal activity based on RNA relative abundance of internal transcribed spacer (ITS). ITS RNA's half-time is low since it is functionally not needed for the establishment of ribosomes but can be considered to be a general proxy for fungal protein biosynthesis (Žifčáková et al., 2016; Baldrian et al., 2012). Additionally, quantitative real-time polymerase chain reaction (qPCR) was applied for detection of the functional red-like cbbL gene encoding rubisco (in nongreen algae and α- and β-Proteobacteria, Selesi et al., 2005) and the archaeal and bacterial amoA gene encoding ammonia monooxygenase. This study is based on the assumption that an increase in the numbers of rRNA and ITS RNA relative abundance reflects increased metabolic activity (Blazewicz et al., 2013; Rocca et al., 2015). Nonetheless, rRNA content is not always directly related to activity since it is relatively stable.
2.1 Soil analysis
In total 11 samples of topsoil (integrating a depth between 0 and 5 cm) were used, representing different soil types and land uses (see Table 1). To make a representative sample for each site, nine individual subsamples were taken on a grid from within a 10 m×10 m area and homogenized. Samples were sieved to <2 mm, hand-picked to remove roots, and stored at 4 ∘C (for up to 6 months) prior to incubations. The field moist soil used for the incubations was analyzed for total sulfur and thiocyanate (SCN−) to link OCS production to substrate availability at the start of the incubation experiments. Bulk soil sulfur content was determined on an elemental analyzer (Vario EL, Elementar Analysensysteme GmbH, Germany). For thiocyanate measurement, about 8 g of soil was extracted in 1 M sodium hydroxide (NaOH) solution, centrifuged, and filtered to remove particulates. Thiocyanate concentrations (reported per gram dry soil) were determined colorimetrically using 50 mm cuvettes and adding chloramine-T, isonicotinic acid as well as 1,3-dimethylbarbituric acid (Environment Agency, 2011). Absorption measurements were made at 600 nm using a photometer (DR3900, Hach Lange GmbH, Germany), calibrated based on a standard curve of diluted potassium thiocyanate from 1 to 5 mg L−1. The blank for photometry analysis was subjected to the same color reactions as the samples using 1 M NaOH instead of sample extract. For ammonium () and nitrate () quantification 5 g soil was extracted in 50 mL of 2 M KCl for 60 min and was filtered through a 604 1∕2 Whatman™ filter paper (GE Healthcare, Chicago, Illinois, USA). The filtered extracts were frozen at −20 ∘C until analysis with a flow injection analyzer (Quickchem QC85S5, Lachat Instruments, Hach Company, Loveland, CO, USA).
Table 1Soil properties and experimental conditions used for analysis. Note that NO and CO exchange rates were measured only for A1, A1dry, and F3 soils at 50 and 1000 ppt OCS, respectively. Temperature for all experiments was 25 ∘C.

Note that OCS fluxes for F3, A1, and A1dry are presented in Bunk et al. (2018). a Data adopted from Bunk et al. (2017); b data adopted from Oswald et al. (2013); n.d. means not determined.
2.2 Incubations
An automated dynamic chamber system was used to incubate soil at 25 ∘C in the dark (Behrendt et al., 2014). The system has six chambers, switching so that it is measuring one while flushing the other five. It also includes a soil-free reference chamber. Experiments of pseudo-replicates, which were representative for a 10 m×10 m area, were run in series, with three technical replicates at any given time, for a given soil moisture. Each chamber was measured for 15 min and then flushed at a rate of 2.5 L min−1.
At the start of each experiment/run (for overview see Table 1), soil (∼60 g) was moistened to saturation (100 % water-filled pore space, WFPS) for most soils; 80 % WFPS for desert soils (D1 and D2), and placed into Plexiglas incubation chambers (inner diameter 0.092 m, height 0.136 m). The composition of air entering the chambers (flow 500 mL min−1) was adjusted by adding (i) CO2 (Westphalia, Germany) to a CO2-free air stream using soda lime to reach ppm and (ii) a variable amount of OCS to “zero” air produced by a pure air generator (PAG 003, Eco Physics AG, Switzerland). For practical reasons, different experiments were performed to test various controls on OCS fluxes. First, OCS fluxes were compared using soils from agricultural sites – corn (A1 and A2), sugar beet (A3), and wheat (A4), as well as from a grassland site (A5), from sand deserts (D1 and D2), and from a natural and previously burned rainforest (F1 and F2) under ambient OCS mixing ratios (about 500 ppt). Second, for three soils NO and CO exchange rates were compared under 50 and 1000 ppt OCS fumigation using the fresh and 40 ∘C dried midlatitude cornfield soil (A1), Mainz, Germany, and a soil sample originated from a spruce forest (F3), Sparneck, Germany. Data for OCS exchange for A1 are shown in the Supplement. Third, for only one site, a fresh midlatitude cornfield soil (A1) also previously investigated for OCS exchange (Kesselmeier et al., 1999; Van Diest and Kesselmeier, 2008; Bunk et al., 2017), we stopped the incubation at selected moisture contents and inlet OCS concentrations and subsampled for molecular analysis. During the incubations, subsamples of this soil were taken at four different soil moistures flushed with OCS-free air (50 ppt OCS). In addition, one sample at the moisture representing maximum OCS consumption under 1000 ppt OCS fumigation was taken for microbial analysis.
For OCS, comparison of net fluxes measured using different levels of OCS in inlet air allows separate quantification of OCS production and consumption contributions to the net flux (Kaisermann et al., 2018). As the air entering the chamber is moisture-free, the soils dry out over time, allowing us to see how gas production and consumption changed with soil moisture. At the start and end of each experiment the gravimetric soil moisture (θg) was determined. Over the course of the experiment gravimetric soil moisture was determined by calculating the mass balance of evaporated water vapor (Behrendt et al., 2014).
For the comparison of results of soils that differ in texture, the gravimetric soil moisture was converted into the percent of water-filled pore space, WFPSlab, as
where θsat is the gravimetric soil moisture at saturation, which was estimated by rewetting the soil until the surface of the particles was covered by a tiny film of water. Msoil(ti) equals the dry mass of soil plus water at any given time point ti and msoil(ts) equals the dry mass of soil plus the residual mass of water at the end of the experiment.
2.3 OCS, NO and CO exchange rates
The selected outflow from the six soil chambers of the automated incubation system was connected to a commercial OCS,CO2, CO, and H2O analyzer (907-0028, Los Gatos Research Inc., USA). Absorption peaks were detected at gas-specific spectral lines (OCS at 2050.40 cm−1 and CO at 2050.86 cm−1). The instrument performs an off-axis integrated cavity output spectroscopy (OA-ICOS), a type of cavity enhanced absorption spectroscopy. In principle the absorption of a quantum cascade laser light by a trace gas is measured according to the Bouguer–Lambert–Beer's law. For incubations of the agricultural soil (A1 fresh and A1 dried at 40 ∘C) and a soil sample from a spruce forest (F3), a NOx analyzer was also connected to the collection line (42i-TL, Thermo Scientific, USA), and NO was detected via chemiluminescence. NO standard gas (5 ppm, Air Liquide, Germany) was used for the calibration of the NOx analyzer. The limit of detection (LOD) was estimated based on the 3σ of the noise from the soil-free chamber (LODNO=0.15 ppb NO, LODOCS<15 ppt, and LODCO<0.3 ppb). The precision and accuracy of laser spectrometers have been evaluated in detail elsewhere (Kooijmans et al., 2016).
In front of the inlet of both analyzers a Nafion dryer (MD-110, Perma Pure LLC, USA) was installed. The exchange rate of each trace gas, JTG, OCS, NO, and CO was calculated as
where Q is the flow rate through the chamber (2.5 L min−1), and cout and cref are the concentrations of each trace gas at the outlet of the soil chamber and soil-free chamber (ng m−3), respectively (Behrendt et al., 2014). Msoil equals the dry mass of soil after drying for 48 h at 105 ∘C. The average and standard deviation of the fluxes were calculated for the last five points of each 15 min interval that the air exiting the soil was analyzed, over the entire time period during which the soil dried out. While the OCS mixing ratios measured were all above the limit of detection, the difference between the OCS mixing ratio of incoming and outgoing air, especially under moderate to low soil moisture, was generally only a few parts per trillion. Therefore, it seems reasonable to set a threshold of detection (i.e., the minimum detectable rate of production or consumption based on the noise of the instrument). Similar to the definition of a limit of detection, we used 3 times the deviation of OCS mixing ratios measured from one soil chamber to define this threshold and converted it into an OCS exchange rate of about ±1.09 pmol g−1 h−1.
2.4 Extraction of RNA and amplicon sequencing
A commercial RNA extraction kit (RNA PowerSoil, MOBIO, USA), involving bead beating at 6 m s−1 for 30 s for cell disruption (FastPrep, MOBIO, USA), was used for RNA extraction of about 1 g soil. RNA was eluted in 100 µL nuclease-free water and further cleaned with a commercial kit for RNA (RNeasy PowerClean Pro CleanUp Kit, MOBIO, USA). Quality and quantity of purified nucleic acids were analyzed by agarose gel electrophoresis (1 % w∕v), nanodrop (ND-2000, Thermo Fisher Scientific, USA), and Qubit fluorometer (Thermo Fisher Scientific, USA). RNA integrity and quantity were analyzed by agarose gel electrophoresis (0.5 % w∕v) and Qubit analysis, after DNase treatment (DNase Max Kit, MOBIO, USA). Subsequently, cDNA was produced with random hexamer primers (Roche) and SuperScript III Reverse Transcriptase (Invitrogen, Karlsruhe, Germany). Ribosomal 16S rRNA and ITS genes were amplified for the V3–V4 region (Klindworth et al., 2013) and ITS3F-4R region (White et al., 1990), respectively, from cDNA. Amplification and sequencing-library preparation were performed for MiSeq Illumina platform in Macrogen Inc. (Seoul, South Korea).
2.5 qPCR for archaeal and bacterial amoA gene and for red-like cbbL gene
The abundance of the archaeal and bacterial amoA functional marker gene encoding ammonia monooxygenase (AMO) was measured by real-time polymerase chain reaction (qPCR), with the crenamo23f/crenamo616r (Tourna et al., 2008) and amoA1F/amoA2R primers (Rotthauwe et al., 1997), respectively. The red-like cbbL functional marker gene encoding rubisco large subunit type IA was quantified with cbbLR1F and cbbLR1intR primers (Selesi et al., 2007). The total reaction volume of 20 µL consisted of 2 µL DNA (1 ng µL−1) or cDNA (diluted 1∕50), 0.4 or 0.6 µM of primer (archaeal and bacterial amoA, respectively), and 1× Power SYBR Green PCR Master Mix (Invitrogen, Karlsruhe, Germany), performed in a qPCR cycler (StepOnePlus™, Applied Biosystems, USA). Reactions were performed in triplicate, and cycling parameters were set to 10 min at 95 ∘C for initialization; 40 cycles of denaturation at 95 ∘C for 30 s; annealing for 30 s at either 54 ∘C (archaeal amoA), 60 s at 55 ∘C (bacterial amoA), or 30 s at 55 ∘C (cbbL); and 30 s at 72 ∘C for elongation, followed by fluorescence measurement. Melting curves were measured in the range of 60 to 95 ∘C in 0.3 ∘C increments. Standard curves were created from 10-fold dilutions of purified plasmids containing the respective gene of interest as described previously (Catão et al., 2016). Archaea and bacterial amoA standard curves had 87.5 % and 67.1 % efficiency and 0.93 and 0.97 coefficient of determination (R2), respectively. The abundance of the red-like form of rubisco was calculated from the 10-fold dilutions standard curve produced from purified DNA of Sinorhizobium meliloti obtained from DSMZ (number 30135), with 84.8 % efficiency and a 0.99 coefficient of determination (R2).
2.6 Sequence analysis
The RNA relative abundance was used as proxy for microbial activity in this study. Before sequence analysis was performed with a standard QIIME pipeline, paired-end reads of 300 bp were merged with PEAR (Zhang et al., 2014), with maximum lengths of 500 or 550 bp for 16S rRNA and ITS, respectively, and cleaned with PrinSeq (Schmieder and Edwards, 2011). Specific criteria were used to proceed with the analysis only with high-quality reads in terms of sequence confidence: mean phred over 25 (probability that the base assigned by the sequencer is at least 99 %); trim quality window of 50 (space of nucleotides scanned for quality at each time); minimum length of 200 bp; removal of artificial duplicates obtained during sequencing; and only 1 % of bases, which were not recognized as ATGC, were allowed (Schmieder and Edwards, 2011). Pre-cleaned sequences were analyzed with QIIME version 1.9.1 (Caporaso et al., 2010), following usearch61 chimera (sequences that can be artificially created during amplification of DNA molecules for the sequencing) screening, and the operational taxonomic units (OTUs) picking process was performed using the uclust_ref method. Chimera checking, OTU picking, and OTU taxonomy assignment of representative OTUs were based on Greengenes taxonomy database 13.8 version for 16S rRNA (McDonald et al., 2012) and ITS UNITE 12.11 version for ITS (Abarenkov et al., 2010). The biome table was exported using the .tsv file format and was used for calculations in R (version 3.3.1) or Igor Pro 7. For graphical representation, overall description of taxa is presented as the normalized relative abundance of the counts (from QIIME pipeline) of sequences assigned to that taxa divided by the total amount of sequences obtained after cleaning steps for each sample. Similarly, only the first hit of classification (from the blast approach) with the highest bit score and lowest e value was considered. The count of reads classified per species above was normalized per the total of cleaned reads and expressed per million reads.
3.1 OCS exchange for rewetted and dried-out soils under ambient (500 ppt) OCS
After wetting stored soils to 80 %–100 % WFPS, all agricultural soils (A1 to A5) produced OCS, with rates of production declining as the soil dried out. At ∼37 % WFPSlab, these soils switched to a state of net OCS consumption (Fig. 1a). Around 15 % WFPSlab, OCS exchange rates increased again to a local maximum (in some cases again net-producing OCS) at about 10 % WFPSlab before they finally declined to zero exchange under completely dry conditions. The cornfield soil (A2) produced 13 pmol g−1 h−1, followed by the 4.7 pmol g−1 h−1 from the grassland soil (A5) and 3.8 pmol g−1 h−1 OCS from the wheat field soil (A4), respectively. For the sugar beet soil (A3) OCS fluxes were less than 1.09 pmol g−1 h−1 (undetectable) or negative (net OCS uptake) in the range from 65 % to 15 % WFPSlab but increased to a production of 1.5 pmol g−1 h−1 at about 10 % WFPSlab. The soil from a wheat field (A4) had an almost identical OCS exchange profile to the cornfield soil (A1). The grassland soil (A5) produced up to 5 pmol g−1 h−1 OCS and was the only agricultural soil that emitted OCS > 1.09 pmol g−1 h−1 within the range of moderate soil moisture. Both rainforest soil samples (F1 and F2) exchanged OCS above detection levels only at very high and low soil moisture; both acted as small net sinks for OCS in between (Fig. 1b). The two desert soils (D1 and D2, sand content ≥90 % determined according to ISO 11277) produced up to 3.3 to 9.56 pmol g−1 h−1 at high soil moisture, with fluxes declining as the soil dried out (Fig. 1c).
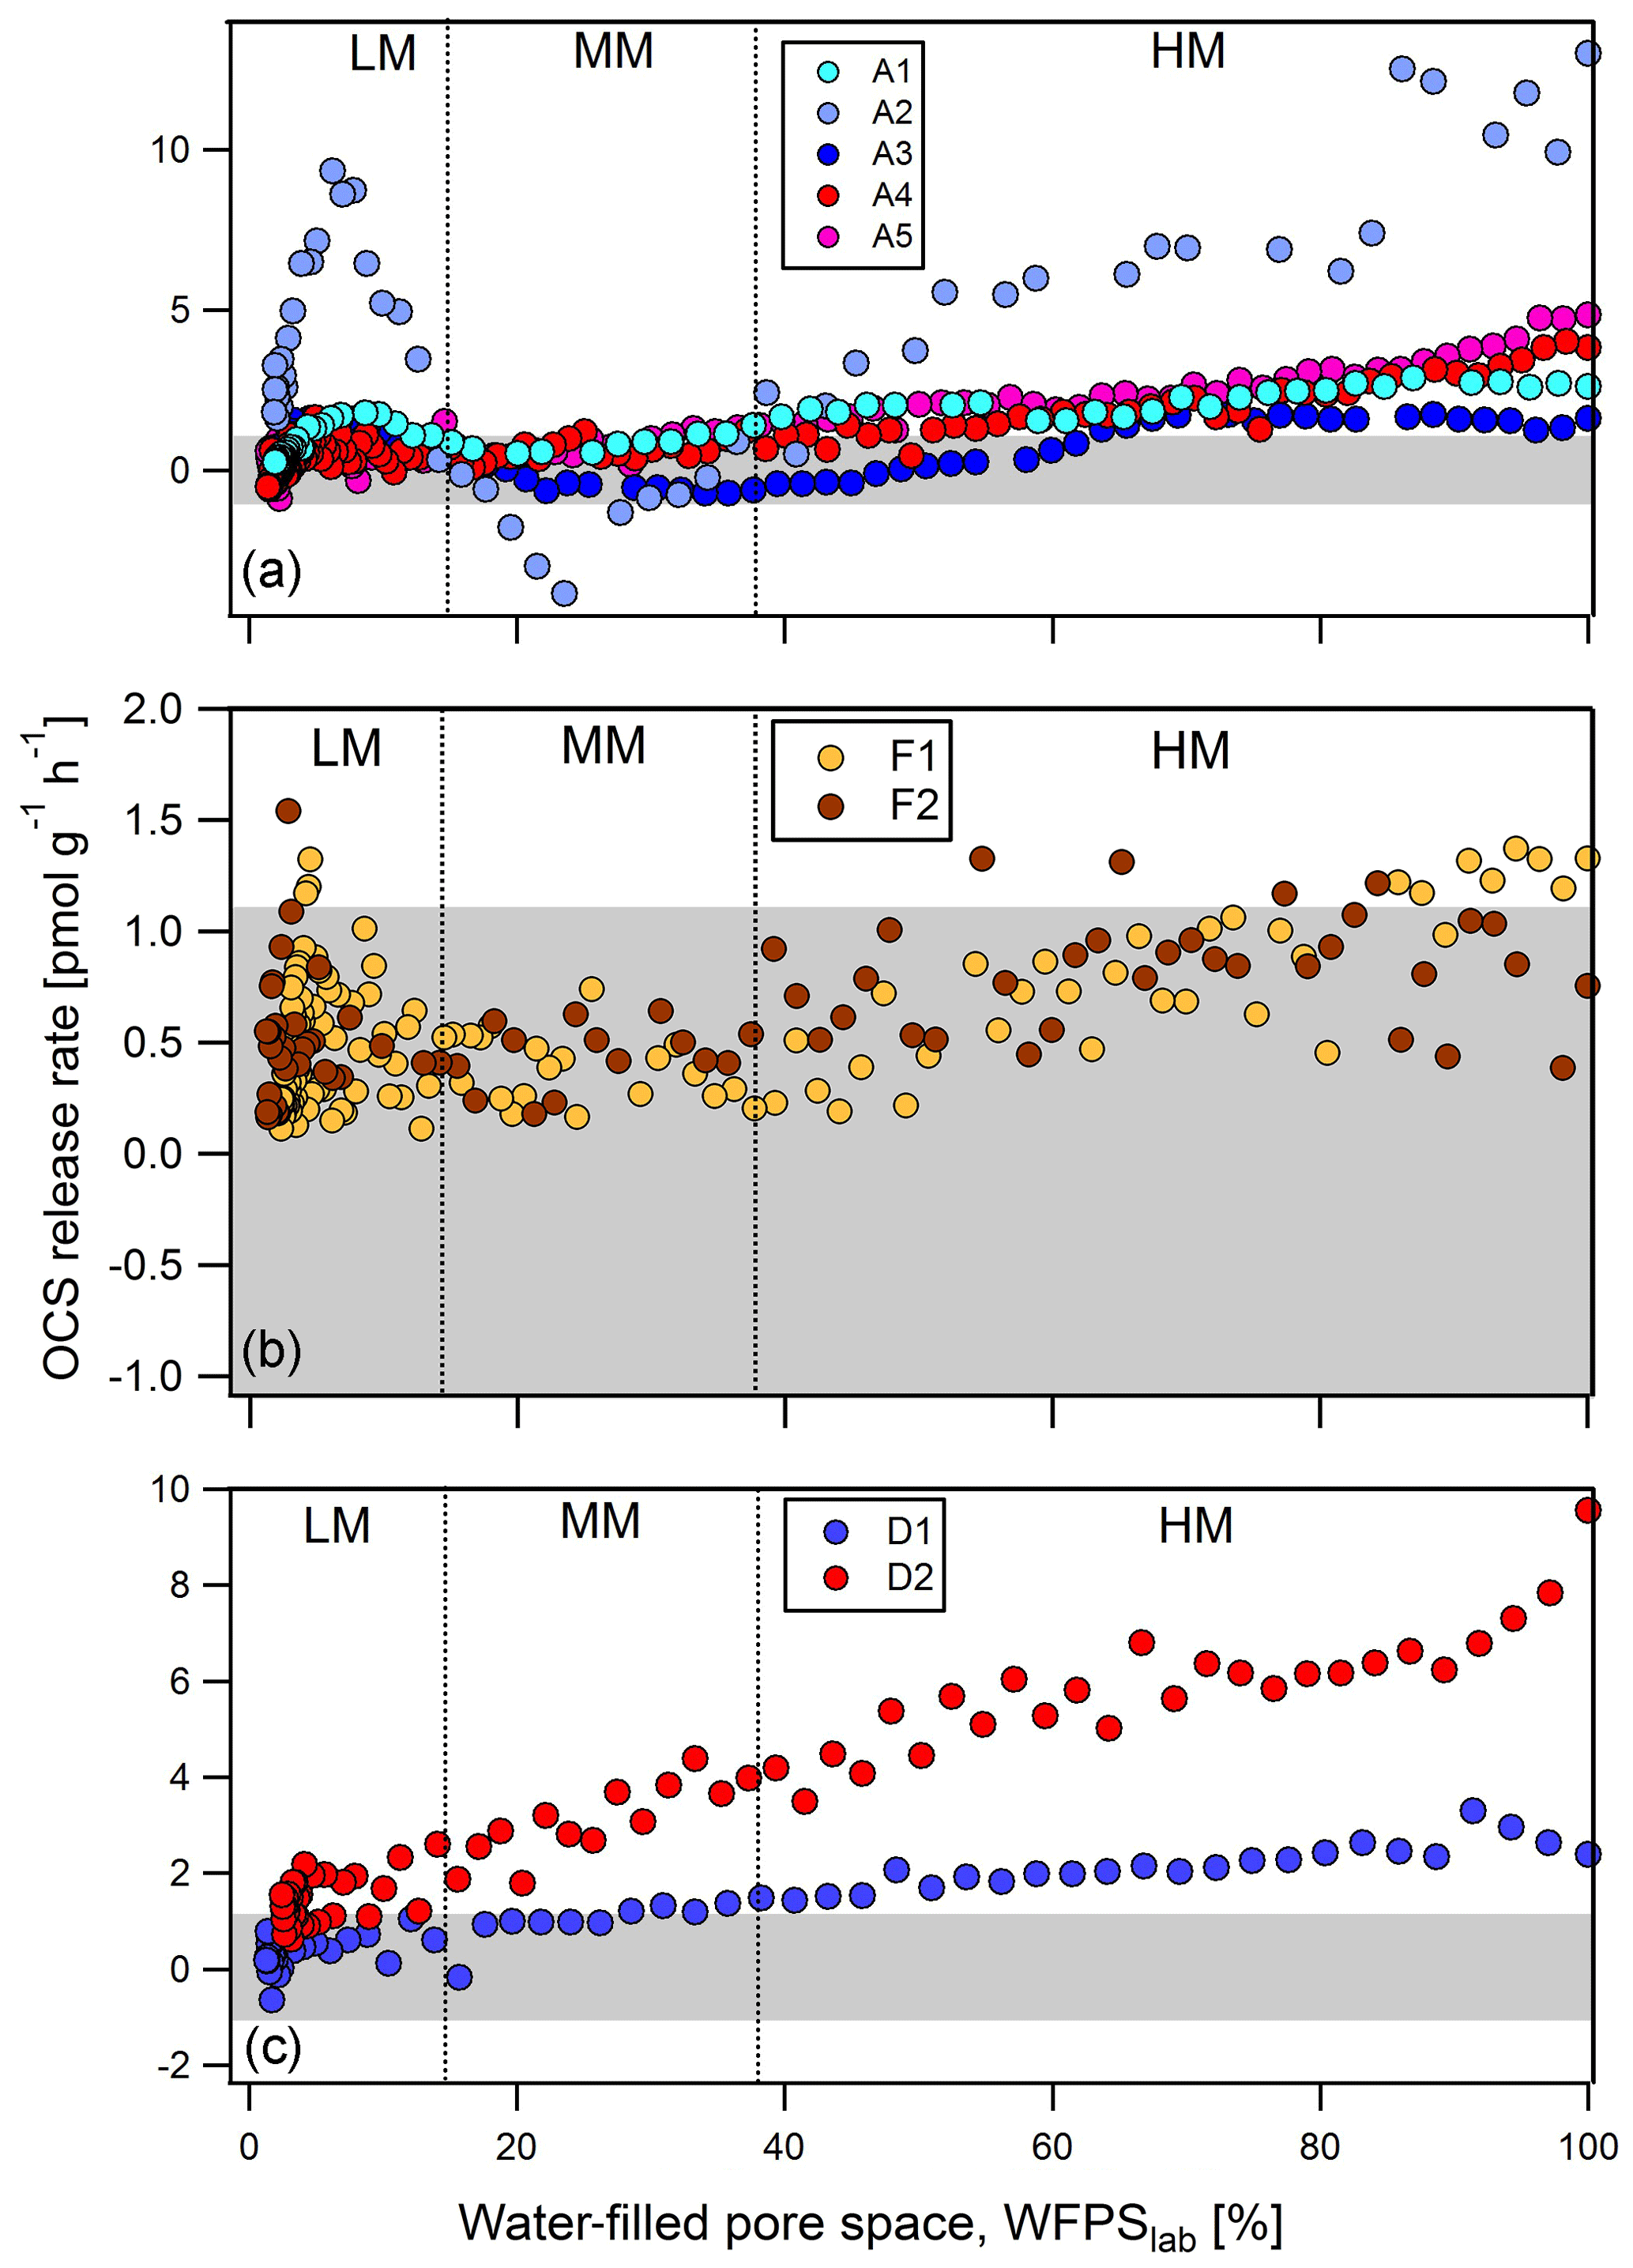
Figure 1OCS exchange rates from soil samples originated from agriculture (a) A1 to A5: cornfield (light blue), cornfield (blue), sugar beet (dark blue), wheat field (red), and grassland (pink); (b) F1, F2: natural rainforest (orange) and annual burned rainforest (brown); and (c) D1, D2: sand desert (blue) and sand desert (red) measured at 500 ppt OCS mixing ratio and 400 ppm CO2 mixing ratio. According to Bunk et al. (2017) OCS release rates are classified into high-moisture (HM), moderate-moisture (MM), and low-moisture (LM) regime. The y axis has different scales in subfigures. Data of A1, A2, and A3 are adapted from Bunk et al. (2019). Grey shaded area represents the threshold of 1.09 to −1.09 pmol g−1 h−1 where no significant OCS exchange could be detected.
We measured thiocyanate in soil extracts at the start of the dry-out experiments where high POCS was observed, because a pathway of thiocyanate hydrolase has been proposed for OCS production (POCS). Thiocyanate concentrations for the desert soils were very low, below detection for D1 (<0.5 mg kg−1; grey point in Fig. 2) and only 0.65 mg SCN− kg−1 for D2. For all other soils, thiocyanate concentrations ranged between 0.87 and 12.04 mg SCN− kg−1. For all soils except the agricultural soil (A2, not used in curve fitting), an increase in thiocyanate concentration coincided with a decrease in the maximum observed OCS exchange rate at WFPS > 37 %, OCSmax,HM (see Fig. 2). The maximum OCS exchange rate and thiocyanate concentration for the agricultural soil (A2, green circle) are considered outliers, possibly due to the release of thiocyanate from fine roots during the sieving procedure.

Figure 2Correlation between OCS exchange rate, OCSmax,HM, and thiocyanate (SCN−) at high soil moisture for samples F1, F2, A3, A4, and A5 (green). Thiocyanate was below limit of detection (LOD of 0.5 mg kg−1) for D1 soil (grey).
While the agricultural soils (A) and forest soils (F) showed similar patterns that included a second increase in OCS production at below 10 % WFPSlab, desert soils (D) only produced OCS. The different behavior for OCS exchange from desert soils may be related to differences in soil properties: desert soils (D) are characterized by high pH (carbonate contents of 1.89 % to 0.55 % for D1 and D2 soils, respectively) and high amount of total sulfur (0.13 % to 3.74 %). The highest concentrations from a desert soil (D2) and a cornfield soil (A2) correlated with the largest net OCS exchange rates (see Table 1). The high correlated with low maximum OCS exchange rate at the start of the experiment.
3.2 Fungal activity correlated with POCS and UOCS from a midlatitude cornfield soil (A1) over the range of soil moisture
The highly conserved 16S rRNA gene reflects differences in bacterial and archaeal populations. Overall, the sequencing approach did not result in significant differences in 16S rRNA relative abundance for bacterial classes for the cornfield soil (A1) fumigated at 50 versus 1000 ppt OCS at moderate soil moisture (Fig. 3). In contrast, for ITS RNA relative abundance of Ascomycota (p value = 0.006) indicated these were significantly more active under 1000 ppt OCS compared to 50 ppt OCS, which could suggest their importance for OCS exchange (Fig. 4). Within the phylum Ascomycota the largest difference in RNA relative abundance from 50 to 1000 ppt OCS resulted for the class Sordariomycetes (p value = 0.029). Within the phylum Basidiomycota (p value = 0.034) the largest difference in RNA relative abundance from 50 to 1000 ppt OCS was observed for the class Cystobasidiomycetes (p value = 0.009), which is also significantly more abundant in the OCS 1000 ppt samples. For the phylum Zygomycota the RNA relative abundance decreased from 50 to 1000 ppt OCS (p value = 0.035).
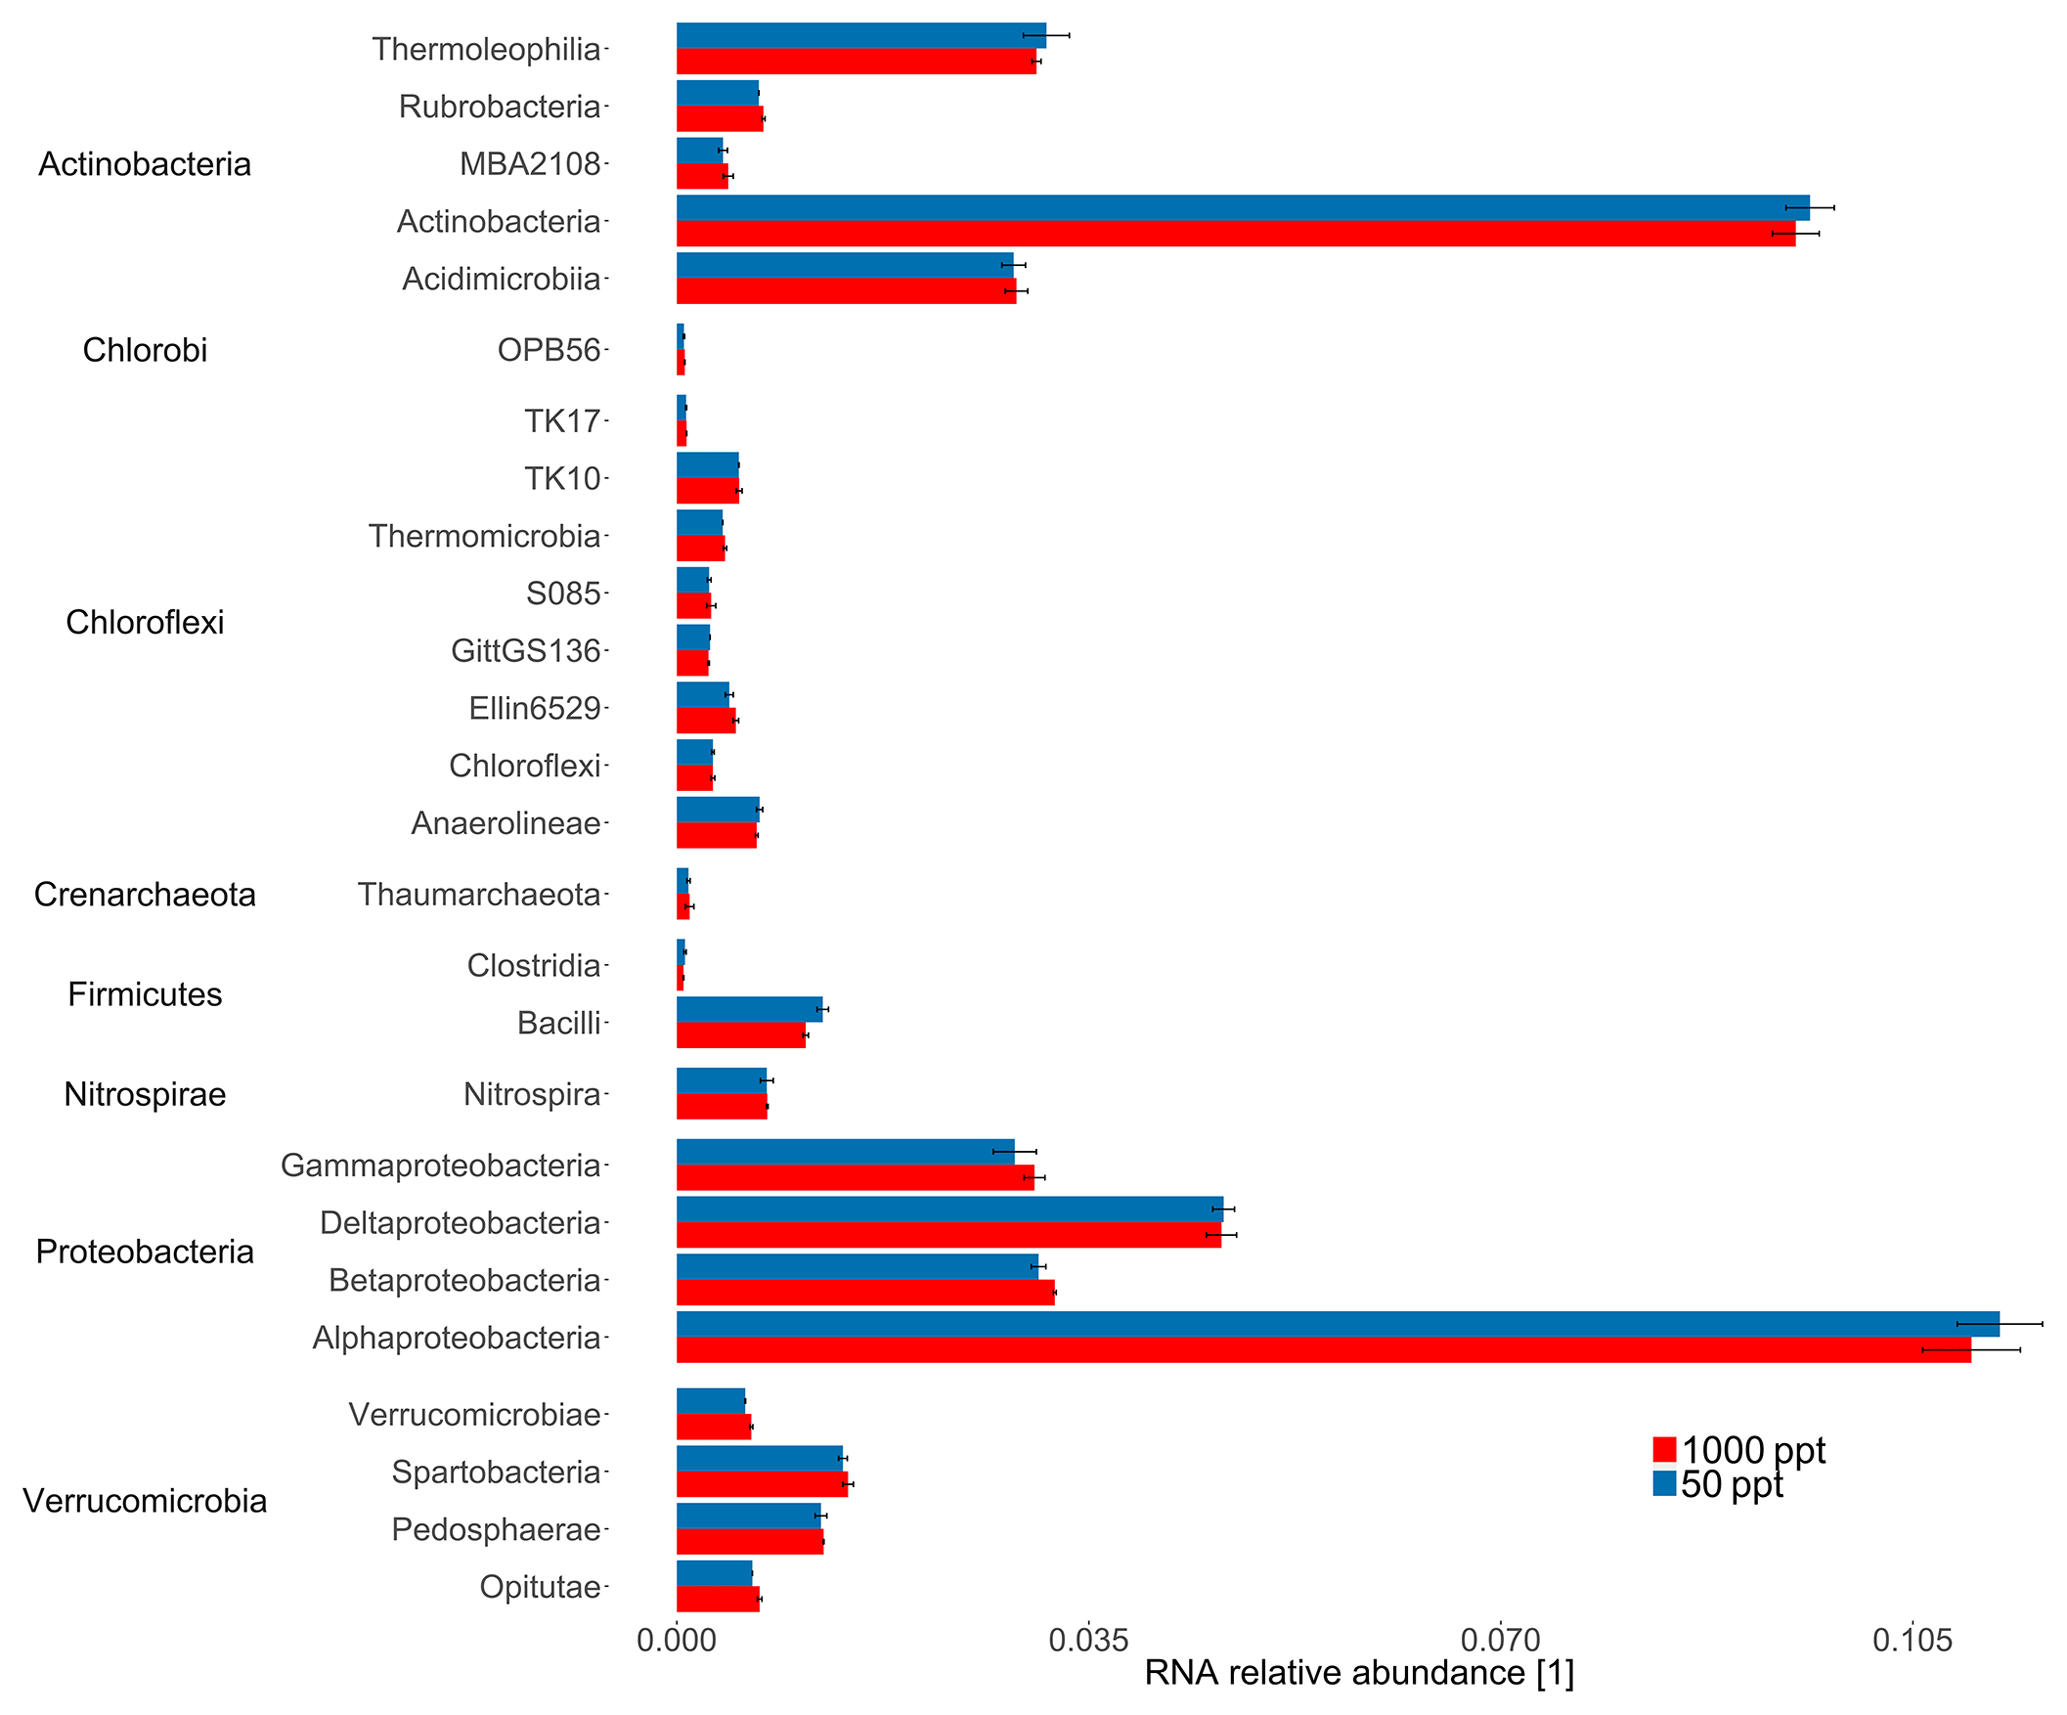
Figure 3Taxonomic composition of the midlatitude corn field soil in Mainz, Germany, at 22 % WFPSlab of the samples under 1000 or 50 ppt OCS. The 16S rRNA relative abundance for selected bacterial classes was normalized by the total number of assigned reads per sample. Classes with RNA relative abundance did not show significant differences and were not plotted. Error bars represent standard deviation. Asterisks represent statistically different values (p value < 0.05).
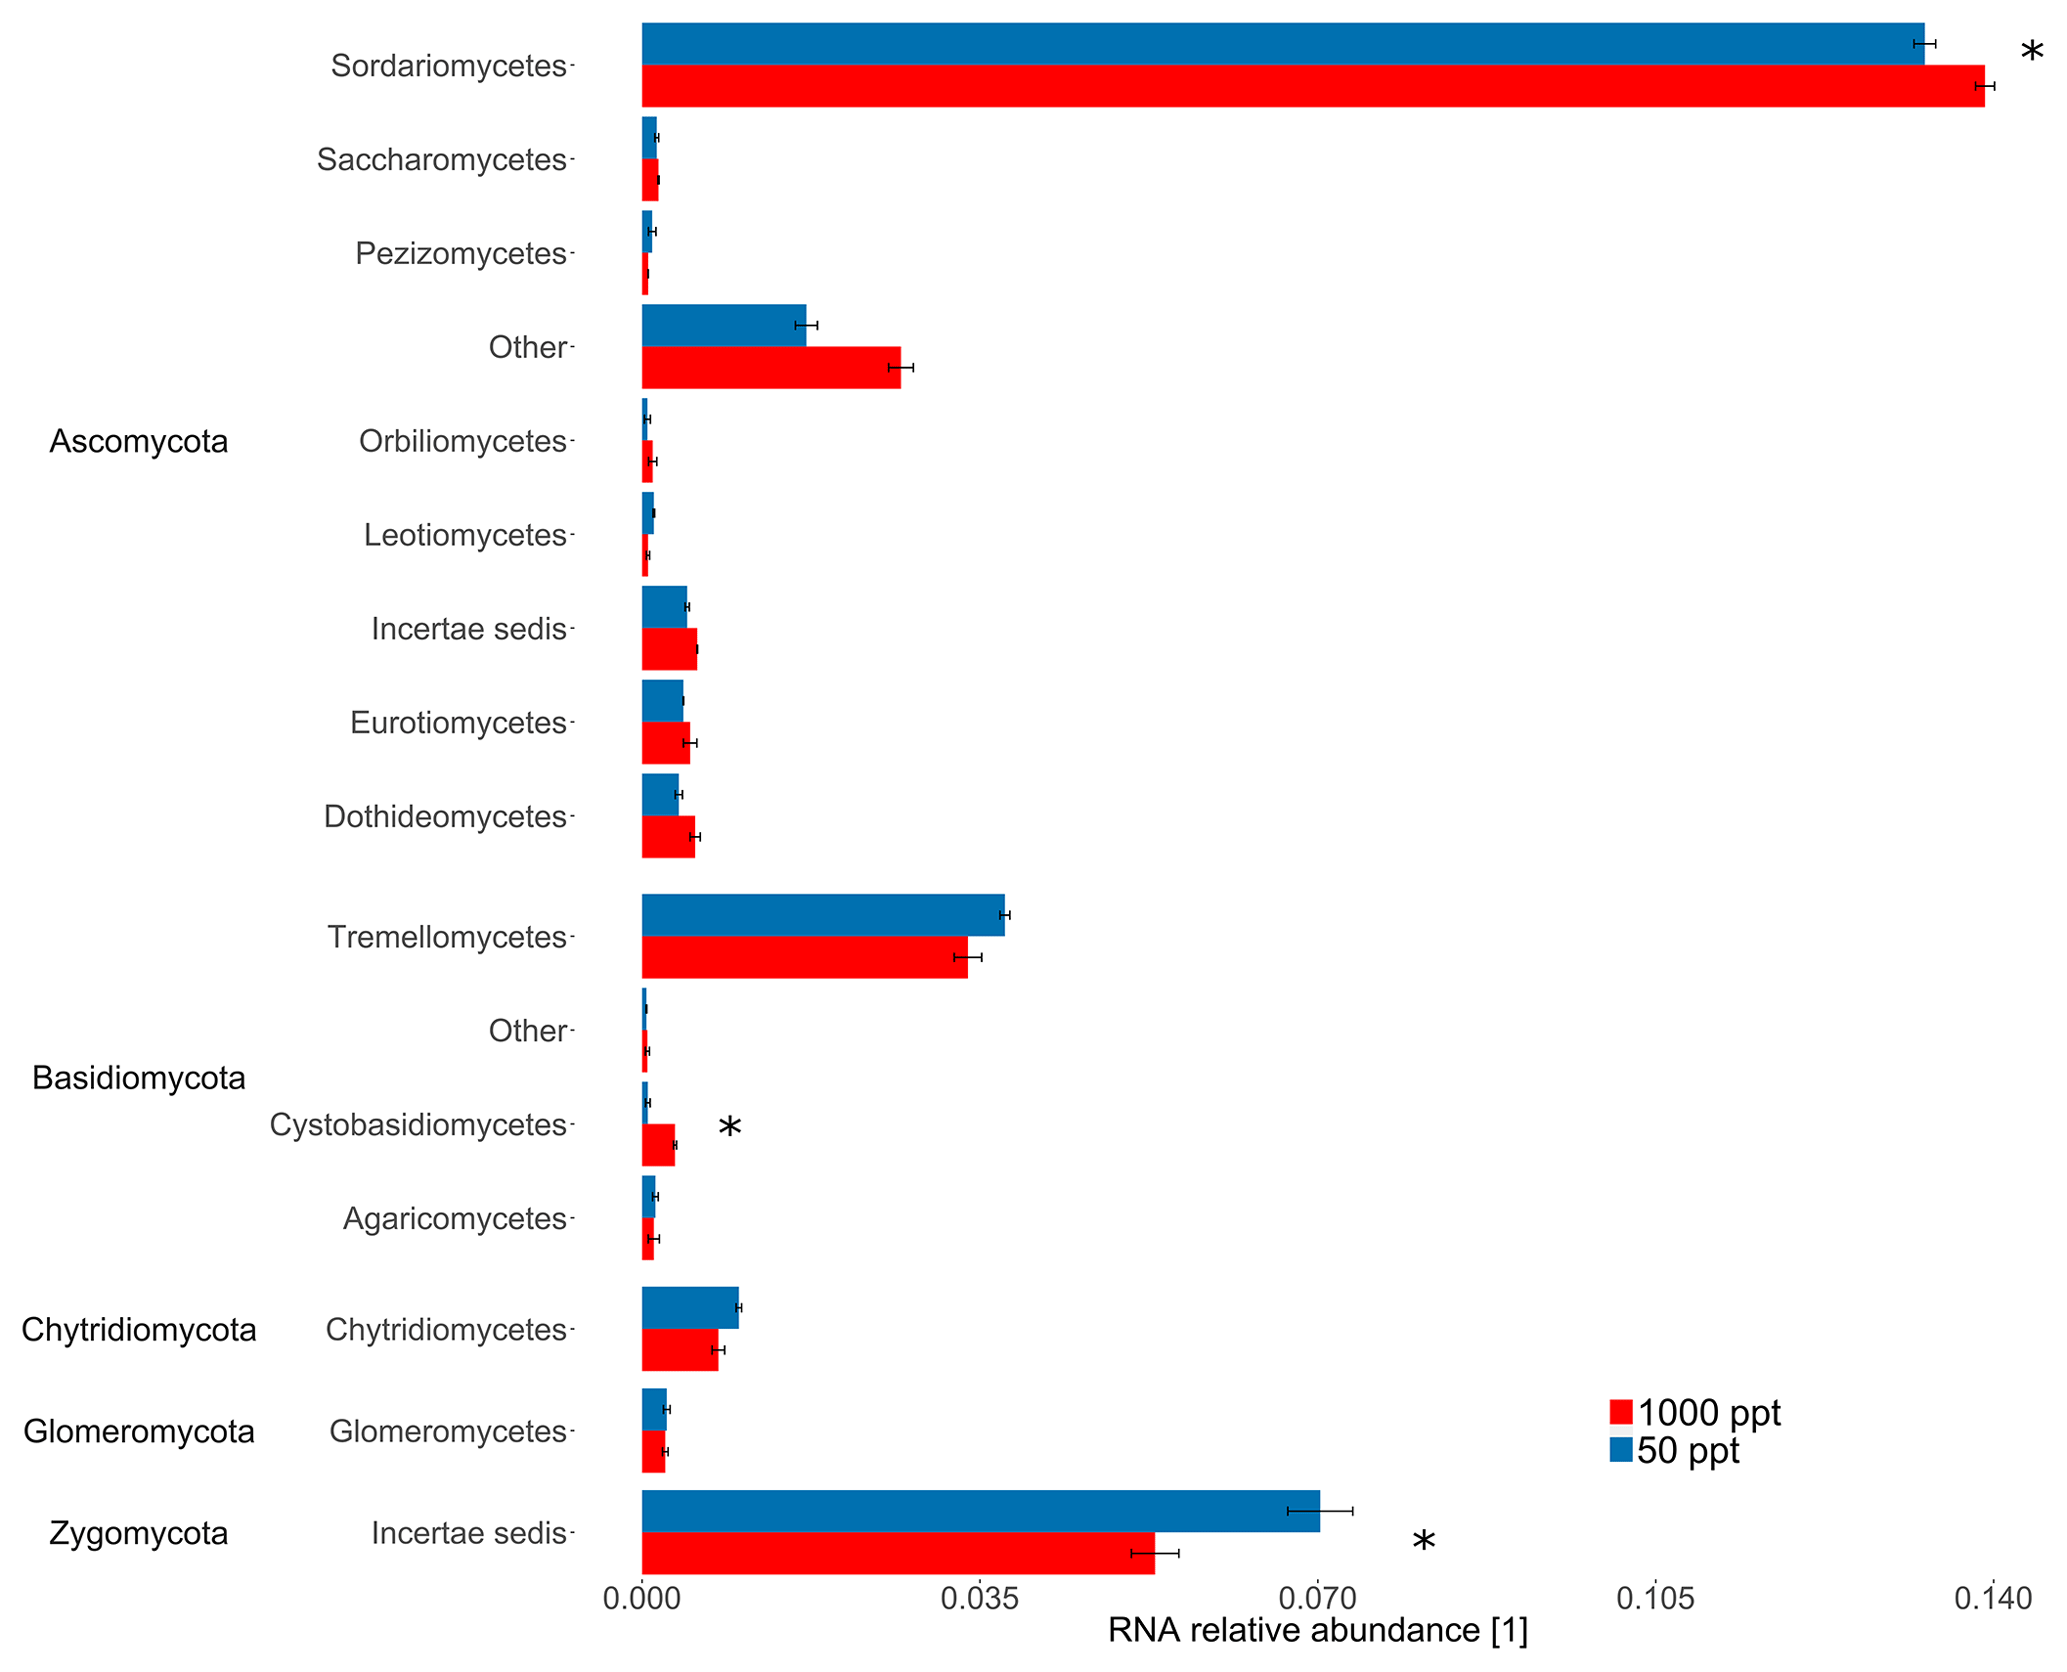
Figure 4Taxonomic composition of the midlatitude corn field soil in Mainz, Germany, at 22 % WFPSlab of the samples under 1000 or 50 ppt OCS. RNA relative abundance of internal transcribed spacer (ITS) for fungal classes was normalized by the total number of assigned reads per sample. Classes with RNA relative abundance did not show significant differences and were not plotted. Error bars represent standard deviation. Asterisks represent statistically different values (p value < 0.05). “Other” is identified by the QIIME pipeline, however with no known classification in the database, under the used threshold of sequence similarity (90 %).
3.3 Effect of [OCS] on NO release rate
For the investigation of the microbial groups involved in OCS production and consumption, we studied simultaneous OCS, NO (as a proxy for nitrification; see Fig. 5), and CO exchange for a fresh and 40 ∘C dried cornfield soil (A1) and a soil originated from a spruce forest (F3). The maximum NO release rate for the 40 ∘C dried cornfield sample (Fig. 5a) was 726.9 pmol g−1 h−1 at 50 ppt OCS and 1102.7 pmol g−1 h−1 at 1000 ppt OCS at 37 % WFPSlab, whereas for the fresh sample, NO rates were substantially lower (Fig. 6d). The soil sample from the spruce forest in Sparneck, Germany (F3), released maximal NO of 5579.5 pmol g−1 h−1 at 50 ppt OCS and 7159.4 pmol g−1 h−1 at 1000 ppt OCS and 41 % WFPSlab (Fig. 5b). The observed increase in NO release rate at 1000 ppt OCS compared to 50 ppt OCS suggests that microbial groups involved in the nitrogen cycle (e.g., nitrifiers), which utilize CA and rubisco, might have contributed to the simultaneous exchange of NO and OCS under moderate soil moisture. Interestingly, at 1000 ppt OCS its OCS release rate was lower (indicating OCS consumption increased) and coincided with low CO release compared to 50 ppt OCS under moderate soil moisture regime (see Fig. S2 in the Supplement).
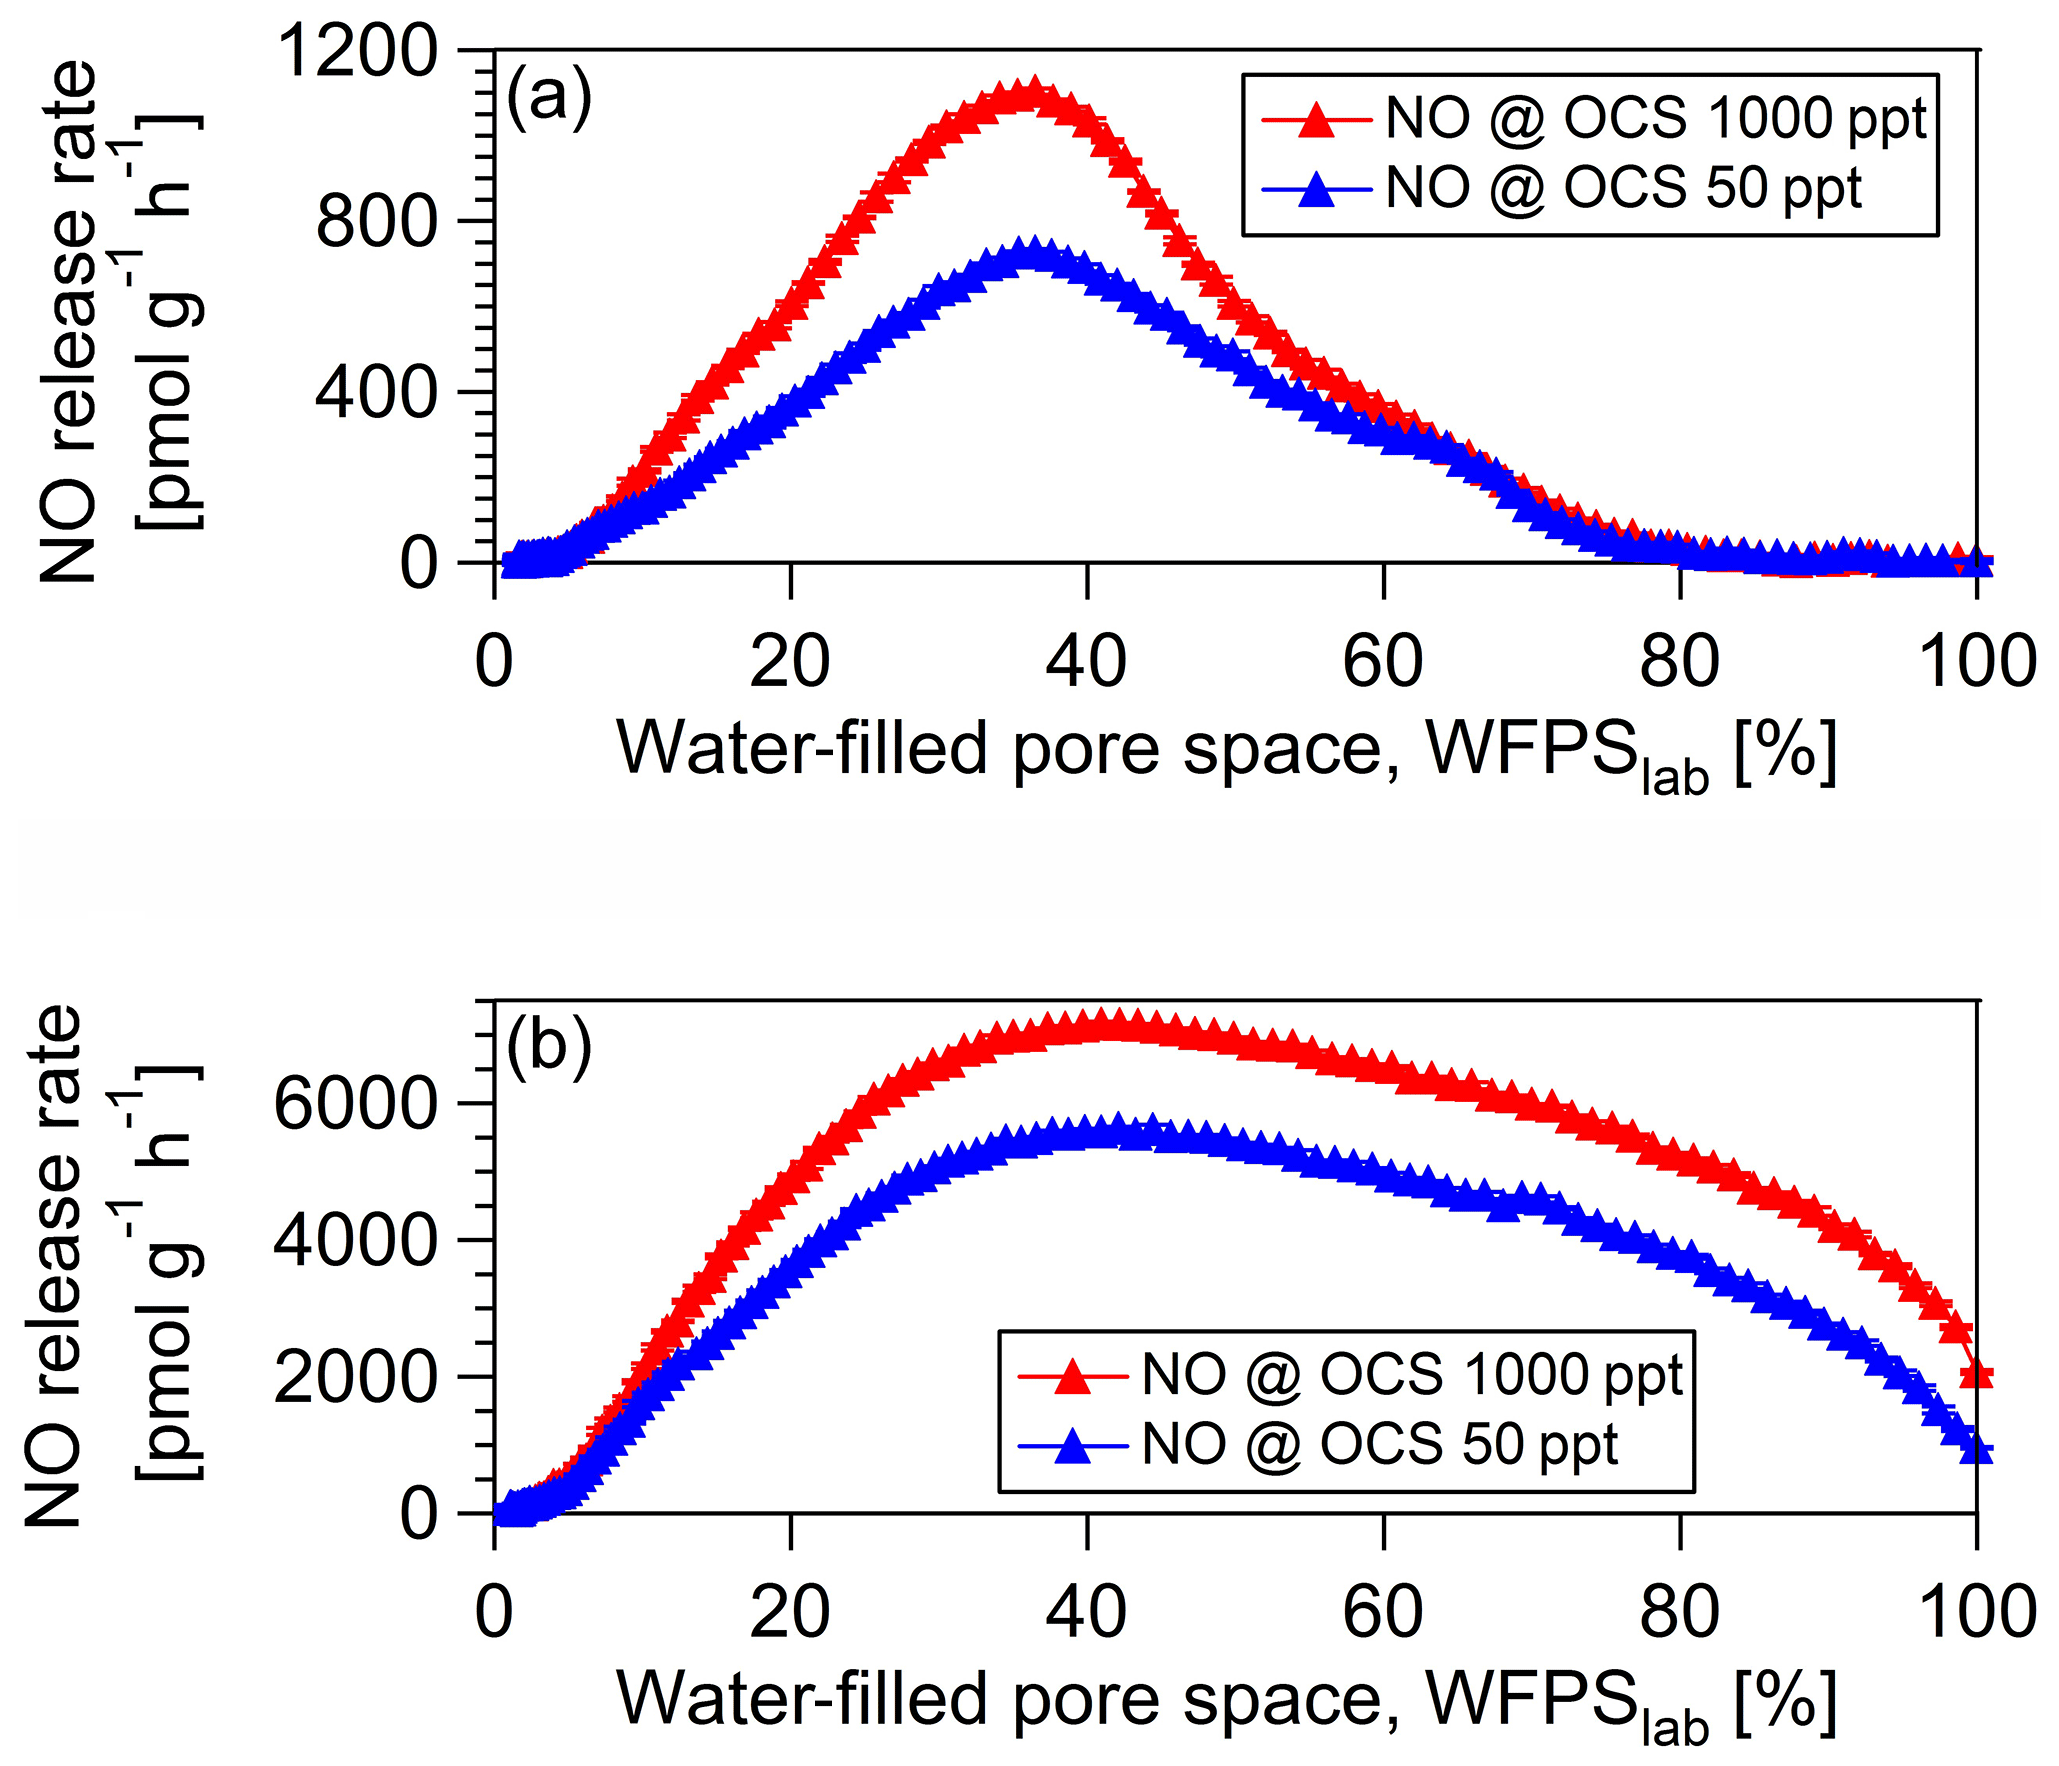
Figure 5NO exchange rates (a) are shown for a midlatitude cornfield soil sample 40 ∘C dried from Mainz, Germany (A1), and a soil sample originated from a spruce forest in Sparneck, Germany, at OCS mixing ratio of 50 ppt (blue) and 1000 ppt (red).
3.4 Effect of OCS fumigation on the archaeal and bacterial amoA and red-like cbbL gene transcripts (qPCR) from a midlatitude cornfield soil (A1)
The change in 16S rRNA relative abundance for bacteria (sequencing) could not resolve significant differences for a cornfield soil (A1) fumigated at 50 versus 1000 ppt OCS at moderate soil moisture (see Sect. 3.1). Hence, qPCR assays were used for the specific quantification of the AOB and AOA amoA and red-like cbbL gene transcripts. For the fresh soil sample from a cornfield (A1) 34 AOB amoA transcripts per nanogram extracted DNA were detected at 95 % WFPSlab with a continuous increase up to 221 transcripts per nanogram extracted DNA at 7 % WFPSlab, all at 50 ppt OCS (see Fig. 6). A total of 2193 AOA amoA transcripts per nanogram extracted DNA were detected at 33 % WFPSlab with a continuous increase up to 39 494 transcripts at 7 % WFPSlab at 50 ppt OCS (see Fig. 6). For red-like cbbL (rubisco) 13 463 transcripts per nanogram extracted DNA were detected at 95 % WFPSlab with a continuous increase up to 45 033 transcripts per nanogram extracted DNA at 7 % WFPSlab, all at 50 ppt OCS (see Fig. 6).
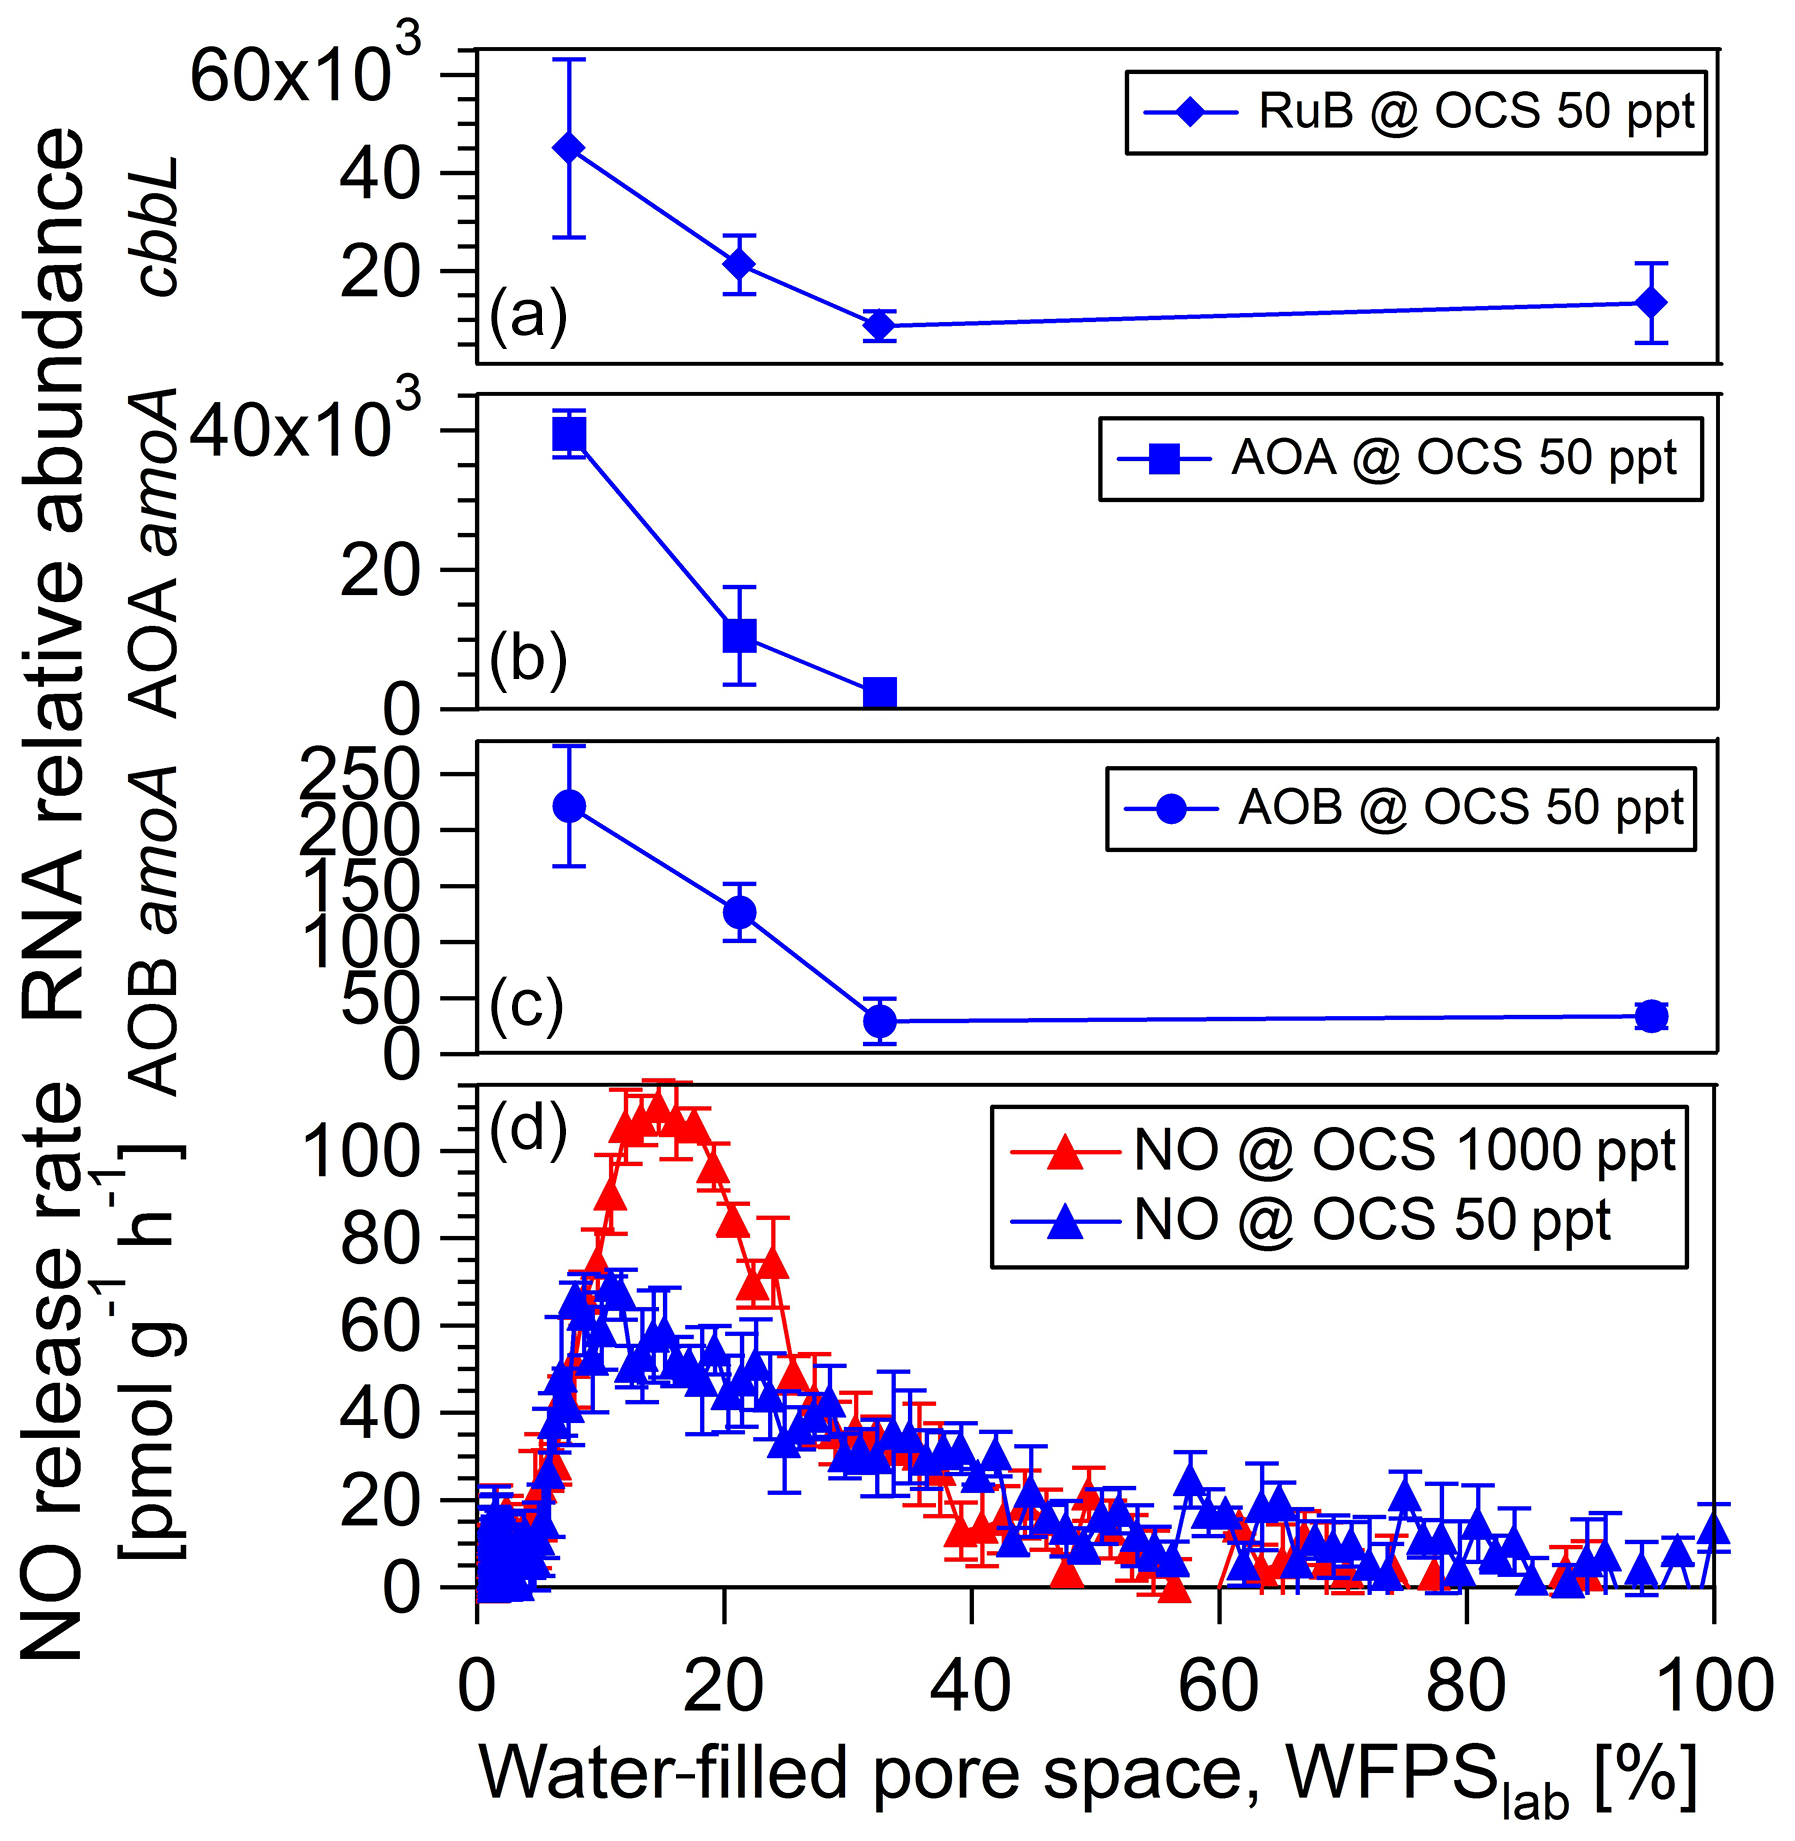
Figure 6RNA relative abundance of the cbbL functional gene, encoding ribulose-1,5-bisphosphate carboxylase (rubisco) large subunit type IA, measured over dry-out under 50 ppt OCS (blue diamonds, a). RNA relative abundance of the amoA functional gene for ammonia-oxidizing archaea (AOA; blue squares, b) and ammonia-oxidizing bacteria (AOB; blue points, c) measured over dry-out under 50 ppt OCS. NO exchange rates at 50 ppt (dark blue, d) and 1000 ppt (light blue, d) OCS mixing ratio are shown for the A1 soil sample from a midlatitude corn field, Mainz, Germany.
4.1 Interpretation of patterns of OCS exchange for rewetted and dried-out soils under ambient (500 ppt) OCS
OCS is produced by the degradation of various S compounds. Thiocyanate has been considered to be an important precursor for OCS (e.g., Conrad, 1996). Thus, it is likely that the OCS production rate is correlated with the concentration of thiocyanate as a dominant intermediate of organic S compound degradation. Lehmann and Conrad (1996) added sodium thiocyanate to soil samples and found an increase in OCS production. Nonetheless, there is indication that also organic compounds might be precursors of OCS in soil (Smith and Kelly, 1988; Kelly et al., 1993). In our study, all vegetated soils (i.e., not D1 and D2 desert soils) contained significant amounts of thiocyanate that likely were produced during decomposition of plant material (Bunk et al., 2017; Kelly et al., 1993). In the two tropical forest soils, thiocyanate and OCS fluxes were at or close to detection limits. Over a range of moisture conditions, these soils consume any OCS produced and provide a (barely detectable) sink for OCS from the atmosphere (Whelan et al., 2016; Sun et al., 2018).
The desert soils (D1 and D2), although exhibiting low thiocyanate concentrations, contained high bulk S, likely in the form of inorganic S compounds. In deserts such enrichments of inorganic salts are the result of long-term dry deposition (Michalski et al., 2004). Microorganisms might be able to produce OCS from sulfate (Meredith et al., 2018; Banwart and Bremner, 1976) or other S-containing precursors (Banwart and Bremner, 1975; Flöck et al., 1997; Lehmann and Conrad, 1996) and thus may have high rates of OCS production that do not depend on organic S availability. The positive OCS net fluxes from desert soils (D1 and D2) at 500 ppt OCS suggest that OCS consumption in these soils is, if at all present, only low. Low amounts of organic matter in these soils might limit the abundance and activity of heterotrophs, such as Actinobacteria (Ogawa et al., 2016). An alternative explanation is the inhibition of rubisco through high pH and the presence of carbonate (Lorimer and Pierce, 1989). Both inorganic and organic S availability control OCS production rates in general (e.g., Meredith et al., 2018; Banwart and Bremner, 1976; Banwart and Bremner, 1975; Flöck et al., 1997; Lehmann and Conrad, 1996), but rates of OCS consumption are controlled by different parameters (e.g., Kaisermann et al., 2018). And thus net soil OCS exchange and its relation to moisture is not linearly dependent on further controls.
There is already evidence that OCS exchange correlates with total nitrogen content (Kaisermann et al., 2018). In our study the highest nitrate concentrations correspond to maximum OCS net exchange under high soil moisture. This is in agreement with a nitrate fertilization study in which substantial increase in OCS net fluxes from forest soils was the consequence (Melillo and Steudler, 1989). The correlations of and concentration with OCS net release rate at the start of the experiment suggest that microbial nitrogen cycling is connected to OCS exchange.
4.2 Fungal activity correlated with POCS and UOCS from a midlatitude cornfield soil (A1) over the range of soil moisture
Carbonic anhydrase is thought to be the most important enzyme involved in OCS uptake (Bunk et al., 2017). Masaki et al. (2016) concluded that fungal species may contribute differently to OCS exchange in soils; although some were net consumers of OCS, pure cultures from strains of Umbelopsis/Mortierella sp. according to Masaki et al. (2016) were net producers of OCS. In our study, we found a significant difference in ITS RNA relative abundance for several fungi when OCS in ambient air was changed from 50 to 1000 ppt, indicating fungal sensitivity to OCS. Recent studies suggest that fungi containing CA might be responsible for OCS uptake (Ogawa et al., 2016; Bunk et al., 2017). In addition, enzymes involved in different CO2 fixation pathways, including the CBB cycle, hydroxypropionate–hydroxybutyrate cycle (HP–HB), anaplerotic reactions of heterotrophic microorganisms (PEPCO), or the Wood–Ljungdahl pathway, might play a role for OCS. For example, using a specific inhibitor for CA leads to changed OCS flux (Kesselmeier et al., 1999). A possible explanation for the large differences in OCS exchange among the various soils investigated here might be a niche separation (here soil moisture) of gene expression and activity maxima under different moisture conditions for different OCS-converting enzymes: at high soil moisture the OCS production by hydrolysis of organic S compounds might be the dominant process, while at moderate soil moisture consumption of OCS by CO2 assimilation might be the predominant process. Under moderate soil moisture we found a lower activity of Zygomycota and Tremellomycetes at 1000 ppt compared to 50 ppt OCS, whereas both Sordariomycetes (Ascomycota showed the highest RNA relative abundance of overall fungi in the midlatitude cornfield soil (A1) and Cystobasidiomycetes exhibited an increased metabolic activity (see Fig. 4).
Carbonic anhydrase is not a single enzyme but rather a group of five different families (α, β, γ, δ, and ζ). A recent study suggest that Actinobacteria contain a CA-like gene, to which also OCS hydrolases are similar (Ogawa et al., 2016). Thus, these bacteria may contain a hydrolase that might be specialized to uptake of OCS. The importance of phototrophs (eukaryotic algae) for OCS exchange was already demonstrated (Sauze et al., 2017). There is evidence that different CAs and likely other enzymes are involved in the OCS exchange (Meredith et al., 2019). CA is well known to act as an “upstream amplifier” for rubisco and PEPCO. Due to the similarity of the OCS and CO2 molecules, it seems reasonable that for OCS consumption the roles of rubisco and PEPCO might have been underestimated. There might be not only a bulk kcat and KM (Ogée, et al., 2016) but rather multiple parameters for diverse types of CA (Meredith et al., 2019) and maybe even for other enzymes such as rubisco (this study) necessary to fully understand and model the microbial OCS production and consumption from soils.
4.3 Effect of [OCS] on NO release rate
While in other studies the OCS production and consumption are disentangled by utilizing different inlet mixing ratios (Kaisermann et al., 2018), we introduce a new concept of measuring different gases, such as NO release rate (as a proxy for nitrification), simultaneously to OCS exchange rates to better understand which microbial groups are involved in OCS production and consumption. Interestingly under moderate soil moisture conditions, where the lowest OCS net release at 1000 ppt OCS occurred (see Fig. S1 in the Supplement), maximum NO release rates were detected. Under moderate to low soil moisture, NO net production is predominantly accepted to originate from nitrification (e.g., Oswald et al., 2013). NO release rates increased under elevated OCS fumigation, which agrees with our results. Based on the correlations with and concentrations (Sect. 4.1), we hypothesize that microbial groups involved in the nitrogen cycle (e.g., nitrifiers and potentially denitrifiers) are involved in the OCS exchange. Interestingly, at 1000 ppt OCS its release was lower (indicating OCS consumption increased) and coincided with low CO release compared to 50 ppt OCS under moderate soil moisture (see Fig. S2 in the Supplement). It is worth noting the correlation of OCS and CO exchange rates (see Figs. S1 and S2 in the Supplement), but, given the lack of CO ambient mixing ratios at the inlet and the lack of CO dehydrogenase activity measurement, we cannot fully explain that result.
4.4 Effect of OCS fumigation on the 16S rRNA relative abundance of archaeal and bacterial amoA and red-like cbbL gene transcripts (qPCR)
Despite the evidence of nitrogen-dependent OCS exchange, the mechanisms are not understood (Kaisermann et al., 2018; Melillo and Steudler, 1989). Fungi are considered to be relevant OCS consumers utilizing CA over the whole range of soil moisture (Bunk et al., 2017). However, there is increasing evidence that OCS consumption is not performed by a single metabolic process (Sauze et al., 2017; Meredith et al., 2019; our study). Our data suggest that indeed CA plays an important role for OCS exchange, but also for further enzymes (e.g., rubisco) being involved in CO2 assimilation. At high soil moisture, anaerobes such as acetogens, methanogens, and sulfate reducers might have been active and capable of catalyzing the oxidation of CO via CODH via the Wood–Ljungdahl pathway to fix CO2 (Davidova et al., 1993; Ragsdale, 2004). Since the incubations were performed under oxic conditions and CO production was observed from the soil (inlet air was free of CO), the contribution of CO consumption via the Wood–Ljungdahl pathway from anaerobic pockets at elevated soil moisture range might have been underestimated. Under moderate soil moisture, reduced CO production may be mainly attributed to the activity of aerobic CO2-assimilating microorganisms (Bédard and Knowles, 1989; Jones and Morita, 1983; Jones et al., 1984; Bender and Conrad, 1994) with minor importance of the aerobic CODH pathway (Conrad et al., 1981). Our study suggests that under moderate soil moisture prokaryotic autotrophs, Sordariomycetes (Ascomycota), and Cystobasidomycetes were dominant OCS consumers in the midlatitude agricultural soil (A1). Our study highlights how gene expression information of enzymes involved in CO2 fixation combined with the simultaneous assessment of NO and CO as well as OCS exchange is useful for understanding the complex microbial controls on net OCS exchange from soils.
We restricted the discussion of the microbial groups involved in OCS consumption to fungi since the involvement of bacterial groups would have required a more specific approach such as stable isotope probing to prove their involvement. The strength of our study is the proven correlations of OCS net exchange to , , and NO exchange and functional genes (AOB, AOA amoA and red-like cbbL rubisco over drying out at 50 ppt OCS).
Fungi are considered to be dominant microbial OCS consumers in the literature, which may utilize CA over the whole range of soil moisture (Bunk et al., 2017). However, there is increasing evidence that OCS consumption is not performed by a single metabolic process (Kaisermann et al., 2018; Sauze et al., 2017; Meredith et al., 2019; this study). Our data suggest that indeed CA plays an important role for OCS exchange, but the role of other enzymes involved in CO2 fixation might have been underestimated. At high soil moisture creating anoxia, acetogens, methanogens, and sulfate reducers are capable of catalyzing the oxidation of CO (Davidova et al., 1993; Ragsdale, 2004). Our study suggests that under moderate soil moisture autotrophs (e.g., AOB), Sordariomycetes (Ascomycota), and Cystobasidomycetes are likely the dominant OCS consumers in the midlatitude agricultural soil (A1). Our study highlights that simultaneous assessment of enzymes involved in CO2 assimilation and simultaneous assessment of NO and potentially CO as well as OCS exchange are useful for disentangling the complex microbial controls of net OCS exchange from soils. Our study is the first assessment of the environmental significance of different microbial groups producing and consuming OCS by various enzymes other than CA. A combination of stable isotope probing (e.g., Eyice et al., 2015) with 32S-labeled OCS plus metagenomics is required to prove our conclusions that further enzymes beyond CA are involved in OCS conversion. Our study is a first important step towards the understanding of the mechanism of microbial OCS consumption and production in soils.
Raw sequencing data were deposited in the NCBI SRA accession number SRP121207, BioProjectID PRJNA415548. Data for trace gas release are stored in a database (http://bexis2.uni-jena.de/, last access: 28 February 2019) and are available on request.
The supplement related to this article is available online at: https://doi.org/10.5194/soil-5-121-2019-supplement.
TB was responsible for sample collection and performed the laboratory experiments with RB. TB extracted the nucleic acids and analyzed the data together with ZY. ECPC and ES performed qPCR analysis, and ECPC evaluated the qPCR results and sequencing results. TB wrote the paper. JK and ST supervised the project and commented on the paper. SK contributed to the evaluation of qPCR results and writing the paper. All authors have contributed to writing and editing the manuscript.
The authors declare that they have no conflict of interest.
The work has been funded by the Max Planck Society and Deutsche
Forschungsgemeinschaft (DFG) CRC 1076 “AquaDiva”. We thank
Alexander Moravek, Dianming Wu, and Moawad Badawy for support in collecting
the soil samples.
The article processing
charges for this open-access
publication were covered by the
Max Planck Society.
Edited by: Asmeret Asefaw
Berhe
Reviewed by: three anonymous referees
Abarenkov, K., Nilsson, R. H., Larsson, K. H., Alexander, I. J., Eberhardt, U., Erland, S., Høiland, K., Kjøller, R., Larsson, E., Pennanen, T., Sen, R., Taylor, A. F. S., Tedersoo, L., Ursing, B. M., Vrålstad, T., Liimatainen, K., Peintner, U., and Kõljalg, U.: The UNITE database for molecular identification of fungi – recent updates and future perspectives, New Phytol., 186, 281–285, 2010.
Alber, B. E.: Autotrophic CO2 Metabolism, in: Encyclopedia of Microbiology edited by: Schaechter, M., Elsevier, Heidelberg, Germany, 18–31, 2009.
Badger, M. R. and Bek, E. J.: Multiple Rubisco forms in proteobacteria: their functional significance in relation to CO2 acquisition by the CBB cycle, J. Exp. Bot., 59, 1525–1541, 2008.
Baldrian, P., Kolařik, M., Stursová, M., Kopecký, J., Valášková, V., Větrovský, T., Zifčáková, L., Snajdr, J., Rídl, J., Vlček, C., and Voříšková, J.: Active and total microbial communities in forest soil are largely different and highly stratified during decomposition, ISME J., 6, 248–258, https://doi.org/10.1038/ismej.2011.95, 2012.
Banwart, W. L. and Bremner, J. M.: Formation of volatile sulfur compounds by microbial decomposition of sulfur-containing amino acids in soils, Soil Biol. Biochem., 7, 359–364, 1975.
Banwart, W. L. and Bremner, J. M.: Volatilization of sulfur from unamended and sulfate-treated soils, Soil Biol. Biochem., 8, 19–22, 1976.
Bédard, C. and Knowles, R.: Physiology, biochemistry and specific inhibitors of CH4, and CO oxidation by methanotrophs and nitrifiers, Microbiol. Rev., 53, 68–84, 1989.
Behrendt, T., Veres, P. R., Ashuri, F., Song, G., Flanz, M., Mamtimin, B., Bruse, M., Williams, J., and Meixner, F. X.: Characterisation of NO production and consumption: new insights by an improved laboratory dynamic chamber technique, Biogeosciences, 11, 5463–5492, https://doi.org/10.5194/bg-11-5463-2014, 2014.
Bender, M. and Conrad, R.: Microbial oxidation of methane, ammonium and carbon monoxide, and turnover of nitrous oxide and nitric oxide in soils, Biogeochemistry, 27, 97–112, 1994.
Berry, J., Wolf, A., Campbell, E., Baker, I., Blake, N., Blake, D., Denning, A. S., Kawa, R., Montzka, S. A., Seibt, U., Stimler, K., Yakir, D., and Zhu, Z.: A coupled model of the global cycles of carbonyl sulfide and CO2: A possible new window on the carbon cycle, J. Geophys. Res.-Biogeo., 118, 842–852, https://doi.org/10.1002/jgrg.20068, 2013.
Blazewicz, S. J., Barnard, R. L., Daly, R. A., and Firestone, M. K.: Evaluating rRNA as an indicator of microbial activity in environmental communities: limitations and uses, ISME J., 7, 2061–2068, 2013.
Blezinger, S., Wilhelm, C., and Kesselmeier, J.: Enzymatic consumption of carbonyl sulfide (COS) by marine algae, Biogeochemistry, 48, 185–197, 2000.
Blonquist, J. M., Montzka, S. A., Munger, W., Yakir, D., Desai, A. R., Dragoni, D., Griffis, T. J., Monson, R. K., Scott, R. L., and Bowling, D. R.: The potential of carbonyl sulfide as a proxy for gross primary production at flux tower sites, J. Geophys. Res., 116, G04019, https://doi.org/10.1029/2011JG001723, 2011.
Brühl, C., Lelieveld, J., Crutzen, P. J., and Tost, H.: The role of carbonyl sulphide as a source of stratospheric sulphate aerosol and its impact on climate, Atmos. Chem. Phys., 12, 1239–1253, https://doi.org/10.5194/acp-12-1239-2012, 2012.
Bunk, R., Behrendt, T., Yi, Z., Andreae, M. O., and Kesselmeier, J.: Exchange of carbonyl sulfide (OCS) between soils and atmosphere under various CO2 concentrations, J. Geophys. Res.-Biogeo., 122, 1343–1358, https://doi.org/10.1002/2016JG003678, 2017.
Bunk, R., Yi, Z., Behrendt, T., Wu, D., Andreae, M. O., and Kesselmeier, J.: Carbonyl sulfide (OCS) exchange between soils and the atmosphere affected by soil moisture and compensation points, Biogeosciences Discuss., https://doi.org/10.5194/bg-2018-20, 2018.
Campbell, J. E., Carmichael, G. R., Chai, T., Mena-Carrasco, M., Tang, Y., Blake, D. R., Blake, N. J., Vay, S. A., Collatz, G. J., Baker, I., Berry, J. A., Montzka, S. A., Sweeny, C., Schnoor, J. L., and Stanier, C. O.: Photosynthetic control of atmospheric carbonyl sulfide during the growing season, Science, 322, 1085–1088, 2008.
Campbell, J. E., Berry, J. A., Seibt, U., Smith, S. J., Montzka, S. A., Launois, T., Belviso, S., Bopp, L., and Laine, M.: Large historical growth in global terrestrial gross primary production, Nature, 544, 84–87, https://doi.org/10.1038/nature22030, 2017.
Caporaso, J. G., Kuczynski, J., Stombaugh, J., Bittinger, K., Bushman, F. D., Costello, E. K., Fierer, N., Gonzalez Pena, A., Goodrich, J. K., Gordon, J. I., Huttley, G. A., Kelley, S. T., Knights, D., Koenig, J. E., Ley, R. E., Lozupone, C. A., McDonald, D., Muegge, B. D., Pirrung, M., Reeder, J., Sevinsky, J. R., Turnbaugh, P. J., Walters, W. A., Widmann, J., Yatsunenko, T., Zaneveld, J., and Knight, R.: QIIME allows analysis of high-throughput community sequencing data, Nat. Methods, 7, 335–336, https://doi.org/10.1038/nmeth.f.303, 2010.
Catão, E. C. P., Lopes, F. A. C., Rubini, M. R., Nardoto, G. B., Prosser, J. I., and Krüger, R. H.: Short-term impact of soybean management of ammonia oxidizers in a Brazilian savanna under restoration as revealed by coupling different techniques, Biol. Fert. Soils, 52, 1–12, 2016.
Conrad, R.: Soil Microorganisms as Controllers of Atmospheric Trace Gases (H2, CO, CH4, OCS, N2O, and NO), Microbiol. Rev., 60, 609–640, 1996.
Conrad, R. and Seiler, W.: Influence of temperature, moisture, and organic carbon on the flux of H2 and CO between soil and atmosphere: Field studies in subtropical regions, J. Geophys. Res.-Atmos., 90, 5699–5709, https://doi.org/10.1029/JD090iD03p05699, 1985.
Conrad, R., Meyer, O., and Seiler, W.: Role of carboxydobacteria in consumption of atmospheric carbon monoxide by soil, Appl. Environ. Microbiol., 42, 211–215, 1981.
Cousins, A., Baroli, I., Badger, M. R., Ivakov, A., Lea, P. J., Leegood, R. C., and von Caemmerer, S.: The Role of Phosphoenolpyruvate Carboxylase during C4 Photosynthetic Isotope Exchange and Stomatal Conductance, Plant Physiol., 145, 1006–1017, https://doi.org/10.1104/pp.107.103390, 2007.
Davidova, M. N., Tarasova, N. B., Mukhitova, F. K., and Karpilova, I. U.: Carbon monoxide in metabolism of anaerobic bacteria, Can. J. Microbiol., 40, 417–425, 1993.
Environment Agency: Determination of thiocyanate by alkaline extraction of soil samples followed by spectrophotometric determination using chloramine-T-isonicotinic acid and 1,3-dimethylbarbituric acid, Leicestershire, UK, 1–60, available at: http://www.environment-agency.gov.uk/nls (last access: 24 April 2017), 2011.
Erb, T. J.: Carboxylases in Natural and Synthetic Microbial Pathways, Appl. Environ. Microbiol., 77, 8466–8477, https://doi.org/10.1128/AEM.05702-11, 2011.
Eyice, O., Namura, M., Chen, Y., Mead, A., Samavedam, S., and Schäfer, H.: SIP metagenomics identifies uncultivated Methylophilaceae as dimethylsulfide degrading bacteria in soil and lake sediment, ISME J., 9, 2336–2348, 2015.
Flöck, O. R., Andreae, M. O., and Dräger, M.: Environmentally relevant precursors of carbonyl sulfide in aquatic systems, Mar. Chem., 59, 71–85, 1997.
Inman, R. E. and Ingersoll, R. B.: Note on the uptake of carbon monoxide by soil fungi, JAPCA J. Air Waste. Ma., 21, 646–647, 1971.
Jones, R. D. and Morita, R. Y.: Effects of various parameters on carbon monoxide oxidation by ammonium oxidizers, Can. J. Microbiol., 30, 894–899, 1983.
Jones, R. D., Morita, R. Y., and Griffiths, R. P.: Method for estimating in situ chemolithotrophic ammonium oxidation using carbon monoxide oxidation, Mar. Ecol.-Prog. Ser., 17, 259–269, 1984.
Kaisermann, A., Ogée, J., Sauze, J., Wohl, S., Jones, S. P., Gutierrez, A., and Wingate, L.: Disentangling the rates of carbonyl sulfide (COS) production and consumption and their dependency on soil properties across biomes and land use types, Atmos. Chem. Phys., 18, 9425–9440, https://doi.org/10.5194/acp-18-9425-2018, 2018.
Kamezaki, K., Hattori, S., Ogawa, T., Toyoda, S., Kato, H., Katayama, Y., and Yoshida, N.: Sulfur Isotopic Fractionation of Carbonyl Sulfide during Degradation by Soil Bacteria, Environ. Sci. Technol., 50, 3537–3544, https://doi.org/10.1021/acs.est.5b05325, 2016.
Katayama, Y., Narahara, Y., Inoue, Y., Amano, F., Kanagawa, T., and Kuriaishi, H.: A thiocyanate hydrolase of Thiobacillus thioparus: a novel enzyme catalizing the formation of carbonyl sulfide from thiocyanate, J. Biol. Chem., 267, 9170–9175, 1992.
Kelly, D. P., Malin, G., and Wood, A. P.: Microbial transformations and biogeochemical cycling of one-carbon substrates containing Sulphur, nitrogen or halogens, in: Microbial Growth on C1 Compounds, edited by: Murrell, J. C. and Kelly, D. P., Intercept, Andover, Mass., 47–63, 1993.
Kesselmeier, J., Teusch, N., and Kuhn, U.: Controlling variables for the uptake of atmospheric carbonyl sulfide by soil, J. Geophys. Res., 104, 11577–11584, 1999.
King, G. M. and Weber, C. F.: Distribution, diversity and ecology of aerobic CO-oxidizing bacteria, Nat. Rev. Microbiol., 5, 107–118, 2007.
Klindworth, A., Pruesse, E., Schweer, T., Peplles, J., Quast, C., Horn, M., and Glöckner, F. O.: Evaluation of general 16S ribosomal RNA gene PCR primers for classical and next-generation sequencing-based diversity studies, Nucleic Acids Res., 41, 1–11, 2013.
Könneke, M., Schubert, D. M., Brown, P. C., Hügler, M., Standfest, S., Schwander, T., Schada von Borzyskowski, L., Erb, T. J., Stahl, D. A., and Berg, I. A.: Ammonia-oxidizing archaea use the most energy-efficient aerobic pathway for CO2 fixation, P. Natl. Acad. Sci. USA, 111, 8239–8244, https://doi.org/10.1073/pnas.1402028111, 2014.
Kooijmans, L. M. J., Uitslag, N. A. M., Zahniser, M. S., Nelson, D. D., Montzka, S. A., and Chen, H.: Continuous and high-precision atmospheric concentration measurements of COS, CO2, CO and H2O using a quantum cascade laser spectrometer (QCLS), Atmos. Meas. Tech., 9, 5293–5314, https://doi.org/10.5194/amt-9-5293-2016, 2016.
Kuhn, U. and Kesselmeier, J.: Environmental variables controlling the uptake of carbonyl sulfide by lichens, J. Geophys. Res., 105, 26783–26792, 2000.
Laing, W. A. and Christeller, J. T.: A Steady-State Kinetic Study on the Catalytic Mechanism of Ribulose Biphosphate Carboxylase from Soybean, Arch. Biochem. Biophys., 202, 592–600, 1980.
Lehmann, S. and Conrad, R.: Characteristics of Turnover of Carbonyl Sulfide in Four Different Soils, J. Atmos. Chem., 23, 193–207, 1996.
Lorimer, G. H. and Pierce, J.: Carbonyl Sulfide: An Alternate Substrate for but Not an Actovator of Ribulose-1,5-biphosphate Carboxylase, J. Biol. Chem., 264, 2764–2772, 1989.
Masaki, Y., Ozawa, R., Kageyama, K., and Katayama, Y.: Degradation and emission of carbonyl sulfide, an atmospheric trace gas, by fungi isolated from forest soil, FEMS Microbiol. Lett., 363, fnw197, https://doi.org/10.1093/femsle/fnw197, 2016.
Maseyk, K., Berry, J. A., Billesbach, D., Campbell, J. E., Torn, M. S., Zahniser, M., and Seibt, U.: Sources and sinks of carbonyl sulfide in an agricultural field in the southern great planes, P. Natl. Acad. Sci. USA, 111, 9064–9069, https://doi.org/10.1073/pnas.1319132111, 2014.
Mason, F., Harper, D., and Larkin, M.: The microbial degradation of thiocyanate, Biochem. Soc. T., 22, 423S, https://doi.org/10.1042/bst022423s, 1994.
McDonald, D., Price, M. N., Goodrich, J., Nawrocki, E. P., DeSantis, T. Z., Probst, A., Andersen, G. L., Knight, R., and Hugenholtz, P.: An improved Greengenes taxonomy with explicit ranks for ecological and evolutionary analyses of bacteria and archaea, ISME J., 6, 610–618, 2012.
Melillo, J. M. and Steudler, P. A.: The effect of nitrogen fertilization on the COS and CS2 emissions from temperature forest soils, J. Atmos. Chem., 9, 411–417, 1989.
Meredith, L. K., Boye, K., Youngerman, C., Whelan, M., Ogée, J., Sauze, J., and Wingate, L.: Coupled Biological and Abiotic Mechanisms Driving Carbonyl Sulfide Production in Soils, Soil Systems, 2, 37, https://doi.org/10.3390/soilsystems2030037, 2018.
Meredith, L. K., Ogée, J., Boye, K., Singer, E., Wingate, L., von Sperber, C., Sengupta, A., Whelan, M., Pang, E., Keiluweit, M., Brüggemann, N., Berry, J. A., and Welander, P. V.: Soil exchange rates of COS and CO18O differ with the diversity of microbial communities and their carbonic anhydrase enzymes, ISME J., 13, 290–300, https://doi.org/10.1038/s41396-018-0270-2, 2019.
Michalski, G., Böhlke, J. K., and Thiemens, M.: Long term atmospheric deposition as the source of nitrate and other salts in the Atacama Desert, Chile: New evidence from mass-independent oxygen isotopic compositions, Geochim. Cosmochim. Ac., 68, 4023–4038, 2004.
Notni, J., Schenk, S., Protoschill-Krebs, G., Kesselmeier, J., and Anders, E.: The missing link in COS metabolism: A model study on the reactivation of carbonic anhydrase from its hydrosulfide analogue, ChemBioChem, 8, 530–536, 2007.
Ogawa, T., Kato, H., Higashide, M., Nishimiya, M., and Katayama, Y.: Degradation of carbonyl sulfide by Actinomycetes and detection of clade D of β-class carbonic anhydrase, FEMS Microbiol. Lett., 363, fnw223, https://doi.org/10.1093/femsle/fnw223, 2016.
Ogée, J., Sauze, J., Kesselmeier, J., Genty, B., Van Diest, H., Launois, T., and Wingate, L.: A new mechanistic framework to predict OCS fluxes from soils, Biogeosciences, 13, 2221–2240, https://doi.org/10.5194/bg-13-2221-2016, 2016.
Oswald, R., Behrendt, T., Ermel, M., Wu, D., Su, H., Cheng, Y., Breuninger, C., Moravek, A., Mougin, E., Delon, C., Loubet, B., Pommerening-Röser, A., Sörgel, M., Pöschl, U., Hoffmann, T., Andreae, M. O., Meixner, F. X., and Trebs, I.: HONO emissions from soil bacteria as a major source of atmospheric reactive nitrogen, Science, 341, 1233–1235, 2013.
Placella, S. A. and Firestone, M. K.: Transcriptional Response of Nitrifying Communities to Wetting of Dry soil, Appl. Environ. Microbiol., 79, 3294–3302, 2013.
Pratscher, J., Dumont, M. G., and Conrad, R.: Ammonia-oxidation coupled to CO2 fixation by archaea and bacteria in an agricultural soil, P. Natl. Acad. Sci. USA, 108, 4170–4175, 2011.
Protoschill-Krebs, G. and Kesselmeier, J.: Enzymatic pathways for the consumption of carbonyl sulphide (COS) by higher plants, Bot. Acta, 105, 206–212, 1992.
Protoschill-Krebs, G., Wilhelm, C., and Kesselmeier, J.: Consumption of carbonyl sulfide by Chlamydomonas reinhardtii with different activities of carbonic anhydrase (CA) induced by different CO2 growing regimes, Bot. Acta, 108, 445–448, 1995.
Protoschill-Krebs, G., Wilhelm, C., and Kesselmeier, J.: Consumption of carbonyl sulphide by carbonic anhydrase (CA) isolated from Pisum sativum, Atmos. Environ., 30, 3151–3156, 1996.
Ragsdale, S. W.: Life with carbon monoxide, Crit. Rev. Biochem. Mol., 39, 165–195, 2004.
Rasigraf, O., Kool, D. M., Jetten, M. S. M., Sinninghe Damsté, J. S., and Ettwig, K. F.: Autotrophic Carbon Dioxide Fixation via the Calvin-Benson-Bassham Cycle by the Denitrifying Methanotroph “Candidatus Methylomirabilis oxyfera”, Appl. Environ. Microbiol., 80, 2451–2460, 2014.
Rocca, J. D., Hall, E. K., Lennon, J. T., Evans, S. E., Waldrop, M. P., Cotner, J. B., Nemergut, D. R., Graham, E. B., and Wallenstein, M. D.: Relationships between protein-encoding gene abundance and corresponding process are commonly assumed yet rarely observed, ISME J., 9, 1693–1999, https://doi.org/10.1038/ismej.2014.252, 2015.
Rotthauwe, J. H., Witzel, K. P., and Liesack, W.: The ammonia monooxygenase structural gene amoA as a functional marker: molecular fine-scale analysis of natural ammonia-oxidizing populations, Appl. Environ. Microbiol., 63, 4704–4712, 1997.
Sandoval-Soto, L., Stanimirov, M., von Hobe, M., Schmitt, V., Valdes, J., Wild, A., and Kesselmeier, J.: Global uptake of carbonyl sulfide (COS) by terrestrial vegetation: Estimates corrected by deposition velocities normalized to the uptake of carbon dioxide (CO2), Biogeosciences, 2, 125–132, https://doi.org/10.5194/bg-2-125-2005, 2005.
Sandoval-Soto, L., Kesselmeier, M., Schmitt, V., Wild, A., and Kesselmeier, J.: Observations of the uptake of carbonyl sulfide (COS) by trees under elevated atmospheric carbon dioxide concentrations, Biogeosciences, 9, 2935–2945, https://doi.org/10.5194/bg-9-2935-2012, 2012.
Sauze, J., Ogeé, J., Maron, P.-A., Crouzet, O., Nowak, V., Wohl, S., Kaisermann, A., Jones, S. P., and Wingate, L.: The interaction of soil phototrophs and fungi with pH and their impact on soil CO2, CO18O and OCS exchange, Soil Biol. Biochem., 115, 371–382, https://doi.org/10.1016/j.soilbio.2017.09.009, 2017.
Schmieder, R. and Edwards, R.: Quality control and preprocessing of metagenomic datasets, Bioinformatics, 27, 863–864, 2011.
Selesi, D., Pattis, I., Schmid, M., Kandeler, E., and Hartmann, A.: Quantification of bacterial RubisCO genes in soils by cbbL targeted real-time PCR, J. Microbiol. Meth., 69, 497–503, 2007.
Selesi, D., Schmid, M., and Hartmann, A.: Diversity of green-like and red-like ribulose-1,5-biphosphate carboxylase/oxygenase large-subunit genes (cbbL) in differently managed agricultural soils, Appl. Environ. Microbiol., 71, 175–184, 2005.
Smeulders, M. J., Barends, T. R. M., Pol, A., Scherer, A., Zandvoort, M. H., Udvarhelyi, A., Khadem, A. F., Menzel, A., Hermans, J., Shoeman, R. L., Wessels., H. J. C. T., van den Heuvel, L. P., Russ, L., Schlichting, I., Jetten, M. S. M., and Op den Camp, H. J. M.: Evolution of a new enzyme for carbon disulphide conversion by an acidothermophilic archaeon, Nature, 478, 412–416, 2011.
Smith, K. S. and Ferry, J. G.: Procaryotic carbonic anhydrases, FEMS Microbiology Reviews, 24, 335–366, 2000.
Smith, N. A. and Kelly, P.: Oxidation of carbon disulphide as the sole source of energy for the autotrophic growth of Thiobacillus thioporus strain TK-m, J. Gen. Microbiol., 134, 3041–3048, 1988.
Sokolova, T. G., Yakimov, M. M., Chernyh, N. A., Yu, E. Lun'kova, Kostrikina, N. A., Taranov, E. A., Lebedinskii, A. V., and Bonch-Osmolovskaya, E. A.: Aerobic Carbon Monoxide Oxidation in the Course of Growth of a Hyperthermophilic Archaeon, Sulfolobus sp. ETSY, Microbiology, 86, 539–548, 2017.
Sorokin, D. Y., Tourova, T. P., Lysenko, A. M., and Muyzer, G.: Diversity of culturable halophilic sulfur-oxidizing bacteria in hypersaline habitats, Microbiology, 152, 3013–3023, 2006.
Sun, W., Kooijmans, L. M. J., Maseyk, K., Chen, H., Mammarella, I., Vesala, T., Levula, J., Keskinen, H., and Seibt, U.: Soil fluxes of carbonyl sulfide (COS), carbon monoxide, and carbon dioxide in a boreal forest in southern Finland, Atmos. Chem. Phys., 18, 1363–1378, https://doi.org/10.5194/acp-18-1363-2018, 2018.
Tourna, M., Freitag, T. E., Nicol, G. W., and Prosser, J. I.: Growth, activity and temperature response of ammonia-oxidizing archaea and bacteria in soil microcosms, Environ. Microbiol., 10, 1357–1364, 2008.
Van Diest, H. and Kesselmeier, J.: Soil atmosphere exchange of carbonyl sulfide (COS) regulated by diffusivity depending on water-filled pore space, Biogeosciences, 5, 475–483, https://doi.org/10.5194/bg-5-475-2008, 2008.
Watts, S. F.: The mass budgets of carbonyl sulfide, dimethyl sulfide, carbon disulfide and hydrogen sulfide, Atmos. Environ., 34, 761–779, 2000.
Whelan, M. E., Hilton, T. W., Berry, J. A., Berkelhammer, M., Desai, A. R., and Campbell, J. E.: Carbonyl sulfide exchange in soils for better estimates of ecosystem carbon uptake, Atmos. Chem. Phys., 16, 3711–3726, https://doi.org/10.5194/acp-16-3711-2016, 2016.
Whelan, M. E. and Rhew, R. C.: Carbonyl sulfide produced by abiotic thermal and photodegradation of soil organic matter from wheat field substrate, J. Geophys. Res.-Biogeo., 120, 54–62, https://doi.org/10.1002/2014JG002661, 2015.
Whelan, M. E., Lennartz, S. T., Gimeno, T. E., Wehr, R., Wohlfahrt, G., Wang, Y., Kooijmans, L. M. J., Hilton, T. W., Belviso, S., Peylin, P., Commane, R., Sun, W., Chen, H., Kuai, L., Mammarella, I., Maseyk, K., Berkelhammer, M., Li, K.-F., Yakir, D., Zumkehr, A., Katayama, Y., Ogée, J., Spielmann, F. M., Kitz, F., Rastogi, B., Kesselmeier, J., Marshall, J., Erkkilä, K.-M., Wingate, L., Meredith, L. K., He, W., Bunk, R., Launois, T., Vesala, T., Schmidt, J. A., Fichot, C. G., Seibt, U., Saleska, S., Saltzman, E. S., Montzka, S. A., Berry, J. A., and Campbell, J. E.: Reviews and syntheses: Carbonyl sulfide as a multi-scale tracer for carbon and water cycles, Biogeosciences, 15, 3625–3657, https://doi.org/10.5194/bg-15-3625-2018, 2018.
White, T. J., Bruns, T. D., Lee, S. B., and Taylor, J. W.: Amplification and direct sequencing of fungal ribosomal RNA genes for phylogenetics, in: PCR protocols: a guide to methods and applications, edited by: Innis, M. A., Gelfand, D. H., Sninsky, J. J., and White, T. J., Academic Press, London, UK, 315–322, 1990.
Wingate, L., Ogée, J., Cuntz, M., Genty, B., Reiter, I., Seibt, U., Yakir, D., Maseyk, K., Pendall, E. G., Barbour, M. M., Mortazavi, B., Burlett, R., Peylin, P., Miller, J., Mencuciini, M., Shim, J. H., Hunt, J., and Grace, J.: The impact of soil organisms on the global budget of δ18O in atmospheric CO2, P. Natl. Acad. Sci. USA, 106, 22411–22415, https://doi.org/10.1073/pnas.0905210106, 2009.
Zhang, J., Kobert, K., Flouri, T., and Stamatakis, A.: PEAR: a fasta and accurate Illumina Paired-End reAd mergeR, Bioinformatics, 30, 614–620, 2014.
Žifčáková, L., Vĕtrovský, T., Howe, A., and Baldrian, P.: Microbial activity in forest soil reflects the changes in ecosystem properties between summer and winter, Environ. Microbiol., 18, 288–301, https://doi.org/10.1111/1462-2920.13026, 2016.