the Creative Commons Attribution 4.0 License.
the Creative Commons Attribution 4.0 License.
 | 15 Feb 2018
Saturated and unsaturated salt transport in peat from a constructed fen
Reuven B. Simhayov
Tobias K. D. Weber
Jonathan S. Price
The underlying processes governing solute transport in peat from an experimentally constructed fen peatland were analyzed by performing saturated and unsaturated solute breakthrough experiments using Na+ and Cl− as reactive and non-reactive solutes, respectively. We tested the performance of three solute transport models, including the classical equilibrium convection–dispersion equation (CDE), a chemical non-equilibrium one-site adsorption model (OSA) and a model to account for physical non-equilibrium, the mobile–immobile (MIM) phases. The selection was motivated by the fact that the applicability of the MIM in peat soils finds a wide consensus. However, results from inverse modeling and a robust statistical evaluation of this peat provide evidence that the measured breakthrough of the conservative tracer, Cl−, could be simulated well using the CDE. Furthermore, the very high Damköhler number (which approaches infinity) suggests instantaneous equilibration between the mobile and immobile phases underscoring the redundancy of the MIM approach for this particular peat. Scanning electron microscope images of the peat show the typical multi-pore size distribution structures have been homogenized sufficiently by decomposition, such that physical non-equilibrium solute transport no longer governs the transport process. This result is corroborated by the fact the soil hydraulic properties were adequately described using a unimodal van Genuchten–Mualem model between saturation and a pressure head of 1000 cm of water. Hence, MIM was not the most suitable choice, and the long tailing of the Na+ breakthrough curve was caused by chemical non-equilibrium. Successful description was possible using the OSA model. To test our results for the unsaturated case, we conducted an unsaturated steady-state evaporation experiment to drive Na+ and Cl− transport. Using the parameterized transport models from the saturated experiments, we could numerically simulate the unsaturated transport using Hydrus-1-D. The simulation showed a good prediction of observed values, confirming the suitability of the parameters for use in a slightly unsaturated transport simulation. The findings improve the understanding of solute redistribution in the constructed fen and imply that MIM should not be automatically assumed for solute transport in peat but rather should be evidence based.
- Article
(4122 KB) - Full-text XML
- BibTeX
- EndNote


A large pool of leachable Na, Ca and S was introduced in the tailings sand used to construct a fen watershed as part of a novel attempt at landscape reclamation in the oil sands region (Simhayov et al., 2017). The transport of these solutes in groundwater derived from these tailings are likely to affect fen vegetation (Simhayov et al., 2017); thus, a better understanding of the transport processes through peat, and solute accumulation in the rooting zone of the fen, is needed.
The current assumption is that solute attenuation in peat is a result of solute adsorption and mass exchanges between mobile and immobile phases (Hoag and Price, 1997; Rezanezhad et al., 2012). Generally, in Sphagnum-derived peat, hyaline cells and their skeletal remnants are thought to account for a large fraction of dead-end pores with distinct pore size density distributions (Weber et al., 2017a, b) and a volumetric moisture content (VMC) between 10 and 20 % (Hayward and Clymo, 1982; Weber et al., 2017a, b). This physical structure, along with surface adsorption of reactive solutes (Rezanezhad et al., 2012, 2016) will lead to delayed arrival of solutes which are likely to affect vegetation community development in oil sands reclamation landscapes. The physical and hydraulic properties of undisturbed peat changes along a continuous vertical profile (Weber et al., 2017b; Limpens et al., 2008), whereby deep peat layers are generally more decomposed (Clymo, 1983). In addition to pore-scale effects, the systematic layered heterogeneity common in natural peatlands influences mixing and transport (Hoag and Price, 1997). However, in constructed peatlands, the decomposition gradient is destroyed because of the disruption caused by draining, stripping, transport and placement (Nwaishi et al., 2015).
Solute transport in the subsurface may be subject to physical and chemical non-equilibrium (Nielsen et al., 1986) invalidating the use of the conventional convection–dispersion equation (CDE) to simulate it. Physical non-equilibrium is thought to be a process of a heterogeneous flow field with spatial differences in hydraulic conductivity due to dead-end pores (Coats and Smith, 1964; Zurmühl and Durner, 1996), non-moving intra-aggregate water (Philip, 1968; Passioura, 1971) or stagnant water in thin liquid films around soil particles (Nielsen et al., 1986). In this mobile–immobile model (MIM; Coats and Smith, 1964; van Genuchten and Wierenga, 1976), the liquid phase is partitioned into a mobile and an immobile region. Convective–dispersive transport occurs only in the mobile zone, while solute transport into the immobile region is by diffusion, the rate of which can be determined by experiments and inverse estimation of transport parameters (Vanderborght et al., 1997). In chemical non-equilibrium models, it is assumed that sorption at the pore-water solid particle interface is kinetically controlled (Cameron and Klute, 1977; Nkedi-Kizza et al., 1989). Both parametric non-equilibrium models may additionally account for chemical equilibrium adsorption (Toride et al., 1993).
To distinguish between the governing solute transport process, inverse modeling can provide the necessary information on model parameter estimates and associated uncertainties, and permits the calculation of model performance and selection criteria (Vrugt and Dane, 2006; Iden and Durner, 2008; Weber et al., 2017a). The modeling can be based on measured solute breakthrough experiments of reactive as well as non-reactive solutes (Nkedi-Kizza et al., 1984). In the notation of the convection–dispersion equation, the retardation factor is strictly referred and attributed to equilibrium adsorption (Toride et al., 1995, Šimůnek and van Genuchten, 2008, Šimůnek et al., 2008) and is a function of bulk density, the slope of the adsorption isotherm and volumetric water content (Toride et al., 1995). A problem in deriving a numerical value for the retardation factor during inverse modeling is that it is mathematically directly negatively proportional to the flow.
To the knowledge of the authors, the only literature reports with experiments of NaCl breakthrough on saturated peat columns conducted in the laboratory are from Price and Woo (1988), Hoag and Price (1997), Ours et al. (1997), Comas and Slater (2004) and Rezanezhad et al. (2012). Ours et al. (1997) speculate that the observed prolonged tailing of NaCl is a result of solutes diffusing into immobile zones. However, neither batch adsorption tests with the potential to exclude kinetic chemical sorption are presented nor were solute transport models fitted to breakthrough curves, leaving their conclusions tentative. Hoag and Price (1997) successfully described their observations with the CDE. However, based on an effective porosity (ne) determined by photo imagery, the authors calculated the pore-water velocity by , where q is specific discharge. The method of estimating ne from photo-imagery may easily lead to a systematic miscalculation of effective pore-water velocity, resulting in different values of v than those calculated from total porosity, φ or inverse estimation. By estimating CDE model parameters describing non-reactive Cl− breakthrough and keeping v fixed, their retardation factor (R), reflecting vwater∕vsolute was > 1 and close to the ratio of φ to ne. They attributed the delay in solute transport to physical non-equilibrium processes, whereby solutes diffuse into inactive pores (i.e., solute transfer from the mobile to the immobile region). The approach of Hoag and Price (1997) differs from the classical understanding where diffusion into the immobile zone is described by a kinetic constant, while R assumes chemical equilibrium of solutes with sorption sites (e.g., Coats and Smith, 1964; van Genuchten and Wierenga, 1976). Rezanezhad et al. (2012) concluded MIM transport is observable on small peat samples. Moreover, parameter uncertainties and correlations are not shown and the performance of the MIM in comparison to the classical CDE is not given, such that a rigorous model selection is not possible. Additionally, acknowledging that Na+ and Cl− ions may interact with dissolved organic matter, inducing changes in the pore size and geometry (Ours et al., 1997; Comas & Slater, 2004) a pretreatment was implemented (see Sect. 2.3.1).
The goal of the study is to expand our understanding of the transport processes in the vadose zone of decomposed peat by testing various transport models and scrutinizing the common assumption that the mobile–immobile transport model best reflects the processes in saturated and unsaturated peat. We approach this objective by conducting lab-based experiments including saturated and unsaturated breakthrough experiments using NaCl. Cl− is generally uninvolved in chemical reactions in peat, except for ultra-saline conditions (Ours et al., 1997), and its counter ion, Na+, is a prominent solute and potential contaminant in the oil sands reclamation landscape (Simhayov et al., 2017). To compare the performance of models, model parameters were estimated using inverse modeling with the CXTFIT v2.0 code (Toride et al., 1995). Comparison was based on a statistical analysis to investigate the information content of the data collected, enabling a careful assessment of the underlying processes. Subsequently, the parameterized models were used to numerically simulate the solute transport in unsaturated steady-state evaporation experiments with Hydrus-1-D (Simunek et al., 2008). We tested if the model selection and parameterization based on saturated experiments can be extended to predict unsaturated solute transport. No further inverse estimation was done for the unsaturated transport of the non-reactive solute except for the Freundlich–Langmuir parameters of the reactive solute. A sensitivity analysis was then carried out to estimate potential errors caused by using parameters derived from saturated transport to simulate the unsaturated case.
The peat used for the fen was moderately decomposed rich fen, sedge peat with remnants of Sphagnum moss, originating from a donor fen prior to stripping of overburden material to expose the oil sands deposits (Price et al., 2011; Daly et al., 2012; Nwaishi et al., 2015). The donor fen had been drained for 2 years prior and the peat underwent accelerated decomposition due to exposure to oxygen (Nwaishi et al., 2015). Vegetation growth on the drained fen resulted in addition of stems and leaves to the peat. The samples were shoveled into 20 L buckets from a stockpile made by the heavy machinery that removed the peat layer from the donor fen, further disturbing the peat, as it was placed in the fen. The peat has a relatively open structure (Fig. 1), compared to Sphagnum peat used in other transport studies (e.g., Hoag and Price, 1997; Rezanezhad et al., 2012).
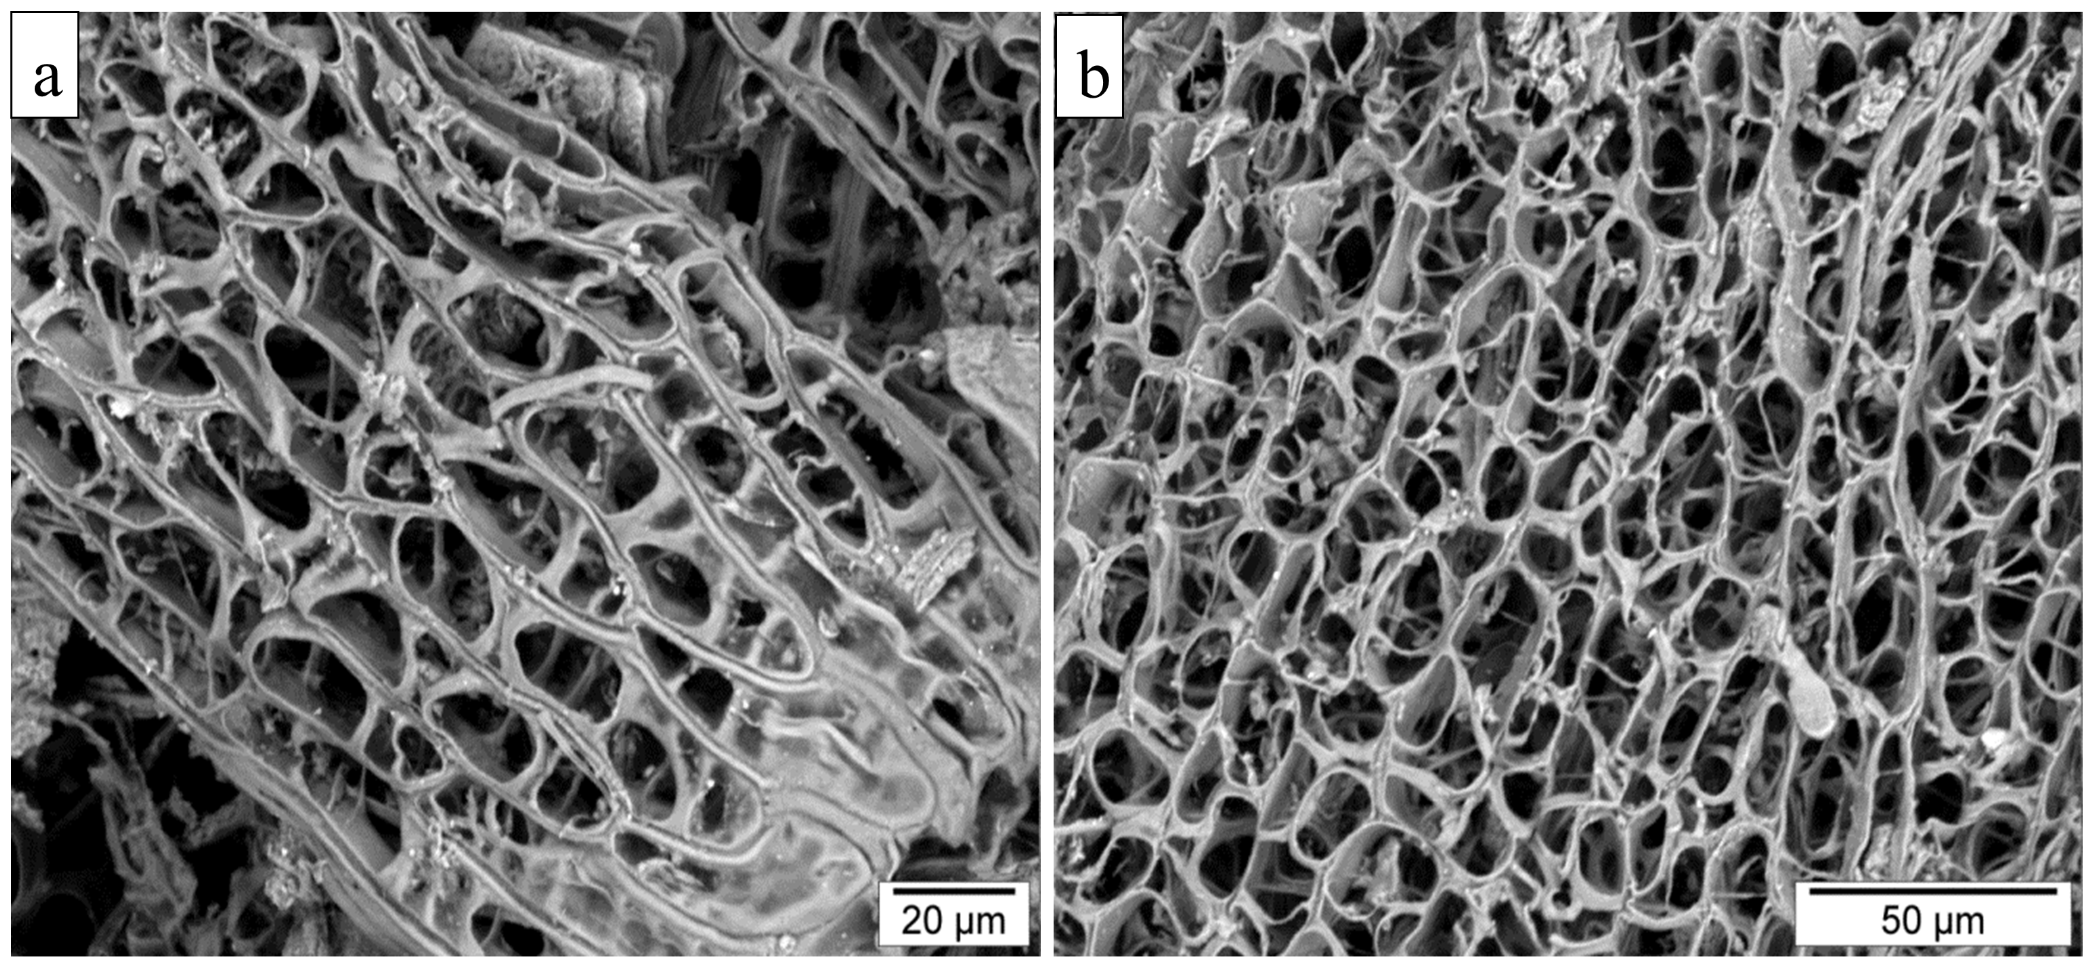
Figure 1Scanning electron microscope pictures of samples of the peat used in this study. (a) Moss with hyaline cells; note cells with intact membrane at bottom right corner and larger pore spaces in bottom left and top right corners. (b) Hyaline cells with membranes missing; the view through the skeleton is evident. Modified from Rezanezhad et al. (2016).
2.1 Research approach
Four soil physical experiments were conducted to estimate the hydraulic properties and solute transport characteristics of the fen peat material. The conducted experiments were (1) transient evaporation, (2) water retention characteristics using tension disks, (3) saturated breakthrough and (4) unsaturated breakthrough. As previously noted, the peat was sampled from the stock of disturbed peat used to construct the fen; in addition, we carefully removed woody inclusions and intact leaves to homogenize it such that we could ensure minimal variation between samples. The peat was gently, yet thoroughly, mixed and packed into columns (see Appendix A1); no milling or sieving was done. Prior to experimentation, samples were saturated from the bottom in small increments, over a 24 h period, using 18.2 MΩ cm water (ultra-pure water). All experiments were conducted at a target bulk density (ρB) of 0.12 g cm−3. Experiments were conducted on triplicates, except for the tension disk experiments, which were conducted on four samples. For the determination of the solute transport properties, Cl− was used as a non-reactive solute and Na+ as a reactive solute. All breakthrough experiments were performed using a solution of 200 and 300 corresponding to values measured by Kessel (2016) in the constructed Nikanotee Fen watershed. This solution was prepared by mixing 500 mg of NaCl (1.06404.055, ACS grade, Merck, Germany) per liter of ultra-pure water.
2.2 Soil hydraulic properties
To determine the peat soil hydraulic properties, we conducted transient evaporation experiments (Schindler, 1980; Peters et al., 2015; Weber et al., 2017a, b) for the retention properties, supplemented with tension disk experiments (Klute and Dirksen, 1986; McCarter et al., 2017). Tension disk experiments are considered to be a more reliable method to determine the unsaturated hydraulic conductivity in the wet range, because transient evaporation experiments contain limited information at pressure heads between 0 and −60 cm for the unsaturated hydraulic conductivity curve (Peters and Durner, 2008). Water retention and unsaturated hydraulic conductivity data were obtained with the tension disk experiments using 10 cm i.d. and 5 cm high peat samples at −2.5, −5, −7.5, −10, −15, −20 and −25 cm pressure head (h; cm) steps, which was also the order in which the experiment was conducted. Outflow during each pressure step was monitored by scales with an accuracy of 0.1 g and logged at 1 min intervals and the unsaturated hydraulic conductivity calculated with the Darcy–Buckingham equation (Swartzendruber, 1969). The transient evaporation experiments were conducted on the same samples using commercial UMS HYPROP devices (UMS GmbH, Munich, Germany). The water retention and unsaturated hydraulic conductivity data were then used to obtain parameters of the unimodal van Genuchten–Mualem model (van Genuchten, 1980; Mualem, 1976) by inverse modeling. For further details on parameters, the reader is referred to Appendix A.2.
The volumetric water content, θ, was determined as the difference between sample weight and the oven-dry mass for samples dried at 80 ∘C until no difference in weight was measured (Gardner, 1986). Bulk density was determined as the ratio of dry weight to the original sample volume. Volumetric water content at saturation, θs, was assumed to be equivalent to the sample total porosity. Saturated hydraulic conductivity (Ks; cm d−1) was determined with a constant head test (Freeze and Cherry, 1979) using the flowthrough chambers described below and a hydraulic gradient of 1.
2.3 Saturated breakthrough experiments and inverse modeling
2.3.1 Sample preparation
Saturated breakthrough experiments were conducted in 10 cm long, 10 cm i.d. PlexiglasTM (785 cm3) flowthrough chambers, fitted at each end with cm high-density polyethylene (HDPE) end plates with silicon gaskets. A polypropylene fiber pad was placed between the plate and the sample to enhance the distribution of the solution beneath the sample (see Appendix A1). The NaCl solute source was a 20 L magnetically stirred solution reservoir pumped at a steady rate of 5 mL min−1 (a flux density of 0.064 cm min−1) using a peristaltic pump (WT600–3J, LongerPump, China) and the outflow solute concentration monitored continuously (e.g., Skaggs and Leij, 2002). Prior to the breakthrough experiment, the samples were flushed with two chamber volumes of the NaCl solution to reduce potential changes to the pore sizes as a result of swelling (Price and Woo, 1988; Ours et al., 1997) or clogging due to flocculation. Subsequently, the samples were inverted and flushed with ultra-pure water for six chamber volumes to remove the solutes that were introduced. To determine sampling times and the end of the experiment, an electrical conductivity (EC) electrode (11388–372, SympHony, VWR, USA) connected to a portable meter (SP80PC, SympHony, VWR, USA) was used. The EC meter was calibrated using a two-point calibration with 84 and 1413 µS cm−1 conductivity calibration solutions (HI-7033 and HI-7031), respectively (Hanna Instruments, USA). EC was checked every 5–10 min depending on the trend observed. Sampling was done with observed changes in EC and the experiment was continued until 1 h after the outflow EC value was similar to the inflow. Samples were collected in 1.5 mL polypropylene micro centrifuge tubes (Z336769, Sigma-Aldrich, USA) and kept frozen until analyzed. Water samples were analyzed for Na+ and Cl− using an ion chromatograph (IC) (DIONEX ICS 3000, IonPac AS18 and CS16 analytical columns). Apparatus blank corrections were done as described in Rajendran et al. (2008), where no transport model for the apparatus blank was assumed but correction values generated using hermite cubic splines.
2.3.2 Solute transport models
Two different parametric solute transport model types were used to describe the observed breakthrough data of Cl− and a third additional model for the Na+ data. We list the model in the order of testing. The first two consisted of the MIM equation (Eqs. 1 and 2; van Genuchten and Wagenet, 1989) and the classical CDE (Eq. 3; van Genuchten and Alves, 1982; Nielsen et al., 1986), and the third is the one-site adsorption equation (OSA; Eqs. 5 and 6; van Genuchten et al., 1974; Nielsen et al., 1986) which was only used for Na+.
The MIM for a non-reactive solute with instantaneous equilibration is given by
where β is the ratio of the water content of the mobile region to the total water content; θ (L3 L−3), Cm and Cim are the concentrations in the water phase of the mobile and immobile regions (M L−3), respectively; D is the dispersion coefficient (L2 T−1); v is the average linear pore-water velocity (L T−1); and αMIM is the first-order rate coefficient between the mobile and immobile regions (T−1).
The CDE is given by
where c is the concentration of the total water phase (M L−3), and R is a retardation factor for equilibrium adsorption, which for a non-reactive solute is typically assumed to be 1 (but see Hoag and Price, 1997). In the classical interpretation, R is related to the adsorption distribution coefficient, Kd (M3 L−3), by . The MIM reduces to the CDE equation under certain conditions, which can be analyzed by the dimensionless Damköhler number (Da; Wehrer and Totsche, 1995; Vanderborght et al., 1997) (Eq. 4), given by
where L is the column length (L). Large Da values indicate very fast equilibration between the regions. From inspection of Eq. (4), it becomes clear that Da→∞, and as αMIM increases, Da increases proportionally, signifying instantaneous equilibration; thus, a differentiation between the two regions cannot be determined. Moreover, Parker and Valocchi (1986) showed that the CDE may also be applicable when a considerable part of the solute dispersion is caused by diffusion into the immobile region.
In physical non-equilibrium, the attenuation of both reactive and non-reactive solutes is affected. However, if only the reactive solute shows long tailing, then it can be assumed that chemical non-equilibrium is affecting the flow process. In NaCl breakthrough experiments (Rezanezhad et al., 2012), only Na+ showed long tailings in fen peat so that the physical non-equilibrium model should not be employed. For this case, first-order kinetic chemical non-equilibrium models may be chosen. One typical model for solute transport in porous media is the one-site adsorption equation which is an expansion of the CDE with the addition of a kinetic adsorption member. It is given by
where s is the kinetically sorbed concentration to the solid (M), and αOSA is the first-order rate coefficient between dissolved and adsorbed concentration (T−1) which has been found to be a function of pore-water velocity and cannot be derived by batch experiments alone (Nielsen et al., 1986).
Following the traditional approach for solute transport parameterization in peat (Rezanezhad et al., 2012, 2017), we initially assumed the MIM model and compared it with the performance of the CDE for the non-reactive solute. For Na+, transport parameters were additionally estimated with a one-site chemical adsorption model. The data used for the fitting were averages of three replicates. Parameterization of the model was done with CXTFIT (V2.0; Toride et al., 1995), which minimizes the least squares. We estimated the following parameters: v and D for the CDE; v, D, β and αMIM for MIM; and R and αOSA for the OSA model. The estimated D and v from the Cl− data fit were used for the Na+ simulations, since dispersion is a physical material property, and R can only be determined if v is fixed from knowledge of a conservative solute experiment. Using various starting values, we ensured that the global minimum was found. CXTFIT calculates the variance–covariance matrix, which is required for the calculation of the standard errors of the parameters and the parameter correlation matrix.
The root mean squared error (RMSE) was used as an index for model performance calculated for each of the tested models (Eq. 14 in Weber et al., 2017a). The corrected Akaike information criterion (AICc; Eq. 2 in Ye et al., 2008) was used as a method of model comparison where the model with the smallest AICc is to be favored. It is a statistically robust and commonly used index to compare models in soil physics (e.g., Weber et al., 2017a).
2.4 Unsaturated breakthrough experiments and sensitivity analyses
2.4.1 Sample preparation
The unsaturated solute breakthrough experiments were designed as six steady-state evaporation columns 23 cm high and 10 cm i.d. (Fig. 2). Peat samples were placed in a column constructed with a grooved HDPE base plate with an inlet a silicon washer and polypropylene fiber pad, and open at the top (see Appendix A1). The columns were slowly saturated from the bottom in small increments over 48 h to minimize trapped gas bubbles. Once saturated, the columns were flushed with two column volumes of the NaCl solution to reduce potential changes in hydraulic properties, as previously described. The NaCl flushing was followed by flushing six column volumes of ultra-pure water to remove the Na+ and Cl−, with the water overflowing from the top of the sample. Flushing of Na+ did not remove all solute, resulting in 40 mg L−1 of Na+ remaining in the time zero samples were taken at the bottom 8 cm of the column. Nevertheless, these concentrations were accounted for in the HYDRUS simulation. Columns were then drained overnight with 0 cm pressure head at the bottom of the sample and connected to a Marriot device containing ultra-pure water. The water table was set to the base of the peat column, and the columns were left to settle for 11 days, after which the columns were instrumented with the soil tensiometers and water samplers (further details below).
Each Marriot device was fitted with a low flow 12 V mini water pump to circulate the water within it for 5 min every 2 h to prevent solute stratification. Three Marriot devices were filled with an 8.9 mM solution of NaCl as treatment and three with ultra-pure water. The columns were fitted with four unsaturated soil water samplers at 2.5, 7.5, 12.5 and 17.5 cm above the water table (19.21.05, Rhizon, Rhizonsphere, Germany) and with two tensiometers at 10 cm (LM) 23 cm (UM), to determine if the water pressure deviated from hydrostatic conditions (see Appendix A3). Tensiometers were composed of a porous clay cup and a flexible silicon tube, which was open to the atmosphere. The experiment was run for 120 days; evaporation was calculated based on changes to the water level in the Marriot device (see Appendix A3). The experiment was conducted in a room with controlled humidity maintained at ∼45 %, assisted by a fan to mix the air in the chamber. Relative humidity (RH) and temperature were measured every 10 min (ECT, Decagon, USA) (see Appendix A3).

NaCl solution was introduced at the base of the column and drawn upwards by evaporation. Marriot devices were attached to supply water over the bottom boundary for each column. The pressure head at the lower boundary was fixed to a pressure head of 0 cm for the duration of the experiment. Daily values of the water level in the Marriot were measured with a measuring tape, and the evaporative water flux over the upper boundary was calculated by dividing the water lost by the cross-sectional surface area of the column (see Appendix A3).
Pore-water samples were taken weekly from each sample height through the Rhizon samplers. On average, 5.5 mL of water were drawn from each sampler using a dedicated 30 mL polypropylene syringe (Z683647, Sigma-Aldrich, USA). To ensure equal pull on each sampling point, cm HDPE spacers were fabricated and placed within the syringe body and piston. Only samples from time steps of 0, 21, 42, 63, 84 and 120 days were analyzed. After the experiment ended, the cores were frozen, then sliced to ∼2 cm thick sections using a band saw. Sections were measured with callipers, weighed and placed in pre-weighed, food-grade and heat-resistant bags. The slices were than thawed and ultra-pure water, twice the weight of the slice, was added to extract the solutes and placed on a table shaker (MaxQ 3000, Thermo Fisher Scientific) for 48 h. All samples were frozen until analyzed for Na+ and Cl− via IC at the Biogeochemistry Laboratory at the University of Waterloo (DIONEX ICS 3000, IonPac AS18 and CS16 analytical columns). Results were adjusted to account for the dilution effect of the added water.
2.4.2 Numerical simulations and sensitivity analyses
The steady-state unsaturated evaporation experiment with solute transport was simulated with HYDRUS-1-D (Simunek et al., 2008), which numerically solves Richard's equation for water flow and the solute transport equations. For the water flow, the soil hydraulic properties are the necessary input and were parameterized with a unimodal van Genuchten–Mualem equation using data collected in the tension disk experiments and transient evaporation experiments. The model domain represented the 23 cm high column with a spatial discretization of 0.5 cm.
The lower boundary condition for the water flow was at constant zero pressure representing the water table. The upper boundary condition was a flux boundary based on measured evaporation rates. For the solute transport, the lower boundary was a fixed concentration in the liquid phase and the upper boundary condition was a zero flux. To account for the soil solution sampling (that would otherwise lead to a misrepresentation of water flow and solute transport), we used the root water uptake function in HYDRUS by specifying an individual root at the height of each of the four Rhizon samplers. The applied root water uptake model (Feddes et al., 1978) assumes no salinity stress, no pressure-dependent reduction of given water uptake quantity and a quasi-infinite maximum allowed concentration for passive root solute uptake. The total water volume extracted per sampling day was taken to be equal at each root node.
Table 1Soil physical and hydraulic properties of prepared peat cores from different experiments. Values are averages; percentages in brackets are the coefficients of variation. Porosity was calculated using particle density for the constructed fen peat from Ketcheson (2015).
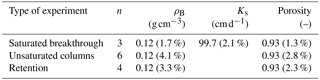
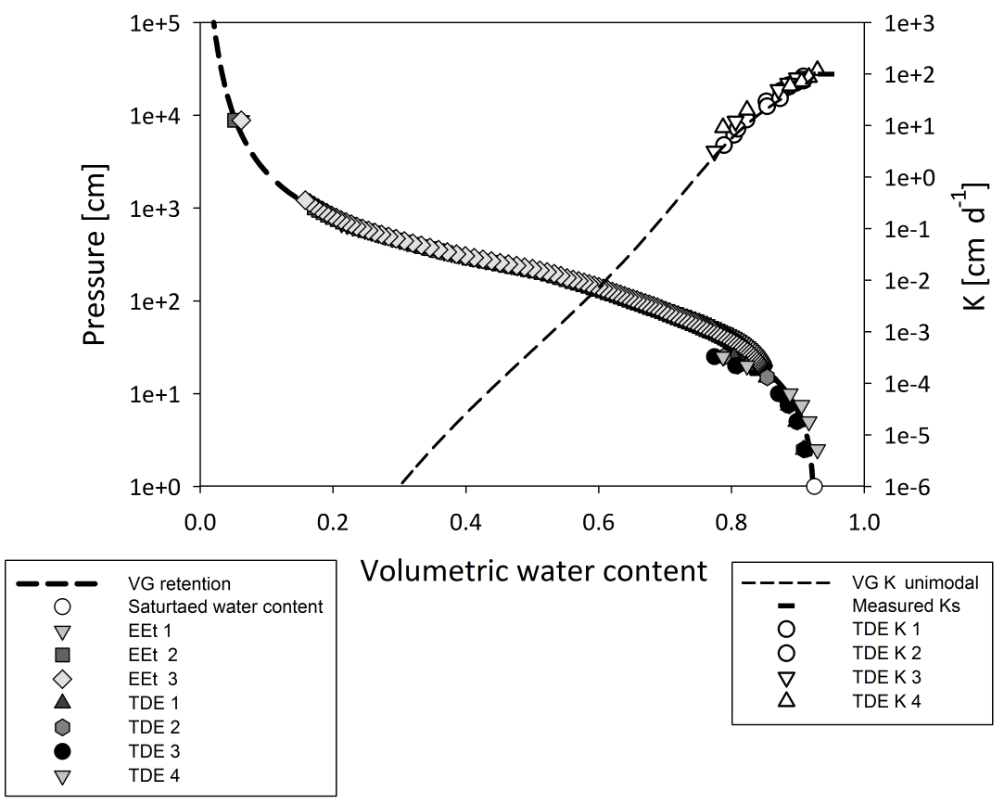
Figure 3Soil water retention and hydraulic conductivity curves with measurement results of the transient evaporation experiments (EEts) and tension disk experiments (TDEs) and parameterizations for the unimodal van Genuchten–Mualem model. Negative pressure was used for the retention experiment.
Dispersion is dependent on the average linear velocity, which in turn is dependent on the water content (Perkins and Johnston, 1963). To date, HYDRUS does not account for a water content dependency of dispersion (D(θ)) in solute transport modeling. Also, this information is not available from the saturated experiment. Therefore, a sensitivity analysis of D on the model response was done to approximate its quantitative influence on the solute transport. To gauge the range of values for the sensitivity analysis, a calculation of the change in D was performed using data gathered from the unsaturated columns. The calculation used the equation for D in capillary flow under unsaturated conditions in soils as a function of v, by Fried and Combarnous (1971) (not shown). The equation connects D to changes in water content and allows the calculation of changes in D due to measured changes in water content. Comparison of the calculated values provided with a range of change in D. Calculations indicated that the change in D ranged from 8 to 15 %. Therefore, to add extra range, the sensitivity analysis for the HYDRUS model was performed using ±20 % and a ±100 % change in D.
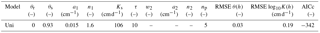
Table 2Parameter results for the soil hydraulic properties function of the unimodal (uni) model saturation function; the parameter names are explained in the text.
3.1 Soil physical properties
The bulk density and porosity of the prepared peat samples in the various experiments was similar (Table 1), indicating a successful sample replication. The retention curve (Fig. 3) does not have the classical shape that would point at discrimination between an active and inactive porosity (Rezanezhad et al., 2016; Weber et al., 2017b). Measured water retention and hydraulic conductivity data closely fit the van Genuchten–Mualem unimodal model with an RMSE of 0.03 and AICc value of −342 (Fig. 3; Table 2). Furthermore, the estimated Ks value of the unimodal fit (106 cm d−1; Table 2) is similar to the measured value (100 cm d−1; Table 1).
3.2 Saturated breakthrough experiment
Cl− breakthrough started around ∼60 min with arriving 97 min from the start of the experiment (Fig. 4). Complete Cl− breakthrough () was achieved after 300 min. Similar to Cl−, initial Na+ breakthrough began ∼60 min from the start of the experiment (Fig. 4). However, was not achieved until ∼250 min, with only ∼0.85 breakthrough at the end of the experiment that had prolonged tailing, indicating a non-equilibrium process. The EC curve is similar in shape to that of Cl− but took longer to reach the full breakthrough. Attenuation of Na+ compared to Cl− is evident by the greater time until (Fig. 4) and is attributed mainly to the high adsorption capacity of peat (Ho and McKay, 2000). In contrast, Cl− attenuation in peat is mainly due to mechanical dispersion and diffusion into dead-end pores and not adsorption (Price and Woo, 1988). The dissimilarity of the EC breakthrough curve to that of Na+ (Fig. 4) demonstrates the limitation of using EC electrodes as an indicator for solutions containing reactive solutes, flowing through reactive mediums. This limitation is due to enrichment of ions in the solution from the soil and cation exchange with the medium, which changes the solution concentration of the cation of interest; therefore, EC can be a good estimator for non-reactive solutes but is limited as an indicator for cation transport (Olsen et al., 2000; Vogeler et al., 2000).
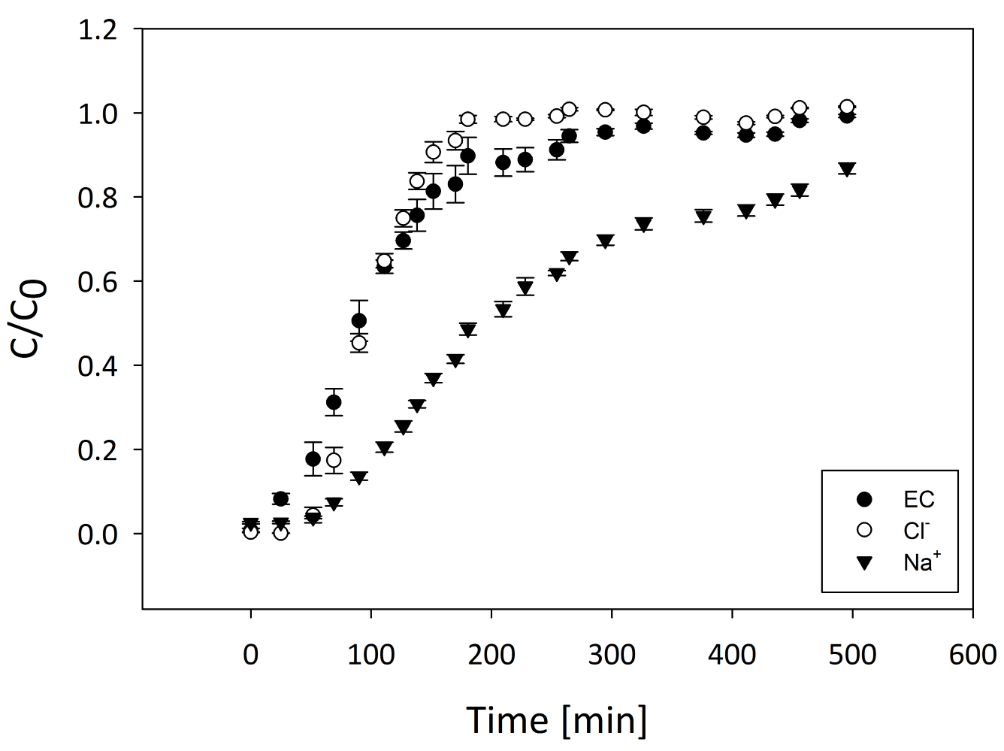
Figure 4EC, Cl− and Na+ corrected saturated breakthrough curves in saturated peat over time. Each point is an average of three samples; error bars are standard error of mean. Errors were not accounted for in the fitting.
3.3 Unsaturated column experiment
The evaporation rate of the experiment was 3 mm d−1 (not shown; see Appendix A3). As expected, Cl− was transported faster than Na+, as evident by the more rapid rise of Cl− in the peat profile (Fig. 5). of Cl− reached 7.5 cm above the water table within 21 days (Fig. 5a) and by 42 days reached 17.5 cm (Fig. 5a). Complete breakthrough () of Cl− was achieved between 63 and 84 days from start of experiment (Fig. 5a).
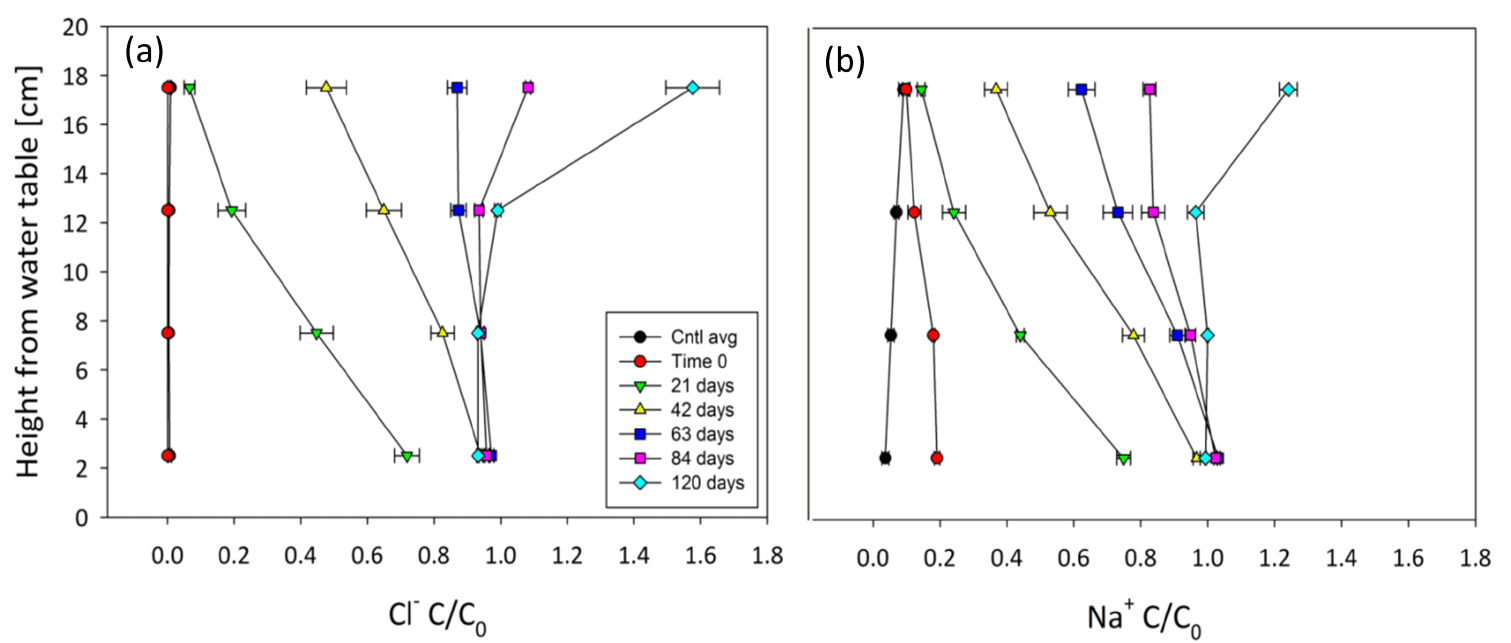
Figure 5Breakthrough curves of solutes in the unsaturated columns profile (a) of Cl− and (b) of Na+. Values presented are averages and whiskers are standard errors. “Cntl avg” represents the average of control measurements; for this aim, all measurements in a specific height were averaged with each point representing 18 measurements. For the treatment, each point is an average of three measurements. Each treatment curve represents a different sampling time from start of experiment. The water table location is at 0 cm.

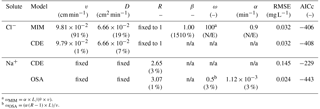
Table 3Estimated saturated transport parameters and the models' goodness of fit data. “n/a” – not applicable; N/E – not evaluated: the parameter is at the upper feasible bound of the parameter estimation. Toride et al. (1995) estimated values are presented with coefficient of variation as percentages in brackets; the parameters are explained in the text.
a .
b .
Comparably, Na+ reached 7.5 cm within 21 days (Fig. 5b). After 42 days, the was located between 12.5 to 17.5 cm from the water table (Fig. 5b). Complete Na+ breakthrough occurred later than Cl−, sometime after 84 days but before 120 days (Fig. 5b). The accumulation of both elements above inflow concentrations () at 17.5 cm after 120 days (Fig. 5b) indicates evaporative accumulation occurred as water molecules left the column while solute molecules remained (Tsypkin, 2003). Therefore, evaporative accumulation enhances the breakthrough rate as ions remain in the soil while water evaporates, thus producing a faster accumulation rate than if the breakthrough was estimated using a saturated flow system where the solutes would leave the system with the solution. Nevertheless, this effect is a basic product of evaporation-controlled transport (Elrick et al., 1994; Tsypkin, 2003).
3.4 Simulations
3.4.1 Solute transport model selection
For all transport models, the fitted parameters and associated uncertainties, AICc and RMSE values are given in Table 3. The CDE and MIM model for Cl− fit the data well (Fig. 6a) and have identical RMSEs (0.032 mg L−1). However, the AICc favors the CDE. Additionally, the MIM model estimated parameters (v, D and β) show much larger coefficients of variation, with β varying by 1510 % (Table 3). During fitting, αMIM ran into the CXTFIT internal upper boundary, further suggesting that the application of the MIM is an overparameterization and therefore not suitable. Also, the MIM has two more parameters than the CDE model, which makes the simpler CDE model preferable (Cavanaugh, 1997).

Figure 7Observed values (Obs) from the unsaturated column experiment vs. simulated values (Sim) of (a) Cl− and (b) Na+. Observed values are averages and standard error; n=3. T stands for time, and the number that follows is the number of days. Extract T120 represents values measured via extraction as part of post-experiment processing. Depth of 0 cm marks the top of the column. The dashed reference line marks .
Table 4Unsaturated transport parameters used in or estimated by HYDRUS and models' goodness of fit data. “n/a” – not applicable. Estimated values are presented with the coefficient of variation as percentages in brackets. “Diff. W” is the molecular diffusion coefficient of the solutes.
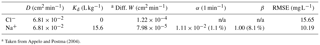
a Taken from Appelo and Postma (2004).

Figure 8Sensitivity analysis of unsaturated transport for changes in the dispersion coefficient. (a) in Cl− transport, (b) in Na+.
The Peclet number, which is the ratio of advective to diffusive transfer, was 33.9 for the fitted Cl− breakthrough data. In systems with values >2, diffusion is considered negligible (Huysmans and Dassargues, 2005). Moreover, with β→1 (Table 3), the Damköhler number, Da, approaches infinity, so that the equilibration between the mobile and immobile zones is considered instantaneous (Vanderborght et al., 1997; Wehrer and Totsche, 2005). In other words, Da indicates the system is not governed by physical non-equilibrium processes, but rather the simpler CDE concept applies. The significance of this result is that the physical non-equilibrium approach may be excluded for these samples and boundary conditions. This exclusion is supported by the instantaneous equilibration between the mobile and immobile zones, indicated by the very large ω which was at the upper bound during the parameter estimation. One possible reason for this finding could be based on the inherent nature of the samples. The peat of the Nikanotee Fen watershed (i.e., the peat used in this experiment) was moderately decomposed sedge peat containing small amounts of Sphagnum moss (Nwaishi et al., 2015). It is the Sphagnum mosses that contain the hyaline cells (Hayward and Clymo, 1982), which are probably the main cause for the existence of dead-end pores. Therefore, with only a small part of the peat originating from Sphagnum, the potential for dead-end pores was small compared to peat that originates mainly from Sphagnum moss. Additionally, evidence found in the scanning electron microscope (SEM) scans of the peat used in this study (Fig. 1), shows that the cell membranes have decayed, with only the skeleton of the cell remaining, while the skeleton itself is still intact so water can move much more freely through these structures. These results contradict the hitherto common finding in laboratory studies that breakthrough experiments on peat need to be described by the MIM (Hoag and Price, 1997; Rezanezhad et al., 2012; Liu et al., 2016; Rezanezhad et al., 2017; Thiemeyer et al., 2017). Additionally, this finding is reflected in the fact that a multimodal retention curve was not observable, which would have been indicative for a two-domain flow of solute transport.
Since the CDE model provides a good description of the saturated Cl− breakthrough, physical non-equilibrium can be neglected as the underlying process (Table 3; Fig. 6b). Therefore, the non-equilibrium effect observed in the Na+ breakthrough (Fig. 6b) must be due to chemical processes such as an interaction of Na+ ions with negatively charged sites on the peat surface. Having shown that the MIM is not parsimonious in its parameters, the robust estimates of v and D for the CDE were fixed when fitting the remaining model parameters of the CDE and one-site adsorption model for Na+. First, the CDE was fitted with R to the Na+ data; the resulting curve shows that equilibrium adsorption does not fit (Fig. 6b). In comparison, the one-site adsorption model fit well (Fig. 6b) and had a lower RMSE and a considerably lower AICc value (Table 3). Based on the estimated R value of the one-site adsorption model, the Kd value of Na+ was 15.6 L kg−1. The parameters from the CDE for Cl− and from one-site adsorption for Na+ were then used for the HYDRUS simulation of the unsaturated columns.
3.4.2 Unsaturated column simulations and sensitivity analyses
The HYDRUS predictions of solute concentrations at the four observation points were good for both solutes (Fig. 7), even though the solute transport model parameterization was based on the saturated experiments. Plotting of the concentrations from the solute extractions for the upper part of the core at the end of the experiment reaffirmed the models' generally good fit for both solutes (Fig. 7), although in both cases the models underestimate the measured concentration at the very top of the soil profile (Table 4).
Given that the dispersion coefficient for the unsaturated modeling was based on measurements in the saturated flowthrough chambers, a sensitivity analysis was performed with HYDRUS to determine its impact on the simulations. It indicates that a ±20 % change in the dispersion coefficient resulted in a ±1.2 % and a ±4.1 % change in the final concentration of Cl− and Na+, respectively (Fig. 8). Further, an analysis with a ±100 % change in D altered the final concentrations by −5 to 6.5 % for Cl− and by 9 to −17 % for Na+. The analysis demonstrates unsaturated transport is not highly sensitive to changes in the dispersion coefficient under the experimental conditions used. Furthermore, since the differences in water contents were not large, ranging between 0.93 at full saturation to 0.84 at the top of the column, it is likely that the actual hydrodynamic dispersion did not vary significantly.
Saturated breakthrough experiments on disturbed peat, taken from stocks used in the Nikanotee Fen, were conducted in the laboratory using conservative and reactive solutes. With this approach, we investigated whether the common assumption of mobile–immobile solute transport process best reflects the transport processes in saturated and unsaturated peat. Based on inverse modeling of time series of measured conservative tracer concentrations and robust statistical evaluation, we found that the MIM model was an overparameterization for Cl−, since very good results were found using the simpler CDE.
For this reason, it could be deduced that the Na+ attenuation, expressed by prolonged tailings in the observed breakthrough in the fen peat, is chemically based, as the physical non-equilibrium (i.e., MIM) approach would have had an effect on both solutes. Hence, we can conclude that Na+ showed a distinct chemical non-equilibrium adsorption process, which could be described using the OSA model and still fulfilling the requirement of parsimony. The results are in contrast to the commonly accepted MIM behavior of solutes' breakthrough in peat samples.
The significance of this result is that while reactive solutes may be heavily attenuated in peat, conservative solutes are not necessarily retarded (Hoag and Price, 1997). In the present case, the degraded structure of the peat (Fig. 1) eliminated many of the enclosed spaces commonly visible in less decomposed Sphagnum peat (see Hoag and Price, 1997; Rezanezhad et al., 2016). Measured water retention data were adequately described using a unimodal expression for the underlying pore size distribution, corroborating the finding that a physical dual porosity structure was not present. On a side note, we can attest that the use of EC as an indirect measurement for a reactive solute will result in overestimation of breakthrough if the solute interacts with the solid phase.
This research implies that automatically assuming mobile and immobile regions in peat is incorrect. The sedge peat with remnants of Sphagnum moss used in this experiment had relatively few dead-end pores, due to the low content of Sphagnum moss with intact hyaline cells. Furthermore, evidence suggests that the peat used has decayed enough to lose the cell membranes but not enough to break the cell skeleton and is likely why the peat lacks the classically assumed MIM regions. The decomposition may have been enhanced by aeration of the peat in the donor fen (Nwaishi et al., 2015). Although we acknowledge that any manipulation of a sample alters it, the prior disturbance (see introduction of the “Materials and methods” section) is likely to have had a significantly greater impact. Furthermore, the peat was not manipulated in a destructive manner such as sieving or milling, and was handled carefully. The reduced inter-sample variability caused by the careful homogenization of the peat improved the certainty in our results and thus our ability to understand the hydraulic properties of the peat. Additionally, it is concluded that transport parameters gathered in saturated breakthrough experiments can be used to simulate transport in slightly unsaturated media under near steady-state conditions. Data gathered show that the accumulation of solutes via evaporation causes concentration to rise quickly above the initial concentration. While these results are valid for the described boundary conditions and initial conditions, the fate of salt accumulation is not clear under more natural conditions such as complex meteorological evapotranspiration–precipitation cycles with, for example, surface inundation and overland flow export of solutes. Additionally, different salt concentration levels at the lower boundary of the experiment were not investigated, which has been documented in the case of the Nikanotee Fen watershed (Kessel, 2016). As a first assessment of the effect D has on salt accumulation, a synthetic parameter sensitivity analysis was carried out for Na+. To further understand the rates of the evaporative accumulation, a more complex numerical transport model should be used, including flushing due to precipitation and runoff, using the parameters reported in this study along with various weather scenarios. Considering the complex hydraulic retention and conductivity properties of Sphagnum mosses and peat, it is conceivable that a wide range of tested water contents could affect the choice of the underlying transport process. Additionally, the experiment was carried out under steady-state conditions, unlike the complex meteorological patterns in the field. Furthermore, the implications for reclamation projects are that if one of the goals is to enhance solute attenuation, the origin and composition of the peat, its water retention properties along with its decomposition state should be characterized, as not all peats will perform equally. Hence, from the industry perspective, if solute attenuation is the goal, then peat with a larger amount of Sphagnum and a confirmed dual porosity structure would be a better choice. Finally, our findings imply that MIM should not be automatically assumed for solute transport in peat but rather should be evidence based.
The data can be made available upon request to tobias.weber@uni-hohenheim.de.
A1 Pictures of saturated and unsaturated experiments
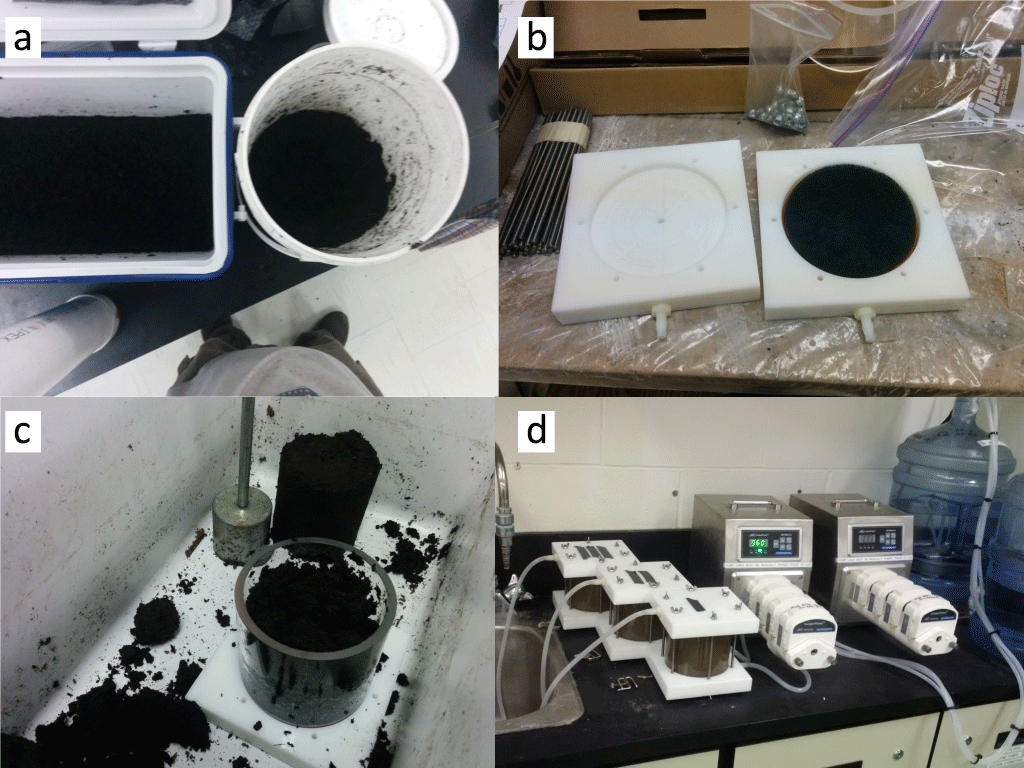
Figure A1Pictures from saturated transport experiment: (a) cleaning and mixing the peat; (b) flowthrough cell plates (the green pad is below the sample, redistributing the water beneath it); (c) packing cell with peat; and (d) flowthrough experiment setup (cells are connected to a pump drawing the solution from a container on a magnetic stirrer).
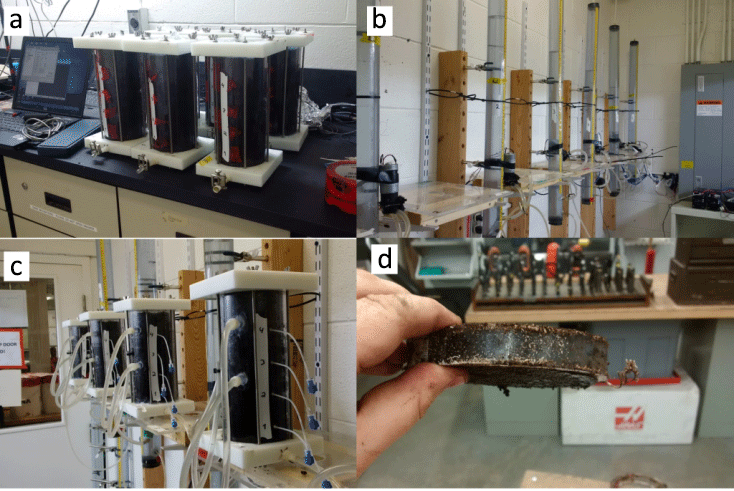
Figure A2Pictures from the unsaturated transport experiment: (a) columns with peat (note the laptop for scale); (b) Marriot bottles and pumps; (c) columns connected and instrumented (blue caps are the soil pore-water samplers; large tubes are the tensiometers); and (d) slice of a peat column before extraction at the end of the experiment.
A2 Soil hydraulic properties
A2.1 Measurements of water retention properties
The tension disk experiment (TDE) was conducted on 10 cm i.d. and 5 cm high peat samples at seven different pressure steps under unsaturated unit gradient vertical flow conditions using a tension disk apparatus that used 15 µm Nytex screens to prevent air entry below the air entry pressure (∼35 cm) (Price et al., 2008; McCarter et al., 2017). Samples were initially saturated for 48 h and two layers of cheese cloth covered the top and bottom of the sample to maintain the integrity of the surfaces. The pressure steps (h; cm) were −2.5, −5, −7.5, −10, −15, −20 and −25 cm, which was also the order in which the experiment was conducted. During the experiment, outflow was monitored for each pressure step by a scale with an accuracy of at least 0.1 g and logged at 1 min intervals. The experiment stopped when there was no change from past measurements over a 30 min period. After each step, the weight of the sample was determined to enable calculation of the water content. From the outflow, the unsaturated hydraulic conductivity was calculated from the Darcy–Buckingham equation (Swartzendruber, 1969).
Saturated hydraulic conductivity
The flowthrough columns (FTCs) were used for the determination of the saturated conductivity (Ks; cm d−1), too, which were connected to a Marriot bottle supplying a constant pressure head. The adopted method was a constant head test (Freeze and Cherry, 1979) with a gradient of 0.44. Once the outflow stabilized, it was measured in a 250 mL glass graduated cylinder (S63459, Fischer Scientific, USA) every 2 min over 20 min.
Transient evaporation experiment
The transient evaporation experiment (EEt) was conducted on the same samples as the TDE with a 0 cm pressure head at the bottom prior to the beginning of the EEt with the commercial UMS HYPROP device (UMS GmbH, Munich, Germany). The samples had a larger diameter than the UMS HYPROP device so that Plexiglas screens were used at the bottom to seal and prop the sample. The pressure head was directly measured in the middle of the sample, and thus directly related to the calculated water content to obtain the retention information, which is a valid approximation at or near a linear pressure distribution (Becher, 1971). Hence, the evaluation for conductivity is not reliable.
Inverse fitting of soil hydraulic properties
The water retention and unsaturated hydraulic conductivity data were used to parameterize soil hydraulic property (SHP) models. We used the unimodal van Genuchten–Mualem model combination (van Genuchten, 1980; Mualem, 1976). We used the analytical expression derived by Priesack and Durner (2006). The soil water retention function is given by
where θr is the residual, θs the saturated water content (cm3 cm−3) and Γ(h) (–) the effective saturation given by
where wi is a weighting coefficient between the modal pore size distributions, αi (cm−1) and ni (–) are shape parameters with constraining and . The unimodal van Genuchten saturation function is obtained by k=1. The unsaturated hydraulic conductivity is expressed as
where Ks is the saturated hydraulic conductivity (cm d−1) and τ is sometimes referred to as a tortuosity constant, which should be positive.
All parameters were estimated except for θs, which was set to 0.925, i.e., the porosity value. Estimation was done in R v3.2.1 (R Core Team, 2015) with implementation of the differential evolution optimizer to minimize the sum of squared errors for the retention and hydraulic conductivity curves (Mullen et al., 2011). The estimation of the soil hydraulic properties of the fen peat by inverse estimation was done as described in Peters and Durner (2008). After all procedures were concluded, bulk densities for all samples were determined gravimetrically based on an oven-dry mass basis for samples dried at 80 ∘C until no difference in weight was measured (Gardner, 1986). From knowledge of the dry weight and experimental system weight, water contents could be calculated for the soil hydraulic properties.
A2.2 Statistical parameters
The RMSE is used as a metric to describing the model prediction quality, such that
where m is the number of observations, yl is the observed and the model predicted value (solute concentration, water content or hydraulic conductivity). The AICc (Ye et al., 2008) was also used as a method of model comparison where the model with the smallest AICc is to be favored. Applications so soil hydrological model testing can be found in Weber et al. (2017a, b).
where np is the number of parameters of a respective model.
Estimation of model parameters was done by minimizing the sum of squared errors for the retention and hydraulic conductivity curves in R.3.2.1 (R Core Team, 2015) with an implementation of the differential evolution optimizer (Mullen et al., 2011) by adopting the multi-objective function as described in Peters and Durner (2008).
A3 Unsaturated experiment conditions
Ambient conditions in the chamber where the experiment was conducted were stable with an average temperature of ∘C and an average RH of 41±0.02 % (Fig. A3.1). Additionally, water pressure profile in the soil did not vary much for each column; soil water pressure above the water table averaged cm for the low meter and cm for the high meter (Fig. A3). Furthermore, data from all columns were in a similar range (Fig. A4), meaning the columns were reasonable replicates in soil water pressure.
Moreover, E data strengthen the conclusion that the columns were decent replicates with an overall low fluctuation in values averaging at 0.27±0.05 cm d−1 (Fig. A5).
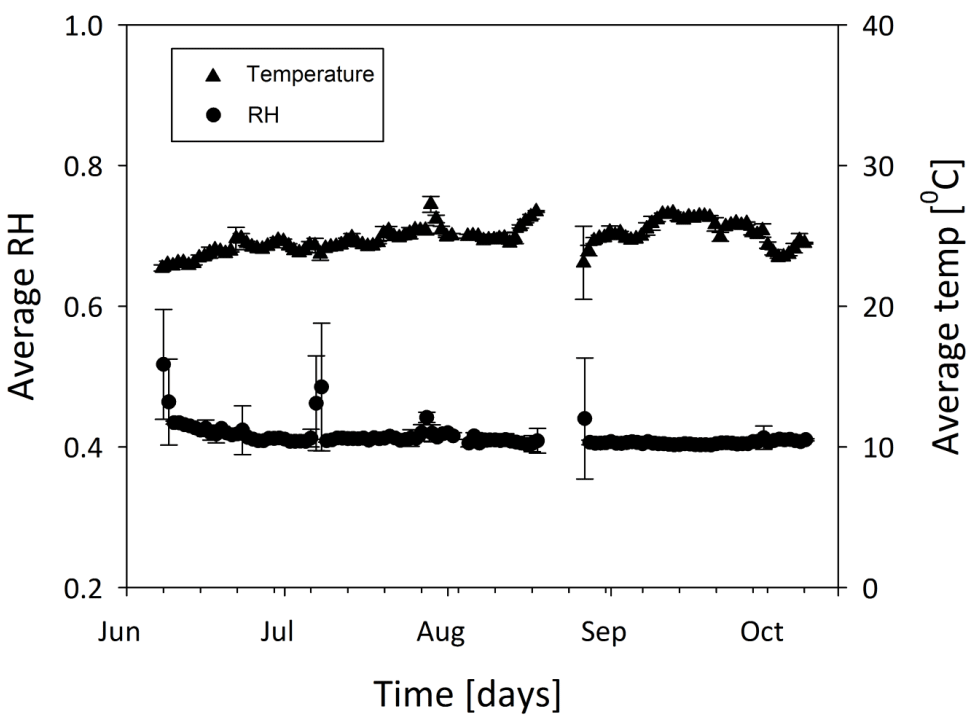
Figure A3Measured temperature and relative humidity during the unsaturated column experiment. Each point is a daily average of 144 measurements and corresponding standard error.

Figure A4Soil water pressure measurements over time. The water table is marked at 0 cm. Values around the −10 cm mark are from the low pressure meters of all six columns; values around −20 cm are from the high pressure meters.
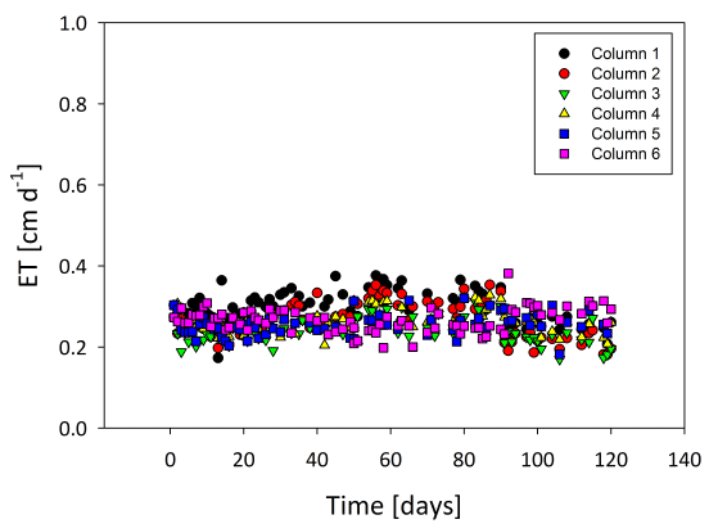
Figure A5Calculated ET during the experiment. Data presented are for each column separately (color coded; see legend).
The authors declare that they have no conflict of interest.
The authors would like to thank Harmen Vander Heide, Dan Beaver, Andrew Urschel, Scott
Ketcheson, Eric Kessel, Tasha-Leigh Gauthier, James Sherwood, Corey
Wells and Vito Lam for their help with logistics, fabrication and
analysis. Additionally, the authors thank Mazda Kompanizare, Behrad
Gharedaghloo, Fereidoun Rezanezhad and Sascha Christian Iden for
their advice. Funding from the following sources is gratefully
acknowledged: Natural Science and Engineering Research Council
Collaborative Research and Development (NSERC-CRD), Suncor Energy
Inc., Shell Canada Limited and Esso Imperial Oil Limited and the
German Academic Exchange Service.
Edited by: David Dunkerley
Reviewed by: two anonymous referees
Appelo, C. A. J. and Postma, D.: Geochemistry, Groundwater and Pollution, CRC press, Belkama, Rotterdam, the Netherlands, 2004.
Becher, H. H.: Ein Verfahren zur Messung der ungesättigten Wasserleitfähigkeit, J. Plant Nutr. Soil Sc., 128, 1–12, 1971.
Cameron, D. R. and Klute, A.: Convective-dispersive solute transport with a combined equilibrium and kinetic adsorption model, Water Resour. Res., 13, 183–188, 1977.
Cavanaugh, J. E.: Unifying the derivations of the Akaike and corrected Akaike information criteria, Stat. Probabil. Lett., 31, 201–208, 1997.
Clymo, R. S.: Peat, in: Mires, Swamp, Bog, Fen and Moor, General Studies (Ecosystem of the World 4A), edited by: Gore, A. J. P., Elsevier, Amsterdam, 159–224, 1983.
Coats, K. H. and Smith, B. D.: Dead-end pore volume and dispersion in porous media, Soc. Petrol. Eng. J., 4, 73–84, 1964.
Comas, X. and Slater, L.: Low-frequency electrical properties of peat, Water Resour. Res., 40, W12414, https://doi.org/10.1029/2004WR003534, 2004.
Daly, C., Price, J. S., Rezanezhad, F., Pouliot, R., Rochefort, L., and Graf, M.: Initiatives in oil sand reclamation: considerations for building a fen peatland in a post-mined oil sands landscape, in: Restoration and Reclamation of Boreal Ecosystems – Attaining Sustainable Development, edited by: Vitt, D. and Bhatti, J. S., Cambridge University Press, 179–201, 2012.
Elrick, D. E., Mermoud, A., and Monnier, T.: An analysis of solute accumulation during steady-state evaporation in an initially contaminated soil, J. Hydrol., 155, 27–38, 1994.
Feddes, R. A., Kowalik, P. J., and Zaradny, H.: Simulation of Field Water Use and Crop Yield, Centre for Agricultural Publishing and Documentation, Wiley, New York, USA, 188 pp., 1978.
Freeze, R. A. and Cherry, J. A.: Groundwater (No. 629.1 F7), Prentice-Hall, The University of Michigan, USA, 604 pp., 1979.
Fried, J. J. and Combarnous, M. A.: Dispersion in porous media, edited by: Chow, V. T., Adv. Hydrosci, 9, Academic Press, New York, USA, 169–282, 1971.
Gardner, W. H.: Water content, in: Methods of Soil Analysis: Physical and Mineralogical 29 Methods, edited by: Kiute, A., Agronomy Series 9 (Part 1), Soil Science Society of America, 30 Madison, Wisconsin, 493–544, 1986.
Hayward, M. P. and Clymo, S. R.: Profiles of Water Content and Pore Size in Sphagnum and Peat, and their Relation to Peat Bog Ecology, P Roy. Soc. Lond. B. Bio., 215, 299–325, https://doi.org/10.1098/rspb.1982.0044, 1982.
Ho, Y. S. and McKay, G.: The kinetics of sorption of divalent metal ions onto sphagnum moss peat, Water Res., 34, 735–742, 2000.
Hoag, R. S. and Price, J. S.: The effects of matrix diffusion on solute transport and retardation in undisturbed peat in laboratory columns, J. Contam. Hydrol., 28, 193–205, 1997.
Huysmans, M. and Dassargues, A.: Review of the use of Péclet numbers to determine the relative importance of advection and diffusion in low permeability environments, Hydrogeol. J., 13, 895–904, 2005.
Iden, S. C. and Durner, W.: Multiple batch extraction test to estimate contaminant release parameters using a Bayesian approach, J. Contam. Hydrol., 95, 168–182, 2008.
Kessel, E.: The hydrogeochemisty of a constructed fen peatland in a post-mined landscape in the Athabasca Oil Sands Region, Alberta, Canada, M.Sc. Thesis, Department of Geography and Environmenal Management, University of Waterloo, Waterloo, ON, Canada, 2016.
Ketcheson, S. J.: Hydrology of a constructed fen watershed in a post-mined landscape in the Athabasca oil sands region, Alberta, Canada, (Doctoral dissertation), University of Waterloo, Waterloo, ON, Canada, 2015.
Klute, A. and Dirksen, C.: Hydraulic conductivity and diffusivity: laboratory methods, in: Methods of Soil Analysis. Part 1. Physical and Mineralogical Methods, 2nd ed, edited by: Klute, A., Agronomy Monograph., 9. ASA, Madison, WI, 687–734, 1986.
Limpens, J., Berendse, F., Blodau, C., Canadell, J. G., Freeman, C., Holden, J., Roulet, N., Rydin, H., and Schaepman-Strub, G.: Peatlands and the carbon cycle: from local processes to global implications – a synthesis, Biogeosciences, 5, 1475–1491, https://doi.org/10.5194/bg-5-1475-2008, 2008.
Liu, H., Janssen, M., and Lennartz, B.: Changes in flow and transport patterns in fen peat following soil degradation, Eur. J. Soil Sci., 67, 763–772, 2016.
McCarter, C., Ketcheson, S. J., Weber, T. K. D., Whittington, P. N., Scarlett, S., and Price, J. S.: Modified Technique for Measuring Unsaturated Hydraulic Conductivity in Sphagnum Moss and Peat., Soil Sci. Soc. Am. J., 81, 747–757, https://doi.org/10.2136/sssaj2017.01.0006, 2017.
Mualem, Y.: A new model for predicting the hydraulic conductivity of unsaturated porous media, Water Resour. Res., 12, 513–522, 1976.
Mullen, K., Ardia, D., Gil, D., Windover, D., and Cline, J.: “DEoptim”: An R Package for Global Optimization by Differential Evolution, J. Stat. Softw., 40, 1–26, 2011.
Nielsen, D. R., Van Genuchten, M. Th., and Biggar, J. W.: Water flow and solute transport processes in the unsaturated zone, Water Resour. Res., 22, 89S–108S, https://doi.org/10.1029/WR022i09Sp0089S, 1986.
Nkedi-Kizza, P., Biggar, J. W., Selim, H. M., Van Genuchten, M. T., Wierenga, P. J., Davidson, J. M., and Nielsen, D. R.: On the equivalence of two conceptual models for describing ion exchange during transport through an aggregated oxisol, Water Resour. Res., 20, 1123–1130, 1984.
Nkedi-Kizza, P., Brusseau, M. L., Rao, P. S. C., and Hornsby, A. G.: Nonequilibrium sorption during displacement of hydrophobic organic chemicals and calcium-45 through soil columns with aqueous and mixed solvents, Environ. Sci. Technol., 23, 814–820, 1989.
Nwaishi, F., Petrone, R. M., Price, J. S., Ketcheson, S. J., Slawson, R., and Andersen, R.: Impacts of donor-peat management practices on the functional characteristics of a constructed fen, Ecol. Eng., 81, 471–480, 2015.
Olsen, H., Gui, S., and Lu, N.: Critical review of coupled flow theories for clay barriers, Transport Res. Rec., 1714, 57–64, 2000.
Ours, D. P., Siegel, D. I., and Glaser, P. H.: Chemical dilation and the dual porosity of humified bog peat, J. Hydrol., 196, 348–360, 1997.
Parker, J. C. and Valocchi, A.: Constraints on the validity of equilibrium and first-order kinetic transport models in structural soils, Water Resour. Res., 22, 399–407, 1986.
Passioura, J. B.: Hydrodynamic dispersion in aggregated media: 1. Theory, Soil Sci., 111, 339–344, 1971.
Perkins, T. K. and Johnston, O. C.: A review of diffusion and dispersion in porous media, Soc. Petrol. Eng. J., 3, 70–84, 1963.
Peters, A. and Durner, W.: A simple model for describing hydraulic conductivity in unsaturated porous media accounting for film and capillary flow, Water Resour. Res., 44, W11417, https://doi.org/10.1029/2008WR007136, 2008.
Peters, A., Iden, S. C., and Durner, W.: Revisiting the simplified evaporation method: Identification of hydraulic functions considering vapor, film and corner flow, J. Hydrol., 527, 531–542, https://doi.org/10.1016/j.jhydrol.2015.05.020, 2015.
Philip, J. R.: Diffusion, dead-end pores, and linearized absorption in aggregated media, Soil Res., 6, 21–30, 1968.
Price, J. S. and Woo, M. K.: Wetlands as waste repositories? Solute transport in peat, in: Proc. Nat. Student Conference on Northern Studies, Assoc. of Canadian Universities for Northern Studies, Ottawa, Ont., 18–19 November 1986, 392–395, 1988.
Price, J. S., Whittington, P. N., Elrick, D. E., Strack, M., Brunet, N., and Faux, E.: A method to determine unsaturated hydraulic conductivity in living and undecomposed moss, Soil Sci. Soc. Am. J., 72, 487–491, 2008.
Price, J. S., Rochefort, L., Rezanezhad, F., Pouliot, R., Graf, M. D., and Andersen, R.: Fen creation in the Athabasca oil sands region, Final Report and Implications, Suncor Energy Inc., 178 pp., 2011.
Priesack, E. and Durner, W.: Closed-form expression for the multi-modal unsaturated conductivity function, Vadose Zone J., 5, 121–124, 2006.
R Core Team: R (version 3.1.2): A language and environment for statistical computing, R Foundation for Statistical Computing, Vienna, Austria, 2014.
Rajendran, A., Kariwala, V., and Farooq, S.: Correction procedures for extra-column effects in dynamic column breakthrough experiments, Chem. Eng. Sci., 63, 2696–2706, 2008.
Rezanezhad, F., Price, J. S., and Craig, J. R.: The effect of dual-porosity on transport and retardation in peat: a laboratory experiment, Can. J. Soil Sci., 92, 1–10, 2012.
Rezanezhad, F., Price, J. S., Quinton, W. L., Lennartz, B., Milojevic, T., and Van Cappellen, P.: Structure of peat soils and implications for water storage, flow and solute transport: a review update for geochemists, Chem. Geol., 419, 75–84, 2016.
Rezanezhad, F., Kleimeier, C., Milojevic, T., Liu, H., Weber T. K. D., Van Cappellen, P., and Lennartz, B.: The Role of Pore Structure on Nitrate Reduction in Peat Soil: A Physical Characterization of Pore Distribution and Solute Transport, Wetlands, 37, 951–960, https://doi.org/10.1007/s13157-017-0930-4, 2017.
Schindler, U.: Ein Schnellverfahren zur Messung der Wasserleitfähigkeit im teilgesättigten Boden an Stechzylinderproben, Arch. Acker Pfl. Boden., 24, 1–7, 1980.
Simhayov, R. B., Price, J. S., Smeaton, C. M., Parsons, C., Rezanezhad, F., and Van Cappellen, P.: Solute pools in Nikanotee Fen watershed in the Athabasca oil sands region, Environ. Pollut., 225, 150–162, 2017.
Šimůnek, J. and van Genuchten, M. T.: Modeling nonequilibrium flow and transport processes using HYDRUS, Vadose Zone J., 7, 782–797, 2008.
Šimůnek, J., van Genuchten, M. T., and Šejna, M.: Development and applications of the HYDRUS and STANMOD software packages and related codes, Vadose Zone J., 7, 587–600, 2008.
Skaggs, T. H. and Leij, F. J.: Chapter 6.3: Solute transport: theoretical background, in: Methods of Soil Analysis: Part 4. Physical Methods, edited by: Dane, J. H. and Topp, C. G., SSSA, Madison, Wisc., 1353–1380, 2002.
Swartzendruber, D.: The flow of water in unsaturated soils, Flow through porous media, Academic Press, New York, 215–291, 1969.
Tiemeyer, B., Pfaffner, N., Frank, S., Kaiser, K., Fiedler, S.: Pore water velocity and ionic strength effects on DOC release from peat-sand mixtures: results from laboratory and field experiments, Geoderma, 296, 86–97, 2017.
Toride, N., Leij, F. J., and Genuchten, M. T.: A comprehensive set of analytical solutions for nonequilibrium solute transport with first-order decay and zero-order production, Water Resour. Res., 29, 2167–2182, 1993.
Toride, N., Leij, F. J., and Van Genuchten, M. T.: The CXTFIT code for estimating transport parameters from laboratory or filed tracer experiments, US Salinity Laboratory, Riverside, 1995.
Tsypkin, G. G.: Accumulation and precipitation of salts during groundwater evaporation and flow, Fluid Dyn., 38, 900–907, 2003.
Vanderborght, J., Mallants, D., Vanclooster, M., and Feyen, J.: Parameter uncertainty in the mobile-immobile solute transport model, J. Hydrol., 190, 75–101, 1997.
van Genuchten, M. T. and Wierenga, P. J.: Mass Transfer Studies in Sorbing Porous Media I, Analytical Solutions1, Soil Sci. Soc. Am. J. 40, 473, https://doi.org/10.2136/sssaj1976.03615995004000040011x, 1976.
Van Genuchten, M. T.: A closed-form equation for predicting the hydraulic conductivity of unsaturated soils, Soil Sci. Soc. Am. J., 44, 892–898, 1980.
Van Genuchten, M. T. and Alves, W. J.: Analytical solutions of the one-dimensional convective-dispersive solute transport equation (No. 157268), United States Department of Agriculture, Economic Research Service, 1982.
Van Genuchten, M. T. and Wagenet, R. J.: Two-site/two-region models for pesticide transport and degradation: theoretical development and analytical solutions, Soil Sci. Soc. Am. J., 53, 1303–1310, 1989.
Van Genuchten, M. T., Davidson, J. M., and Wierenga, P. J.: An evaluation of kinetic and equilibrium equations for the prediction of pesticide movement through porous media, Soil Sci. Soc. Am. J., 38, 29–35, 1974.
Vogeler, I., Duwig, C., Clothier, B. E., and Green, S. R.: A simple approach to determine reactive solute transport using time domain reflectometry, Soil Sci. Soc. Am. J., 64, 12–18, 2000.
Vrugt, J. A. and Dane, J. H.: Inverse modelling of soil hydraulic properties, Encyclopaedia of Hydrological Sciences, 6, 77, https://doi.org/10.1002/0470848944.hsa079, 2006.
Weber, T. K. D., Iden, S. C., and Durner, W.: Unsaturated hydraulic properties of Sphagnum moss and peat reveal trimodal pore-size distributions, Water Resour. Res., 53, 415–434, 2017a.
Weber, T. K. D., Iden, S. C., and Durner, W.: A pore-size classification for peat bogs derived from unsaturated hydraulic properties, Hydrol. Earth Syst. Sci., 21, 6185–6200, https://doi.org/10.5194/hess-21-6185-2017, 2017b.
Wehrer, M. and Totsche, K. U.: Determination of effective release rates of polycyclic aromatic hydrocarbons and dissolved organic carbon by column outflow experiments, Eur. J. Soil Sci., 56, 803–813, 1995.
Ye, M., Meyer, P. D., and Neuman, S. P.: On model selection criteria in multimodel analysis, Water Resour. Res., 44, W03428, https://doi.org/10.1029/2008WR006803, 2008.
Zurmühl, T. and Durner, W.: Modeling transient water and solute transport in a biporous soil, Water Resour. Res., 32, 819–829, 1996.