the Creative Commons Attribution 4.0 License.
the Creative Commons Attribution 4.0 License.
 | 13 Sep 2018
Continental soil drivers of ammonium and nitrate in Australia
Juhwan Lee
Gina M. Garland
Raphael A. Viscarra Rossel
Soil N is an essential element for plant growth, but its mineral forms are subject to loss from the environment by leaching and gaseous emissions. Despite its importance for the soil-plant system, factors controlling soil mineral N contents over large spatial scales are not well understood. We used and contents (0–30 cm depth) from 469 sites across Australia and determined soil controls on their regional variation. Soil mineral N varied regionally but depended on the different land uses. In the agricultural region of Australia, tended to be similar (median 4.0 vs. 3.5 mg N kg−1) and was significantly enriched (3.0 vs. 1.0 mg N kg−1), compared to the non-agricultural region. The importance of soil controls on mineral N in the agricultural region, identified by the model trees algorithm Cubist, showed that was affected by total N, cation exchange capacity (CEC) and pH. In the non-agricultural region, was affected not only by CEC and pH, but also by organic C and total P. In each of the regions, was primarily affected by CEC, with more complex biophysical controls. In both regions, correlations between mineral N and soil C : N : P stoichiometry suggest that more was found in P-depleted soil relative to total C and total N. However, our results showed that only in the non-agricultural region was sensitive to the state of C and its interaction with N and P. The models helped to explain 36 %–68 % of regional variation in mineral N. Although soil controls on high N contents were highly uncertain, we found that region-specific interactions of soil properties control mineral N contents. It is therefore essential to understand how they alter soil mechanisms and N cycling at large scales.
Please read the corrigendum first before continuing.
-
Notice on corrigendum
The requested paper has a corresponding corrigendum published. Please read the corrigendum first before downloading the article.
-
Article
(2168 KB)
- Corrigendum
-
Supplement
(423 KB)
-
The requested paper has a corresponding corrigendum published. Please read the corrigendum first before downloading the article.
- Article
(2168 KB) - Full-text XML
- Corrigendum
-
Supplement
(423 KB) - BibTeX
- EndNote


Nitrogen is an essential element and one of the main factors limiting the functioning and productivity of various soil-plant systems. This is particularly the case in cropping-dominant systems, where annual crop productivity often depends on rotations with N2-fixing legumes or the continuous addition of chemical fertilizer or organic matter. External N enters the soil (e.g. atmospheric N deposition and fertilizer N) and plants (e.g. N2 fixation) and cycles through them in various chemical forms or states, mostly mediated by soil microbes. Mineralization (ammonification), microbial immobilization, nitrification, and denitrification determine the availability of or that can be taken up by plants or lost to the environment, which in turn contributes to the regulation of terrestrial C sequestration (Ciais et al., 2013; Luo et al., 2004; Post et al., 1985; Rastetter et al., 1997; Thornton et al., 2007). Biotic and abiotic transformations of N from mineralized soil organic matter or those derived from external soil inputs are spatially and temporally variable. In addition, different mineral forms of N (e.g. and ) often show different distribution patterns and their relative importance in terms of the contribution to total N stocks across a broad range of land uses and management practices due to different climatic and ecological conditions (Farley and Fitter, 1999; Johnston, 1993).
Managed soil, especially that used for agricultural production and grazing, is often characterized by N imbalances and reactive N losses to the environment (Ciais et al., 2013; Fowler et al., 2013; Vitousek et al., 1997). One of the consequences of continuous cropping on the N cycle is the increased emissions of ammonia, N oxides (NOx), and nitrous oxide (N2O), mainly through N fertilizer application. Nitrous oxide is a potent greenhouse gas and ozone-depleting substance, while NOx produces ozone in the troposphere (Ravishankara et al., 2009). Other concerns include the leaching of to groundwater, which may contribute to terrestrial and coastal eutrophication (Conley et al., 2009). Accordingly, there are increasing demands to measure or simulate the fate of residual mineral N across agricultural areas as well as in the soil under native vegetation, which can be conceptually linked to the loss of N to air and water upon land-use conversion. Indeed, there is a strong need for large-scale soil information from which one can accurately define current baselines and determine the state of soil mineral N and its response to soil conditions. However, such large-scale soil information is generally not available.
Soil mineral N contents can be highly variable and uncertain because multiple reaction pathways and oxidation states of N processes exist (Butterbach-Bahl et al., 2013). Nitrogen transformation processes in soil are controlled by the complex interactions of soil variables, such as substrate availability, pH, and temperature and water content, which are affected by ecological factors (i.e. soil, climate, vegetation and topography) and past management history. In particular, soil properties related to the storage and quality of soil organic matter and its management could affect the levels and variation in soil and (Vagstad et al., 1997). Soil N transformations also involve the biogeochemistry of other nutrients, such as C and P, which are key constituents of organic molecules. In particular, regular N input into the soil, including plant N returning to the soil as residues or decomposing roots, is important for the maintenance of soil organic C (SOC) (therefore the availability of soil N to plants) and closely interacts with the terrestrial organic C sink (Rastetter et al., 1997; Zaehle, 2013). Stiles et al. (2017) showed that N fertilizer addition alone resulted in an increase in both SOC and total N, but the combined addition of N and P had the opposite effect. Conversely, there are studies showing that SOC can be depleted by N fertilizer application (Neff et al., 2002; Shahbaz et al., 2017). Overall, N cycling is closely linked to soil C sequestration and stabilization, but C–N cycle coupling can be complicated through changes in soil P. Glendining et al. (2011) found that, globally, SOC and the C:N ratio of soil organic matter are important controls of total N in soil, although large uncertainties remain. Therefore, the effects of soil N and P and their elemental interactions on mineral N dynamics are important (Booth et al., 2005; Taylor and Townsend, 2010), but they have not been widely explored across large spatial scales.
Differences in inherent soil properties as well as land use cause a shift in dominant forms of soil N and its distribution across sites. Land uses are generally characterized by vegetation types, dominant sources of soil N input, and the levels of soil disturbance and often coincide with climate and ecological conditions. Therefore, it may be possible to specifically compare the patterns of mineral N across broad regions by land use. The amount of N stored in soil in organic and mineral forms is considered a limiting factor for the primary productivity of many ecosystems. How primary productivity is managed affects the rate at which soil N and other essential nutrients are replenished. Yet, there is often a long-term tendency of ecological properties, such as biodiversity, to decline with external additions of reactive N through atmospheric deposition and fertilizer inputs (De Schrijver et al., 2011). It is therefore important to determine soil mineral N patterns and their controlling factors, but there are limited soil N data available for understanding plant and soil processes at different scales.
Since primary soil controls on mineral N are largely unknown on the continental scale of Australia, it is relevant to measure and understand how the state of soil N differs between regions, where diverse dominant land-use conditions exist. Our aim here is to determine soil controls on the continental variation in soil and contents between and within the agricultural and non-agricultural regions of Australia. We focused on a set of soil attributes and assessed their importance for determining the large-scale drivers of mineral N contents by land use.
2.1 Data sets
We used two soil data sets for our analysis. First, the Biomes of Australian Soil Environments (BASE) project (Bissett et al., 2016) provides soil and other contextual data across the continent, originally developed for the assessment of soil biodiversity (available at https://data.bioplatforms.com, last access: 26 February 2018). The BASE project performed soil sampling and analysis, as described in Bissett et al. (2016). For this study, we obtained the contents of soil and (mg N kg−1), total organic C (TOC) (%), exchangeable cations (Al3+, Ca2+, Mg2+, K+, and Na+ in mequiv 100 g−1), texture (%) and pH (in CaCl2) from BASE, which were measured at the 0–0.1 and 0.2–0.3 m depths from over 650 sites across Australia between 2011 and 2016 (Fig. 1). Each sample was collected from a site that represented a unique combination of soil, climate and management. Specifically, between 9 and 30 soil cores were sampled in a 25 m × 25 m quadrat and split into two different depths, 0–0.1 and 0.2–0.3 m, respectively, and then combined into one composite sample (approximately 1 kg of soil) for each depth. Site soil sampling was done in a destructive manner and measured at a single time point. The contents of mineral N were determined colourimetrically on dried soil samples <2 mm after extraction with 1 M KCl. Spatial distribution of and content can be different and temporally unstable for each site (Giebel et al., 2006). So far, this is the most comprehensive data describing soil mineral N pools across different soil and land-use types of Australia at the continental scale, including a wide range of agricultural soil conditions. At the scale of this study, we assumed that spatial patterns of soil mineral N remained persistent with time. This assumption was based on the number of sites across which the effect of confounding factors may be minimized. The size of sampling area was fixed to match the smallest grid size of legacy soil attribute maps in Australia. Although fine-resolution (<25 m) soil heterogeneity was not addressed, the BASE data of soil and contents could be extended with key soil attributes previously produced from national mapping efforts but not measured in BASE. The exchangeable cations were summed to estimate cation exchange capacity (CEC).
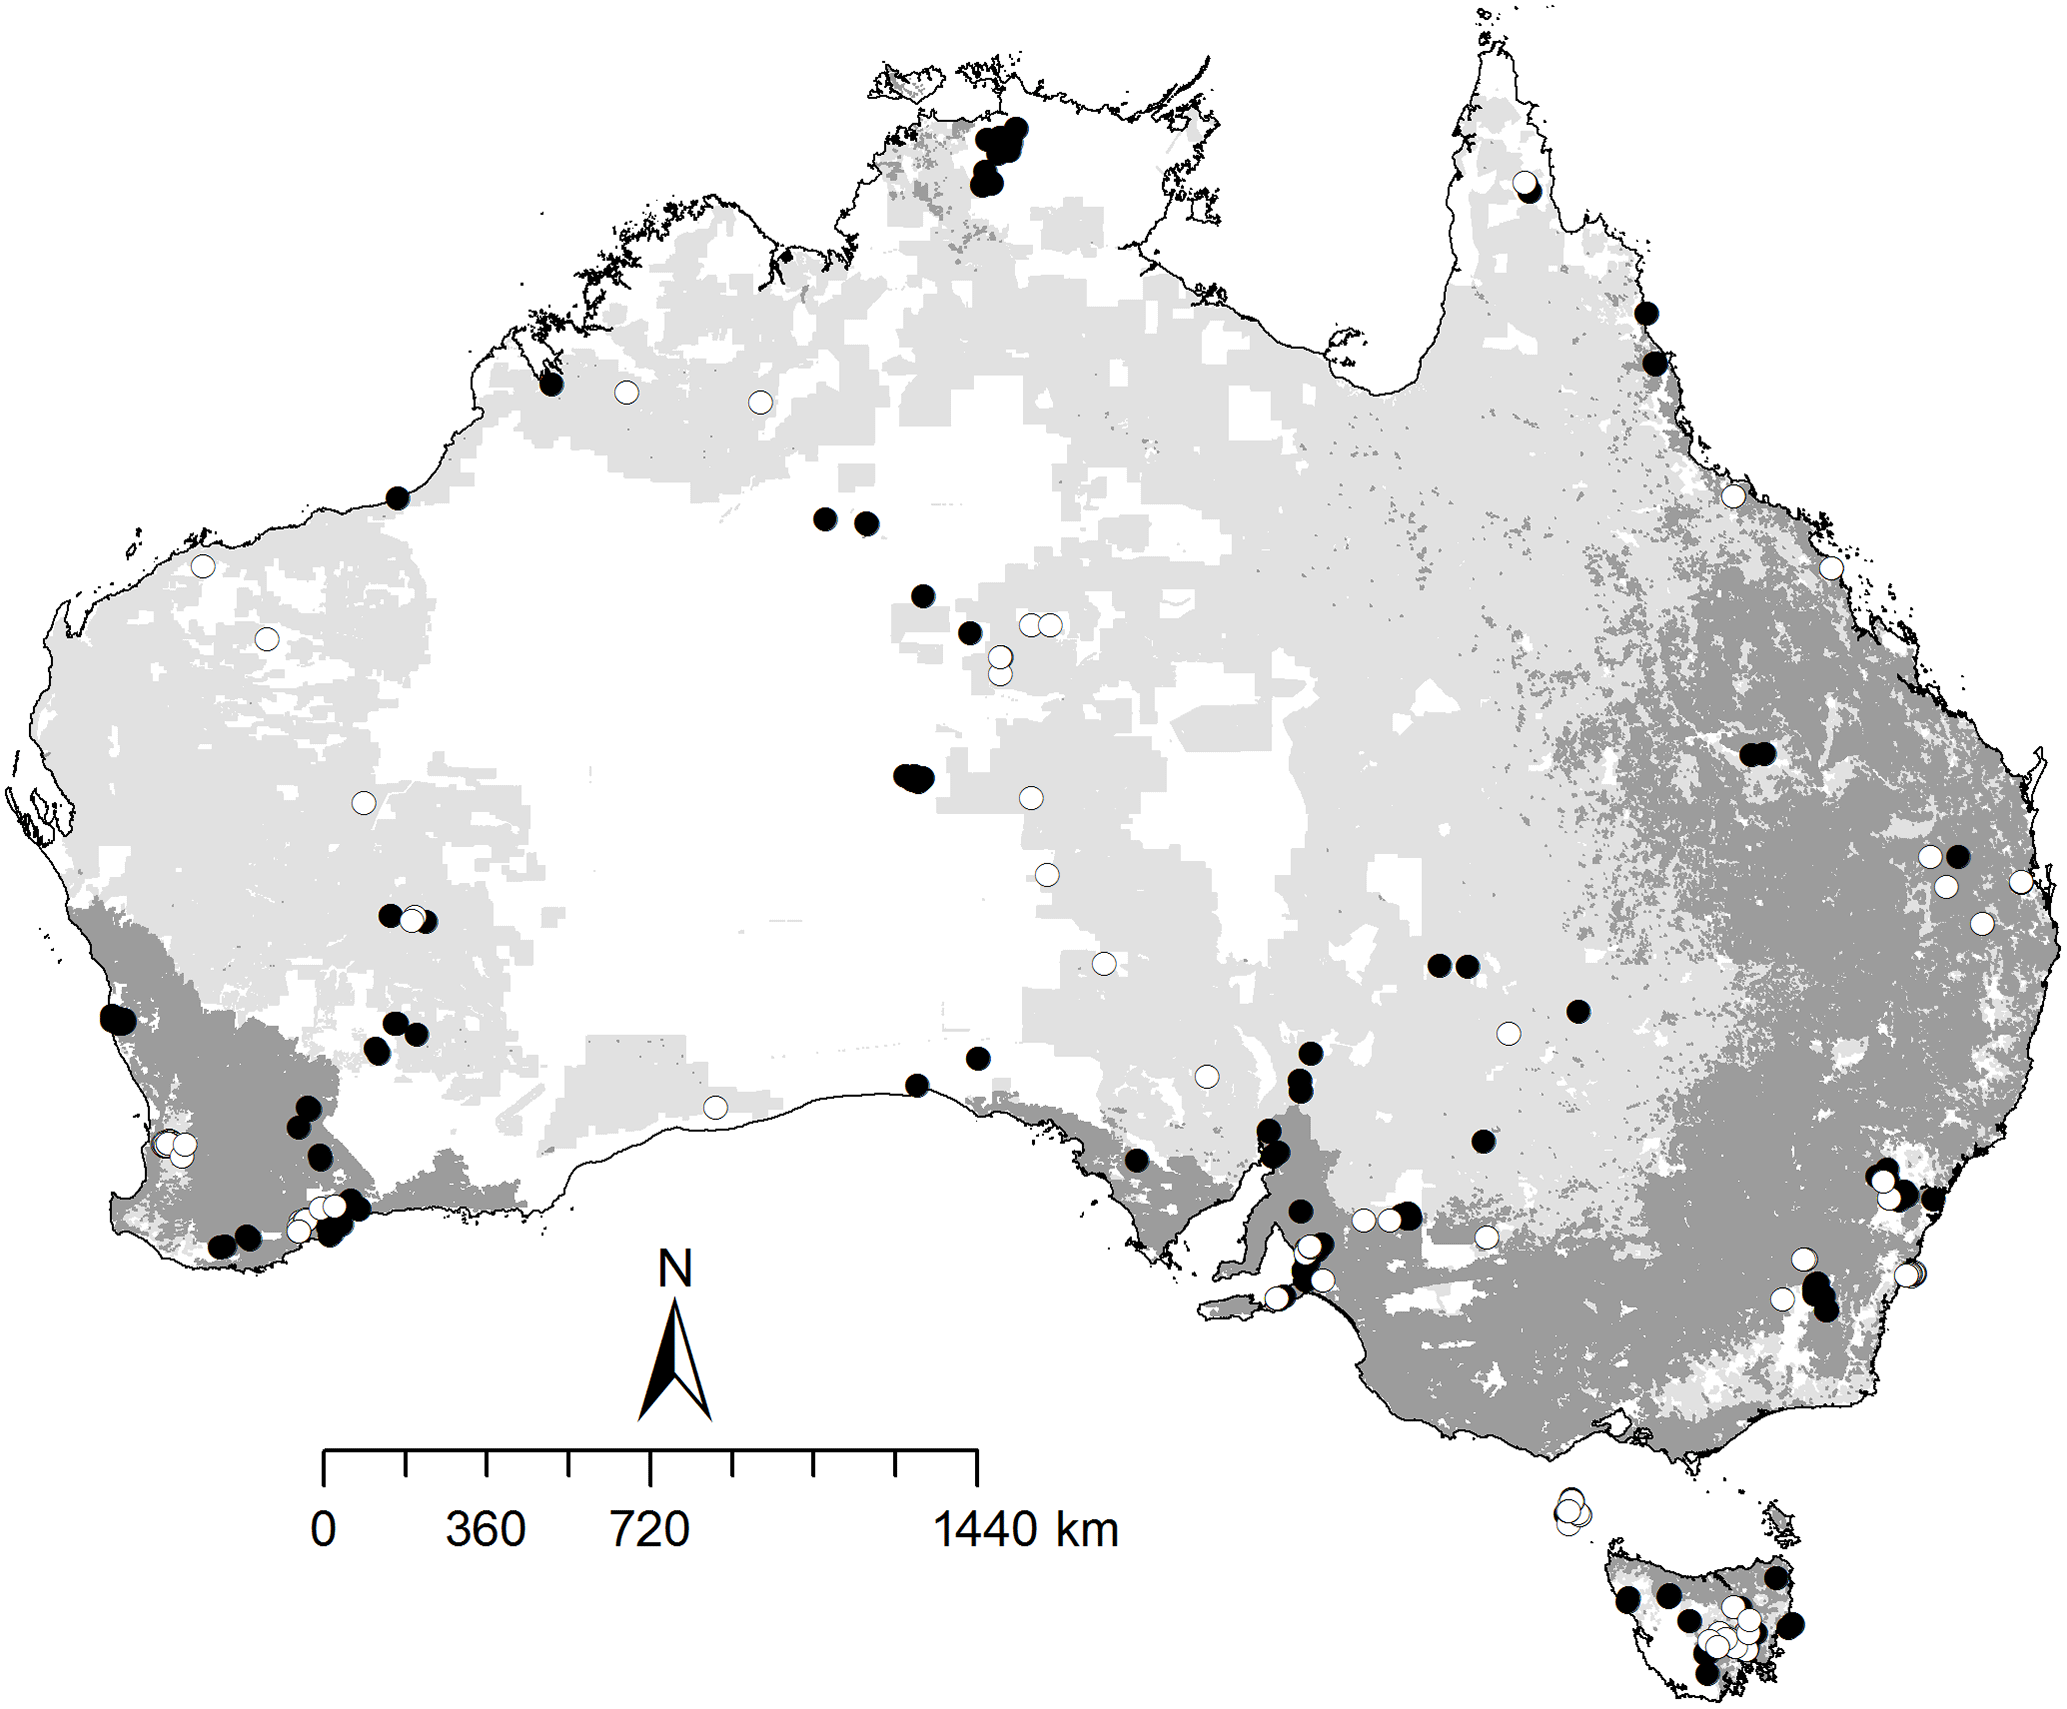
Figure 1Location of 469 sampling sites across Australia, indicated with open circles for soils used for dryland and irrigated cropping and from improved and native pastures used for animal grazing (160 sites), and closed circles for soils from areas that are conserved and in natural environments outside of the agricultural production zones (309 sites). The dark grey area represents intensive agricultural and plantation production. The light grey area represents agricultural production from relatively natural environments. The white area indicates the non-agricultural region.
Second, to complement the BASE data set, we used Australian soil attribute values extracted from recently produced soil maps with robust uncertainty estimates at a pixel resolution of 90 × 90 m (or 3 arcsec) (Viscarra Rossel et al., 2015). The maps that we used were the percentage of total N (TN) and total P (TP) contents, bulk density (BD) (g cm−3), and available water capacity (AWC). Each of the Australian soil attribute maps were independently produced by 3-D spatial modelling that combined historical soil data and estimates derived from visual and infrared soil spectra. The approaches used to produce the maps were described in detail in Viscarra Rossel et al. (2015). When the soil maps were produced at the fine spatial scale, auxiliary environmental data were already considered in the spatial modelling. These variables represent proxies for the main environmental factors of soil formation, which were related to parent material, climate, biota and vegetation, and terrain and landscape position. For this study, a weighted average over the 0–5, 5–15, and 15–30 cm depths was calculated for each of the mentioned soil variables. The depth-average values of each soil attribute were extracted using the coordinates from the 469 sites at which both and contents were measured. The extraction of grid values to each geographic location and the compiling of data was done in the Geographic Resources Analysis Support System (GRASS) GIS 7.2 (http://grass.osgeo.org, last access: 1 January 2018).
2.2 Data analyses
The data set was screened for any missing values of land uses and soil properties. A total of 469 sites were retained for data analyses (Fig. 1), and we performed the analyses on (1) all samples, (2) the samples from the sites that mainly originate from dryland and irrigated cropping and from improved and native pastures used for animal grazing (hereafter referred to as the “agricultural” region), and (3) the samples from the protected sites and those in natural environments outside of the agricultural production zones (referred as the “non-agricultural” region) (Fig 1). The agricultural region (160 sites) covers the main grain-cropping zones of Australia, which differ by climate and soil regimes and farming practices. Sites used for agricultural production from relatively natural environment did not receive external N fertilization but some N excretion by grazing animals or biomass inputs from commercial production. There was no livestock grazing in the non-agricultural region. If the content of soil mineral N in the data was reported as the value at or below the detection limit of 1 ppm, it was replaced with 0.5 mg N kg−1 (a median of the detection limit). The content of soil mineral N was averaged over the two sampling depths and then log transformed to approximate normality. Mean comparisons of the log-transformed data were performed between the regions at the 0.05 significance level (p<0.05) using the analysis of variance (ANOVA). Tukey's HSD test was used to compare the measured mineral N contents among the multiple land uses. The data set covered four general land uses: (1) conservation and natural environments, (2) production from dryland agriculture and plantations, (3) production from irrigated agriculture and plantations and (4) production from relatively natural environments. The general land use classes included 28 detailed land uses, according to the Australian Land Use and Management Classification (Table S1 in the Supplement).
The contents of soil , , TOC, TN, TP, CEC, and the fraction of sand, silt, clay, BD, and AWC, except for pH, were log transformed for further modelling. For each of the soil and measurements, data analyses were performed on the whole data, including 22 samples for and 170 samples for , which were measured under the detection limit. Only 3 and 42 of these samples for and were located within the agricultural region, respectively. Empirical models of soil mineral N as a function of the selected soil properties were built using the machine learning algorithm Cubist (Quinlan, 1992). Cubist is a form of a rule-based decision tree with piecewise linear models. Models were developed and evaluated by 10-fold, 50-repeated cross-validation. Model performance was assessed using the coefficient of the determination (R2), the root mean squared error (RMSE), the mean error (ME), and the standard deviation of the error (SDE). In Cubist, the number of committees was fixed as one to avoid producing complex models, but the number of nearest neighbours was optimized using the RMSE of resampling results. The optimized models consisted of 1–8 different rule sets, with 3–9 neighbours. The importance of each soil variable was assessed based on the usage of each individual variable in the rule conditions and the model for Cubist. The cut-off was set at 80 % as the probability to be essentially used in either the rule conditions or the linear model. In addition, the sensitivity of important soil variables was tested with 5, 10, and 20 committee models. The same data analysis and regression approach were applied on the data sets for the agricultural and non-agricultural regions separately, and then a Pearson correlation analysis was performed, accordingly. All statistical analyses and Cubist modelling were performed in the R version 3.4.3 (R Core Team, 2017). Functions from the “Cubist” (version 0.0.21) and “caret” (version 6.0.76) packages were used.
3.1 Soil mineral N in relation to large-scale land use
The median contents of and in the soil were 3.5 and 1.5 mg N kg−1, respectively, across all sites (Fig. 2). The interquartile ranges of and contents were 1.75–6.0 and 0.5–4.5 mg N kg−1. The corresponding coefficient of variation was 147 % for and 215 % for across the sites, showing wide variation in the measured soil mineral N. The median sum of and was 6.0 mg N kg−1, with the interquartile range of 3.5–12.0 and the maximum of up to 123 mg N kg−1. Compared to the non-agricultural region, the soil in the agricultural region had similar contents of (4.0 vs. 3.5 mg N kg−1) but significantly (p<0.05) larger contents of (3.0 vs. 1.0 mg N kg−1). There were a number of sites with relatively small contents of mineral N, particularly . If we only considered soil contents above the detection limit, the median contents would then increase to 4.5 mg N kg−1 in the agricultural region and to 2.5 mg N kg−1 in the non-agricultural region. Nevertheless, the regional patterns of and remained consistent. The sum of soil mineral N showed a regional difference similar to that of . For all sites, the ratio of -N to -N was about 2.0 (interquartile range 0.75–6.0). Specifically, soil was identified as a dominant mineral form of N at 309 sites. The and fractions of TN were 0.4 % and 0.2 %, respectively, and comprised together approximately 1 %–2 % of TN in the soil at the sites. The fraction of TN ranged between 0.01 % and 10.0 % and appeared to be more variable than that of , which had the range of 0.05 %–5.8 %. The -N : -N ratio was significantly lower in the agricultural region (median 1.4) than the non-agricultural region (median 2.3). This also corresponded to a significantly higher fraction of TN in the agricultural region, compared to the non-agricultural region.
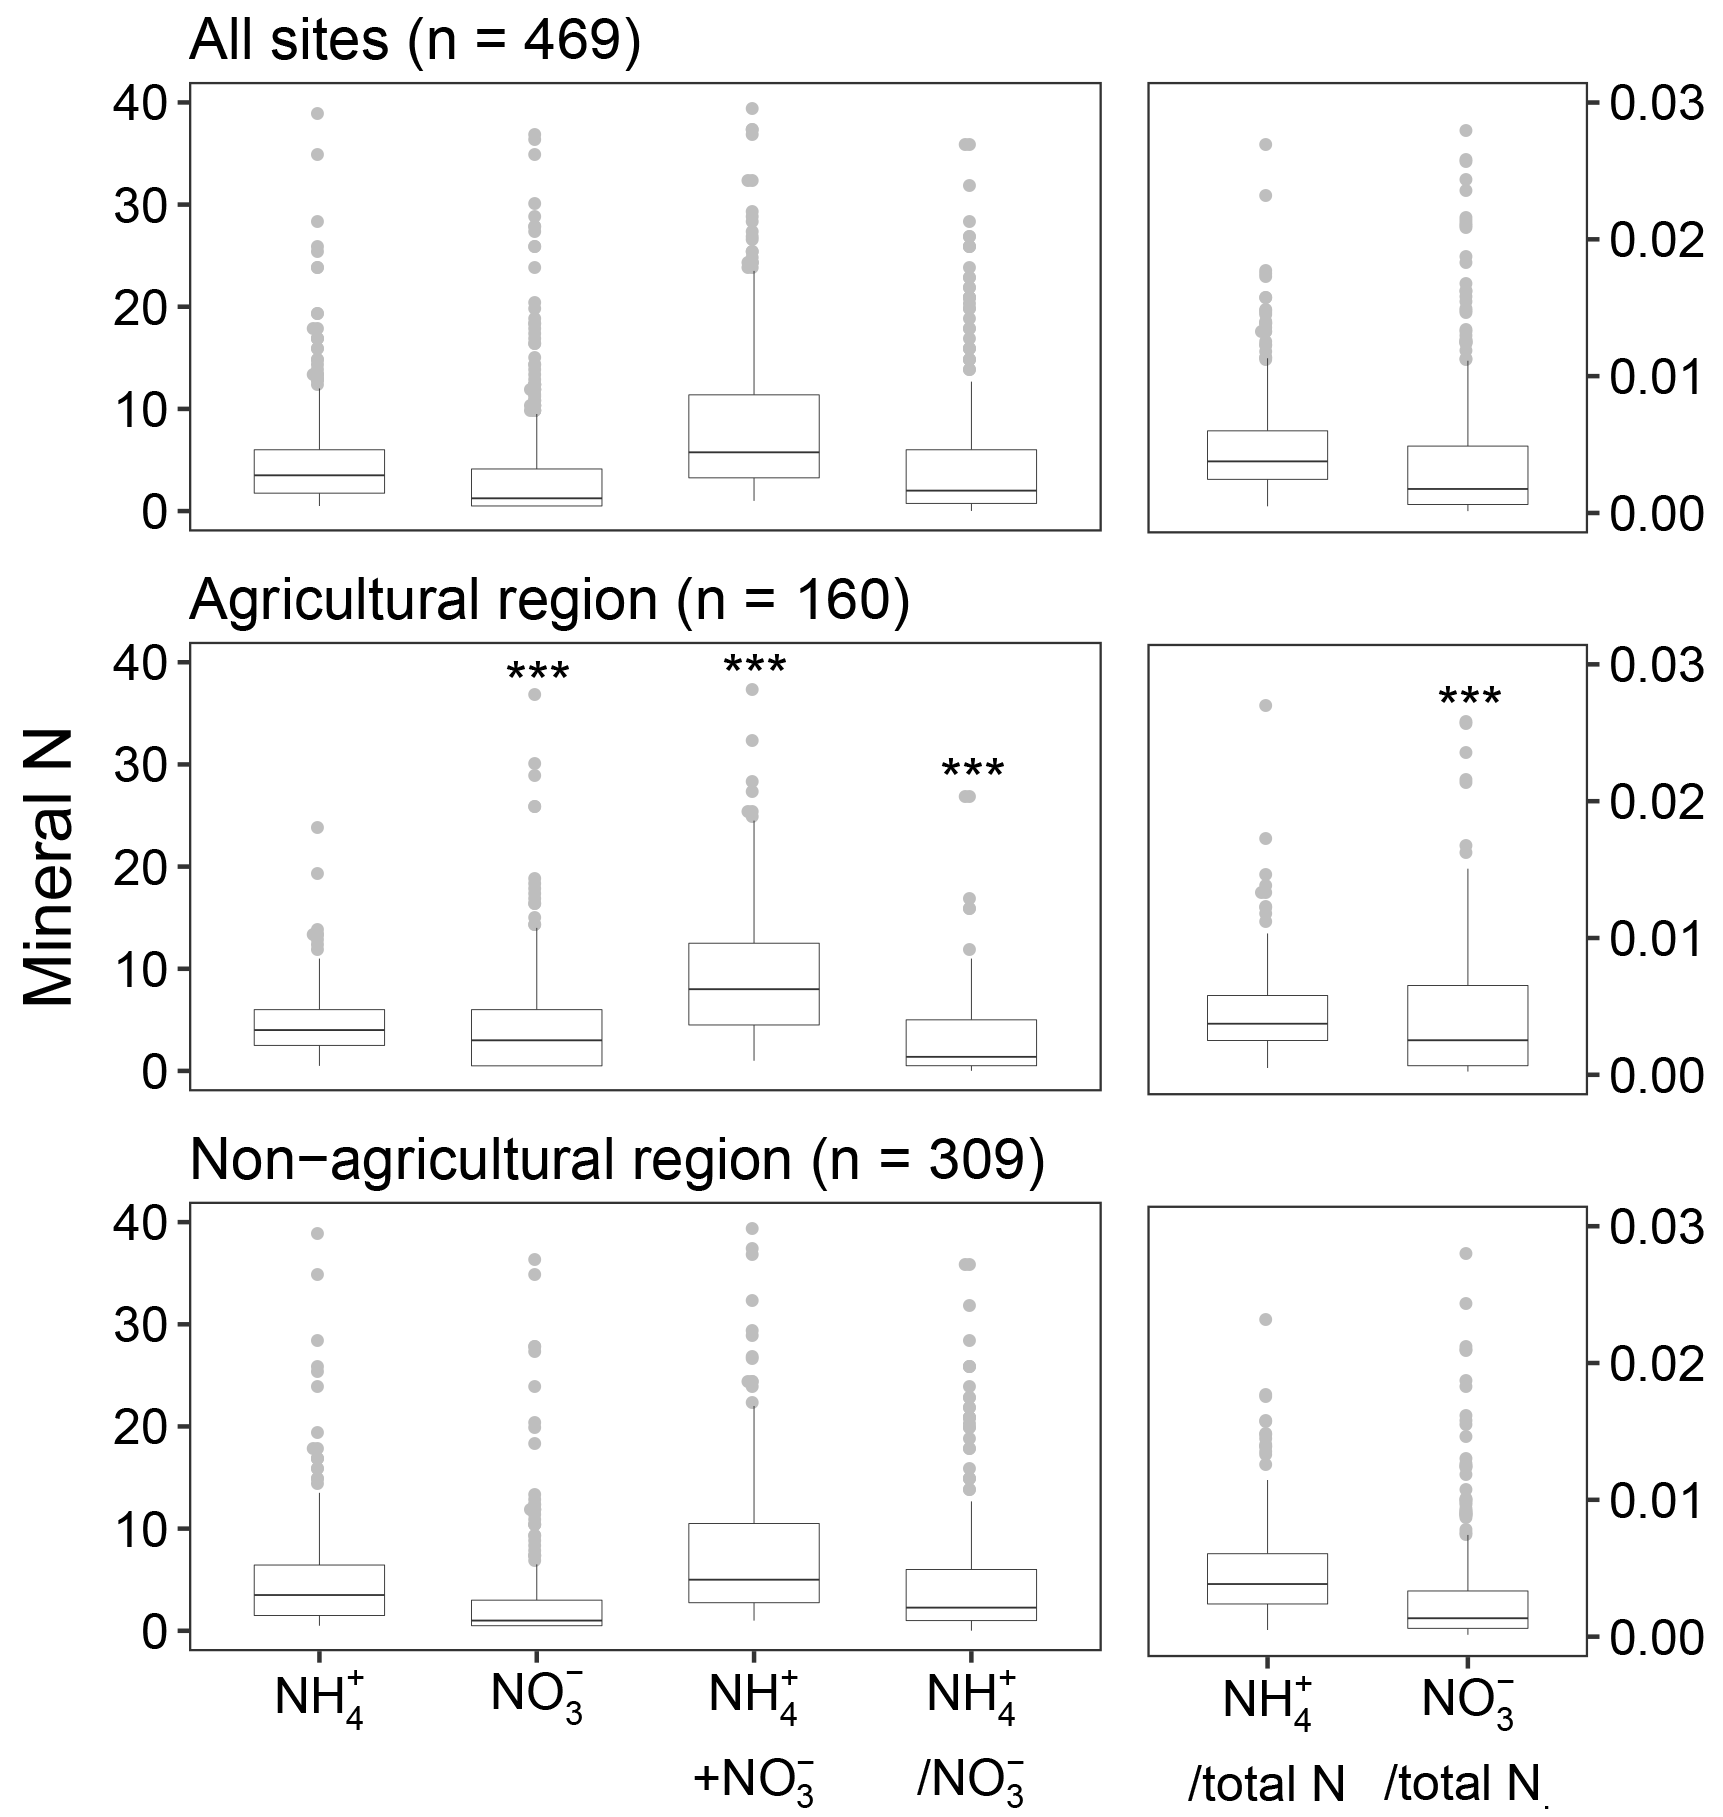
Figure 2Mineral N contents (mg N kg−1) and fractions of total N in soil. The bottom, middle, and top of each box represents the 25th, 50th (median), and 75th percentiles, respectively. The points above the whiskers are extreme values. Means between main agricultural and non-agricultural regions of Australia are significantly different at P-value <0.001 (***), indicated by the ANOVA on the log of the values.
Table 1Summary of and contents (mg N kg−1) in Australian soil by land use across 469 sites. Means with different letters are significantly different at p<0.05, based on Tukey's HSD on the log of the values. Any categorical variables with a sample size of <10 are considered in the multiple mean comparisons but not presented in the table. See Table S1 for the definition of land uses.
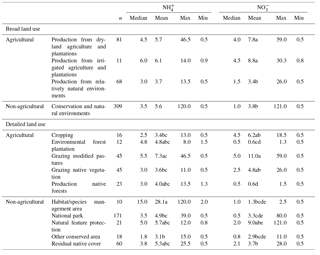
The contents of and differed by both broad and detailed land uses (Table 1). Soil contents showed no difference among the broad land uses, but there was more variation for conservation and natural environments, compared to the other land uses. Relatively low contents were found in the soil used for production from relatively natural environments. Overall, also considering the limited data, no apparent differences were found between the detailed land uses. Large soil contents generally resulted from agricultural production, compared to the soil in conservation and natural environments or those used mainly for production from relatively natural environments. This pattern was generally found for detailed land uses as well.
3.2 Soil controls on the contents of mineral N
The importance of each of the soil variables as the primary controlling factor over soil mineral N are shown in Fig. 3. Across all sites, TOC, TN, TP, the clay fraction, CEC and pH appeared to have effects on contents. Especially, the variation in soil contents was consistently related to pH (Fig. S1 in the Supplement). The contents of were primarily affected by CEC and to a lesser extent by similar soil controls as for . In addition, BD was identified as a potential driver for only. In the agricultural region, soil was controlled by TN, CEC, and pH, while TN and CEC as well as TOC, sand fraction, and AWC were important controlling factors of . Among these soil properties, only the pH and CEC showed consistent large-scale effects on mineral N (Figs. S1 and S2). There was no effect of TOC and TP on , but their effects were important in more complex models. In the non-agricultural region, soil was affected by TOC, TP, CEC, and pH. Soil was affected by all selected soil variables in the same region, where BD, CEC and TOC were the most important factors. There was some effect of TN, but TP and pH had relatively less important contribution in contrast to its importance for the soil controls on . In general, based on Pearson’s correlation coefficients, the contents of and significantly correlated with the soil variables identified by Cubist (Table 2). The exception was CEC, which was not correlated with but was selected as important for in the agricultural region. A similar case was found between and TN or BD when accounting for all sites or regions.
Table 2Significant Pearson's correlation coefficients between soil or (mg N kg−1) and selected soil variables at p-value <0.05 (n=469). The correlations indicated by “ns” are not significant.
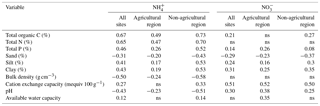
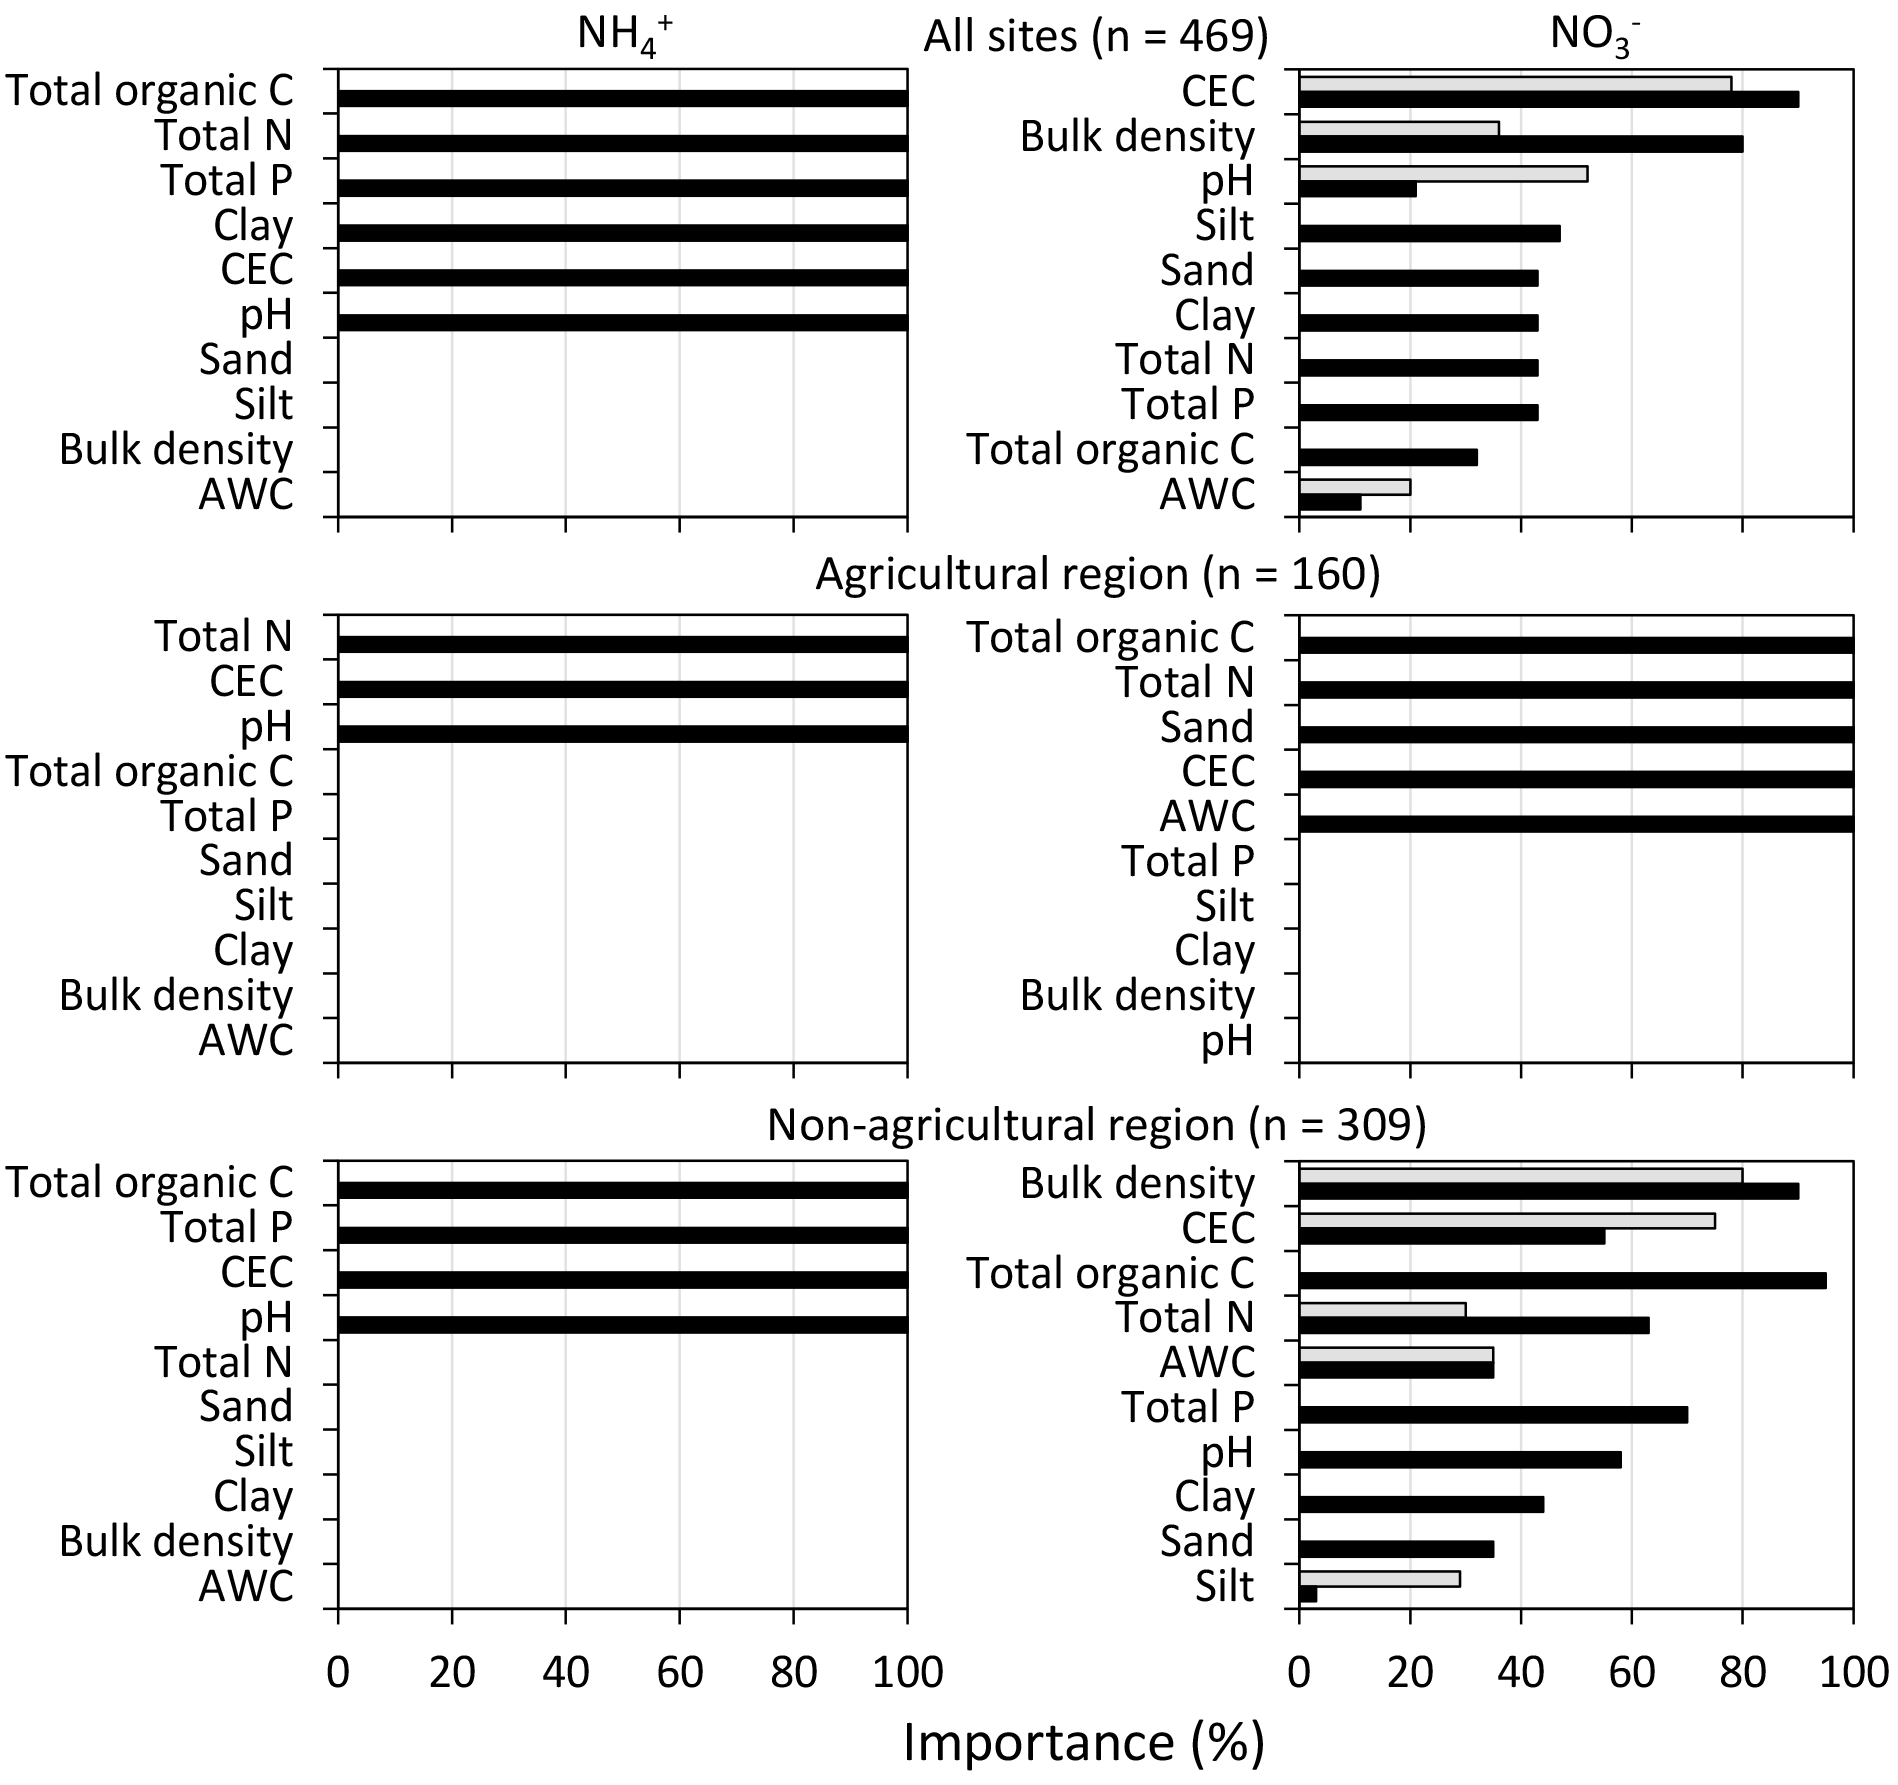
Figure 3Importance of soil attributes as the predictors of and contents (mg N kg−1). The importance of the predictors is based on the usage of each variable in the rule conditions (grey bars) and in the Cubist model (black bars). The abbreviations used are CEC (effective cation exchange) and AWC (available water capacity).
After cross-validation, Cubist models were able to explain 60 %±11 % of the measured variation for and 42 %±13 % for in the soil across all sites (Table 3). The models were evaluated by considering all sites together as well as the sites in each of the regions separately. Specifically, the RMSE and SDE of the region-specific models tended to decrease, showing overall improvement in accuracy and precision. The Cubist models appeared to reasonably cover a range of measured and contents for each selected region (Fig. 4). However, the model failed to reproduce a high range of measured mineral N values when considering all sites or each of the regions. Therefore, the soil factors identified by the model may have unstable effects on these high values.
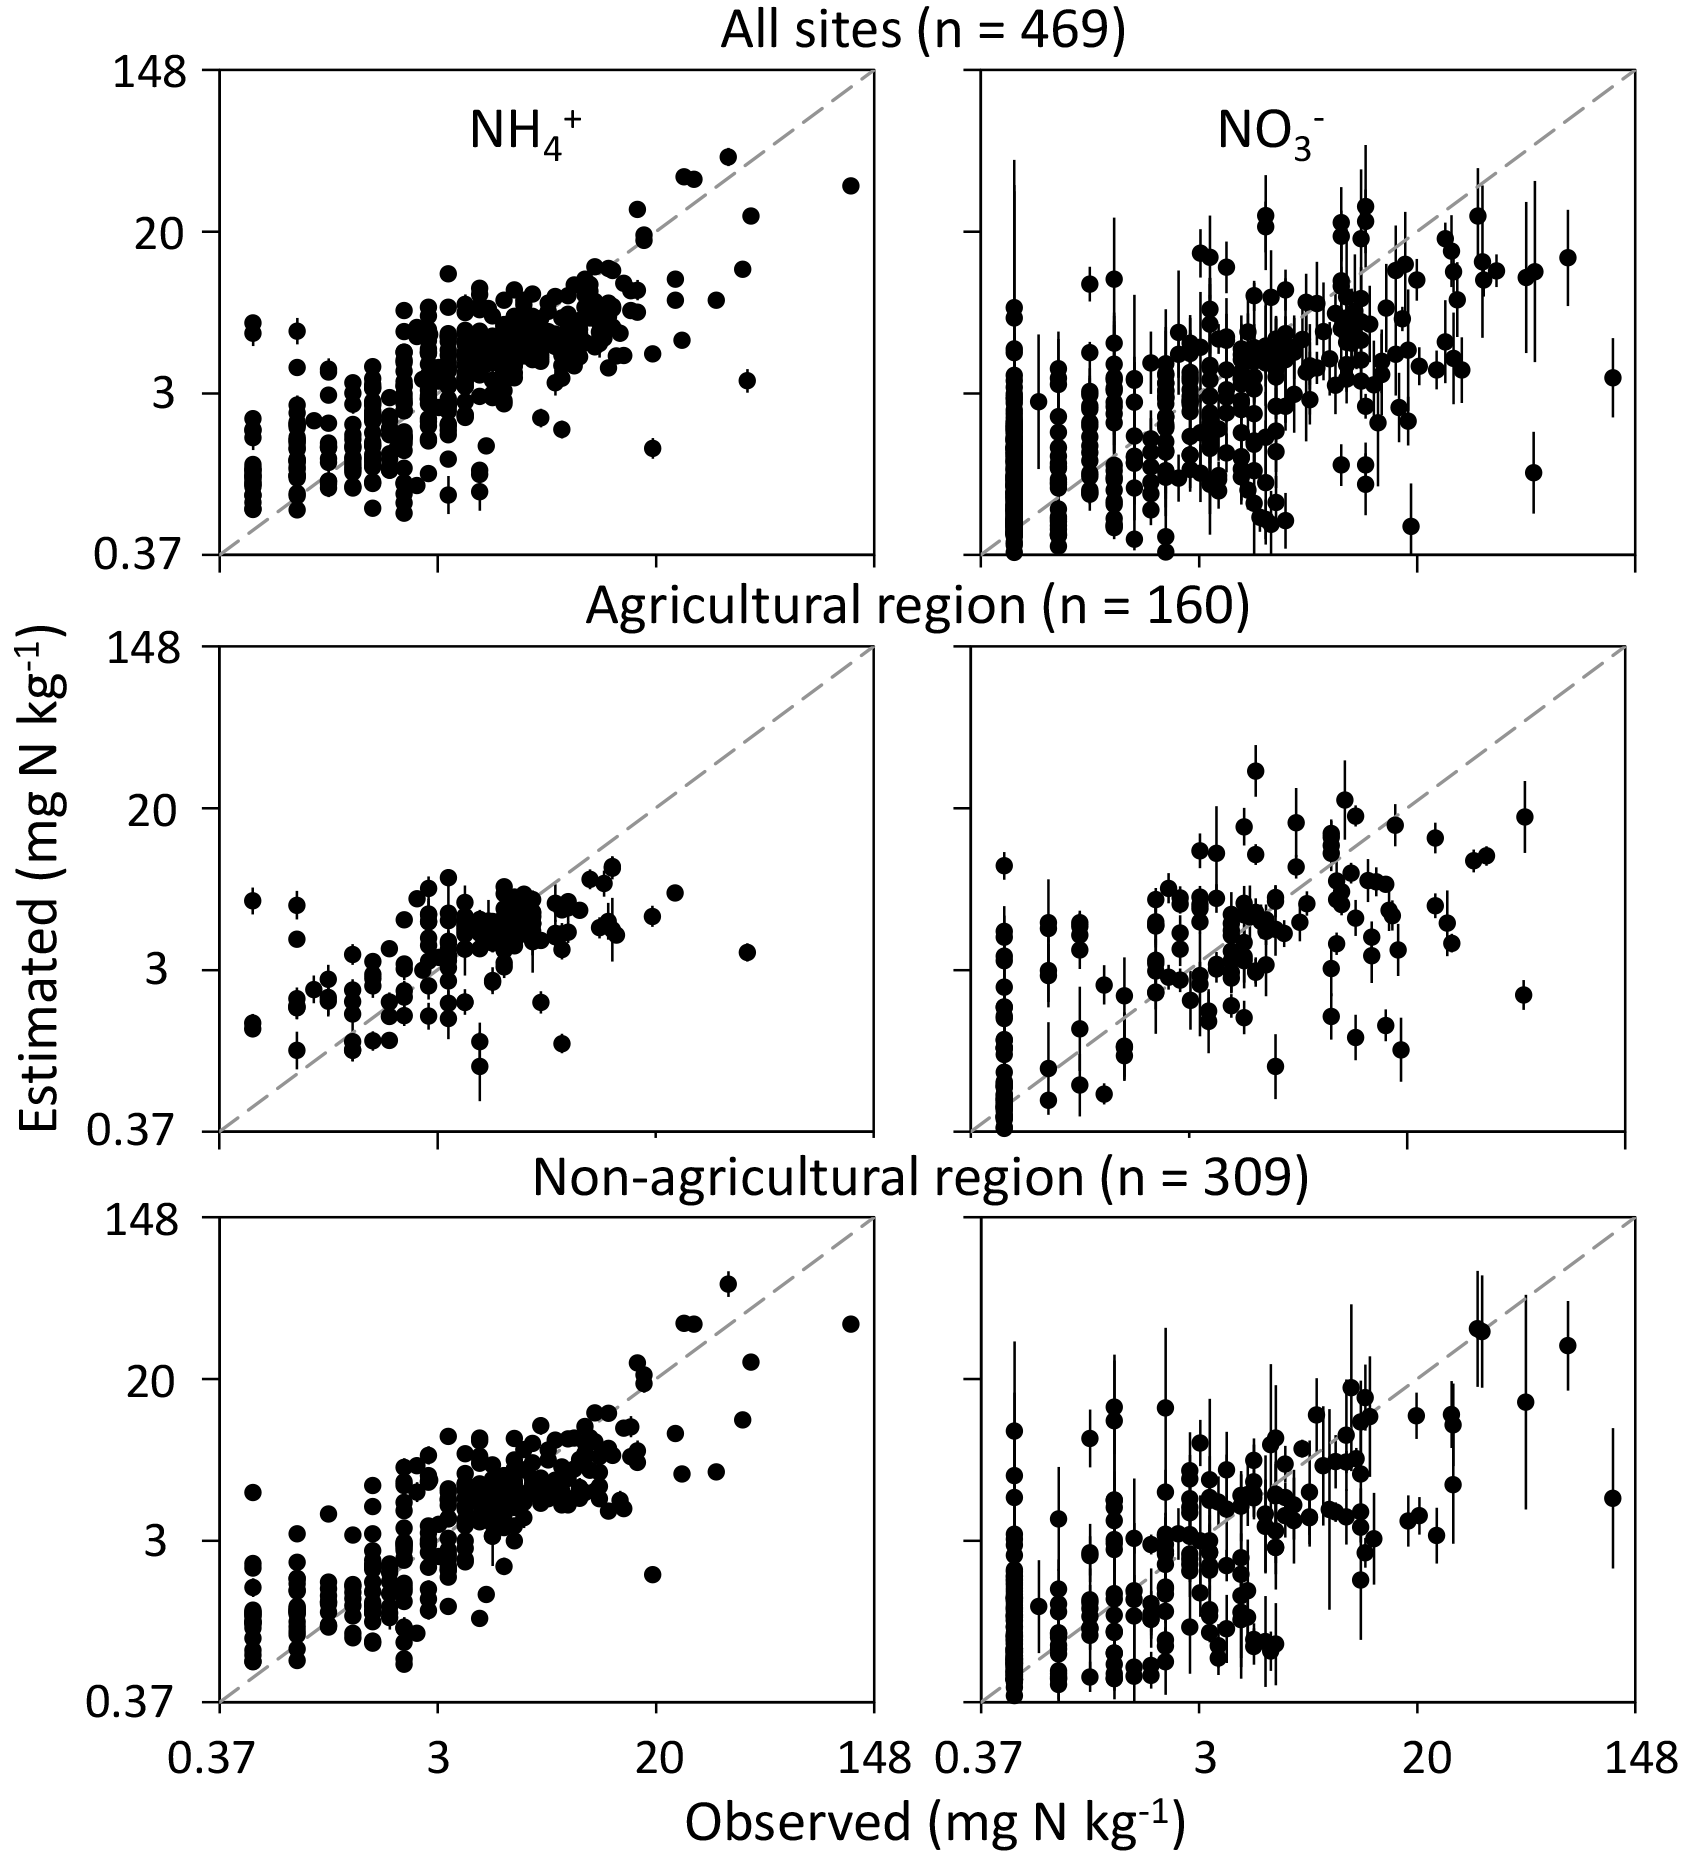
Figure 4Soil and contents on the log-transformed scale estimated by optimized Cubist models. Points represent model evaluation by 10-fold, 50-repeated cross-validation. The error bar is the standard deviation of the estimated mineral N content. The 1 : 1 line is indicated.
Table 3Cross-validation statistics (mean ± standard deviation) of Cubist model on the estimation of and contents (mg N kg−1) in soils. The performance of the models was evaluated with 10-fold, 50-repeated cross-validation with instance-based corrections. The coefficient of determination (R2), the root mean squared error (RMSE), estimated bias (ME), and the standard error of estimated bias (SDE) are considered.
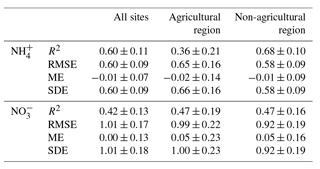
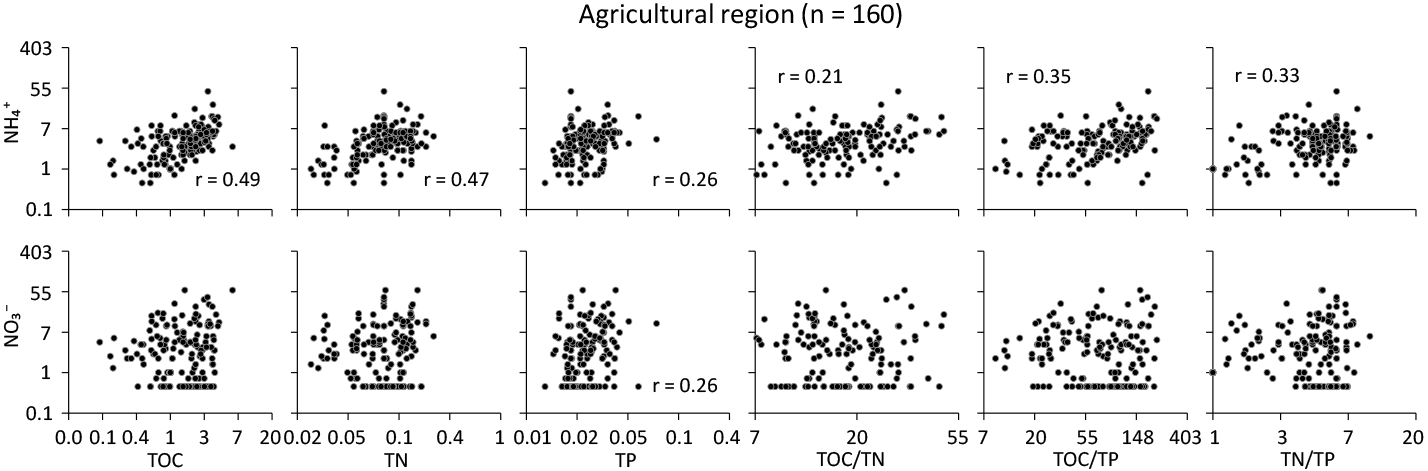
Figure 5For and (mg N kg−1), scatter plots of total organic C (TOC), total N (TN), total P (TP), and element ratios on the log-transformed scale in the agricultural region. The unit is expressed as percent C, N, or P by weight of soil. Pearson's correlation coefficient is reported only when the trend is significant (p<0.05).
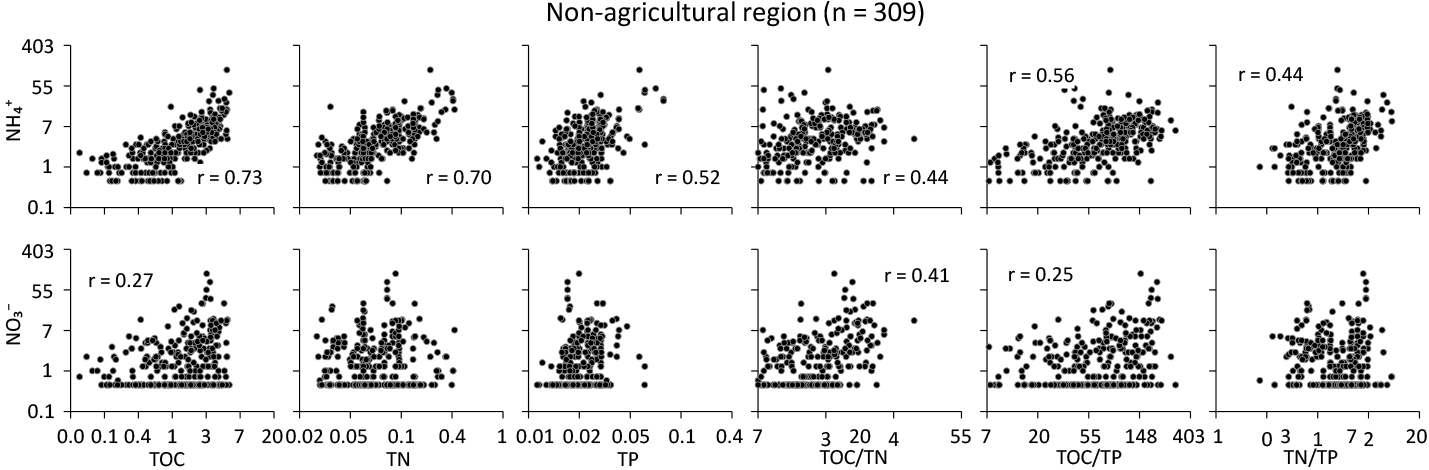
Figure 6For and (mg N kg−1), scatter plots of total organic C (TOC), total N (TN), total P (TP), and element ratios on the log-transformed scale in the non-agricultural region, where soil is used for conservation and under natural vegetation. The unit is expressed as percent C, N, or P by weight of soil. Pearson's correlation coefficient is reported only when the trend is significant (p<0.05).
3.3 Relationships between mineral N and soil C, N, and P stoichiometry
Depending on the specific region, soil nutrients had distinct effects on the level of each mineral form of N. In the agricultural region (Fig. 5), soil was directly related to TN and TOC to a lesser extent TP, with significant effects from the interaction of total soil nutrients (p<0.05). Soil was significantly related to TP only in the agricultural soil (p<0.05). However, no significant relationships between and all soil elemental ratios and the model suggest that the contents of were insensitive to changes in the elemental TP but indirectly related to TOC or TN. In the non-agricultural region (Fig. 6), each of the total nutrient contents was significantly related to the distribution of soil in a similar manner to the soil in the agricultural region. This suggests that TOC was a main controlling factor, but the effects of elemental interactions would be potentially important, also corresponding to those from the modelling. Specifically, the levels of increased in the P-depleted soil relative to the other nutrients in both regions.
4.1 Continental variation in soil and
The distribution of and in the soil and the ratio of -N to -N show that is a predominant source of N for plant uptake or other biological processes across the sites, compared to . This suggests that the risk of loss from leaching and denitrification may not be large or evident at the scale of the study or from the sparse data set. The sum of and at the sites might be useful to approximately set the potential limits of inherent soil N availability and thus the relevant limits for mineral N management particularly in the agricultural region of Australia. However, it was again based on limited soil data across a vast area of the continent and should be interpreted with caution. The distribution of was characterized by relatively low values or values under the detection limit, which suggest that those soils were depleted in . On the other hand, large-scale variation in soil and total mineral N contents should be considered when making implications for the regional effects of land use patterns on soil N dynamics. The fraction, relative to of TN, substantially increased if the soil with small contents was excluded (data not shown). There may also be extreme values for and , usually higher than 45–50 mg N kg−1 and approximately equivalent to 150–200 kg N ha−1, representing potential hot spots. Such a wide range of and contents on top of spatially scarce soil data presents a challenge in determining the responses of varying mineral N to soil factors in different regions defined by broad land uses.
We found complex but consistent regional patterns of soil and by broad land uses. The soil in the agricultural region was characterized by relatively smaller but significantly larger contents than the soil in the non-agricultural region, generally from conservation areas and natural environments (Fig. 2). However, each site in the agricultural region represents more modified landscapes for production. This region accounts for most of the soil conditions affected by land uses particularly related to agricultural production and grazing. Overall, more appeared to be accumulated in the soil under agricultural conditions because of the significant mean difference in the sum of mineral N between the regions. The relative accumulation of soil was also supported by the ratio of to , which was considerably lower in the soil from the agricultural region, compared to that in the non-agricultural region. The soil receiving high N inputs from external sources and recycled N may have more in the balance of soil and pools (Watson and Mills, 1998). In the agricultural region, historical soil N input is known to enhance potential N nitrification over time, although it is further complicated by continuous soil disturbance (e.g. intensive tillage) and various tillage intensities (Angus and Grace, 2017). In addition, the soil's capacity to supply through N mineralization may have been decreased with soil organic matter decline in response to continuous soil disturbance (Viscarra Rossel et al., 2014). The regional balance of soil mineral N would in part depend on preferential N uptake in main crops (Andrews et al., 2013; Gastal and Lemaire, 2002; Haynes and Goh, 1978). However, this effect has not been shown for many crops grown in the region, and thus more data are needed to further confirm this.
Land-use types play a role as the major sources of regional differences in soil and across the sites (Table 1). It is therefore promising to split the continental data on mineral N into the region-specific variation in N based on land uses, if the current land uses were maintained with minimal spatial and temporal changes. Land uses and associated conditions can geographically constrain or be constrained by each other, contributing to regional differences in soil characteristics and N transformation rates (Booth et al., 2005). As shown above, the amount of or the sum of and stored in the soil was distinctly characterized between the regions, subject to different dominant land uses. The land-use types affected by production activities have been driven by N inputs and eventually led to enrichment of soil , as suggested also by the differences in mineral N between the agricultural and other non-agricultural regions. was depleted in the soil within low-input or relatively natural environments used for production, compared to the soil under conservation and natural environments not used for agricultural purposes. This has important implications because resource-based production systems with little to no input (e.g. grazing of native vegetation) may not be sustainable, compared to input-driven production systems. The effect of agricultural land uses on the levels of and may depend on the interactive effect of soil management and external N input from anthropogenic sources (Fueki et al., 2010). Similarly, soil and contents under cropping were about 2.5 and 4.5 mg N kg−1, respectively, showing the decline in and enrichment of . The levels of soil mineral N were highly variable in the protected or natural environments, particularly for , similar to the patterns between the regions. Presumably, this was due to the differences in the amount and quality of biomass input under natural vegetation and crop production, leading to different soil organic matter decomposition (source) versus N immobilization (sink) (Post and Kwon, 2000; Post et al., 1985).
Among ecological factors, the climatic variables such as precipitation and temperatures are known to strongly limit soil N storage across spatial scales (Liu et al., 2017; Post et al., 1985). In this study, however, we did not determine how soil mineral N status would change under other climatic and ecological conditions in Australia. This was because most of the sites were located in arid or temperate ecological zones. Given the number of the sites, the extent and support of measured soil data did not fully represent a possible range of soil conditions. Therefore, further measurements are needed to account for diverse agro-ecological settings.
4.2 Soil controls over the measured variation in and
Interactions between soil variables and related processes operating on multiple aspects of the N cycle are often difficult to understand at the continental scale. Much less is known about the large-scale effect of land-use patterns on soil mineral N dynamics. In this study, we used the measured data as well as the high-resolution soil values from model predictions that are reliable and accurate with small to moderate uncertainty (Viscarra Rossel and Bui, 2016; Viscarra Rossel et al., 2015). Although potential uncertainties exist in the data as a proxy for “real” soil conditions, multiple soil variables were significantly related to and contents in the soil at all sites and between the regions (Table 2). In Cubist models, a comparable set of the soil variables acted as the controlling drivers on the distribution of and across the sites (Table 2 and Fig. 3). Rule-based models are practical in interpreting and extrapolating plant N availability and N losses under various conditions. These common soil drivers suggest that similar mechanisms drive and to some extent, linking them together. It is well known that CEC contributed to the potential to retain both and . In addition, there were probably more complex interactions of soil controls on contents, for example, including additional effects of soil texture. Since the selected soil variables can potentially determine soil mineral N availability and losses, the accurate measurement and mapping of soil attributes are important for continental simulations of soil N dynamics. Some of the soil variables, particularly CEC, may have indirect effects on soil mineral N, presumably confounded by other predominant drivers, such as soil texture and BD (Dunne and Willmott, 1996; Saxton et al., 1986).
It is important to note that the importance of soil controlling factors was different between the agricultural and non-agricultural regions. These variables, which were previously identified as important across the sites could serve as conditional controls between the regions, depending on dominant land-use and vegetation types. Particularly for the soil in the agricultural region, the contents of soil and tended to be controlled by only 3–5 primary drivers and the interactions of less important variables. These included pH for and CEC for in the soil. Total organic C, TN, and TP had varying degrees of importance that were specific for each mineral form of N between regions. In the agricultural region, positively depended on TN and thus the distribution and sources of organic matter and potential N availability in the soil. Instead, retention capacity may become important through pH and CEC effects. In the non-agricultural region, soil might depend on the mineralization of organic matter sources but is less limited by TN or TP under near steady-state conditions. Soil was positively affected by TOC and TN in the agricultural region, where it could be more affected by the capacity of the soil to immobilize residual if an ample N supply was assumed. In contrast, was affected to a certain extent by TOC and TN and the effect of TP remained relatively higher in the non-agricultural region, receiving limited soil inputs. Thus, soil may presumably be associated with organic matter and N mineralization rates. At this stage, however, no clear mechanisms are evident from the different drivers of mineral N contents between the regions. Nevertheless, land-use conditions would provide constraints on what critical soil variables drive the large-scale variation in and contents.
The Cubist models were able to account for 36 %–68 % of the measured variation in both and in the soil across the sites and within each region (Table 3 and Fig. 4). The contents of and were reasonably estimated by the model for each region. In contrast, the model performance of soil mineral N was substantially limited by high prediction error, particularly over a high range of contents at all sites and in the non-agricultural region. In addition, the overall model performance was possibly limited by the presence of samples with contents under the detection limit so that any differences in the selected soil variables could not be fully considered in the model, eventually leading to the oversimplified controls in each of the regions. As a result, much of the model error resulted from the lack of accuracy. In addition, the models may not capture all the processes and resulting variation as they were based on the limited data sets. Similar issues, such as the underestimation of relatively high contents, have been found using model-based approaches (Johnsson et al., 1987; Necpalova et al., 2015; Smith et al., 2008; Wu and McGechan, 1998). The evaluation of these models suggests that the region-specific simulation of soil mineral N may not be sufficiently reliable at the continental scale, and this issue has been reported (Chang et al., 2001). These studies recommended further improvement in the mechanisms within the models, especially for hydrological or N transformation processes responsible for contents. Specifically, we need to focus more on mechanistic roles of different soil drivers in N cycling between the regions, temporal controls over N transformation, and biogeochemical hot spots and moments in N retention and removal. As such, it is especially relevant to continue the development of accurate models in order to predict general patterns when integrating different land uses.
4.3 Soil stoichiometric controls on and
Stoichiometric interactions of total soil C, N, and P can be geographically related to the transformation processes between soil organic and inorganic N over large spatial scales. The states of soil TOC, TN, and TP have been reported at the continental scale for Australia (Viscarra Rossel et al., 2015) and across Australia's major agro-ecological regions (Bui and Henderson, 2013). As far as we know, little or no studies have addressed the fate of soil mineral N by directly linking to soil stoichiometric interactions of C, N and P at the continental scale in Australia because of practical difficulties in directly measuring soil mineral N. We acknowledge this challenge and the need for more measurements at additional sites. Despite this limitation, our results suggest that soil organic matter and its C : N : P stoichiometry may contribute to the potential to maintain or increase contents in each region under different land uses. Specifically, there was a trend of increasing soil contents with increasing C : N (median 15.9 and 15.1), C : P (72.8 and 73.1), and N : P (5.0 and 4.5) ratios in the agricultural (Fig. 5) and non-agricultural regions (Fig. 6). There is also an indication that final soil elemental ratios are less affected by soil input stoichiometric ratios than previously expected and depend mostly on soil mineralogy (Frossard et al., 2016). Similarly, Kirkby et al. (2011) found that the stable portion of organic matter had relatively constant C : N : P ratios across a range of soil types. This suggests that soil dynamics may depend on the amount of C and N stored in the soil as well as the relative P limitation in soil nutrient quality. The effects of these elemental interactions on soil seemed to be important in the non-agricultural region only (Figs. 5 and 6), specifically through changes in the amount of N and P retained in soil organic matter.
Different organic matter depletion and composition and N mineralization from soil organic matter between the regions can limit the initial step for the terrestrial N cycle and determine the fate of mineral N (Booth et al., 2005; Denk et al., 2017; Gardenas et al., 2011). Recently, Tipping et al. (2016) reported global averages of the C : N and C : P stoichiometry, which approximately corresponded to 8.3 and 62.5 for nutrient-rich soil organic matter and 25.6 and 909.0 for nutrient-poor soil organic matter. The contents of C, N and P and corresponding elemental ratios in the soil suggest that TN was limited while TP was abundant in Australian soil, relative to organic C. However, plant-available P is typically very low in Australian soil (Dalal et al., 2003; Viscarra Rossel and Bui, 2016). Soil C : P and N : P ratios are known to increase in response to disturbance events, such as the level of soil tillage and fire intensity (Bui and Henderson, 2013; Orians and Milewski, 2007). Our soil stoichiometry results, although limited, generally support the general status of nutrient-poor soil organic matter, as previously shown by Viscarra Rossel et al. (2015). More importantly, these regional patterns may not be consistent over different spatial scales. For example, Kirkby et al. (2011) reported significantly higher C : P ratios for four Australian agricultural soils than international soils and thus a potential P reduction due to total C loss at the field scale. Therefore, the importance of soil elemental interactions in determining the variation of mineral N at different spatial scales across and within various production and ecological conditions needs to be estimated.
The distribution of soil and contents was significantly affected by regional differences of land use across Australia. Despite a wide range of soil conditions, the nature of the main soil controls and interactions over soil N storage and availability appeared to differ across the sites and between the agricultural and non-agricultural regions, constituting regionally explicit soil controls. Total organic C, TN, and TP had varying degrees of importance as a controlling factor between and and between regions. Assuming that total soil nutrients were related to the amount of soil N that can be retained, the effects of total soil elements was probably due to differences in the source type of mineral N and under declining or steady-state soil organic N. In addition, more complex effects of soil properties on than on were found in both regions. Our results also suggest that the stoichiometric interactions of C, N, and P may provide potentially important constraints on the dynamics of mineral N at the sites, specifically for in each of the regions and in the non-agricultural region. Overall, large-scale and tended to be sensitive to N or P status relative to C in the soil nutrient budget, showing the biogeochemical role of soil nutrients in the regulation of soil mineral N cycling. The Cubist model was effective at explaining the region-specific heterogeneity of Australian soils, empirically related to the contents of mineral N. However, the mechanisms of mineral N cycling controlled by the soil properties were not evident at the continental scale. In addition, the current data set and models still under-represent the intensive production and other agro-ecological zones of Australia. Therefore, more focus should be given to a mechanistic understanding of the large-scale changes in soil mineral N retention and losses at this scale.
The BASE data sets analysed during the current study were created by the Australian Microbiome initiative and are available at https://data.bioplatforms.com (last access: 26 February 2018).
The supplement related to this article is available online at: https://doi.org/10.5194/soil-4-213-2018-supplement.
RAVR conceived the project. JL conducted the analyses and modelling. All authors contributed to the interpretation of the results and the writing of the paper.
The authors declare that they have no conflict of interest.
We would like to acknowledge the contribution of the Biomes of Australian
Soil Environments (BASE) consortium
(https://data.bioplatforms.com/organization/pages/bpa-base/acknowledgements,
last access: 26 February 2018) in the
generation of data used in this publication. The BASE project is supported by
funding from Bioplatforms Australia through the Australian Government
National Collaborative Research Infrastructure Strategy (NCRIS). We also
acknowledge the funding support of Carbon Link Pty. Ltd.
Edited by: Axel Don
Reviewed by: two anonymous
referees
Andrews, M., Raven, J. A., and Lea, P. J.: Do plants need nitrate? The mechanisms by which nitrogen form affects plants, Ann. Appl. Biol., 163, 174–199, 2013. a
Angus, J. F. and Grace, P. R.: Nitrogen balance in Australia and nitrogen use efficiency on Australian farms, Soil Res., 55, 435–450, 2017. a
Bissett, A., Fitzgerald, A., Meintjes, T., Mele, P. M., Reith, F., Dennis, P. G., Breed, M. F., Brown, B., Brown, M. V., Brugger, J., Byrne, M., Caddy-Retalic, S., Carmody, B., Coates, D. J., Correa, C., Ferrari, B. C., Gupta, V. V. S. R., Hamonts, K., Haslem, A., Hugenholtz, P., Karan, M., Koval, J., Lowe, A. J., Macdonald, S., McGrath, L., Martin, D., Morgan, M., North, K. I., Paungfoo-Lonhienne, C., Pendall, E., Phillips, L., Pirzl, R., Powell, J. R., Ragan, M. A., Schmidt, S., Seymour, N., Snape, I., Stephen, J. R., Stevens, M., Tinning, M., Williams, K., Yeoh, Y. K., Zammit, C. M., and Young, A.: Introducing BASE: the Biomes of Australian Soil Environments soil microbial diversity database, Gigascience, 5, 21, https://doi.org/10.1186/s13742-016-0126-5, 2016. a, b
Booth, M. S., Stark, J. M., and Rastetter, E.: Controls on nitrogen cycling in terrestrial ecosystems: A synthetic analysis of literature data, Ecol. Monogr., 75, 139–157, 2005. a, b, c
Bui, E. N. and Henderson, B. L.: C : N : P stoichiometry in Australian soils with respect to vegetation and environmental factors, Plant Soil, 373, 553–568, 2013. a, b
Butterbach-Bahl, K., Baggs, E. M., Dannenmann, M., Kiese, R., and Zechmeister-Boltenstern, S.: Nitrous oxide emissions from soils: how well do we understand the processes and their controls?, Philos. T. R. Soc. B, 368, 20130122, https://doi.org/10.1098/rstb.2013.0122, 2013. a
Chang, C. W., Laird, D. A., Mausbach, M. J., and Hurburgh, Jr., C. R.: Near-infrared reflectance spectroscopy-principal components regression analyses of soil properties, Soil Sci. Soc. Am. J., 65, 480–490, 2001. a
Ciais, P., Sabine, C., Bala, G., Bopp, L., Brovkin, V., Canadell, J., Chhabra, A., DeFries, R., Galloway, J., Heimann, M., Jones, C., Le Quere, C., Myneni, R. B., Piao, S., and Thornton, P.: Carbon and Other Biogeochemical Cycles, in: Climate Change 2013: The Physical Science Basis. Contribution of Working Group I to the Fifth Assessment Report of the Intergovernmental Panel on Climate Change, edited by Stocker, T., Qin, D., Plattner, G.-K., Tignor, M., Allen, S., Boschung, J., Nauels, A., Xia, Y., Bex, V., and Midgley, P., chap. 6, 465–570, Cambridge University Press, Cambridge, United Kingdom and New York, NY, USA, 2013. a, b
Conley, D. J., Paerl, H. W., Howarth, R. W., Boesch, D. F., Seitzinger, S. P., Havens, K. E., Lancelot, C., and Likens, G. E.: Controlling eutrophication: nitrogen and phosphorus, Science, 323, 1014–1015, 2009. a
Dalal, R. C., Wang, W. J., Robertson, G. P., and Parton, W. J.: Nitrous oxide emission from Australian agricultural lands and mitigation options: a review, Aust. J. Soil Res., 41, 165–195, 2003. a
De Schrijver, A., De Frenne, P., Ampoorter, E., Van Nevel, L., Demey, A., Wuyts, K., and Verheyen, K.: Cumulative nitrogen input drives species loss in terrestrial ecosystems, Global Ecol. Biogeogr., 20, 803–816, 2011. a
Denk, T. R. A., Mohn, J., Decock, C., Lewicka-Szczebak, D., Harris, E., Butterbach-Bahl, K., Kiese, R., and Wolf, B.: The nitrogen cycle: A review of isotope effects and isotope modeling approaches, Soil Biol. Biochem., 105, 121–137, 2017. a
Dunne, K. A. and Willmott, C. J.: Global distribution of plant-extractable water capacity of soil, Int. J. Climatol., 16, 841–859, 1996. a
Farley, R. A. and Fitter, A. H.: Temporal and spatial variation in soil resources in a deciduous woodland, J. Ecol., 87, 688–696, 1999. a
Fowler, D., Coyle, M., Skiba, U., Sutton, M. A., Cape, J. N., Reis, S., Sheppard, L. J., Jenkins, A., Grizzetti, B., Galloway, J. N., Vitousek, P., Leach, A., Bouwman, A. F., Butterbach-Bahl, K., Dentener, F., Stevenson, D., Amann, M., and Voss, M.: The global nitrogen cycle in the twenty-first century, Philos. T. R. Soc. B, 368, 20130164, https://doi.org/10.1098/rstb.2013.0164, 2013. a
Frossard, E., Buchmann, N., Bünemann, E. K., Kiba, D. I., Lompo, F., Oberson, A., Tamburini, F., and Traoré, O. Y. A.: Soil properties and not inputs control carbon : nitrogen : phosphorus ratios in cropped soils in the long term, SOIL, 2, 83–99, https://doi.org/10.5194/soil-2-83-2016, 2016. a
Fueki, N., Sato, K., and Nakatsu, S.: Interpretation of soil mineral nitrogen by scoring organic matter and nitrogen management as an ”N-score” in the fields of Hokkaido before sugar beet planting, Soil Sci. Plant Nutr., 56, 750–759, 2010. a
Gardenas, A. I., Ågren, G. I., Bird, J. A., Clarholm, M., Hallin, S., Ineson, P., Katterer, T., Knicker, H., Nilsson, S. I., Näsholm, T., Ogle, S., Paustian, K., Persson, T., and Stendahl, J.: Knowledge gaps in soil carbon and nitrogen interactions: From molecular to global scale, Soil Biol. Biochem., 43, 702–717, 2011. a
Gastal, F. and Lemaire, G.: N uptake and distribution in crops: an agronomical and ecophysiological perspective, J. Exp. Bot., 53, 789–799, 2002. a
Giebel, A., Wendroth, O., Reuter, H. I., Kersebaum, K. C., and Schwarz, J.: How representatively can we sample soil mineral nitrogen?, J. Plant Nutr. Soil Sc., 169, 52–59, 2006. a
Glendining, M. J., Dailey, A. G., Powlson, D. S., Richter, G. M., Catt, J. A., and Whitmore, A. P.: Pedotransfer functions for estimating total soil nitrogen up to the global scale, Eur. J. Soil Sci., 62, 13–22, 2011. a
Haynes, R. J. and Goh, K. M.: Ammonium and nitrate nutrition of plants, Biol. Rev., 53, 465–510, 1978. a
Johnsson, H., Bergstrom, L., Jansson, P.-E., and Paustian, K.: Simulated nitrogen dynamics and losses in a layered agricultural soil, Agriculture, Ecosystems and Environment, 18, 333–356, 1987. a
Johnston, C. A.: Material fluxes across wetland ecotones in northern landscapes, Ecol. Appl., 3, 424–440, 1993. a
Kirkby, C. A., Kirkegaard, J. A., Richardson, A. E., Wade, L. J., Blanchard, C., and Batten, G.: Stable soil organic matter: A comparison of C : N : P : S ratios in Australian and other world soils, Geoderma, 163, 197–208, 2011. a, b
Liu, D. W., Zhu, W. X., Wang, X. B., Pan, Y. P., Wang, C., Xi, D., Bai, E., Wang, Y. S., Han, X. G., and Fang, Y. T.: Abiotic versus biotic controls on soil nitrogen cycling in drylands along a 3200 km transect, Biogeosciences, 14, 989–1001, 2017. a
Luo, Y., Su, B., Currie, W. S., Dukes, J. S., Finzi, A. C., Hartwig, U., Hungate, B., McMurtrie, R. E., Oren, R., Parton, W. J., Pataki, D. E., Shaw, M. R., Zak, D. R., and Field, C. B.: Progressive nitrogen limitation of ecosystem responses to rising atmospheric carbon dioxide, Bioscience, 54, 731–739, 2004. a
Necpalova, M., Anex, R. P., Fienen, M. N., Del Grosso, S. J., Castellano, M. J., Sawyer, J. E., Iqbal, J., Pantoja, J. L., and Barker, D. W.: Understanding the DayCent model: Calibration, sensitivity, and identifiability through inverse modeling, Environmental Modelling Software, 66, 110–130, 2015. a
Neff, J. C., Townsend, A. R., Gleixner, G., Lehman, S. J., Turnbull, J., and Bowman, W. D.: Variable effects of nitrogen additions on the stability and turnover of soil carbon, Nature, 419, 915–917, https://doi.org/10.1038/nature01136, 2002. a
Orians, G. H. and Milewski, A. V.: Ecology of Australia: the effects of nutrient-poor soils and intense fires, Biol. Rev., 82, 393–423, 2007. a
Post, W. M. and Kwon, K. C.: Soil carbon sequestration and land-use change: Processes and potential, Glob. Change Biol., 6, 317–327, 2000. a
Post, W. M., Pastor, J., Zinke, P. J., and Stangenberger, A. G.: Global Patterns of soil nitrogen storage, Nature, 317, 613–616, 1985. a, b, c
Quinlan, J. R.: Learning with continuous classes, Proceedings of the 5th Australian Joint Conference On Artificial Intelligence, 343–348, 1992. a
Rastetter, E. B., Agren, G. I., and Shaver, G. R.: Responses of N-limited ecosystems to increased CO2: A balanced-nutrition, coupled-element-cycles model, Ecol. Appl., 7, 444–460, 1997. a, b
Ravishankara, A. R., Daniel, J. S., and Portmann, R. W.: Nitrous Oxide (N2O): The dominant ozone-depleting substance emitted in the 21st century, Science, 326, 123–125, 2009. a
R Core Team: R: A Language and Environment for Statistical Computing, R Foundation for Statistical Computing, Vienna, Austria, available at: https://www.R-project.org/ (last access: 18 December 2017), 2017.
Saxton, K. E., Rawls, W. J., Romberger, J. S., and Papendick, R. I.: Estimating generalized soil-water characteristics from texture, Soil Sci. Soc. Am. J., 50, 1031–1036, 1986. a
Shahbaz, M., Kuzyakov, Y., Maqsood, S., Wendland, M., and Heitkamp, F.: Decadal nitrogen fertilization decreases mineral-associated and subsoil carbon: A 32-year study, Land Degrad. Dev., 28, 1463–1472, https://doi.org/10.1002/ldr.2667, 2017. a
Smith, W. N., Grant, B. B., Desjardins, R. L., Rochette, P., Drury, C. F., and Li, C.: Evaluation of two process-based models to estimate soil N2O emissions in Eastern Canada, Can. J. Soil Sci., 88, 251–260, 2008. a
Stiles, W. A. V., Rowe, E. C., and Dennis, P.: Long-term nitrogen and phosphorus enrichment alters vegetation species composition and reduces carbon storage in upland soil, Sci. Total Environ., 593, 688–694, 2017. a
Taylor, P. G. and Townsend, A. R.: Stoichiometric control of organic carbon-nitrate relationships from soils to the sea, Nature, 464, 1178–1181, 2010. a
Thornton, P. E., Lamarque, J. F., Rosenbloom, N. A., and Mahowald, N. M.: Influence of carbon-nitrogen cycle coupling on land model response to CO2 fertilization and climate variability, Global Biogeochem. Cy., 21, GB4018, https://doi.org/10.1029/2006gb002868, 2007. a
Tipping, E., Somerville, C. J., and Luster, J.: The C : N : P : S stoichiometry of soil organic matter, Biogeochemistry, 130, 117–131, 2016. a
Vagstad, N., Eggestad, H. O., and Hoyas, T. R.: Mineral nitrogen in agricultural soils and nitrogen losses: Relation to soil properties, weather conditions, and farm practices, Ambio, 26, 266–272, 1997. a
Viscarra Rossel, R. A. and Bui, E. N.: A new detailed map of total phosphorus stocks in Australian soil, Sci. Total Environ., 542, 1040–1049, 2016. a, b
Viscarra Rossel, R. A., Webster, R., Bui, E. N., and Baldock, J. A.: Baseline map of organic carbon in Australian soil to support national carbon accounting and monitoring under climate change, Glob. Change Biol., 20, 2953–2970, 2014. a
Viscarra Rossel, R. A., Chen, C., Grundy, M. J., Searle, R., Clifford, D., and Campbell, P. H.: The Australian three-dimensional soil grid: Australia's contribution to the GlobalSoilMap project, Soil Res., 53, 845–864, 2015. a, b, c, d, e
Vitousek, P. M., Aber, J. D., Howarth, R. W., Likens, G. E., Matson, P. A., Schindler, D. W., Schlesinger, W. H., and Tilman, D.: Human alteration of the global nitrogen cycle: Sources and consequences, Ecol. Appl., 7, 737–750, 1997. a
Watson, C. J. and Mills, C. L.: Gross nitrogen transformations in grassland soils as affected by previous management intensity, Soil Biol. Biochem., 30, 743–753, 1998. a
Wu, L. and McGechan, M. B.: A review of carbon and nitrogen processes in four soil nitrogen dynamics models, J. Agr. Eng. Res., 69, 279–305, 1998. a
Zaehle, S.: Terrestrial nitrogen-carbon cycle interactions at the global scale, Philos. T. R. Soc. B, 368, 20130125, https://doi.org/10.1098/rstb.2013.0125, 2013. a
The requested paper has a corresponding corrigendum published. Please read the corrigendum first before downloading the article.
- Article
(2168 KB) - Full-text XML
- Corrigendum
-
Supplement
(423 KB) - BibTeX
- EndNote