the Creative Commons Attribution 4.0 License.
the Creative Commons Attribution 4.0 License.
 | 05 Jun 2018
Separation of soil respiration: a site-specific comparison of partition methods
Louis-Pierre Comeau
Jane Jinglan Cui
Jenny Farmer
Without accurate data on soil heterotrophic respiration (Rh), assessments of soil carbon (C) sequestration rate and C balance are challenging to produce. Accordingly, it is essential to determine the contribution of the different sources of the total soil CO2 efflux (Rs) in different ecosystems, but to date, there are still many uncertainties and unknowns regarding the soil respiration partitioning procedures currently available. This study compared the suitability and relative accuracy of five different Rs partitioning methods in a subtropical forest: (1) regression between root biomass and CO2 efflux, (2) lab incubations with minimally disturbed soil microcosm cores, (3) root exclusion bags with hand-sorted roots, (4) root exclusion bags with intact soil blocks and (5) soil δ13C–CO2 natural abundance. The relationship between Rh and soil moisture and temperature was also investigated. A qualitative evaluation table of the partition methods with five performance parameters was produced. The Rs was measured weekly from 3 February to 19 April 2017 and found to average 6.1 ± 0.3 . During this period, the Rh measured with the in situ mesh bags with intact soil blocks and hand-sorted roots was estimated to contribute 49 ± 7 and 79 ± 3 % of Rs, respectively. The Rh percentages estimated with the root biomass regression, microcosm incubation and δ13C–CO2 natural abundance were 54 ± 41, 8–17 and 61 ± 39 %, respectively. Overall, no systematically superior or inferior Rs partition method was found. The paper discusses the strengths and weaknesses of each technique with the conclusion that combining two or more methods optimizes Rh assessment reliability.
- Article
(1879 KB) - Full-text XML
-
Supplement
(184 KB) - BibTeX
- EndNote


During the 2016 Convention of the Parties (COP21) of the United Nations Framework Convention on Climate Change (UNFCCC) in Paris, the goal of increasing global soil organic carbon (SOC) stocks by 0.4 % per year was set, with the aim of mitigating global anthropogenic greenhouse gas emissions (Minasny et al., 2017). This ambitious target was set based on the concept that the SOC in the top soil layer is sensitive and responsive to management changes and may offer opportunities to mitigate the current increases in atmospheric CO2 concentration (McConkey et al., 2007). Of the carbon (C) that enters into ecosystems via photosynthesis, a fraction is directly respired by the roots and above-ground plant parts (autotrophic respiration) to produce energy (i.e., adenosine-5′-triphosphate), with the other fraction synthesized into organic molecules. Some of these C-containing compounds are harvested or consumed by herbivores and the remainder is added to the soil as plant residues (Janzen et al., 1998). Subsequently, a portion of these fresh organic compounds is respired by organisms (heterotrophic respiration) and the other portion is converted into SOC by the genesis of soil organic matter (SOM) (Janzen, 2006; Lal, 2005). If the amount of new organic residues added to the soil is greater than the C lost by SOC decomposition, SOC content increases (Ellert and Bettany, 1995).
Typically, many years (up to decades) are needed to assess SOC stock changes over time in order to evaluate which management practices are beneficial for SOC sequestration (Harmon et al., 2011; Wood et al., 2012). This timeframe is impractical for policymakers to evaluate the mitigation potential of different land management practices, in particular with the pressing need of the UNFCCC goal of increasing the global SOC stocks by 0.4 % per year. An alternative approach that allows a more rapid evaluation of these long-term impacts is to combine the SOC stock change procedure (e.g., VandenBygaart et al., 2008) with the soil C efflux balance approach (i.e., Hergoualc'h and Verchot, 2011), which although demanding and with some uncertainties can provide results on soil dynamics on an annual basis. The soil C efflux balance approach involves calculating the rate of C entry and exit in the soil. However, the total CO2 efflux (Rs) from soil does not provide the necessary information to estimate whether the soil is a net source or net sink for atmospheric CO2 (Kuzyakov and Larionova, 2005). Total soil efflux is a combination of root-based respiration (autotrophic (Ra)) and heterotrophic respiration (Rh). Autotrophic respiration does not contribute to net C losses to the atmosphere as it is cycled within the ecosystem, whereas Rh represents net C losses. However, the boundary between Ra and Rh is not easy to distinguish (i.e., the rhizomicrobial respiration is linked to both) and realistic Rh assessments are difficult to produce (Braig and Tupek, 2010).
Reviews of Rh–Rs segregation methods have been made (e.g., Kuzyakov, 2006) but no site-specific study has been made analyzing several different partition techniques simultaneously. The goal of our study was to compare partitioning methods to separate CO2 efflux into its Rs and Rh components in a subtropical secondary forest in Hong Kong. Five methods were selected based on their suitability in the studied ecosystem. Three methods were traditional techniques (i.e., regression between root biomass and CO2 efflux, root exclusion bags with hand-sorted roots and soil δ13C–CO2 natural abundance) and two were innovative variations of existing methods (i.e., root exclusion bags with intact soil blocks and lab incubations with minimally disturbed soil microcosm cores). The influence of soil moisture and temperature on CO2 efflux was also analyzed.
The research was conducted in a subtropical secondary forest of Hong Kong (Tai Po Kau Nature Reserve; 22∘27′ N, 114∘11′ E). The landscape is typical of the escarpment of the Tai Mo Shan, the system formed by volcanic activities in the Late Jurassic epoch (Langford et al., 1989). The rocks are mainly rhyodacite to rhyolite from the Tsuen Wan Volcanic Group (Davis et al., 1997). The study site was approximatively 600 m above sea level and the slope surfaces were stable and vegetated. The forest was approximatively 50 years old and was covered with continuous canopy. More than 100 plant species were registered in the nature reserve. The following genera were found in the study area: Machilus sp., Meliosma sp., Garcinia sp., Engelhardia sp., Psychotria sp., Ilex sp., Eurya sp. and Lithocarpus sp. The mean annual temperature was 23.3 ∘C and annual precipitation was 2400 mm, with a hot, humid season (April–September) and a cool, dry season (October–March) (Hong Kong Observatory). The study area was 1 ha and was located inside a long-term research site belonging to the Chinese University of Hong Kong. The canopy was closed in an area with an average solar radiation of 13.8 W m−2 at 2 m height (unpublished data).
2.1 Soil general characterization
Four soil profiles were dug in the study area, characterizing the different landforms (i.e., back slope and foot slope) present at the site. Morphological description was done according to Jahn et al. (2006) and the soil was classified with the World Reference Base (IUSS-Working-Group-WRB, 2014). Soil pH was determined with a glass–calomel electrode pH meter (McLean, 1982). Rainfall and air temperature were recorded hourly with a HOBO Weather Station (rain gauge, S-RGB-M002; air temperature/RH, sensor S-THB-M008, Onset Computer Corp., USA). Water-holding capacity was assessed by saturating the soils, allowing them to freely drain for 24 h and determining gravimetric water content after oven-drying at 105 ∘C following Arcand et al. (2016). Root biomass was measured by collecting soil cores (inner diameter 5 cm, height 5 cm) and determined using the approach of Tufekcioglu et al. (1999). The soil was dried, finely ground and subsequently analyzed for total C and N content using a CNS Analyzer System (Perkin Elmer 2400 Series II CHNS/O Analyzer, USA) at the Earth System Science Laboratory of the Chinese University of Hong Kong (ESSL-CUHK).
2.2 Partitioning soil respiration
To produce estimates of % Rh, five different approaches were designated based on their suitability in the study area. We decided to use three customary methods often employed in this type of ecosystem (i.e., regression between root biomass and CO2 efflux, root exclusion bags with hand-sorted roots and soil δ13C–CO2 natural abundance) and two innovative variations of existing techniques (i.e., root exclusion bags with intact soil blocks and lab incubations with minimally disturbed soil microcosm cores).
2.2.1 Regression between root biomass and CO2 efflux method
The root biomass regression technique is based on the relationship between the CO2 emitted by the root rhizosphere and root biomass and the CO2 efflux slope fitted from SOM decomposition (i.e., Rh), corresponding to the intercept of the linear regression line (Kucera and Kirkham, 1971). This method was followed according to Farmer (2013) with 22 sampling spots. Each spot was a square of 20×20 cm randomly distributed in the study area. In each spot, Rs was determined per triplicate using a portable IRGA as described above. Concurrently with CO2 efflux measurements, air and soil (10 cm depth) temperatures and soil volumetric moisture content were measured at each sampling spot. Immediately after the Rs measurement, the 20×20 cm squares were excavated to 25 cm depth. All the visible roots (diameter larger than 0.1 cm) from the excavated soil were collected. In the lab, the roots were washed and then oven-dried at 60 ∘C until a steady dry weight was attained, which was then recorded. A linear regression analysis between root quantity and CO2 efflux was performed using the program R Foundation for Statistical Computing version 2.8.1 (R Development Core Team, 2008).
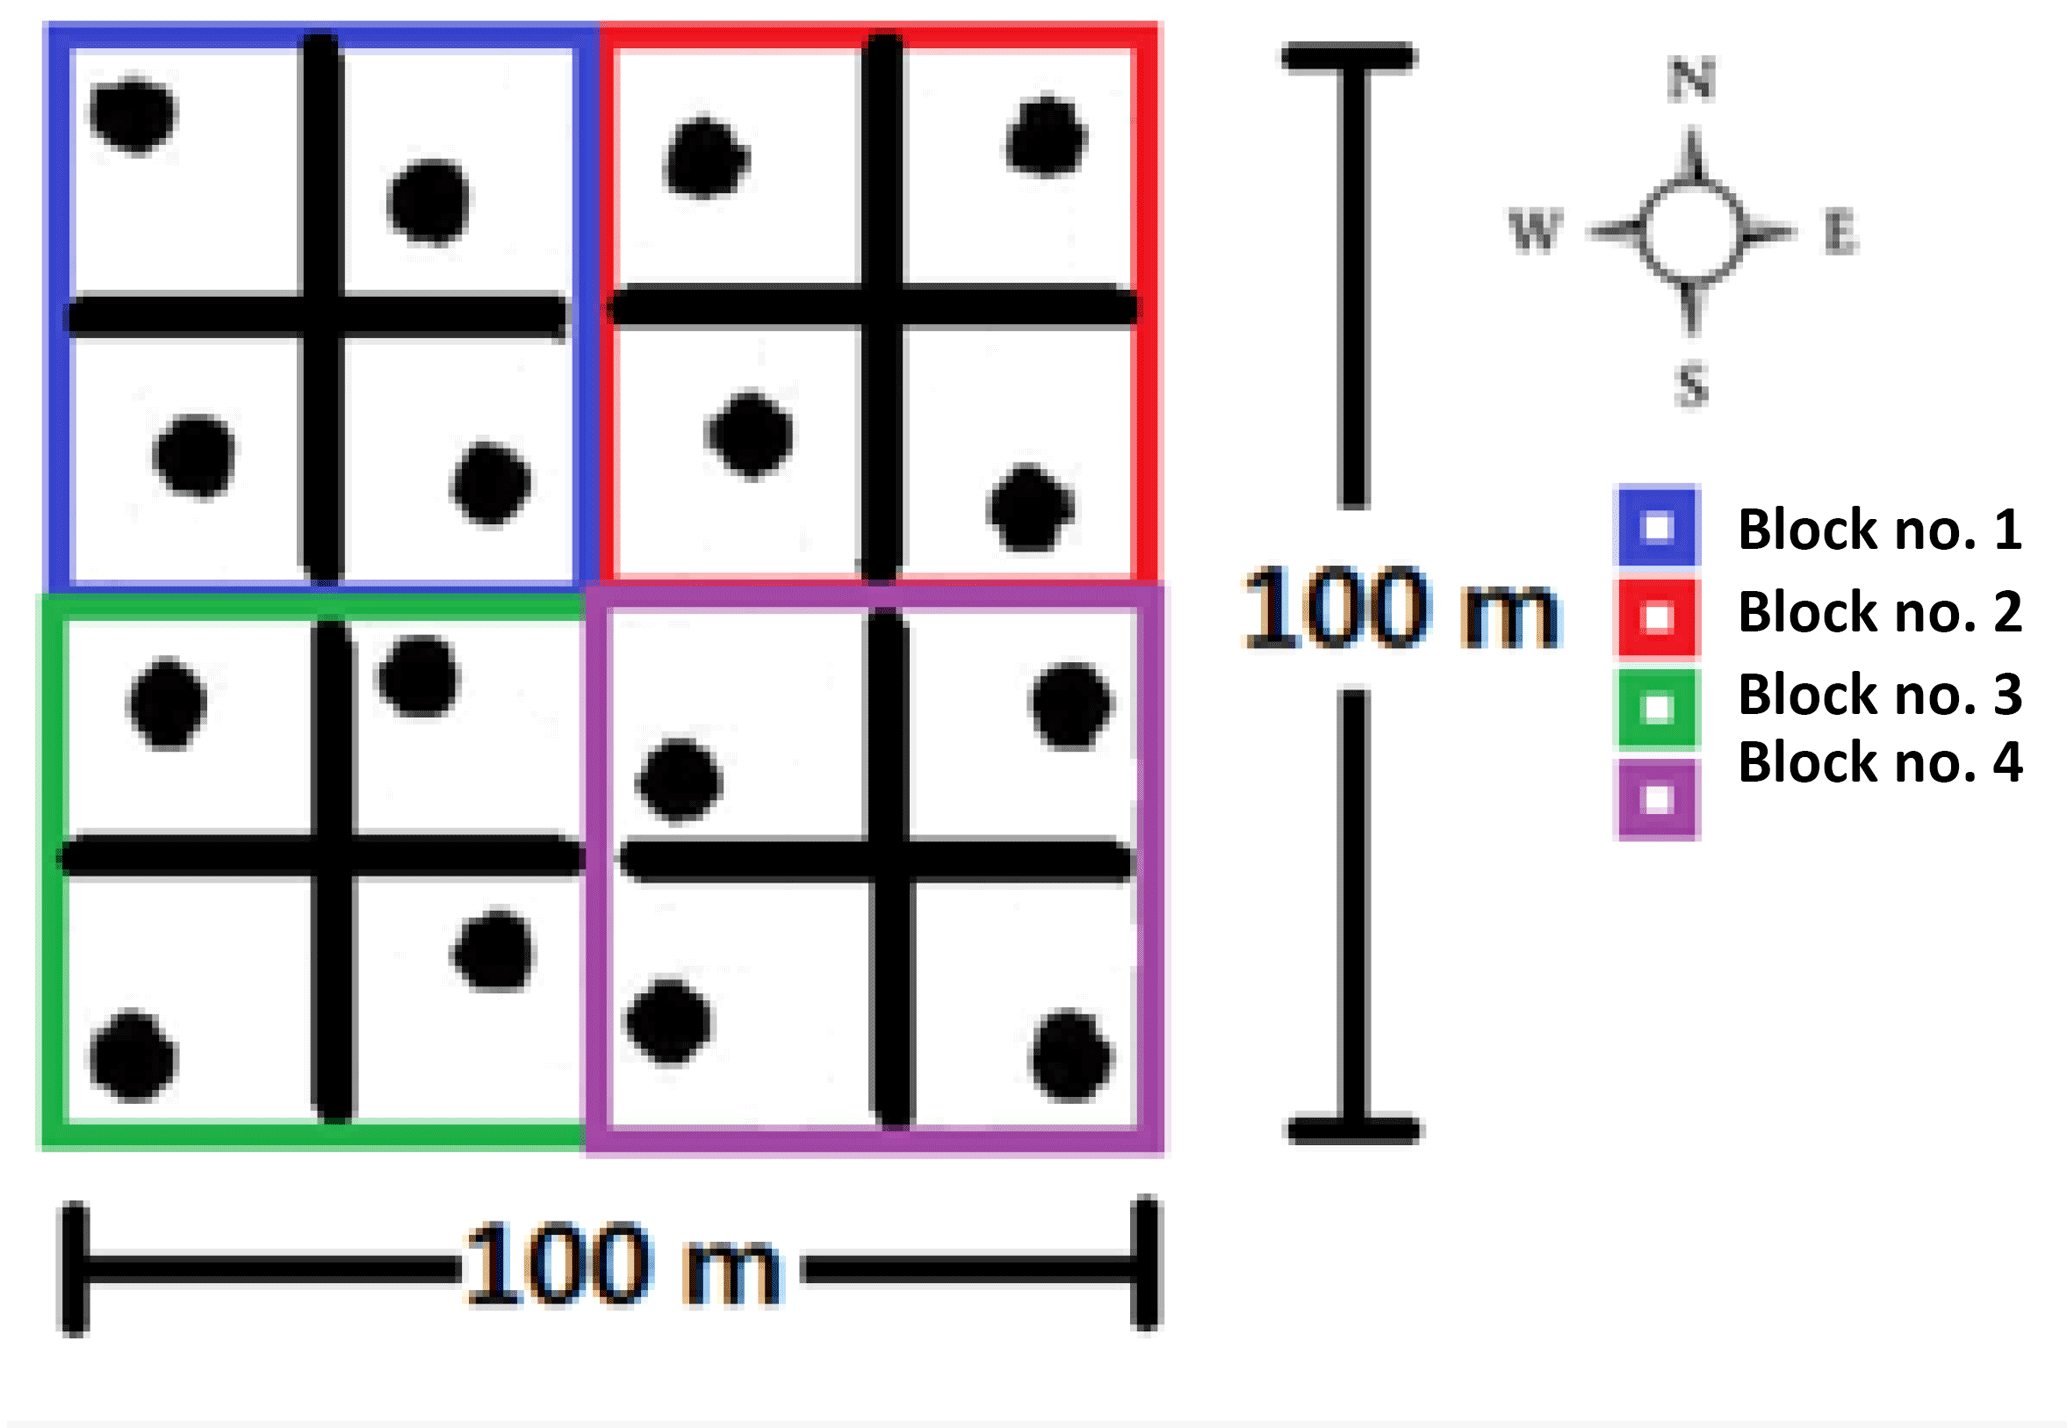
Figure 1Field sampling for the lab incubations: a stratified random design in the 1 ha study area.
2.2.2 Lab incubations
For the lab incubations, undisturbed soil cores with a volume of 98 cm3 (inner diameter 5 cm, height 5 cm) were collected using a stainless-steel core soil sampler from the upper part of the soil profile (0–5 cm). In the study area, four groups of four soil cores (stratified random design) were collected, then pooled per group and brought to the lab (Fig. 1). Subsequently all visible roots were removed but with special care to not destroy the micro-aggregates. The soil was then repacked to original bulk density in minimally disturbed soil microcosm cores of 45 cm3 (inner diameter 3.5 cm, height 5 cm). The soil cores were separated in four groups of different volumetric moisture content (i.e., 15, 25, 35 and 45). These moisture levels corresponded to the natural annual fluctuation in the field (i.e., from dry to moist season) (Cui and Lai, 2016). After moisturizing the samples with distilled water, each individual soil core was placed into a hermetically sealed 2.9 dm3 plastic container and left to stabilize in the dark for 2 weeks at 25 ∘C. After that, the experiment lasted 4 weeks and had four different incubation temperature levels (one per week: 14, 20, 26 and 32 ∘C) corresponding to the minimum, intermediate and maximum soil temperature values in the field based on preliminary studies (Cui and Lai, 2016). At the beginning of each week, the soil cores were pre-incubated in their incubation box to their corresponding weekly temperature (i.e., week no. 1, 14 ∘C … week no. 4, 32 ∘C) for 3 days and then opened and vented for 1 min. From all the boxes gas samples were collected (20 mL) with an airtight syringe (t=0, 24, 72 h) after box closure. The CO2 concentrations were analyzed within 48 h with a gas chromatograph (GC system 7890A, Agilent Technologies). The GC system was equipped with a flame ionization detector and an electron capture detector to quantify CO2 concentration. Between each measurement session, the boxes were opened to vent and the moisture of the soil cores was re-adjusted if needed.
A Gaussian 3-D regression fitted curve was derived as shown in Eq. (1), using SigmaPlot version 10.0 (Systat Software, San Jose, CA).
where f(x,y) is the CO2 efflux function; a, b and c are constant coefficients; x is the soil temperature (∘C); y is the soil moisture content (%); x0 is the average temperature; y0 is the average soil moisture.
2.2.3 Root exclusion bag methods
To partition the CO2 efflux in situ into Rs and Rh using mesh bags, two different approaches were followed: (1) the traditional dug soil with hand-sorted root removal and refilling method (HS) (Fenn et al., 2010; Hinko-Najera, 2015) and (2) a variant of it with intact soil blocks (IB). The HS method consisted of digging a pit for each bag with a size matching the bag dimensions (20×20 cm, depth: 25 cm) where the soil was excavated in layers (to maintain soil horizons) and visible roots were removed before repacking the bag inside the pit with the removed soil. The IB variant of this technique consisted of extracting a cube as intact as possible from the soil (20×20 cm, depth: 25 cm). This was then tightly placed into the micromesh bag and inserted back into its original pit. For both methods, the same type of micromesh bags (38 µm nylon mesh), closed at the bottom but open at the top, was used. This mesh size was used to impede roots from entering inside the bags, but allowed mycorrhiza to penetrate (Moyano et al., 2007). In all the pits excavated, no root below 25 cm depth was observed. Collars measuring 10 cm diameter were installed on the soil in the center of each bag to a depth of 8 cm, for heterotrophic emissions sampling.
Seven plots were randomly distributed inside the study area. In each plot, an IB bag was paired with a HS bag with a space of 150 cm between them. The root exclusion bags were installed during the month of October 2016 and were allowed to stabilize for 3 months. At 1 m distance from each root exclusion bag, a collar was inserted into non-disturbed soil to measure Rs. To assess Rs and Rh without the influence of litterfall decomposition, the collars were cleared of leaves and flowers on a weekly basis.
From 3 February to 19 April 2017 the collars were measured weekly with an IRGA (Environmental Gas Monitor, EGM-4, PP Systems, UK) attached to a soil respiration chamber (SRC-1, PP Systems, UK). Soil temperature and soil moisture were measured in the area located between the collar and the edge of the bag (to 10 cm depth, HH2, Delta-T Devices, Cambridge, England). At the end of the study all the root exclusion bags were removed from the soil and inspected to ensure that no root had penetrated inside. The soil inside the measurement collars was then collected to assess bulk density (van Reeuwijk, 1992). Mathematical calculation and descriptive statistical analyses were done with Microsoft Excel XP®.
2.2.4 δ13C natural abundance method
Millard et al. (2010) have demonstrated that the natural abundance δ13C (‰) of Rs falls between the δ13C values of the Rh and Ra. The δ13C of Rs and Rh respiration was determined following Lin et al. (1999) and Millard et al. (2010). The isotopic partitioning experiment assessed values of the δ13C of the Rs, Ra and Rh. The sampling took place on 15 March 2017. A closed chamber (10 cm diameter, 10 cm high) was positioned on each emissions measurement collar (n=7 as described in Sect. 2.2.3). The chambers were flushed for 2 min with CO2-free air to remove all the atmospheric air trapped within the headspace. Chambers were left to incubate for 40 min to ensure the concentration of the chamber sample reached above 400 ppm of CO2 from which a duplicate sample of the gas in the chamber headspace was extracted into evacuated vials to give the δ13C of the Rs. Subsequently, the soil under the chamber was dug and immediately brought to the lab (ESSL-CUHK, less than 30 min travel) where the soil and the roots were carefully separated. The roots were gently washed with water to remove adhered soil aggregates and slightly dried afterward with paper towels. Samples of 5 g of root and 10 g of root-free soil per chamber were incubated in CO2-free air in 250 mL airtight glass bottles to give the δ13C of the Ra and Rh, respectively. The bottles were left to incubate for 90 min before duplicate extraction into evacuated vials. As recommended by Midwood and Millard (2011), before gas sample extraction, the butyl rubber septa used to seal the vials were heated at 105 ∘C for 12 h. The C isotope ratio of the CO2 in all samples was analyzed using the GasBench II connected to a DELTAplus Advantage isotope ratio mass spectrometer (both Thermo Finnigan, Bremen, Germany) at the James Hutton Institute Scotland UK. The δ13C ratios, all expressed relative to Vienna Pee Dee Belemnite (VPDB), was calculated with respect to CO2 reference gases injected with every sample and traceable to International Atomic Energy Agency reference material NBS 19 TS-Limestone. Measurement of the individual signatures of the natural abundance δ13C of the Rs, Rh and Ra allowed partitioning between the different sources using the mass balance mixing model (Lin et al., 1999; Millard et al., 2010):
where % Rh is the proportion of Rh from Rs, and δRs, δRh and δRa are the δ13C isotopic signatures.
2.3 Qualitative comparison of segregation methods
While there is much debate in the literature, and methods are still being developed, isotopic partitioning methods are increasingly being recognized as a more accurate approach to segregation of Rs than non-isotopic techniques (Paterson et al., 2009; Kuzyakov, 2006). Thus, for comparison purposes we used the soil δ13C natural abundance method as a reference point for segregation relative accuracy. Partition methods that had Rh % < 10, 10–20 and > 20 lower or larger than the δ13C–CO2 natural abundance were categorized as high, intermediate and low relative accuracy, respectively. The level of precision of the segregation methods was determined with the statistical variance associated with the Rh ∕ Rs ratio averages. High, intermediate and low precision levels were attributed to Rh % standard errors of < 10, 10–20 and > 20, respectively. The level of complexity was evaluated with the number of steps required to complete each method. For example, the hand-sorted root exclusion bag technique was judged as a four-step method (pit excavation, root removal, bag/pit refiling and CO2 efflux measurements). Methods with five steps or fewer were deemed simple and six steps or more deemed as complex. The time needed to set up the experiment was assessed by counting the number of working hours (8 h equal 1 day) required prior to the start of the measurements. The time needed to produce seasonal trends was the number of months of measurements (in the field or in the lab) required to characterize the Rh at the different temperature and moisture levels of the year.
Table 1Morphological description of the soil profiles at the study site.
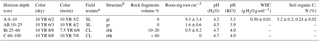
a SL: sandy loam; CL: clay loam.
b gr: granular; sbk: subangular blocky.
WHC: water-holding capacity; C: carbon; N: nitrogen.
3.1 Soil characteristics
According to their morphology and diagnostic properties, the soil was classified as Alic Umbrisol (Nechic) and Haplic Alisol (Nechic) (IUSS-Working-Group-WRB, 2014). The difference between the two soil groups was the thickness of humus-containing horizon (between 20 and 30 cm for the Umbrisol, while it was 10 to 20 cm for the Alisol). The A horizon had high organic C content (3.2 ± 0.2 %) and high acidity (pH 4.2) (Table 1). The subsurface soil was represented by clayey yellow-colored profiles with an argic horizon. Soil texture was heavier in the argic horizon than in the topsoil and parent material. The structure in all the soil profiles was predominantly granular in the upper horizons, whereas the argic horizon was characterized by subangular blocky structure (Table 1). The argic horizon was deemed to be of high-activity clays and low cation base status based on previous results in the area, along with soil acidity, type of parent material and level of mineralization of the bedrock in the soil pits.
Table 2Comparison of environmental parameters inside and outside the root exclusion bags.
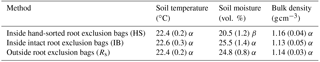
Values are means and standard error. Values in the same column followed by a different Greek letter (α, β) are significantly different from each other at α=0.05.
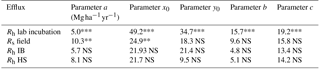
Table 3Parameter values of the Gaussian 3-D regression fitted curve (Eq. 1).
Rh lab incubation: heterotrophic respiration from the soil cores
incubation.
Rs field: total soil respiration from outside of the root exclusion
bags.
Rh IB: heterotrophic respiration from the intact root exclusion
bags.
Rh HS: heterotrophic respiration from the hand-sorted root exclusion
bags.
** and *** denote values that are significant at p<0.01 and p<0.05,
respectively; NS non-significant.
Parameters are from Eq. (1). Parameter a corresponds to the height of the
maximum high of the curve (), x0 is the
peak soil temperature point (∘C) in the curve, y0 is the
peak soil moisture (%) point in the curve and b and c are the
Gaussian root mean squared widths of the soil temperature and soil moisture,
respectively.
Table 4Average δ13C–CO2 results.
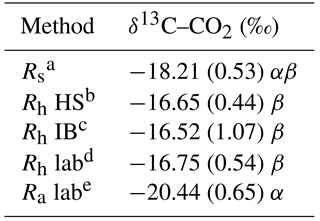
a Rs: gas samples collected from the field total soil respiration
collars.
b Rh HS: gas samples collected from the field hand-sorted root
exclusion bag collars.
c Rh IB: gas samples collected from the field intact blocks root
exclusion bag collars.
d Rh lab: gas samples collected from lab incubations of soil with
freshly removed roots.
e Ra lab: gas samples collected from lab incubations of the roots
extracted in Rh lab.
Values are means and standard error; n=14 for Rs and Ra and n=7 for
HS, IB and Rh lab.
Values followed by a different Greek letter (α, β) are
significantly different from each other at α=0.05.
Table 5Comparison of heterotrophic respiration assessment methods.
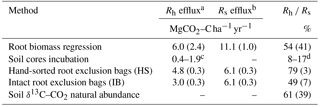
Values are means and standard error; n=22 for the root biomass
regression, n=47 for soil incubation,
n=28 for both root exclusion bag techniques.
a Rh: heterotrophic respiration.
b Rs: total soil efflux taken alongside the Rh
efflux.
c Efflux range at temperature between 14 ∘C and
26 ∘C.
d Calculated as Rh from incubation at 14 and
26 ∘C divided by average field Rs at 14 and
26 ∘C, respectively.
3.2 Regression between root biomass and CO2 efflux
The 22 quadrats used for the root biomass regression assessment yielded an average Rs of 11.1 ± 1.0 MgCO2–C ha1 yr−1. The regression of the CO2 efflux against root biomass produced a statistically significant slope correlation of 0.08 ± 0.04 gCO2 m2 h−1 per mg root cm−3 (p=0.03), and set the intercept at 0.25 ± 0.10 g CO2 m2 h−1 (p=0.02), which represented the basal efflux in the absence of roots, i.e., the Rh (Fig. 3). The Rh measured (i.e., slope intercept) when the root biomass regression technique was performed (October 2016) was 6.0 ± 2.4 , equivalent to 54 % of the Rs (Table 5).
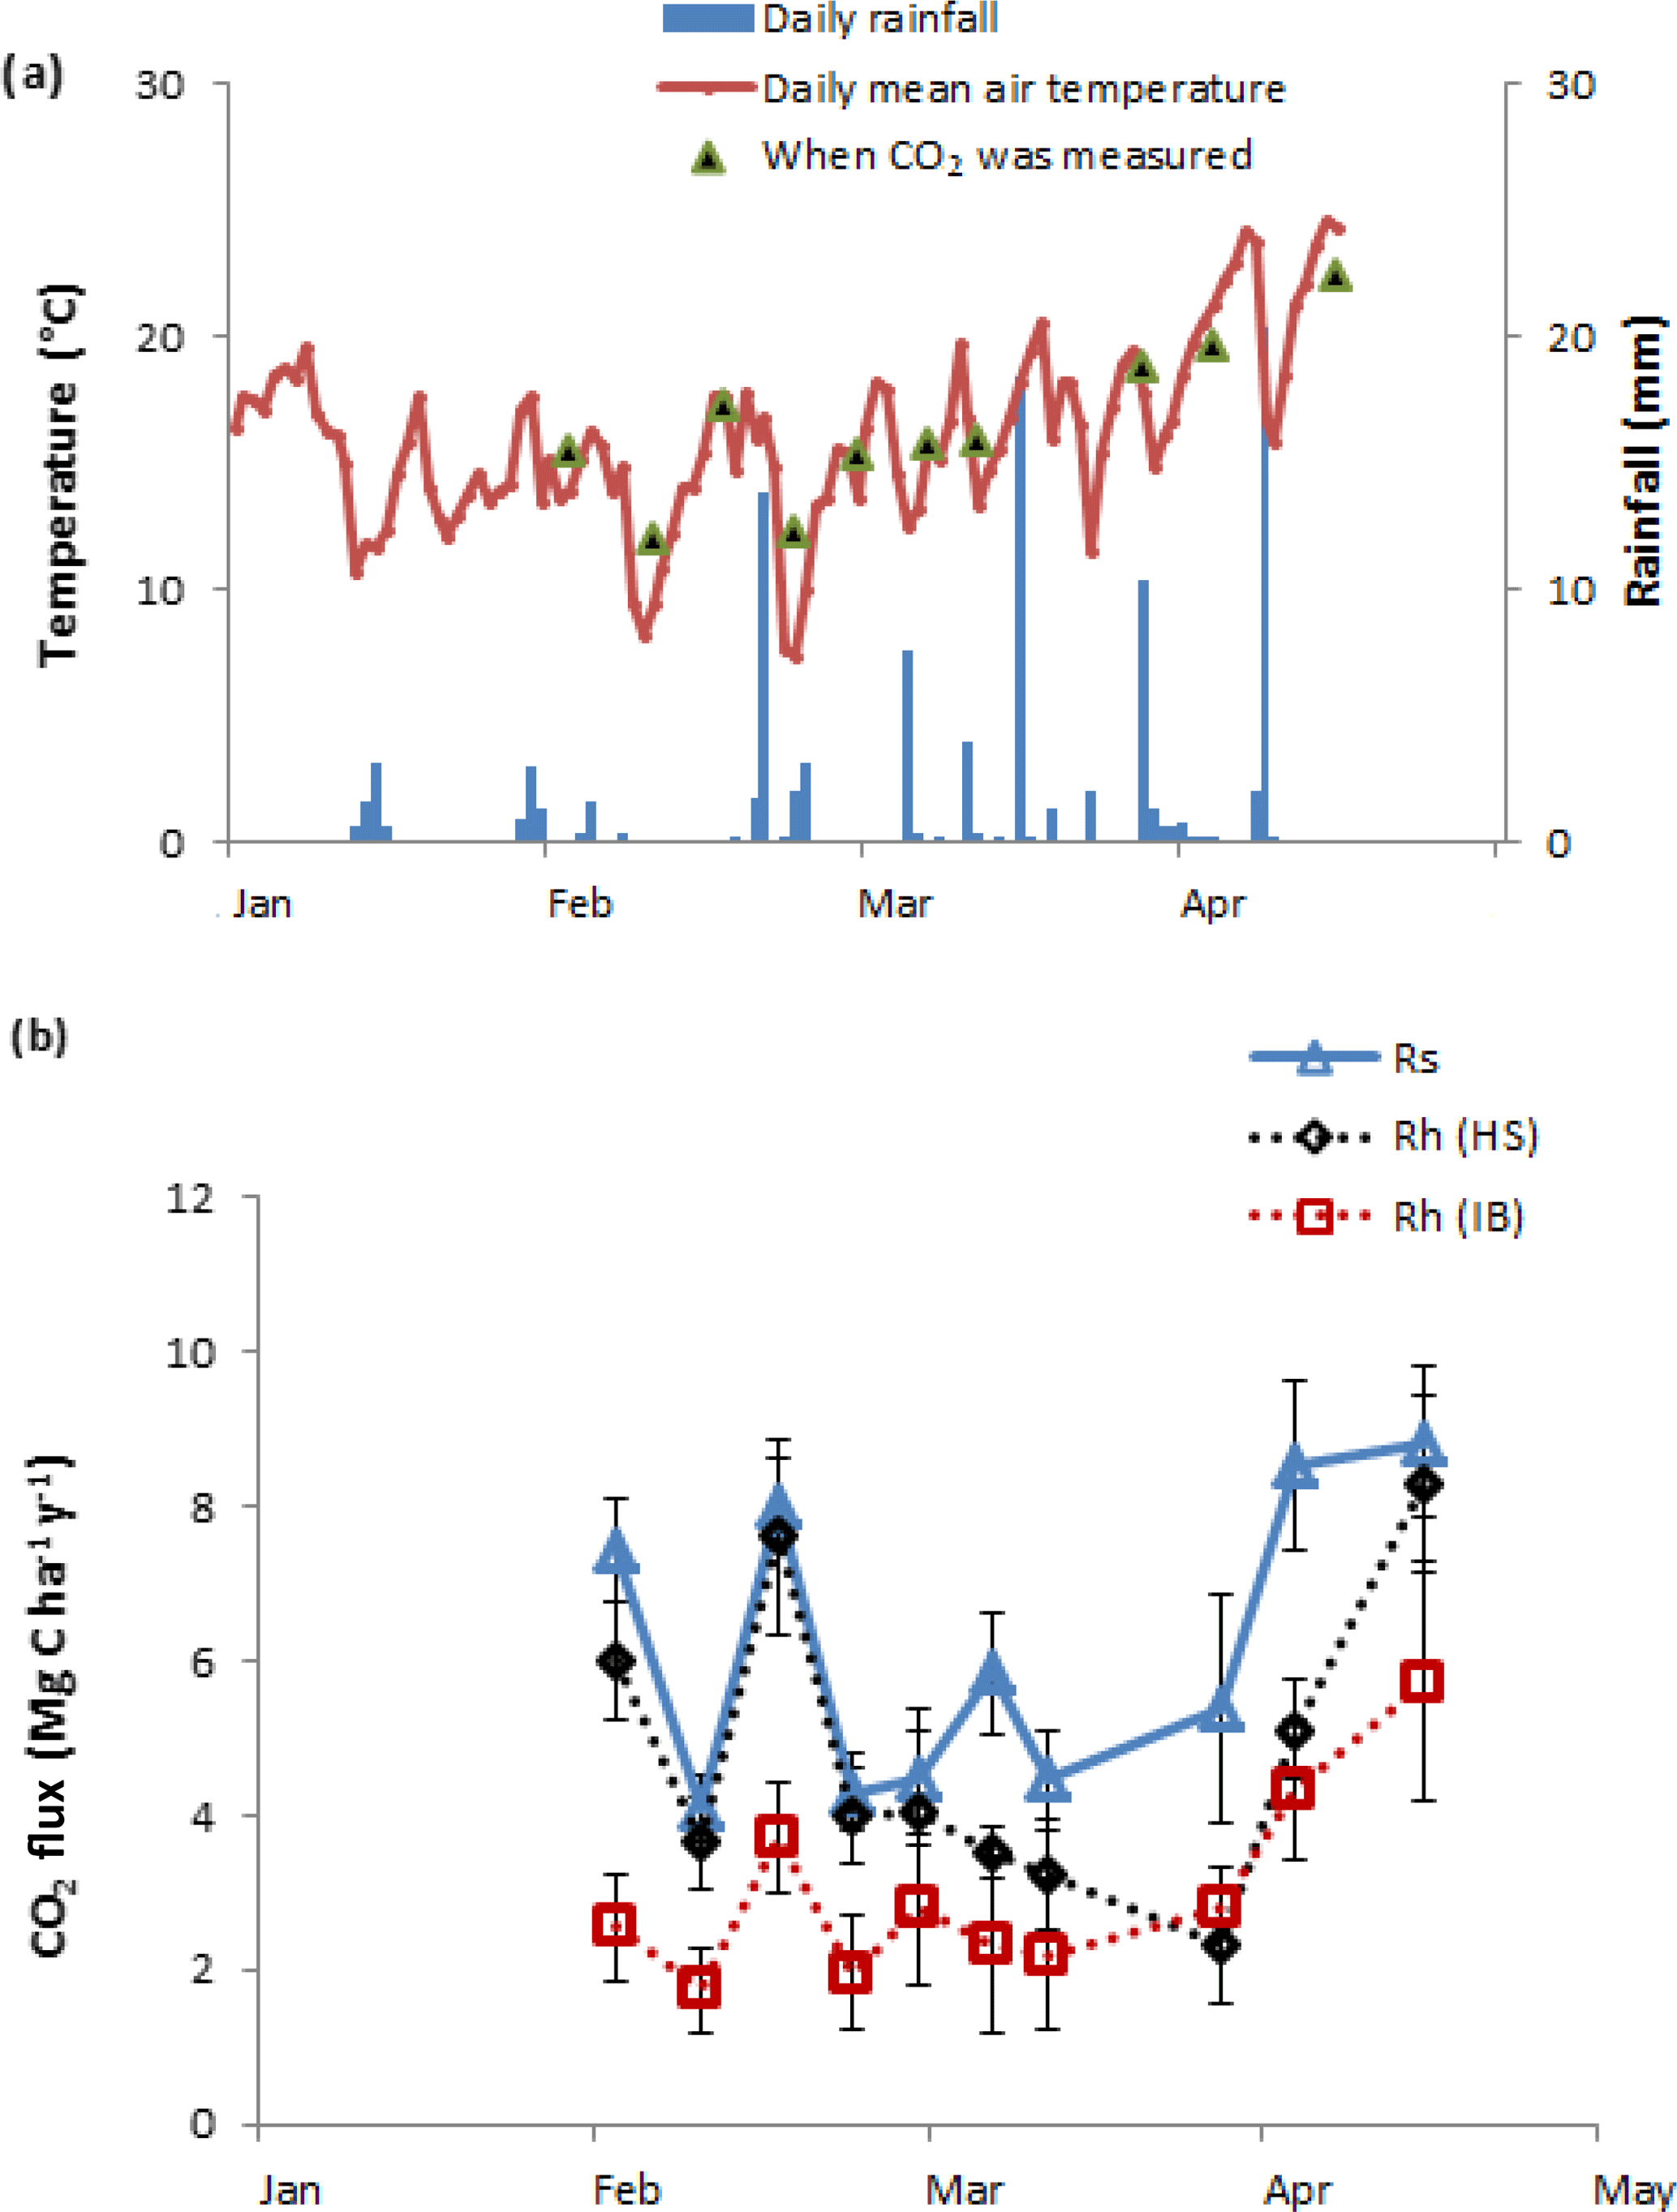
Figure 2(a) Soil and air temperature and daily rainfall over the study period; (b) total soil CO2 efflux (Rs), heterotrophic CO2 efflux (Rh) from hand-sorted root exclusion bags (HS) and Rh from intact block root exclusion bags (IB).
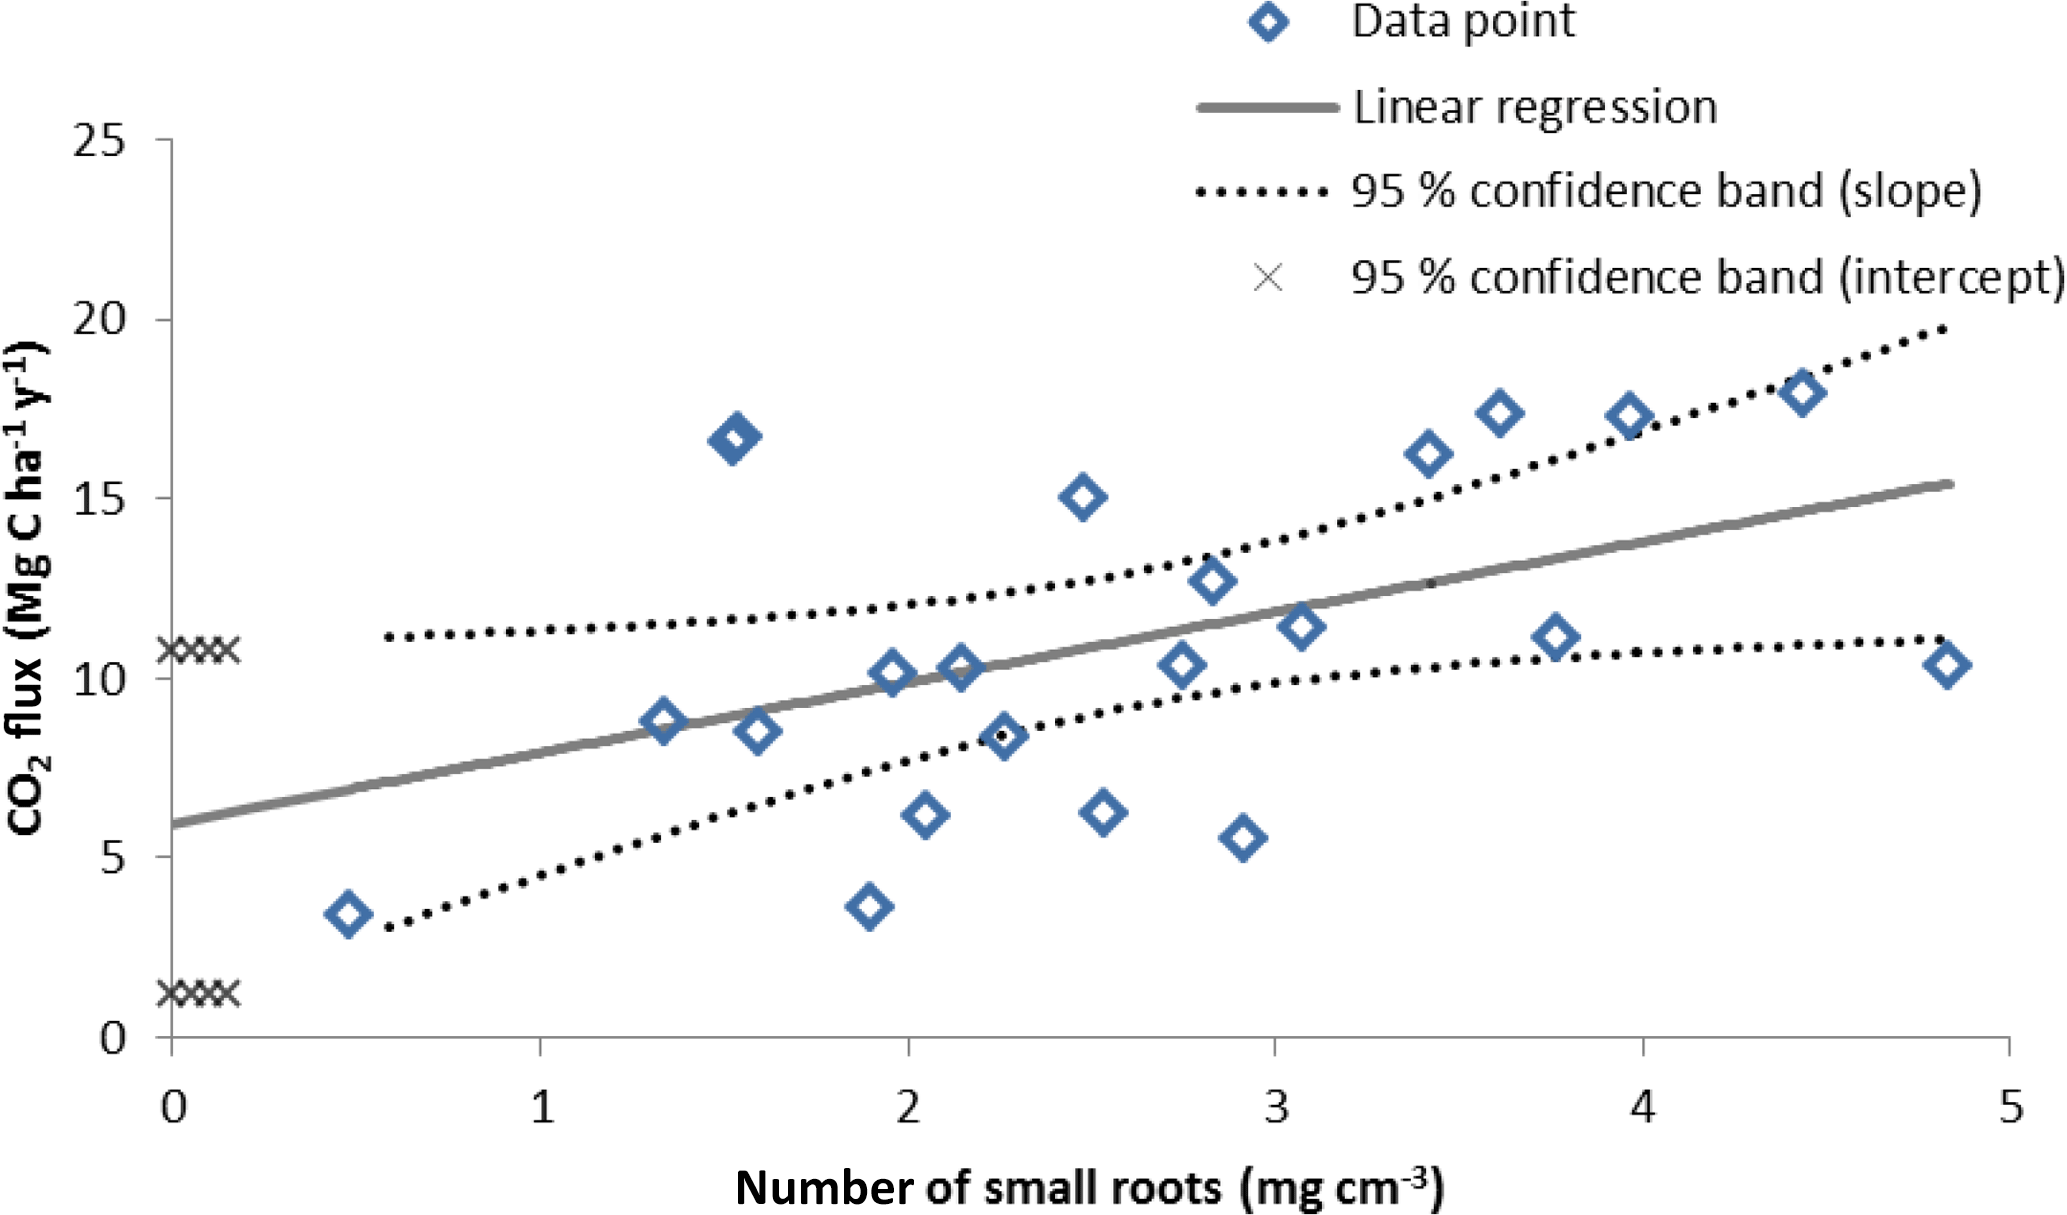
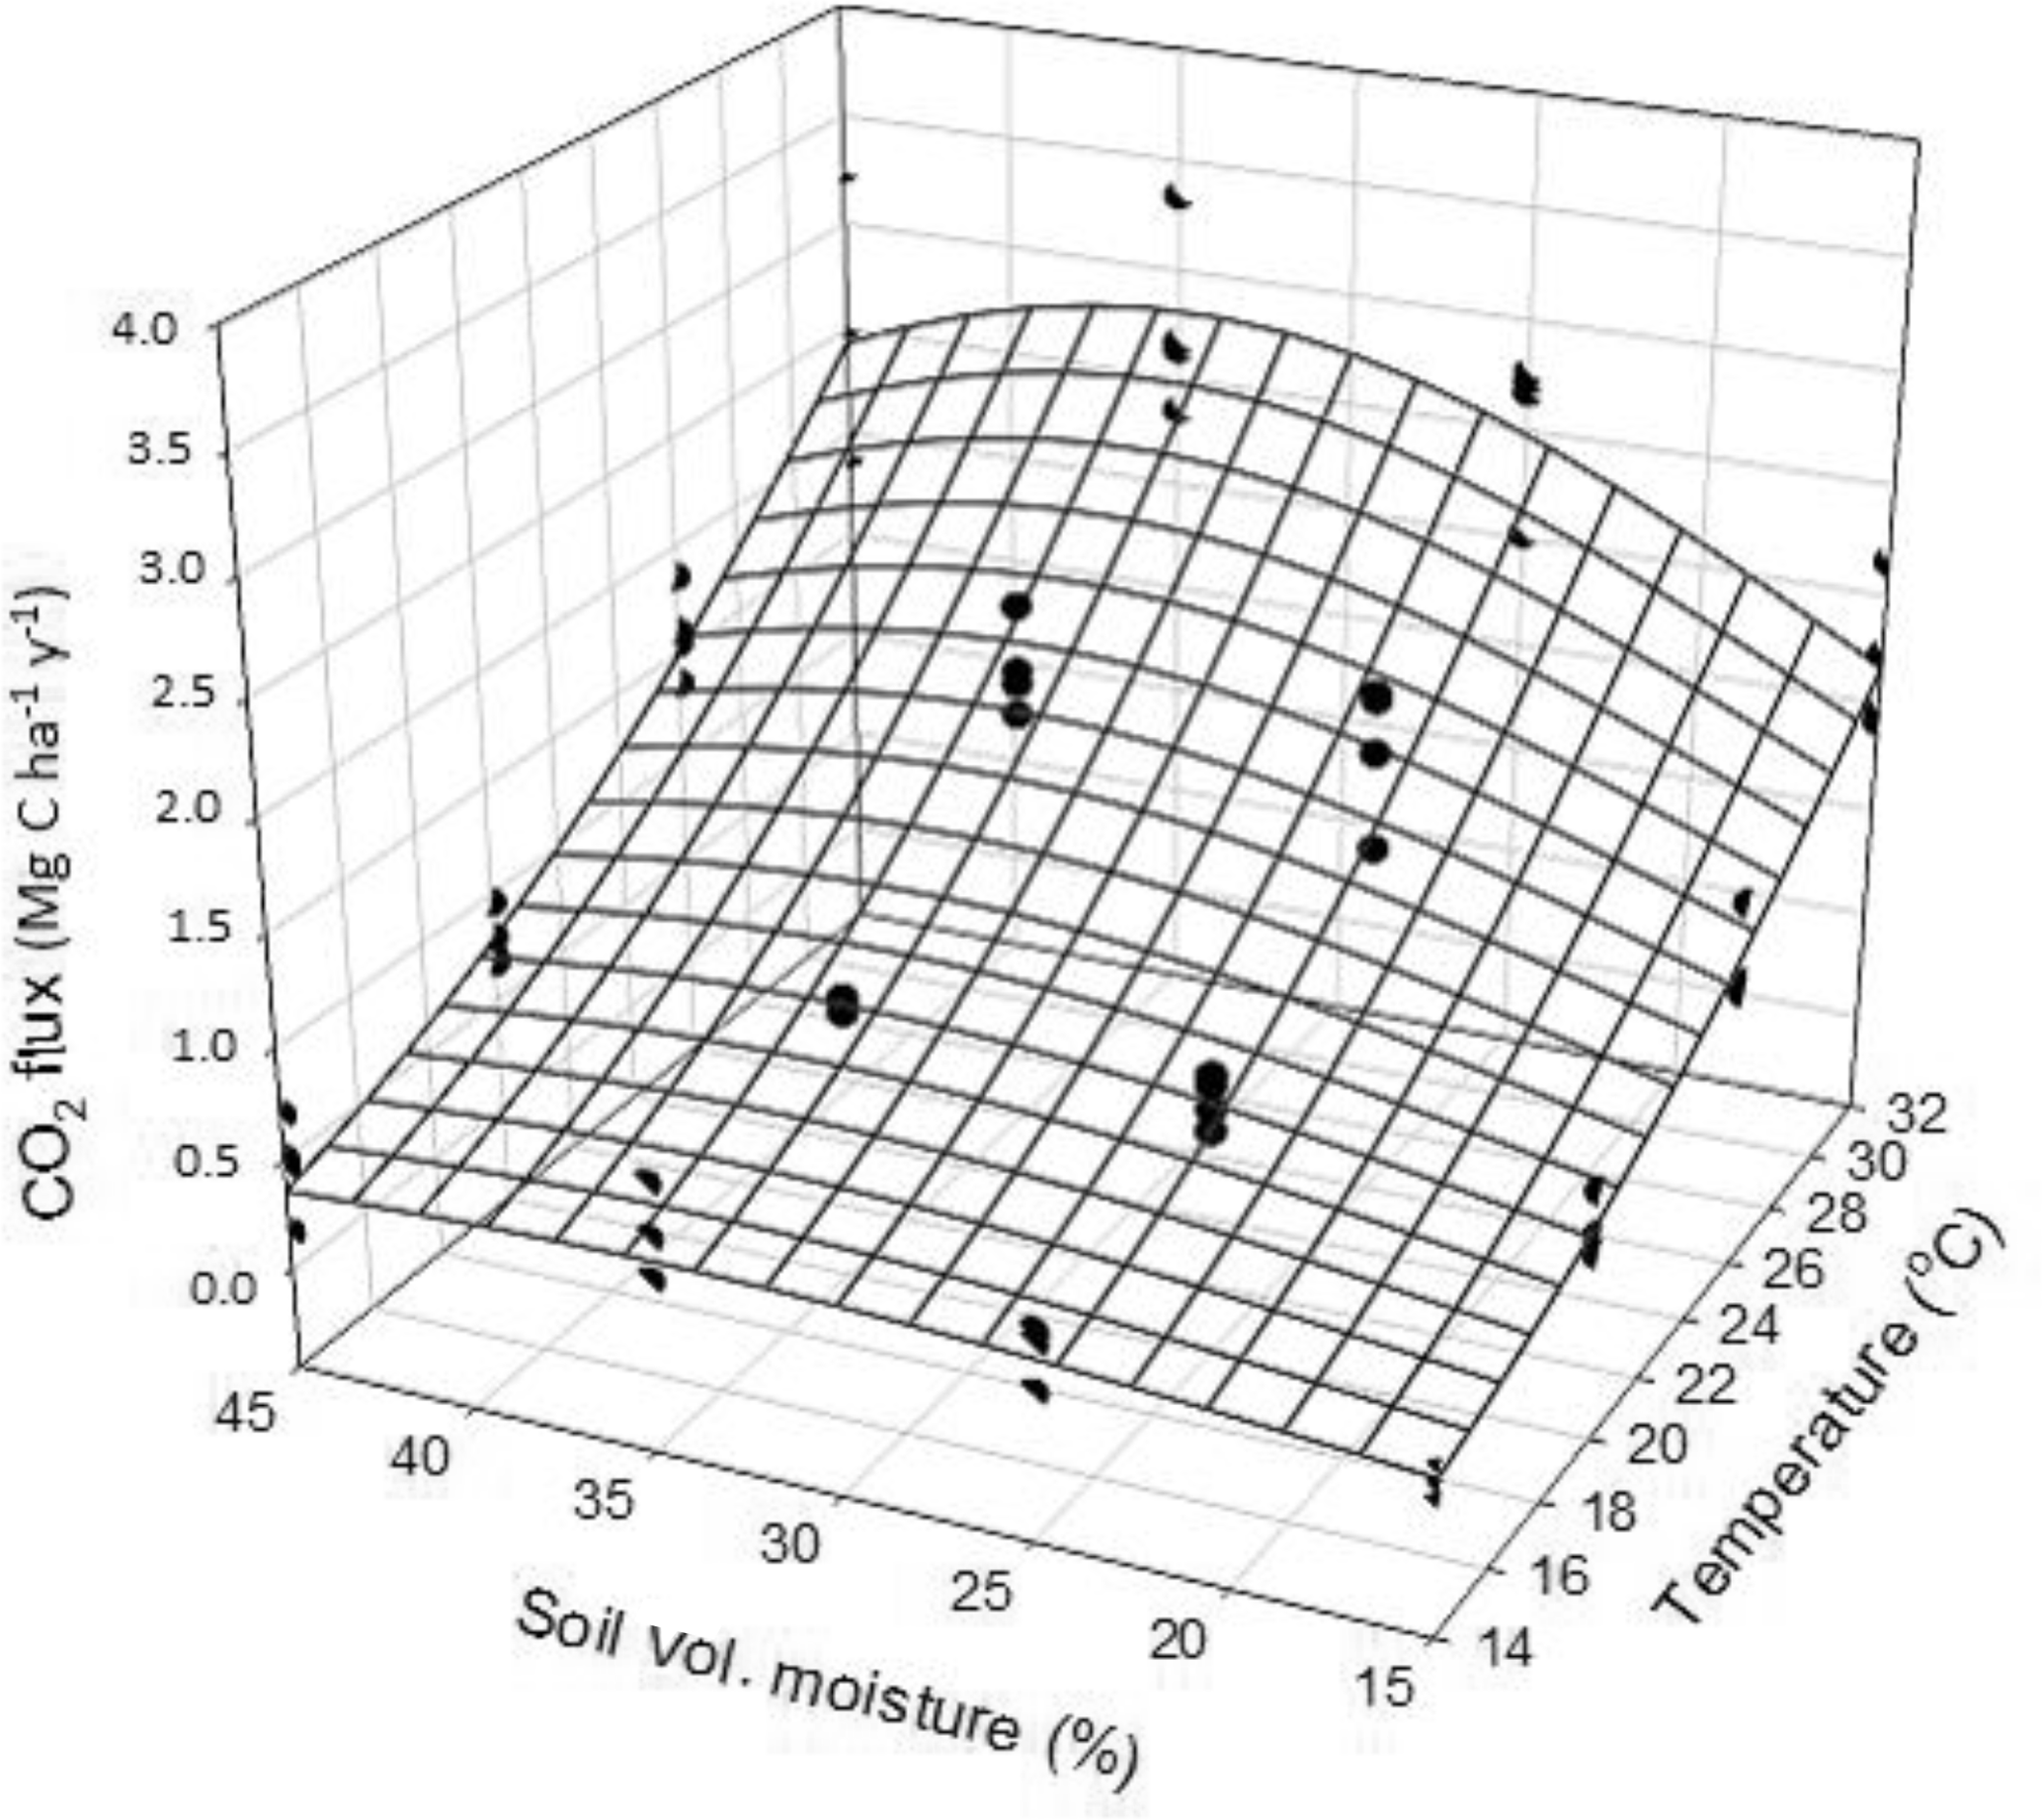
Figure 4Results from the lab incubation: regression between incubation temperature, moisture and CO2 efflux.
3.3 Lab incubation
During the incubation with minimally disturbed soil microcosms, the average (moisture levels combined) CO2 efflux at 14, 20, 26 and 32 ∘C was 0.36 ± 0.50, 0.67 ± 0.38, 1.40 ± 0.91 and 2.24 ± 1.39 Mg CO2–C ha1 yr−1, respectively (Fig. 4). The exponential relationship between CO2 efflux, soil temperature and moisture is presented in Table 3.
3.4 Root exclusion bag methods
During the root exclusion bag measurement period (February–April 2017), the average air temperature was 16 ∘C and the total rainfall 107 mm. During that period the Rs averaged 6.1 (Fig. 2). One of the requirements for the suitability of root exclusion bag methods to estimate Rh is that soil bulk density, soil temperature and moisture are statistically equal inside and outside of the bags. In this experiment, no significant differences were detected regarding the bulk density and soil temperature (p=0.87 and p=0.15, respectively) but the volumetric soil moisture in the HS bags was on average 17 % lower than outside the root exclusion bags (p=0.04) (Table 2). As would be expected, all Rh IB and Rh HS efflux rates were lower than the Rs efflux at each measurement date. Throughout the experiment, the Rh IB was consistently lower than the Rh HS, except on 31 March (Fig. 2b).
3.5 Soil δ13C–CO2 natural abundance
On a landscape basis, the δ13C–CO2 natural abundance method reasonably segregated the three respiration components (Table 4). The δ13C–CO2 values of the Rh HS, Rh IB and Rh lab were in a very close range (i.e., −16.52 to −16.75), indicating that the efflux measured in the root exclusion bags were not contaminated with root respiration. Based on the δ13C–CO2 of the Rs (−18.21 ± 0.53), the Rh lab (−16.75 ± 0.54) and the Ra lab (−20.44 ± 0.65), the average percentage of heterotrophic respiration was 61 ± 39 % (Table 5).
Using the δ13C–CO2 method as a baseline, the increase/decrease of the Rh from root biomass regression, lab incubation, hand-sorted and intact block (IB) root exclusion techniques were −11, −72–87, +30 and −20 %, respectively (Table 5).
Table 6Qualitative evaluation of the partition methods.
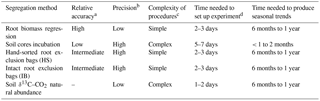
a Partition methods that had Rh % < 10, 10–20 and > 20 lower
or larger than the δ13C–CO2 natural abundance were
categorized as high, intermediate and low accuracy, respectively.
b High, intermediate and low precision values were attributed to Rh %
standard errors of < 10, 10–20 and > 20, respectively.
c Methods with five steps or fewer were deemed simple and six steps or
more deemed as more complex.
d The time needed to set up experiment was assessed with the number of
working hours required prior to be able to start the measurements.
e The time needed to produce seasonal trends was the number of months
of measurements required to characterize the Rh at the different temperature
and moisture levels of the year.
4.1 Regression between root biomass and CO2 efflux technique
As demonstrated by Gupta and Singh (1981) the intercept of the regression line between the independent variable (i.e., root biomass) and the dependent variable (i.e., Rs) corresponds to soil respiration in the absence of roots (i.e., Rh) (Fig. 3). In this study the regression had 10 points (45 %) outside the confidence interval but the intercept and slope were still statistically significant. This uncertainty in the regression fit was likely caused in large part by the older roots which are bulkier but respire less than fine and young roots (Behera et al., 1990). However, this method had the closest average Rh ∕ Rs ratio to the δ13C natural abundance technique. Consequently the root biomass regression technique was assessed as high relative accuracy and low precision (Table 6). Previous studies also highlighted large variation of CO2 efflux and root biomass which causes relatively low coefficient of determinations (Behera et al., 1990; Farmer, 2013). In accordance to Kuzyakov (2002), this method was comparatively simple (Table 6).
4.2 Lab incubation method
Interpreting soil respiration processes in response to seasonal changes is generally challenging because soil temperature and moisture regularly co-vary (Carbone et al., 2011; Davidson et al., 1998). The lab incubation technique was the only method capable of dividing the effect of soil temperature and moisture on Rh and producing a significant Gaussian regression fit (Table 3). However, the microcosm incubation produced Rh values notably lower than the other techniques (Table 5). This may be due to three different causes: first, the fact that the soil column in the incubation microcosms was 5 cm thick while the A horizon in the field (i.e., where the Rh assessments from the other techniques were made) was 10 cm (Table 1). Second, to prevent potential shifts in the microbial community during the incubations (i.e., adapting to lower resource availability), prior to the beginning of the experiment, the microcosms were left to stabilize for two weeks. Accordingly, the fresh and labile organic residues that would, in the other segregation methods, contribute to the soil respiration had already decomposed before the beginning of the incubations. Third, the low Rh of the lab incubation method could also be attributed in part to the fact that this technique did not contain any rhizomicrobial respiration and its priming effect (Kuzyakov et al., 2000); that is, this method produced Rh from basal microbial respiration which is considered to be from stabilized SOM with slow turnover rates (Kuzyakov, 2006; Neff et al., 2002). In view of that, with additional field and lab method development, it would be possible to further segregate Rh assessments into percentage of rhizomicrobial respiration, decomposition of plant residues and basal decomposition of SOM. Overall, the lab incubation technique was slightly more complex than the non-isotopic field Rh assessment methods but allowed a prompt determination of Rh whilst simulating year-round field conditions (Table 6). Further studies should test the effect of microcosm height on Rh in relation to field measurements and determine microbial C use efficiency by isothermal microcalorimetry during the incubations.
4.3 Root exclusion bag methods
The HS and IB methods had % Rh of 79 ± 3 and 49 ± 7 %, respectively. The variances around the means were the lowest of all the field segregation methods tested (Table 5). Comparing the % Rh of the HS and IB with the δ13C natural abundance technique, they resulted 18 % above and 12 % below, respectively. Thus the root exclusion bag methods were judged to be of intermediate relative accuracy and high precision. Also, the HS and IB methods were fast and simple to set up (Table 6).
The micromesh size used in the root exclusion bags was 38 µm, which was reported to impede root penetration but to allow arbuscular mycorrhiza to spread inside the bags (Moyano et al., 2007; Rühr and Buchmann, 2010). In turn, Fenn et al. (2010) stated that in the mycorrhizal structures the arbuscules exist within roots, and therefore, the CO2 efflux from these bags could contain some portions of the roots' respiration. Contrary to this, the IB and HS air samples analyzed for δ13C had an isotopic signature close to and not statistically different from the gas samples collected in the lab airtight glass bottle of fresh soil without roots. This indicates that the root exclusion bags (both IB and HS) did not comprise traces of root respiration that had a significantly larger δ13C–CO2 signature (Table 4). After the 3-month period of soil stabilization, both bag methods for partitioning total soil respiration and root-free soil respiration components successfully produced Rs>Rh on every sampling day, indicating that efflux rates within the bags had reached an apparent post-disturbance state (Fig. 2). Also, in both IB and HS, soil temperature and bulk density were statistically equal to the surrounding soil (i.e., Rs) (Table 2). This indicates that the environmental conditions inside and outside of the bags were similar in respect to these two parameters. However, the soil moisture of the IB was statistically equal to the surrounding soil but for HS it was significantly lower. This was likely caused by the breakdown of the original soil structure at the moment of root removal that increased the drainage inside the HS bags. Moyano et al. (2007) also found that soil moisture can be affected by the hand-sorted root exclusion bag method. Overall, HS had a moisture level 20 % lower and an Rh efflux 60 % larger than IB (Table 5). The larger HS Rh efflux compared with IB Rh could be due in part to the lower soil moisture in the former. This likelihood is supported by the fact that in the regression fit the maximum Rh was when moisture content was relatively low (i.e., y0, Table 3). In addition, the breakdown of numerous soil aggregates during the root removal likely allowed the soil microorganisms to thrive in previously encrusted SOM domains of the HS soil. It has been shown that the part of the SOM that is located in the interior of the soil aggregates is hardly accessible to microorganisms, and thus not easily mineralized unless the aggregates are shattered (Goebel et al., 2005).
4.4 Soil δ13C natural abundance method
The three respiration components of this method (i.e., δ13C–CO2 from Rs, Rh and Ra) had large standard errors (Table 4) that produced a high uncertainty value in the Rh ∕ Rs ratio assessment (61 ± 39 %, Table 5). This method was accordingly deemed to be of low precision (Table 6). This, in turn, impeded our ability to produce an Rh ∕ Rs ratio assessment in the individual collars. The low precision of this method indicates that some biases in the assessment of relative accuracy could potentially have been generated. This large δ13C–CO2 variance was likely caused by variability of δ13C in soil and plants residues and also due to 13C discrimination by plants that is affected by moisture content and nitrogen availability (Hogh-Jensen and Schjoerring, 1997). In addition, other studies reported the variability of δ13C in soil or plants of at least 1–2 ‰, which in some cases can limit the capacity to produce soil respiration segregation assessments (Accoe et al., 2002; Cheng, 1996; Farquhar et al., 1989). Because soils are porous mediums, excluding any atmospheric CO2 that has a different isotopic composition (i.e., δ13C −7.5 to −8.5 ‰) to that of the Rs efflux is challenging, and potential air contaminations have to be considered when analyzing the results (Millard et al., 2010). In our study, the Rh δ13C was measured in the field (IB and HS; potentially air-contaminated) and from airtight containers in lab incubations of root-free soil (Rs lab; not potentially air-contaminated). Both ways produced δ13C in a close range and without statistical differences between them (Table 4). This indicates that the chamber system used in the field to collect the δ13C efflux samples was adequately effective to prevent air contamination. Overall, the soil δ13C natural abundance method was fast to set up but was relatively complex to perform with a field and lab component to be accomplished within a short period of time (Table 6). Further studies should use a large number of sampling points to attempt to reduce the respiration components standard errors.
4.5 Comparison of methods and recommendations
The analysis of the five different Rs partitioning methods examined in this study shows that none of them were fully satisfactory; that is, each technique had strengths and weaknesses (Table 6). Using δ13C–CO2 is acknowledged as the preeminent way to segregate Rs (Cheng, 1996; Kuzyakov, 2006); and accordingly the relative accuracy of the other methods was defined by their difference with this method. However, we recognize this was a precarious approach because the δ13C–CO2 method had a large variation. The root biomass regression, which is also recognized in the literature as a reliable method (Kuzyakov, 2006), gave a similar % Rh estimate. However, we found several other shortcomings with the δ13C–CO2 method. First, the conjunction of field and lab procedures makes it difficult to complete this method in 1 day as needed. Second, the air flushing with CO2-free gas in the field (to prevent ambient δ13CO2 contamination) makes that technique more complex than the other methods to assess Rh %. Third, the ability to perform this technique in remote areas is limited because the δ13C–CO2 needs to be quickly assessed with a calibrated and accurate spectrometer (Midwood et al., 2006). Fourth, the large variation in δ13C–CO2 of the respiration components (i.e., Ra, Rh and Rs) impeded the assessment of Rh % per individual collar. Accordingly, further studies should analyze the spatial relationships of δ13C–CO2 with soil properties and root characteristics. As a stand-alone method, the δ13C–CO2 technique was unable to produce an assessment of soil CO2 efflux, and thus it needed to be performed in conjunction with field Rs measurements. In this regard, the δ13C–CO2 complemented the root exclusion bag methods well because it allowed us to determine whether the buried bags had been torn and been invaded by roots and to standardize Rh % determination.
The root biomass regression method had the advantage of being simple, and produced an average Rh % close to the δ13C–CO2 natural abundance. However it had the disadvantage of requiring a high number of replicates due to the low coefficient of determination between the CO2 efflux and the root biomass. Another disadvantage of the root biomass regression technique is that in order to produce seasonal trends, the labor-intensive procedures (i.e., pit digging, CO2 measurements and root counting) need to be reinitiated several times during the year. This shortcoming can be particularly impractical in small plot experiments. Complementary studies should assess thresholds of root size to be included in the regression fit in order to optimize the correlation fit and use the δ13C–CO2 natural abundance method to determine the effect of root size on the isotopic signature.
The root exclusion bag methods (i.e., HS and IB) had the advantage of being easy to monitor throughout the year, capturing temporal variability of the % of Rh. The bag methods can be considered as a miniaturization of the traditional soil trenching method. However, contrasting with large trenches (e.g., Comeau et al., 2016; Fisher and Gosz, 1986) the root exclusion bags had the advantage of being simpler to establish and allowed mycorrhiza development inside the mesh bags (Moyano et al., 2007). Conversely, due to the relatively small bag sizes, root webs on the outside edge could potentially contaminate Rh assessment. In this study, the δ13C–CO2 determination made with the collars located in the center of the bags showed no isotopic signature of root respiration. Similar to a trenching method, the root exclusion bag method had the disadvantage of requiring several months of soil stabilization before CO2 efflux measurements could begin. Compared with the δ13C–CO2 natural abundance method, the HS and IB overestimated and underestimated % Rh by 18 and 12 %, respectively. The divergences were likely caused by soil disturbances, alteration in root demise dynamic and a lack of root exudates. Correspondingly, Carbone et al. (2016) found an 11 % difference in Rh % assessment between an isotopic partition method and the trenching technique. Comparing the HS and IB, the former created more soil disturbances but the latter would not be suitable for soil with a high amount of sand, gravel or rock because the intact blocks would collapse.
The lab incubations of the minimally disturbed microcosms was the only method that had absolutely no influence of roots or mycorrhiza. Thus the results from this method exclusively represented the CO2 efflux originating from the mineralization of the slow turnover SOC pool (i.e., basal soil respiration) (Pell et al., 2006). Assessment of basal soil respiration in relationship with the total Rh is of great importance in evaluating the dynamic of the stabilized SOC. In this study, the Rh % from the lab incubation was 8–17 %, while the δ13C–CO2 natural abundance had an average of 61 % Rh. Thus, as the soil incubation results were not affected by the height of the soil columns (as discussed above), basal respiration represented approximately one-fifth of the Rh. Because stabilized SOC is a key indicator of soil quality and health (Creamer et al., 2014), further research should study the relationship between basal soil respiration and rhizosphere-derived Rh. Also, future studies on soil CO2 efflux segregation should include other partitioning techniques like the trenching method and radiocarbon-based assessments (Chiti et al., 2016). Overall, results from field experiments exhibited a range of potential Rh between 2.5 and 6.0 Mg CO2-. With the publication of the total annual live biomass growth (i.e., including root and above-grown biomass) at the study site (Tai Po Kau Nature Reserve), assessment of the net ecosystem C balance would then be possible.
Methods for determining ecosystem C fluxes need to be improved and applied to allow a quantitative understanding of the biological processes underlying the SOC balance. This study compared five methods to assess Rh and our results showed large variation in effluxes and Rh ∕ Rs ratio between the different techniques analyzed. The data revealed that the hand-sorted root exclusion bags and the intact root exclusion bag methods produced similar Rh efflux values, and these effluxes were slightly lower than the one produced by the root biomass regression method but notably larger than the lab incubation with soil cores. We found that methods with higher relative accuracy (soil δ13C–CO2 natural abundance and root biomass regression) had lower precision (i.e., large variance) and methods with higher precision (root exclusions bags and lab incubation) had lower relative accuracy. Based upon these results, we suggest that when assessing the rate of heterotrophic emissions and their contribution to total soil-based emissions, two or more methods should be performed to produce more integral assessments.
Research data can be accessed in the Supplement.
The supplement related to this article is available online at: https://doi.org/10.5194/soil-4-141-2018-supplement.
The authors declare that they have no conflict of interest.
This article is part of the special issue “Regional perspectives and challenges of soil organic carbon management and monitoring – a special issue from the Global Symposium on Soil Organic Carbon 2017”. It is a result of the Global Symposium on Soil Organic Carbon, Rome, Italy, 21–23 March 2017.
The work described in this paper was supported by two grants from the
Research Grants Council of the Hong Kong Special Administrative Region, China
(CUHK14302014 and CUHK14305515), as well as a Direct Grant of CUHK (SS16914).
Thomas Lui is thanked for assistance with the gas chromatograph analysis.
Jack Lin is thanked for the assistance in building the microcosm tubes and
for ensuring that the incubation containers were fully airtight. Amelia Amadeo, Christoph Hartmann and
Merve Oztoprak are thanked for the assistance
during the field measurements. Barry Thornton from the James Hutton
Institute, Scotland, UK, is thanked for the δ13C–CO2
determination.
Edited by: Peter de Ruiter
Reviewed by: Jeroen van Leeuwen and one anonymous referee
Accoe, F., Boeckx, P., Van Cleemput, O., Hofman, G., Zhang, Y., Rong Hua, L., and Guanxiong, C.: Evolution of the d13C Signature Related to Total Carbon Contents and Carbon Decomposition Rate Constants in a Soil Profile Under Grassland, Rapid Commun. Mass Spectrom., 16, 2184–2189, https://doi.org/10.1002/rcm.767, 2002.
Arcand, M. M., Helgason, B. L., and Lemke, R. L.: Microbial crop residue decomposition dynamics in organic and conventionally managed soils, Appl. Soil Ecol., 107, 347–359, 2016.
Behera, N., Joshi, S. K., and Pati, D. P.: Root contribution to total soil metabolism in a tropical forest soil from Orissa, India, Forest Ecol. Manag., 36, 125–134, 1990.
Braig, E. and Tupek, B.: Separating soil respiration components with stable isotopes: natural abundance and labelling approaches, IFOREST, 3, 92–94, 2010.
Carbone, M. S., Still, C. J., Ambrose, A. R, Dawson, T. E., Williams, A. P., Boot, C. M., Schaeffer, S. M., and Schimel, J. P.: Seasonal and episodic moisture controls on plant and microbial contributions to soil respiration, Oecologia, 167, 265–278, 2011.
Carbone, M. S., Richardson, A. D., Chen, M., Davidson, E. A., Hughes, H., Savage, K. E., and Hollinger, D. Y.: Constrained partitioning of autotrophic and heterotrophic respiration reduces model uncertainties of forest ecosystem carbon fluxes but not stocks, J. Geophys. Res.-Biogeosci., 121, 2476–2492, 2016.
Cheng, W.: Measurement of rhizosphere respiration and organic matter decomposition using natural 13C, Plant Soil, 183, 263–268, 1996.
Chiti, T., Certini, G., Forte, C., Papale, D., and Valentini, R.: Radiocarbon-Based Assessment of Heterotrophic Soil Respiration in Two Mediterranean Forests, Ecosystems, 19, 62–72, 2016.
Comeau, L.-P., Hergoualc'h, K., Hartill, J., Smith, J., and Verchot, L. V.: How do the heterotrophic and the total soil respiration of an oil palm plantation on peat respond to nitrogen fertilizer application?, Geoderma, 268, 41–51, https://doi.org/10.1016/j.geoderma.2016.01.016, 2016.
Creamer, R. E., Schulte, R. P. O., Stone, D., Galb, A., Krogh, P. H., Lo Papa, G., Murray, P. J., Peres, G., Foersterg, B., Rutgers, M., Sousa, J. P., and Winding, A.: Measuring basal soil respiration across Europe: do incubation temperature and incubation period matter?, Ecol. Indic., 36, 409–418, 2014.
Cui, J. and Lai, D. Y. F.: Soil-atmosphere N2O and CH4 exchanges were suppressed by litter layer in a subtropical secondary forest, AGU Fall Meeting, San Francisco, USA, 12–16 December 2016.
Davidson, E. A., Belk, E., and Boone, R. D.: Soil water content and temperature as independent or confounded factors controlling soil respiration in a temperate mixed hardwood forest, Global Change Biol., 4, 217–227, 1998.
Davis, D. W., Sewell, R. J., and Campbell, S. D. J.: U-Pb dating of Mesozoic igneous rocks from Hong Kong, J. Geol. Soc. London, 154, 1067–1076, 1997.
Ellert, B. H. and Bettany, J. R.: Calculation of organic matter and nutrients stored in soils under contrasting management regimes, Can. J. Soil Sci., 75, 529–538, 1995.
Farmer, J. A.: Measuring and modeling soil carbon and carbon dioxide emissions from Indonesian peatlands under land-use change, PhD, University of Aberdeen, UK, available at: https://aulib.abdn.ac.uk/F?func=direct&local_base=ABN01&doc_number=001582866 (last access: 9 May 2018), 2013.
Farquhar, G. D., Ehleringer, J. R., and Hubick, K. T.: Carbon isotope discrimination and photosynthesis, Annu. Rev. Plant Physio., 40, 503–537, 1989.
Fenn, K. M., Malhi, Y., and Morecroft, M. D.: Soil CO2 efflux in a temperate deciduous forest: environmental drivers and component contributions, Soil Biol. Biochem., 42, 1685–1693, 2010.
Fisher, F. M. and Gosz, J. R.: Effects of trenching on soil processes and properties in a New Mexico mixed-conifer forest, Biol. Fertil. Soils, 2, 35–42, 1986.
Goebel, M.-O., Bachmann, J., Woche, S. K., and Fischer, W. R.: Soil wettability, aggregate stability, and the decomposition of soil organic matter, Geoderma, 128, 80–93, 2005.
Gupta, S. R. and Singh, J. S.: Soil respiration in a tropical grassland, Soil Biol. Biochem., 13, 261–268, 1981.
Harmon, M. E., Bond-Lamberty, B., Tang, J. W., and Vargas, R.: Heterotrophic respiration in disturbed forests: A review with examples from North America, J. Geophys. Res.-Biogeosci., 116, G00K04, https://doi.org/10.1029/2010JG001495, 2011.
Hergoualc'h, K. and Verchot, L. V.: Stocks and fluxes of carbon associated with land use change in Southeast Asian tropical peatlands: a review, Global Biogeochem. Cy., 25, GB2001, https://doi.org/10.1029/2009gb003718, 2011.
Hinko-Najera, N., Fest, B., Livesley, S. J., and Arndt, S. K.: Reduced throughfall decreases autotrophic respiration, but not heterotrophic respiration in a dry temperate broadleaved evergreen forest, Agr. Forest Meteorol., 200, 66–77, 2015.
Hogh-Jensen, H. and Schjoerring, J. K.: Effects of drought and inorganic N form on nitrogen fixation and carbon isotope discrimination in Trifolium repens, Plant Physiol. Bioch., 35, 55–62, 1997.
IUSS-Working-Group-WRB: World Reference Base for soil resources 2014, in: World Soil Resources Reports, FAO, Rome, 203 p., available at: http://www.fao.org/3/i3794en/I3794en.pdf (last access: 1 May 2018), 2014.
Jahn, R., Blume, H.-P., Asio, V. B., Spaargaren, O., and Schad, P.: Guidelines for soil description, FAO, Rome, 97, 109 p., available at: http://www.fao.org/3/a-a0541e.pdf (last access: 10 May 2018), 2006.
Janzen, H. H.: The soil carbon dilemma: shall we hoard it or use it?, Soil Biol. Biochem., 38, 419–424, 2006.
Janzen, H. H., Campbell, C. A., Izaurralde, R. C., Ellert, B. H., Juma, N., McGill, W. B., and Zentner, R. P.: Management effects on soil C storage on the Canadian prairies, Soil Till. Res., 47, 181–195, https://doi.org/10.1016/S0167-1987(98)00105-6, 1998.
Kucera, C. L. and Kirkham, D. R.: Soil respiration studies in tallgrass prairie in Missouri, Ecology, 52, 912–915, 1971.
Kuzyakov, Y.: Review: factors affecting rhizosphere priming effects, J. Plant Nutr. Soil Sc., 165, 382–396, 2002.
Kuzyakov, Y.: Sources of CO2 efflux from soil and review of partitioning methods, Soil Biol. Biochem., 38, 425–448, 2006.
Kuzyakov, Y. and Larionova, A. A.: Review of methods and results of separation of root and rhizomicrobial respiration, J. Plant Nutr. Soil Sc., 168, 503–520, 2005.
Kuzyakov, Y., Friedel, J. K., and Stahr, K.: Review of mechanisms and quantification of priming effects, Soil Biol. Biochem., 32, 1485–1498, 2000.
Lal, R.: World crop residues production and implications of its use as a biofuel, Environ. Int., 31, 575–584, 2005.
Langford, R. L., Lai, R. W., Arthurton, R. S., and Shaw, R.: Geology of the Western New Territories, Hong Kong Geological Memoir No. 3, Geotechnical Control Office, Hong Kong, 140 pp., 1989.
Lin, G., Ehleringer, J., Rygiewicz, P., Johnson, M., and Tingey, D.: Elevated CO2 and Temperature Impacts on Different Components of Soil CO2 Efflux in Douglas-fir Terracosms, Global Change Biol., 5, 157–168, 1999.
McConkey, B. G., Angers, D., Bentham, M., Boehm, M., Brierley, T., Cerkowniak, D., Liang, B. C., Collas, P., de Gooijer, H., Desjardins, R., Gameda, S., Grant, B., Huffman, T., Hutchinson, J., Hill, L., Krug, P., Martin, T., Patterson, G., Rochette, P., and Worth, D.: Canadian Agricultural Greenhouse Gas Monitoring Accounting and Reporting System: Methodology and greenhouse gas estimates for agricultural land in the LULUCF sector for NIR 2006, Agriculture and Agri-Food Canada, Canada, 2007.
McLean, E. O.: Soil pH and lime requirement, in: Methods of soil analysis. Part 2. Chemical and microbiological properties, edited by: Page, A. L., Miller, R. H., and Keeney, D. R., Agronomy, 9, 199–224, 2nd edition, ASA, SSSA Publ., Madison, WI, 1982.
Midwood, A. and Millard, P.: Challenges in Measuring the δ13C of the Soil Surface CO2 Efflux, Rapid Commun. Mass Sp., 25, 232–242, https://doi.org/10.1002/rcm.4857, 2011.
Midwood, A., Gebbing, T., Wendler, R., Sommerkorn, M., Hunt, J., and Millard, P.: Collection and Storage of CO2 for 13C Analysis: an Application to Separate Soil CO2 Efflux into Root- and Soil-derived Components, Rapid Commun. Mass Sp., 20, 3379–3384, https://doi.org/10.1002/rcm.2749, 2006.
Millard, P., Midwood, A., Hunt, J., Barbour, M., and Whitehead, D.: Quantifying the Contribution of Soil Organic Matter Turnover to Forest Soil Respiration, Using Natural Abundance δ13C, Soil Biol. Biochem., 42, 935–943, https://doi.org/10.1016/j.soilbio.2010.02.010, 2010.
Minasny, B., Malone, B. P., McBratney, A. B., Angers, D. A., Arrouays, D., Chambers, A., Chaplot, V., Chen, Z. S., Cheng, K., Das, B. S., Field, D. J., Gimona, A., Hedley, C. B., Hong, S. Y., Mandal, B., Marchant, B. P., Martin, M., McConkey, B. G., Mulder, V. L., O'Rourke, S., Richer-de-Forges, A. C., Odeh, I., Padarian, J., Paustian, K., Pan, G. X., Poggio, L., Savin, I., Stolbovoy, V., Stockmann, U., Sulaeman, Y., Tsui, C. C., Vagen, T. G., van Wesemael, B., and Winowiecki, L.: Soil carbon 4 per mille, Geoderma, 292, 59–86, 2017.
Moyano, F. E., Kutsch, W. L., and Schultze, E.-D.: Response of mycorrhizal, rhizosphere and soil basal respiration to temperature and photosynthesis in a barley field, Soil Biol. Biochem., 39, 843–853, 2007.
Neff, J. C., Townsend, A. R., Gleixner, G., Lehman, S. J., Turnbull, J., and Bowman, W. D.: Variable effects of nitrogen additions on the stability and turnover of soil carbon, Nature, 6910, 915–917, 2002.
Paterson, E., Midwood, A. J., and Millard, P.: Through the Eye of the Needle: a Review of Isotope Approaches to Quantify Microbial Processes Mediating Soil Carbon Balance, New Phytol., 184, 19–33, https://doi.org/10.1111/j.1469-8137.2009.03001.x, 2009.
Pell, M., Stenström, J., and Granhall, U.: Soil Respiration, in: Microbial Methods for Assessing Soil Quality, edited by: Bloem, J., Hopkins, D. W., and Benedetti, A., CAB International, Wallingford, Oxfordshire, UK, 2006.
R Development Core Team: A Language and Environment for Statistical Computing. R Foundation for Statistical Computing. Version 2.8.1, available at: http://www.R-project.org (last access: 1 May 2014), 2008.
Rühr, N. K. and Buchmann, N.: Soil respiration fluxes in a temperate mixed forest: seasonality and temperature sensitivities differ among microbial and root-rhizosphere respiration, Tree Physiol., 30, 165–176, 2010.
Tufekcioglu, A., Raich, J. W., Isenhart, T. M., and Schultz, R. C.: Fine root dynamics, coarse root biomass, root distribution, and soil respiration in a multispecies riparian buffer in Central Iowa, USA, Agroforest. Syst., 44, 163–174, 1999.
VandenBygaart, A. J., McConkey, B. G., Angers, D. A., Smith, W., de Gooijer, H., Bentham, M., and Martin, T.: Soil carbon change factors for the Canadian agriculture national greenhouse gas inventory, Can. J. Soil Sci., 88, 671–680, 2008.
Van Reeuwijk, L. P.: Procedures for soil analysis, 3rd Edition, International Soil Reference and Information Center (ISRIC), Wageningen, the Netherlands, 34 pp., 1992.
Wood, T. E., Cavaleri, M. A., and Reed, S. C.: Tropical forest carbon balance in a warmer world: a critical review spanning microbial- to ecosystem-scale processes, Biol. Rev., 87, 912–927, 2012.